Lynndyl, UT Map & Demographics
Lynndyl Map
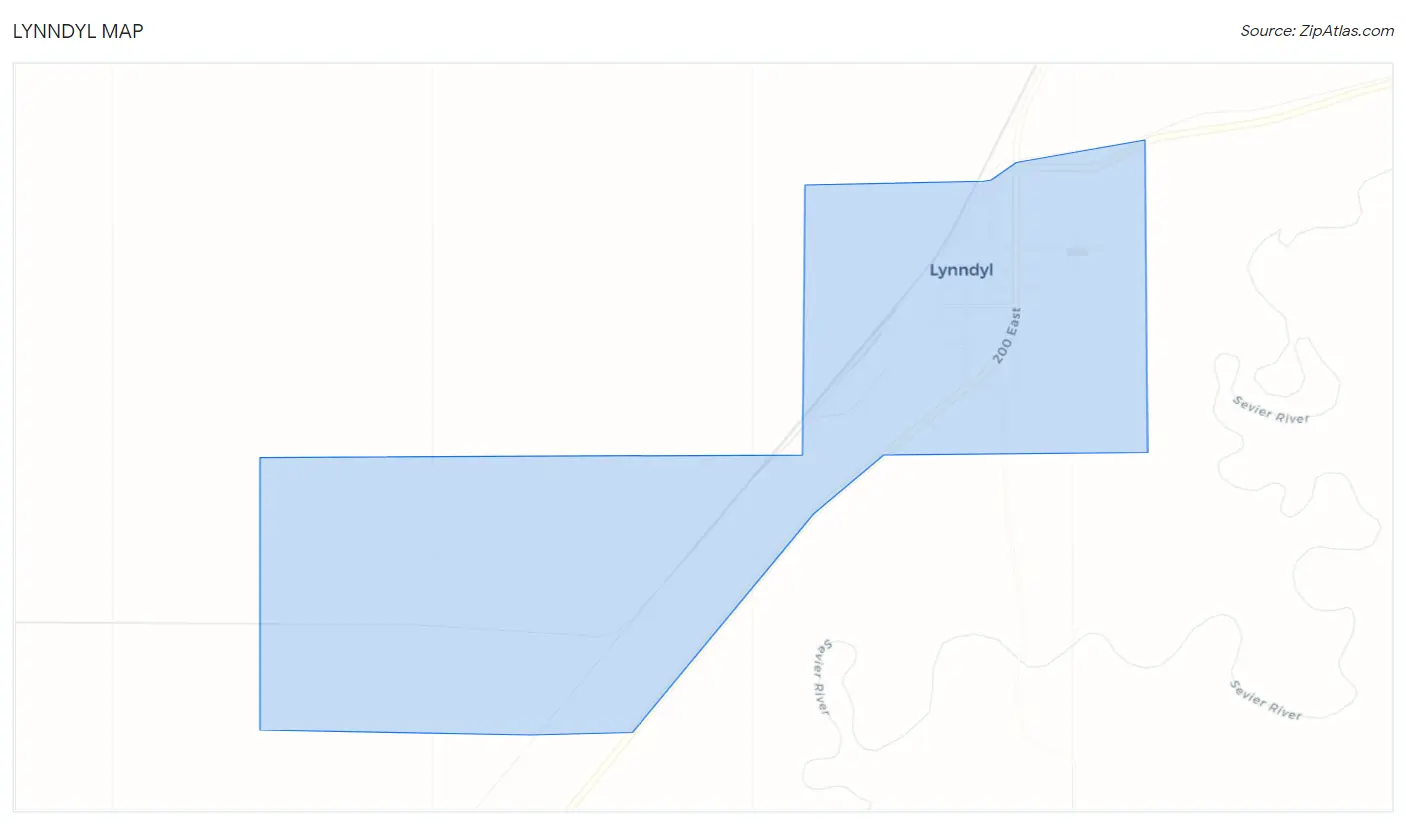
Lynndyl Overview
$16,038
PER CAPITA INCOME
$66,563
AVG FAMILY INCOME
$65,625
AVG HOUSEHOLD INCOME
94.9%
WAGE / INCOME GAP [ % ]
5.1¢/ $1
WAGE / INCOME GAP [ $ ]
0.27
INEQUALITY / GINI INDEX
119
TOTAL POPULATION
64
MALE POPULATION
55
FEMALE POPULATION
116.36
MALES / 100 FEMALES
85.94
FEMALES / 100 MALES
26.4
MEDIAN AGE
3.7
AVG FAMILY SIZE
3.3
AVG HOUSEHOLD SIZE
25
LABOR FORCE [ PEOPLE ]
38.5%
PERCENT IN LABOR FORCE
Lynndyl Zip Codes
Lynndyl Area Codes
Income in Lynndyl
Income Overview in Lynndyl
Per Capita Income in Lynndyl is $16,038, while median incomes of families and households are $66,563 and $65,625 respectively.
| Characteristic | Number | Measure |
| Per Capita Income | 119 | $16,038 |
| Median Family Income | 31 | $66,563 |
| Mean Family Income | 31 | $67,084 |
| Median Household Income | 36 | $65,625 |
| Mean Household Income | 36 | $63,231 |
| Income Deficit | 31 | $0 |
| Wage / Income Gap (%) | 119 | 94.90% |
| Wage / Income Gap ($) | 119 | 5.10¢ per $1 |
| Gini / Inequality Index | 119 | 0.27 |
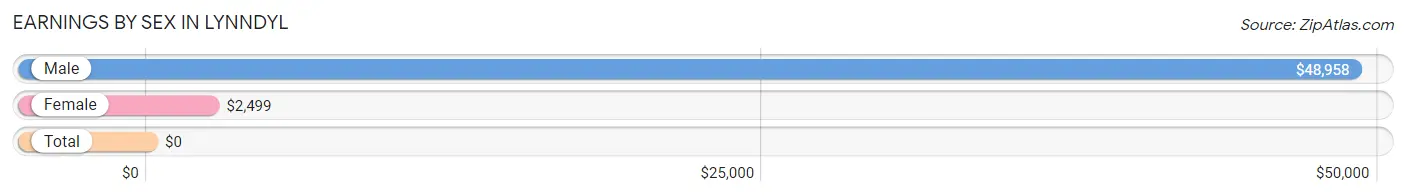
Earnings by Sex in Lynndyl
| Sex | Number | Average Earnings |
| Male | 25 (83.3%) | $48,958 |
| Female | 5 (16.7%) | $2,499 |
| Total | 30 (100.0%) | $0 |
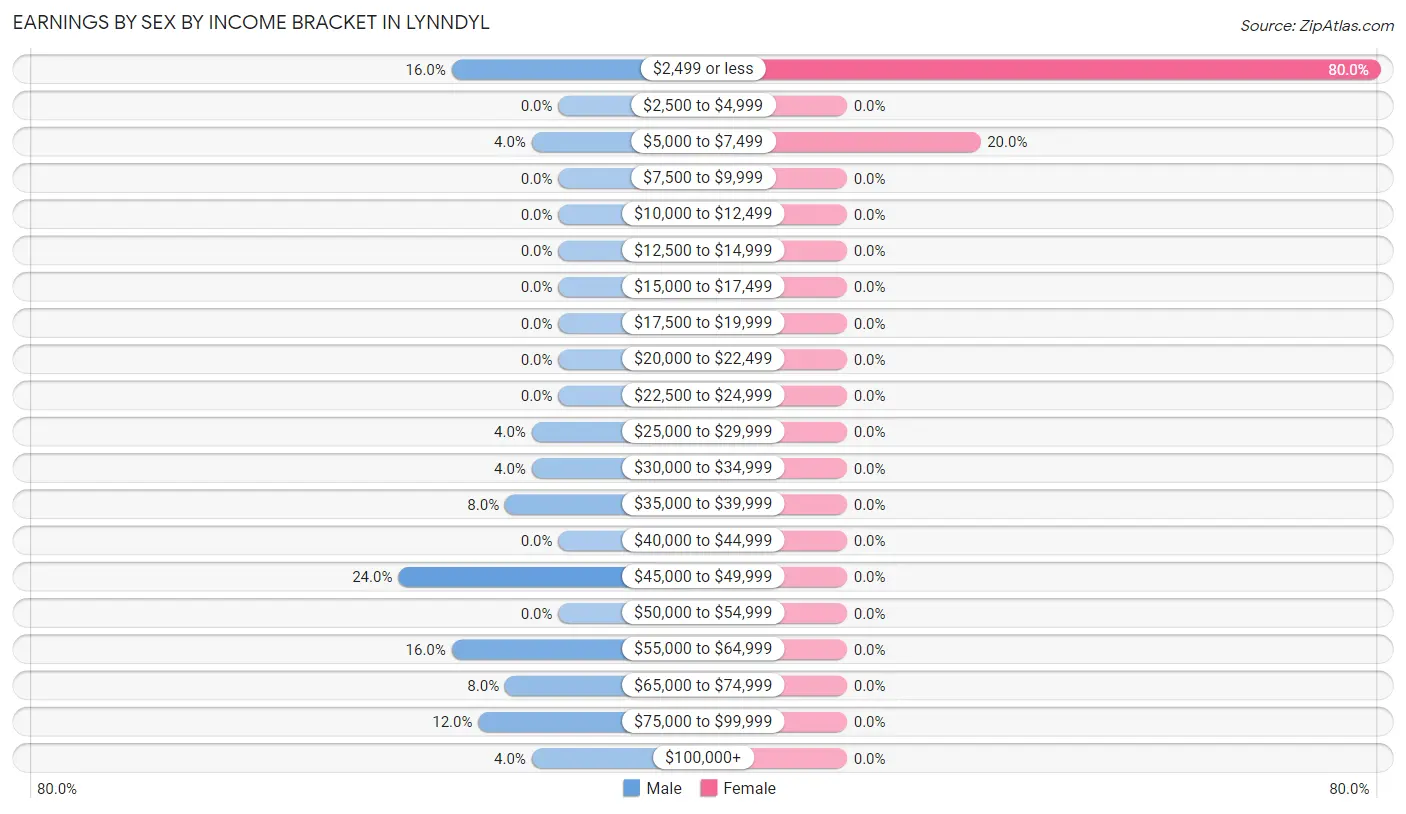
Earnings by Sex by Income Bracket in Lynndyl
The most common earnings brackets in Lynndyl are $45,000 to $49,999 for men (6 | 24.0%) and $2,499 or less for women (4 | 80.0%).
| Income | Male | Female |
| $2,499 or less | 4 (16.0%) | 4 (80.0%) |
| $2,500 to $4,999 | 0 (0.0%) | 0 (0.0%) |
| $5,000 to $7,499 | 1 (4.0%) | 1 (20.0%) |
| $7,500 to $9,999 | 0 (0.0%) | 0 (0.0%) |
| $10,000 to $12,499 | 0 (0.0%) | 0 (0.0%) |
| $12,500 to $14,999 | 0 (0.0%) | 0 (0.0%) |
| $15,000 to $17,499 | 0 (0.0%) | 0 (0.0%) |
| $17,500 to $19,999 | 0 (0.0%) | 0 (0.0%) |
| $20,000 to $22,499 | 0 (0.0%) | 0 (0.0%) |
| $22,500 to $24,999 | 0 (0.0%) | 0 (0.0%) |
| $25,000 to $29,999 | 1 (4.0%) | 0 (0.0%) |
| $30,000 to $34,999 | 1 (4.0%) | 0 (0.0%) |
| $35,000 to $39,999 | 2 (8.0%) | 0 (0.0%) |
| $40,000 to $44,999 | 0 (0.0%) | 0 (0.0%) |
| $45,000 to $49,999 | 6 (24.0%) | 0 (0.0%) |
| $50,000 to $54,999 | 0 (0.0%) | 0 (0.0%) |
| $55,000 to $64,999 | 4 (16.0%) | 0 (0.0%) |
| $65,000 to $74,999 | 2 (8.0%) | 0 (0.0%) |
| $75,000 to $99,999 | 3 (12.0%) | 0 (0.0%) |
| $100,000+ | 1 (4.0%) | 0 (0.0%) |
| Total | 25 (100.0%) | 5 (100.0%) |
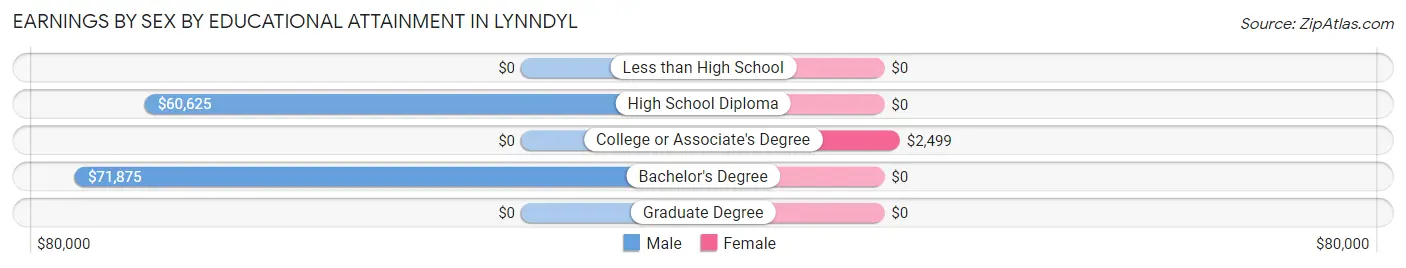
Earnings by Sex by Educational Attainment in Lynndyl
Average earnings in Lynndyl are $49,792 for men and $2,499 for women, a difference of 95.0%. Men with an educational attainment of bachelor's degree enjoy the highest average annual earnings of $71,875, while those with high school diploma education earn the least with $60,625. Women with an educational attainment of college or associate's degree earn the most with the average annual earnings of $2,499, while those with college or associate's degree education have the smallest earnings of $2,499.
| Educational Attainment | Male Income | Female Income |
| Less than High School | - | - |
| High School Diploma | $60,625 | $0 |
| College or Associate's Degree | - | - |
| Bachelor's Degree | $71,875 | $0 |
| Graduate Degree | - | - |
| Total | $49,792 | $2,499 |
Family Income in Lynndyl
Family Income Brackets in Lynndyl
According to the Lynndyl family income data, there are 12 families falling into the $50,000 to $74,999 income range, which is the most common income bracket and makes up 38.7% of all families.
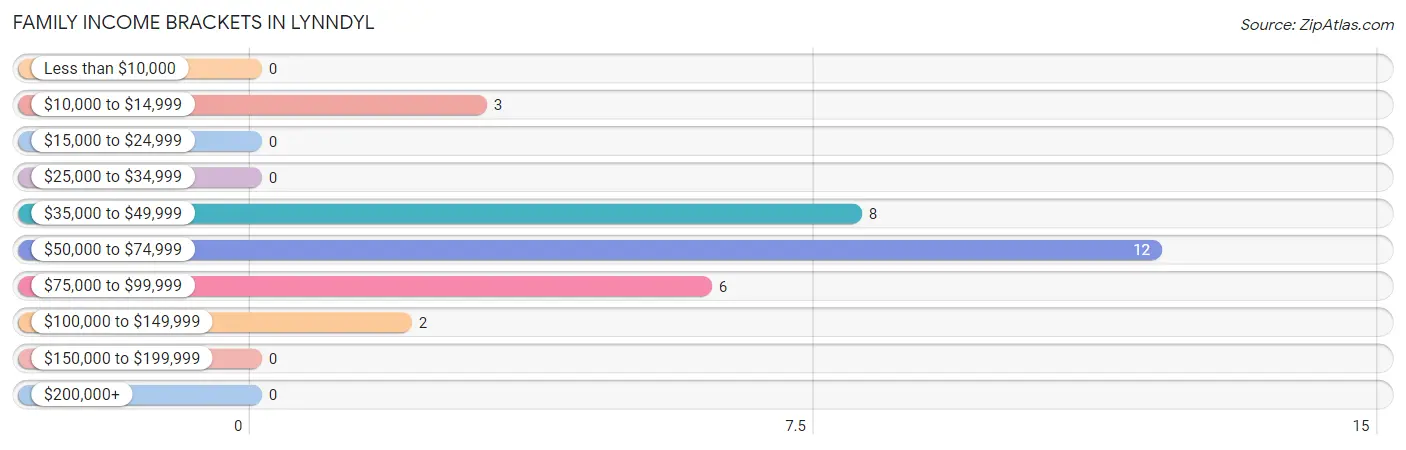
| Income Bracket | # Families | % Families |
| Less than $10,000 | 0 | 0.0% |
| $10,000 to $14,999 | 3 | 9.7% |
| $15,000 to $24,999 | 0 | 0.0% |
| $25,000 to $34,999 | 0 | 0.0% |
| $35,000 to $49,999 | 8 | 25.8% |
| $50,000 to $74,999 | 12 | 38.7% |
| $75,000 to $99,999 | 6 | 19.4% |
| $100,000 to $149,999 | 2 | 6.5% |
| $150,000 to $199,999 | 0 | 0.0% |
| $200,000+ | 0 | 0.0% |
Family Income by Famaliy Size in Lynndyl
2-person families (7 | 22.6%) account for the highest median family income in Lynndyl with $70,625 per family, while 2-person families (7 | 22.6%) have the highest median income of $35,312 per family member.
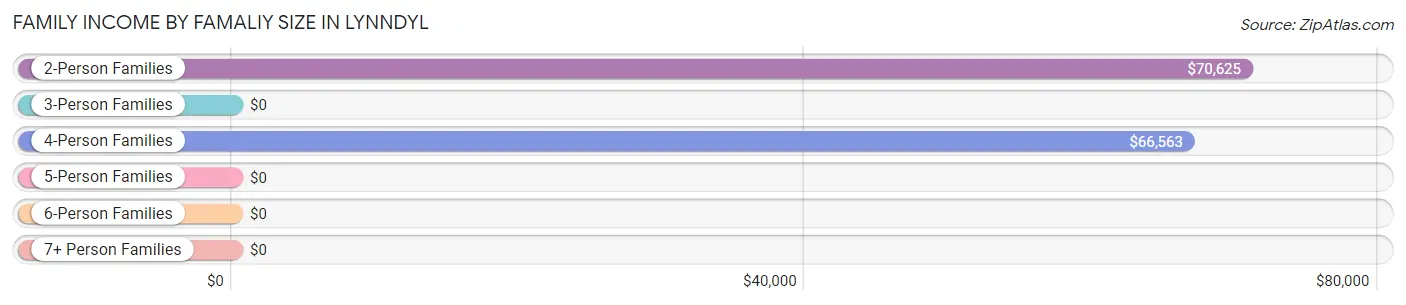
| Income Bracket | # Families | Median Income |
| 2-Person Families | 7 (22.6%) | $70,625 |
| 3-Person Families | 5 (16.1%) | $0 |
| 4-Person Families | 7 (22.6%) | $66,563 |
| 5-Person Families | 8 (25.8%) | $0 |
| 6-Person Families | 0 (0.0%) | $0 |
| 7+ Person Families | 4 (12.9%) | $0 |
| Total | 31 (100.0%) | $66,563 |
Family Income by Number of Earners in Lynndyl
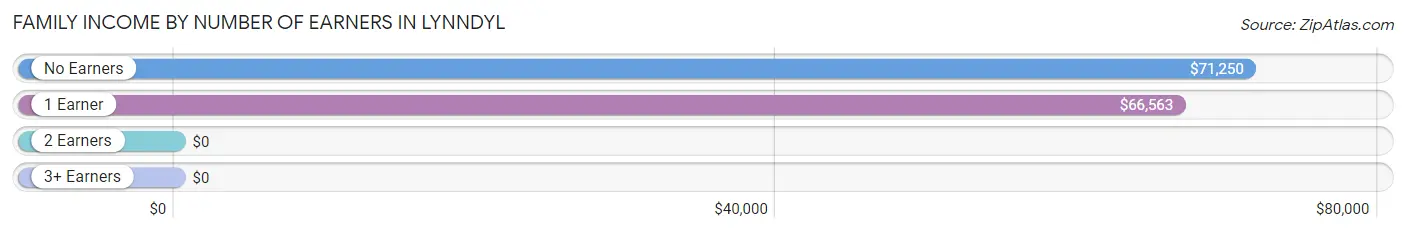
| Number of Earners | # Families | Median Income |
| No Earners | 6 (19.4%) | $71,250 |
| 1 Earner | 19 (61.3%) | $66,563 |
| 2 Earners | 5 (16.1%) | $0 |
| 3+ Earners | 1 (3.2%) | $0 |
| Total | 31 (100.0%) | $66,563 |
Household Income in Lynndyl
Household Income Brackets in Lynndyl
With 12 households falling in the category, the $50,000 to $74,999 income range is the most frequent in Lynndyl, accounting for 33.3% of all households.
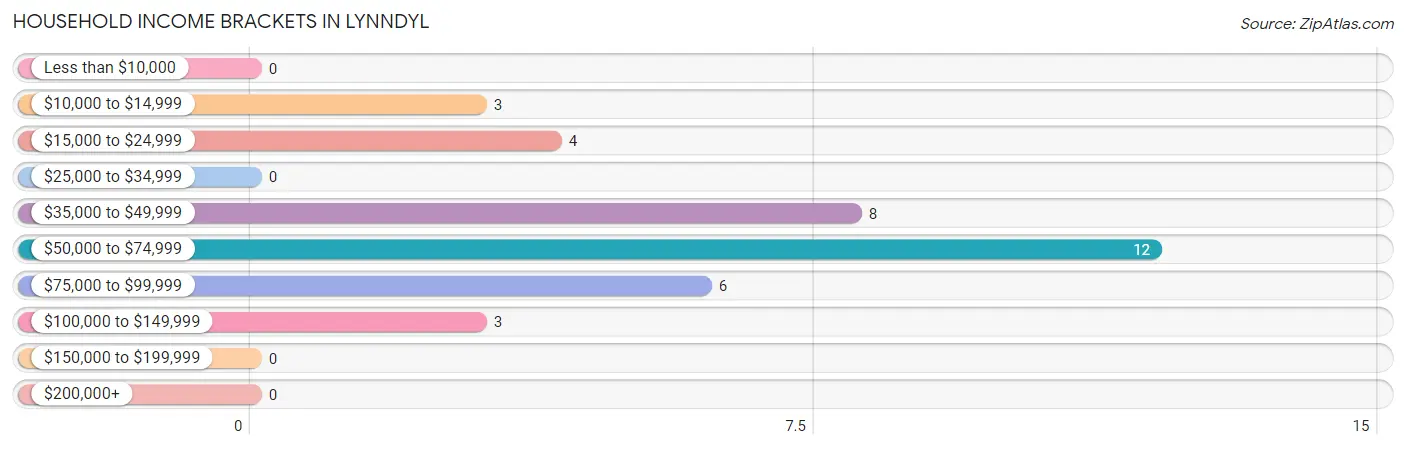
| Income Bracket | # Households | % Households |
| Less than $10,000 | 0 | 0.0% |
| $10,000 to $14,999 | 3 | 8.3% |
| $15,000 to $24,999 | 4 | 11.1% |
| $25,000 to $34,999 | 0 | 0.0% |
| $35,000 to $49,999 | 8 | 22.2% |
| $50,000 to $74,999 | 12 | 33.3% |
| $75,000 to $99,999 | 6 | 16.7% |
| $100,000 to $149,999 | 3 | 8.3% |
| $150,000 to $199,999 | 0 | 0.0% |
| $200,000+ | 0 | 0.0% |
Household Income by Householder Age in Lynndyl
The median household income in Lynndyl is $65,625, with the highest median household income of $71,250 found in the 65+ years age bracket for the primary householder. A total of 12 households (33.3%) fall into this category.
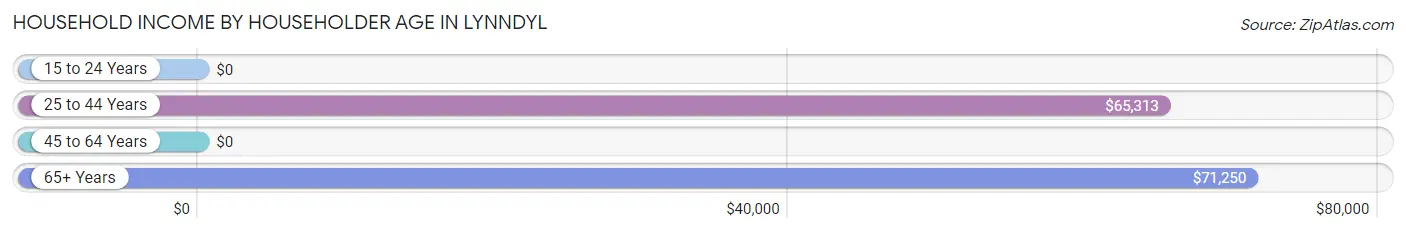
| Income Bracket | # Households | Median Income |
| 15 to 24 Years | 0 (0.0%) | $0 |
| 25 to 44 Years | 19 (52.8%) | $65,313 |
| 45 to 64 Years | 5 (13.9%) | $0 |
| 65+ Years | 12 (33.3%) | $71,250 |
| Total | 36 (100.0%) | $65,625 |
Poverty in Lynndyl
Income Below Poverty by Sex and Age in Lynndyl
With 9.4% poverty level for males and 7.3% for females among the residents of Lynndyl, 16 and 17 year old males and 55 to 64 year old females are the most vulnerable to poverty, with 1 males (100.0%) and 2 females (50.0%) in their respective age groups living below the poverty level.
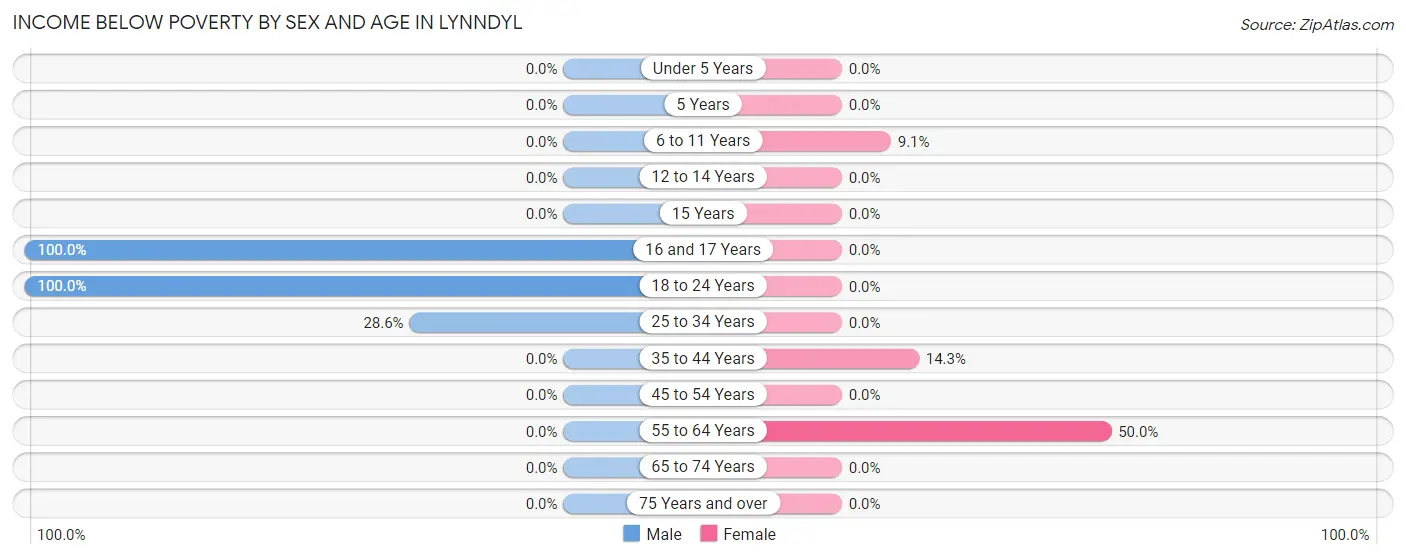
| Age Bracket | Male | Female |
| Under 5 Years | 0 (0.0%) | 0 (0.0%) |
| 5 Years | 0 (0.0%) | 0 (0.0%) |
| 6 to 11 Years | 0 (0.0%) | 1 (9.1%) |
| 12 to 14 Years | 0 (0.0%) | 0 (0.0%) |
| 15 Years | 0 (0.0%) | 0 (0.0%) |
| 16 and 17 Years | 1 (100.0%) | 0 (0.0%) |
| 18 to 24 Years | 3 (100.0%) | 0 (0.0%) |
| 25 to 34 Years | 2 (28.6%) | 0 (0.0%) |
| 35 to 44 Years | 0 (0.0%) | 1 (14.3%) |
| 45 to 54 Years | 0 (0.0%) | 0 (0.0%) |
| 55 to 64 Years | 0 (0.0%) | 2 (50.0%) |
| 65 to 74 Years | 0 (0.0%) | 0 (0.0%) |
| 75 Years and over | 0 (0.0%) | 0 (0.0%) |
| Total | 6 (9.4%) | 4 (7.3%) |
Income Above Poverty by Sex and Age in Lynndyl
According to the poverty statistics in Lynndyl, males aged under 5 years and females aged under 5 years are the age groups that are most secure financially, with 100.0% of males and 100.0% of females in these age groups living above the poverty line.
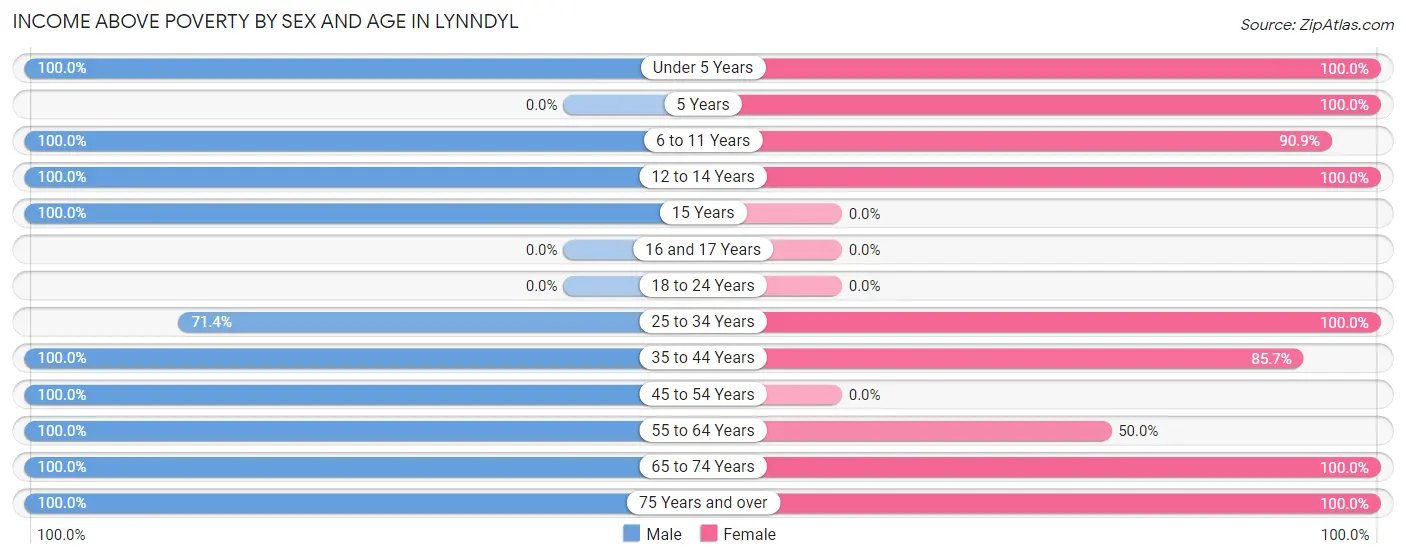
| Age Bracket | Male | Female |
| Under 5 Years | 11 (100.0%) | 6 (100.0%) |
| 5 Years | 0 (0.0%) | 1 (100.0%) |
| 6 to 11 Years | 9 (100.0%) | 10 (90.9%) |
| 12 to 14 Years | 8 (100.0%) | 5 (100.0%) |
| 15 Years | 3 (100.0%) | 0 (0.0%) |
| 16 and 17 Years | 0 (0.0%) | 0 (0.0%) |
| 18 to 24 Years | 0 (0.0%) | 0 (0.0%) |
| 25 to 34 Years | 5 (71.4%) | 11 (100.0%) |
| 35 to 44 Years | 10 (100.0%) | 6 (85.7%) |
| 45 to 54 Years | 2 (100.0%) | 0 (0.0%) |
| 55 to 64 Years | 3 (100.0%) | 2 (50.0%) |
| 65 to 74 Years | 2 (100.0%) | 8 (100.0%) |
| 75 Years and over | 5 (100.0%) | 2 (100.0%) |
| Total | 58 (90.6%) | 51 (92.7%) |
Income Below Poverty Among Married-Couple Families in Lynndyl
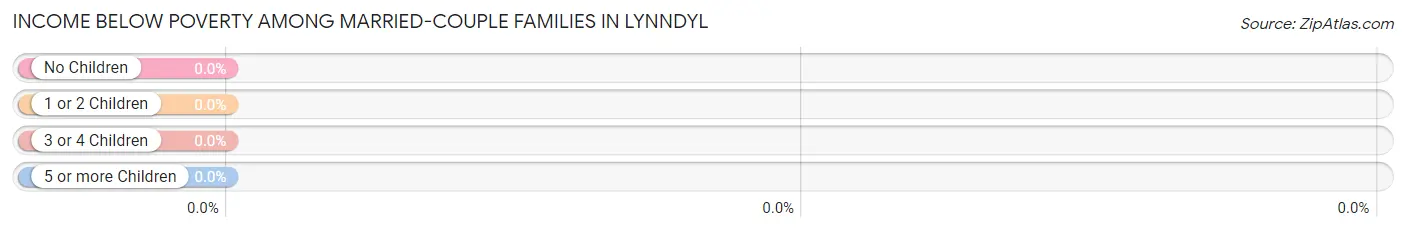
| Children | Above Poverty | Below Poverty |
| No Children | 5 (100.0%) | 0 (0.0%) |
| 1 or 2 Children | 9 (100.0%) | 0 (0.0%) |
| 3 or 4 Children | 8 (100.0%) | 0 (0.0%) |
| 5 or more Children | 4 (100.0%) | 0 (0.0%) |
| Total | 26 (100.0%) | 0 (0.0%) |
Income Below Poverty Among Single-Parent Households in Lynndyl
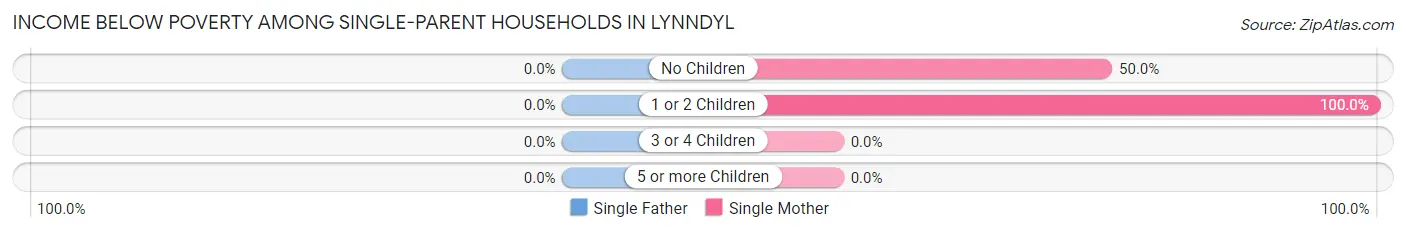
| Children | Single Father | Single Mother |
| No Children | 0 (0.0%) | 2 (50.0%) |
| 1 or 2 Children | 0 (0.0%) | 1 (100.0%) |
| 3 or 4 Children | 0 (0.0%) | 0 (0.0%) |
| 5 or more Children | 0 (0.0%) | 0 (0.0%) |
| Total | 0 (0.0%) | 3 (60.0%) |
Income Below Poverty Among Married-Couple vs Single-Parent Households in Lynndyl
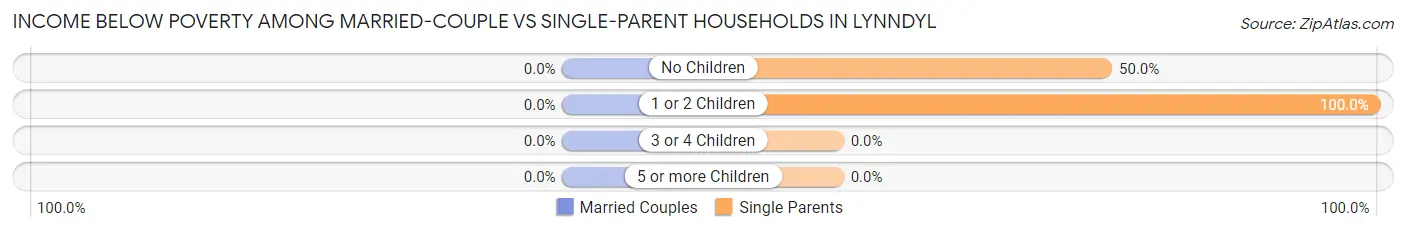
| Children | Married-Couple Families | Single-Parent Households |
| No Children | 0 (0.0%) | 2 (50.0%) |
| 1 or 2 Children | 0 (0.0%) | 1 (100.0%) |
| 3 or 4 Children | 0 (0.0%) | 0 (0.0%) |
| 5 or more Children | 0 (0.0%) | 0 (0.0%) |
| Total | 0 (0.0%) | 3 (60.0%) |
Race in Lynndyl
The most populous races in Lynndyl are White / Caucasian (101 | 84.9%), Two or more Races (12 | 10.1%), and Asian (2 | 1.7%).
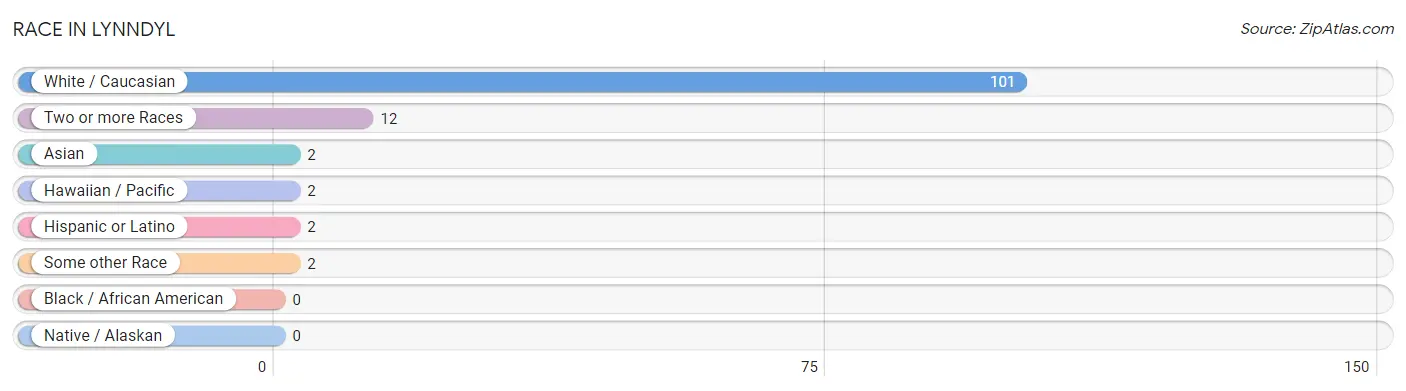
| Race | # Population | % Population |
| Asian | 2 | 1.7% |
| Black / African American | 0 | 0.0% |
| Hawaiian / Pacific | 2 | 1.7% |
| Hispanic or Latino | 2 | 1.7% |
| Native / Alaskan | 0 | 0.0% |
| White / Caucasian | 101 | 84.9% |
| Two or more Races | 12 | 10.1% |
| Some other Race | 2 | 1.7% |
| Total | 119 | 100.0% |
Ancestry in Lynndyl
The most populous ancestries reported in Lynndyl are German (34 | 28.6%), English (28 | 23.5%), Irish (28 | 23.5%), American (16 | 13.5%), and European (8 | 6.7%), together accounting for 95.8% of all Lynndyl residents.
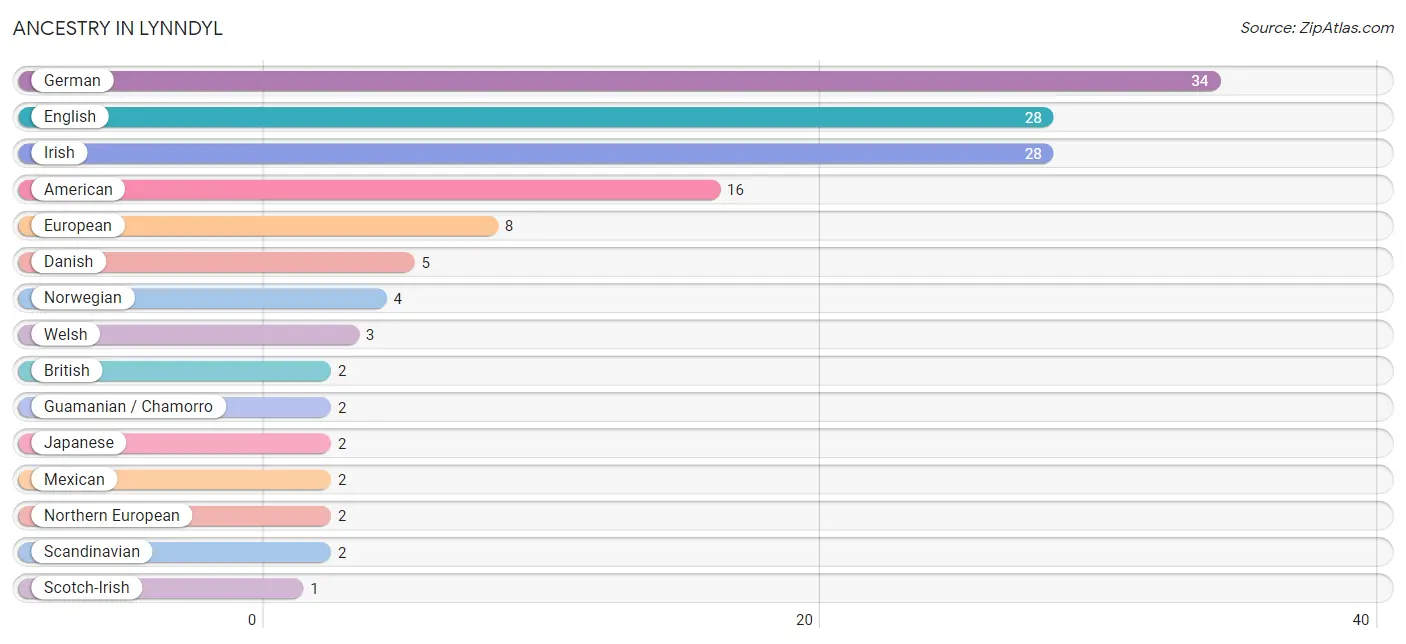
| Ancestry | # Population | % Population |
| American | 16 | 13.5% |
| British | 2 | 1.7% |
| Danish | 5 | 4.2% |
| English | 28 | 23.5% |
| European | 8 | 6.7% |
| German | 34 | 28.6% |
| Guamanian / Chamorro | 2 | 1.7% |
| Irish | 28 | 23.5% |
| Japanese | 2 | 1.7% |
| Mexican | 2 | 1.7% |
| Northern European | 2 | 1.7% |
| Norwegian | 4 | 3.4% |
| Scandinavian | 2 | 1.7% |
| Scotch-Irish | 1 | 0.8% |
| Scottish | 1 | 0.8% |
| Swiss | 1 | 0.8% |
| Welsh | 3 | 2.5% | View All 17 Rows |
Immigrants in Lynndyl
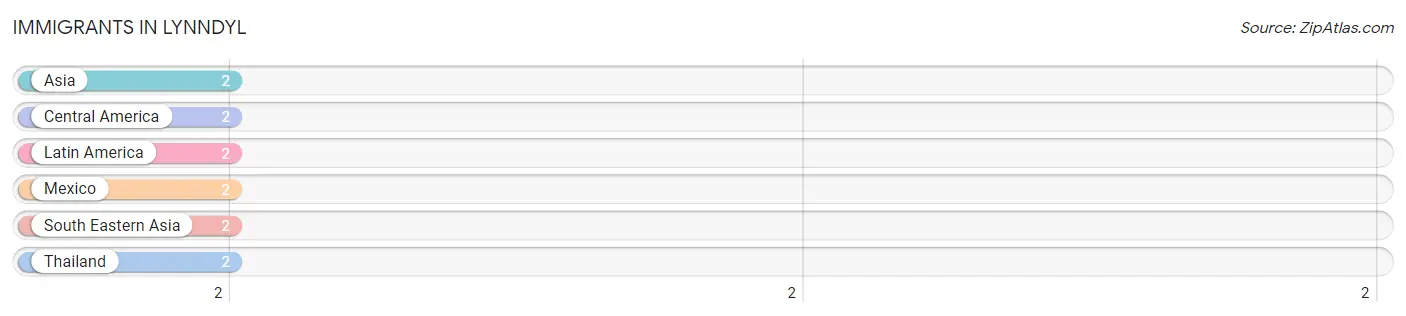
The most numerous immigrant groups reported in Lynndyl came from Asia (2 | 1.7%), Central America (2 | 1.7%), Latin America (2 | 1.7%), Mexico (2 | 1.7%), and South Eastern Asia (2 | 1.7%), together accounting for 8.4% of all Lynndyl residents.
| Immigration Origin | # Population | % Population |
| Asia | 2 | 1.7% |
| Central America | 2 | 1.7% |
| Latin America | 2 | 1.7% |
| Mexico | 2 | 1.7% |
| South Eastern Asia | 2 | 1.7% |
| Thailand | 2 | 1.7% | View All 6 Rows |
Sex and Age in Lynndyl
Sex and Age in Lynndyl
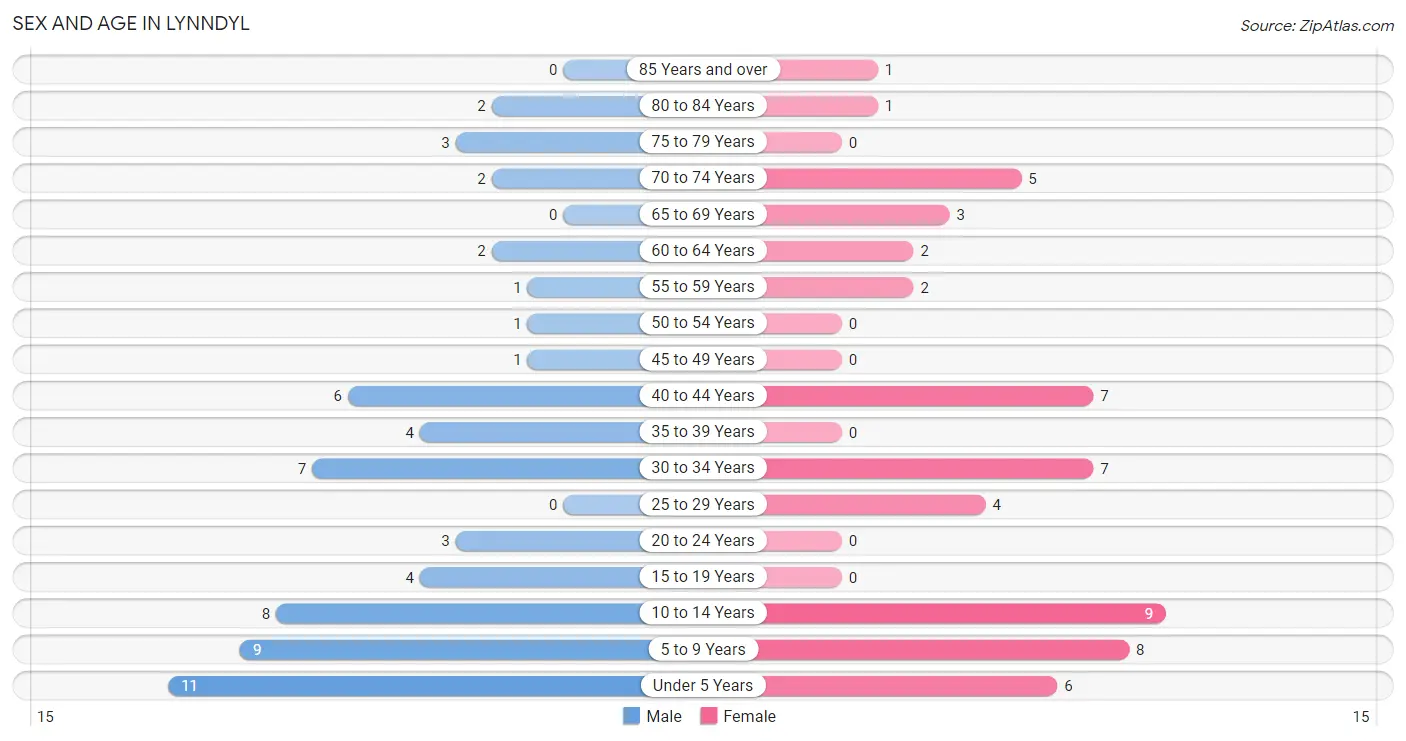
The most populous age groups in Lynndyl are Under 5 Years (11 | 17.2%) for men and 10 to 14 Years (9 | 16.4%) for women.
| Age Bracket | Male | Female |
| Under 5 Years | 11 (17.2%) | 6 (10.9%) |
| 5 to 9 Years | 9 (14.1%) | 8 (14.5%) |
| 10 to 14 Years | 8 (12.5%) | 9 (16.4%) |
| 15 to 19 Years | 4 (6.2%) | 0 (0.0%) |
| 20 to 24 Years | 3 (4.7%) | 0 (0.0%) |
| 25 to 29 Years | 0 (0.0%) | 4 (7.3%) |
| 30 to 34 Years | 7 (10.9%) | 7 (12.7%) |
| 35 to 39 Years | 4 (6.2%) | 0 (0.0%) |
| 40 to 44 Years | 6 (9.4%) | 7 (12.7%) |
| 45 to 49 Years | 1 (1.6%) | 0 (0.0%) |
| 50 to 54 Years | 1 (1.6%) | 0 (0.0%) |
| 55 to 59 Years | 1 (1.6%) | 2 (3.6%) |
| 60 to 64 Years | 2 (3.1%) | 2 (3.6%) |
| 65 to 69 Years | 0 (0.0%) | 3 (5.4%) |
| 70 to 74 Years | 2 (3.1%) | 5 (9.1%) |
| 75 to 79 Years | 3 (4.7%) | 0 (0.0%) |
| 80 to 84 Years | 2 (3.1%) | 1 (1.8%) |
| 85 Years and over | 0 (0.0%) | 1 (1.8%) |
| Total | 64 (100.0%) | 55 (100.0%) |
Families and Households in Lynndyl
Median Family Size in Lynndyl
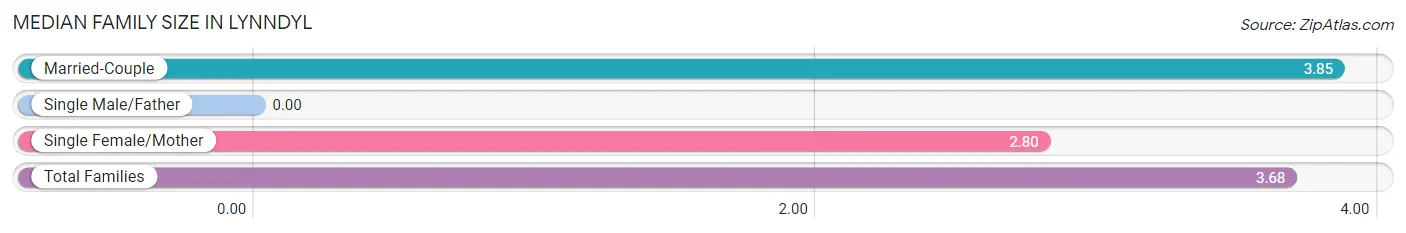
| Family Type | # Families | Family Size |
| Married-Couple | 26 (83.9%) | 3.85 |
| Single Male/Father | 0 (0.0%) | - |
| Single Female/Mother | 5 (16.1%) | 2.80 |
| Total Families | 31 (100.0%) | 3.68 |
Median Household Size in Lynndyl
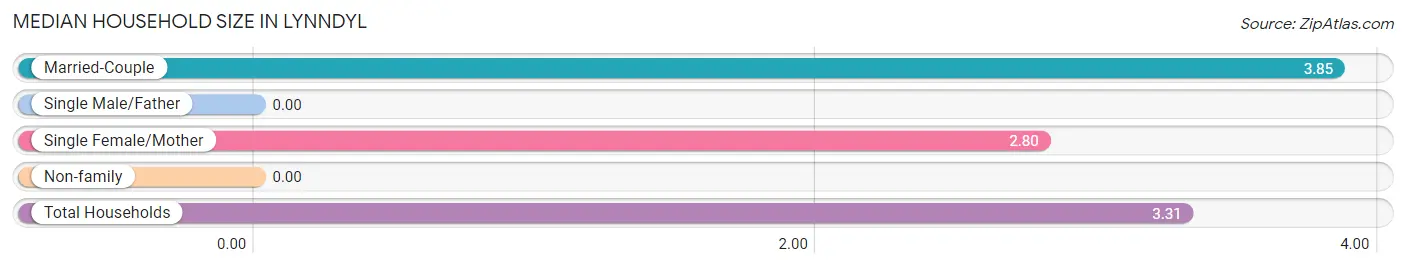
| Household Type | # Households | Household Size |
| Married-Couple | 26 (72.2%) | 3.85 |
| Single Male/Father | 0 (0.0%) | - |
| Single Female/Mother | 5 (13.9%) | 2.80 |
| Non-family | 5 (13.9%) | - |
| Total Households | 36 (100.0%) | 3.31 |
Household Size by Marriage Status in Lynndyl
Out of a total of 36 households in Lynndyl, 31 (86.1%) are family households, while 5 (13.9%) are nonfamily households. The most numerous type of family households are 5-person households, comprising 8, and the most common type of nonfamily households are 1-person households, comprising 5.
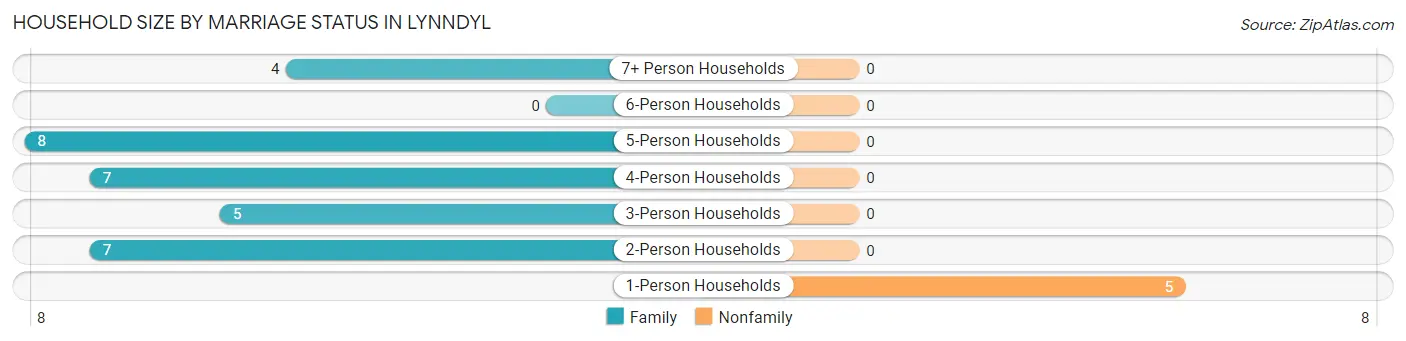
| Household Size | Family Households | Nonfamily Households |
| 1-Person Households | - | 5 (13.9%) |
| 2-Person Households | 7 (19.4%) | 0 (0.0%) |
| 3-Person Households | 5 (13.9%) | 0 (0.0%) |
| 4-Person Households | 7 (19.4%) | 0 (0.0%) |
| 5-Person Households | 8 (22.2%) | 0 (0.0%) |
| 6-Person Households | 0 (0.0%) | 0 (0.0%) |
| 7+ Person Households | 4 (11.1%) | 0 (0.0%) |
| Total | 31 (86.1%) | 5 (13.9%) |
Female Fertility in Lynndyl
Fertility by Age in Lynndyl
| Age Bracket | Women with Births | Births / 1,000 Women |
| 15 to 19 years | 0 (0.0%) | 0.0 |
| 20 to 34 years | 0 (0.0%) | 0.0 |
| 35 to 50 years | 0 (0.0%) | 0.0 |
| Total | 0 (0.0%) | 0.0 |
Fertility by Age by Marriage Status in Lynndyl
| Age Bracket | Married | Unmarried |
| 15 to 19 years | 0 (0.0%) | 0 (0.0%) |
| 20 to 34 years | 0 (0.0%) | 0 (0.0%) |
| 35 to 50 years | 0 (0.0%) | 0 (0.0%) |
| Total | 0 (0.0%) | 0 (0.0%) |
Fertility by Education in Lynndyl
| Educational Attainment | Women with Births | Births / 1,000 Women |
| Less than High School | 0 (0.0%) | 0.0 |
| High School Diploma | 0 (0.0%) | 0.0 |
| College or Associate's Degree | 0 (0.0%) | 0.0 |
| Bachelor's Degree | 0 (0.0%) | 0.0 |
| Graduate Degree | 0 (0.0%) | 0.0 |
| Total | 0 (0.0%) | 0.0 |
Fertility by Education by Marriage Status in Lynndyl
| Educational Attainment | Married | Unmarried |
| Less than High School | 0 (0.0%) | 0 (0.0%) |
| High School Diploma | 0 (0.0%) | 0 (0.0%) |
| College or Associate's Degree | 0 (0.0%) | 0 (0.0%) |
| Bachelor's Degree | 0 (0.0%) | 0 (0.0%) |
| Graduate Degree | 0 (0.0%) | 0 (0.0%) |
| Total | 0 (0.0%) | 0 (0.0%) |
Employment Characteristics in Lynndyl
Employment by Class of Employer in Lynndyl
Among the 25 employed individuals in Lynndyl, private company employees (16 | 64.0%), local government employees (7 | 28.0%), and not-for-profit organizations (1 | 4.0%) make up the most common classes of employment.
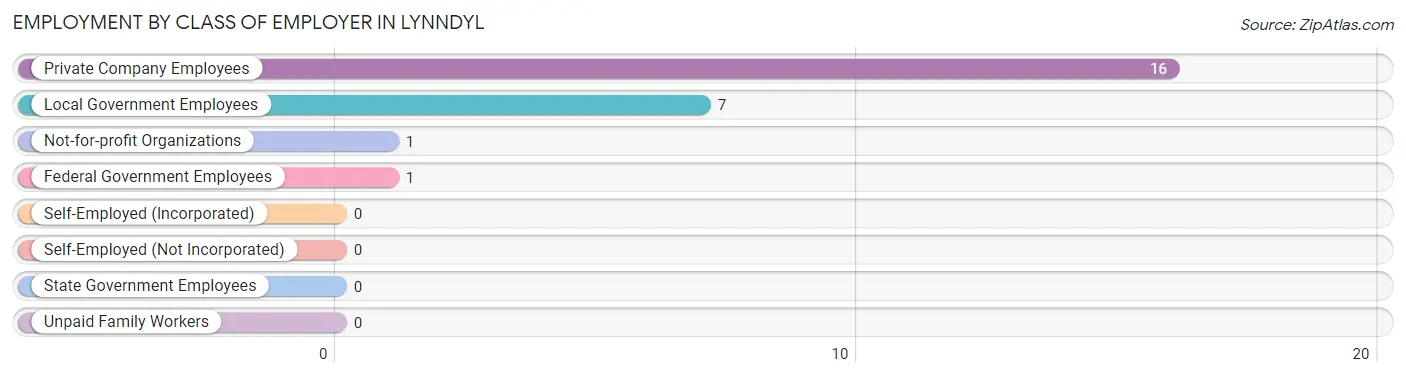
| Employer Class | # Employees | % Employees |
| Private Company Employees | 16 | 64.0% |
| Self-Employed (Incorporated) | 0 | 0.0% |
| Self-Employed (Not Incorporated) | 0 | 0.0% |
| Not-for-profit Organizations | 1 | 4.0% |
| Local Government Employees | 7 | 28.0% |
| State Government Employees | 0 | 0.0% |
| Federal Government Employees | 1 | 4.0% |
| Unpaid Family Workers | 0 | 0.0% |
| Total | 25 | 100.0% |
Employment Status by Age in Lynndyl
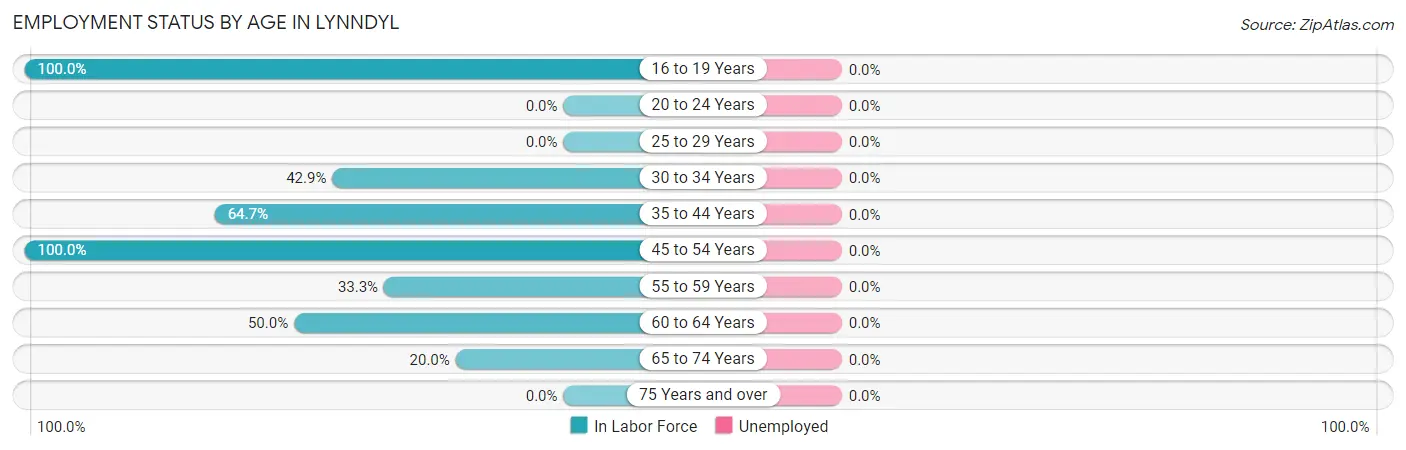
| Age Bracket | In Labor Force | Unemployed |
| 16 to 19 Years | 1 (100.0%) | 0 (0.0%) |
| 20 to 24 Years | 0 (0.0%) | 0 (0.0%) |
| 25 to 29 Years | 0 (0.0%) | 0 (0.0%) |
| 30 to 34 Years | 6 (42.9%) | 0 (0.0%) |
| 35 to 44 Years | 11 (64.7%) | 0 (0.0%) |
| 45 to 54 Years | 2 (100.0%) | 0 (0.0%) |
| 55 to 59 Years | 1 (33.3%) | 0 (0.0%) |
| 60 to 64 Years | 2 (50.0%) | 0 (0.0%) |
| 65 to 74 Years | 2 (20.0%) | 0 (0.0%) |
| 75 Years and over | 0 (0.0%) | 0 (0.0%) |
| Total | 25 (38.5%) | 0 (0.0%) |
Employment Status by Educational Attainment in Lynndyl
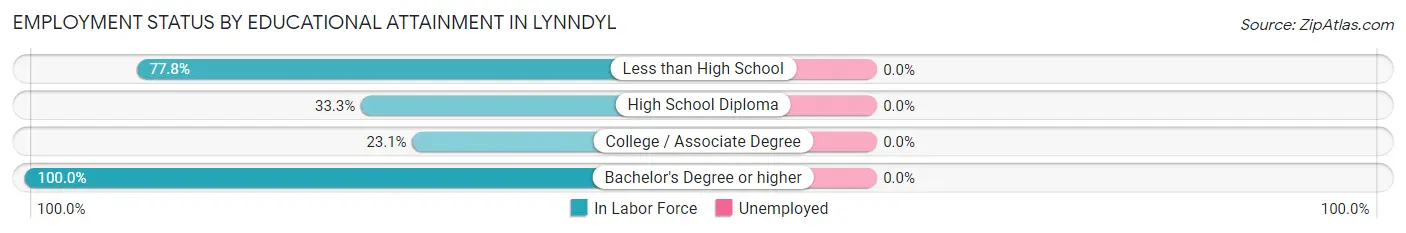
| Educational Attainment | In Labor Force | Unemployed |
| Less than High School | 7 (77.8%) | 0 (0.0%) |
| High School Diploma | 5 (33.3%) | 0 (0.0%) |
| College / Associate Degree | 3 (23.1%) | 0 (0.0%) |
| Bachelor's Degree or higher | 7 (100.0%) | 0 (0.0%) |
| Total | 22 (50.0%) | 0 (0.0%) |
Employment Occupations by Sex in Lynndyl
Management, Business, Science and Arts Occupations
The most common Management, Business, Science and Arts occupations in Lynndyl are Computers, Engineering & Science (4 | 16.0%), Architecture & Engineering (4 | 16.0%), Management (3 | 12.0%), Community & Social Service (3 | 12.0%), and Education, Arts & Media (2 | 8.0%).
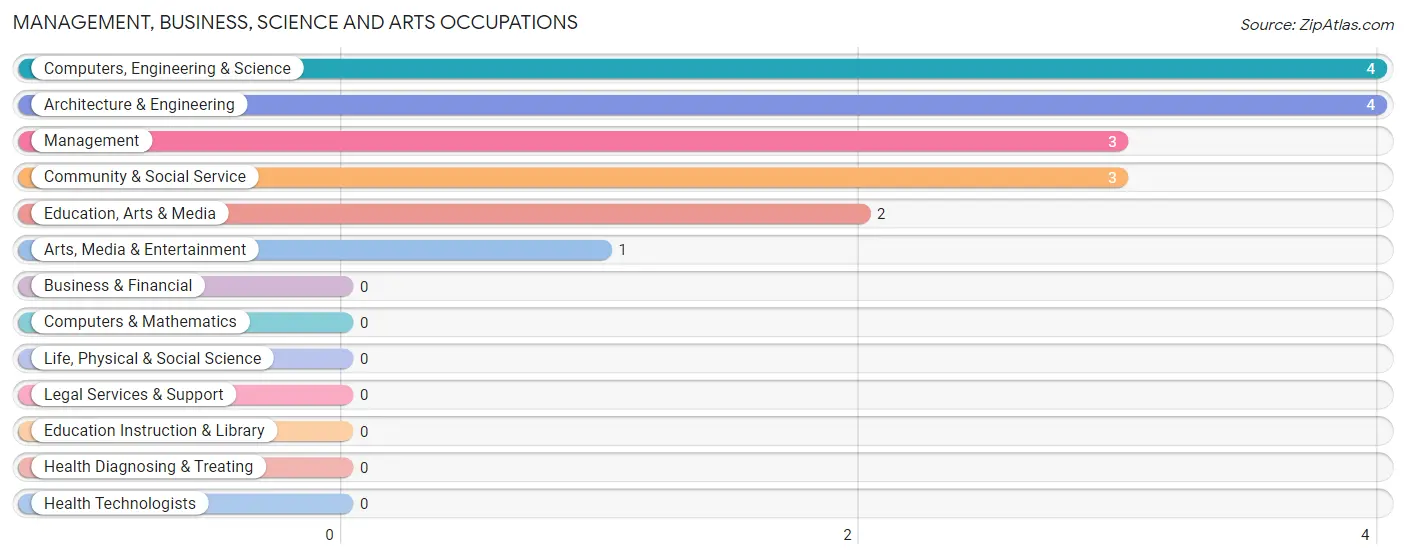
Management, Business, Science and Arts Occupations by Sex
Within the Management, Business, Science and Arts occupations in Lynndyl, the most male-oriented occupations are Management (100.0%), Computers, Engineering & Science (100.0%), and Architecture & Engineering (100.0%), while the most female-oriented occupations are Arts, Media & Entertainment (100.0%), and Community & Social Service (33.3%).

| Occupation | Male | Female |
| Management | 3 (100.0%) | 0 (0.0%) |
| Business & Financial | 0 (0.0%) | 0 (0.0%) |
| Computers, Engineering & Science | 4 (100.0%) | 0 (0.0%) |
| Computers & Mathematics | 0 (0.0%) | 0 (0.0%) |
| Architecture & Engineering | 4 (100.0%) | 0 (0.0%) |
| Life, Physical & Social Science | 0 (0.0%) | 0 (0.0%) |
| Community & Social Service | 2 (66.7%) | 1 (33.3%) |
| Education, Arts & Media | 2 (100.0%) | 0 (0.0%) |
| Legal Services & Support | 0 (0.0%) | 0 (0.0%) |
| Education Instruction & Library | 0 (0.0%) | 0 (0.0%) |
| Arts, Media & Entertainment | 0 (0.0%) | 1 (100.0%) |
| Health Diagnosing & Treating | 0 (0.0%) | 0 (0.0%) |
| Health Technologists | 0 (0.0%) | 0 (0.0%) |
| Total (Category) | 9 (90.0%) | 1 (10.0%) |
| Total (Overall) | 21 (84.0%) | 4 (16.0%) |
Services Occupations
The most common Services occupations in Lynndyl are , and Food Preparation & Serving (2 | 8.0%).
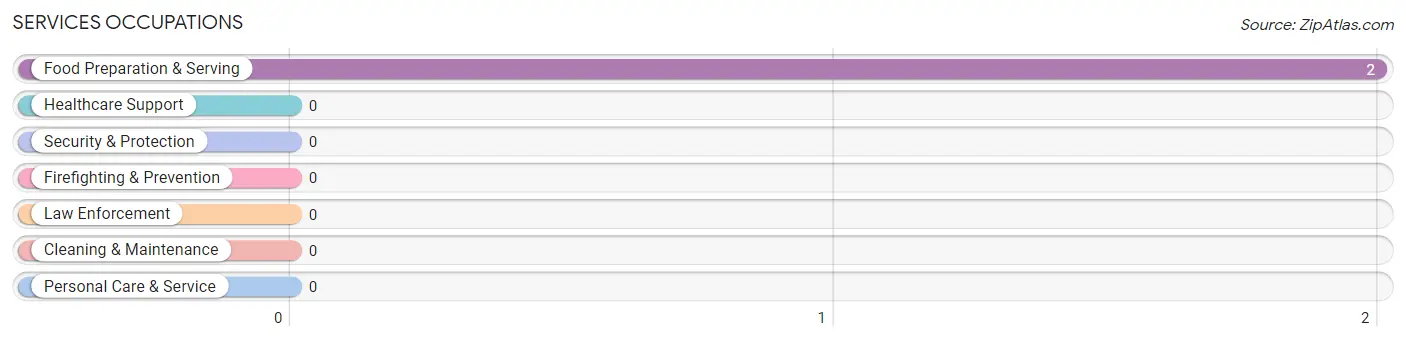
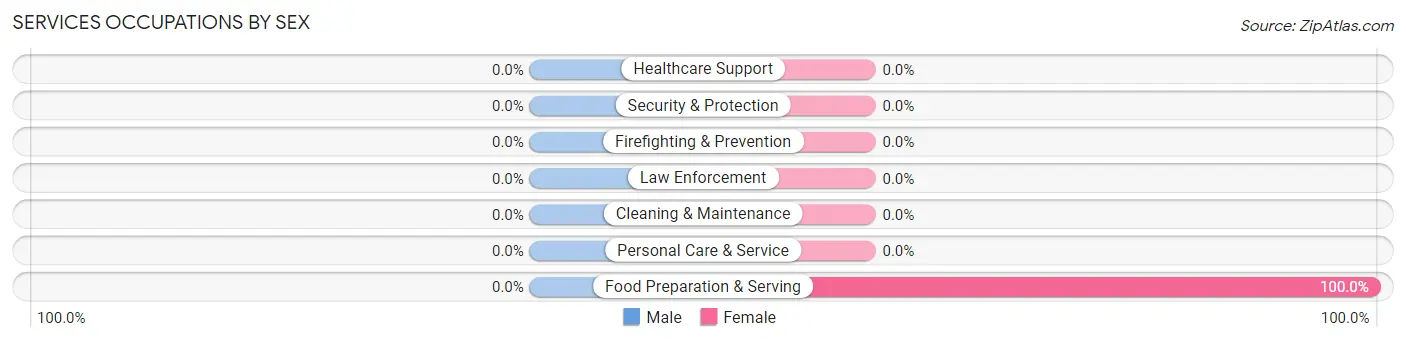
Services Occupations by Sex
| Occupation | Male | Female |
| Healthcare Support | 0 (0.0%) | 0 (0.0%) |
| Security & Protection | 0 (0.0%) | 0 (0.0%) |
| Firefighting & Prevention | 0 (0.0%) | 0 (0.0%) |
| Law Enforcement | 0 (0.0%) | 0 (0.0%) |
| Food Preparation & Serving | 0 (0.0%) | 2 (100.0%) |
| Cleaning & Maintenance | 0 (0.0%) | 0 (0.0%) |
| Personal Care & Service | 0 (0.0%) | 0 (0.0%) |
| Total (Category) | 0 (0.0%) | 2 (100.0%) |
| Total (Overall) | 21 (84.0%) | 4 (16.0%) |
Sales and Office Occupations
The most common Sales and Office occupations in Lynndyl are Sales & Related (1 | 4.0%), and Office & Administration (1 | 4.0%).
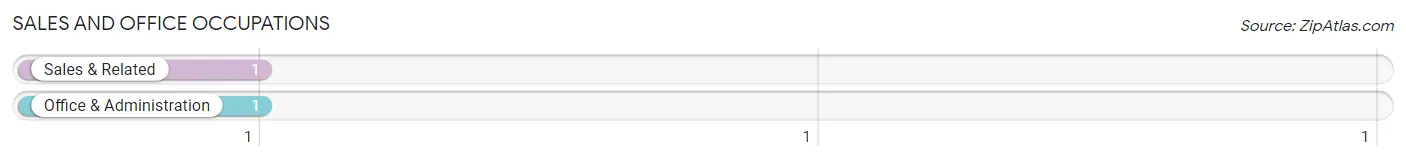
Sales and Office Occupations by Sex
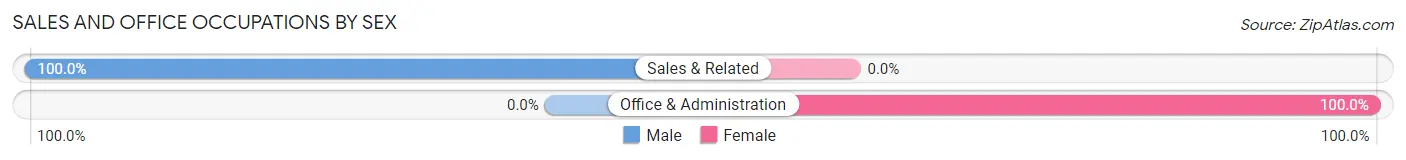
| Occupation | Male | Female |
| Sales & Related | 1 (100.0%) | 0 (0.0%) |
| Office & Administration | 0 (0.0%) | 1 (100.0%) |
| Total (Category) | 1 (50.0%) | 1 (50.0%) |
| Total (Overall) | 21 (84.0%) | 4 (16.0%) |
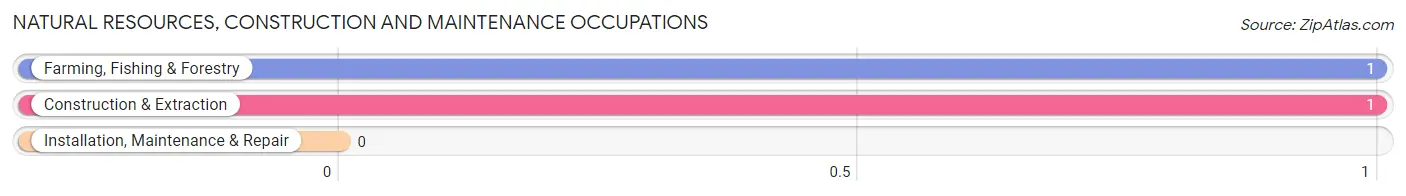
Natural Resources, Construction and Maintenance Occupations
The most common Natural Resources, Construction and Maintenance occupations in Lynndyl are Farming, Fishing & Forestry (1 | 4.0%), and Construction & Extraction (1 | 4.0%).
Natural Resources, Construction and Maintenance Occupations by Sex
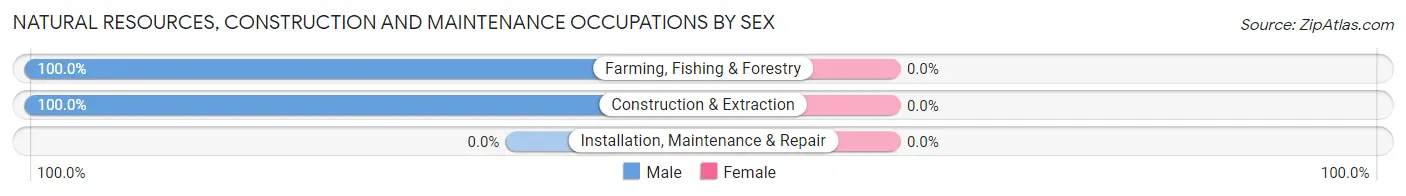
| Occupation | Male | Female |
| Farming, Fishing & Forestry | 1 (100.0%) | 0 (0.0%) |
| Construction & Extraction | 1 (100.0%) | 0 (0.0%) |
| Installation, Maintenance & Repair | 0 (0.0%) | 0 (0.0%) |
| Total (Category) | 2 (100.0%) | 0 (0.0%) |
| Total (Overall) | 21 (84.0%) | 4 (16.0%) |
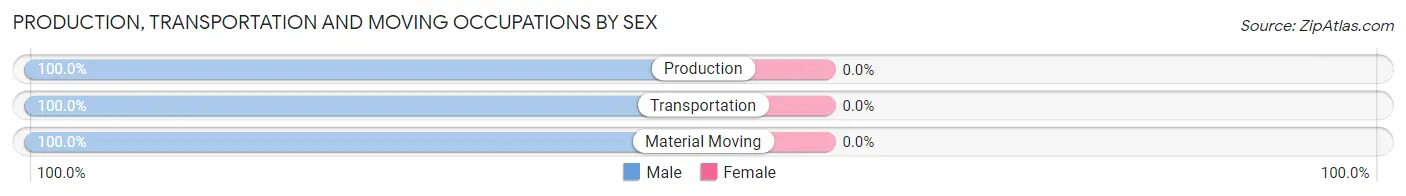
Production, Transportation and Moving Occupations
The most common Production, Transportation and Moving occupations in Lynndyl are Transportation (6 | 24.0%), Production (2 | 8.0%), and Material Moving (1 | 4.0%).
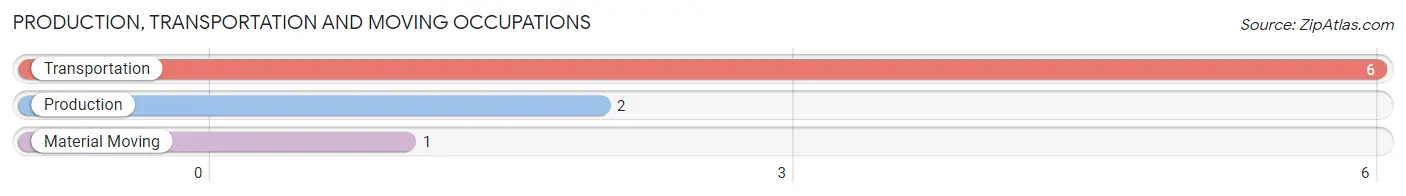
Production, Transportation and Moving Occupations by Sex
| Occupation | Male | Female |
| Production | 2 (100.0%) | 0 (0.0%) |
| Transportation | 6 (100.0%) | 0 (0.0%) |
| Material Moving | 1 (100.0%) | 0 (0.0%) |
| Total (Category) | 9 (100.0%) | 0 (0.0%) |
| Total (Overall) | 21 (84.0%) | 4 (16.0%) |
Employment Industries by Sex in Lynndyl
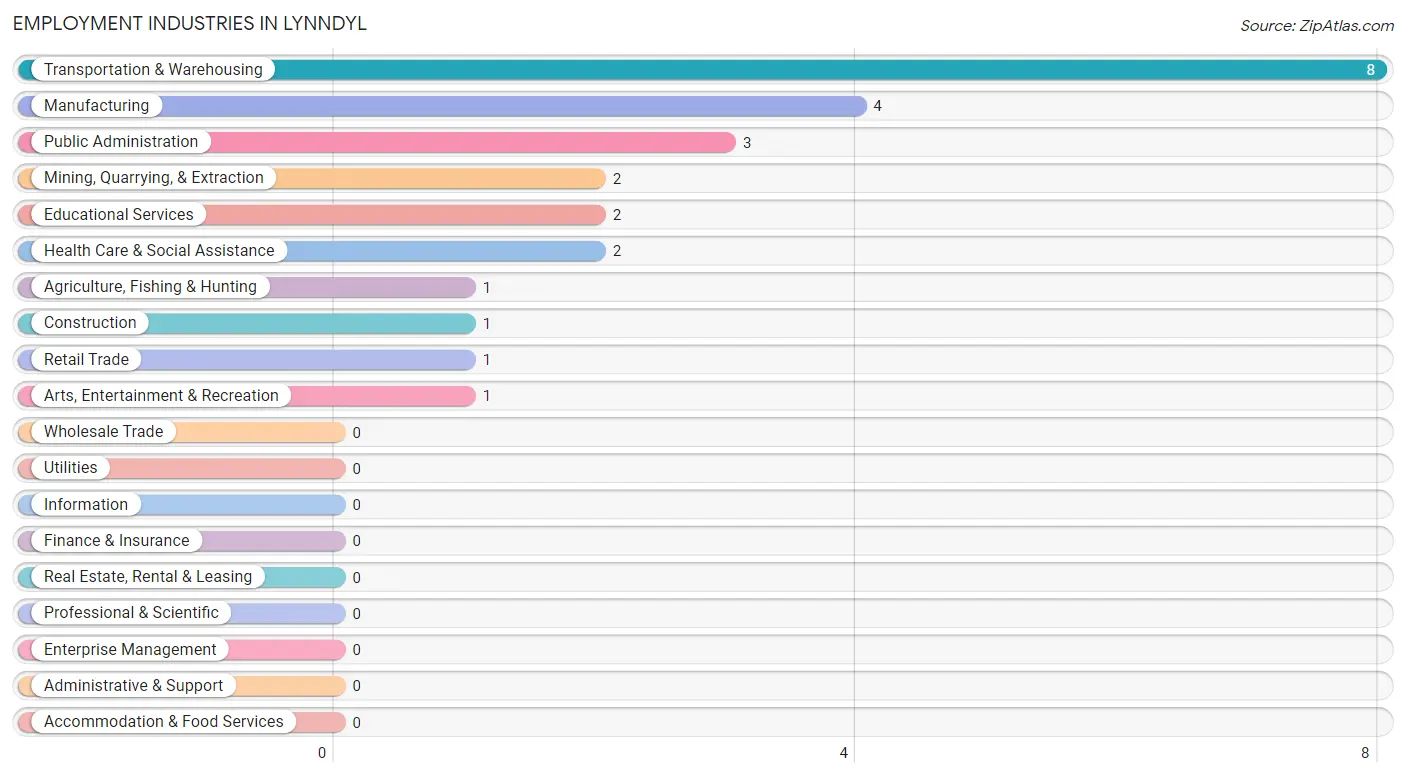
Employment Industries in Lynndyl
The major employment industries in Lynndyl include Transportation & Warehousing (8 | 32.0%), Manufacturing (4 | 16.0%), Public Administration (3 | 12.0%), Mining, Quarrying, & Extraction (2 | 8.0%), and Educational Services (2 | 8.0%).
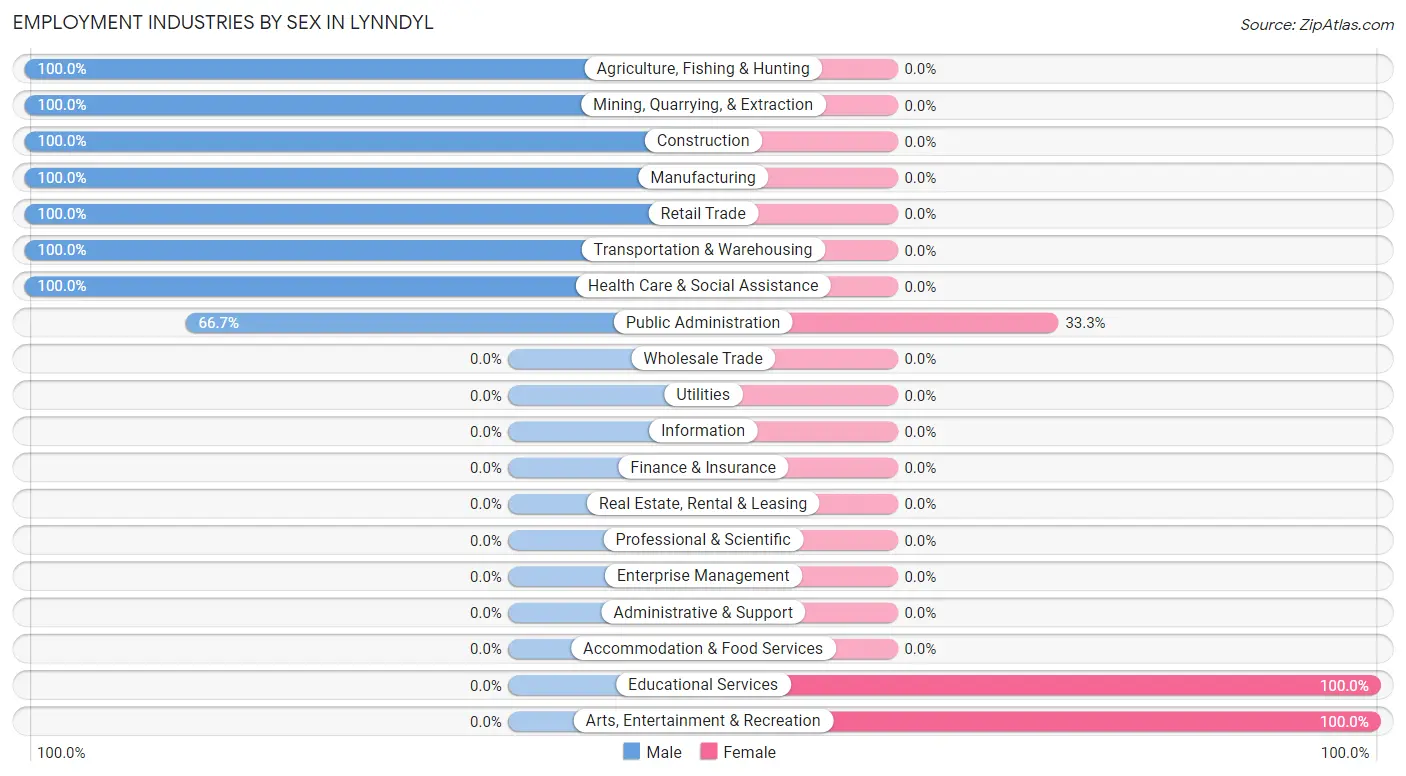
Employment Industries by Sex in Lynndyl
The Lynndyl industries that see more men than women are Agriculture, Fishing & Hunting (100.0%), Mining, Quarrying, & Extraction (100.0%), and Construction (100.0%), whereas the industries that tend to have a higher number of women are Educational Services (100.0%), Arts, Entertainment & Recreation (100.0%), and Public Administration (33.3%).
| Industry | Male | Female |
| Agriculture, Fishing & Hunting | 1 (100.0%) | 0 (0.0%) |
| Mining, Quarrying, & Extraction | 2 (100.0%) | 0 (0.0%) |
| Construction | 1 (100.0%) | 0 (0.0%) |
| Manufacturing | 4 (100.0%) | 0 (0.0%) |
| Wholesale Trade | 0 (0.0%) | 0 (0.0%) |
| Retail Trade | 1 (100.0%) | 0 (0.0%) |
| Transportation & Warehousing | 8 (100.0%) | 0 (0.0%) |
| Utilities | 0 (0.0%) | 0 (0.0%) |
| Information | 0 (0.0%) | 0 (0.0%) |
| Finance & Insurance | 0 (0.0%) | 0 (0.0%) |
| Real Estate, Rental & Leasing | 0 (0.0%) | 0 (0.0%) |
| Professional & Scientific | 0 (0.0%) | 0 (0.0%) |
| Enterprise Management | 0 (0.0%) | 0 (0.0%) |
| Administrative & Support | 0 (0.0%) | 0 (0.0%) |
| Educational Services | 0 (0.0%) | 2 (100.0%) |
| Health Care & Social Assistance | 2 (100.0%) | 0 (0.0%) |
| Arts, Entertainment & Recreation | 0 (0.0%) | 1 (100.0%) |
| Accommodation & Food Services | 0 (0.0%) | 0 (0.0%) |
| Public Administration | 2 (66.7%) | 1 (33.3%) |
| Total | 21 (84.0%) | 4 (16.0%) |
Education in Lynndyl
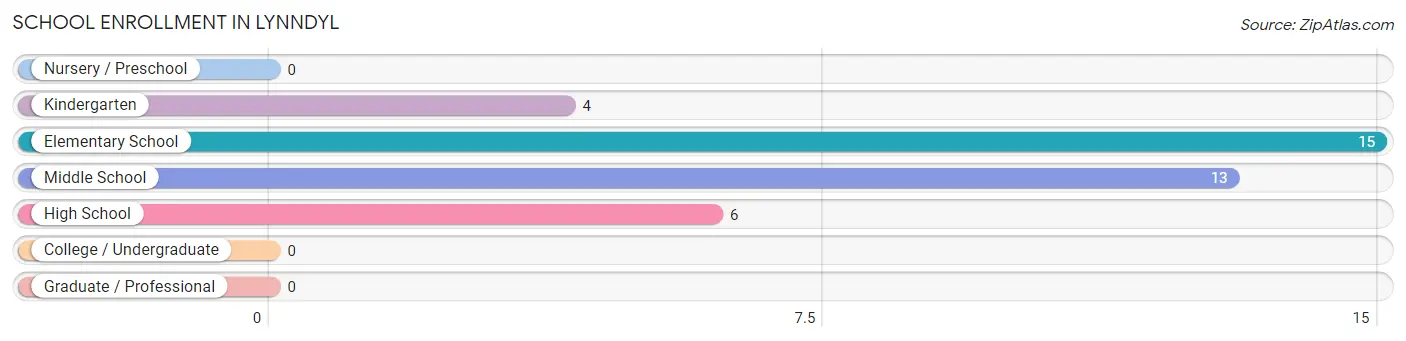
School Enrollment in Lynndyl
The most common levels of schooling among the 38 students in Lynndyl are elementary school (15 | 39.5%), middle school (13 | 34.2%), and high school (6 | 15.8%).
| School Level | # Students | % Students |
| Nursery / Preschool | 0 | 0.0% |
| Kindergarten | 4 | 10.5% |
| Elementary School | 15 | 39.5% |
| Middle School | 13 | 34.2% |
| High School | 6 | 15.8% |
| College / Undergraduate | 0 | 0.0% |
| Graduate / Professional | 0 | 0.0% |
| Total | 38 | 100.0% |
School Enrollment by Age by Funding Source in Lynndyl
Out of a total of 38 students who are enrolled in schools in Lynndyl, 12 (31.6%) attend a private institution, while the remaining 26 (68.4%) are enrolled in public schools. The age group of 5 to 9 year old has the highest likelihood of being enrolled in private schools, with 6 (35.3% in the age bracket) enrolled. Conversely, the age group of 15 to 17 year olds has the lowest likelihood of being enrolled in a private school, with 4 (100.0% in the age bracket) attending a public institution.
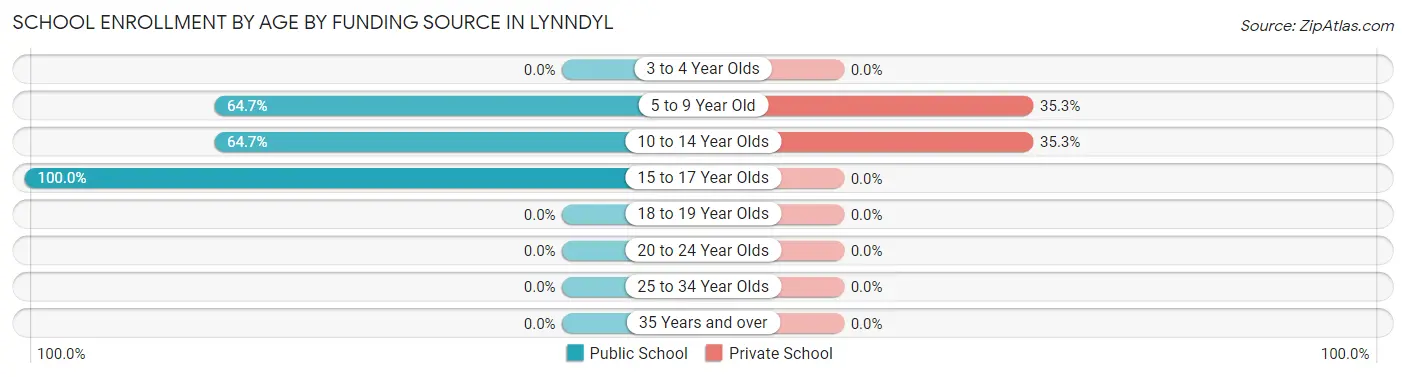
| Age Bracket | Public School | Private School |
| 3 to 4 Year Olds | 0 (0.0%) | 0 (0.0%) |
| 5 to 9 Year Old | 11 (64.7%) | 6 (35.3%) |
| 10 to 14 Year Olds | 11 (64.7%) | 6 (35.3%) |
| 15 to 17 Year Olds | 4 (100.0%) | 0 (0.0%) |
| 18 to 19 Year Olds | 0 (0.0%) | 0 (0.0%) |
| 20 to 24 Year Olds | 0 (0.0%) | 0 (0.0%) |
| 25 to 34 Year Olds | 0 (0.0%) | 0 (0.0%) |
| 35 Years and over | 0 (0.0%) | 0 (0.0%) |
| Total | 26 (68.4%) | 12 (31.6%) |
Educational Attainment by Field of Study in Lynndyl
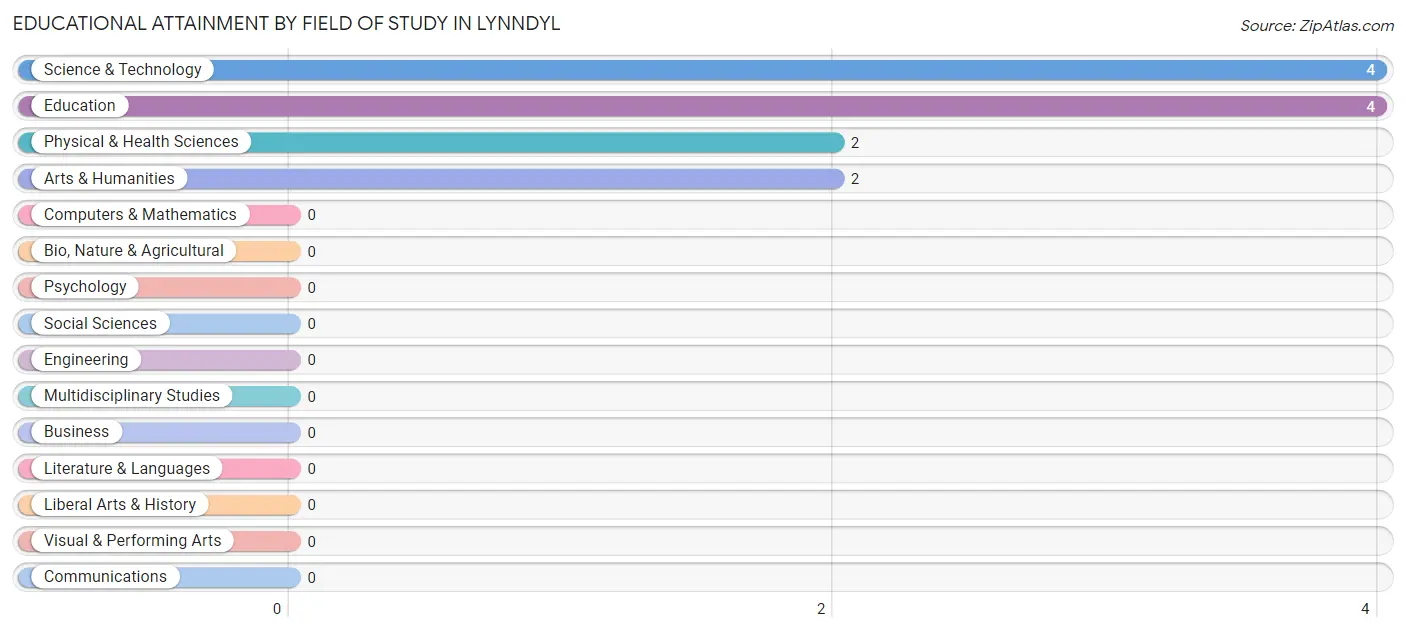
Science & technology (4 | 33.3%), education (4 | 33.3%), physical & health sciences (2 | 16.7%), and arts & humanities (2 | 16.7%) are the most common fields of study among 12 individuals in Lynndyl who have obtained a bachelor's degree or higher.
| Field of Study | # Graduates | % Graduates |
| Computers & Mathematics | 0 | 0.0% |
| Bio, Nature & Agricultural | 0 | 0.0% |
| Physical & Health Sciences | 2 | 16.7% |
| Psychology | 0 | 0.0% |
| Social Sciences | 0 | 0.0% |
| Engineering | 0 | 0.0% |
| Multidisciplinary Studies | 0 | 0.0% |
| Science & Technology | 4 | 33.3% |
| Business | 0 | 0.0% |
| Education | 4 | 33.3% |
| Literature & Languages | 0 | 0.0% |
| Liberal Arts & History | 0 | 0.0% |
| Visual & Performing Arts | 0 | 0.0% |
| Communications | 0 | 0.0% |
| Arts & Humanities | 2 | 16.7% |
| Total | 12 | 100.0% |
Transportation & Commute in Lynndyl
Vehicle Availability by Sex in Lynndyl
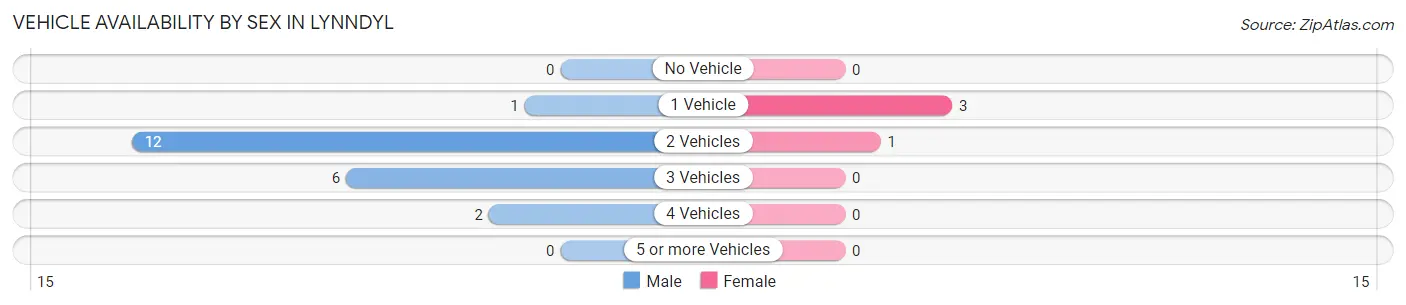
The most prevalent vehicle ownership categories in Lynndyl are males with 2 vehicles (12, accounting for 57.1%) and females with 2 vehicles (1, making up 300.0%).
| Vehicles Available | Male | Female |
| No Vehicle | 0 (0.0%) | 0 (0.0%) |
| 1 Vehicle | 1 (4.8%) | 3 (75.0%) |
| 2 Vehicles | 12 (57.1%) | 1 (25.0%) |
| 3 Vehicles | 6 (28.6%) | 0 (0.0%) |
| 4 Vehicles | 2 (9.5%) | 0 (0.0%) |
| 5 or more Vehicles | 0 (0.0%) | 0 (0.0%) |
| Total | 21 (100.0%) | 4 (100.0%) |
Commute Time in Lynndyl
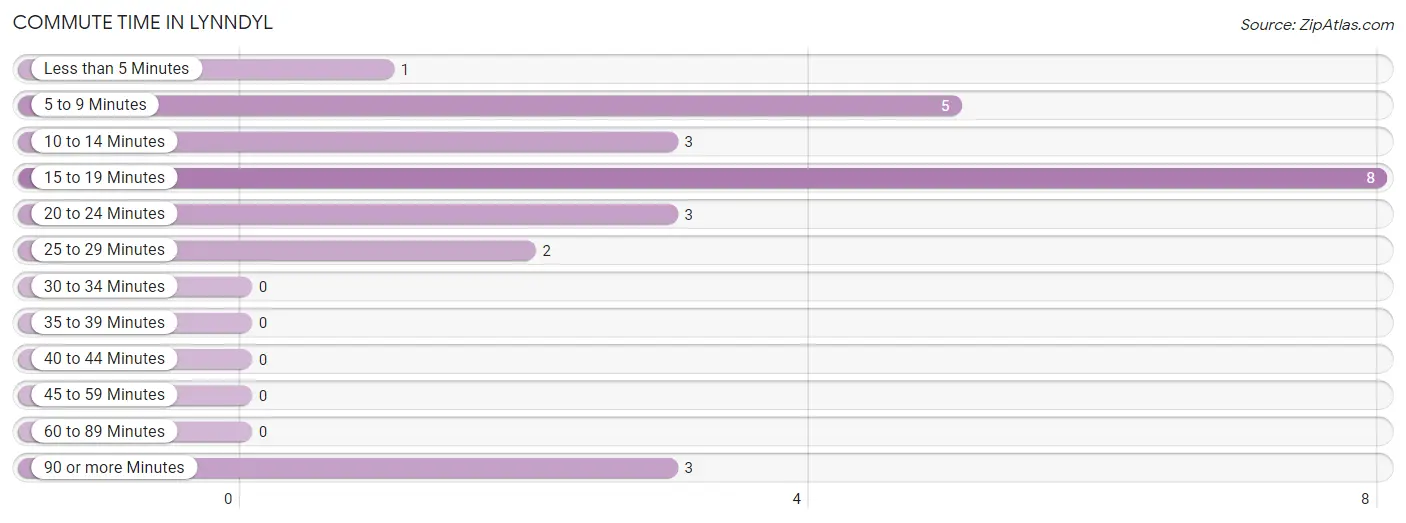
The most frequently occuring commute durations in Lynndyl are 15 to 19 minutes (8 commuters, 32.0%), 5 to 9 minutes (5 commuters, 20.0%), and 10 to 14 minutes (3 commuters, 12.0%).
| Commute Time | # Commuters | % Commuters |
| Less than 5 Minutes | 1 | 4.0% |
| 5 to 9 Minutes | 5 | 20.0% |
| 10 to 14 Minutes | 3 | 12.0% |
| 15 to 19 Minutes | 8 | 32.0% |
| 20 to 24 Minutes | 3 | 12.0% |
| 25 to 29 Minutes | 2 | 8.0% |
| 30 to 34 Minutes | 0 | 0.0% |
| 35 to 39 Minutes | 0 | 0.0% |
| 40 to 44 Minutes | 0 | 0.0% |
| 45 to 59 Minutes | 0 | 0.0% |
| 60 to 89 Minutes | 0 | 0.0% |
| 90 or more Minutes | 3 | 12.0% |
Commute Time by Sex in Lynndyl
The most common commute times in Lynndyl are 15 to 19 minutes (8 commuters, 38.1%) for males and 5 to 9 minutes (2 commuters, 50.0%) for females.
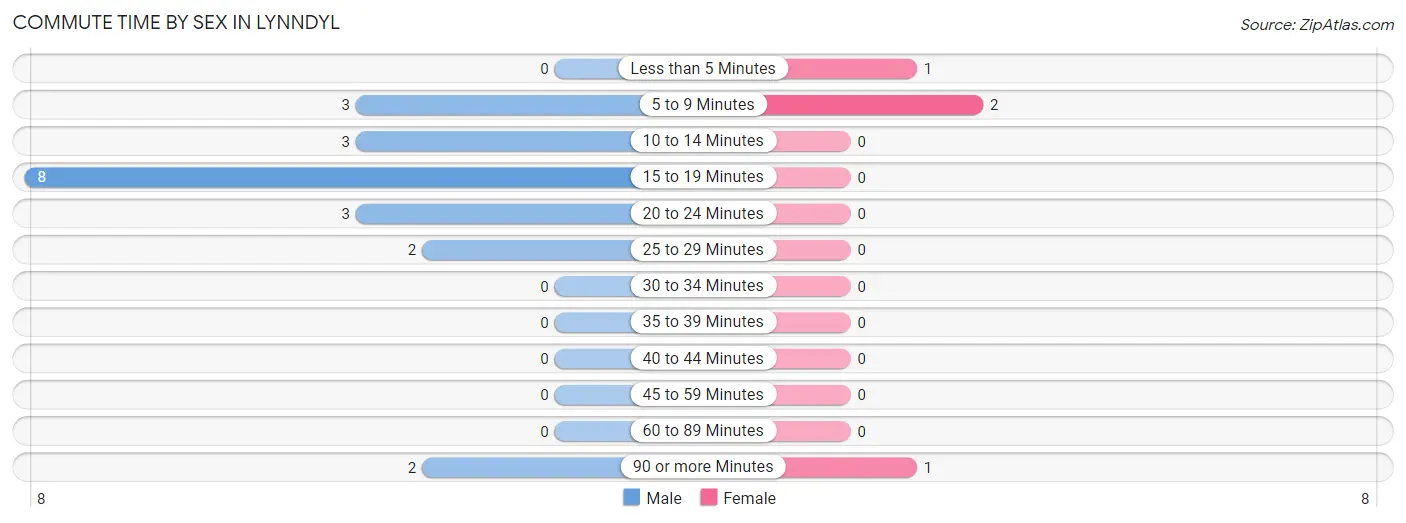
| Commute Time | Male | Female |
| Less than 5 Minutes | 0 (0.0%) | 1 (25.0%) |
| 5 to 9 Minutes | 3 (14.3%) | 2 (50.0%) |
| 10 to 14 Minutes | 3 (14.3%) | 0 (0.0%) |
| 15 to 19 Minutes | 8 (38.1%) | 0 (0.0%) |
| 20 to 24 Minutes | 3 (14.3%) | 0 (0.0%) |
| 25 to 29 Minutes | 2 (9.5%) | 0 (0.0%) |
| 30 to 34 Minutes | 0 (0.0%) | 0 (0.0%) |
| 35 to 39 Minutes | 0 (0.0%) | 0 (0.0%) |
| 40 to 44 Minutes | 0 (0.0%) | 0 (0.0%) |
| 45 to 59 Minutes | 0 (0.0%) | 0 (0.0%) |
| 60 to 89 Minutes | 0 (0.0%) | 0 (0.0%) |
| 90 or more Minutes | 2 (9.5%) | 1 (25.0%) |
Time of Departure to Work by Sex in Lynndyl
The most frequent times of departure to work in Lynndyl are 12:00 AM to 4:59 AM (7, 33.3%) for males and 7:00 AM to 7:29 AM (2, 50.0%) for females.
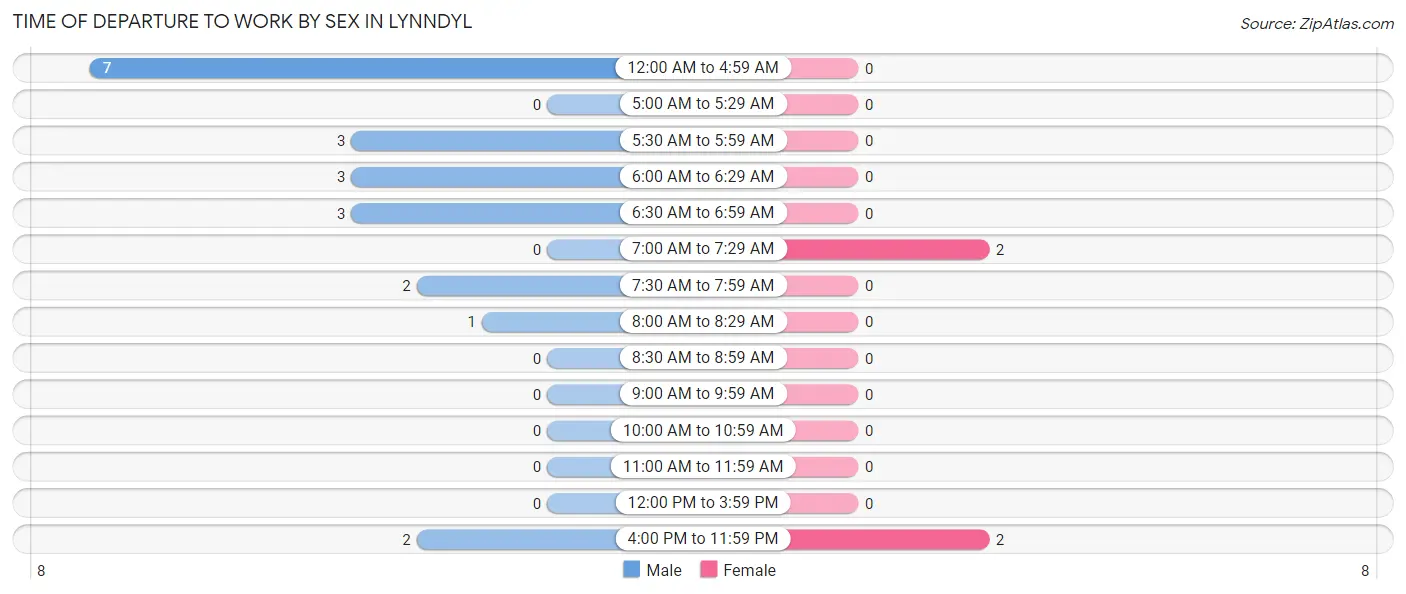
| Time of Departure | Male | Female |
| 12:00 AM to 4:59 AM | 7 (33.3%) | 0 (0.0%) |
| 5:00 AM to 5:29 AM | 0 (0.0%) | 0 (0.0%) |
| 5:30 AM to 5:59 AM | 3 (14.3%) | 0 (0.0%) |
| 6:00 AM to 6:29 AM | 3 (14.3%) | 0 (0.0%) |
| 6:30 AM to 6:59 AM | 3 (14.3%) | 0 (0.0%) |
| 7:00 AM to 7:29 AM | 0 (0.0%) | 2 (50.0%) |
| 7:30 AM to 7:59 AM | 2 (9.5%) | 0 (0.0%) |
| 8:00 AM to 8:29 AM | 1 (4.8%) | 0 (0.0%) |
| 8:30 AM to 8:59 AM | 0 (0.0%) | 0 (0.0%) |
| 9:00 AM to 9:59 AM | 0 (0.0%) | 0 (0.0%) |
| 10:00 AM to 10:59 AM | 0 (0.0%) | 0 (0.0%) |
| 11:00 AM to 11:59 AM | 0 (0.0%) | 0 (0.0%) |
| 12:00 PM to 3:59 PM | 0 (0.0%) | 0 (0.0%) |
| 4:00 PM to 11:59 PM | 2 (9.5%) | 2 (50.0%) |
| Total | 21 (100.0%) | 4 (100.0%) |
Housing Occupancy in Lynndyl
Occupancy by Ownership in Lynndyl
Of the total 36 dwellings in Lynndyl, owner-occupied units account for 36 (100.0%), while renter-occupied units make up 0 (0.0%).
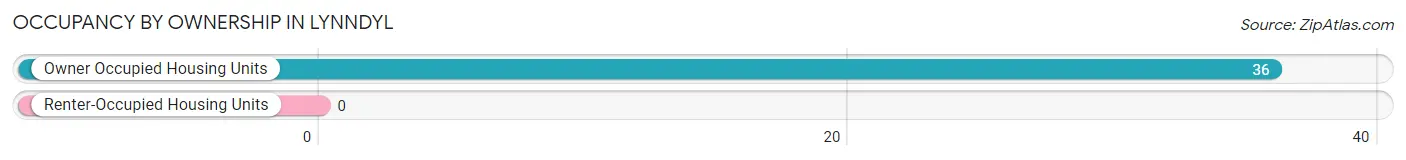
| Occupancy | # Housing Units | % Housing Units |
| Owner Occupied Housing Units | 36 | 100.0% |
| Renter-Occupied Housing Units | 0 | 0.0% |
| Total Occupied Housing Units | 36 | 100.0% |
Occupancy by Household Size in Lynndyl
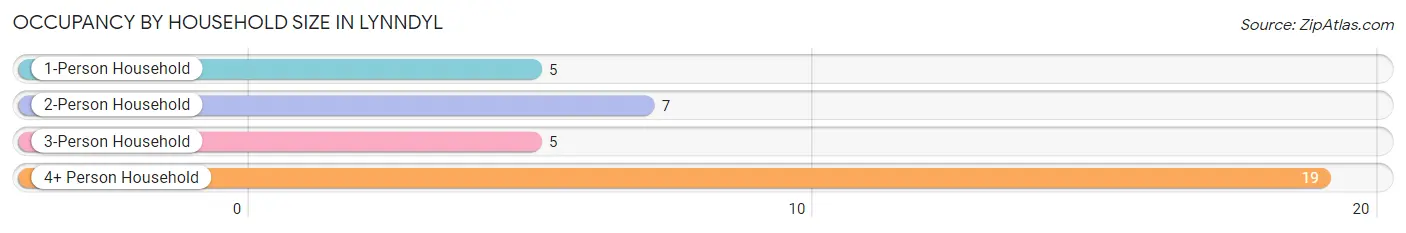
| Household Size | # Housing Units | % Housing Units |
| 1-Person Household | 5 | 13.9% |
| 2-Person Household | 7 | 19.4% |
| 3-Person Household | 5 | 13.9% |
| 4+ Person Household | 19 | 52.8% |
| Total Housing Units | 36 | 100.0% |
Occupancy by Ownership by Household Size in Lynndyl
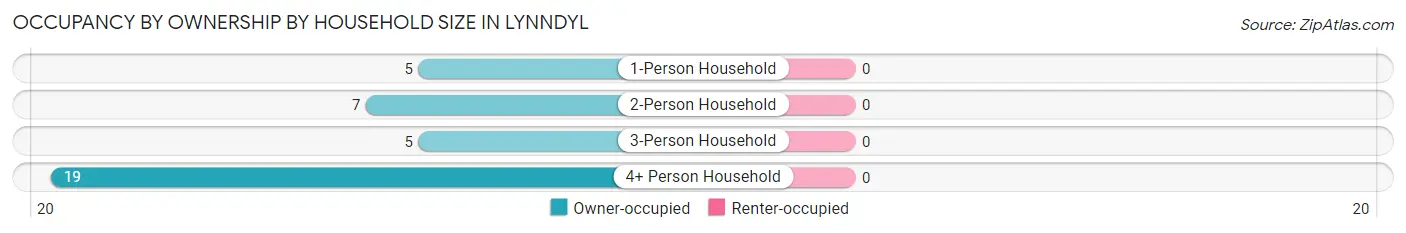
| Household Size | Owner-occupied | Renter-occupied |
| 1-Person Household | 5 (100.0%) | 0 (0.0%) |
| 2-Person Household | 7 (100.0%) | 0 (0.0%) |
| 3-Person Household | 5 (100.0%) | 0 (0.0%) |
| 4+ Person Household | 19 (100.0%) | 0 (0.0%) |
| Total Housing Units | 36 (100.0%) | 0 (0.0%) |
Occupancy by Educational Attainment in Lynndyl
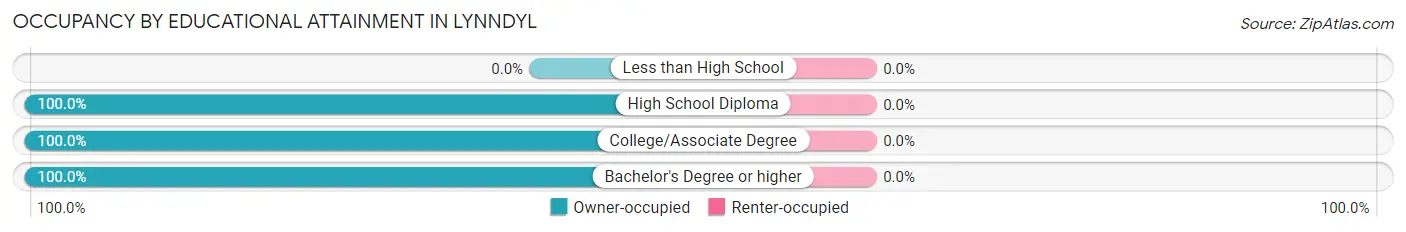
| Household Size | Owner-occupied | Renter-occupied |
| Less than High School | 0 (0.0%) | 0 (0.0%) |
| High School Diploma | 13 (100.0%) | 0 (0.0%) |
| College/Associate Degree | 13 (100.0%) | 0 (0.0%) |
| Bachelor's Degree or higher | 10 (100.0%) | 0 (0.0%) |
Occupancy by Age of Householder in Lynndyl
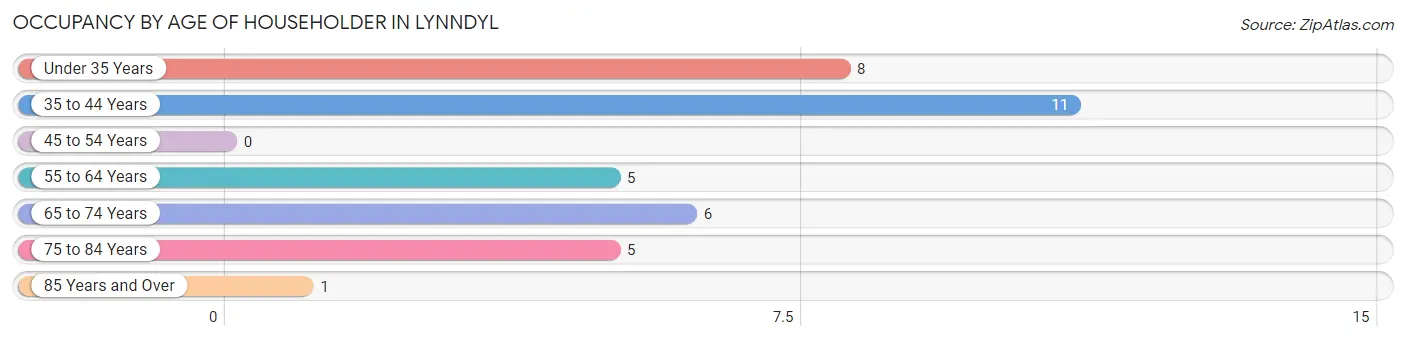
| Age Bracket | # Households | % Households |
| Under 35 Years | 8 | 22.2% |
| 35 to 44 Years | 11 | 30.6% |
| 45 to 54 Years | 0 | 0.0% |
| 55 to 64 Years | 5 | 13.9% |
| 65 to 74 Years | 6 | 16.7% |
| 75 to 84 Years | 5 | 13.9% |
| 85 Years and Over | 1 | 2.8% |
| Total | 36 | 100.0% |
Housing Finances in Lynndyl
Median Income by Occupancy in Lynndyl
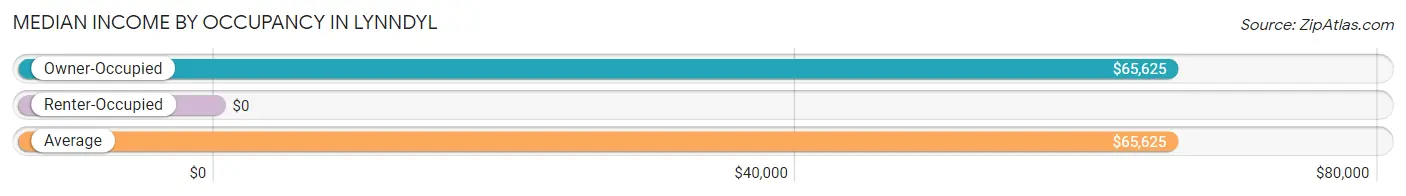
| Occupancy Type | # Households | Median Income |
| Owner-Occupied | 36 (100.0%) | $65,625 |
| Renter-Occupied | 0 (0.0%) | $0 |
| Average | 36 (100.0%) | $65,625 |
Occupancy by Householder Income Bracket in Lynndyl
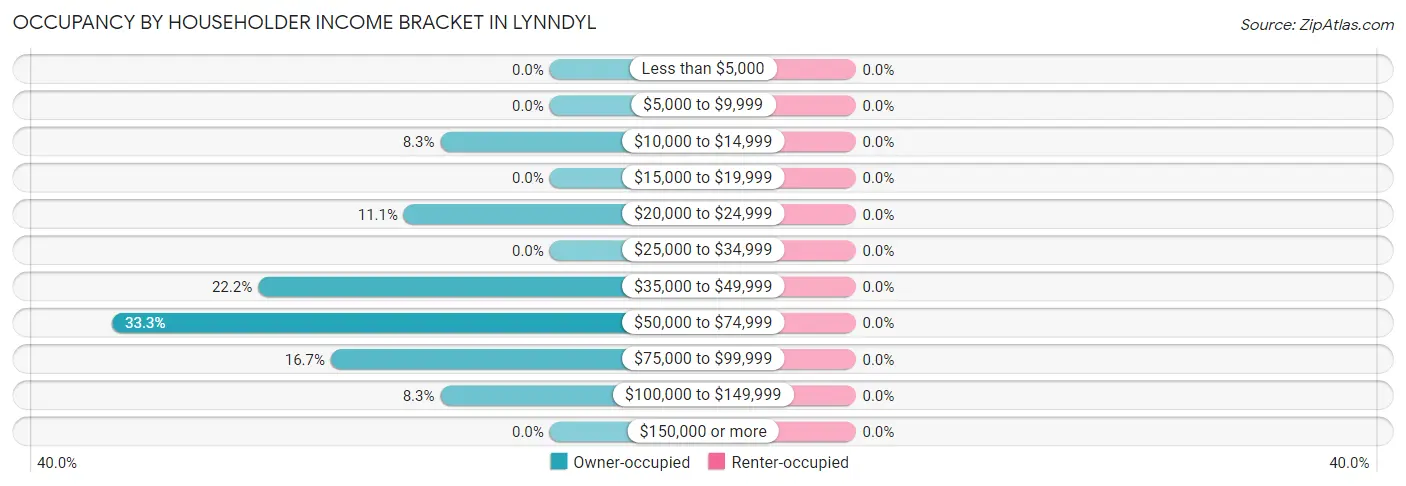
| Income Bracket | Owner-occupied | Renter-occupied |
| Less than $5,000 | 0 (0.0%) | 0 (0.0%) |
| $5,000 to $9,999 | 0 (0.0%) | 0 (0.0%) |
| $10,000 to $14,999 | 3 (8.3%) | 0 (0.0%) |
| $15,000 to $19,999 | 0 (0.0%) | 0 (0.0%) |
| $20,000 to $24,999 | 4 (11.1%) | 0 (0.0%) |
| $25,000 to $34,999 | 0 (0.0%) | 0 (0.0%) |
| $35,000 to $49,999 | 8 (22.2%) | 0 (0.0%) |
| $50,000 to $74,999 | 12 (33.3%) | 0 (0.0%) |
| $75,000 to $99,999 | 6 (16.7%) | 0 (0.0%) |
| $100,000 to $149,999 | 3 (8.3%) | 0 (0.0%) |
| $150,000 or more | 0 (0.0%) | 0 (0.0%) |
| Total | 36 (100.0%) | 0 (0.0%) |
Monthly Housing Cost Tiers in Lynndyl
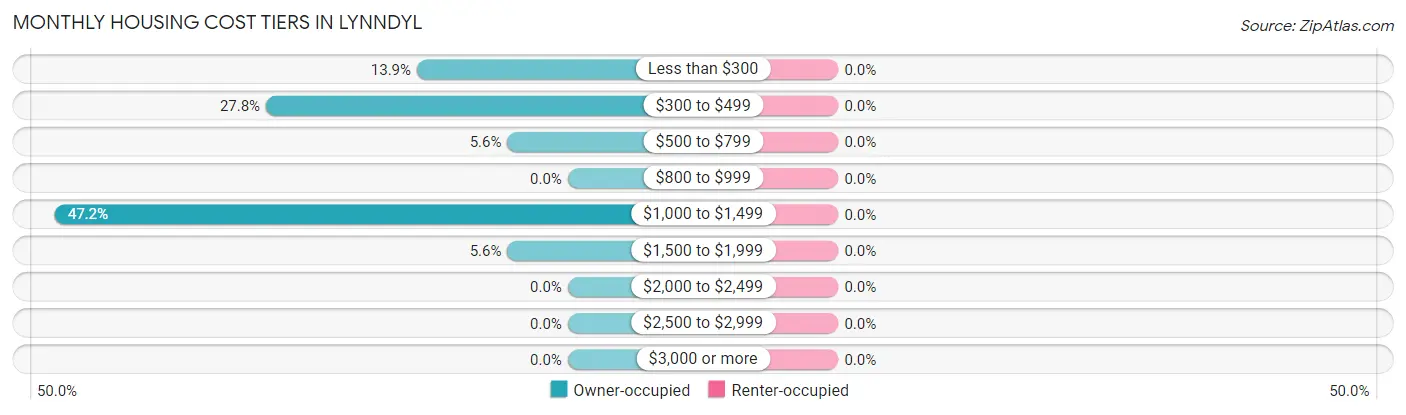
| Monthly Cost | Owner-occupied | Renter-occupied |
| Less than $300 | 5 (13.9%) | 0 (0.0%) |
| $300 to $499 | 10 (27.8%) | 0 (0.0%) |
| $500 to $799 | 2 (5.6%) | 0 (0.0%) |
| $800 to $999 | 0 (0.0%) | 0 (0.0%) |
| $1,000 to $1,499 | 17 (47.2%) | 0 (0.0%) |
| $1,500 to $1,999 | 2 (5.6%) | 0 (0.0%) |
| $2,000 to $2,499 | 0 (0.0%) | 0 (0.0%) |
| $2,500 to $2,999 | 0 (0.0%) | 0 (0.0%) |
| $3,000 or more | 0 (0.0%) | 0 (0.0%) |
| Total | 36 (100.0%) | 0 (0.0%) |
Physical Housing Characteristics in Lynndyl
Housing Structures in Lynndyl
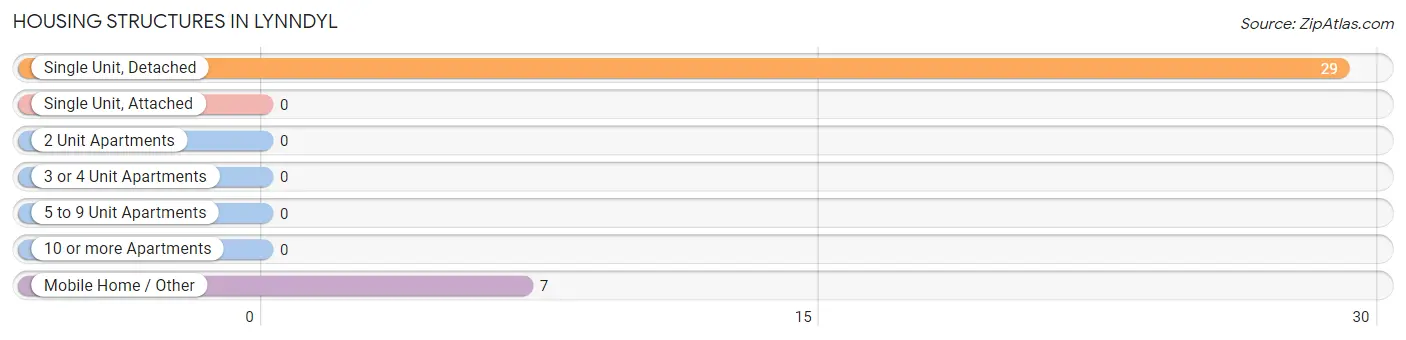
| Structure Type | # Housing Units | % Housing Units |
| Single Unit, Detached | 29 | 80.6% |
| Single Unit, Attached | 0 | 0.0% |
| 2 Unit Apartments | 0 | 0.0% |
| 3 or 4 Unit Apartments | 0 | 0.0% |
| 5 to 9 Unit Apartments | 0 | 0.0% |
| 10 or more Apartments | 0 | 0.0% |
| Mobile Home / Other | 7 | 19.4% |
| Total | 36 | 100.0% |
Housing Structures by Occupancy in Lynndyl
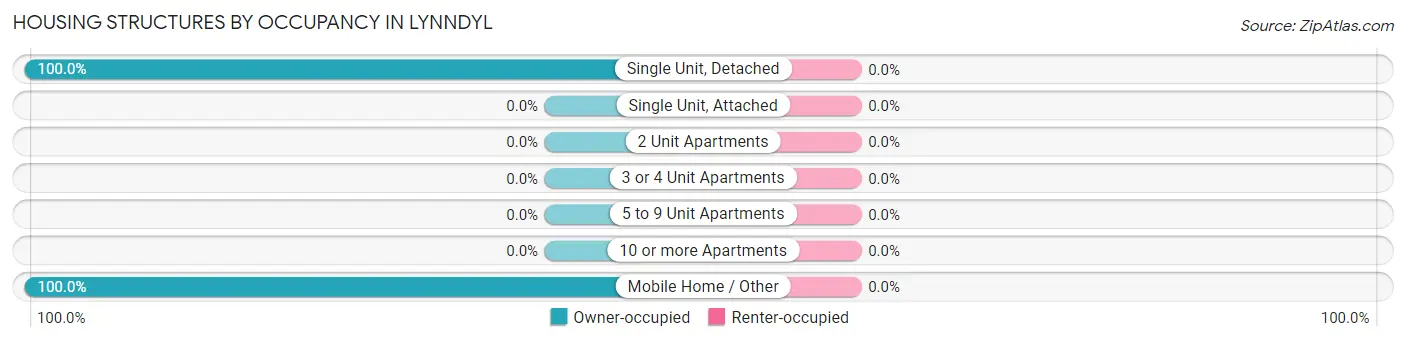
| Structure Type | Owner-occupied | Renter-occupied |
| Single Unit, Detached | 29 (100.0%) | 0 (0.0%) |
| Single Unit, Attached | 0 (0.0%) | 0 (0.0%) |
| 2 Unit Apartments | 0 (0.0%) | 0 (0.0%) |
| 3 or 4 Unit Apartments | 0 (0.0%) | 0 (0.0%) |
| 5 to 9 Unit Apartments | 0 (0.0%) | 0 (0.0%) |
| 10 or more Apartments | 0 (0.0%) | 0 (0.0%) |
| Mobile Home / Other | 7 (100.0%) | 0 (0.0%) |
| Total | 36 (100.0%) | 0 (0.0%) |
Housing Structures by Number of Rooms in Lynndyl
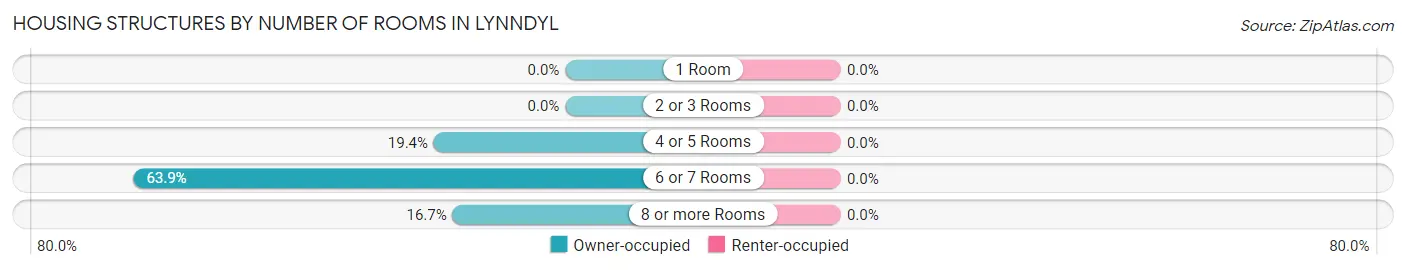
| Number of Rooms | Owner-occupied | Renter-occupied |
| 1 Room | 0 (0.0%) | 0 (0.0%) |
| 2 or 3 Rooms | 0 (0.0%) | 0 (0.0%) |
| 4 or 5 Rooms | 7 (19.4%) | 0 (0.0%) |
| 6 or 7 Rooms | 23 (63.9%) | 0 (0.0%) |
| 8 or more Rooms | 6 (16.7%) | 0 (0.0%) |
| Total | 36 (100.0%) | 0 (0.0%) |
Housing Structure by Heating Type in Lynndyl
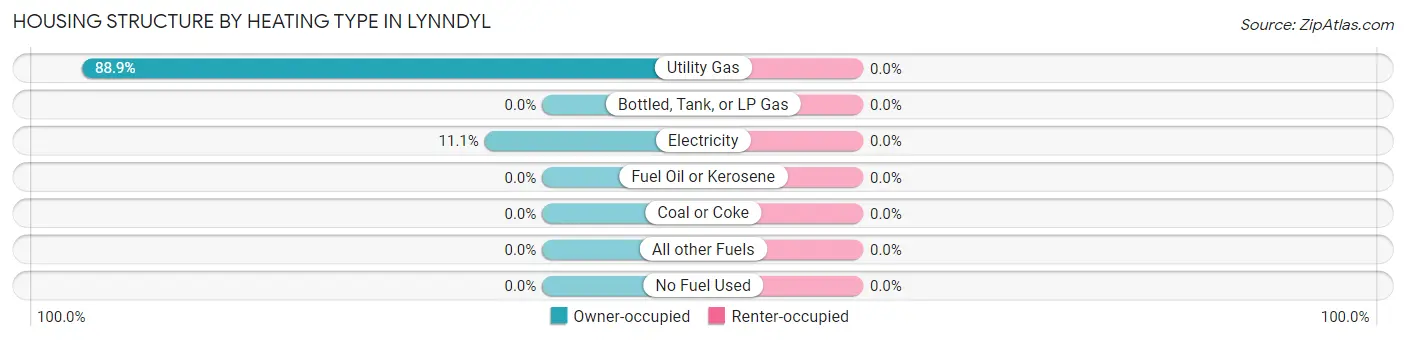
| Heating Type | Owner-occupied | Renter-occupied |
| Utility Gas | 32 (88.9%) | 0 (0.0%) |
| Bottled, Tank, or LP Gas | 0 (0.0%) | 0 (0.0%) |
| Electricity | 4 (11.1%) | 0 (0.0%) |
| Fuel Oil or Kerosene | 0 (0.0%) | 0 (0.0%) |
| Coal or Coke | 0 (0.0%) | 0 (0.0%) |
| All other Fuels | 0 (0.0%) | 0 (0.0%) |
| No Fuel Used | 0 (0.0%) | 0 (0.0%) |
| Total | 36 (100.0%) | 0 (0.0%) |
Household Vehicle Usage in Lynndyl
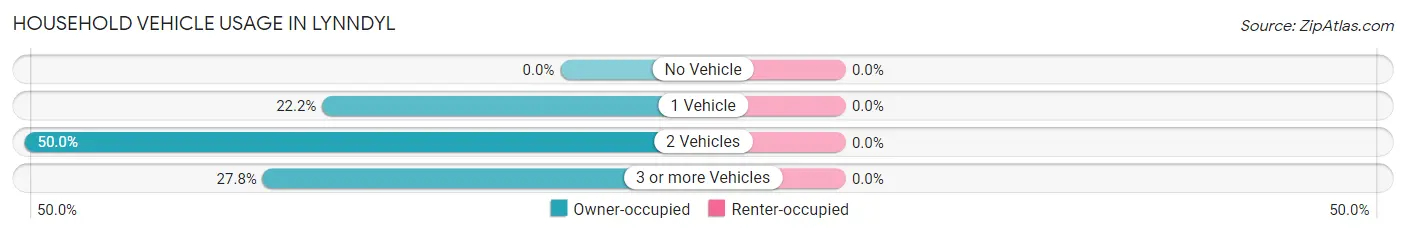
| Vehicles per Household | Owner-occupied | Renter-occupied |
| No Vehicle | 0 (0.0%) | 0 (0.0%) |
| 1 Vehicle | 8 (22.2%) | 0 (0.0%) |
| 2 Vehicles | 18 (50.0%) | 0 (0.0%) |
| 3 or more Vehicles | 10 (27.8%) | 0 (0.0%) |
| Total | 36 (100.0%) | 0 (0.0%) |
Real Estate & Mortgages in Lynndyl
Real Estate and Mortgage Overview in Lynndyl
| Characteristic | Without Mortgage | With Mortgage |
| Housing Units | 17 | 19 |
| Median Property Value | $136,300 | $305,000 |
| Median Household Income | $48,036 | $0 |
| Monthly Housing Costs | $325 | $0 |
| Real Estate Taxes | $900 | $0 |
Property Value by Mortgage Status in Lynndyl
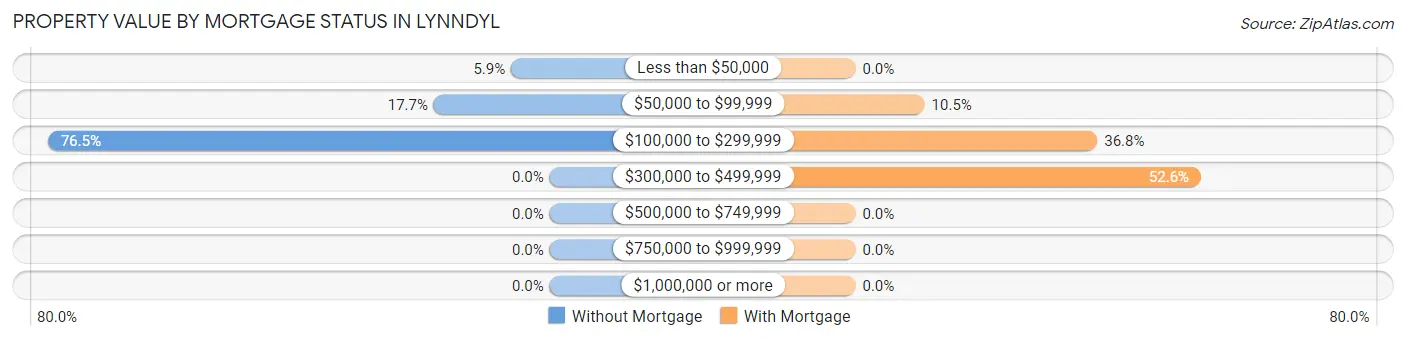
| Property Value | Without Mortgage | With Mortgage |
| Less than $50,000 | 1 (5.9%) | 0 (0.0%) |
| $50,000 to $99,999 | 3 (17.6%) | 2 (10.5%) |
| $100,000 to $299,999 | 13 (76.5%) | 7 (36.8%) |
| $300,000 to $499,999 | 0 (0.0%) | 10 (52.6%) |
| $500,000 to $749,999 | 0 (0.0%) | 0 (0.0%) |
| $750,000 to $999,999 | 0 (0.0%) | 0 (0.0%) |
| $1,000,000 or more | 0 (0.0%) | 0 (0.0%) |
| Total | 17 (100.0%) | 19 (100.0%) |
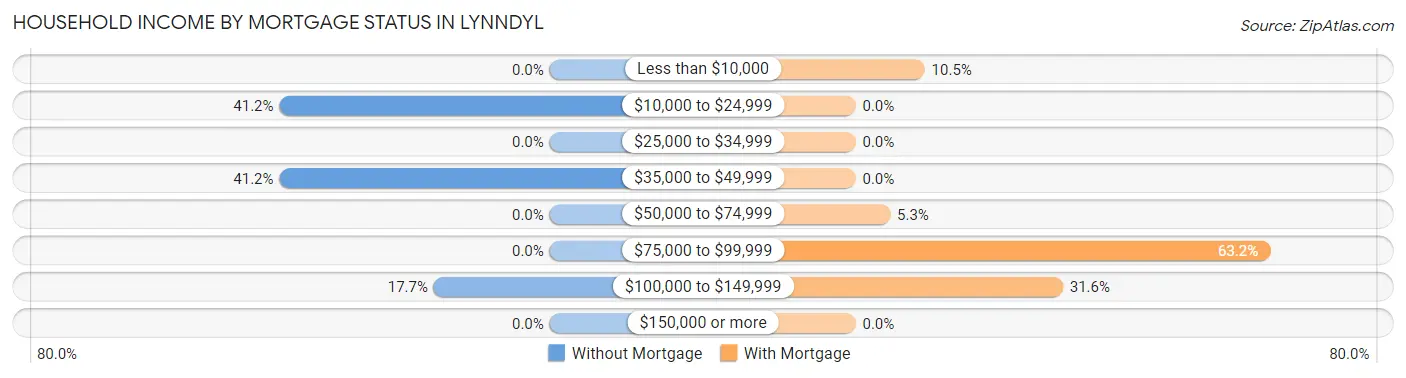
Household Income by Mortgage Status in Lynndyl
| Household Income | Without Mortgage | With Mortgage |
| Less than $10,000 | 0 (0.0%) | 2 (10.5%) |
| $10,000 to $24,999 | 7 (41.2%) | 0 (0.0%) |
| $25,000 to $34,999 | 0 (0.0%) | 0 (0.0%) |
| $35,000 to $49,999 | 7 (41.2%) | 0 (0.0%) |
| $50,000 to $74,999 | 0 (0.0%) | 1 (5.3%) |
| $75,000 to $99,999 | 0 (0.0%) | 12 (63.2%) |
| $100,000 to $149,999 | 3 (17.6%) | 6 (31.6%) |
| $150,000 or more | 0 (0.0%) | 0 (0.0%) |
| Total | 17 (100.0%) | 19 (100.0%) |
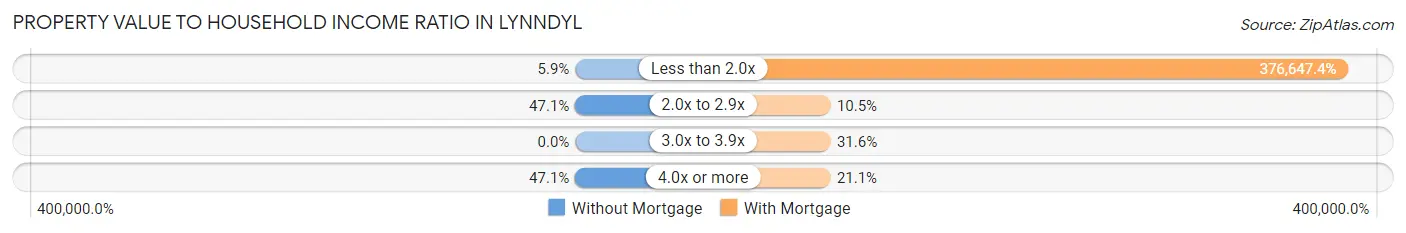
Property Value to Household Income Ratio in Lynndyl
| Value-to-Income Ratio | Without Mortgage | With Mortgage |
| Less than 2.0x | 1 (5.9%) | 71,563 (376,647.4%) |
| 2.0x to 2.9x | 8 (47.1%) | 2 (10.5%) |
| 3.0x to 3.9x | 0 (0.0%) | 6 (31.6%) |
| 4.0x or more | 8 (47.1%) | 4 (21.0%) |
| Total | 17 (100.0%) | 19 (100.0%) |
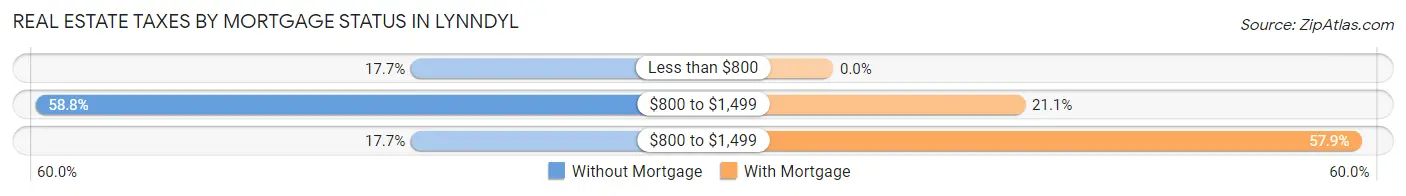
Real Estate Taxes by Mortgage Status in Lynndyl
| Property Taxes | Without Mortgage | With Mortgage |
| Less than $800 | 3 (17.6%) | 0 (0.0%) |
| $800 to $1,499 | 10 (58.8%) | 4 (21.0%) |
| $800 to $1,499 | 3 (17.6%) | 11 (57.9%) |
| Total | 17 (100.0%) | 19 (100.0%) |
Health & Disability in Lynndyl
Health Insurance Coverage by Age in Lynndyl
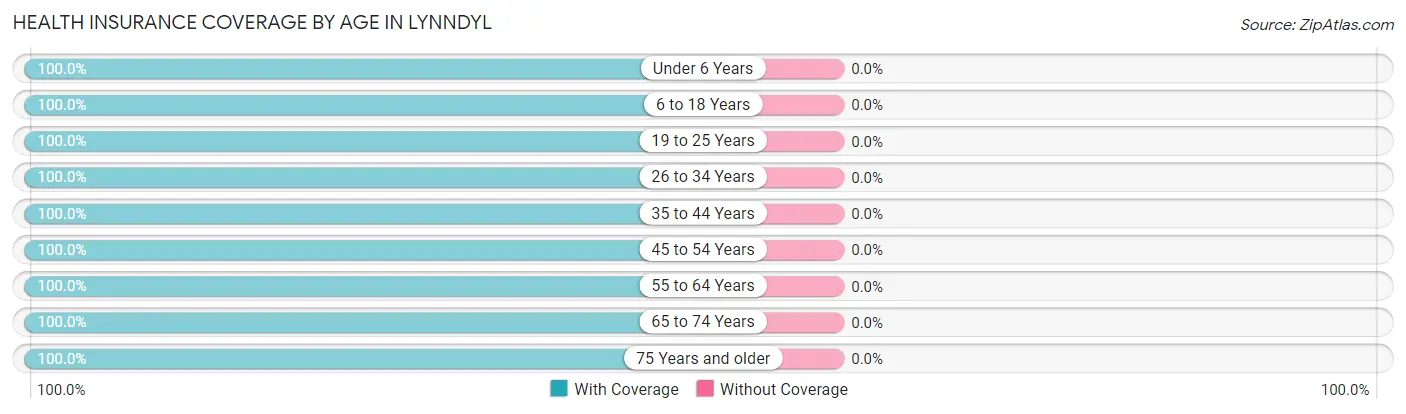
| Age Bracket | With Coverage | Without Coverage |
| Under 6 Years | 18 (100.0%) | 0 (0.0%) |
| 6 to 18 Years | 37 (100.0%) | 0 (0.0%) |
| 19 to 25 Years | 3 (100.0%) | 0 (0.0%) |
| 26 to 34 Years | 18 (100.0%) | 0 (0.0%) |
| 35 to 44 Years | 17 (100.0%) | 0 (0.0%) |
| 45 to 54 Years | 2 (100.0%) | 0 (0.0%) |
| 55 to 64 Years | 7 (100.0%) | 0 (0.0%) |
| 65 to 74 Years | 10 (100.0%) | 0 (0.0%) |
| 75 Years and older | 7 (100.0%) | 0 (0.0%) |
| Total | 119 (100.0%) | 0 (0.0%) |
Health Insurance Coverage by Citizenship Status in Lynndyl
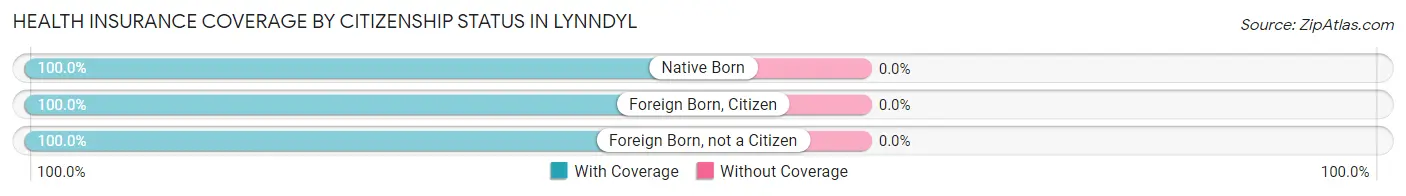
| Citizenship Status | With Coverage | Without Coverage |
| Native Born | 18 (100.0%) | 0 (0.0%) |
| Foreign Born, Citizen | 37 (100.0%) | 0 (0.0%) |
| Foreign Born, not a Citizen | 3 (100.0%) | 0 (0.0%) |
Health Insurance Coverage by Household Income in Lynndyl
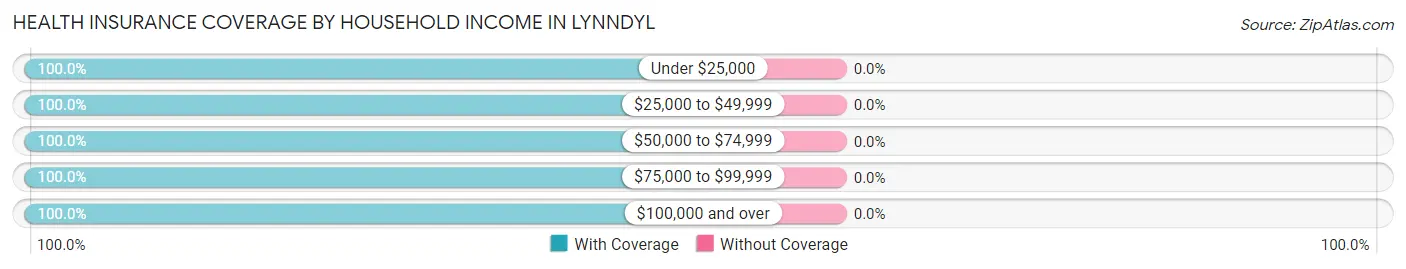
| Household Income | With Coverage | Without Coverage |
| Under $25,000 | 14 (100.0%) | 0 (0.0%) |
| $25,000 to $49,999 | 34 (100.0%) | 0 (0.0%) |
| $50,000 to $74,999 | 43 (100.0%) | 0 (0.0%) |
| $75,000 to $99,999 | 23 (100.0%) | 0 (0.0%) |
| $100,000 and over | 5 (100.0%) | 0 (0.0%) |
Public vs Private Health Insurance Coverage by Age in Lynndyl
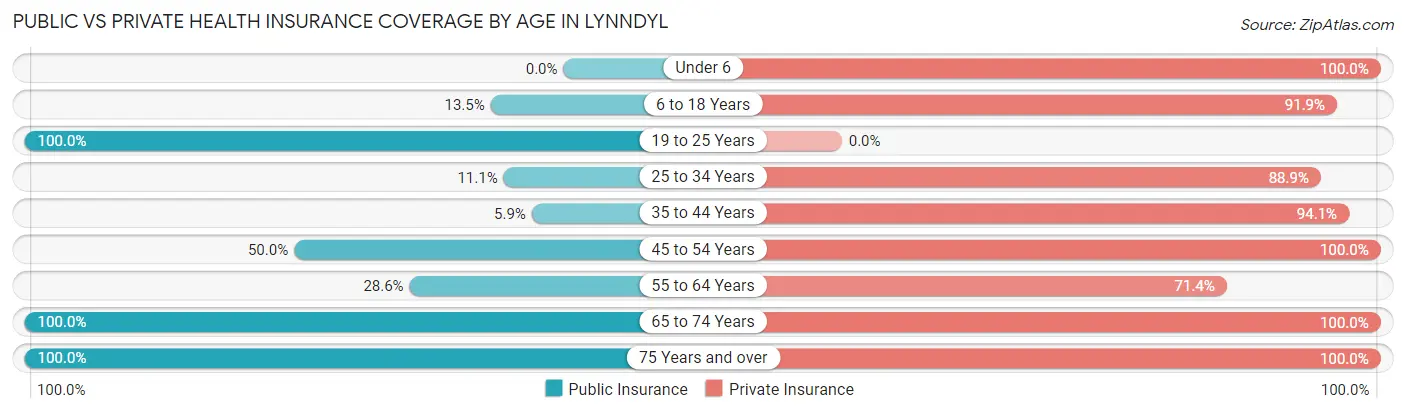
| Age Bracket | Public Insurance | Private Insurance |
| Under 6 | 0 (0.0%) | 18 (100.0%) |
| 6 to 18 Years | 5 (13.5%) | 34 (91.9%) |
| 19 to 25 Years | 3 (100.0%) | 0 (0.0%) |
| 25 to 34 Years | 2 (11.1%) | 16 (88.9%) |
| 35 to 44 Years | 1 (5.9%) | 16 (94.1%) |
| 45 to 54 Years | 1 (50.0%) | 2 (100.0%) |
| 55 to 64 Years | 2 (28.6%) | 5 (71.4%) |
| 65 to 74 Years | 10 (100.0%) | 10 (100.0%) |
| 75 Years and over | 7 (100.0%) | 7 (100.0%) |
| Total | 31 (26.1%) | 108 (90.8%) |
Disability Status by Sex by Age in Lynndyl
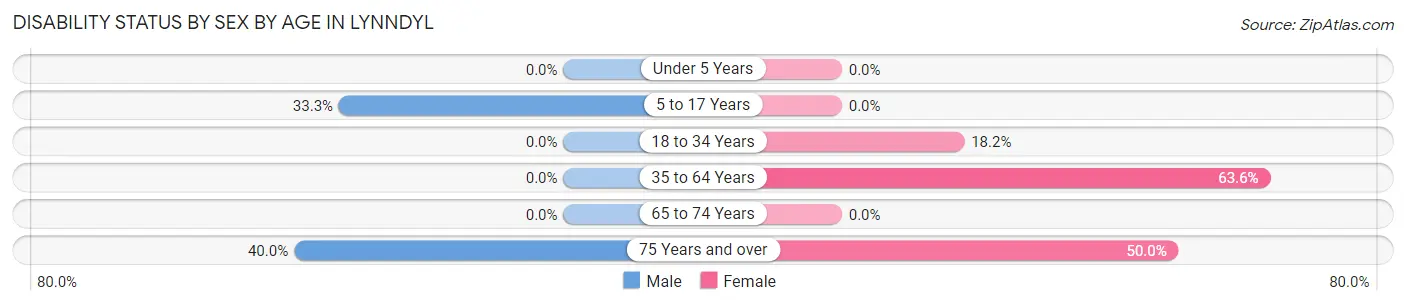
| Age Bracket | Male | Female |
| Under 5 Years | 0 (0.0%) | 0 (0.0%) |
| 5 to 17 Years | 7 (33.3%) | 0 (0.0%) |
| 18 to 34 Years | 0 (0.0%) | 2 (18.2%) |
| 35 to 64 Years | 0 (0.0%) | 7 (63.6%) |
| 65 to 74 Years | 0 (0.0%) | 0 (0.0%) |
| 75 Years and over | 2 (40.0%) | 1 (50.0%) |
Disability Class by Sex by Age in Lynndyl
Disability Class: Hearing Difficulty
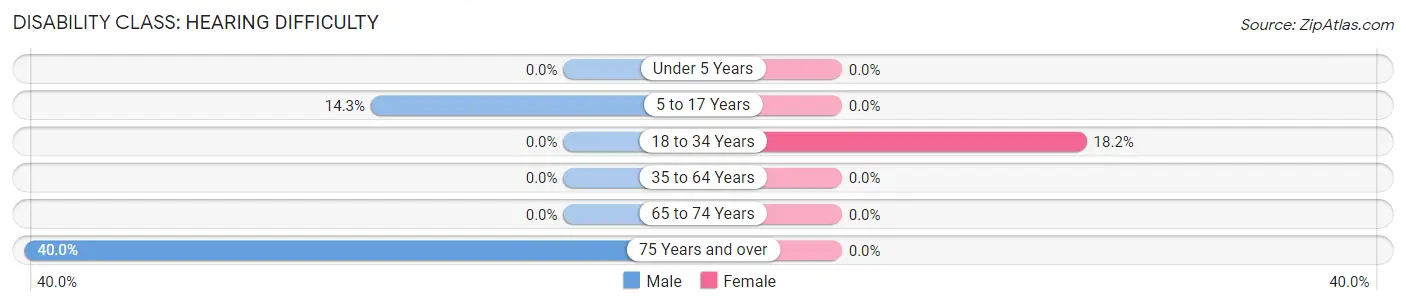
| Age Bracket | Male | Female |
| Under 5 Years | 0 (0.0%) | 0 (0.0%) |
| 5 to 17 Years | 3 (14.3%) | 0 (0.0%) |
| 18 to 34 Years | 0 (0.0%) | 2 (18.2%) |
| 35 to 64 Years | 0 (0.0%) | 0 (0.0%) |
| 65 to 74 Years | 0 (0.0%) | 0 (0.0%) |
| 75 Years and over | 2 (40.0%) | 0 (0.0%) |
Disability Class: Vision Difficulty
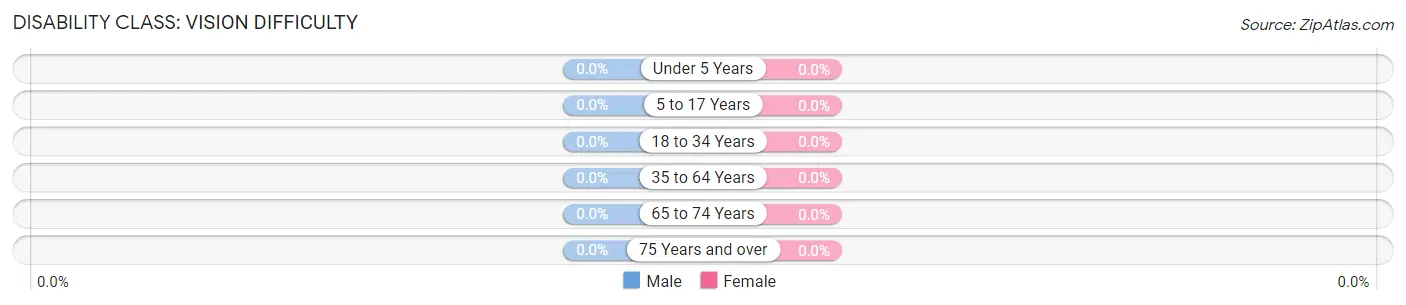
| Age Bracket | Male | Female |
| Under 5 Years | 0 (0.0%) | 0 (0.0%) |
| 5 to 17 Years | 0 (0.0%) | 0 (0.0%) |
| 18 to 34 Years | 0 (0.0%) | 0 (0.0%) |
| 35 to 64 Years | 0 (0.0%) | 0 (0.0%) |
| 65 to 74 Years | 0 (0.0%) | 0 (0.0%) |
| 75 Years and over | 0 (0.0%) | 0 (0.0%) |
Disability Class: Cognitive Difficulty
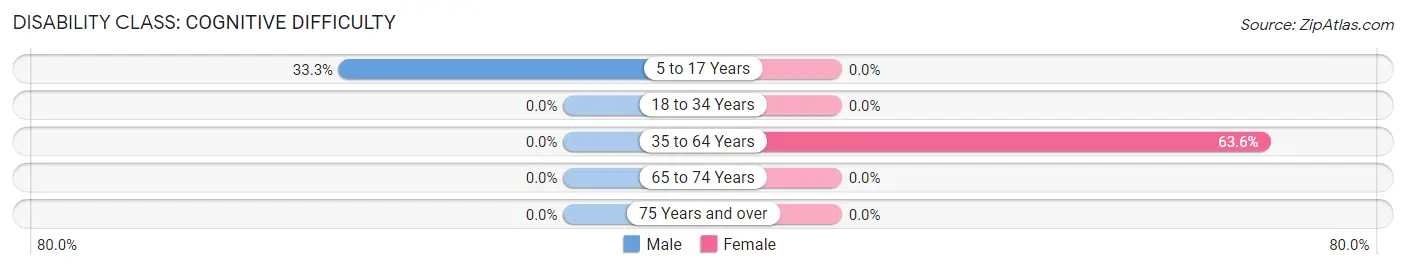
| Age Bracket | Male | Female |
| 5 to 17 Years | 7 (33.3%) | 0 (0.0%) |
| 18 to 34 Years | 0 (0.0%) | 0 (0.0%) |
| 35 to 64 Years | 0 (0.0%) | 7 (63.6%) |
| 65 to 74 Years | 0 (0.0%) | 0 (0.0%) |
| 75 Years and over | 0 (0.0%) | 0 (0.0%) |
Disability Class: Ambulatory Difficulty
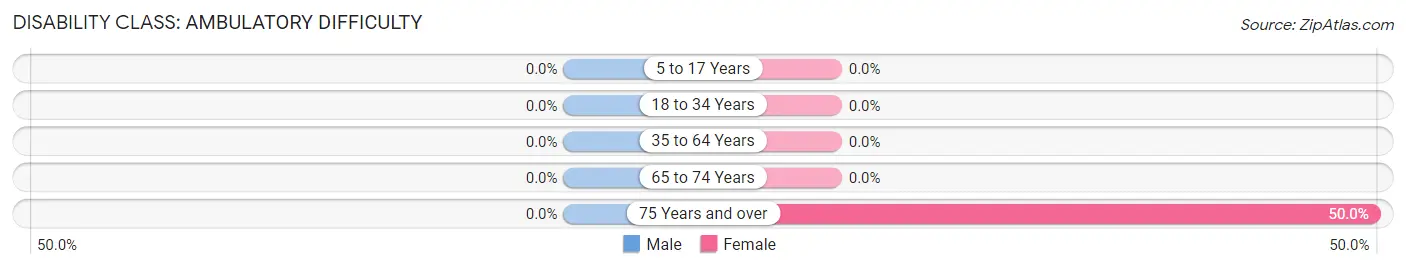
| Age Bracket | Male | Female |
| 5 to 17 Years | 0 (0.0%) | 0 (0.0%) |
| 18 to 34 Years | 0 (0.0%) | 0 (0.0%) |
| 35 to 64 Years | 0 (0.0%) | 0 (0.0%) |
| 65 to 74 Years | 0 (0.0%) | 0 (0.0%) |
| 75 Years and over | 0 (0.0%) | 1 (50.0%) |
Disability Class: Self-Care Difficulty
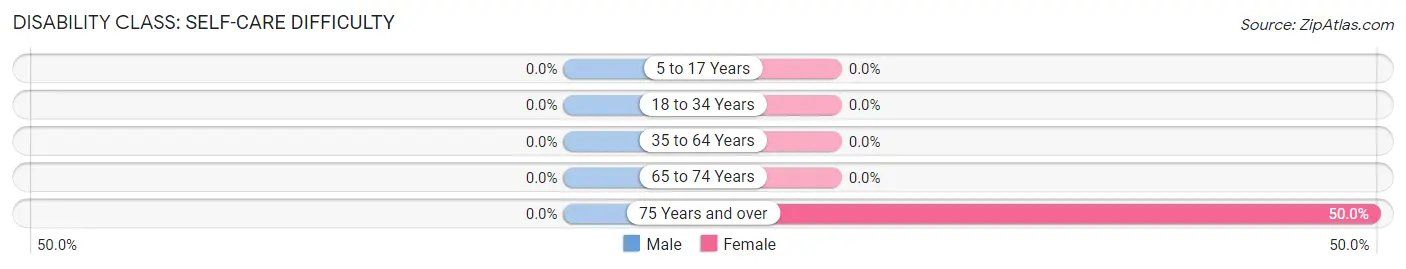
| Age Bracket | Male | Female |
| 5 to 17 Years | 0 (0.0%) | 0 (0.0%) |
| 18 to 34 Years | 0 (0.0%) | 0 (0.0%) |
| 35 to 64 Years | 0 (0.0%) | 0 (0.0%) |
| 65 to 74 Years | 0 (0.0%) | 0 (0.0%) |
| 75 Years and over | 0 (0.0%) | 1 (50.0%) |
Technology Access in Lynndyl
Computing Device Access in Lynndyl
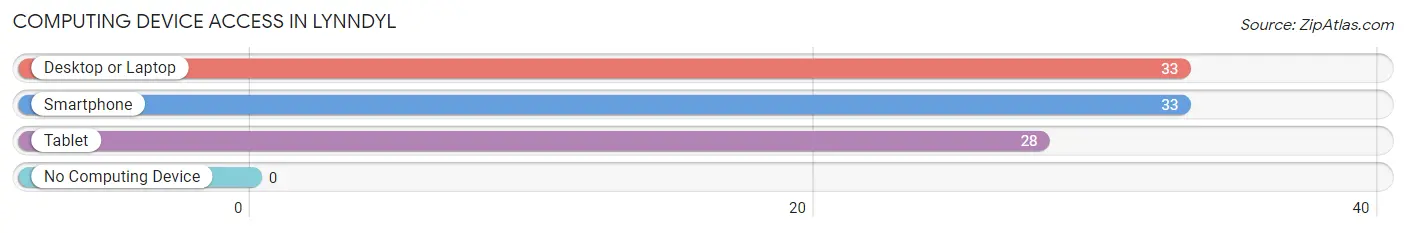
| Device Type | # Households | % Households |
| Desktop or Laptop | 33 | 91.7% |
| Smartphone | 33 | 91.7% |
| Tablet | 28 | 77.8% |
| No Computing Device | 0 | 0.0% |
| Total | 36 | 100.0% |
Internet Access in Lynndyl
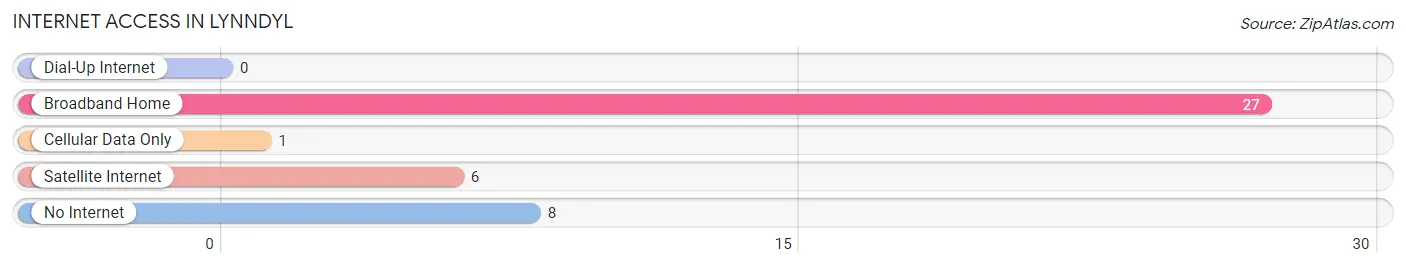
| Internet Type | # Households | % Households |
| Dial-Up Internet | 0 | 0.0% |
| Broadband Home | 27 | 75.0% |
| Cellular Data Only | 1 | 2.8% |
| Satellite Internet | 6 | 16.7% |
| No Internet | 8 | 22.2% |
| Total | 36 | 100.0% |
Lynndyl Summary
Lynndyl, Utah is a small town located in Millard County, Utah. It is situated in the western part of the state, approximately 40 miles southwest of Salt Lake City. The town was founded in 1883 and has a population of approximately 500 people.
Geography
Lynndyl is located in the western part of Millard County, Utah. It is situated in the Sevier Desert, which is part of the Great Basin Desert. The town is located at an elevation of 4,400 feet and is surrounded by mountains and hills. The nearest major city is Delta, which is located approximately 20 miles to the east.
The climate in Lynndyl is semi-arid, with hot summers and cold winters. The average annual temperature is approximately 50 degrees Fahrenheit. The average annual precipitation is approximately 8 inches.
Economy
The economy of Lynndyl is largely based on agriculture. The town is home to several farms, which produce a variety of crops, including alfalfa, corn, wheat, and hay. The town also has a small manufacturing sector, which produces a variety of products, including furniture, clothing, and food products.
The town also has a small tourism industry, which is centered around the nearby Fish Springs National Wildlife Refuge. The refuge is home to a variety of wildlife, including birds, mammals, and reptiles.
Demographics
As of the 2010 census, the population of Lynndyl was 498. The racial makeup of the town was 97.2% White, 0.2% African American, 0.2% Native American, 0.2% Asian, 0.2% Pacific Islander, 0.4% from other races, and 1.8% from two or more races. Hispanic or Latino of any race were 1.2% of the population.
The median household income in Lynndyl was $37,500, and the median family income was $41,250. The per capita income was $17,857. About 11.2% of families and 13.2% of the population were below the poverty line, including 16.7% of those under age 18 and none of those age 65 or over.
History
Lynndyl was founded in 1883 by a group of Mormon settlers. The town was named after the daughter of one of the settlers, who was named Lynda. The town was originally a farming community, and the settlers grew a variety of crops, including alfalfa, corn, wheat, and hay.
In the early 1900s, the town began to grow and develop. The first school was built in 1906, and the first church was built in 1908. The town also had a post office, a bank, and a general store.
In the 1950s, the town began to decline as many of the residents moved away in search of better economic opportunities. The population of the town decreased from a peak of 1,000 in 1950 to just 500 in 2010. Despite this, the town has managed to maintain its small-town charm and is still a popular destination for tourists and outdoor enthusiasts.
Common Questions
What is Per Capita Income in Lynndyl?
Per Capita income in Lynndyl is $16,038.
What is the Median Family Income in Lynndyl?
Median Family Income in Lynndyl is $66,563.
What is the Median Household income in Lynndyl?
Median Household Income in Lynndyl is $65,625.
What is Income or Wage Gap in Lynndyl?
Income or Wage Gap in Lynndyl is 94.9%.
Women in Lynndyl earn 5.1 cents for every dollar earned by a man.
What is Inequality or Gini Index in Lynndyl?
Inequality or Gini Index in Lynndyl is 0.27.
What is the Total Population of Lynndyl?
Total Population of Lynndyl is 119.
What is the Total Male Population of Lynndyl?
Total Male Population of Lynndyl is 64.
What is the Total Female Population of Lynndyl?
Total Female Population of Lynndyl is 55.
What is the Ratio of Males per 100 Females in Lynndyl?
There are 116.36 Males per 100 Females in Lynndyl.
What is the Ratio of Females per 100 Males in Lynndyl?
There are 85.94 Females per 100 Males in Lynndyl.
What is the Median Population Age in Lynndyl?
Median Population Age in Lynndyl is 26.4 Years.
What is the Average Family Size in Lynndyl
Average Family Size in Lynndyl is 3.7 People.
What is the Average Household Size in Lynndyl
Average Household Size in Lynndyl is 3.3 People.
How Large is the Labor Force in Lynndyl?
There are 25 People in the Labor Forcein in Lynndyl.
What is the Percentage of People in the Labor Force in Lynndyl?
38.5% of People are in the Labor Force in Lynndyl.