Nephi, UT Map & Demographics
Nephi Map
Nephi Overview
$33,958
PER CAPITA INCOME
$103,009
AVG FAMILY INCOME
$89,026
AVG HOUSEHOLD INCOME
40.6%
WAGE / INCOME GAP [ % ]
59.4¢/ $1
WAGE / INCOME GAP [ $ ]
0.38
INEQUALITY / GINI INDEX
6,507
TOTAL POPULATION
3,499
MALE POPULATION
3,008
FEMALE POPULATION
116.32
MALES / 100 FEMALES
85.97
FEMALES / 100 MALES
31.5
MEDIAN AGE
3.6
AVG FAMILY SIZE
3.1
AVG HOUSEHOLD SIZE
3,221
LABOR FORCE [ PEOPLE ]
68.9%
PERCENT IN LABOR FORCE
0.7%
UNEMPLOYMENT RATE
Nephi Zip Codes
Nephi Area Codes
Income in Nephi
Income Overview in Nephi
Per Capita Income in Nephi is $33,958, while median incomes of families and households are $103,009 and $89,026 respectively.
| Characteristic | Number | Measure |
| Per Capita Income | 6,507 | $33,958 |
| Median Family Income | 1,635 | $103,009 |
| Mean Family Income | 1,635 | $110,499 |
| Median Household Income | 2,040 | $89,026 |
| Mean Household Income | 2,040 | $98,086 |
| Income Deficit | 1,635 | $0 |
| Wage / Income Gap (%) | 6,507 | 40.62% |
| Wage / Income Gap ($) | 6,507 | 59.38¢ per $1 |
| Gini / Inequality Index | 6,507 | 0.38 |
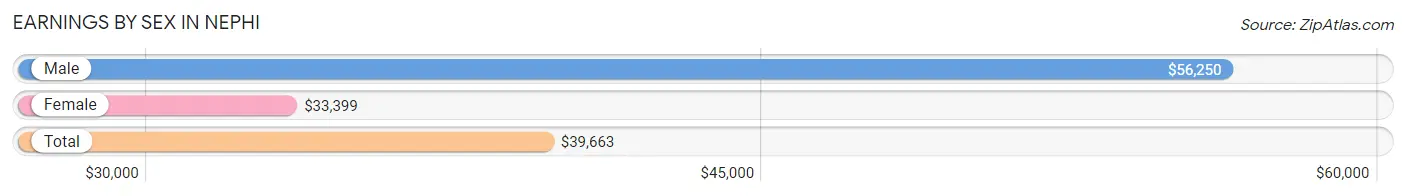
Earnings by Sex in Nephi
Average Earnings in Nephi are $39,663, $56,250 for men and $33,399 for women, a difference of 40.6%.
| Sex | Number | Average Earnings |
| Male | 1,847 (53.8%) | $56,250 |
| Female | 1,588 (46.2%) | $33,399 |
| Total | 3,435 (100.0%) | $39,663 |
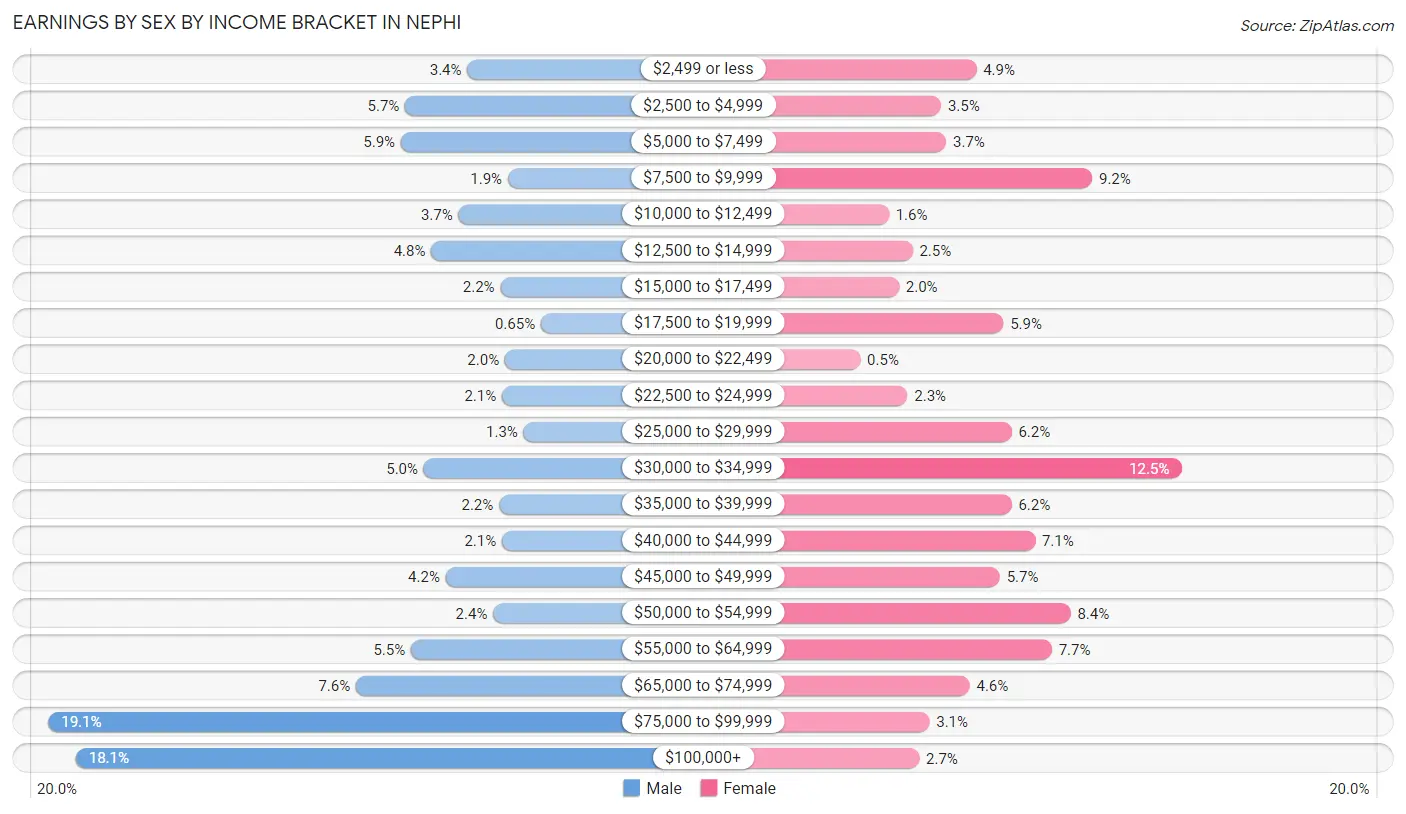
Earnings by Sex by Income Bracket in Nephi
The most common earnings brackets in Nephi are $75,000 to $99,999 for men (353 | 19.1%) and $30,000 to $34,999 for women (199 | 12.5%).
| Income | Male | Female |
| $2,499 or less | 63 (3.4%) | 77 (4.9%) |
| $2,500 to $4,999 | 106 (5.7%) | 56 (3.5%) |
| $5,000 to $7,499 | 109 (5.9%) | 59 (3.7%) |
| $7,500 to $9,999 | 35 (1.9%) | 146 (9.2%) |
| $10,000 to $12,499 | 69 (3.7%) | 25 (1.6%) |
| $12,500 to $14,999 | 88 (4.8%) | 39 (2.5%) |
| $15,000 to $17,499 | 40 (2.2%) | 31 (1.9%) |
| $17,500 to $19,999 | 12 (0.6%) | 93 (5.9%) |
| $20,000 to $22,499 | 37 (2.0%) | 8 (0.5%) |
| $22,500 to $24,999 | 39 (2.1%) | 36 (2.3%) |
| $25,000 to $29,999 | 24 (1.3%) | 98 (6.2%) |
| $30,000 to $34,999 | 93 (5.0%) | 199 (12.5%) |
| $35,000 to $39,999 | 41 (2.2%) | 98 (6.2%) |
| $40,000 to $44,999 | 39 (2.1%) | 112 (7.0%) |
| $45,000 to $49,999 | 78 (4.2%) | 91 (5.7%) |
| $50,000 to $54,999 | 45 (2.4%) | 133 (8.4%) |
| $55,000 to $64,999 | 102 (5.5%) | 122 (7.7%) |
| $65,000 to $74,999 | 140 (7.6%) | 73 (4.6%) |
| $75,000 to $99,999 | 353 (19.1%) | 49 (3.1%) |
| $100,000+ | 334 (18.1%) | 43 (2.7%) |
| Total | 1,847 (100.0%) | 1,588 (100.0%) |
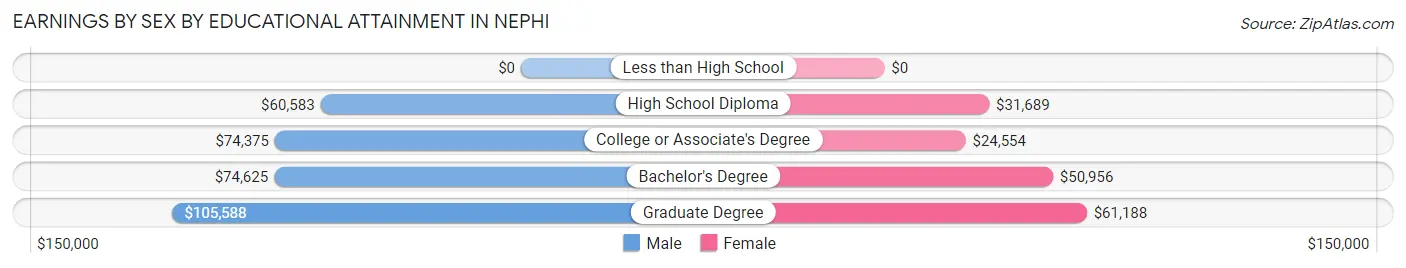
Earnings by Sex by Educational Attainment in Nephi
Average earnings in Nephi are $71,420 for men and $34,649 for women, a difference of 51.5%. Men with an educational attainment of graduate degree enjoy the highest average annual earnings of $105,588, while those with high school diploma education earn the least with $60,583. Women with an educational attainment of graduate degree earn the most with the average annual earnings of $61,188, while those with college or associate's degree education have the smallest earnings of $24,554.
| Educational Attainment | Male Income | Female Income |
| Less than High School | - | - |
| High School Diploma | $60,583 | $31,689 |
| College or Associate's Degree | $74,375 | $24,554 |
| Bachelor's Degree | $74,625 | $50,956 |
| Graduate Degree | $105,588 | $61,188 |
| Total | $71,420 | $34,649 |
Family Income in Nephi
Family Income Brackets in Nephi
According to the Nephi family income data, there are 495 families falling into the $100,000 to $149,999 income range, which is the most common income bracket and makes up 30.3% of all families. Conversely, the $15,000 to $24,999 income bracket is the least frequent group with only 21 families (1.3%) belonging to this category.
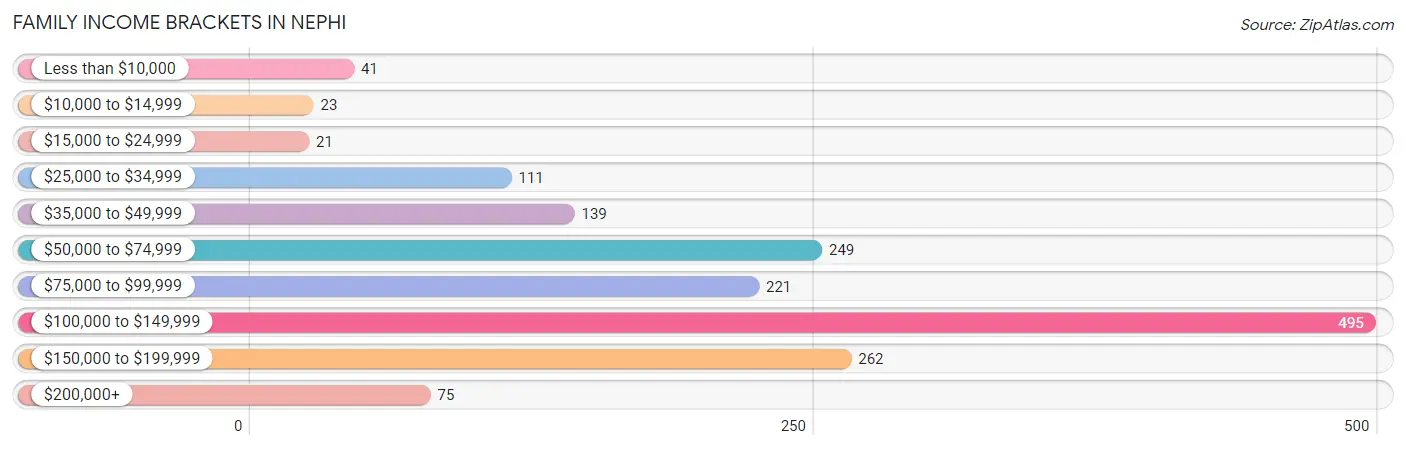
| Income Bracket | # Families | % Families |
| Less than $10,000 | 41 | 2.5% |
| $10,000 to $14,999 | 23 | 1.4% |
| $15,000 to $24,999 | 21 | 1.3% |
| $25,000 to $34,999 | 111 | 6.8% |
| $35,000 to $49,999 | 139 | 8.5% |
| $50,000 to $74,999 | 249 | 15.2% |
| $75,000 to $99,999 | 221 | 13.5% |
| $100,000 to $149,999 | 495 | 30.3% |
| $150,000 to $199,999 | 262 | 16.0% |
| $200,000+ | 75 | 4.6% |
Family Income by Famaliy Size in Nephi
7+ person families (70 | 4.3%) account for the highest median family income in Nephi with $175,784 per family, while 2-person families (608 | 37.2%) have the highest median income of $47,935 per family member.
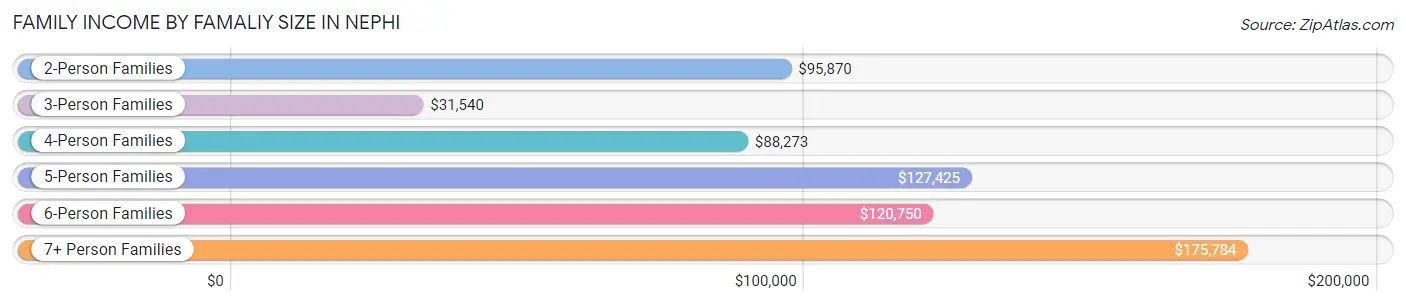
| Income Bracket | # Families | Median Income |
| 2-Person Families | 608 (37.2%) | $95,870 |
| 3-Person Families | 259 (15.8%) | $31,540 |
| 4-Person Families | 272 (16.6%) | $88,273 |
| 5-Person Families | 382 (23.4%) | $127,425 |
| 6-Person Families | 44 (2.7%) | $120,750 |
| 7+ Person Families | 70 (4.3%) | $175,784 |
| Total | 1,635 (100.0%) | $103,009 |
Family Income by Number of Earners in Nephi
The median family income in Nephi is $103,009, with families comprising 3+ earners (310) having the highest median family income of $150,625, while families with no earners (197) have the lowest median family income of $39,417, accounting for 19.0% and 12.0% of families, respectively.
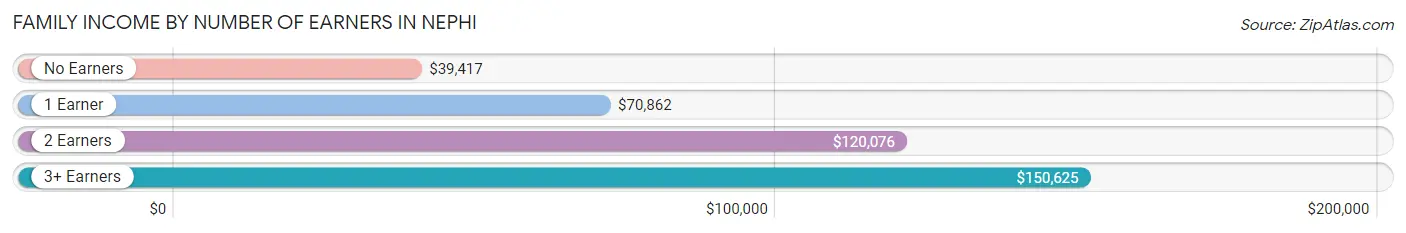
| Number of Earners | # Families | Median Income |
| No Earners | 197 (12.0%) | $39,417 |
| 1 Earner | 288 (17.6%) | $70,862 |
| 2 Earners | 840 (51.4%) | $120,076 |
| 3+ Earners | 310 (19.0%) | $150,625 |
| Total | 1,635 (100.0%) | $103,009 |
Household Income in Nephi
Household Income Brackets in Nephi
With 543 households falling in the category, the $100,000 to $149,999 income range is the most frequent in Nephi, accounting for 26.6% of all households. In contrast, only 39 households (1.9%) fall into the $10,000 to $14,999 income bracket, making it the least populous group.
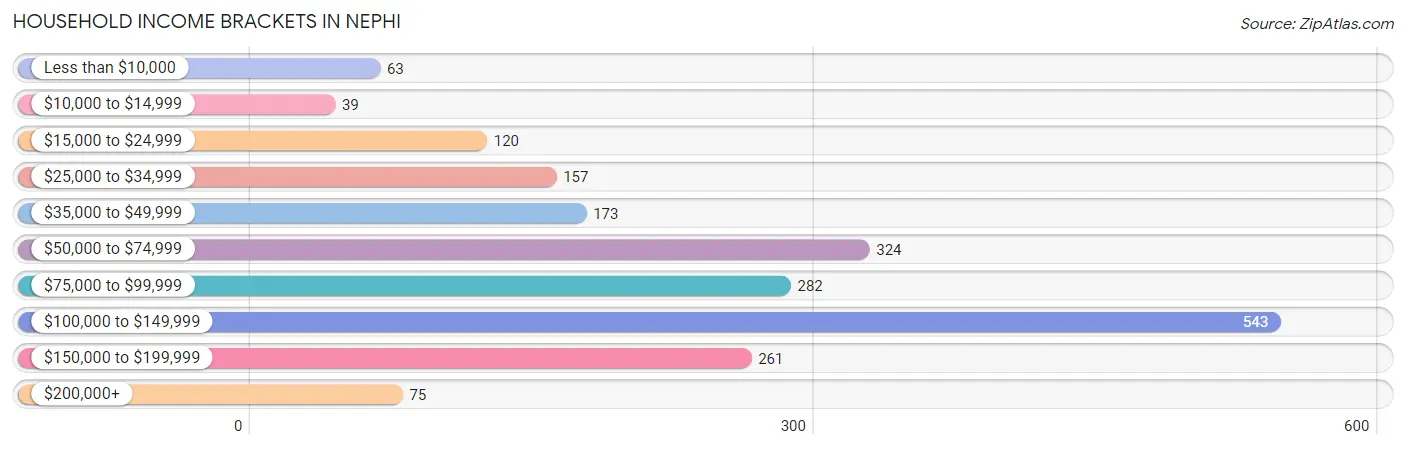
| Income Bracket | # Households | % Households |
| Less than $10,000 | 63 | 3.1% |
| $10,000 to $14,999 | 39 | 1.9% |
| $15,000 to $24,999 | 120 | 5.9% |
| $25,000 to $34,999 | 157 | 7.7% |
| $35,000 to $49,999 | 173 | 8.5% |
| $50,000 to $74,999 | 324 | 15.9% |
| $75,000 to $99,999 | 282 | 13.8% |
| $100,000 to $149,999 | 543 | 26.6% |
| $150,000 to $199,999 | 261 | 12.8% |
| $200,000+ | 75 | 3.7% |
Household Income by Householder Age in Nephi
The median household income in Nephi is $89,026, with the highest median household income of $123,065 found in the 45 to 64 years age bracket for the primary householder. A total of 641 households (31.4%) fall into this category. Meanwhile, the 15 to 24 years age bracket for the primary householder has the lowest median household income of $0, with 55 households (2.7%) in this group.
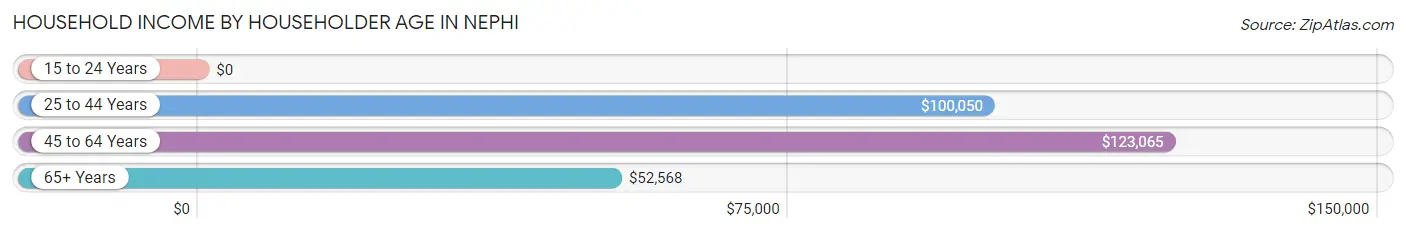
| Income Bracket | # Households | Median Income |
| 15 to 24 Years | 55 (2.7%) | $0 |
| 25 to 44 Years | 884 (43.3%) | $100,050 |
| 45 to 64 Years | 641 (31.4%) | $123,065 |
| 65+ Years | 460 (22.6%) | $52,568 |
| Total | 2,040 (100.0%) | $89,026 |
Poverty in Nephi
Income Below Poverty by Sex and Age in Nephi
With 5.2% poverty level for males and 6.4% for females among the residents of Nephi, under 5 year old males and 65 to 74 year old females are the most vulnerable to poverty, with 30 males (14.9%) and 39 females (17.8%) in their respective age groups living below the poverty level.
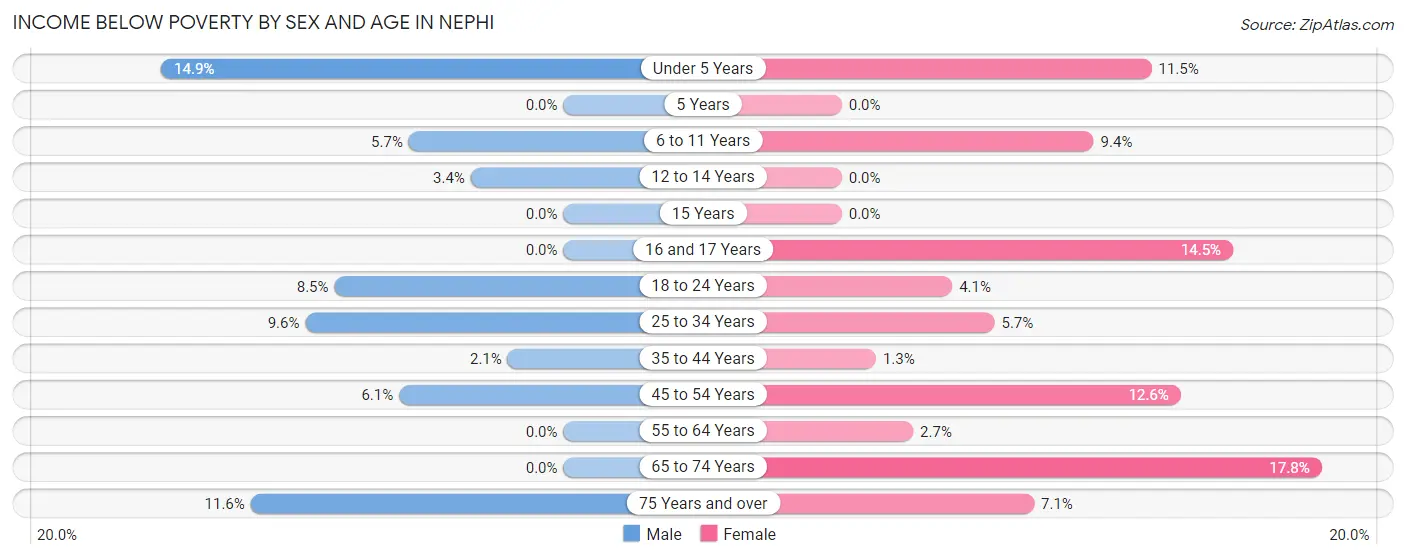
| Age Bracket | Male | Female |
| Under 5 Years | 30 (14.9%) | 23 (11.5%) |
| 5 Years | 0 (0.0%) | 0 (0.0%) |
| 6 to 11 Years | 23 (5.7%) | 23 (9.3%) |
| 12 to 14 Years | 9 (3.4%) | 0 (0.0%) |
| 15 Years | 0 (0.0%) | 0 (0.0%) |
| 16 and 17 Years | 0 (0.0%) | 9 (14.5%) |
| 18 to 24 Years | 26 (8.5%) | 11 (4.1%) |
| 25 to 34 Years | 41 (9.6%) | 23 (5.7%) |
| 35 to 44 Years | 11 (2.1%) | 6 (1.3%) |
| 45 to 54 Years | 25 (6.1%) | 40 (12.6%) |
| 55 to 64 Years | 0 (0.0%) | 7 (2.6%) |
| 65 to 74 Years | 0 (0.0%) | 39 (17.8%) |
| 75 Years and over | 13 (11.6%) | 11 (7.1%) |
| Total | 178 (5.2%) | 192 (6.4%) |
Income Above Poverty by Sex and Age in Nephi
According to the poverty statistics in Nephi, males aged 5 years and females aged 5 years are the age groups that are most secure financially, with 100.0% of males and 100.0% of females in these age groups living above the poverty line.
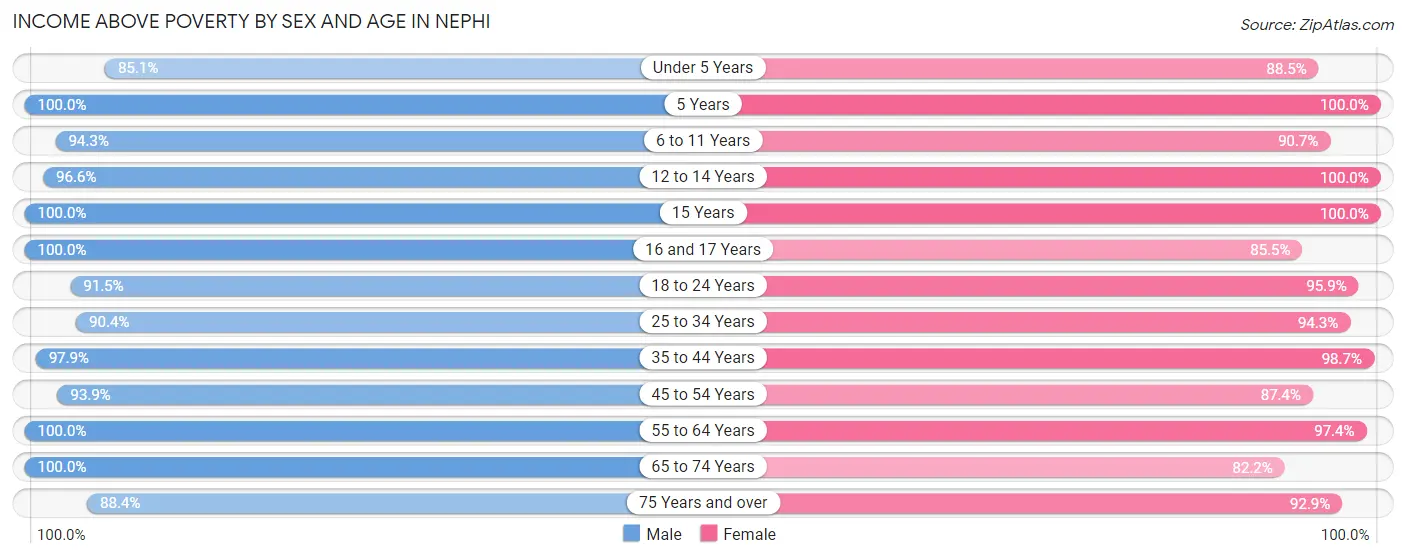
| Age Bracket | Male | Female |
| Under 5 Years | 171 (85.1%) | 177 (88.5%) |
| 5 Years | 45 (100.0%) | 32 (100.0%) |
| 6 to 11 Years | 378 (94.3%) | 223 (90.6%) |
| 12 to 14 Years | 253 (96.6%) | 275 (100.0%) |
| 15 Years | 64 (100.0%) | 76 (100.0%) |
| 16 and 17 Years | 181 (100.0%) | 53 (85.5%) |
| 18 to 24 Years | 280 (91.5%) | 257 (95.9%) |
| 25 to 34 Years | 387 (90.4%) | 383 (94.3%) |
| 35 to 44 Years | 521 (97.9%) | 468 (98.7%) |
| 45 to 54 Years | 385 (93.9%) | 278 (87.4%) |
| 55 to 64 Years | 271 (100.0%) | 257 (97.4%) |
| 65 to 74 Years | 183 (100.0%) | 180 (82.2%) |
| 75 Years and over | 99 (88.4%) | 143 (92.9%) |
| Total | 3,218 (94.8%) | 2,802 (93.6%) |
Income Below Poverty Among Married-Couple Families in Nephi
The poverty statistics for married-couple families in Nephi show that 1.1% or 14 of the total 1,324 families live below the poverty line. Families with 1 or 2 children have the highest poverty rate of 3.4%, comprising of 14 families. On the other hand, families with no children have the lowest poverty rate of 0.0%, which includes 0 families.
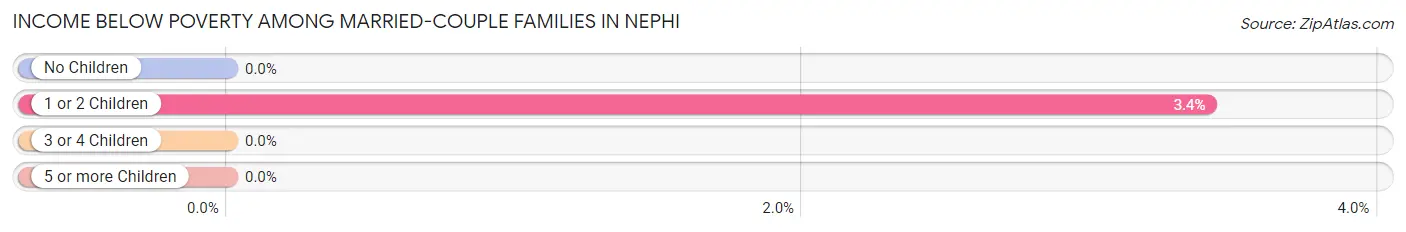
| Children | Above Poverty | Below Poverty |
| No Children | 592 (100.0%) | 0 (0.0%) |
| 1 or 2 Children | 396 (96.6%) | 14 (3.4%) |
| 3 or 4 Children | 260 (100.0%) | 0 (0.0%) |
| 5 or more Children | 62 (100.0%) | 0 (0.0%) |
| Total | 1,310 (98.9%) | 14 (1.1%) |
Income Below Poverty Among Single-Parent Households in Nephi
According to the poverty data in Nephi, 16.0% or 30 single-father households and 27.6% or 34 single-mother households are living below the poverty line. Among single-father households, those with 1 or 2 children have the highest poverty rate, with 30 households (83.3%) experiencing poverty. Likewise, among single-mother households, those with 1 or 2 children have the highest poverty rate, with 34 households (37.0%) falling below the poverty line.
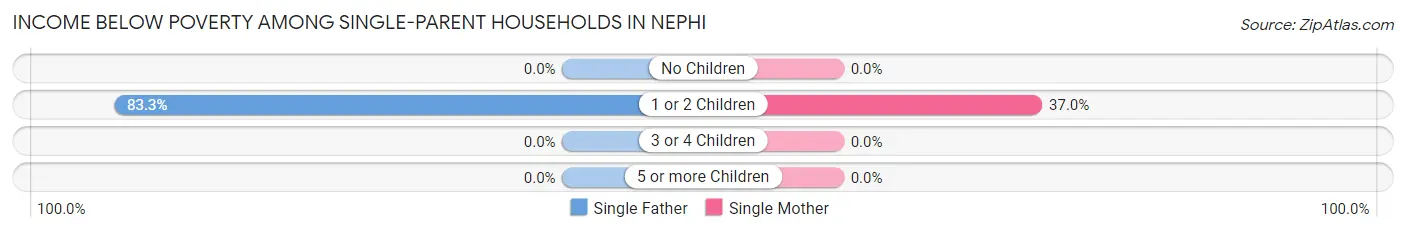
| Children | Single Father | Single Mother |
| No Children | 0 (0.0%) | 0 (0.0%) |
| 1 or 2 Children | 30 (83.3%) | 34 (37.0%) |
| 3 or 4 Children | 0 (0.0%) | 0 (0.0%) |
| 5 or more Children | 0 (0.0%) | 0 (0.0%) |
| Total | 30 (16.0%) | 34 (27.6%) |
Income Below Poverty Among Married-Couple vs Single-Parent Households in Nephi
The poverty data for Nephi shows that 14 of the married-couple family households (1.1%) and 64 of the single-parent households (20.6%) are living below the poverty level. Within the married-couple family households, those with 1 or 2 children have the highest poverty rate, with 14 households (3.4%) falling below the poverty line. Among the single-parent households, those with 1 or 2 children have the highest poverty rate, with 64 household (50.0%) living below poverty.
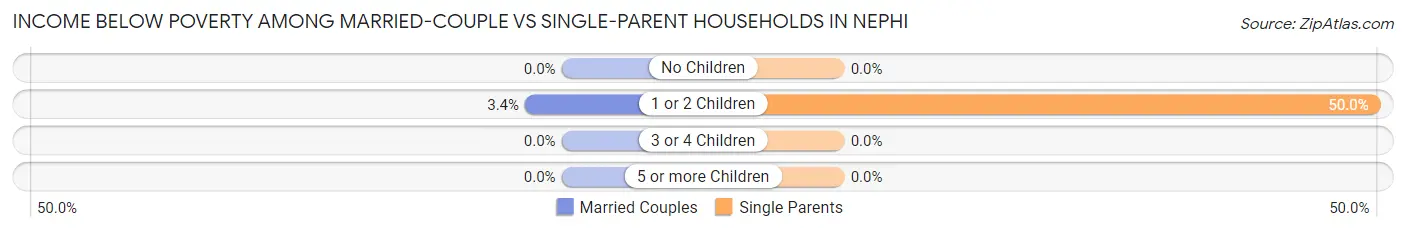
| Children | Married-Couple Families | Single-Parent Households |
| No Children | 0 (0.0%) | 0 (0.0%) |
| 1 or 2 Children | 14 (3.4%) | 64 (50.0%) |
| 3 or 4 Children | 0 (0.0%) | 0 (0.0%) |
| 5 or more Children | 0 (0.0%) | 0 (0.0%) |
| Total | 14 (1.1%) | 64 (20.6%) |
Race in Nephi
The most populous races in Nephi are White / Caucasian (5,982 | 91.9%), Hispanic or Latino (373 | 5.7%), and Two or more Races (322 | 5.0%).
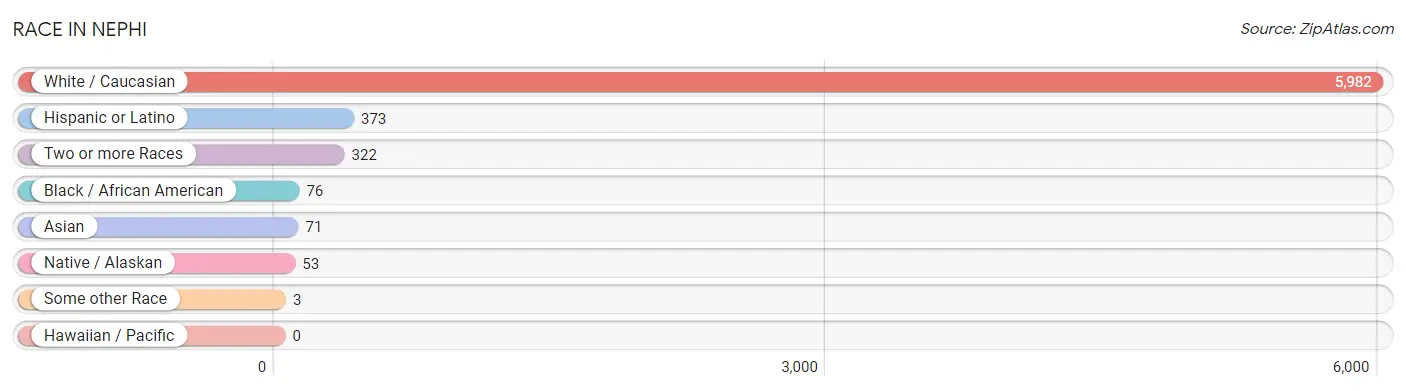
| Race | # Population | % Population |
| Asian | 71 | 1.1% |
| Black / African American | 76 | 1.2% |
| Hawaiian / Pacific | 0 | 0.0% |
| Hispanic or Latino | 373 | 5.7% |
| Native / Alaskan | 53 | 0.8% |
| White / Caucasian | 5,982 | 91.9% |
| Two or more Races | 322 | 5.0% |
| Some other Race | 3 | 0.1% |
| Total | 6,507 | 100.0% |
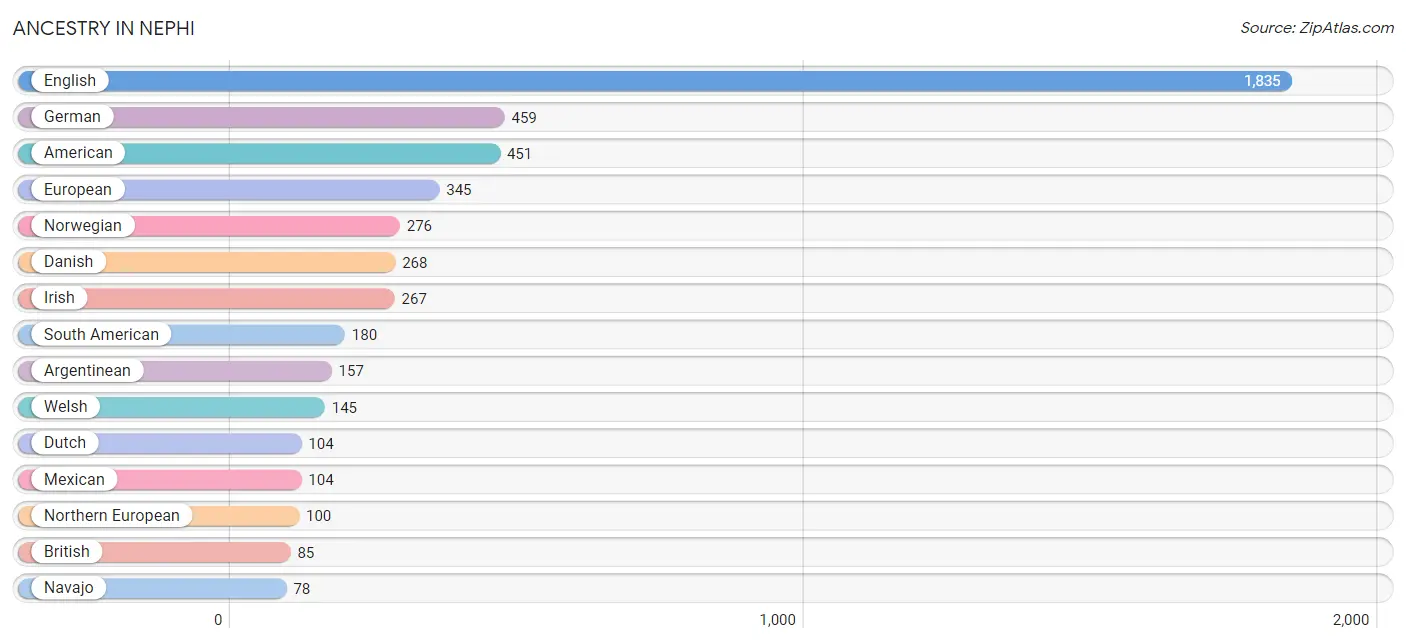
Ancestry in Nephi
The most populous ancestries reported in Nephi are English (1,835 | 28.2%), German (459 | 7.0%), American (451 | 6.9%), European (345 | 5.3%), and Norwegian (276 | 4.2%), together accounting for 51.7% of all Nephi residents.
| Ancestry | # Population | % Population |
| American | 451 | 6.9% |
| Argentinean | 157 | 2.4% |
| Bhutanese | 75 | 1.1% |
| British | 85 | 1.3% |
| Canadian | 18 | 0.3% |
| Danish | 268 | 4.1% |
| Dutch | 104 | 1.6% |
| Ecuadorian | 23 | 0.4% |
| English | 1,835 | 28.2% |
| European | 345 | 5.3% |
| French | 35 | 0.5% |
| German | 459 | 7.0% |
| Greek | 58 | 0.9% |
| Icelander | 11 | 0.2% |
| Irish | 267 | 4.1% |
| Italian | 76 | 1.2% |
| Korean | 71 | 1.1% |
| Mexican | 104 | 1.6% |
| Mexican American Indian | 62 | 0.9% |
| Navajo | 78 | 1.2% |
| Northern European | 100 | 1.5% |
| Norwegian | 276 | 4.2% |
| Polish | 14 | 0.2% |
| Scandinavian | 76 | 1.2% |
| Scotch-Irish | 46 | 0.7% |
| Scottish | 57 | 0.9% |
| South American | 180 | 2.8% |
| Spaniard | 47 | 0.7% |
| Spanish | 34 | 0.5% |
| Spanish American Indian | 7 | 0.1% |
| Swedish | 69 | 1.1% |
| Swiss | 38 | 0.6% |
| Ute | 3 | 0.1% |
| Welsh | 145 | 2.2% | View All 34 Rows |
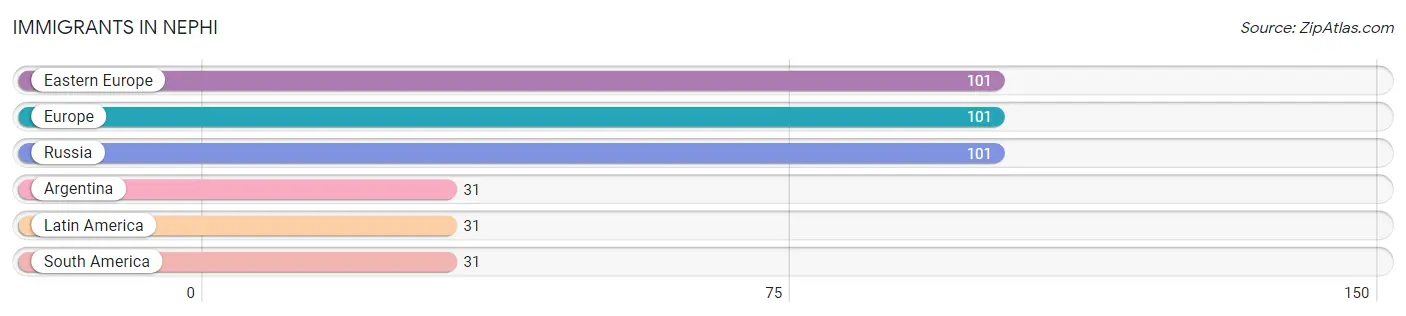
Immigrants in Nephi
The most numerous immigrant groups reported in Nephi came from Eastern Europe (101 | 1.5%), Europe (101 | 1.5%), Russia (101 | 1.5%), Argentina (31 | 0.5%), and Latin America (31 | 0.5%), together accounting for 5.6% of all Nephi residents.
| Immigration Origin | # Population | % Population |
| Argentina | 31 | 0.5% |
| Eastern Europe | 101 | 1.5% |
| Europe | 101 | 1.5% |
| Latin America | 31 | 0.5% |
| Russia | 101 | 1.5% |
| South America | 31 | 0.5% | View All 6 Rows |
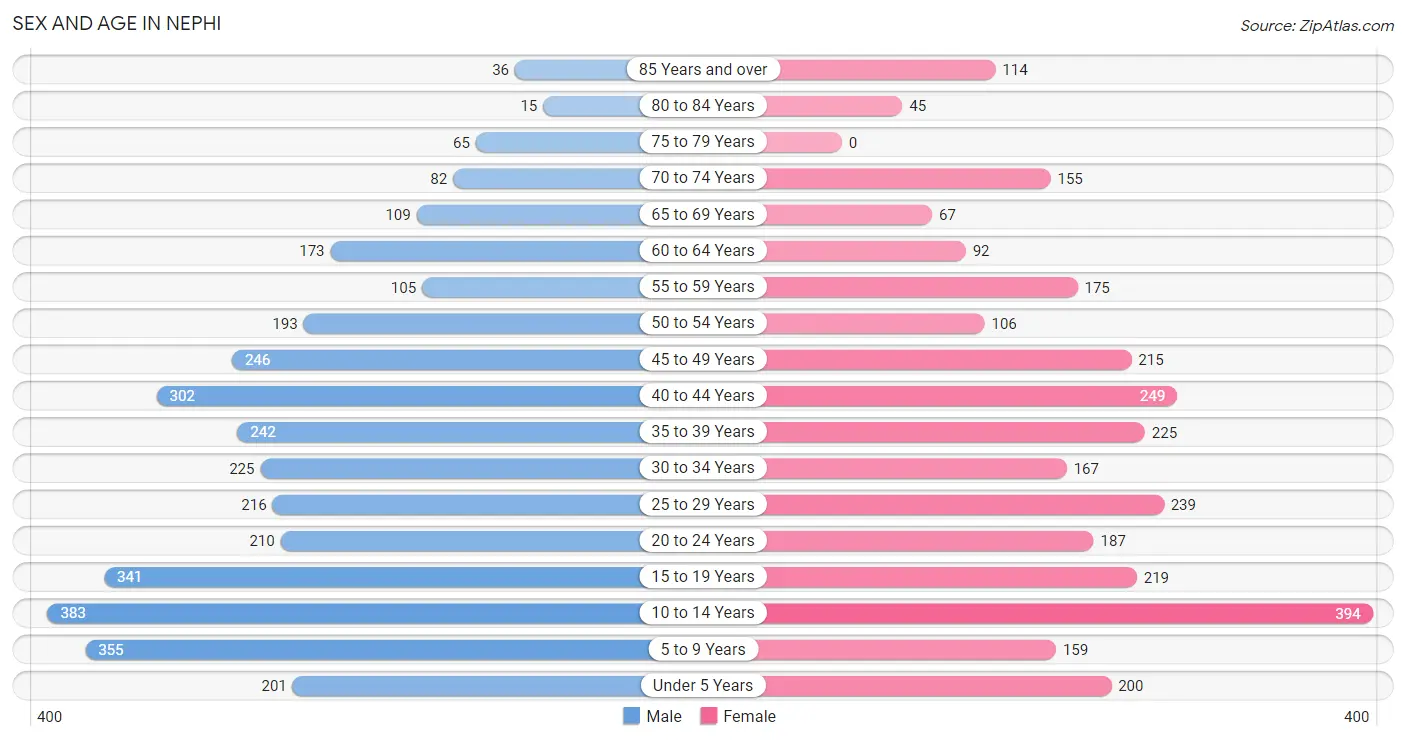
Sex and Age in Nephi
Sex and Age in Nephi
The most populous age groups in Nephi are 10 to 14 Years (383 | 11.0%) for men and 10 to 14 Years (394 | 13.1%) for women.
| Age Bracket | Male | Female |
| Under 5 Years | 201 (5.7%) | 200 (6.7%) |
| 5 to 9 Years | 355 (10.2%) | 159 (5.3%) |
| 10 to 14 Years | 383 (11.0%) | 394 (13.1%) |
| 15 to 19 Years | 341 (9.8%) | 219 (7.3%) |
| 20 to 24 Years | 210 (6.0%) | 187 (6.2%) |
| 25 to 29 Years | 216 (6.2%) | 239 (8.0%) |
| 30 to 34 Years | 225 (6.4%) | 167 (5.6%) |
| 35 to 39 Years | 242 (6.9%) | 225 (7.5%) |
| 40 to 44 Years | 302 (8.6%) | 249 (8.3%) |
| 45 to 49 Years | 246 (7.0%) | 215 (7.1%) |
| 50 to 54 Years | 193 (5.5%) | 106 (3.5%) |
| 55 to 59 Years | 105 (3.0%) | 175 (5.8%) |
| 60 to 64 Years | 173 (4.9%) | 92 (3.1%) |
| 65 to 69 Years | 109 (3.1%) | 67 (2.2%) |
| 70 to 74 Years | 82 (2.3%) | 155 (5.1%) |
| 75 to 79 Years | 65 (1.9%) | 0 (0.0%) |
| 80 to 84 Years | 15 (0.4%) | 45 (1.5%) |
| 85 Years and over | 36 (1.0%) | 114 (3.8%) |
| Total | 3,499 (100.0%) | 3,008 (100.0%) |
Families and Households in Nephi
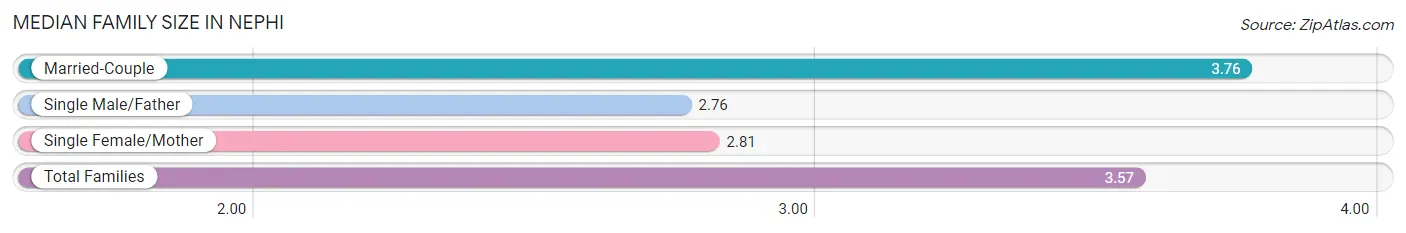
Median Family Size in Nephi
The median family size in Nephi is 3.57 persons per family, with married-couple families (1,324 | 81.0%) accounting for the largest median family size of 3.76 persons per family. On the other hand, single male/father families (188 | 11.5%) represent the smallest median family size with 2.76 persons per family.
| Family Type | # Families | Family Size |
| Married-Couple | 1,324 (81.0%) | 3.76 |
| Single Male/Father | 188 (11.5%) | 2.76 |
| Single Female/Mother | 123 (7.5%) | 2.81 |
| Total Families | 1,635 (100.0%) | 3.57 |
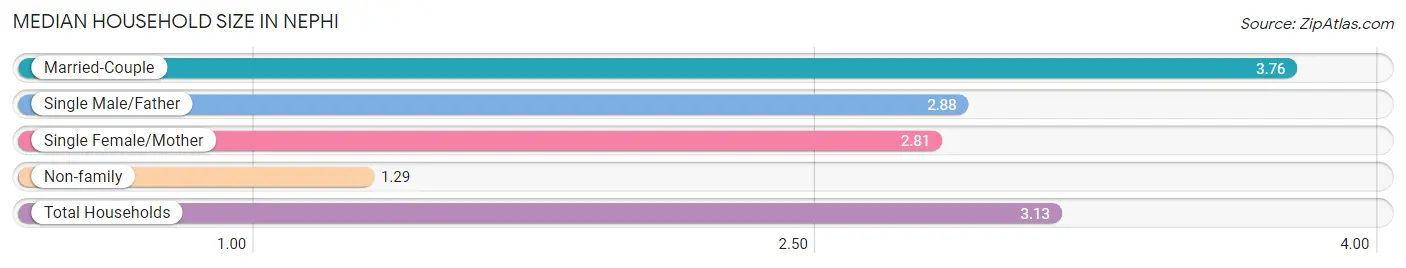
Median Household Size in Nephi
The median household size in Nephi is 3.13 persons per household, with married-couple households (1,324 | 64.9%) accounting for the largest median household size of 3.76 persons per household. non-family households (405 | 19.9%) represent the smallest median household size with 1.29 persons per household.
| Household Type | # Households | Household Size |
| Married-Couple | 1,324 (64.9%) | 3.76 |
| Single Male/Father | 188 (9.2%) | 2.88 |
| Single Female/Mother | 123 (6.0%) | 2.81 |
| Non-family | 405 (19.9%) | 1.29 |
| Total Households | 2,040 (100.0%) | 3.13 |
Household Size by Marriage Status in Nephi
Out of a total of 2,040 households in Nephi, 1,635 (80.1%) are family households, while 405 (19.9%) are nonfamily households. The most numerous type of family households are 2-person households, comprising 608, and the most common type of nonfamily households are 1-person households, comprising 327.
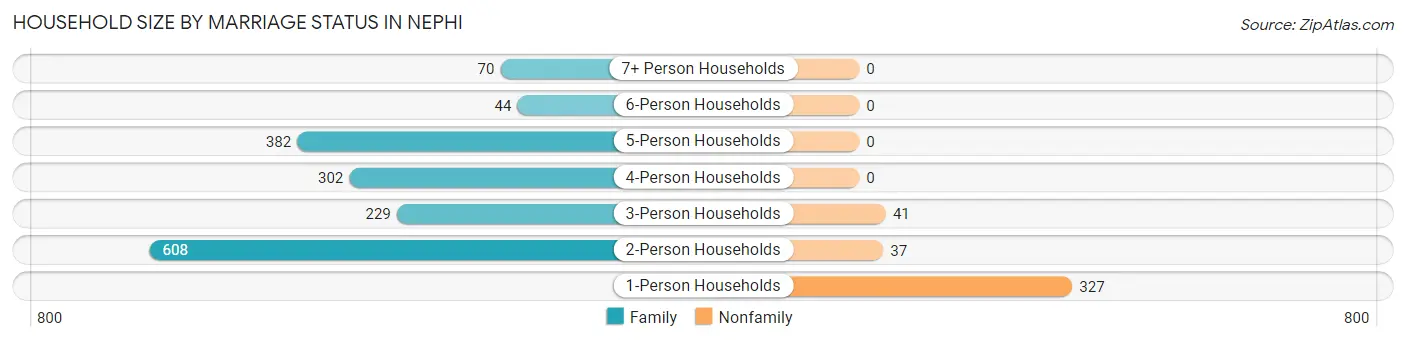
| Household Size | Family Households | Nonfamily Households |
| 1-Person Households | - | 327 (16.0%) |
| 2-Person Households | 608 (29.8%) | 37 (1.8%) |
| 3-Person Households | 229 (11.2%) | 41 (2.0%) |
| 4-Person Households | 302 (14.8%) | 0 (0.0%) |
| 5-Person Households | 382 (18.7%) | 0 (0.0%) |
| 6-Person Households | 44 (2.2%) | 0 (0.0%) |
| 7+ Person Households | 70 (3.4%) | 0 (0.0%) |
| Total | 1,635 (80.1%) | 405 (19.9%) |
Female Fertility in Nephi
Fertility by Age in Nephi
Average fertility rate in Nephi is 38.0 births per 1,000 women. Women in the age bracket of 20 to 34 years have the highest fertility rate with 96.0 births per 1,000 women. Women in the age bracket of 20 to 34 years acount for 100.0% of all women with births.
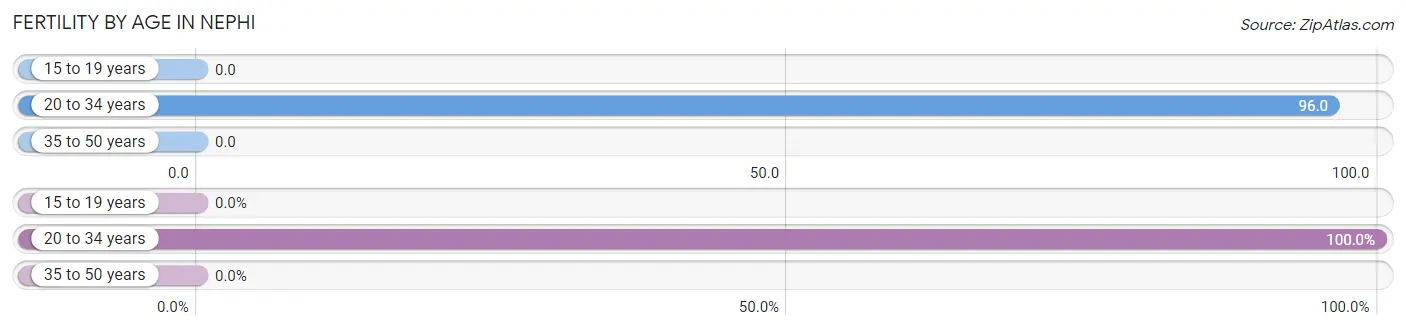
| Age Bracket | Women with Births | Births / 1,000 Women |
| 15 to 19 years | 0 (0.0%) | 0.0 |
| 20 to 34 years | 57 (100.0%) | 96.0 |
| 35 to 50 years | 0 (0.0%) | 0.0 |
| Total | 57 (100.0%) | 38.0 |
Fertility by Age by Marriage Status in Nephi
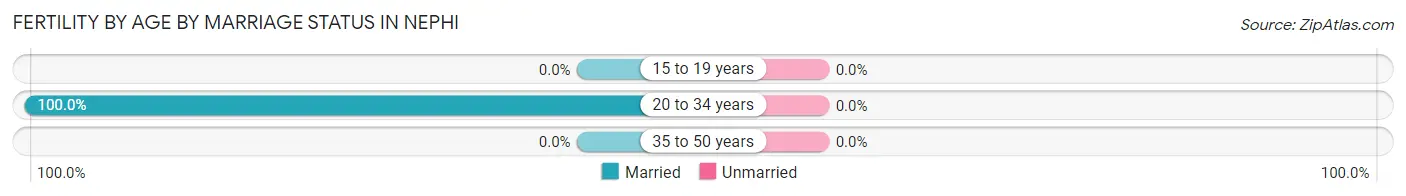
| Age Bracket | Married | Unmarried |
| 15 to 19 years | 0 (0.0%) | 0 (0.0%) |
| 20 to 34 years | 57 (100.0%) | 0 (0.0%) |
| 35 to 50 years | 0 (0.0%) | 0 (0.0%) |
| Total | 57 (100.0%) | 0 (0.0%) |
Fertility by Education in Nephi
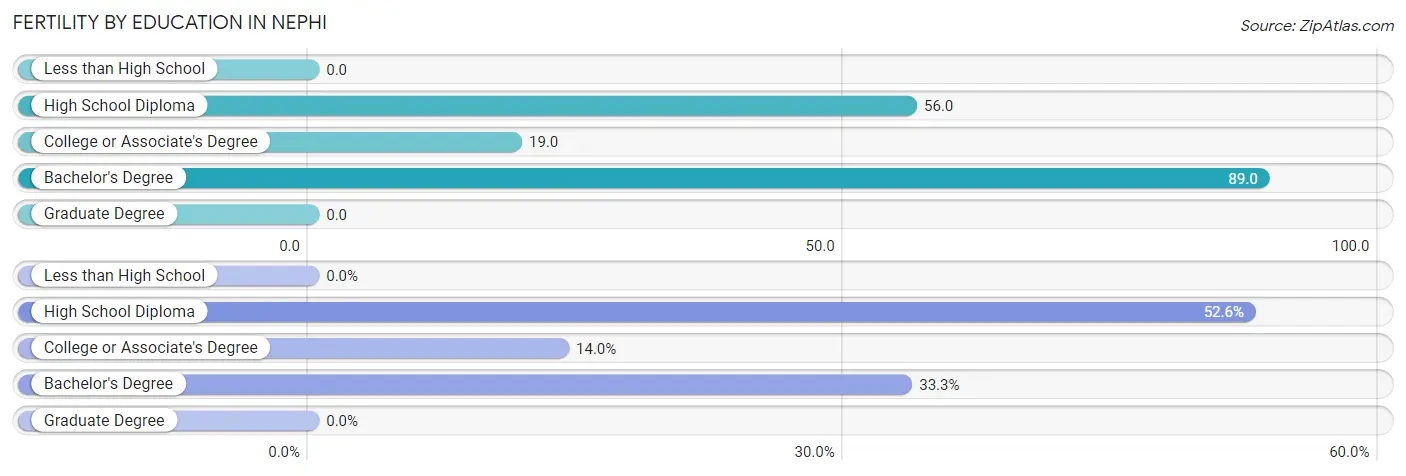
| Educational Attainment | Women with Births | Births / 1,000 Women |
| Less than High School | 0 (0.0%) | 0.0 |
| High School Diploma | 30 (52.6%) | 56.0 |
| College or Associate's Degree | 8 (14.0%) | 19.0 |
| Bachelor's Degree | 19 (33.3%) | 89.0 |
| Graduate Degree | 0 (0.0%) | 0.0 |
| Total | 57 (100.0%) | 38.0 |
Fertility by Education by Marriage Status in Nephi
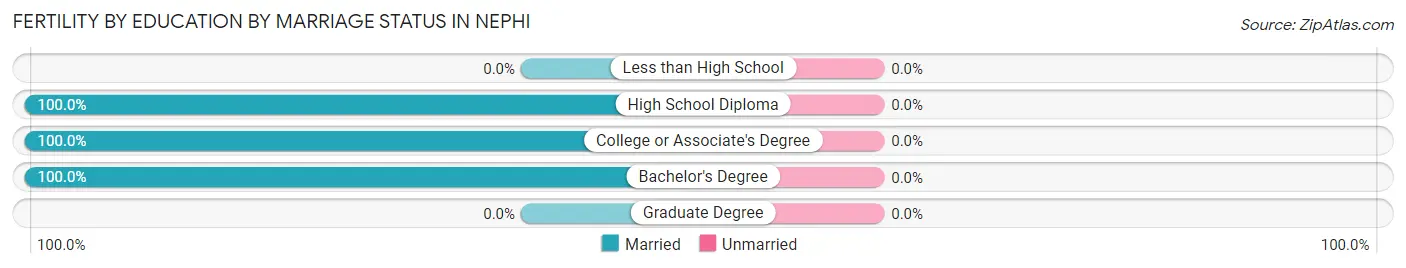
| Educational Attainment | Married | Unmarried |
| Less than High School | 0 (0.0%) | 0 (0.0%) |
| High School Diploma | 30 (100.0%) | 0 (0.0%) |
| College or Associate's Degree | 8 (100.0%) | 0 (0.0%) |
| Bachelor's Degree | 19 (100.0%) | 0 (0.0%) |
| Graduate Degree | 0 (0.0%) | 0 (0.0%) |
| Total | 57 (100.0%) | 0 (0.0%) |
Employment Characteristics in Nephi
Employment by Class of Employer in Nephi
Among the 3,142 employed individuals in Nephi, private company employees (2,096 | 66.7%), local government employees (300 | 9.6%), and not-for-profit organizations (260 | 8.3%) make up the most common classes of employment.
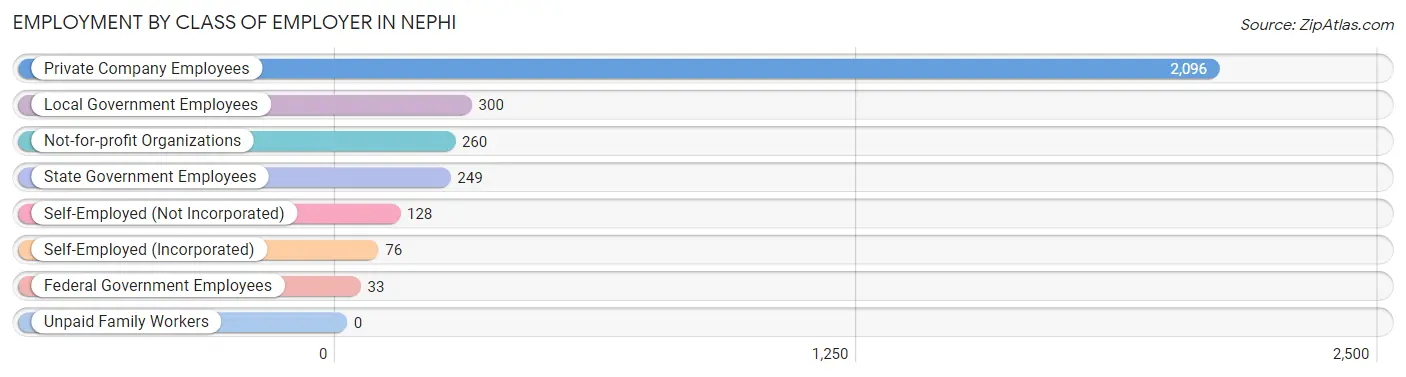
| Employer Class | # Employees | % Employees |
| Private Company Employees | 2,096 | 66.7% |
| Self-Employed (Incorporated) | 76 | 2.4% |
| Self-Employed (Not Incorporated) | 128 | 4.1% |
| Not-for-profit Organizations | 260 | 8.3% |
| Local Government Employees | 300 | 9.6% |
| State Government Employees | 249 | 7.9% |
| Federal Government Employees | 33 | 1.1% |
| Unpaid Family Workers | 0 | 0.0% |
| Total | 3,142 | 100.0% |
Employment Status by Age in Nephi
According to the labor force statistics for Nephi, out of the total population over 16 years of age (4,675), 68.9% or 3,221 individuals are in the labor force, with 0.7% or 23 of them unemployed. The age group with the highest labor force participation rate is 20 to 24 years, with 91.2% or 362 individuals in the labor force. Within the labor force, the 16 to 19 years age range has the highest percentage of unemployed individuals, with 3.8% or 13 of them being unemployed.
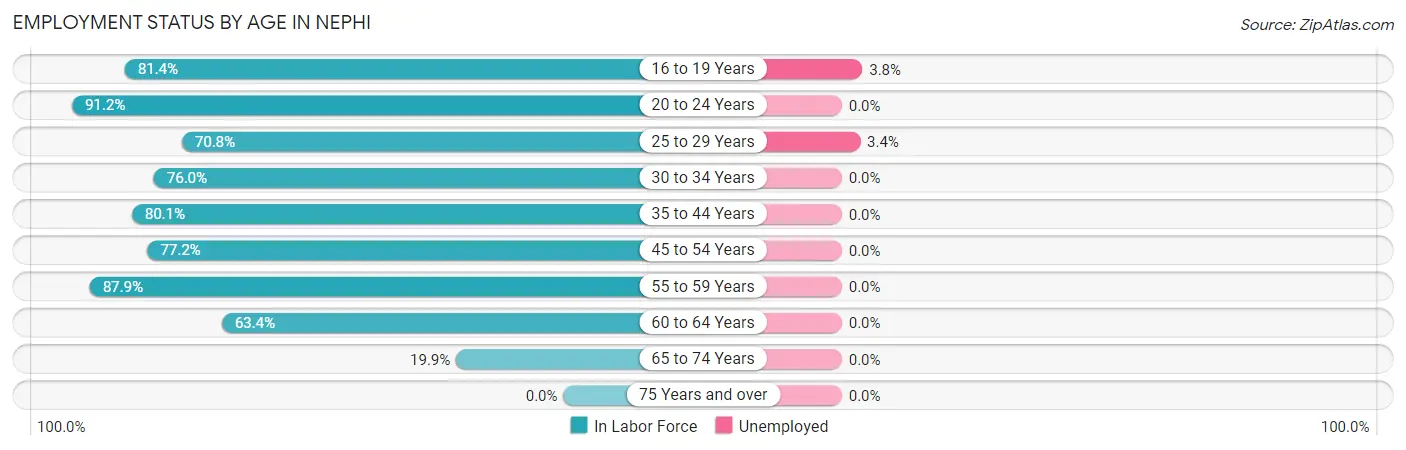
| Age Bracket | In Labor Force | Unemployed |
| 16 to 19 Years | 342 (81.4%) | 13 (3.8%) |
| 20 to 24 Years | 362 (91.2%) | 0 (0.0%) |
| 25 to 29 Years | 322 (70.8%) | 11 (3.4%) |
| 30 to 34 Years | 298 (76.0%) | 0 (0.0%) |
| 35 to 44 Years | 815 (80.1%) | 0 (0.0%) |
| 45 to 54 Years | 587 (77.2%) | 0 (0.0%) |
| 55 to 59 Years | 246 (87.9%) | 0 (0.0%) |
| 60 to 64 Years | 168 (63.4%) | 0 (0.0%) |
| 65 to 74 Years | 82 (19.9%) | 0 (0.0%) |
| 75 Years and over | 0 (0.0%) | 0 (0.0%) |
| Total | 3,221 (68.9%) | 23 (0.7%) |
Employment Status by Educational Attainment in Nephi
According to labor force statistics for Nephi, 76.8% of individuals (2,435) out of the total population between 25 and 64 years of age (3,170) are in the labor force, with 0.5% or 12 of them being unemployed. The group with the highest labor force participation rate are those with the educational attainment of bachelor's degree or higher, with 88.9% or 658 individuals in the labor force. Within the labor force, individuals with college / associate degree education have the highest percentage of unemployment, with 1.1% or 11 of them being unemployed.
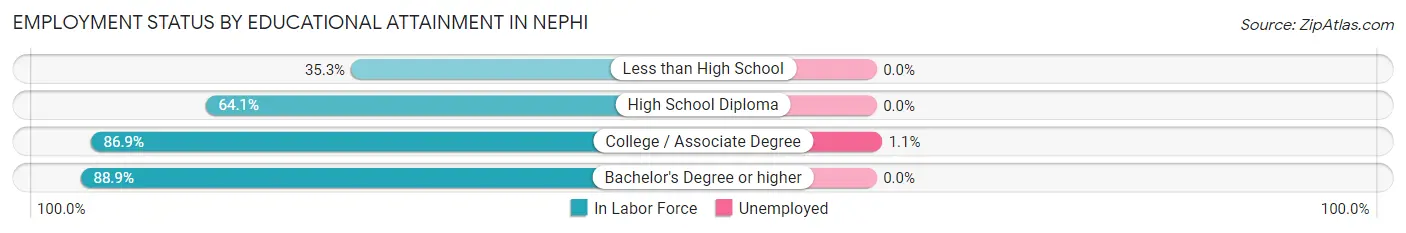
| Educational Attainment | In Labor Force | Unemployed |
| Less than High School | 54 (35.3%) | 0 (0.0%) |
| High School Diploma | 718 (64.1%) | 0 (0.0%) |
| College / Associate Degree | 1,005 (86.9%) | 13 (1.1%) |
| Bachelor's Degree or higher | 658 (88.9%) | 0 (0.0%) |
| Total | 2,435 (76.8%) | 16 (0.5%) |
Employment Occupations by Sex in Nephi
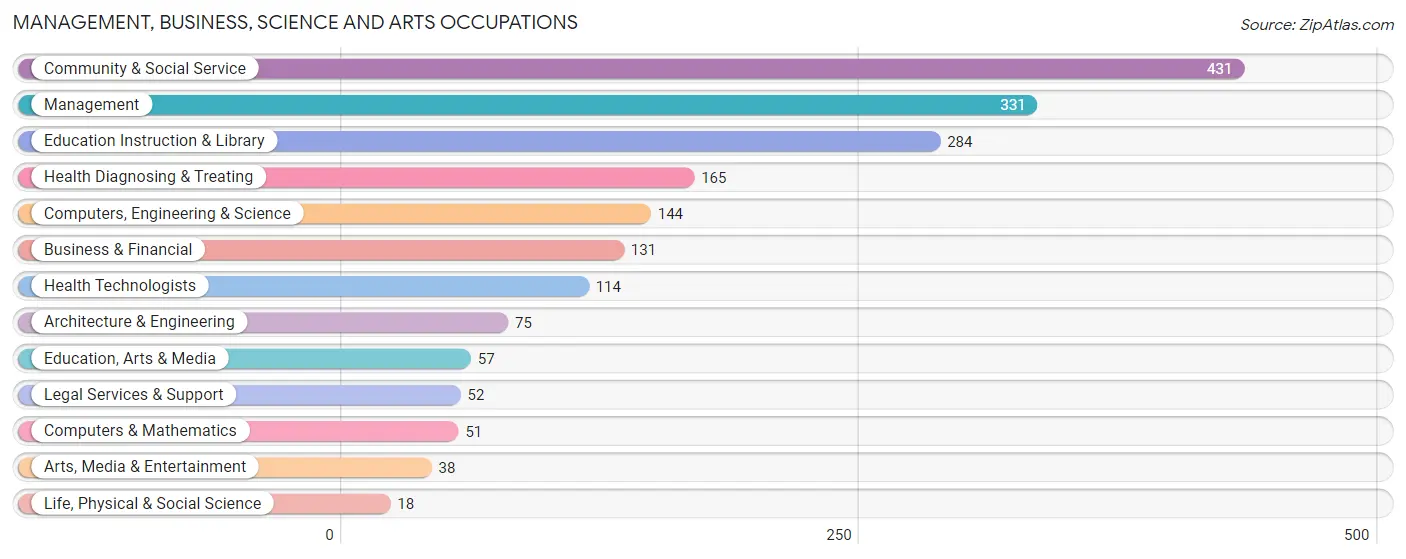
Management, Business, Science and Arts Occupations
The most common Management, Business, Science and Arts occupations in Nephi are Community & Social Service (431 | 13.5%), Management (331 | 10.3%), Education Instruction & Library (284 | 8.9%), Health Diagnosing & Treating (165 | 5.2%), and Computers, Engineering & Science (144 | 4.5%).
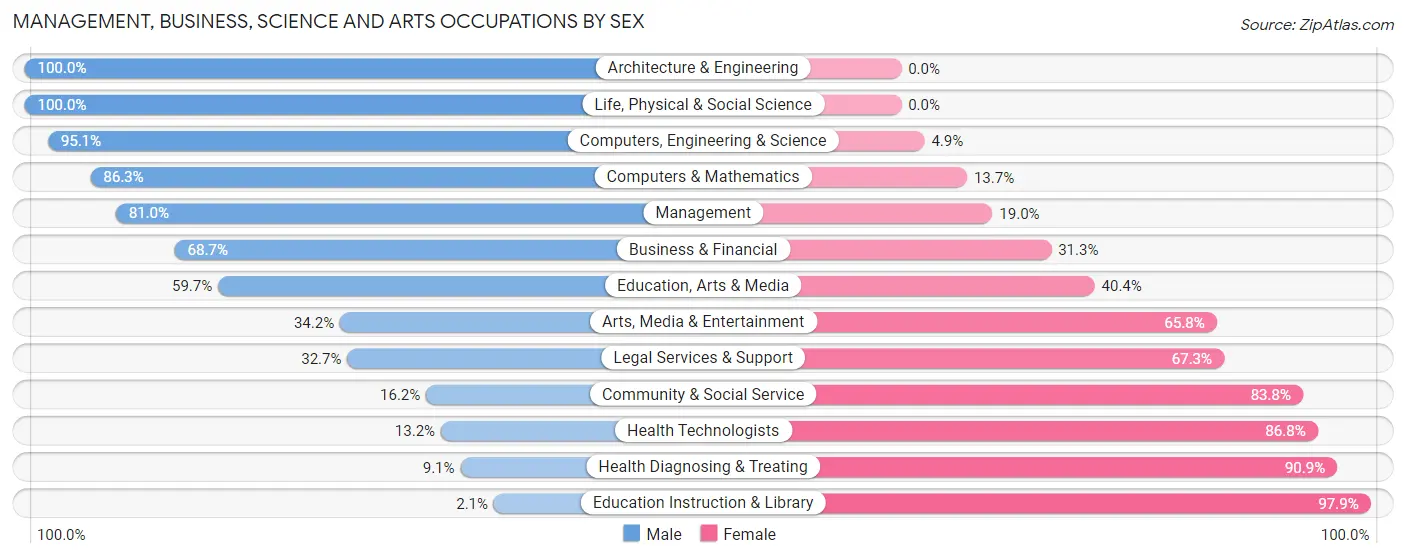
Management, Business, Science and Arts Occupations by Sex
Within the Management, Business, Science and Arts occupations in Nephi, the most male-oriented occupations are Architecture & Engineering (100.0%), Life, Physical & Social Science (100.0%), and Computers, Engineering & Science (95.1%), while the most female-oriented occupations are Education Instruction & Library (97.9%), Health Diagnosing & Treating (90.9%), and Health Technologists (86.8%).
| Occupation | Male | Female |
| Management | 268 (81.0%) | 63 (19.0%) |
| Business & Financial | 90 (68.7%) | 41 (31.3%) |
| Computers, Engineering & Science | 137 (95.1%) | 7 (4.9%) |
| Computers & Mathematics | 44 (86.3%) | 7 (13.7%) |
| Architecture & Engineering | 75 (100.0%) | 0 (0.0%) |
| Life, Physical & Social Science | 18 (100.0%) | 0 (0.0%) |
| Community & Social Service | 70 (16.2%) | 361 (83.8%) |
| Education, Arts & Media | 34 (59.7%) | 23 (40.4%) |
| Legal Services & Support | 17 (32.7%) | 35 (67.3%) |
| Education Instruction & Library | 6 (2.1%) | 278 (97.9%) |
| Arts, Media & Entertainment | 13 (34.2%) | 25 (65.8%) |
| Health Diagnosing & Treating | 15 (9.1%) | 150 (90.9%) |
| Health Technologists | 15 (13.2%) | 99 (86.8%) |
| Total (Category) | 580 (48.2%) | 622 (51.7%) |
| Total (Overall) | 1,739 (54.4%) | 1,459 (45.6%) |
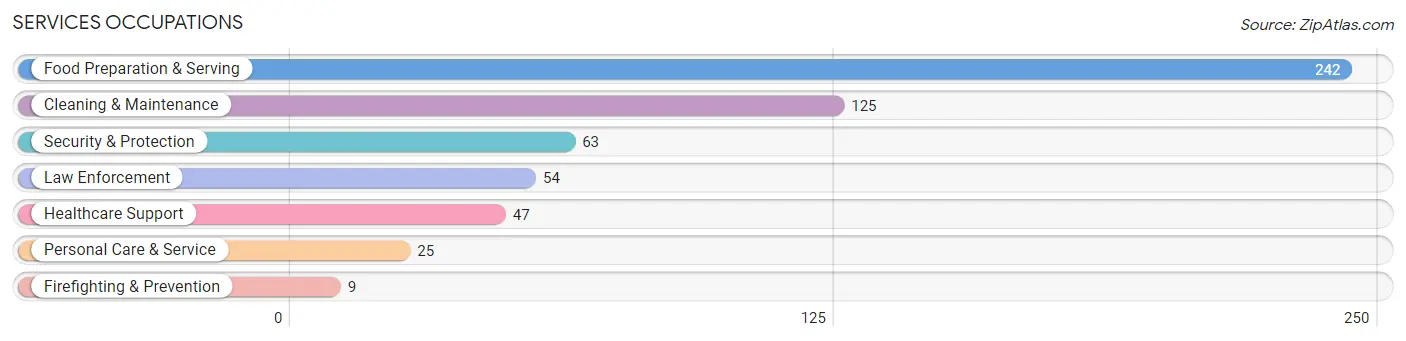
Services Occupations
The most common Services occupations in Nephi are Food Preparation & Serving (242 | 7.6%), Cleaning & Maintenance (125 | 3.9%), Security & Protection (63 | 2.0%), Law Enforcement (54 | 1.7%), and Healthcare Support (47 | 1.5%).
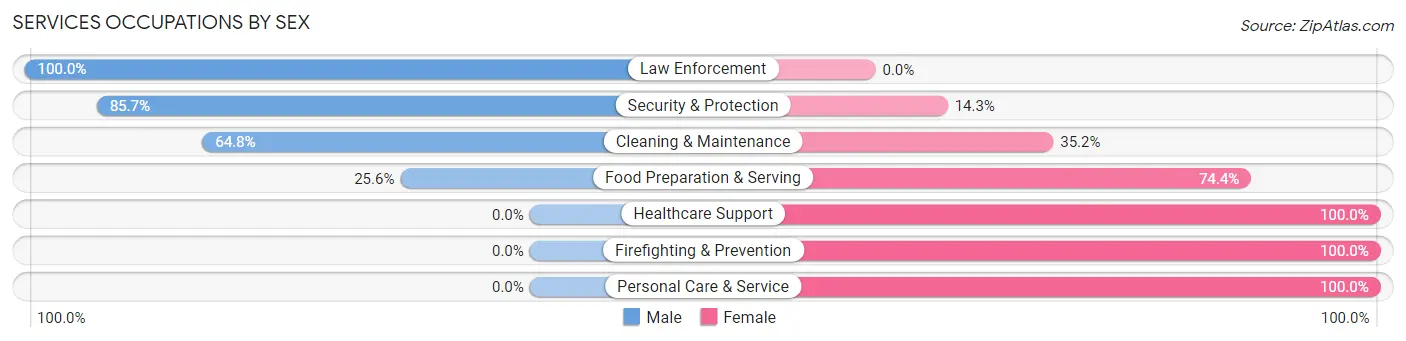
Services Occupations by Sex
Within the Services occupations in Nephi, the most male-oriented occupations are Law Enforcement (100.0%), Security & Protection (85.7%), and Cleaning & Maintenance (64.8%), while the most female-oriented occupations are Healthcare Support (100.0%), Firefighting & Prevention (100.0%), and Personal Care & Service (100.0%).
| Occupation | Male | Female |
| Healthcare Support | 0 (0.0%) | 47 (100.0%) |
| Security & Protection | 54 (85.7%) | 9 (14.3%) |
| Firefighting & Prevention | 0 (0.0%) | 9 (100.0%) |
| Law Enforcement | 54 (100.0%) | 0 (0.0%) |
| Food Preparation & Serving | 62 (25.6%) | 180 (74.4%) |
| Cleaning & Maintenance | 81 (64.8%) | 44 (35.2%) |
| Personal Care & Service | 0 (0.0%) | 25 (100.0%) |
| Total (Category) | 197 (39.2%) | 305 (60.8%) |
| Total (Overall) | 1,739 (54.4%) | 1,459 (45.6%) |
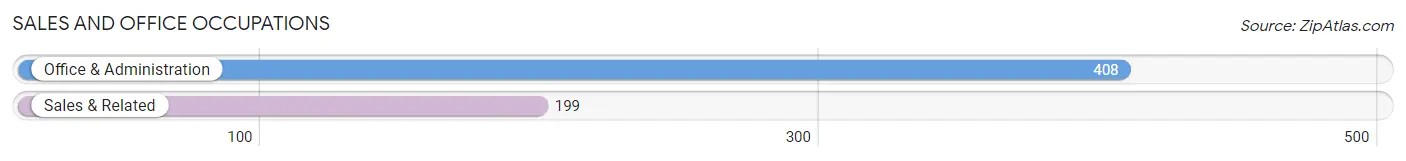
Sales and Office Occupations
The most common Sales and Office occupations in Nephi are Office & Administration (408 | 12.8%), and Sales & Related (199 | 6.2%).
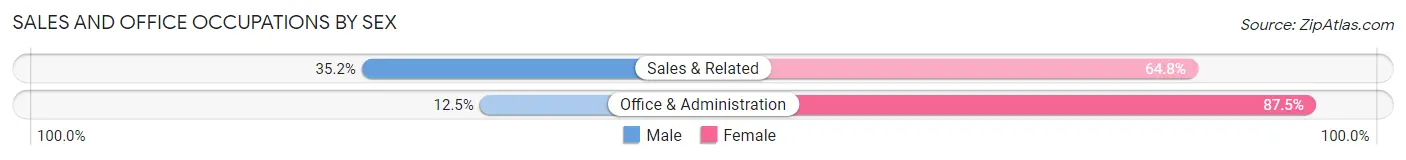
Sales and Office Occupations by Sex
| Occupation | Male | Female |
| Sales & Related | 70 (35.2%) | 129 (64.8%) |
| Office & Administration | 51 (12.5%) | 357 (87.5%) |
| Total (Category) | 121 (19.9%) | 486 (80.1%) |
| Total (Overall) | 1,739 (54.4%) | 1,459 (45.6%) |
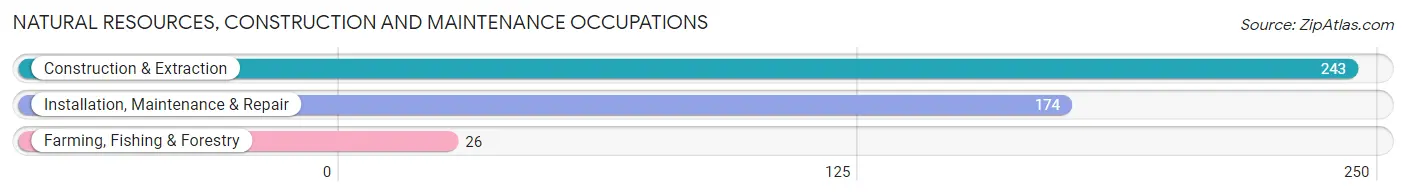
Natural Resources, Construction and Maintenance Occupations
The most common Natural Resources, Construction and Maintenance occupations in Nephi are Construction & Extraction (243 | 7.6%), Installation, Maintenance & Repair (174 | 5.4%), and Farming, Fishing & Forestry (26 | 0.8%).
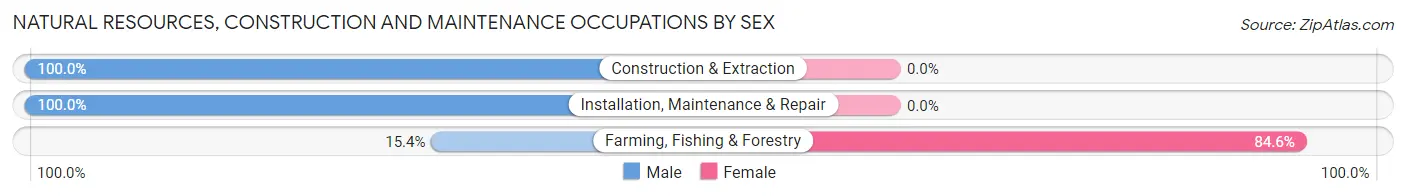
Natural Resources, Construction and Maintenance Occupations by Sex
| Occupation | Male | Female |
| Farming, Fishing & Forestry | 4 (15.4%) | 22 (84.6%) |
| Construction & Extraction | 243 (100.0%) | 0 (0.0%) |
| Installation, Maintenance & Repair | 174 (100.0%) | 0 (0.0%) |
| Total (Category) | 421 (95.0%) | 22 (5.0%) |
| Total (Overall) | 1,739 (54.4%) | 1,459 (45.6%) |
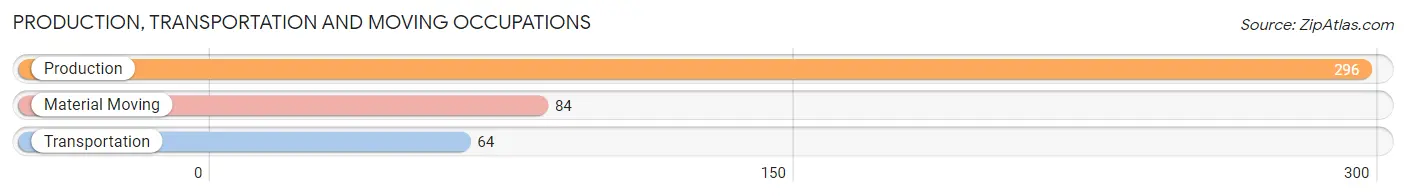
Production, Transportation and Moving Occupations
The most common Production, Transportation and Moving occupations in Nephi are Production (296 | 9.3%), Material Moving (84 | 2.6%), and Transportation (64 | 2.0%).
Production, Transportation and Moving Occupations by Sex
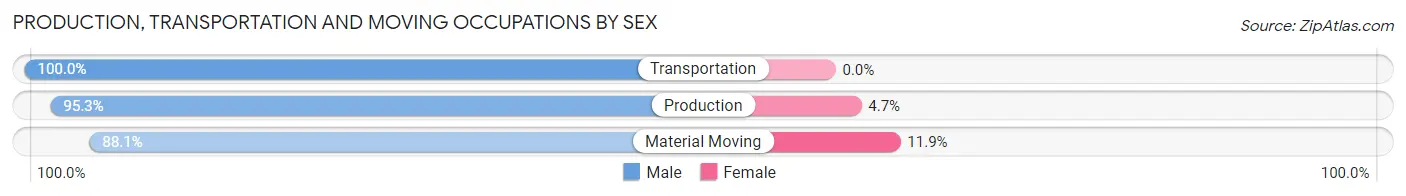
| Occupation | Male | Female |
| Production | 282 (95.3%) | 14 (4.7%) |
| Transportation | 64 (100.0%) | 0 (0.0%) |
| Material Moving | 74 (88.1%) | 10 (11.9%) |
| Total (Category) | 420 (94.6%) | 24 (5.4%) |
| Total (Overall) | 1,739 (54.4%) | 1,459 (45.6%) |
Employment Industries by Sex in Nephi
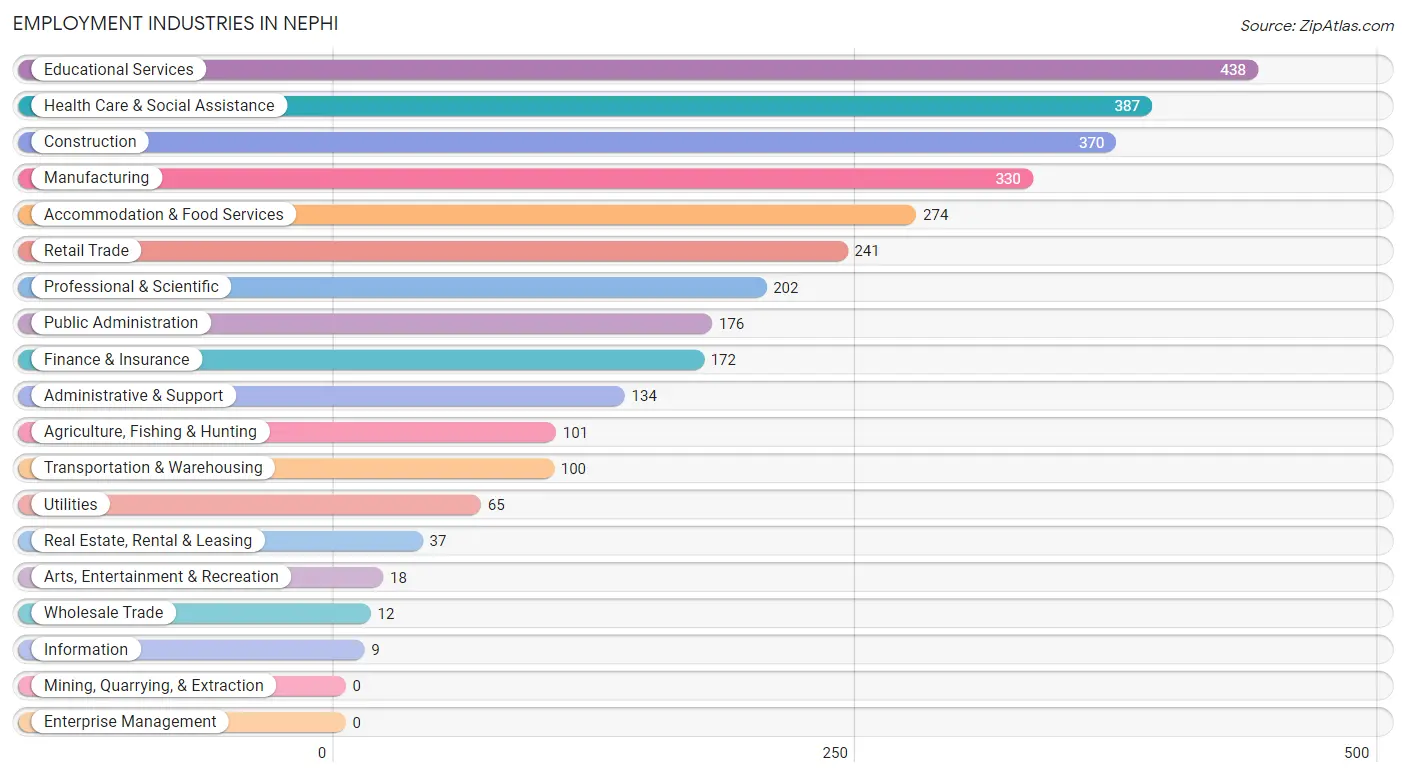
Employment Industries in Nephi
The major employment industries in Nephi include Educational Services (438 | 13.7%), Health Care & Social Assistance (387 | 12.1%), Construction (370 | 11.6%), Manufacturing (330 | 10.3%), and Accommodation & Food Services (274 | 8.6%).
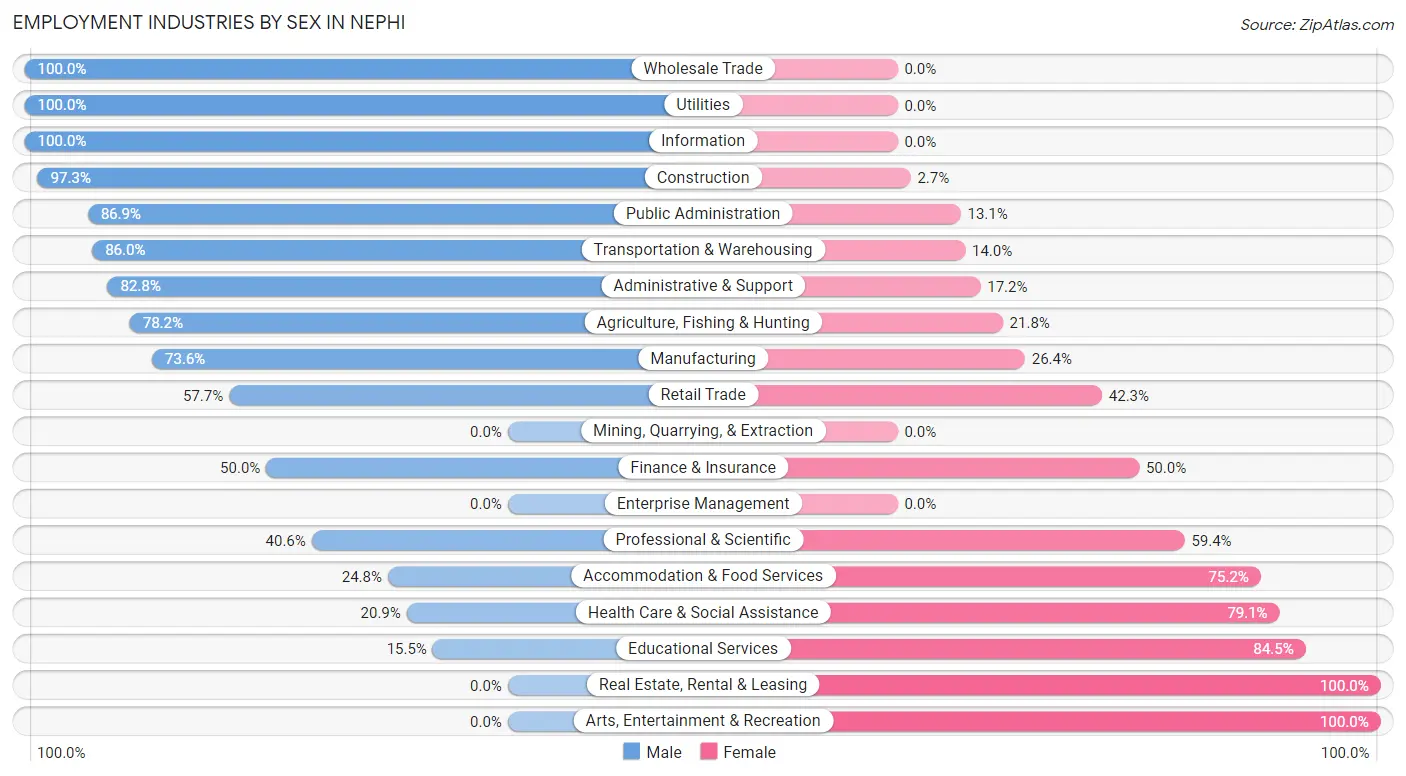
Employment Industries by Sex in Nephi
The Nephi industries that see more men than women are Wholesale Trade (100.0%), Utilities (100.0%), and Information (100.0%), whereas the industries that tend to have a higher number of women are Real Estate, Rental & Leasing (100.0%), Arts, Entertainment & Recreation (100.0%), and Educational Services (84.5%).
| Industry | Male | Female |
| Agriculture, Fishing & Hunting | 79 (78.2%) | 22 (21.8%) |
| Mining, Quarrying, & Extraction | 0 (0.0%) | 0 (0.0%) |
| Construction | 360 (97.3%) | 10 (2.7%) |
| Manufacturing | 243 (73.6%) | 87 (26.4%) |
| Wholesale Trade | 12 (100.0%) | 0 (0.0%) |
| Retail Trade | 139 (57.7%) | 102 (42.3%) |
| Transportation & Warehousing | 86 (86.0%) | 14 (14.0%) |
| Utilities | 65 (100.0%) | 0 (0.0%) |
| Information | 9 (100.0%) | 0 (0.0%) |
| Finance & Insurance | 86 (50.0%) | 86 (50.0%) |
| Real Estate, Rental & Leasing | 0 (0.0%) | 37 (100.0%) |
| Professional & Scientific | 82 (40.6%) | 120 (59.4%) |
| Enterprise Management | 0 (0.0%) | 0 (0.0%) |
| Administrative & Support | 111 (82.8%) | 23 (17.2%) |
| Educational Services | 68 (15.5%) | 370 (84.5%) |
| Health Care & Social Assistance | 81 (20.9%) | 306 (79.1%) |
| Arts, Entertainment & Recreation | 0 (0.0%) | 18 (100.0%) |
| Accommodation & Food Services | 68 (24.8%) | 206 (75.2%) |
| Public Administration | 153 (86.9%) | 23 (13.1%) |
| Total | 1,739 (54.4%) | 1,459 (45.6%) |
Education in Nephi
School Enrollment in Nephi
The most common levels of schooling among the 2,098 students in Nephi are middle school (605 | 28.8%), high school (557 | 26.6%), and elementary school (483 | 23.0%).
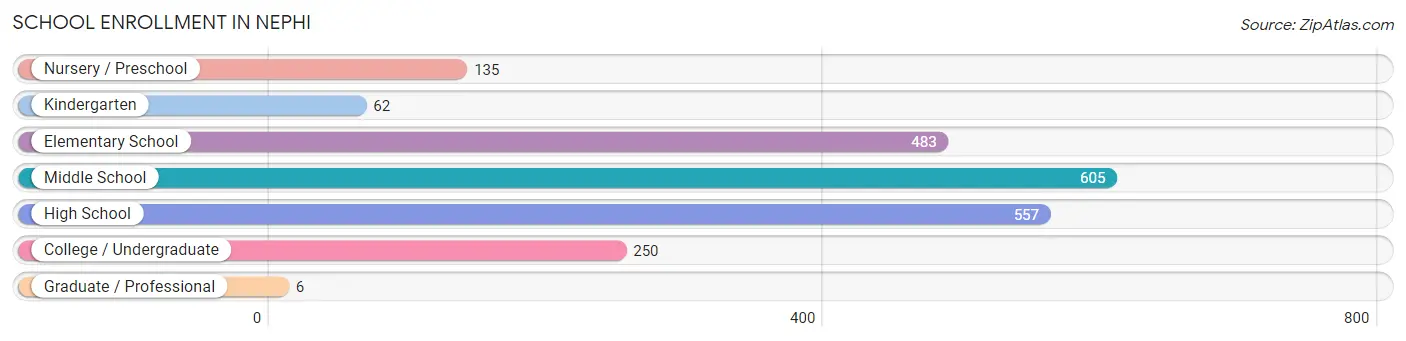
| School Level | # Students | % Students |
| Nursery / Preschool | 135 | 6.4% |
| Kindergarten | 62 | 3.0% |
| Elementary School | 483 | 23.0% |
| Middle School | 605 | 28.8% |
| High School | 557 | 26.6% |
| College / Undergraduate | 250 | 11.9% |
| Graduate / Professional | 6 | 0.3% |
| Total | 2,098 | 100.0% |
School Enrollment by Age by Funding Source in Nephi
Out of a total of 2,098 students who are enrolled in schools in Nephi, 48 (2.3%) attend a private institution, while the remaining 2,050 (97.7%) are enrolled in public schools. The age group of 20 to 24 year olds has the highest likelihood of being enrolled in private schools, with 22 (15.6% in the age bracket) enrolled. Conversely, the age group of 10 to 14 year olds has the lowest likelihood of being enrolled in a private school, with 777 (100.0% in the age bracket) attending a public institution.
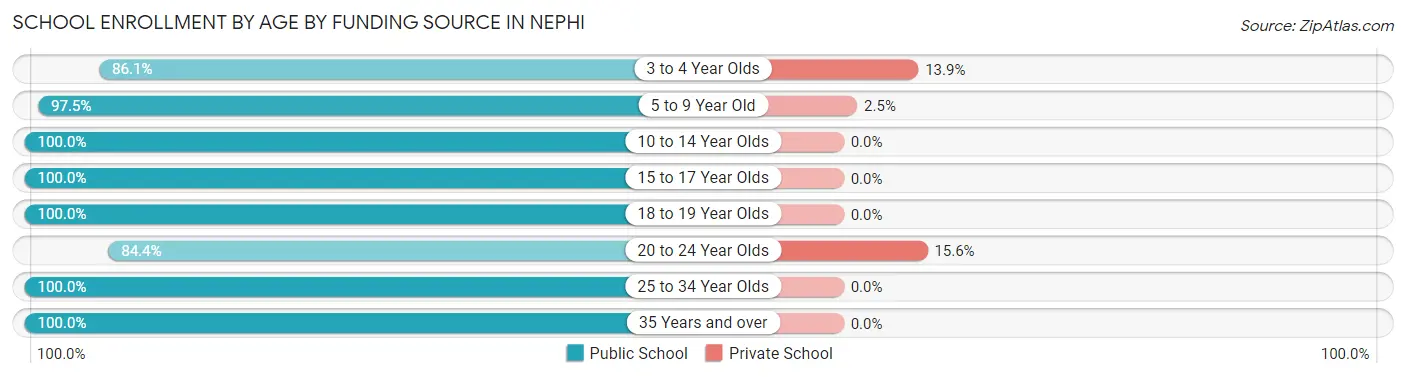
| Age Bracket | Public School | Private School |
| 3 to 4 Year Olds | 93 (86.1%) | 15 (13.9%) |
| 5 to 9 Year Old | 467 (97.5%) | 12 (2.5%) |
| 10 to 14 Year Olds | 777 (100.0%) | 0 (0.0%) |
| 15 to 17 Year Olds | 383 (100.0%) | 0 (0.0%) |
| 18 to 19 Year Olds | 137 (100.0%) | 0 (0.0%) |
| 20 to 24 Year Olds | 119 (84.4%) | 22 (15.6%) |
| 25 to 34 Year Olds | 62 (100.0%) | 0 (0.0%) |
| 35 Years and over | 11 (100.0%) | 0 (0.0%) |
| Total | 2,050 (97.7%) | 48 (2.3%) |
Educational Attainment by Field of Study in Nephi
Education (211 | 24.2%), arts & humanities (188 | 21.6%), science & technology (151 | 17.3%), business (100 | 11.5%), and social sciences (45 | 5.2%) are the most common fields of study among 872 individuals in Nephi who have obtained a bachelor's degree or higher.
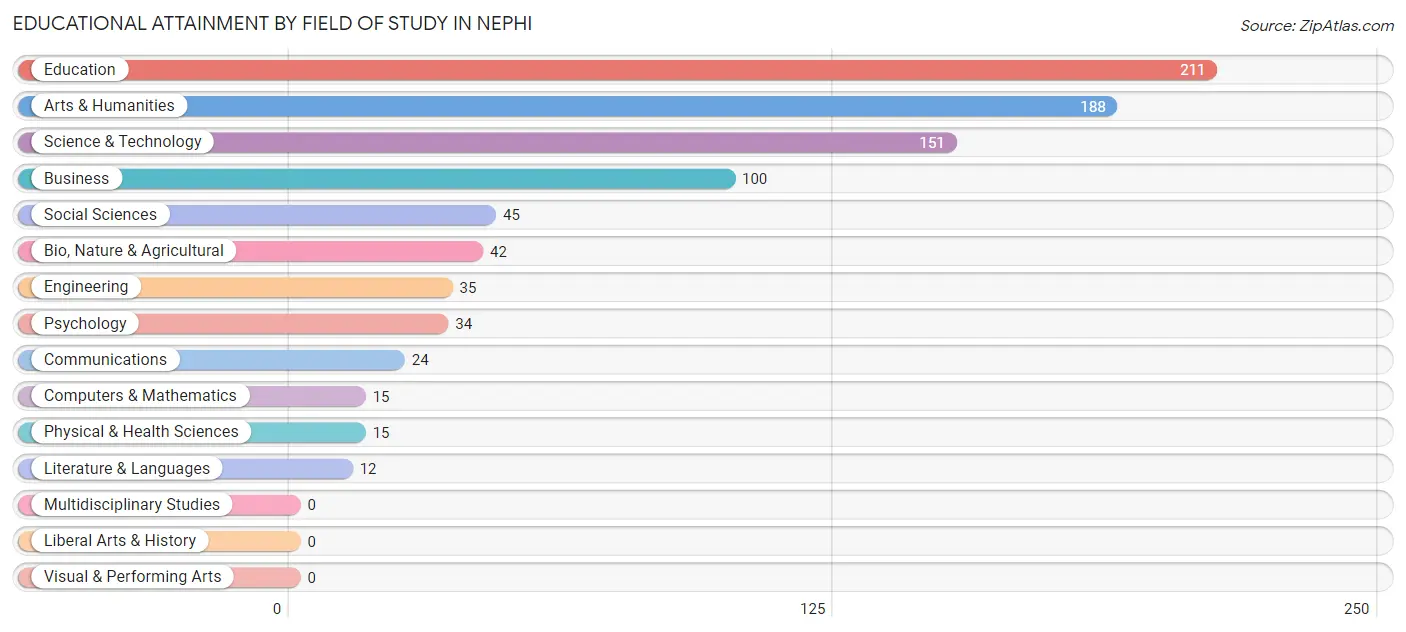
| Field of Study | # Graduates | % Graduates |
| Computers & Mathematics | 15 | 1.7% |
| Bio, Nature & Agricultural | 42 | 4.8% |
| Physical & Health Sciences | 15 | 1.7% |
| Psychology | 34 | 3.9% |
| Social Sciences | 45 | 5.2% |
| Engineering | 35 | 4.0% |
| Multidisciplinary Studies | 0 | 0.0% |
| Science & Technology | 151 | 17.3% |
| Business | 100 | 11.5% |
| Education | 211 | 24.2% |
| Literature & Languages | 12 | 1.4% |
| Liberal Arts & History | 0 | 0.0% |
| Visual & Performing Arts | 0 | 0.0% |
| Communications | 24 | 2.8% |
| Arts & Humanities | 188 | 21.6% |
| Total | 872 | 100.0% |
Transportation & Commute in Nephi
Vehicle Availability by Sex in Nephi
The most prevalent vehicle ownership categories in Nephi are males with 3 vehicles (552, accounting for 32.2%) and females with 3 vehicles (390, making up 38.7%).
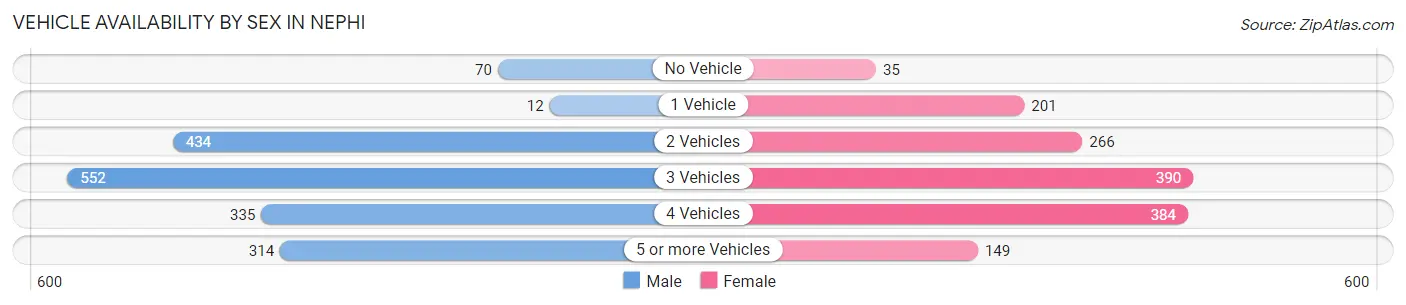
| Vehicles Available | Male | Female |
| No Vehicle | 70 (4.1%) | 35 (2.5%) |
| 1 Vehicle | 12 (0.7%) | 201 (14.1%) |
| 2 Vehicles | 434 (25.3%) | 266 (18.7%) |
| 3 Vehicles | 552 (32.2%) | 390 (27.4%) |
| 4 Vehicles | 335 (19.5%) | 384 (27.0%) |
| 5 or more Vehicles | 314 (18.3%) | 149 (10.5%) |
| Total | 1,717 (100.0%) | 1,425 (100.0%) |
Commute Time in Nephi
The most frequently occuring commute durations in Nephi are less than 5 minutes (706 commuters, 23.6%), 5 to 9 minutes (555 commuters, 18.5%), and 45 to 59 minutes (343 commuters, 11.5%).
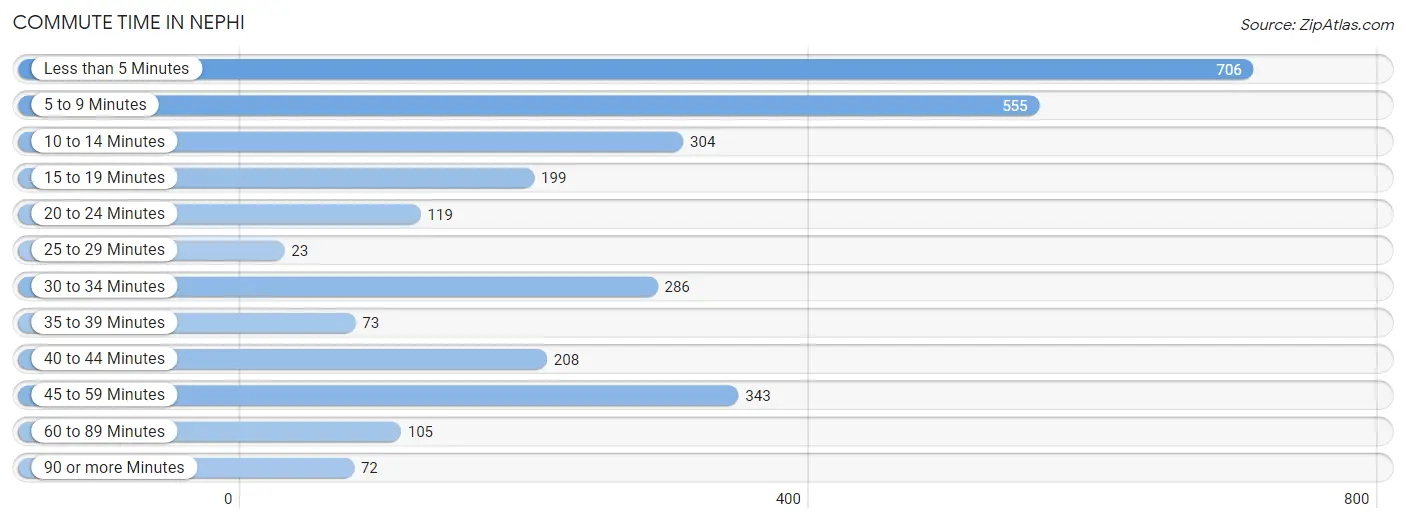
| Commute Time | # Commuters | % Commuters |
| Less than 5 Minutes | 706 | 23.6% |
| 5 to 9 Minutes | 555 | 18.5% |
| 10 to 14 Minutes | 304 | 10.2% |
| 15 to 19 Minutes | 199 | 6.7% |
| 20 to 24 Minutes | 119 | 4.0% |
| 25 to 29 Minutes | 23 | 0.8% |
| 30 to 34 Minutes | 286 | 9.6% |
| 35 to 39 Minutes | 73 | 2.4% |
| 40 to 44 Minutes | 208 | 7.0% |
| 45 to 59 Minutes | 343 | 11.5% |
| 60 to 89 Minutes | 105 | 3.5% |
| 90 or more Minutes | 72 | 2.4% |
Commute Time by Sex in Nephi
The most common commute times in Nephi are less than 5 minutes (302 commuters, 17.8%) for males and less than 5 minutes (404 commuters, 31.0%) for females.
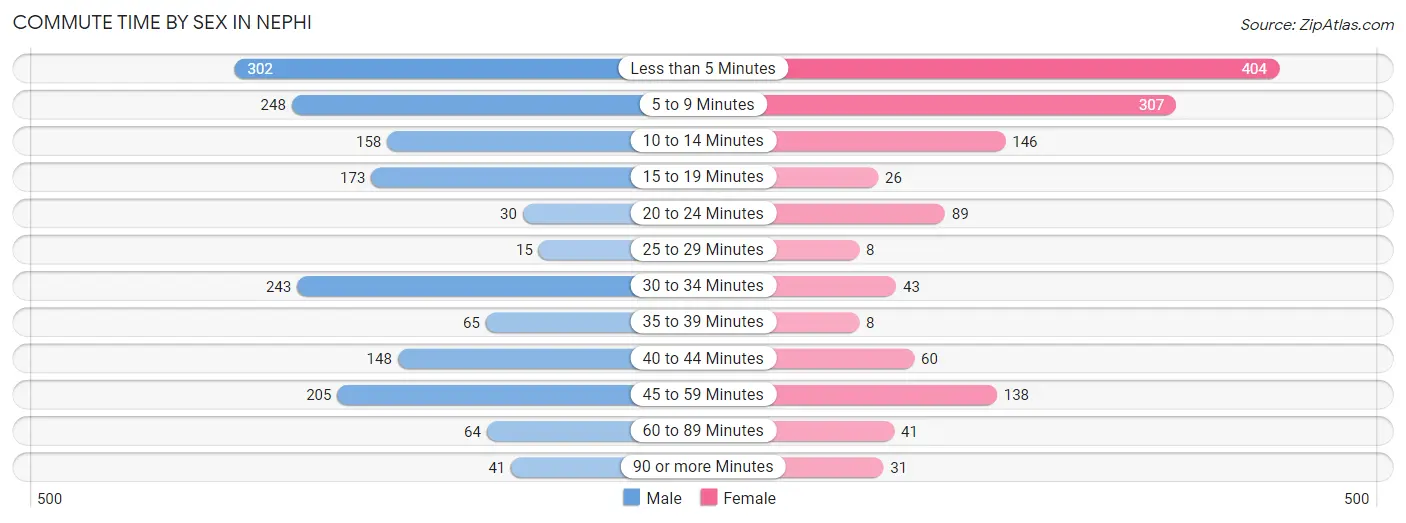
| Commute Time | Male | Female |
| Less than 5 Minutes | 302 (17.8%) | 404 (31.0%) |
| 5 to 9 Minutes | 248 (14.7%) | 307 (23.6%) |
| 10 to 14 Minutes | 158 (9.3%) | 146 (11.2%) |
| 15 to 19 Minutes | 173 (10.2%) | 26 (2.0%) |
| 20 to 24 Minutes | 30 (1.8%) | 89 (6.8%) |
| 25 to 29 Minutes | 15 (0.9%) | 8 (0.6%) |
| 30 to 34 Minutes | 243 (14.4%) | 43 (3.3%) |
| 35 to 39 Minutes | 65 (3.8%) | 8 (0.6%) |
| 40 to 44 Minutes | 148 (8.7%) | 60 (4.6%) |
| 45 to 59 Minutes | 205 (12.1%) | 138 (10.6%) |
| 60 to 89 Minutes | 64 (3.8%) | 41 (3.2%) |
| 90 or more Minutes | 41 (2.4%) | 31 (2.4%) |
Time of Departure to Work by Sex in Nephi
The most frequent times of departure to work in Nephi are 5:00 AM to 5:29 AM (293, 17.3%) for males and 7:00 AM to 7:29 AM (341, 26.2%) for females.
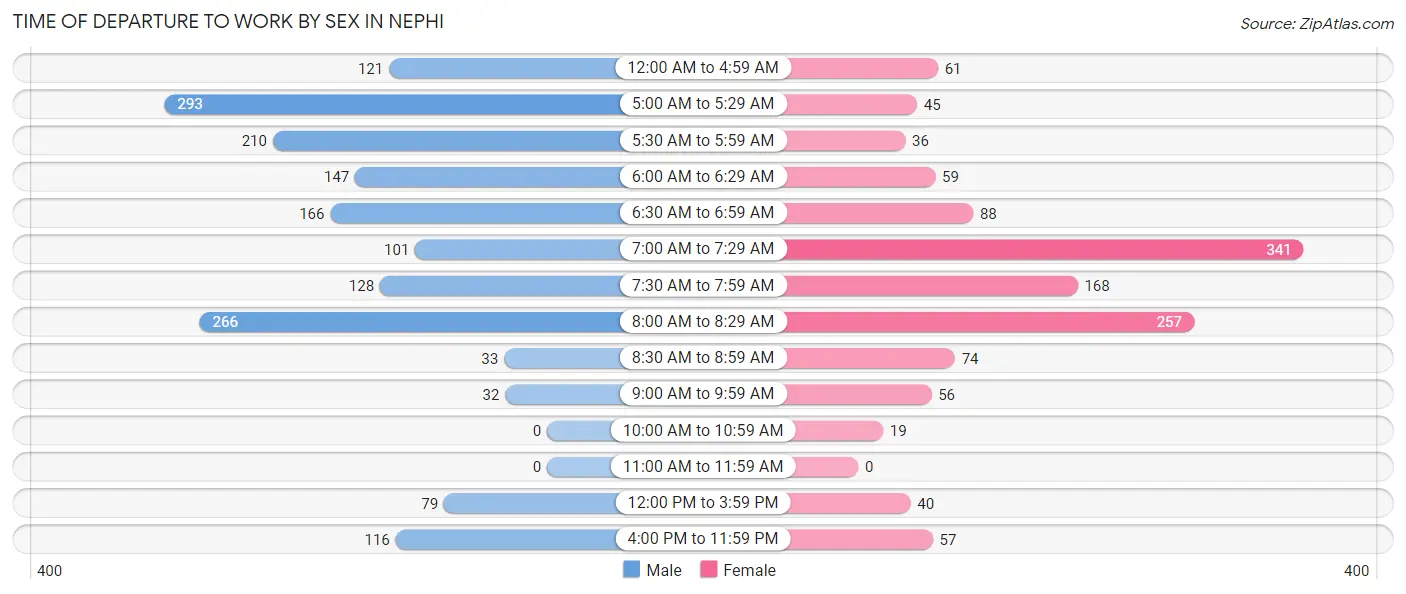
| Time of Departure | Male | Female |
| 12:00 AM to 4:59 AM | 121 (7.1%) | 61 (4.7%) |
| 5:00 AM to 5:29 AM | 293 (17.3%) | 45 (3.5%) |
| 5:30 AM to 5:59 AM | 210 (12.4%) | 36 (2.8%) |
| 6:00 AM to 6:29 AM | 147 (8.7%) | 59 (4.5%) |
| 6:30 AM to 6:59 AM | 166 (9.8%) | 88 (6.8%) |
| 7:00 AM to 7:29 AM | 101 (6.0%) | 341 (26.2%) |
| 7:30 AM to 7:59 AM | 128 (7.6%) | 168 (12.9%) |
| 8:00 AM to 8:29 AM | 266 (15.7%) | 257 (19.8%) |
| 8:30 AM to 8:59 AM | 33 (1.9%) | 74 (5.7%) |
| 9:00 AM to 9:59 AM | 32 (1.9%) | 56 (4.3%) |
| 10:00 AM to 10:59 AM | 0 (0.0%) | 19 (1.5%) |
| 11:00 AM to 11:59 AM | 0 (0.0%) | 0 (0.0%) |
| 12:00 PM to 3:59 PM | 79 (4.7%) | 40 (3.1%) |
| 4:00 PM to 11:59 PM | 116 (6.9%) | 57 (4.4%) |
| Total | 1,692 (100.0%) | 1,301 (100.0%) |
Housing Occupancy in Nephi
Occupancy by Ownership in Nephi
Of the total 2,040 dwellings in Nephi, owner-occupied units account for 1,498 (73.4%), while renter-occupied units make up 542 (26.6%).
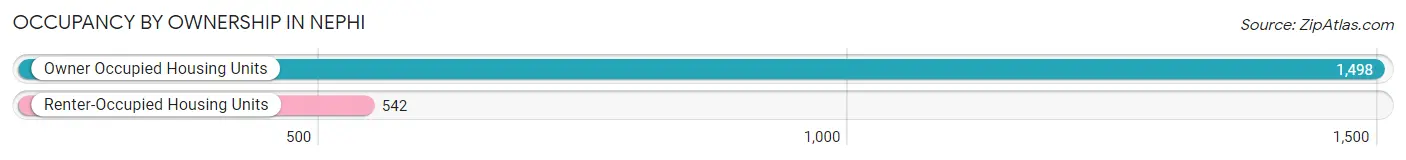
| Occupancy | # Housing Units | % Housing Units |
| Owner Occupied Housing Units | 1,498 | 73.4% |
| Renter-Occupied Housing Units | 542 | 26.6% |
| Total Occupied Housing Units | 2,040 | 100.0% |
Occupancy by Household Size in Nephi
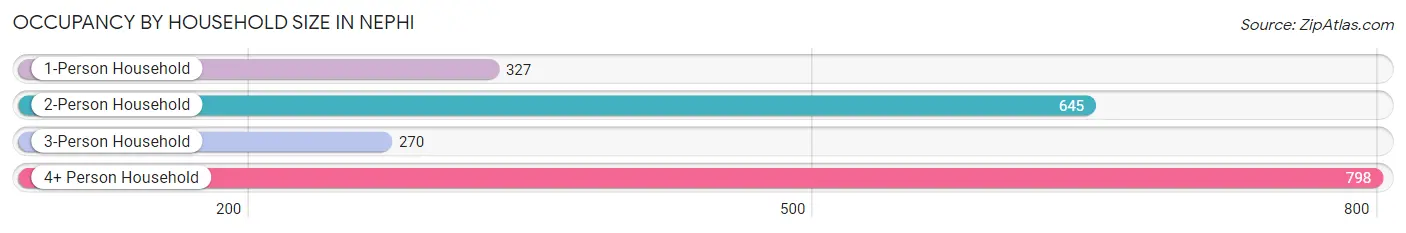
| Household Size | # Housing Units | % Housing Units |
| 1-Person Household | 327 | 16.0% |
| 2-Person Household | 645 | 31.6% |
| 3-Person Household | 270 | 13.2% |
| 4+ Person Household | 798 | 39.1% |
| Total Housing Units | 2,040 | 100.0% |
Occupancy by Ownership by Household Size in Nephi
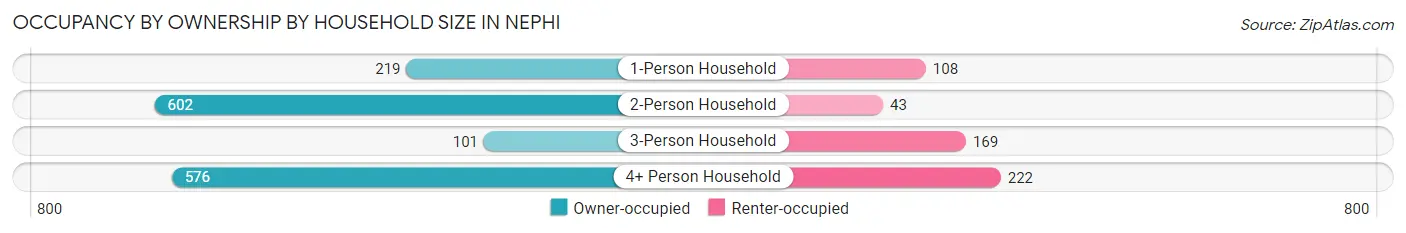
| Household Size | Owner-occupied | Renter-occupied |
| 1-Person Household | 219 (67.0%) | 108 (33.0%) |
| 2-Person Household | 602 (93.3%) | 43 (6.7%) |
| 3-Person Household | 101 (37.4%) | 169 (62.6%) |
| 4+ Person Household | 576 (72.2%) | 222 (27.8%) |
| Total Housing Units | 1,498 (73.4%) | 542 (26.6%) |
Occupancy by Educational Attainment in Nephi
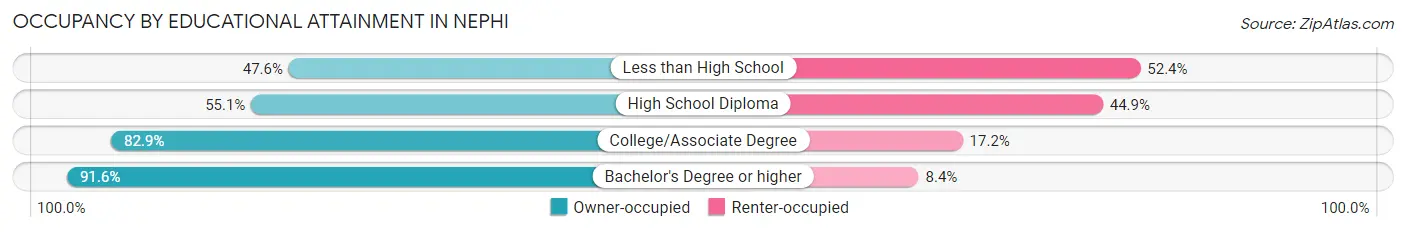
| Household Size | Owner-occupied | Renter-occupied |
| Less than High School | 30 (47.6%) | 33 (52.4%) |
| High School Diploma | 413 (55.1%) | 337 (44.9%) |
| College/Associate Degree | 652 (82.9%) | 135 (17.2%) |
| Bachelor's Degree or higher | 403 (91.6%) | 37 (8.4%) |
Occupancy by Age of Householder in Nephi
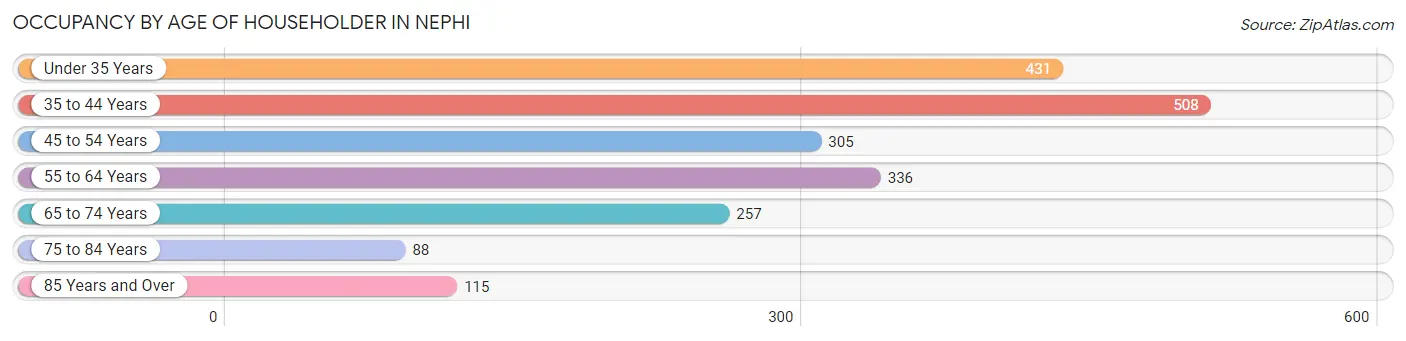
| Age Bracket | # Households | % Households |
| Under 35 Years | 431 | 21.1% |
| 35 to 44 Years | 508 | 24.9% |
| 45 to 54 Years | 305 | 14.9% |
| 55 to 64 Years | 336 | 16.5% |
| 65 to 74 Years | 257 | 12.6% |
| 75 to 84 Years | 88 | 4.3% |
| 85 Years and Over | 115 | 5.6% |
| Total | 2,040 | 100.0% |
Housing Finances in Nephi
Median Income by Occupancy in Nephi
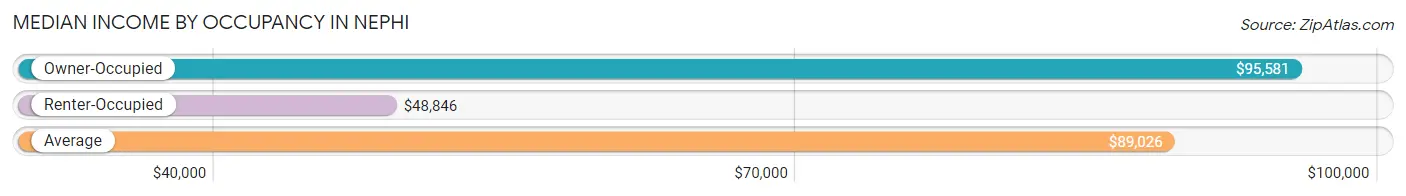
| Occupancy Type | # Households | Median Income |
| Owner-Occupied | 1,498 (73.4%) | $95,581 |
| Renter-Occupied | 542 (26.6%) | $48,846 |
| Average | 2,040 (100.0%) | $89,026 |
Occupancy by Householder Income Bracket in Nephi
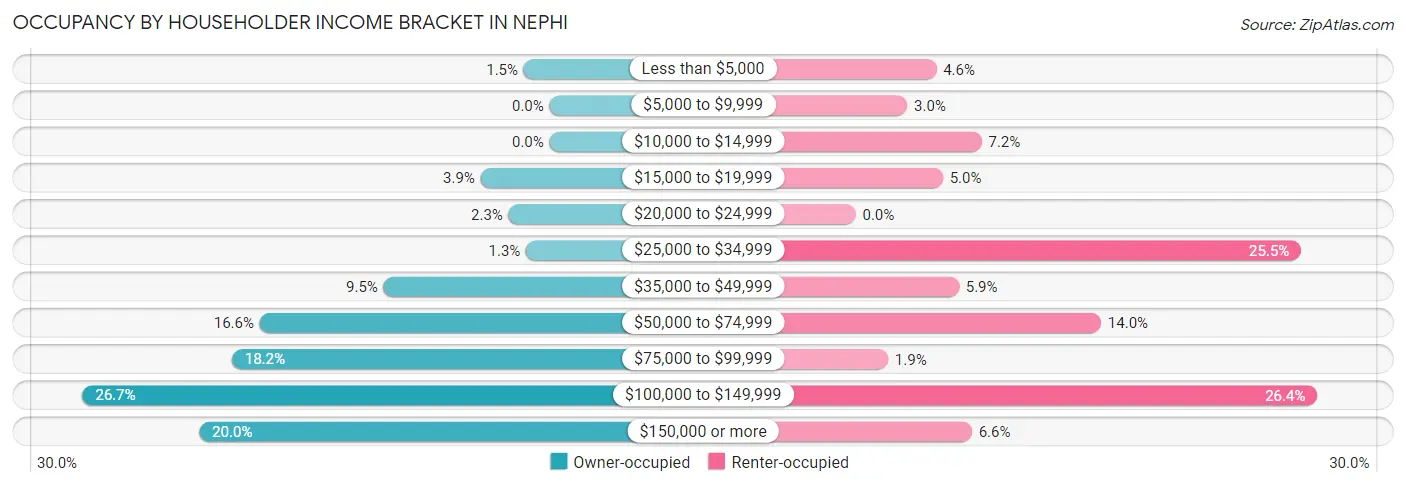
| Income Bracket | Owner-occupied | Renter-occupied |
| Less than $5,000 | 22 (1.5%) | 25 (4.6%) |
| $5,000 to $9,999 | 0 (0.0%) | 16 (2.9%) |
| $10,000 to $14,999 | 0 (0.0%) | 39 (7.2%) |
| $15,000 to $19,999 | 59 (3.9%) | 27 (5.0%) |
| $20,000 to $24,999 | 35 (2.3%) | 0 (0.0%) |
| $25,000 to $34,999 | 20 (1.3%) | 138 (25.5%) |
| $35,000 to $49,999 | 142 (9.5%) | 32 (5.9%) |
| $50,000 to $74,999 | 248 (16.6%) | 76 (14.0%) |
| $75,000 to $99,999 | 272 (18.2%) | 10 (1.8%) |
| $100,000 to $149,999 | 400 (26.7%) | 143 (26.4%) |
| $150,000 or more | 300 (20.0%) | 36 (6.6%) |
| Total | 1,498 (100.0%) | 542 (100.0%) |
Monthly Housing Cost Tiers in Nephi
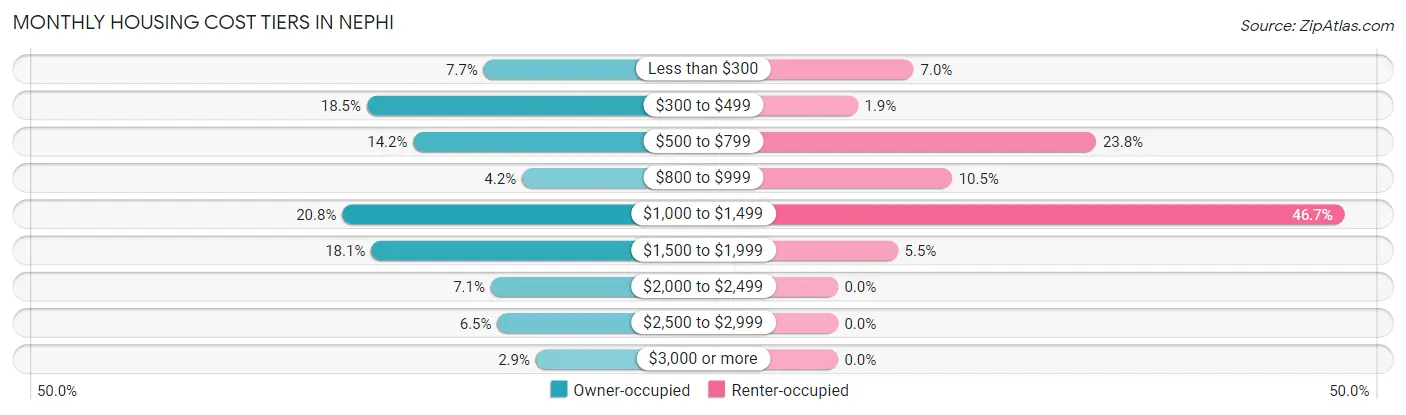
| Monthly Cost | Owner-occupied | Renter-occupied |
| Less than $300 | 116 (7.7%) | 38 (7.0%) |
| $300 to $499 | 277 (18.5%) | 10 (1.8%) |
| $500 to $799 | 213 (14.2%) | 129 (23.8%) |
| $800 to $999 | 63 (4.2%) | 57 (10.5%) |
| $1,000 to $1,499 | 311 (20.8%) | 253 (46.7%) |
| $1,500 to $1,999 | 271 (18.1%) | 30 (5.5%) |
| $2,000 to $2,499 | 106 (7.1%) | 0 (0.0%) |
| $2,500 to $2,999 | 97 (6.5%) | 0 (0.0%) |
| $3,000 or more | 44 (2.9%) | 0 (0.0%) |
| Total | 1,498 (100.0%) | 542 (100.0%) |
Physical Housing Characteristics in Nephi
Housing Structures in Nephi
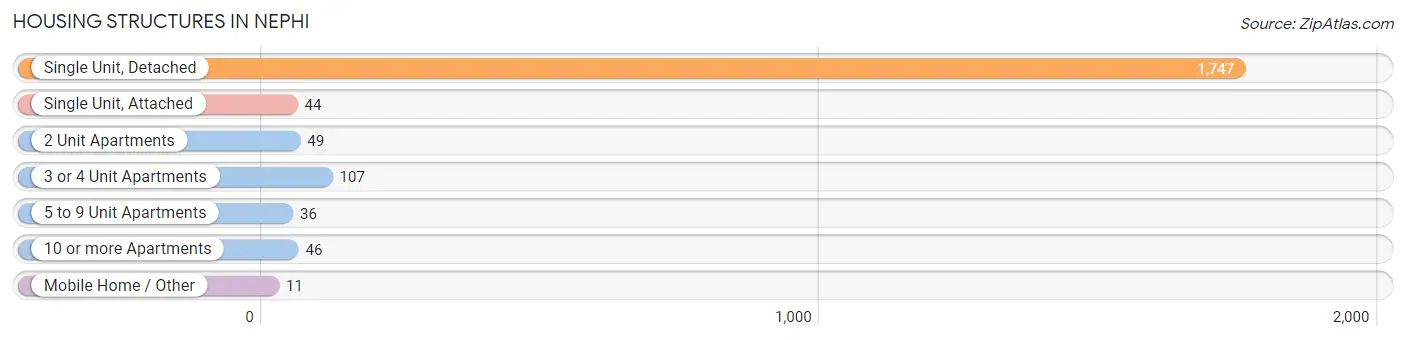
| Structure Type | # Housing Units | % Housing Units |
| Single Unit, Detached | 1,747 | 85.6% |
| Single Unit, Attached | 44 | 2.2% |
| 2 Unit Apartments | 49 | 2.4% |
| 3 or 4 Unit Apartments | 107 | 5.2% |
| 5 to 9 Unit Apartments | 36 | 1.8% |
| 10 or more Apartments | 46 | 2.2% |
| Mobile Home / Other | 11 | 0.5% |
| Total | 2,040 | 100.0% |
Housing Structures by Occupancy in Nephi
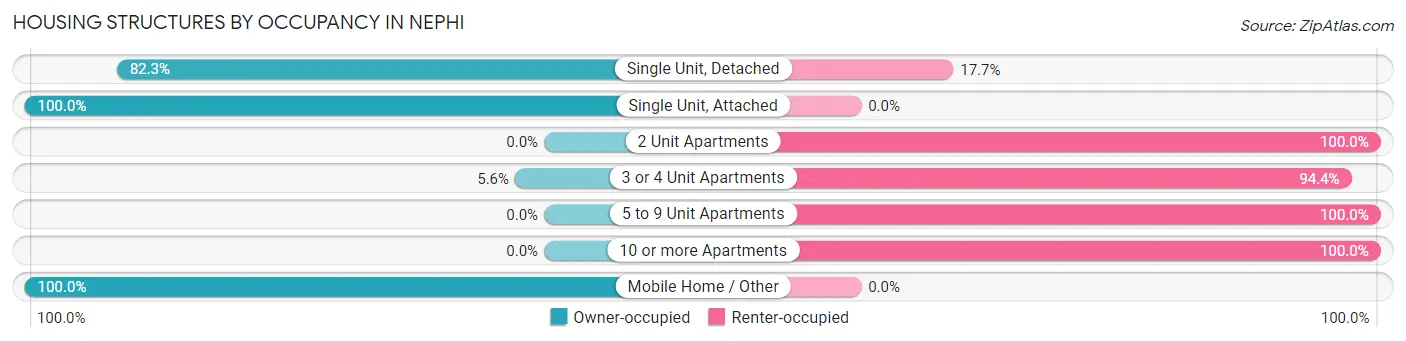
| Structure Type | Owner-occupied | Renter-occupied |
| Single Unit, Detached | 1,437 (82.3%) | 310 (17.7%) |
| Single Unit, Attached | 44 (100.0%) | 0 (0.0%) |
| 2 Unit Apartments | 0 (0.0%) | 49 (100.0%) |
| 3 or 4 Unit Apartments | 6 (5.6%) | 101 (94.4%) |
| 5 to 9 Unit Apartments | 0 (0.0%) | 36 (100.0%) |
| 10 or more Apartments | 0 (0.0%) | 46 (100.0%) |
| Mobile Home / Other | 11 (100.0%) | 0 (0.0%) |
| Total | 1,498 (73.4%) | 542 (26.6%) |
Housing Structures by Number of Rooms in Nephi
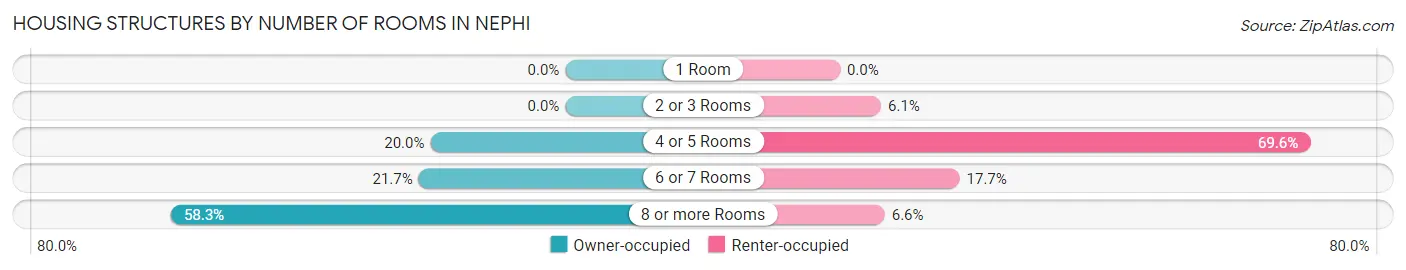
| Number of Rooms | Owner-occupied | Renter-occupied |
| 1 Room | 0 (0.0%) | 0 (0.0%) |
| 2 or 3 Rooms | 0 (0.0%) | 33 (6.1%) |
| 4 or 5 Rooms | 299 (20.0%) | 377 (69.6%) |
| 6 or 7 Rooms | 325 (21.7%) | 96 (17.7%) |
| 8 or more Rooms | 874 (58.3%) | 36 (6.6%) |
| Total | 1,498 (100.0%) | 542 (100.0%) |
Housing Structure by Heating Type in Nephi
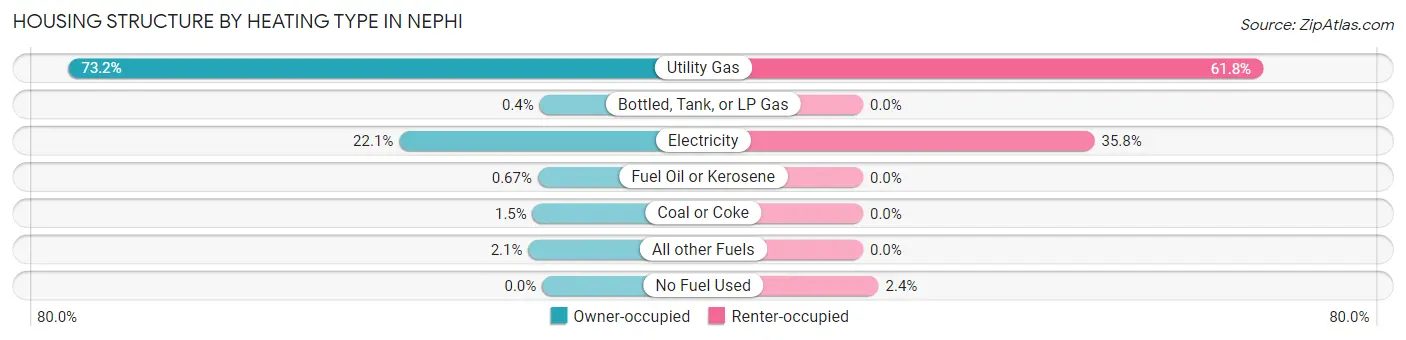
| Heating Type | Owner-occupied | Renter-occupied |
| Utility Gas | 1,097 (73.2%) | 335 (61.8%) |
| Bottled, Tank, or LP Gas | 6 (0.4%) | 0 (0.0%) |
| Electricity | 331 (22.1%) | 194 (35.8%) |
| Fuel Oil or Kerosene | 10 (0.7%) | 0 (0.0%) |
| Coal or Coke | 22 (1.5%) | 0 (0.0%) |
| All other Fuels | 32 (2.1%) | 0 (0.0%) |
| No Fuel Used | 0 (0.0%) | 13 (2.4%) |
| Total | 1,498 (100.0%) | 542 (100.0%) |
Household Vehicle Usage in Nephi
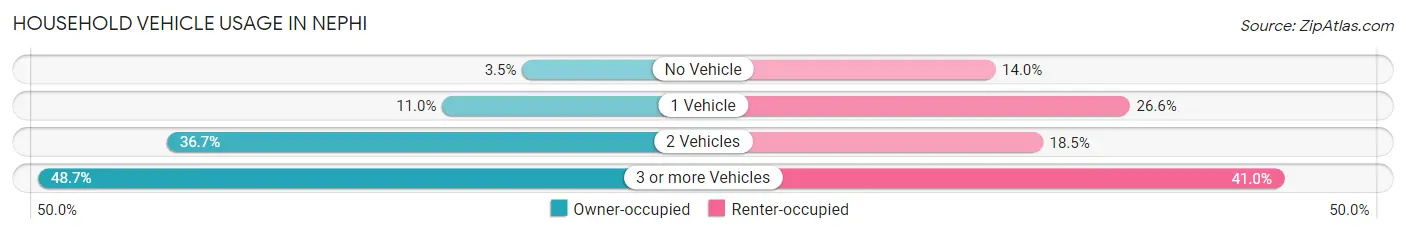
| Vehicles per Household | Owner-occupied | Renter-occupied |
| No Vehicle | 53 (3.5%) | 76 (14.0%) |
| 1 Vehicle | 165 (11.0%) | 144 (26.6%) |
| 2 Vehicles | 550 (36.7%) | 100 (18.4%) |
| 3 or more Vehicles | 730 (48.7%) | 222 (41.0%) |
| Total | 1,498 (100.0%) | 542 (100.0%) |
Real Estate & Mortgages in Nephi
Real Estate and Mortgage Overview in Nephi
| Characteristic | Without Mortgage | With Mortgage |
| Housing Units | 532 | 966 |
| Median Property Value | $339,300 | $314,600 |
| Median Household Income | $66,875 | $239 |
| Monthly Housing Costs | $384 | $44 |
| Real Estate Taxes | $1,827 | $49 |
Property Value by Mortgage Status in Nephi
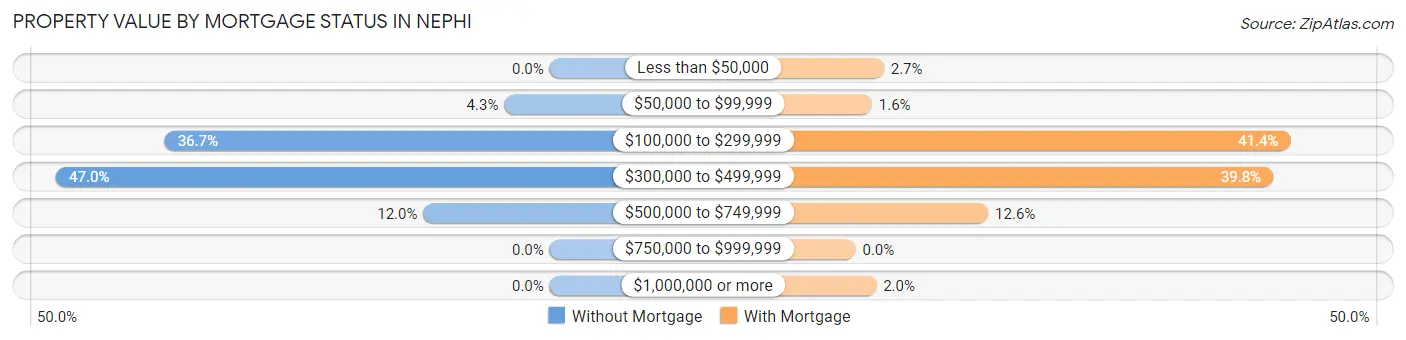
| Property Value | Without Mortgage | With Mortgage |
| Less than $50,000 | 0 (0.0%) | 26 (2.7%) |
| $50,000 to $99,999 | 23 (4.3%) | 15 (1.5%) |
| $100,000 to $299,999 | 195 (36.6%) | 400 (41.4%) |
| $300,000 to $499,999 | 250 (47.0%) | 384 (39.8%) |
| $500,000 to $749,999 | 64 (12.0%) | 122 (12.6%) |
| $750,000 to $999,999 | 0 (0.0%) | 0 (0.0%) |
| $1,000,000 or more | 0 (0.0%) | 19 (2.0%) |
| Total | 532 (100.0%) | 966 (100.0%) |
Household Income by Mortgage Status in Nephi
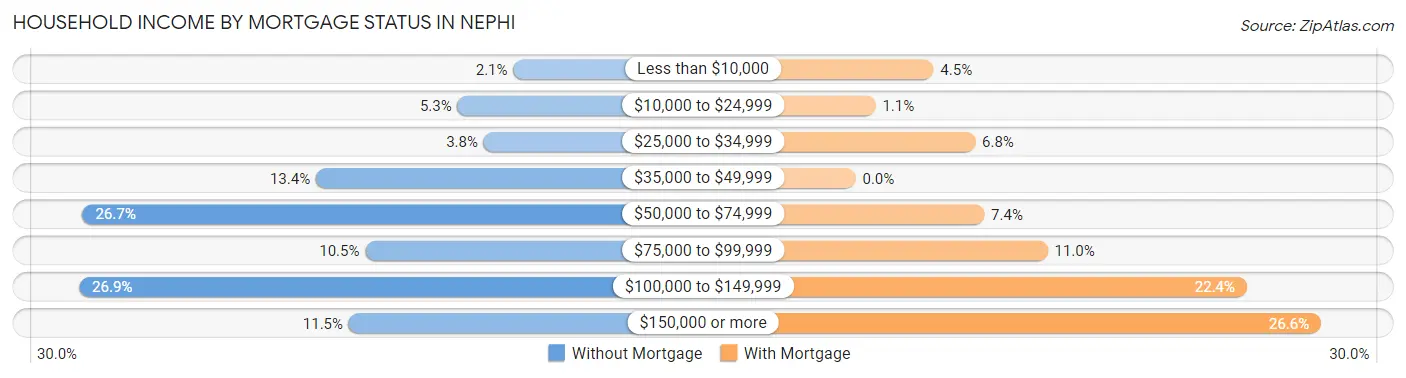
| Household Income | Without Mortgage | With Mortgage |
| Less than $10,000 | 11 (2.1%) | 43 (4.4%) |
| $10,000 to $24,999 | 28 (5.3%) | 11 (1.1%) |
| $25,000 to $34,999 | 20 (3.8%) | 66 (6.8%) |
| $35,000 to $49,999 | 71 (13.4%) | 0 (0.0%) |
| $50,000 to $74,999 | 142 (26.7%) | 71 (7.3%) |
| $75,000 to $99,999 | 56 (10.5%) | 106 (11.0%) |
| $100,000 to $149,999 | 143 (26.9%) | 216 (22.4%) |
| $150,000 or more | 61 (11.5%) | 257 (26.6%) |
| Total | 532 (100.0%) | 966 (100.0%) |
Property Value to Household Income Ratio in Nephi
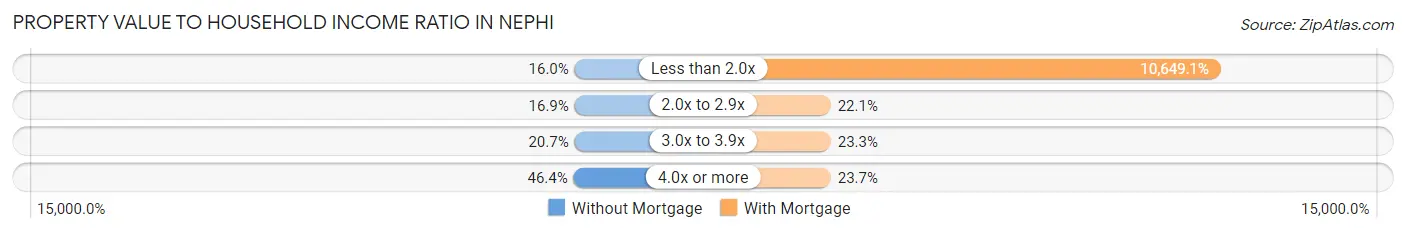
| Value-to-Income Ratio | Without Mortgage | With Mortgage |
| Less than 2.0x | 85 (16.0%) | 102,870 (10,649.1%) |
| 2.0x to 2.9x | 90 (16.9%) | 213 (22.1%) |
| 3.0x to 3.9x | 110 (20.7%) | 225 (23.3%) |
| 4.0x or more | 247 (46.4%) | 229 (23.7%) |
| Total | 532 (100.0%) | 966 (100.0%) |
Real Estate Taxes by Mortgage Status in Nephi
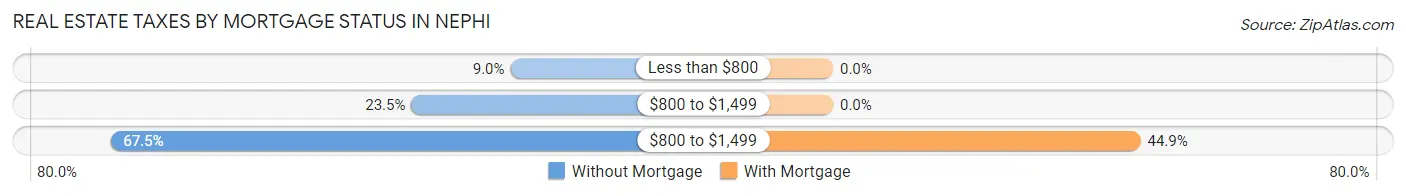
| Property Taxes | Without Mortgage | With Mortgage |
| Less than $800 | 48 (9.0%) | 0 (0.0%) |
| $800 to $1,499 | 125 (23.5%) | 0 (0.0%) |
| $800 to $1,499 | 359 (67.5%) | 434 (44.9%) |
| Total | 532 (100.0%) | 966 (100.0%) |
Health & Disability in Nephi
Health Insurance Coverage by Age in Nephi
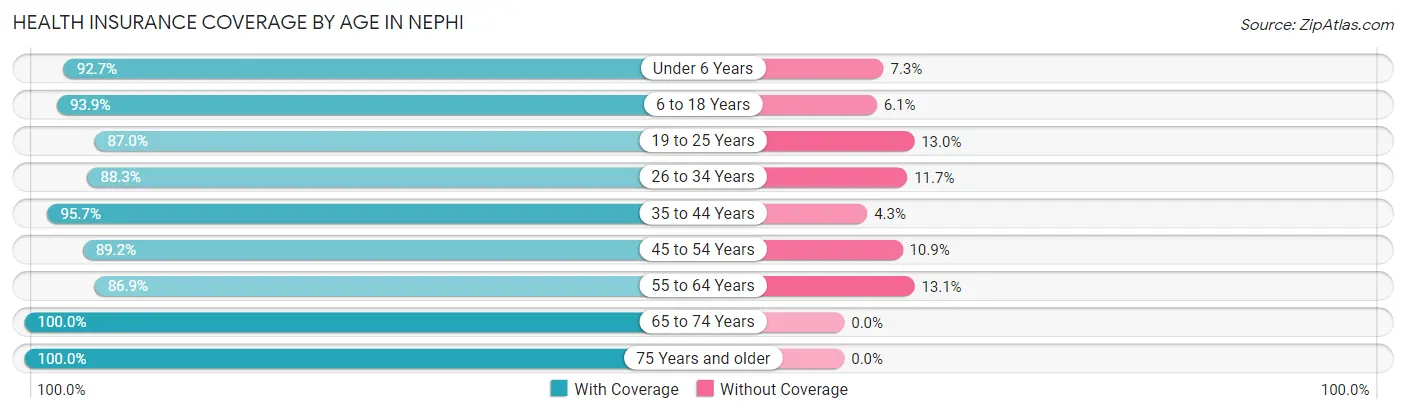
| Age Bracket | With Coverage | Without Coverage |
| Under 6 Years | 443 (92.7%) | 35 (7.3%) |
| 6 to 18 Years | 1,598 (93.9%) | 103 (6.1%) |
| 19 to 25 Years | 460 (87.0%) | 69 (13.0%) |
| 26 to 34 Years | 684 (88.3%) | 91 (11.7%) |
| 35 to 44 Years | 963 (95.7%) | 43 (4.3%) |
| 45 to 54 Years | 649 (89.1%) | 79 (10.8%) |
| 55 to 64 Years | 465 (86.9%) | 70 (13.1%) |
| 65 to 74 Years | 402 (100.0%) | 0 (0.0%) |
| 75 Years and older | 266 (100.0%) | 0 (0.0%) |
| Total | 5,930 (92.4%) | 490 (7.6%) |
Health Insurance Coverage by Citizenship Status in Nephi
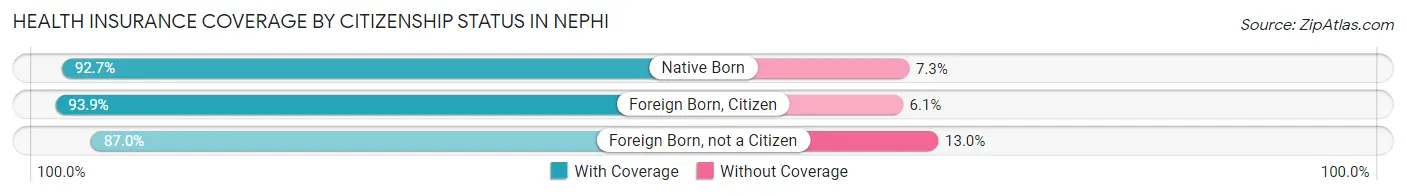
| Citizenship Status | With Coverage | Without Coverage |
| Native Born | 443 (92.7%) | 35 (7.3%) |
| Foreign Born, Citizen | 1,598 (93.9%) | 103 (6.1%) |
| Foreign Born, not a Citizen | 460 (87.0%) | 69 (13.0%) |
Health Insurance Coverage by Household Income in Nephi
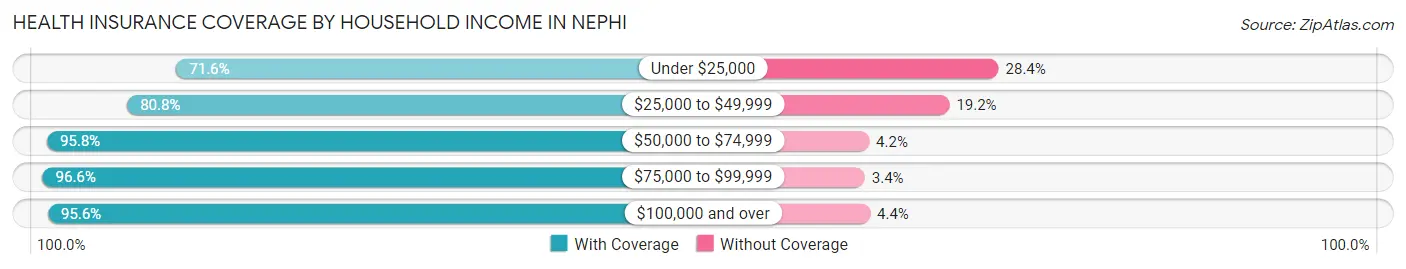
| Household Income | With Coverage | Without Coverage |
| Under $25,000 | 234 (71.6%) | 93 (28.4%) |
| $25,000 to $49,999 | 773 (80.8%) | 184 (19.2%) |
| $50,000 to $74,999 | 732 (95.8%) | 32 (4.2%) |
| $75,000 to $99,999 | 828 (96.6%) | 29 (3.4%) |
| $100,000 and over | 3,325 (95.6%) | 152 (4.4%) |
Public vs Private Health Insurance Coverage by Age in Nephi
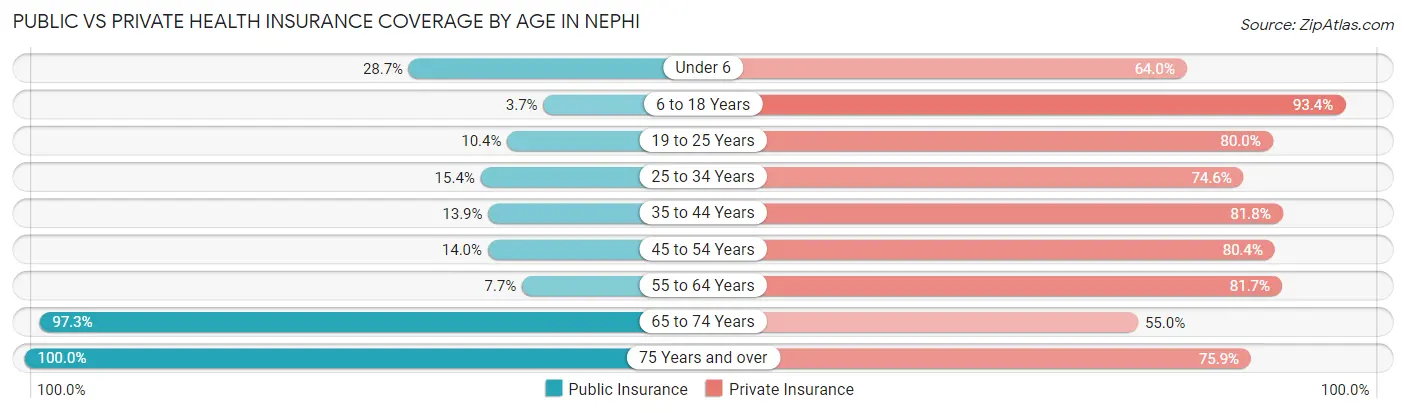
| Age Bracket | Public Insurance | Private Insurance |
| Under 6 | 137 (28.7%) | 306 (64.0%) |
| 6 to 18 Years | 63 (3.7%) | 1,589 (93.4%) |
| 19 to 25 Years | 55 (10.4%) | 423 (80.0%) |
| 25 to 34 Years | 119 (15.3%) | 578 (74.6%) |
| 35 to 44 Years | 140 (13.9%) | 823 (81.8%) |
| 45 to 54 Years | 102 (14.0%) | 585 (80.4%) |
| 55 to 64 Years | 41 (7.7%) | 437 (81.7%) |
| 65 to 74 Years | 391 (97.3%) | 221 (55.0%) |
| 75 Years and over | 266 (100.0%) | 202 (75.9%) |
| Total | 1,314 (20.5%) | 5,164 (80.4%) |
Disability Status by Sex by Age in Nephi
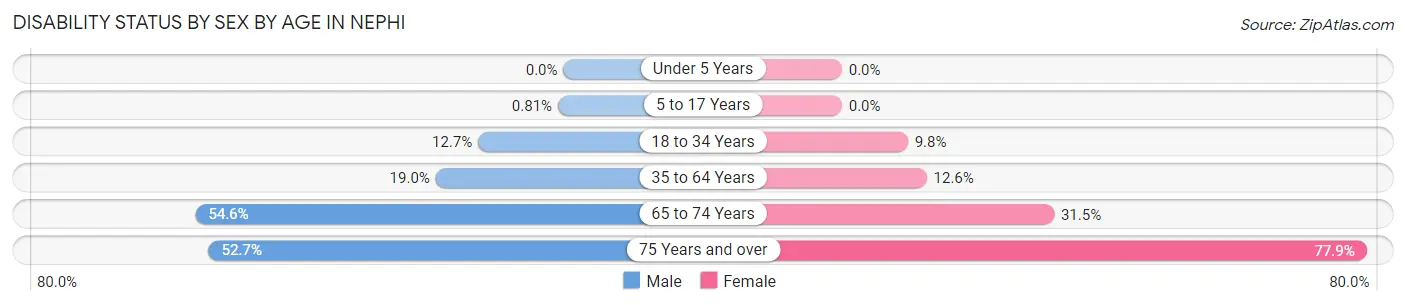
| Age Bracket | Male | Female |
| Under 5 Years | 0 (0.0%) | 0 (0.0%) |
| 5 to 17 Years | 8 (0.8%) | 0 (0.0%) |
| 18 to 34 Years | 93 (12.7%) | 66 (9.8%) |
| 35 to 64 Years | 230 (19.0%) | 133 (12.6%) |
| 65 to 74 Years | 100 (54.6%) | 69 (31.5%) |
| 75 Years and over | 59 (52.7%) | 120 (77.9%) |
Disability Class by Sex by Age in Nephi
Disability Class: Hearing Difficulty
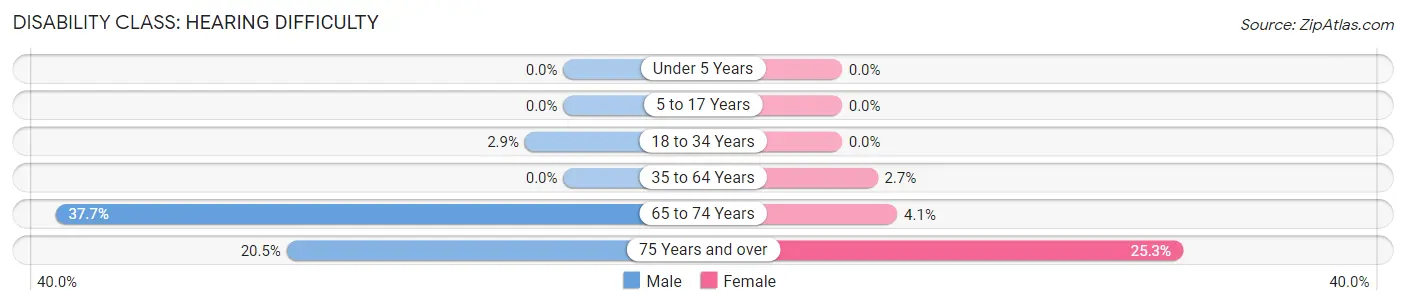
| Age Bracket | Male | Female |
| Under 5 Years | 0 (0.0%) | 0 (0.0%) |
| 5 to 17 Years | 0 (0.0%) | 0 (0.0%) |
| 18 to 34 Years | 21 (2.9%) | 0 (0.0%) |
| 35 to 64 Years | 0 (0.0%) | 28 (2.6%) |
| 65 to 74 Years | 69 (37.7%) | 9 (4.1%) |
| 75 Years and over | 23 (20.5%) | 39 (25.3%) |
Disability Class: Vision Difficulty
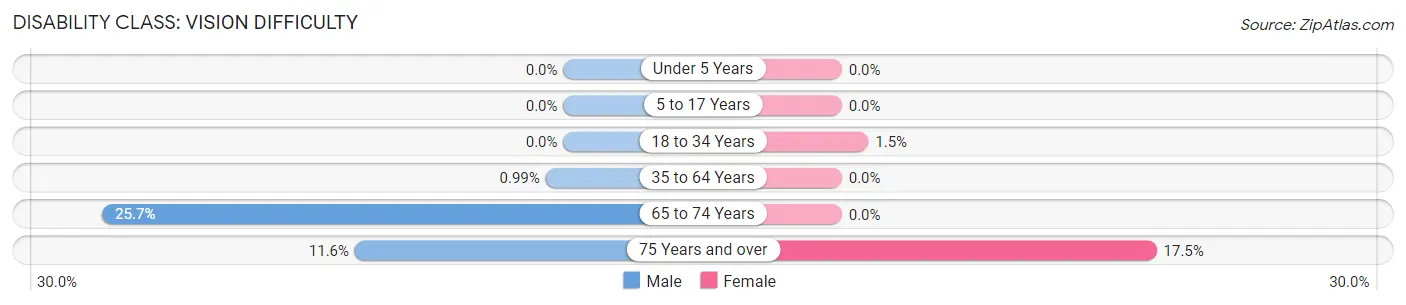
| Age Bracket | Male | Female |
| Under 5 Years | 0 (0.0%) | 0 (0.0%) |
| 5 to 17 Years | 0 (0.0%) | 0 (0.0%) |
| 18 to 34 Years | 0 (0.0%) | 10 (1.5%) |
| 35 to 64 Years | 12 (1.0%) | 0 (0.0%) |
| 65 to 74 Years | 47 (25.7%) | 0 (0.0%) |
| 75 Years and over | 13 (11.6%) | 27 (17.5%) |
Disability Class: Cognitive Difficulty
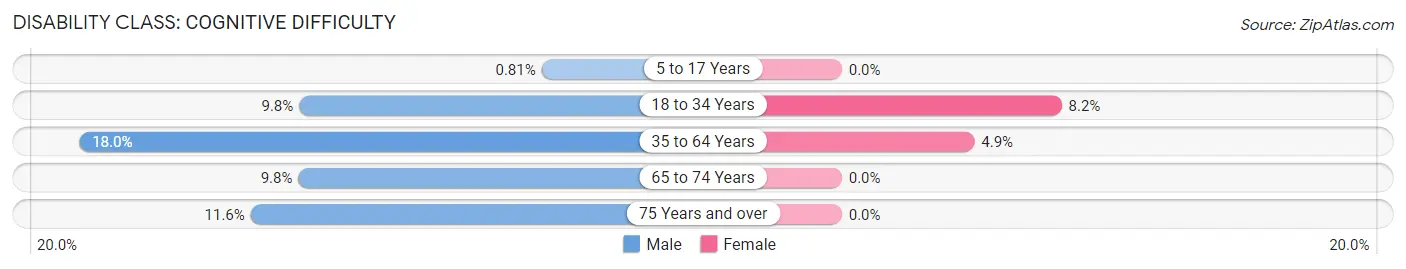
| Age Bracket | Male | Female |
| 5 to 17 Years | 8 (0.8%) | 0 (0.0%) |
| 18 to 34 Years | 72 (9.8%) | 55 (8.2%) |
| 35 to 64 Years | 218 (18.0%) | 52 (4.9%) |
| 65 to 74 Years | 18 (9.8%) | 0 (0.0%) |
| 75 Years and over | 13 (11.6%) | 0 (0.0%) |
Disability Class: Ambulatory Difficulty
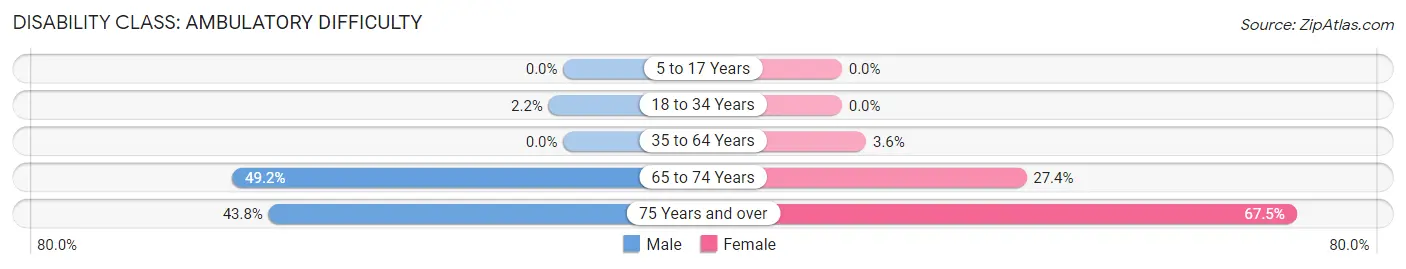
| Age Bracket | Male | Female |
| 5 to 17 Years | 0 (0.0%) | 0 (0.0%) |
| 18 to 34 Years | 16 (2.2%) | 0 (0.0%) |
| 35 to 64 Years | 0 (0.0%) | 38 (3.6%) |
| 65 to 74 Years | 90 (49.2%) | 60 (27.4%) |
| 75 Years and over | 49 (43.8%) | 104 (67.5%) |
Disability Class: Self-Care Difficulty
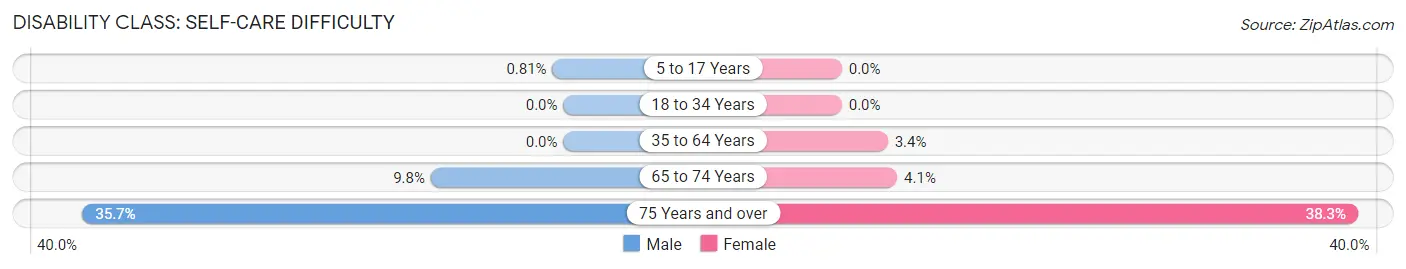
| Age Bracket | Male | Female |
| 5 to 17 Years | 8 (0.8%) | 0 (0.0%) |
| 18 to 34 Years | 0 (0.0%) | 0 (0.0%) |
| 35 to 64 Years | 0 (0.0%) | 36 (3.4%) |
| 65 to 74 Years | 18 (9.8%) | 9 (4.1%) |
| 75 Years and over | 40 (35.7%) | 59 (38.3%) |
Technology Access in Nephi
Computing Device Access in Nephi
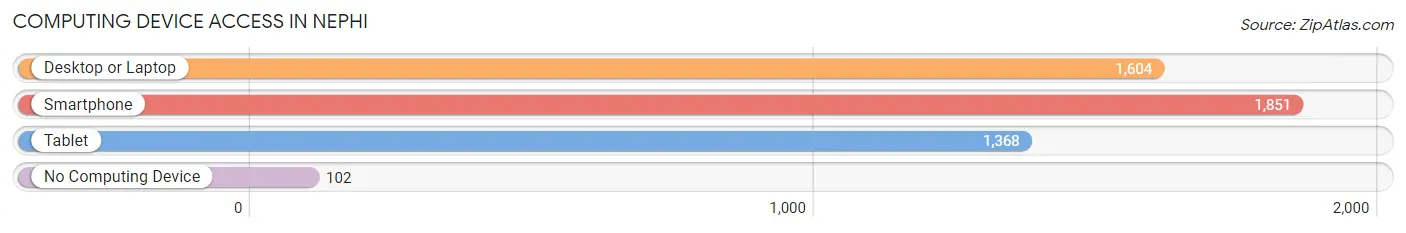
| Device Type | # Households | % Households |
| Desktop or Laptop | 1,604 | 78.6% |
| Smartphone | 1,851 | 90.7% |
| Tablet | 1,368 | 67.1% |
| No Computing Device | 102 | 5.0% |
| Total | 2,040 | 100.0% |
Internet Access in Nephi
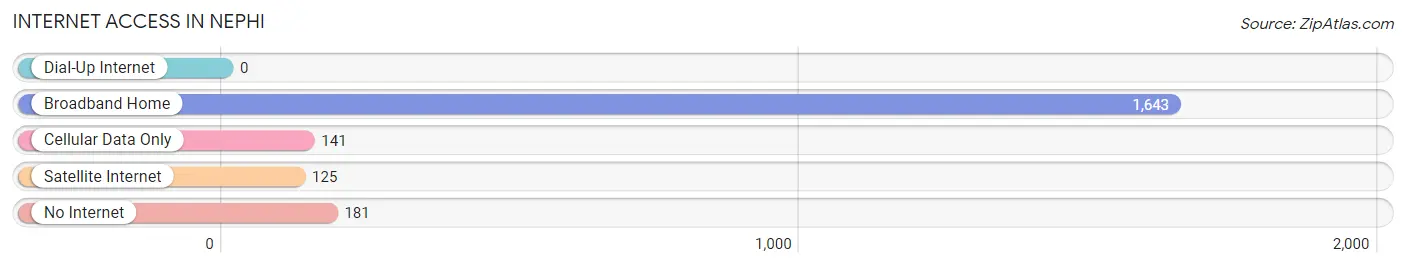
| Internet Type | # Households | % Households |
| Dial-Up Internet | 0 | 0.0% |
| Broadband Home | 1,643 | 80.5% |
| Cellular Data Only | 141 | 6.9% |
| Satellite Internet | 125 | 6.1% |
| No Internet | 181 | 8.9% |
| Total | 2,040 | 100.0% |
Nephi Summary
Nephi is a city located in Juab County, Utah, United States. It is the county seat of Juab County and is located along the Sevier River, approximately 30 miles south of Provo. The population of Nephi was 4,733 at the 2010 census.
History
Nephi was founded in 1851 by Mormon pioneers, led by Nephi Johnson, who was sent by Brigham Young to establish a settlement in the area. The city was named after the Book of Mormon prophet Nephi. The settlers built a fort and irrigation system to support their farming efforts.
In 1856, the settlers built a grist mill and a sawmill, which allowed them to produce flour and lumber. The city was incorporated in 1877 and became the county seat of Juab County in 1882.
Geography
Nephi is located at 39°43'17" North, 111°51'17" West (39.7214, -111.8547). It is situated at an elevation of 4,890 feet (1,490 m) above sea level.
The city is located in the Juab Valley, which is surrounded by the Wasatch Mountains to the east and the Tintic Mountains to the west. The Sevier River runs through the city, providing irrigation for the surrounding farmland.
Economy
The economy of Nephi is largely based on agriculture. The city is home to several large farms, including the Nephi Farms, which produces a variety of fruits and vegetables. The city is also home to several manufacturing companies, including the Nephi Manufacturing Company, which produces a variety of products, including furniture, clothing, and sporting goods.
Demographics
As of the 2010 census, there were 4,733 people, 1,541 households, and 1,097 families residing in the city. The population density was 1,093.3 people per square mile (422.2/km2). There were 1,717 housing units at an average density of 397.3 per square mile (153.3/km2). The racial makeup of the city was 91.2% White, 0.3% African American, 0.7% Native American, 0.4% Asian, 0.1% Pacific Islander, 5.3% from other races, and 2.1% from two or more races. Hispanic or Latino of any race were 11.2% of the population.
There were 1,541 households, out of which 37.2% had children under the age of 18 living with them, 54.2% were married couples living together, 11.2% had a female householder with no husband present, and 28.7% were non-families. 24.2% of all households were made up of individuals, and 11.2% had someone living alone who was 65 years of age or older. The average household size was 2.90 and the average family size was 3.45.
In the city, the population was spread out, with 30.2% under the age of 18, 9.2% from 18 to 24, 25.2% from 25 to 44, 20.2% from 45 to 64, and 15.2% who were 65 years of age or older. The median age was 34 years. For every 100 females, there were 97.2 males. For every 100 females age 18 and over, there were 94.2 males.
The median income for a household in the city was $37,917, and the median income for a family was $41,917. Males had a median income of $31,250 versus $21,250 for females. The per capita income for the city was $14,917. About 8.2% of families and 10.2% of the population were below the poverty line, including 11.2% of those under age 18 and 8.2% of those age 65 or over.
Common Questions
What is Per Capita Income in Nephi?
Per Capita income in Nephi is $33,958.
What is the Median Family Income in Nephi?
Median Family Income in Nephi is $103,009.
What is the Median Household income in Nephi?
Median Household Income in Nephi is $89,026.
What is Income or Wage Gap in Nephi?
Income or Wage Gap in Nephi is 40.6%.
Women in Nephi earn 59.4 cents for every dollar earned by a man.
What is Inequality or Gini Index in Nephi?
Inequality or Gini Index in Nephi is 0.38.
What is the Total Population of Nephi?
Total Population of Nephi is 6,507.
What is the Total Male Population of Nephi?
Total Male Population of Nephi is 3,499.
What is the Total Female Population of Nephi?
Total Female Population of Nephi is 3,008.
What is the Ratio of Males per 100 Females in Nephi?
There are 116.32 Males per 100 Females in Nephi.
What is the Ratio of Females per 100 Males in Nephi?
There are 85.97 Females per 100 Males in Nephi.
What is the Median Population Age in Nephi?
Median Population Age in Nephi is 31.5 Years.
What is the Average Family Size in Nephi
Average Family Size in Nephi is 3.6 People.
What is the Average Household Size in Nephi
Average Household Size in Nephi is 3.1 People.
How Large is the Labor Force in Nephi?
There are 3,221 People in the Labor Forcein in Nephi.
What is the Percentage of People in the Labor Force in Nephi?
68.9% of People are in the Labor Force in Nephi.
What is the Unemployment Rate in Nephi?
Unemployment Rate in Nephi is 0.7%.