Joseph, UT Map & Demographics
Joseph Map
Joseph Overview
$32,360
PER CAPITA INCOME
$77,344
AVG FAMILY INCOME
$73,125
AVG HOUSEHOLD INCOME
29.2%
WAGE / INCOME GAP [ % ]
70.8¢/ $1
WAGE / INCOME GAP [ $ ]
0.44
INEQUALITY / GINI INDEX
558
TOTAL POPULATION
355
MALE POPULATION
203
FEMALE POPULATION
174.88
MALES / 100 FEMALES
57.18
FEMALES / 100 MALES
32.3
MEDIAN AGE
4.4
AVG FAMILY SIZE
4.0
AVG HOUSEHOLD SIZE
301
LABOR FORCE [ PEOPLE ]
66.2%
PERCENT IN LABOR FORCE
11.3%
UNEMPLOYMENT RATE
Joseph Zip Codes
Joseph Area Codes
Income in Joseph
Income Overview in Joseph
Per Capita Income in Joseph is $32,360, while median incomes of families and households are $77,344 and $73,125 respectively.
| Characteristic | Number | Measure |
| Per Capita Income | 558 | $32,360 |
| Median Family Income | 119 | $77,344 |
| Mean Family Income | 119 | $114,990 |
| Median Household Income | 141 | $73,125 |
| Mean Household Income | 141 | $105,925 |
| Income Deficit | 119 | $0 |
| Wage / Income Gap (%) | 558 | 29.22% |
| Wage / Income Gap ($) | 558 | 70.78¢ per $1 |
| Gini / Inequality Index | 558 | 0.44 |
Earnings by Sex in Joseph
Average Earnings in Joseph are $23,309, $17,326 for men and $24,479 for women, a difference of 29.2%.
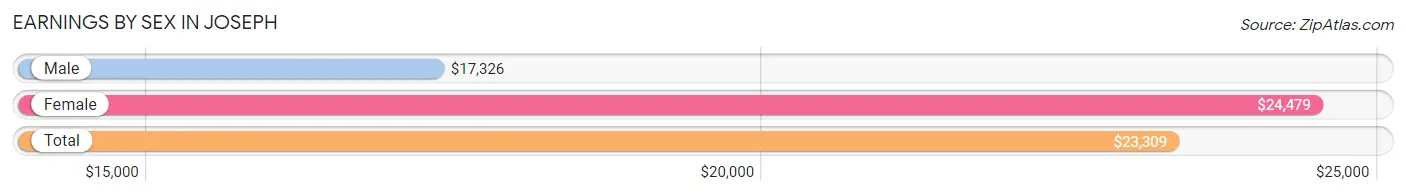
| Sex | Number | Average Earnings |
| Male | 206 (66.7%) | $17,326 |
| Female | 103 (33.3%) | $24,479 |
| Total | 309 (100.0%) | $23,309 |
Earnings by Sex by Income Bracket in Joseph
The most common earnings brackets in Joseph are $15,000 to $17,499 for men (43 | 20.9%) and $2,499 or less for women (21 | 20.4%).
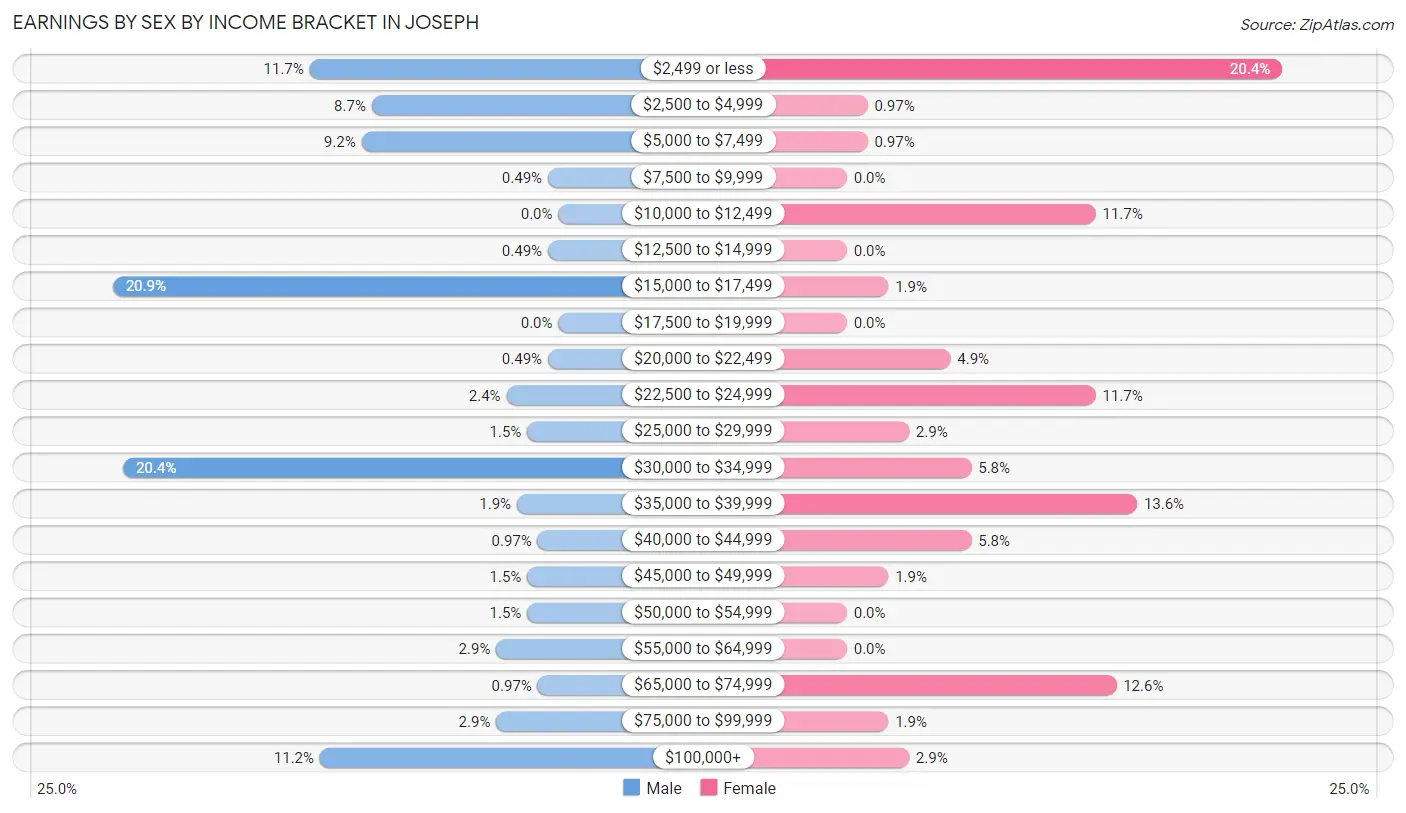
| Income | Male | Female |
| $2,499 or less | 24 (11.7%) | 21 (20.4%) |
| $2,500 to $4,999 | 18 (8.7%) | 1 (1.0%) |
| $5,000 to $7,499 | 19 (9.2%) | 1 (1.0%) |
| $7,500 to $9,999 | 1 (0.5%) | 0 (0.0%) |
| $10,000 to $12,499 | 0 (0.0%) | 12 (11.7%) |
| $12,500 to $14,999 | 1 (0.5%) | 0 (0.0%) |
| $15,000 to $17,499 | 43 (20.9%) | 2 (1.9%) |
| $17,500 to $19,999 | 0 (0.0%) | 0 (0.0%) |
| $20,000 to $22,499 | 1 (0.5%) | 5 (4.9%) |
| $22,500 to $24,999 | 5 (2.4%) | 12 (11.7%) |
| $25,000 to $29,999 | 3 (1.5%) | 3 (2.9%) |
| $30,000 to $34,999 | 42 (20.4%) | 6 (5.8%) |
| $35,000 to $39,999 | 4 (1.9%) | 14 (13.6%) |
| $40,000 to $44,999 | 2 (1.0%) | 6 (5.8%) |
| $45,000 to $49,999 | 3 (1.5%) | 2 (1.9%) |
| $50,000 to $54,999 | 3 (1.5%) | 0 (0.0%) |
| $55,000 to $64,999 | 6 (2.9%) | 0 (0.0%) |
| $65,000 to $74,999 | 2 (1.0%) | 13 (12.6%) |
| $75,000 to $99,999 | 6 (2.9%) | 2 (1.9%) |
| $100,000+ | 23 (11.2%) | 3 (2.9%) |
| Total | 206 (100.0%) | 103 (100.0%) |
Earnings by Sex by Educational Attainment in Joseph
Average earnings in Joseph are $31,591 for men and $24,125 for women, a difference of 23.6%. Men with an educational attainment of high school diploma enjoy the highest average annual earnings of $31,591, while those with college or associate's degree education earn the least with $27,917. Women with an educational attainment of college or associate's degree earn the most with the average annual earnings of $23,875, while those with bachelor's degree education have the smallest earnings of $2,499.
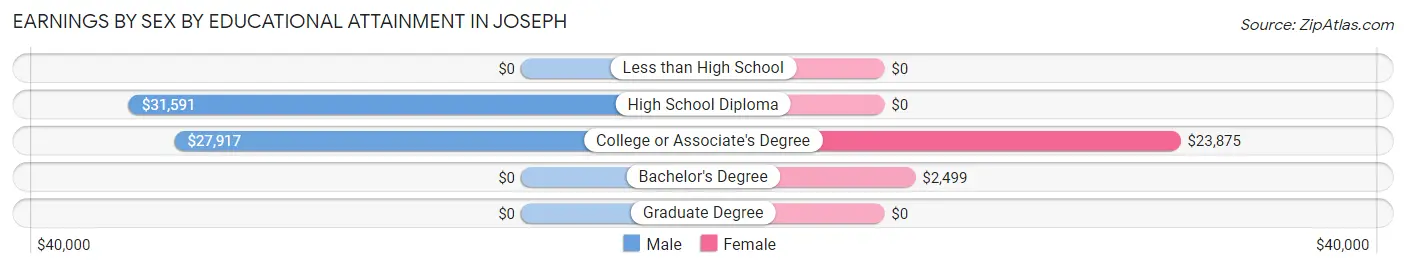
| Educational Attainment | Male Income | Female Income |
| Less than High School | - | - |
| High School Diploma | $31,591 | $0 |
| College or Associate's Degree | $27,917 | $23,875 |
| Bachelor's Degree | - | - |
| Graduate Degree | - | - |
| Total | $31,591 | $24,125 |
Family Income in Joseph
Family Income Brackets in Joseph
According to the Joseph family income data, there are 30 families falling into the $50,000 to $74,999 income range, which is the most common income bracket and makes up 25.2% of all families.
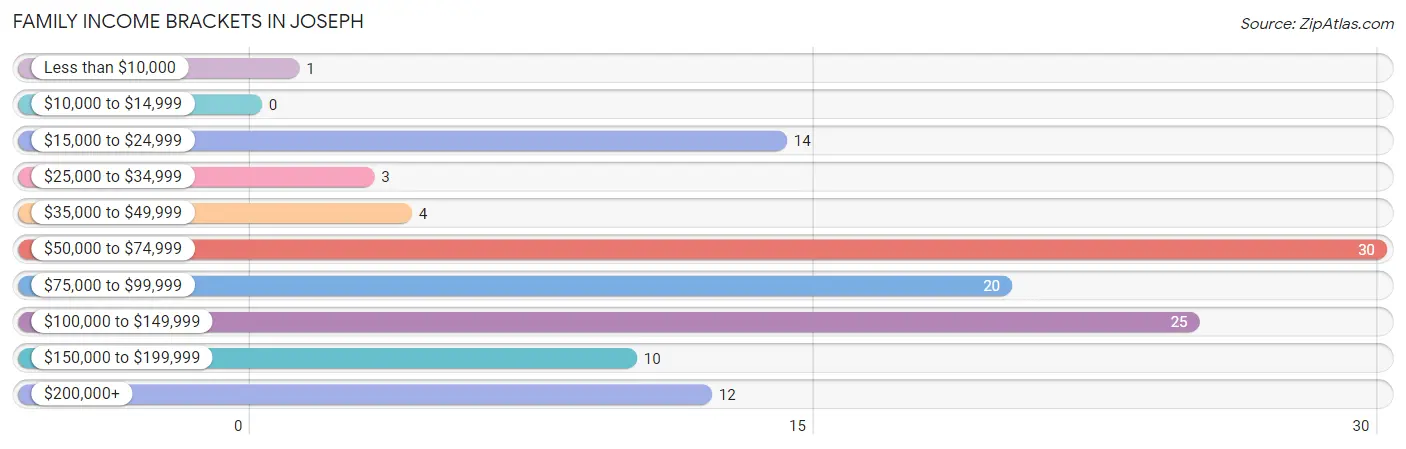
| Income Bracket | # Families | % Families |
| Less than $10,000 | 1 | 0.8% |
| $10,000 to $14,999 | 0 | 0.0% |
| $15,000 to $24,999 | 14 | 11.8% |
| $25,000 to $34,999 | 3 | 2.5% |
| $35,000 to $49,999 | 4 | 3.4% |
| $50,000 to $74,999 | 30 | 25.2% |
| $75,000 to $99,999 | 20 | 16.8% |
| $100,000 to $149,999 | 25 | 21.0% |
| $150,000 to $199,999 | 10 | 8.4% |
| $200,000+ | 12 | 10.1% |
Family Income by Famaliy Size in Joseph
4-person families (15 | 12.6%) account for the highest median family income in Joseph with $145,417 per family, while 2-person families (62 | 52.1%) have the highest median income of $37,678 per family member.
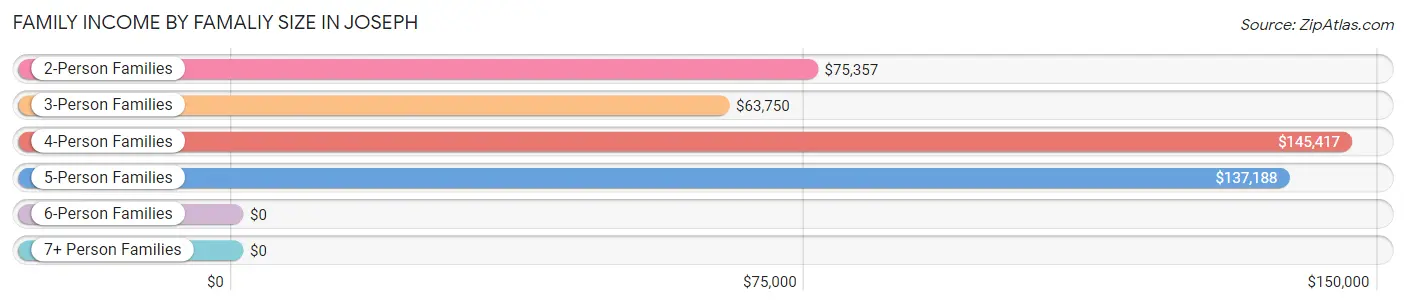
| Income Bracket | # Families | Median Income |
| 2-Person Families | 62 (52.1%) | $75,357 |
| 3-Person Families | 17 (14.3%) | $63,750 |
| 4-Person Families | 15 (12.6%) | $145,417 |
| 5-Person Families | 7 (5.9%) | $137,188 |
| 6-Person Families | 3 (2.5%) | $0 |
| 7+ Person Families | 15 (12.6%) | $0 |
| Total | 119 (100.0%) | $77,344 |
Family Income by Number of Earners in Joseph
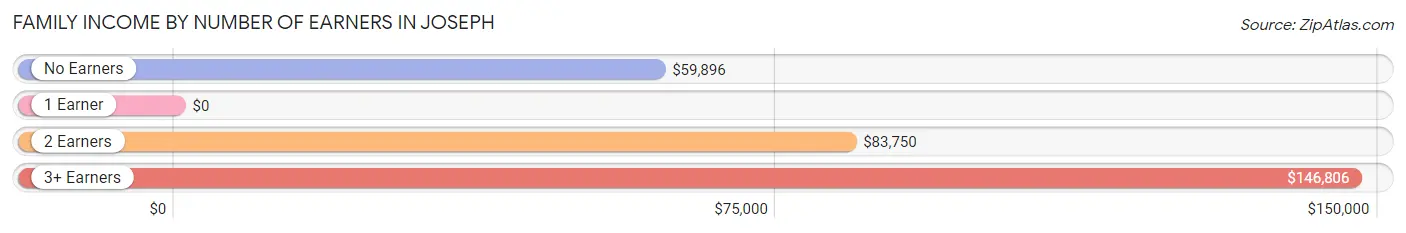
| Number of Earners | # Families | Median Income |
| No Earners | 27 (22.7%) | $59,896 |
| 1 Earner | 27 (22.7%) | $0 |
| 2 Earners | 40 (33.6%) | $83,750 |
| 3+ Earners | 25 (21.0%) | $146,806 |
| Total | 119 (100.0%) | $77,344 |
Household Income in Joseph
Household Income Brackets in Joseph
With 41 households falling in the category, the $50,000 to $74,999 income range is the most frequent in Joseph, accounting for 29.1% of all households. In contrast, only 1 households (0.7%) fall into the less than $10,000 income bracket, making it the least populous group.
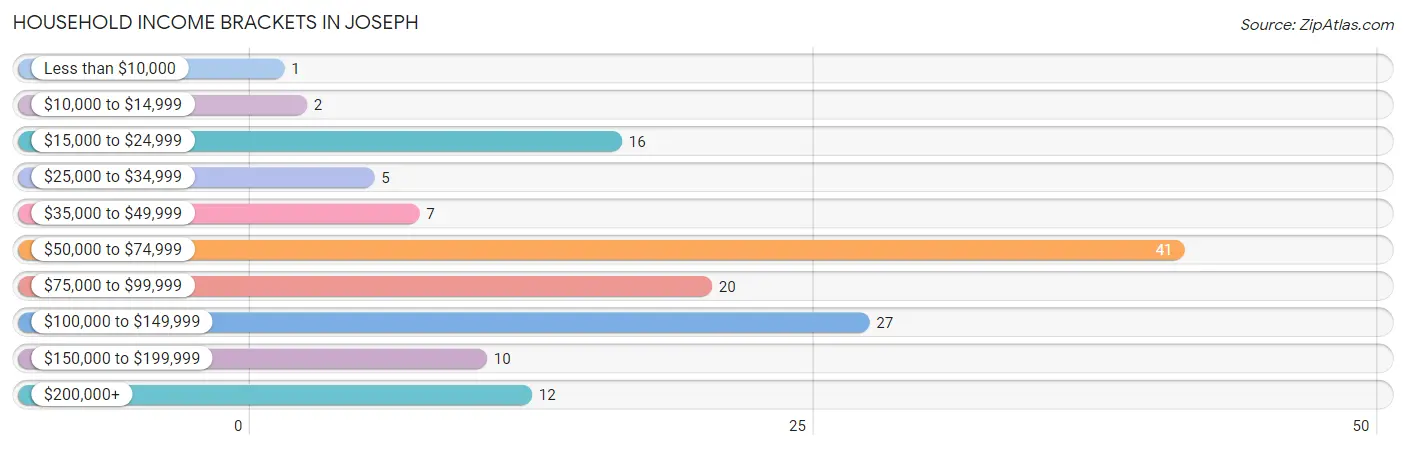
| Income Bracket | # Households | % Households |
| Less than $10,000 | 1 | 0.7% |
| $10,000 to $14,999 | 2 | 1.4% |
| $15,000 to $24,999 | 16 | 11.3% |
| $25,000 to $34,999 | 5 | 3.5% |
| $35,000 to $49,999 | 7 | 5.0% |
| $50,000 to $74,999 | 41 | 29.1% |
| $75,000 to $99,999 | 20 | 14.2% |
| $100,000 to $149,999 | 27 | 19.1% |
| $150,000 to $199,999 | 10 | 7.1% |
| $200,000+ | 12 | 8.5% |
Household Income by Householder Age in Joseph
The median household income in Joseph is $73,125, with the highest median household income of $80,000 found in the 25 to 44 years age bracket for the primary householder. A total of 34 households (24.1%) fall into this category. Meanwhile, the 65+ years age bracket for the primary householder has the lowest median household income of $66,750, with 67 households (47.5%) in this group.
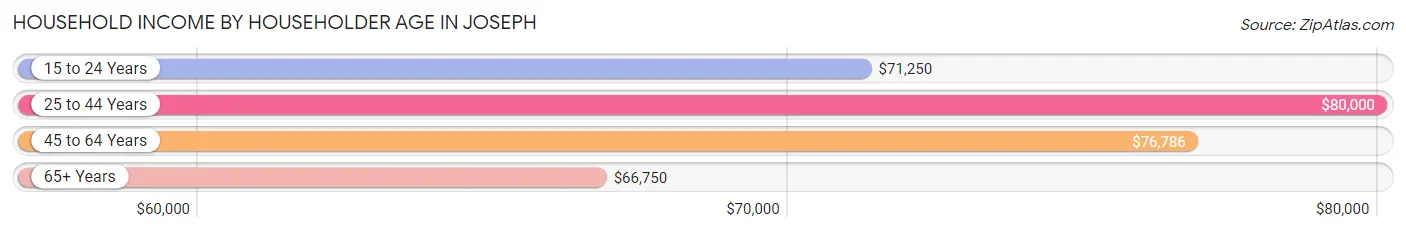
| Income Bracket | # Households | Median Income |
| 15 to 24 Years | 10 (7.1%) | $71,250 |
| 25 to 44 Years | 34 (24.1%) | $80,000 |
| 45 to 64 Years | 30 (21.3%) | $76,786 |
| 65+ Years | 67 (47.5%) | $66,750 |
| Total | 141 (100.0%) | $73,125 |
Poverty in Joseph
Income Below Poverty by Sex and Age in Joseph
With 10.4% poverty level for males and 21.2% for females among the residents of Joseph, 15 year old males and under 5 year old females are the most vulnerable to poverty, with 14 males (73.7%) and 8 females (80.0%) in their respective age groups living below the poverty level.
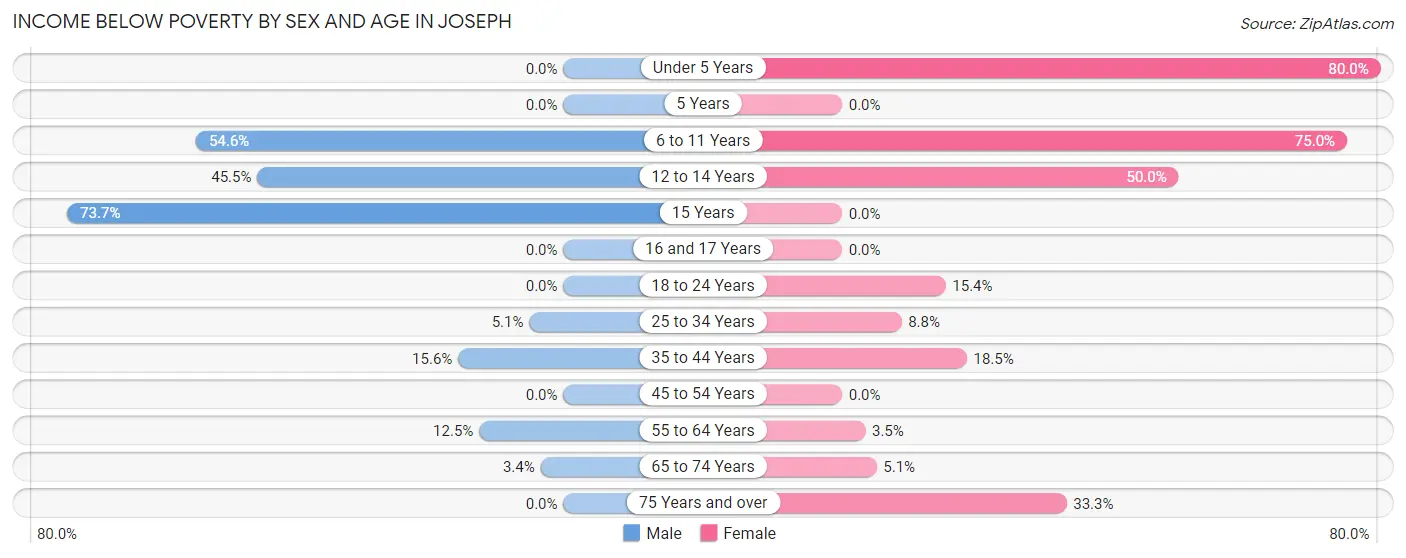
| Age Bracket | Male | Female |
| Under 5 Years | 0 (0.0%) | 8 (80.0%) |
| 5 Years | 0 (0.0%) | 0 (0.0%) |
| 6 to 11 Years | 6 (54.5%) | 15 (75.0%) |
| 12 to 14 Years | 5 (45.5%) | 5 (50.0%) |
| 15 Years | 14 (73.7%) | 0 (0.0%) |
| 16 and 17 Years | 0 (0.0%) | 0 (0.0%) |
| 18 to 24 Years | 0 (0.0%) | 2 (15.4%) |
| 25 to 34 Years | 4 (5.1%) | 3 (8.8%) |
| 35 to 44 Years | 5 (15.6%) | 5 (18.5%) |
| 45 to 54 Years | 0 (0.0%) | 0 (0.0%) |
| 55 to 64 Years | 1 (12.5%) | 1 (3.5%) |
| 65 to 74 Years | 2 (3.4%) | 2 (5.1%) |
| 75 Years and over | 0 (0.0%) | 2 (33.3%) |
| Total | 37 (10.4%) | 43 (21.2%) |
Income Above Poverty by Sex and Age in Joseph
According to the poverty statistics in Joseph, males aged under 5 years and females aged 15 years are the age groups that are most secure financially, with 100.0% of males and 100.0% of females in these age groups living above the poverty line.
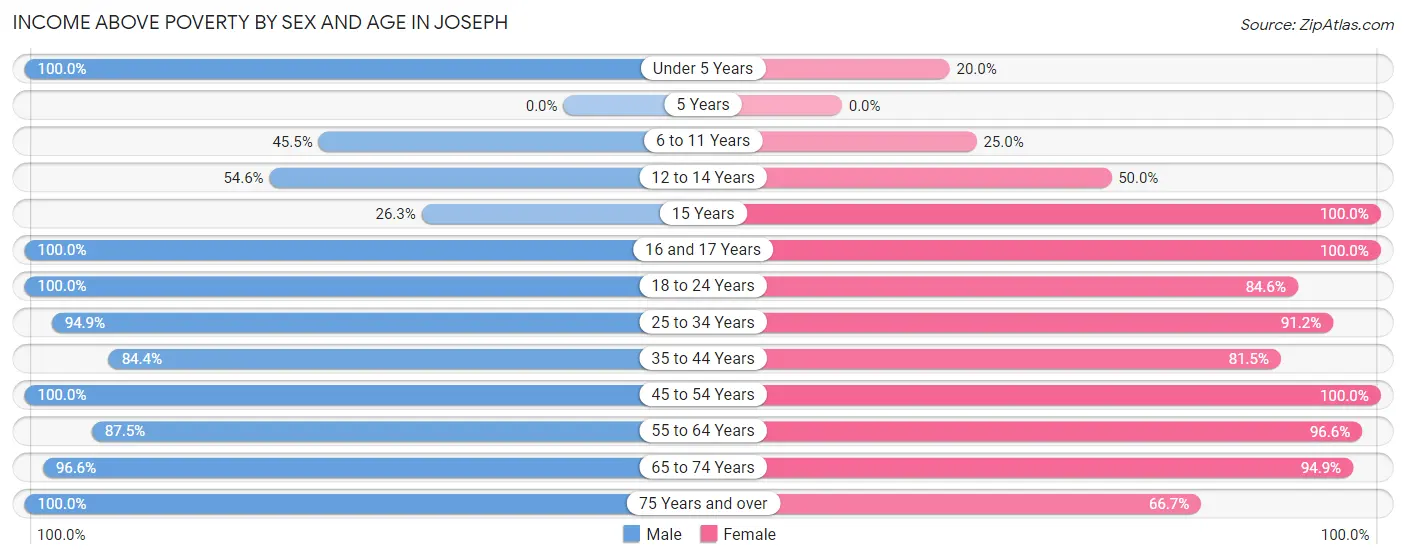
| Age Bracket | Male | Female |
| Under 5 Years | 20 (100.0%) | 2 (20.0%) |
| 5 Years | 0 (0.0%) | 0 (0.0%) |
| 6 to 11 Years | 5 (45.5%) | 5 (25.0%) |
| 12 to 14 Years | 6 (54.5%) | 5 (50.0%) |
| 15 Years | 5 (26.3%) | 2 (100.0%) |
| 16 and 17 Years | 21 (100.0%) | 1 (100.0%) |
| 18 to 24 Years | 66 (100.0%) | 11 (84.6%) |
| 25 to 34 Years | 75 (94.9%) | 31 (91.2%) |
| 35 to 44 Years | 27 (84.4%) | 22 (81.5%) |
| 45 to 54 Years | 25 (100.0%) | 12 (100.0%) |
| 55 to 64 Years | 7 (87.5%) | 28 (96.6%) |
| 65 to 74 Years | 57 (96.6%) | 37 (94.9%) |
| 75 Years and over | 4 (100.0%) | 4 (66.7%) |
| Total | 318 (89.6%) | 160 (78.8%) |
Income Below Poverty Among Married-Couple Families in Joseph
The poverty statistics for married-couple families in Joseph show that 8.9% or 9 of the total 101 families live below the poverty line. Families with 5 or more children have the highest poverty rate of 100.0%, comprising of 5 families. On the other hand, families with 1 or 2 children have the lowest poverty rate of 0.0%, which includes 0 families.
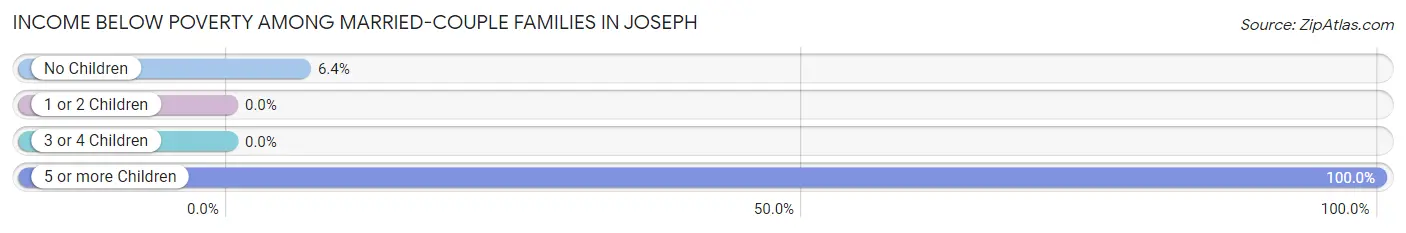
| Children | Above Poverty | Below Poverty |
| No Children | 59 (93.6%) | 4 (6.4%) |
| 1 or 2 Children | 31 (100.0%) | 0 (0.0%) |
| 3 or 4 Children | 2 (100.0%) | 0 (0.0%) |
| 5 or more Children | 0 (0.0%) | 5 (100.0%) |
| Total | 92 (91.1%) | 9 (8.9%) |
Income Below Poverty Among Single-Parent Households in Joseph
According to the poverty data in Joseph, 100.0% or 1 single-father households and 23.5% or 4 single-mother households are living below the poverty line. Among single-father households, those with 1 or 2 children have the highest poverty rate, with 1 households (100.0%) experiencing poverty. Likewise, among single-mother households, those with 1 or 2 children have the highest poverty rate, with 3 households (50.0%) falling below the poverty line.
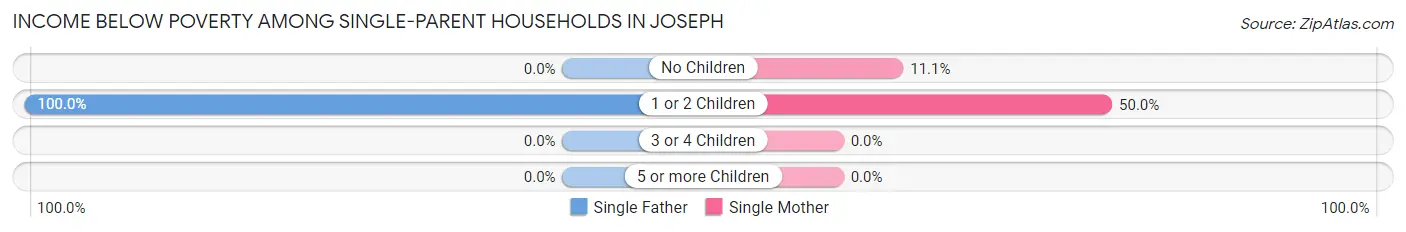
| Children | Single Father | Single Mother |
| No Children | 0 (0.0%) | 1 (11.1%) |
| 1 or 2 Children | 1 (100.0%) | 3 (50.0%) |
| 3 or 4 Children | 0 (0.0%) | 0 (0.0%) |
| 5 or more Children | 0 (0.0%) | 0 (0.0%) |
| Total | 1 (100.0%) | 4 (23.5%) |
Income Below Poverty Among Married-Couple vs Single-Parent Households in Joseph
The poverty data for Joseph shows that 9 of the married-couple family households (8.9%) and 5 of the single-parent households (27.8%) are living below the poverty level. Within the married-couple family households, those with 5 or more children have the highest poverty rate, with 5 households (100.0%) falling below the poverty line. Among the single-parent households, those with 1 or 2 children have the highest poverty rate, with 4 household (57.1%) living below poverty.
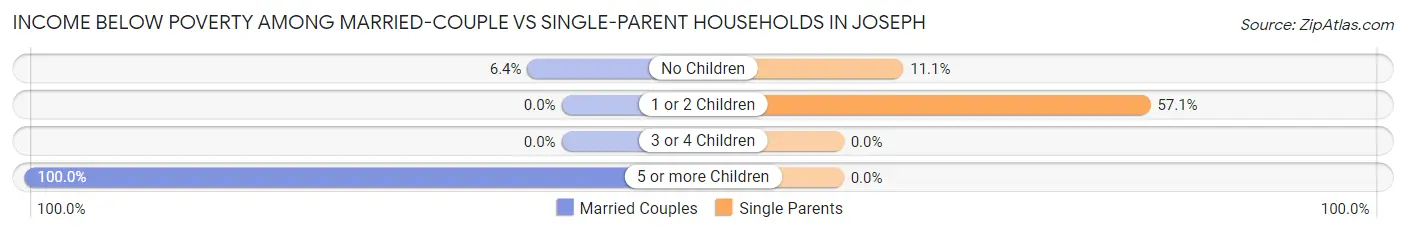
| Children | Married-Couple Families | Single-Parent Households |
| No Children | 4 (6.4%) | 1 (11.1%) |
| 1 or 2 Children | 0 (0.0%) | 4 (57.1%) |
| 3 or 4 Children | 0 (0.0%) | 0 (0.0%) |
| 5 or more Children | 5 (100.0%) | 0 (0.0%) |
| Total | 9 (8.9%) | 5 (27.8%) |
Race in Joseph
The most populous races in Joseph are White / Caucasian (527 | 94.4%), Two or more Races (27 | 4.8%), and Hispanic or Latino (14 | 2.5%).
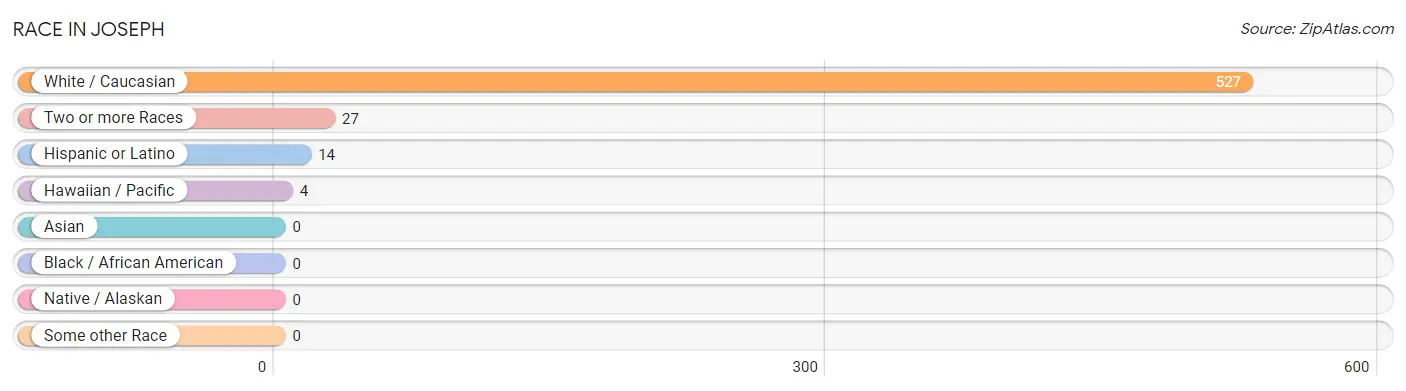
| Race | # Population | % Population |
| Asian | 0 | 0.0% |
| Black / African American | 0 | 0.0% |
| Hawaiian / Pacific | 4 | 0.7% |
| Hispanic or Latino | 14 | 2.5% |
| Native / Alaskan | 0 | 0.0% |
| White / Caucasian | 527 | 94.4% |
| Two or more Races | 27 | 4.8% |
| Some other Race | 0 | 0.0% |
| Total | 558 | 100.0% |
Ancestry in Joseph
The most populous ancestries reported in Joseph are English (130 | 23.3%), Irish (45 | 8.1%), German (43 | 7.7%), Norwegian (34 | 6.1%), and Portuguese (24 | 4.3%), together accounting for 49.5% of all Joseph residents.
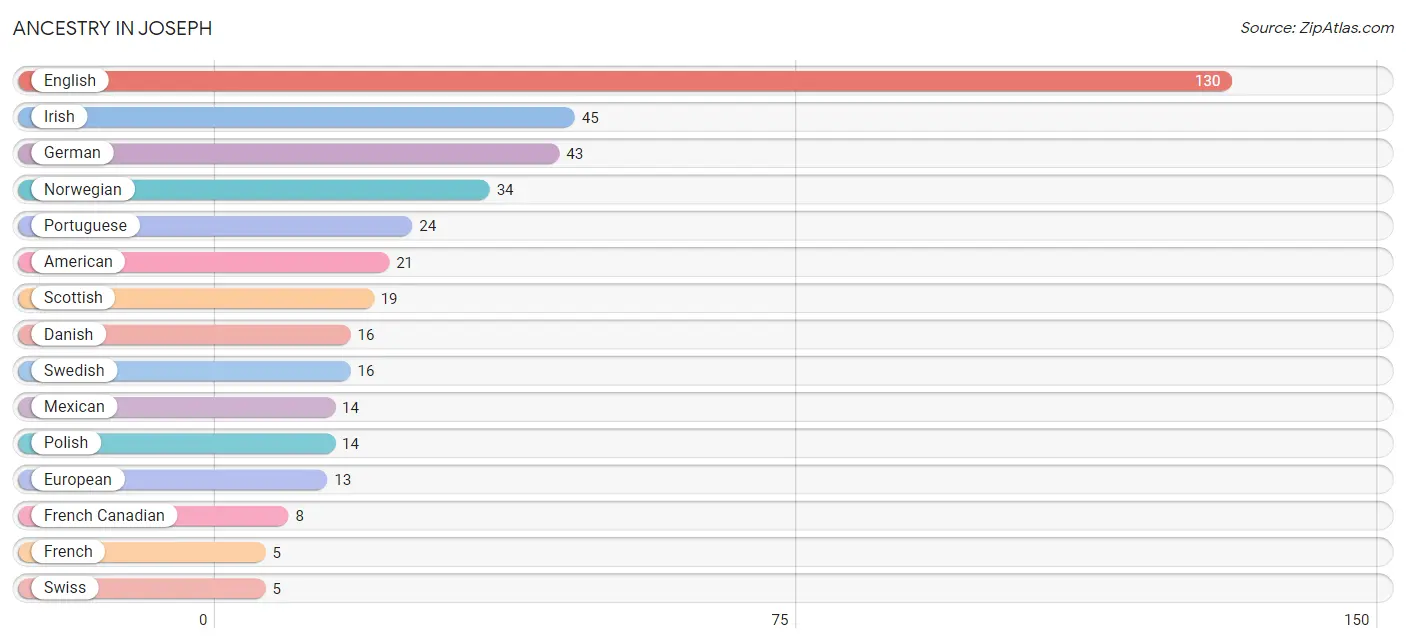
| Ancestry | # Population | % Population |
| American | 21 | 3.8% |
| Danish | 16 | 2.9% |
| Dutch | 3 | 0.5% |
| English | 130 | 23.3% |
| European | 13 | 2.3% |
| French | 5 | 0.9% |
| French Canadian | 8 | 1.4% |
| German | 43 | 7.7% |
| Irish | 45 | 8.1% |
| Mexican | 14 | 2.5% |
| Native Hawaiian | 4 | 0.7% |
| Norwegian | 34 | 6.1% |
| Polish | 14 | 2.5% |
| Portuguese | 24 | 4.3% |
| Scandinavian | 2 | 0.4% |
| Scottish | 19 | 3.4% |
| Swedish | 16 | 2.9% |
| Swiss | 5 | 0.9% |
| Welsh | 2 | 0.4% | View All 19 Rows |
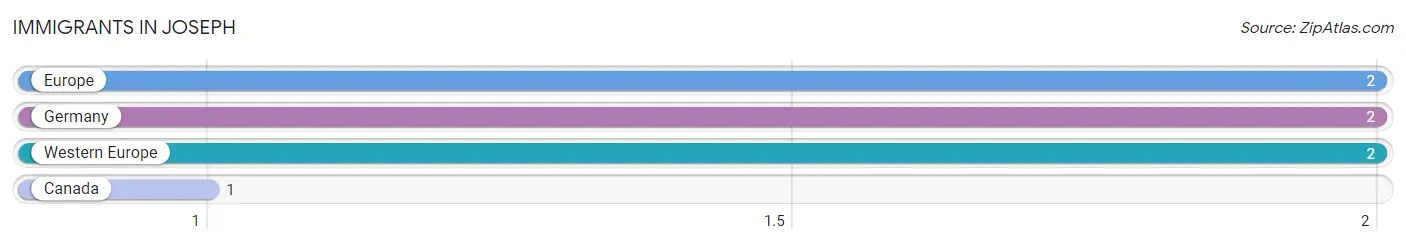
Immigrants in Joseph
The most numerous immigrant groups reported in Joseph came from Europe (2 | 0.4%), Germany (2 | 0.4%), Western Europe (2 | 0.4%), and Canada (1 | 0.2%), together accounting for 1.3% of all Joseph residents.
| Immigration Origin | # Population | % Population |
| Canada | 1 | 0.2% |
| Europe | 2 | 0.4% |
| Germany | 2 | 0.4% |
| Western Europe | 2 | 0.4% | View All 4 Rows |
Sex and Age in Joseph
Sex and Age in Joseph
The most populous age groups in Joseph are 20 to 24 Years (62 | 17.5%) for men and 65 to 69 Years (26 | 12.8%) for women.
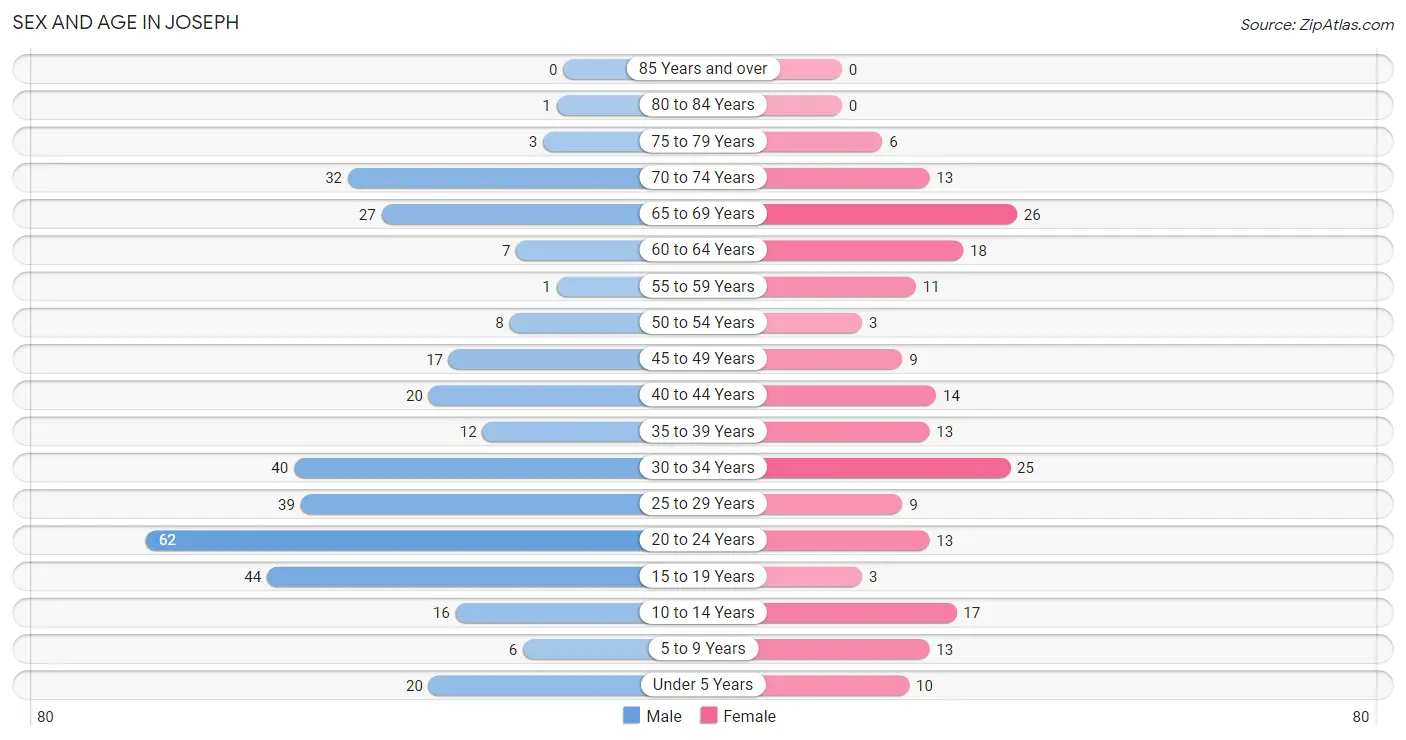
| Age Bracket | Male | Female |
| Under 5 Years | 20 (5.6%) | 10 (4.9%) |
| 5 to 9 Years | 6 (1.7%) | 13 (6.4%) |
| 10 to 14 Years | 16 (4.5%) | 17 (8.4%) |
| 15 to 19 Years | 44 (12.4%) | 3 (1.5%) |
| 20 to 24 Years | 62 (17.5%) | 13 (6.4%) |
| 25 to 29 Years | 39 (11.0%) | 9 (4.4%) |
| 30 to 34 Years | 40 (11.3%) | 25 (12.3%) |
| 35 to 39 Years | 12 (3.4%) | 13 (6.4%) |
| 40 to 44 Years | 20 (5.6%) | 14 (6.9%) |
| 45 to 49 Years | 17 (4.8%) | 9 (4.4%) |
| 50 to 54 Years | 8 (2.2%) | 3 (1.5%) |
| 55 to 59 Years | 1 (0.3%) | 11 (5.4%) |
| 60 to 64 Years | 7 (2.0%) | 18 (8.9%) |
| 65 to 69 Years | 27 (7.6%) | 26 (12.8%) |
| 70 to 74 Years | 32 (9.0%) | 13 (6.4%) |
| 75 to 79 Years | 3 (0.9%) | 6 (3.0%) |
| 80 to 84 Years | 1 (0.3%) | 0 (0.0%) |
| 85 Years and over | 0 (0.0%) | 0 (0.0%) |
| Total | 355 (100.0%) | 203 (100.0%) |
Families and Households in Joseph
Median Family Size in Joseph
The median family size in Joseph is 4.40 persons per family, with married-couple families (101 | 84.9%) accounting for the largest median family size of 4.53 persons per family. On the other hand, single male/father families (1 | 0.8%) represent the smallest median family size with 3.00 persons per family.
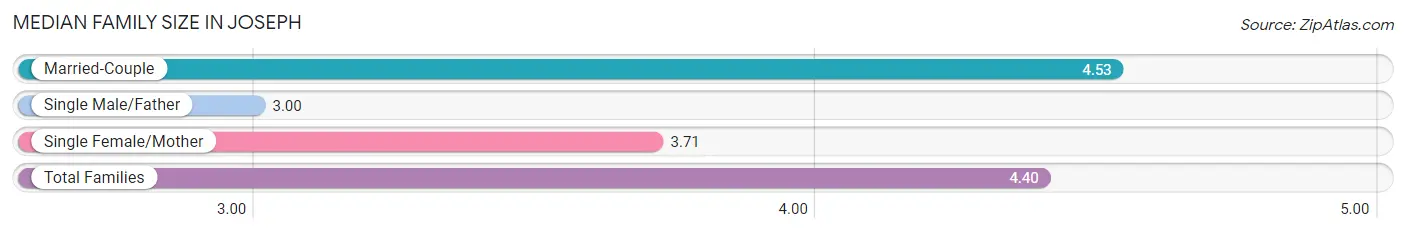
| Family Type | # Families | Family Size |
| Married-Couple | 101 (84.9%) | 4.53 |
| Single Male/Father | 1 (0.8%) | 3.00 |
| Single Female/Mother | 17 (14.3%) | 3.71 |
| Total Families | 119 (100.0%) | 4.40 |
Median Household Size in Joseph
The median household size in Joseph is 3.96 persons per household, with married-couple households (101 | 71.6%) accounting for the largest median household size of 4.55 persons per household. non-family households (22 | 15.6%) represent the smallest median household size with 1.23 persons per household.
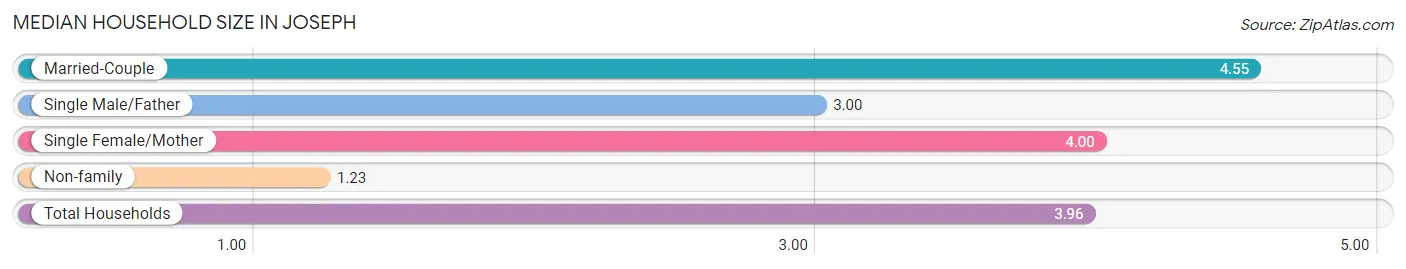
| Household Type | # Households | Household Size |
| Married-Couple | 101 (71.6%) | 4.55 |
| Single Male/Father | 1 (0.7%) | 3.00 |
| Single Female/Mother | 17 (12.1%) | 4.00 |
| Non-family | 22 (15.6%) | 1.23 |
| Total Households | 141 (100.0%) | 3.96 |
Household Size by Marriage Status in Joseph
Out of a total of 141 households in Joseph, 119 (84.4%) are family households, while 22 (15.6%) are nonfamily households. The most numerous type of family households are 2-person households, comprising 62, and the most common type of nonfamily households are 1-person households, comprising 15.
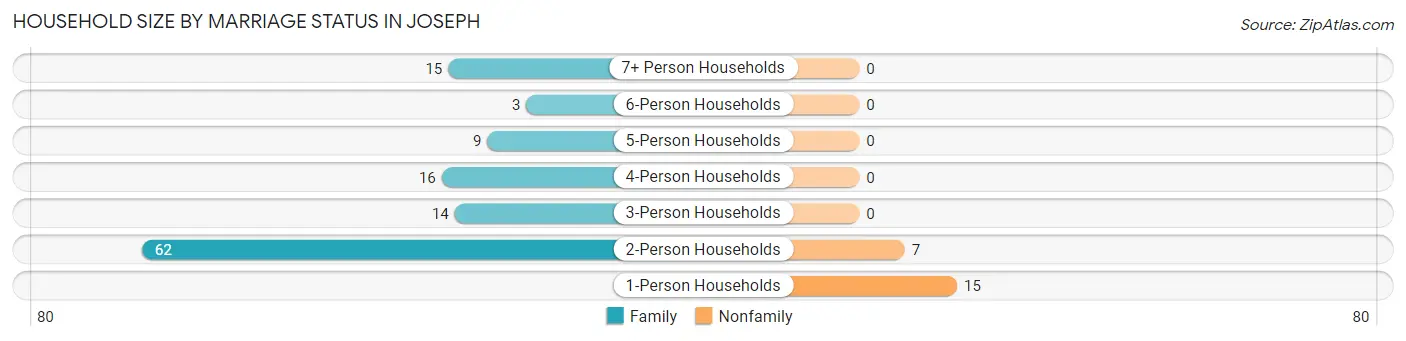
| Household Size | Family Households | Nonfamily Households |
| 1-Person Households | - | 15 (10.6%) |
| 2-Person Households | 62 (44.0%) | 7 (5.0%) |
| 3-Person Households | 14 (9.9%) | 0 (0.0%) |
| 4-Person Households | 16 (11.4%) | 0 (0.0%) |
| 5-Person Households | 9 (6.4%) | 0 (0.0%) |
| 6-Person Households | 3 (2.1%) | 0 (0.0%) |
| 7+ Person Households | 15 (10.6%) | 0 (0.0%) |
| Total | 119 (84.4%) | 22 (15.6%) |
Female Fertility in Joseph
Fertility by Age in Joseph
Average fertility rate in Joseph is 69.0 births per 1,000 women. Women in the age bracket of 20 to 34 years have the highest fertility rate with 128.0 births per 1,000 women. Women in the age bracket of 20 to 34 years acount for 100.0% of all women with births.
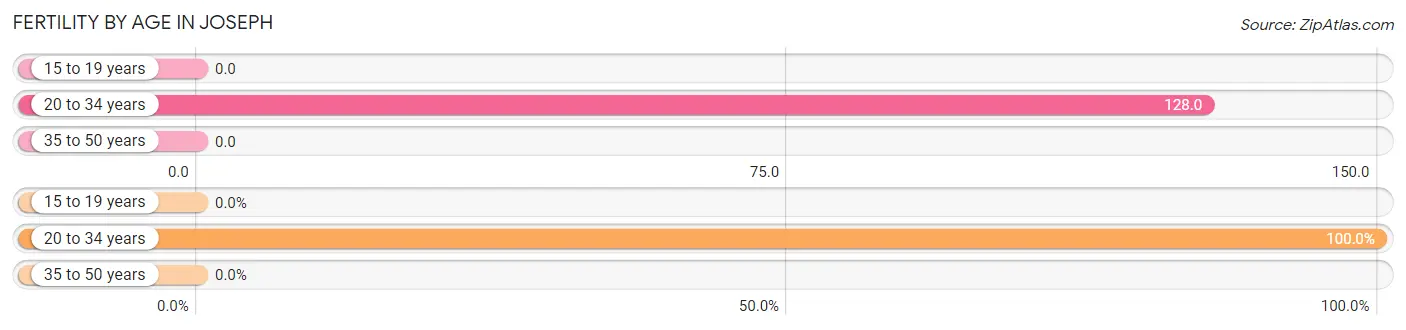
| Age Bracket | Women with Births | Births / 1,000 Women |
| 15 to 19 years | 0 (0.0%) | 0.0 |
| 20 to 34 years | 6 (100.0%) | 128.0 |
| 35 to 50 years | 0 (0.0%) | 0.0 |
| Total | 6 (100.0%) | 69.0 |
Fertility by Age by Marriage Status in Joseph
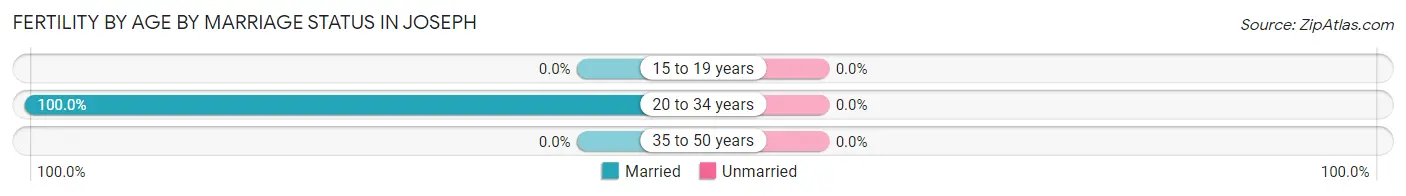
| Age Bracket | Married | Unmarried |
| 15 to 19 years | 0 (0.0%) | 0 (0.0%) |
| 20 to 34 years | 6 (100.0%) | 0 (0.0%) |
| 35 to 50 years | 0 (0.0%) | 0 (0.0%) |
| Total | 6 (100.0%) | 0 (0.0%) |
Fertility by Education in Joseph
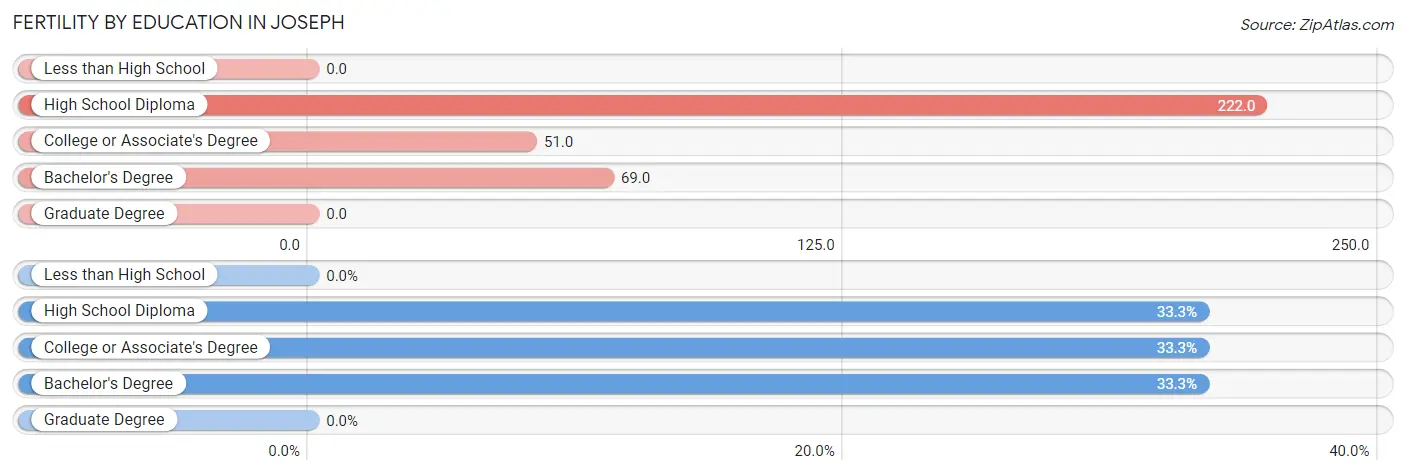
| Educational Attainment | Women with Births | Births / 1,000 Women |
| Less than High School | 0 (0.0%) | 0.0 |
| High School Diploma | 2 (33.3%) | 222.0 |
| College or Associate's Degree | 2 (33.3%) | 51.0 |
| Bachelor's Degree | 2 (33.3%) | 69.0 |
| Graduate Degree | 0 (0.0%) | 0.0 |
| Total | 6 (100.0%) | 69.0 |
Fertility by Education by Marriage Status in Joseph
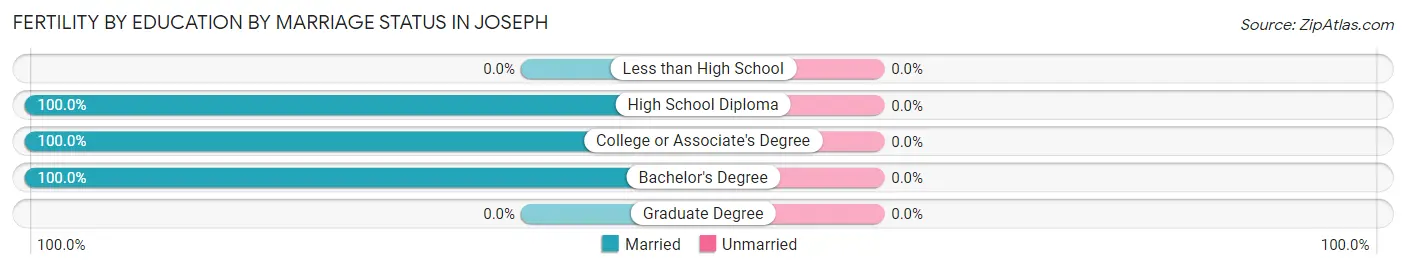
| Educational Attainment | Married | Unmarried |
| Less than High School | 0 (0.0%) | 0 (0.0%) |
| High School Diploma | 2 (100.0%) | 0 (0.0%) |
| College or Associate's Degree | 2 (100.0%) | 0 (0.0%) |
| Bachelor's Degree | 2 (100.0%) | 0 (0.0%) |
| Graduate Degree | 0 (0.0%) | 0 (0.0%) |
| Total | 6 (100.0%) | 0 (0.0%) |
Employment Characteristics in Joseph
Employment by Class of Employer in Joseph
Among the 259 employed individuals in Joseph, private company employees (154 | 59.5%), not-for-profit organizations (26 | 10.0%), and self-employed (not incorporated) (25 | 9.7%) make up the most common classes of employment.
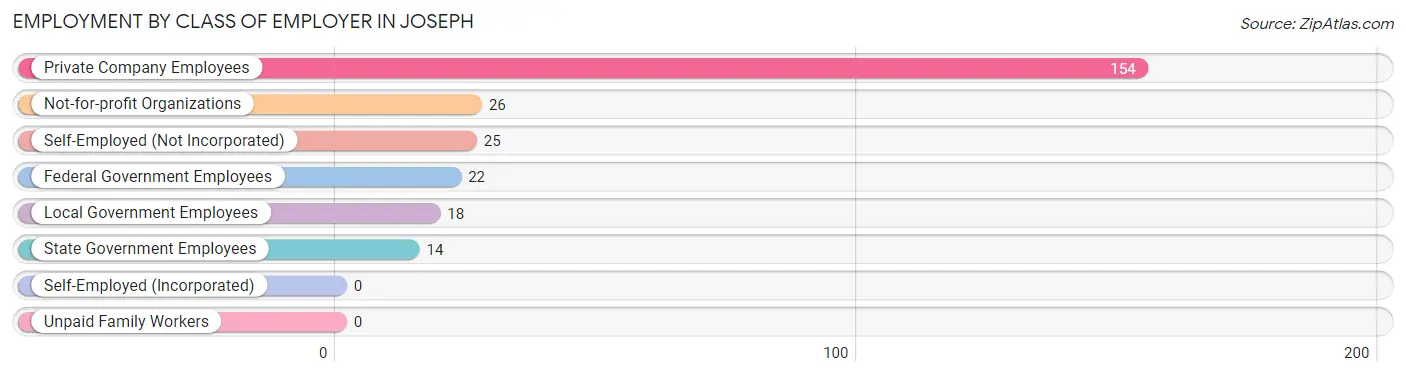
| Employer Class | # Employees | % Employees |
| Private Company Employees | 154 | 59.5% |
| Self-Employed (Incorporated) | 0 | 0.0% |
| Self-Employed (Not Incorporated) | 25 | 9.7% |
| Not-for-profit Organizations | 26 | 10.0% |
| Local Government Employees | 18 | 7.0% |
| State Government Employees | 14 | 5.4% |
| Federal Government Employees | 22 | 8.5% |
| Unpaid Family Workers | 0 | 0.0% |
| Total | 259 | 100.0% |
Employment Status by Age in Joseph
According to the labor force statistics for Joseph, out of the total population over 16 years of age (455), 66.2% or 301 individuals are in the labor force, with 11.3% or 34 of them unemployed. The age group with the highest labor force participation rate is 20 to 24 years, with 93.3% or 70 individuals in the labor force. Within the labor force, the 30 to 34 years age range has the highest percentage of unemployed individuals, with 39.6% or 19 of them being unemployed.
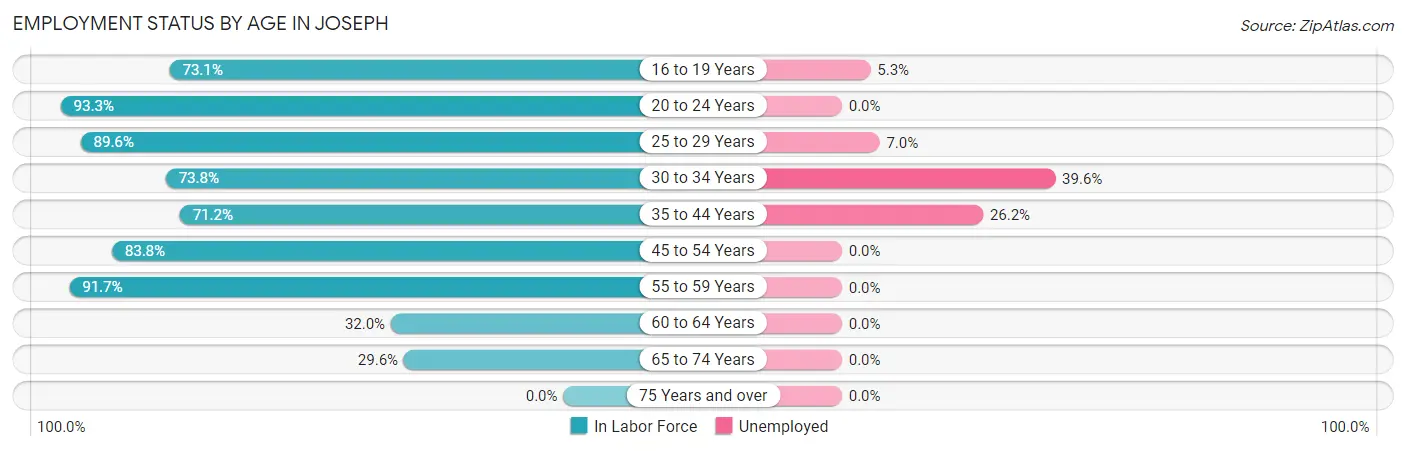
| Age Bracket | In Labor Force | Unemployed |
| 16 to 19 Years | 19 (73.1%) | 1 (5.3%) |
| 20 to 24 Years | 70 (93.3%) | 0 (0.0%) |
| 25 to 29 Years | 43 (89.6%) | 3 (7.0%) |
| 30 to 34 Years | 48 (73.8%) | 19 (39.6%) |
| 35 to 44 Years | 42 (71.2%) | 11 (26.2%) |
| 45 to 54 Years | 31 (83.8%) | 0 (0.0%) |
| 55 to 59 Years | 11 (91.7%) | 0 (0.0%) |
| 60 to 64 Years | 8 (32.0%) | 0 (0.0%) |
| 65 to 74 Years | 29 (29.6%) | 0 (0.0%) |
| 75 Years and over | 0 (0.0%) | 0 (0.0%) |
| Total | 301 (66.2%) | 34 (11.3%) |
Employment Status by Educational Attainment in Joseph
According to labor force statistics for Joseph, 74.4% of individuals (183) out of the total population between 25 and 64 years of age (246) are in the labor force, with 18.0% or 33 of them being unemployed. The group with the highest labor force participation rate are those with the educational attainment of bachelor's degree or higher, with 97.0% or 64 individuals in the labor force. Within the labor force, individuals with bachelor's degree or higher education have the highest percentage of unemployment, with 32.8% or 21 of them being unemployed.
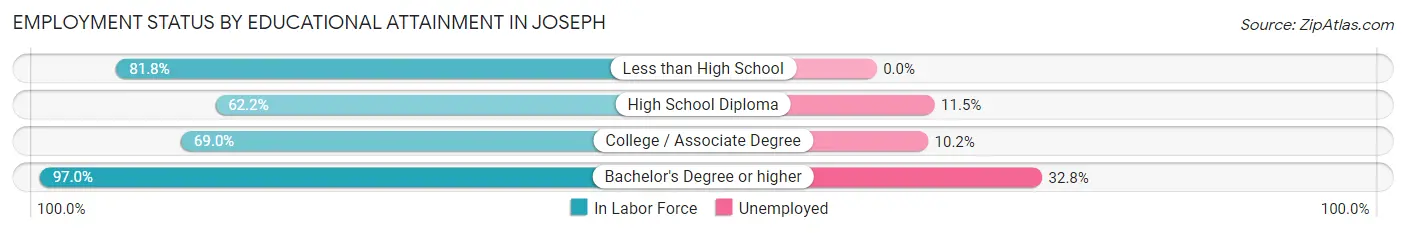
| Educational Attainment | In Labor Force | Unemployed |
| Less than High School | 9 (81.8%) | 0 (0.0%) |
| High School Diploma | 61 (62.2%) | 11 (11.5%) |
| College / Associate Degree | 49 (69.0%) | 7 (10.2%) |
| Bachelor's Degree or higher | 64 (97.0%) | 22 (32.8%) |
| Total | 183 (74.4%) | 44 (18.0%) |
Employment Occupations by Sex in Joseph
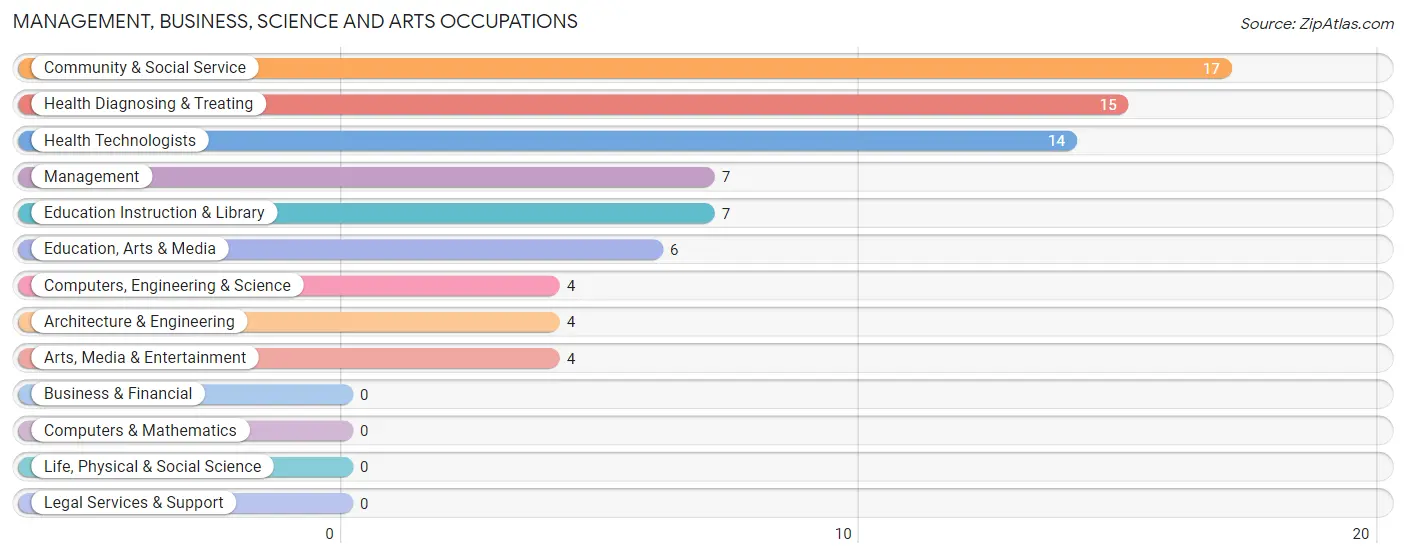
Management, Business, Science and Arts Occupations
The most common Management, Business, Science and Arts occupations in Joseph are Community & Social Service (17 | 6.4%), Health Diagnosing & Treating (15 | 5.6%), Health Technologists (14 | 5.2%), Management (7 | 2.6%), and Education Instruction & Library (7 | 2.6%).
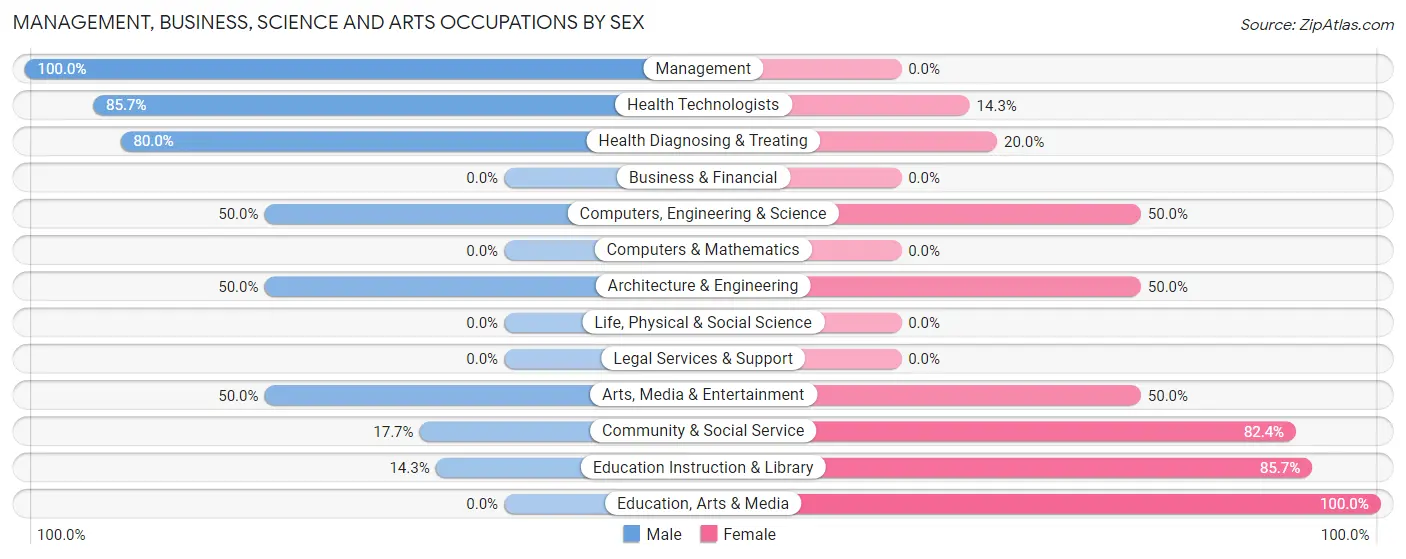
Management, Business, Science and Arts Occupations by Sex
Within the Management, Business, Science and Arts occupations in Joseph, the most male-oriented occupations are Management (100.0%), Health Technologists (85.7%), and Health Diagnosing & Treating (80.0%), while the most female-oriented occupations are Education, Arts & Media (100.0%), Education Instruction & Library (85.7%), and Community & Social Service (82.4%).
| Occupation | Male | Female |
| Management | 7 (100.0%) | 0 (0.0%) |
| Business & Financial | 0 (0.0%) | 0 (0.0%) |
| Computers, Engineering & Science | 2 (50.0%) | 2 (50.0%) |
| Computers & Mathematics | 0 (0.0%) | 0 (0.0%) |
| Architecture & Engineering | 2 (50.0%) | 2 (50.0%) |
| Life, Physical & Social Science | 0 (0.0%) | 0 (0.0%) |
| Community & Social Service | 3 (17.6%) | 14 (82.4%) |
| Education, Arts & Media | 0 (0.0%) | 6 (100.0%) |
| Legal Services & Support | 0 (0.0%) | 0 (0.0%) |
| Education Instruction & Library | 1 (14.3%) | 6 (85.7%) |
| Arts, Media & Entertainment | 2 (50.0%) | 2 (50.0%) |
| Health Diagnosing & Treating | 12 (80.0%) | 3 (20.0%) |
| Health Technologists | 12 (85.7%) | 2 (14.3%) |
| Total (Category) | 24 (55.8%) | 19 (44.2%) |
| Total (Overall) | 173 (64.8%) | 94 (35.2%) |
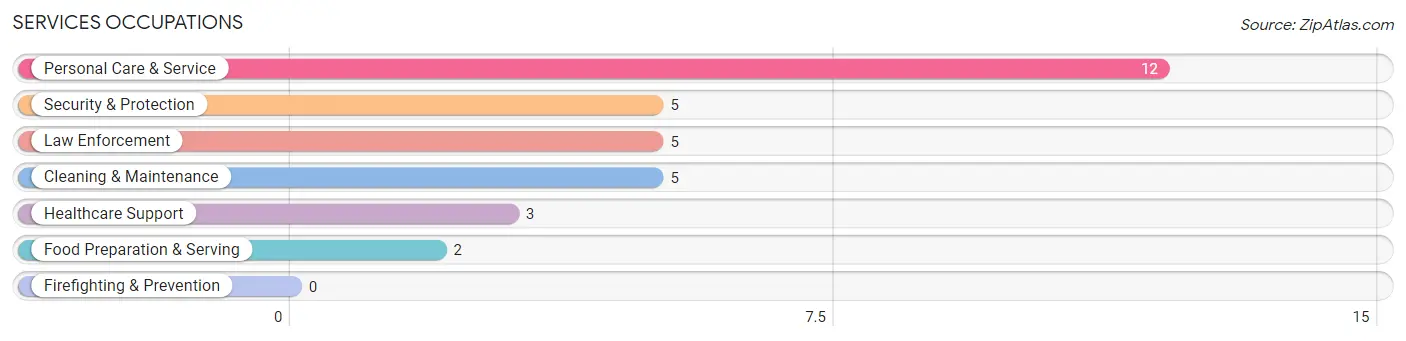
Services Occupations
The most common Services occupations in Joseph are Personal Care & Service (12 | 4.5%), Security & Protection (5 | 1.9%), Law Enforcement (5 | 1.9%), Cleaning & Maintenance (5 | 1.9%), and Healthcare Support (3 | 1.1%).
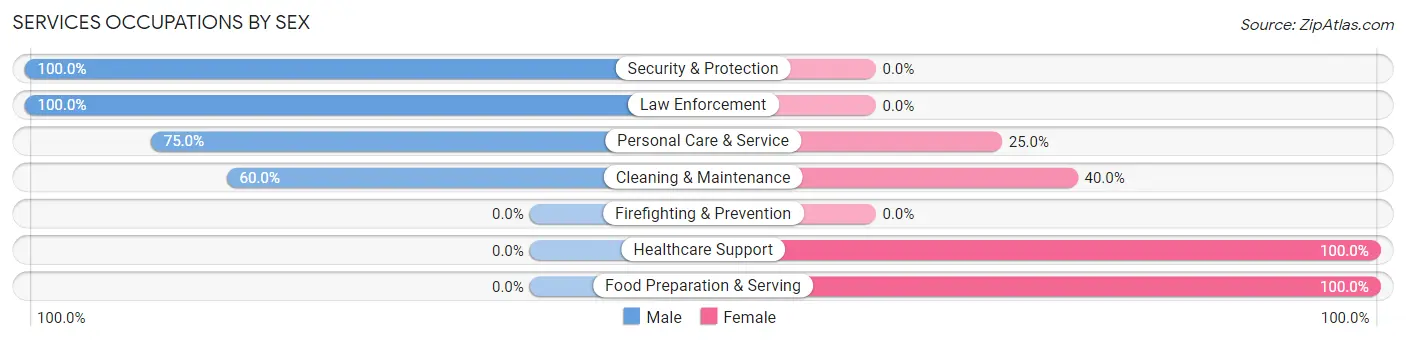
Services Occupations by Sex
Within the Services occupations in Joseph, the most male-oriented occupations are Security & Protection (100.0%), Law Enforcement (100.0%), and Personal Care & Service (75.0%), while the most female-oriented occupations are Healthcare Support (100.0%), Food Preparation & Serving (100.0%), and Cleaning & Maintenance (40.0%).
| Occupation | Male | Female |
| Healthcare Support | 0 (0.0%) | 3 (100.0%) |
| Security & Protection | 5 (100.0%) | 0 (0.0%) |
| Firefighting & Prevention | 0 (0.0%) | 0 (0.0%) |
| Law Enforcement | 5 (100.0%) | 0 (0.0%) |
| Food Preparation & Serving | 0 (0.0%) | 2 (100.0%) |
| Cleaning & Maintenance | 3 (60.0%) | 2 (40.0%) |
| Personal Care & Service | 9 (75.0%) | 3 (25.0%) |
| Total (Category) | 17 (63.0%) | 10 (37.0%) |
| Total (Overall) | 173 (64.8%) | 94 (35.2%) |
Sales and Office Occupations
The most common Sales and Office occupations in Joseph are Office & Administration (102 | 38.2%), and Sales & Related (44 | 16.5%).
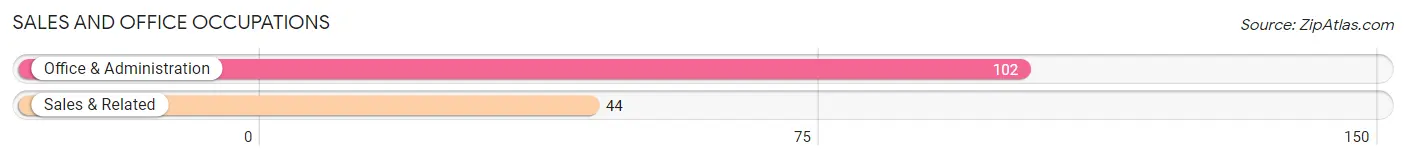
Sales and Office Occupations by Sex
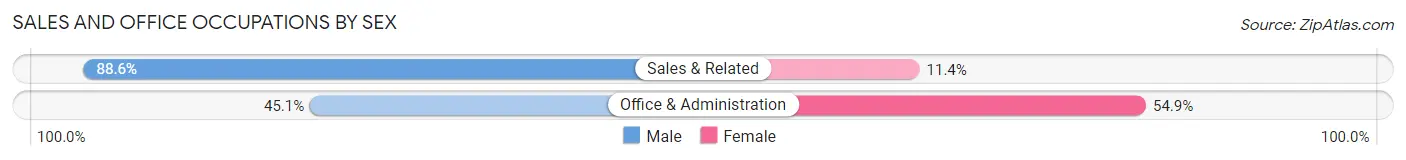
| Occupation | Male | Female |
| Sales & Related | 39 (88.6%) | 5 (11.4%) |
| Office & Administration | 46 (45.1%) | 56 (54.9%) |
| Total (Category) | 85 (58.2%) | 61 (41.8%) |
| Total (Overall) | 173 (64.8%) | 94 (35.2%) |
Natural Resources, Construction and Maintenance Occupations
The most common Natural Resources, Construction and Maintenance occupations in Joseph are Construction & Extraction (18 | 6.7%), Farming, Fishing & Forestry (13 | 4.9%), and Installation, Maintenance & Repair (5 | 1.9%).
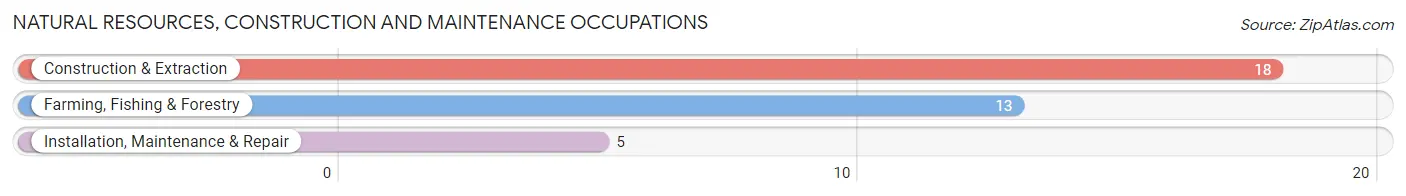
Natural Resources, Construction and Maintenance Occupations by Sex
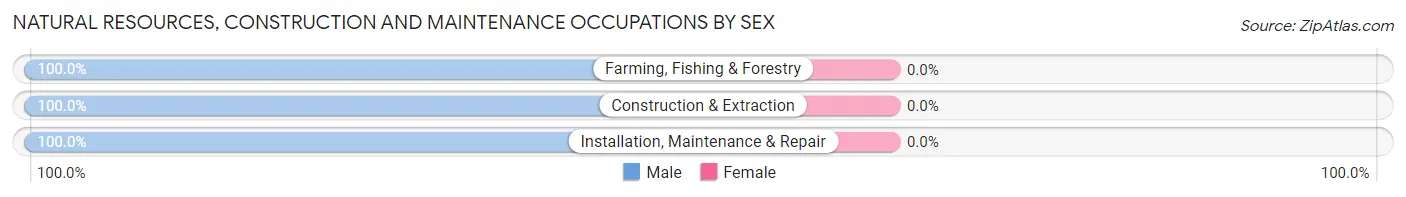
| Occupation | Male | Female |
| Farming, Fishing & Forestry | 13 (100.0%) | 0 (0.0%) |
| Construction & Extraction | 18 (100.0%) | 0 (0.0%) |
| Installation, Maintenance & Repair | 5 (100.0%) | 0 (0.0%) |
| Total (Category) | 36 (100.0%) | 0 (0.0%) |
| Total (Overall) | 173 (64.8%) | 94 (35.2%) |
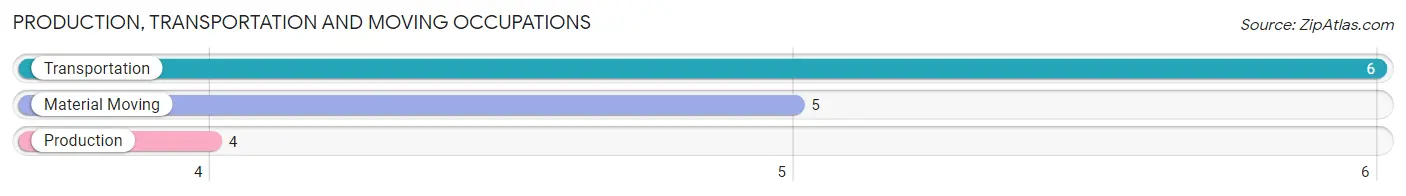
Production, Transportation and Moving Occupations
The most common Production, Transportation and Moving occupations in Joseph are Transportation (6 | 2.2%), Material Moving (5 | 1.9%), and Production (4 | 1.5%).
Production, Transportation and Moving Occupations by Sex
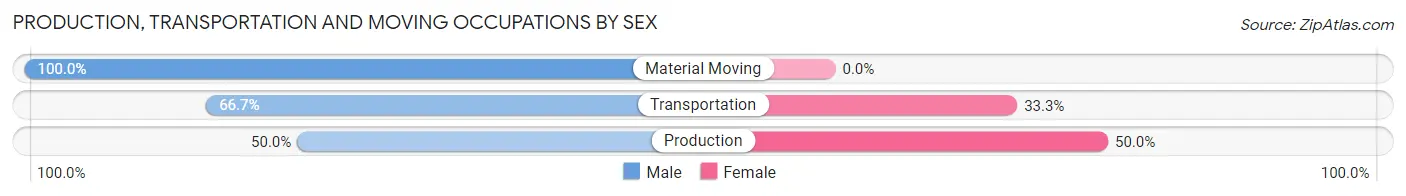
| Occupation | Male | Female |
| Production | 2 (50.0%) | 2 (50.0%) |
| Transportation | 4 (66.7%) | 2 (33.3%) |
| Material Moving | 5 (100.0%) | 0 (0.0%) |
| Total (Category) | 11 (73.3%) | 4 (26.7%) |
| Total (Overall) | 173 (64.8%) | 94 (35.2%) |
Employment Industries by Sex in Joseph
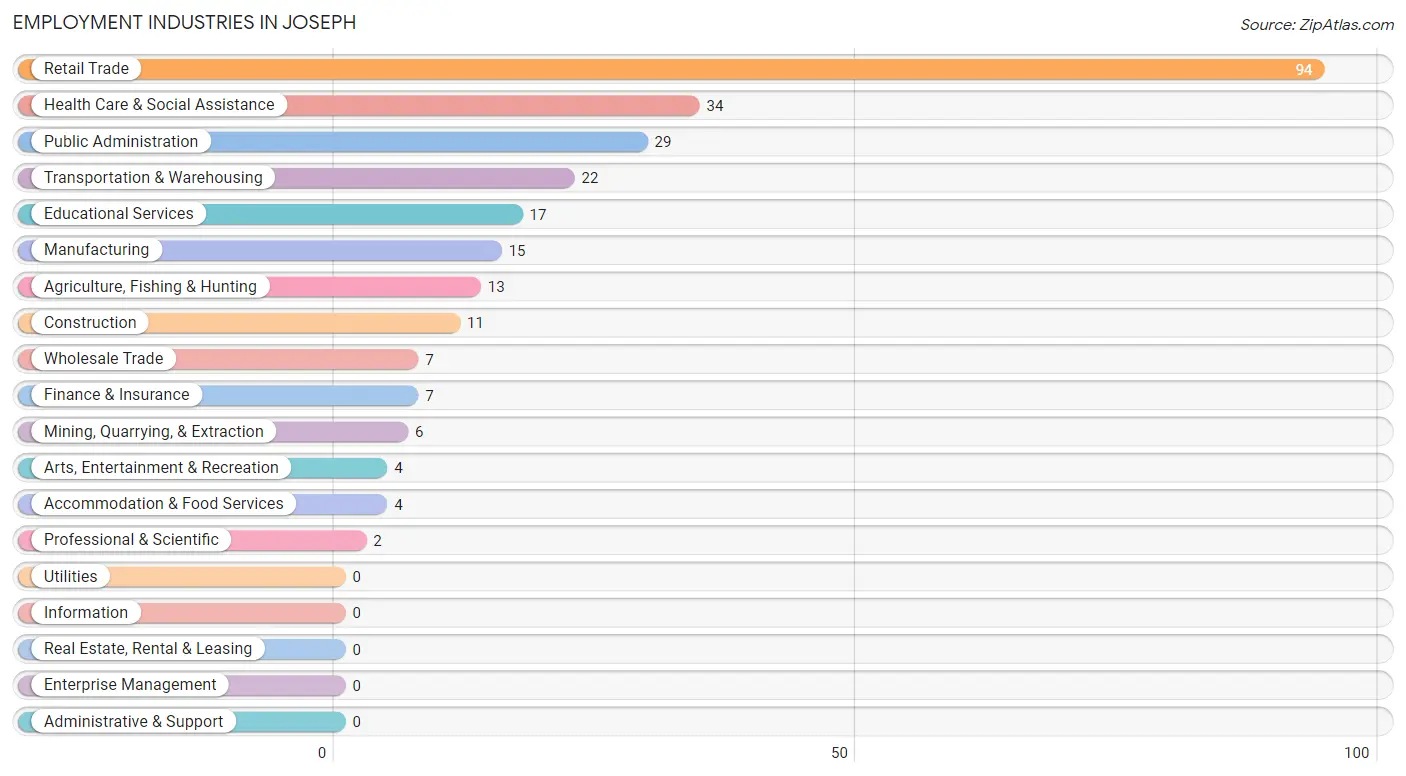
Employment Industries in Joseph
The major employment industries in Joseph include Retail Trade (94 | 35.2%), Health Care & Social Assistance (34 | 12.7%), Public Administration (29 | 10.9%), Transportation & Warehousing (22 | 8.2%), and Educational Services (17 | 6.4%).
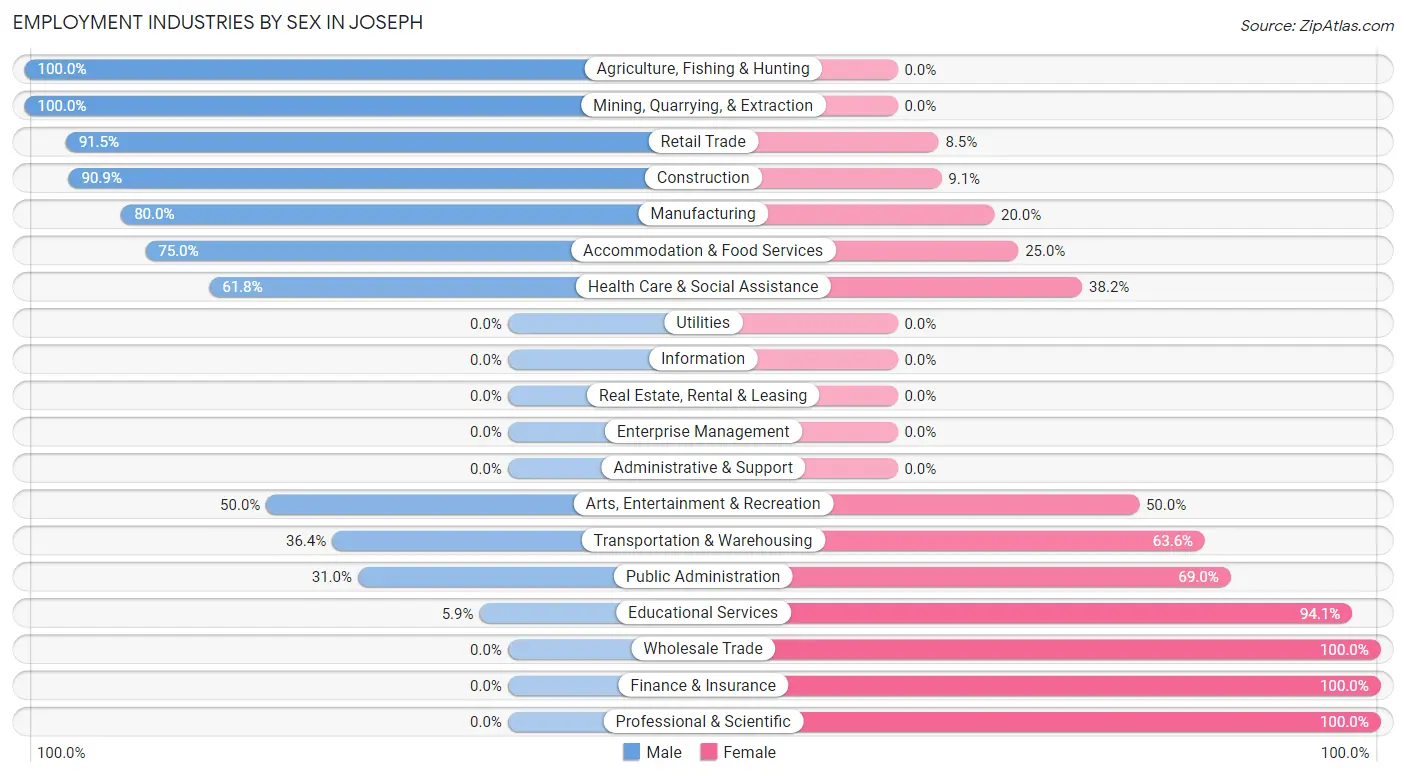
Employment Industries by Sex in Joseph
The Joseph industries that see more men than women are Agriculture, Fishing & Hunting (100.0%), Mining, Quarrying, & Extraction (100.0%), and Retail Trade (91.5%), whereas the industries that tend to have a higher number of women are Wholesale Trade (100.0%), Finance & Insurance (100.0%), and Professional & Scientific (100.0%).
| Industry | Male | Female |
| Agriculture, Fishing & Hunting | 13 (100.0%) | 0 (0.0%) |
| Mining, Quarrying, & Extraction | 6 (100.0%) | 0 (0.0%) |
| Construction | 10 (90.9%) | 1 (9.1%) |
| Manufacturing | 12 (80.0%) | 3 (20.0%) |
| Wholesale Trade | 0 (0.0%) | 7 (100.0%) |
| Retail Trade | 86 (91.5%) | 8 (8.5%) |
| Transportation & Warehousing | 8 (36.4%) | 14 (63.6%) |
| Utilities | 0 (0.0%) | 0 (0.0%) |
| Information | 0 (0.0%) | 0 (0.0%) |
| Finance & Insurance | 0 (0.0%) | 7 (100.0%) |
| Real Estate, Rental & Leasing | 0 (0.0%) | 0 (0.0%) |
| Professional & Scientific | 0 (0.0%) | 2 (100.0%) |
| Enterprise Management | 0 (0.0%) | 0 (0.0%) |
| Administrative & Support | 0 (0.0%) | 0 (0.0%) |
| Educational Services | 1 (5.9%) | 16 (94.1%) |
| Health Care & Social Assistance | 21 (61.8%) | 13 (38.2%) |
| Arts, Entertainment & Recreation | 2 (50.0%) | 2 (50.0%) |
| Accommodation & Food Services | 3 (75.0%) | 1 (25.0%) |
| Public Administration | 9 (31.0%) | 20 (69.0%) |
| Total | 173 (64.8%) | 94 (35.2%) |
Education in Joseph
School Enrollment in Joseph
The most common levels of schooling among the 115 students in Joseph are high school (51 | 44.4%), middle school (25 | 21.7%), and elementary school (18 | 15.7%).
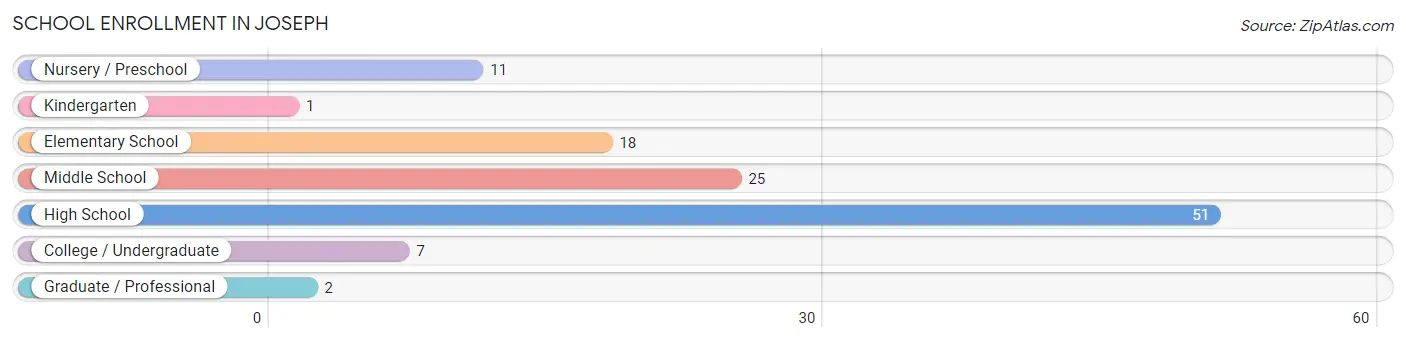
| School Level | # Students | % Students |
| Nursery / Preschool | 11 | 9.6% |
| Kindergarten | 1 | 0.9% |
| Elementary School | 18 | 15.7% |
| Middle School | 25 | 21.7% |
| High School | 51 | 44.4% |
| College / Undergraduate | 7 | 6.1% |
| Graduate / Professional | 2 | 1.7% |
| Total | 115 | 100.0% |
School Enrollment by Age by Funding Source in Joseph
Out of a total of 115 students who are enrolled in schools in Joseph, 5 (4.3%) attend a private institution, while the remaining 110 (95.7%) are enrolled in public schools. The age group of 25 to 34 year olds has the highest likelihood of being enrolled in private schools, with 2 (66.7% in the age bracket) enrolled. Conversely, the age group of 5 to 9 year old has the lowest likelihood of being enrolled in a private school, with 19 (100.0% in the age bracket) attending a public institution.
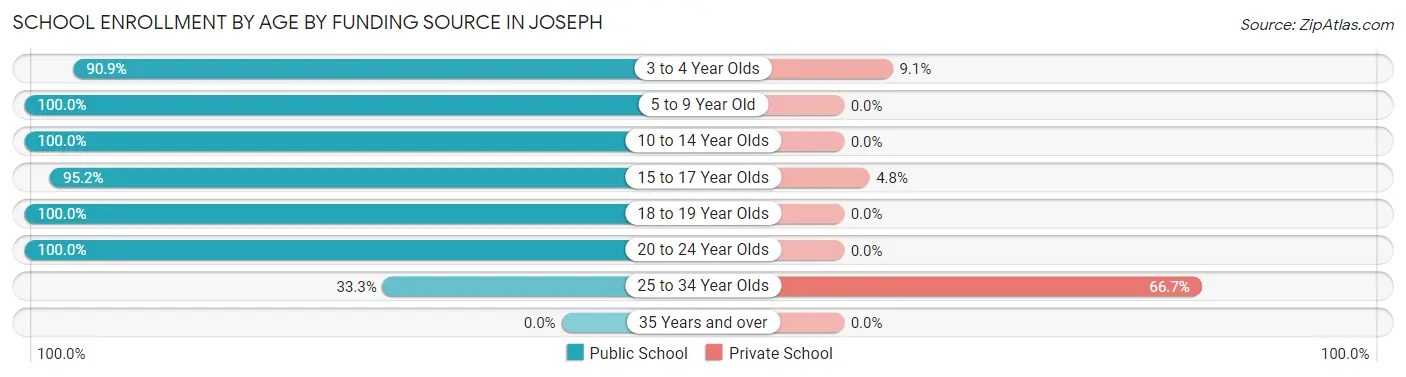
| Age Bracket | Public School | Private School |
| 3 to 4 Year Olds | 10 (90.9%) | 1 (9.1%) |
| 5 to 9 Year Old | 19 (100.0%) | 0 (0.0%) |
| 10 to 14 Year Olds | 30 (100.0%) | 0 (0.0%) |
| 15 to 17 Year Olds | 40 (95.2%) | 2 (4.8%) |
| 18 to 19 Year Olds | 4 (100.0%) | 0 (0.0%) |
| 20 to 24 Year Olds | 6 (100.0%) | 0 (0.0%) |
| 25 to 34 Year Olds | 1 (33.3%) | 2 (66.7%) |
| 35 Years and over | 0 (0.0%) | 0 (0.0%) |
| Total | 110 (95.7%) | 5 (4.3%) |
Educational Attainment by Field of Study in Joseph
Bio, nature & agricultural (42 | 42.0%), science & technology (14 | 14.0%), education (9 | 9.0%), liberal arts & history (8 | 8.0%), and arts & humanities (7 | 7.0%) are the most common fields of study among 100 individuals in Joseph who have obtained a bachelor's degree or higher.
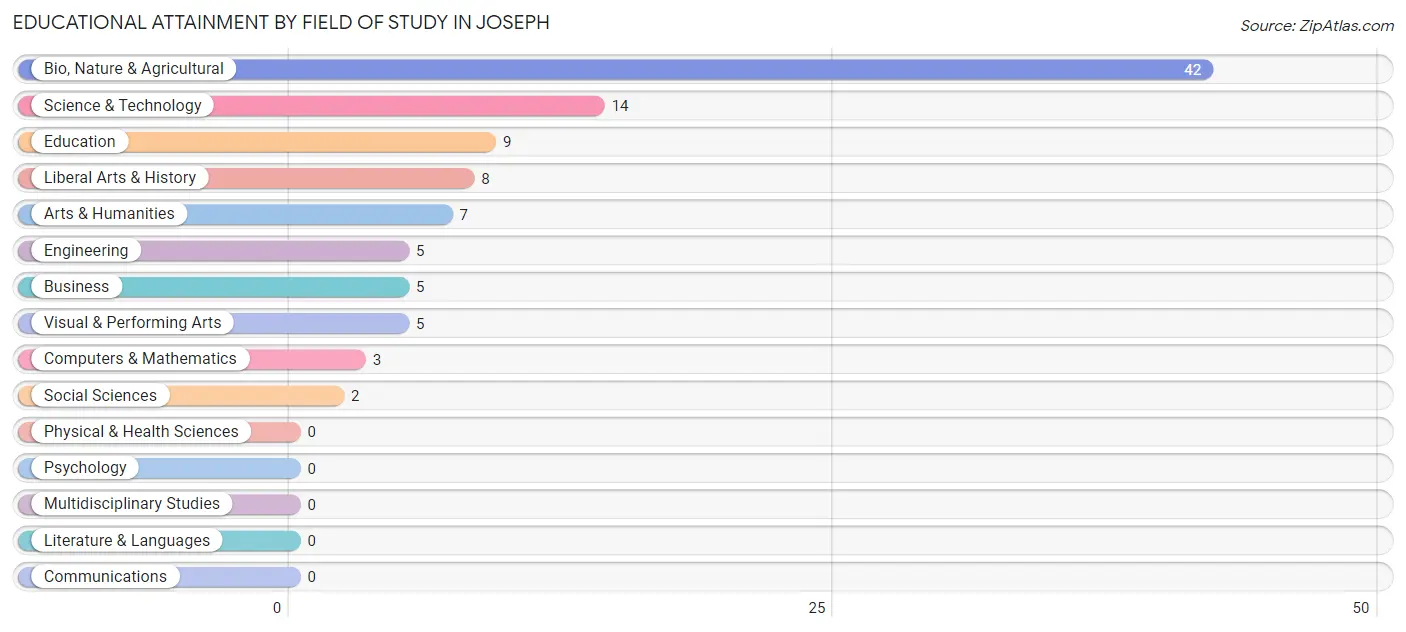
| Field of Study | # Graduates | % Graduates |
| Computers & Mathematics | 3 | 3.0% |
| Bio, Nature & Agricultural | 42 | 42.0% |
| Physical & Health Sciences | 0 | 0.0% |
| Psychology | 0 | 0.0% |
| Social Sciences | 2 | 2.0% |
| Engineering | 5 | 5.0% |
| Multidisciplinary Studies | 0 | 0.0% |
| Science & Technology | 14 | 14.0% |
| Business | 5 | 5.0% |
| Education | 9 | 9.0% |
| Literature & Languages | 0 | 0.0% |
| Liberal Arts & History | 8 | 8.0% |
| Visual & Performing Arts | 5 | 5.0% |
| Communications | 0 | 0.0% |
| Arts & Humanities | 7 | 7.0% |
| Total | 100 | 100.0% |
Transportation & Commute in Joseph
Vehicle Availability by Sex in Joseph
The most prevalent vehicle ownership categories in Joseph are males with 2 vehicles (84, accounting for 50.9%) and females with 2 vehicles (32, making up 89.4%).
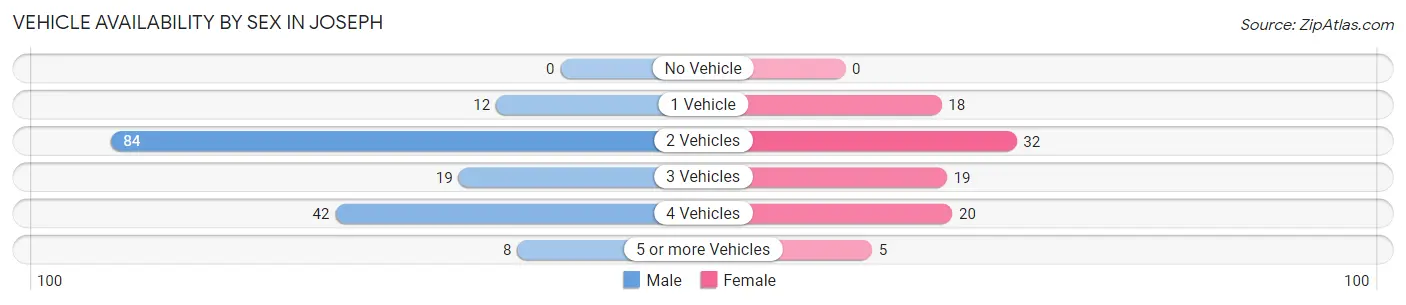
| Vehicles Available | Male | Female |
| No Vehicle | 0 (0.0%) | 0 (0.0%) |
| 1 Vehicle | 12 (7.3%) | 18 (19.2%) |
| 2 Vehicles | 84 (50.9%) | 32 (34.0%) |
| 3 Vehicles | 19 (11.5%) | 19 (20.2%) |
| 4 Vehicles | 42 (25.5%) | 20 (21.3%) |
| 5 or more Vehicles | 8 (4.9%) | 5 (5.3%) |
| Total | 165 (100.0%) | 94 (100.0%) |
Commute Time in Joseph
The most frequently occuring commute durations in Joseph are 10 to 14 minutes (71 commuters, 29.2%), 15 to 19 minutes (62 commuters, 25.5%), and 20 to 24 minutes (49 commuters, 20.2%).
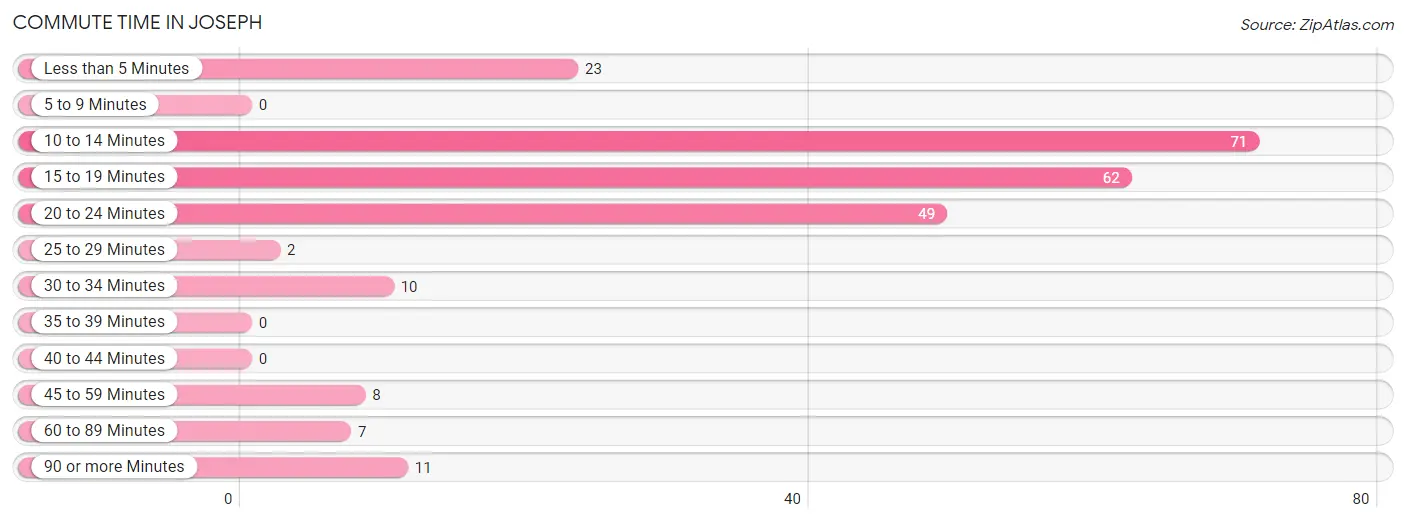
| Commute Time | # Commuters | % Commuters |
| Less than 5 Minutes | 23 | 9.5% |
| 5 to 9 Minutes | 0 | 0.0% |
| 10 to 14 Minutes | 71 | 29.2% |
| 15 to 19 Minutes | 62 | 25.5% |
| 20 to 24 Minutes | 49 | 20.2% |
| 25 to 29 Minutes | 2 | 0.8% |
| 30 to 34 Minutes | 10 | 4.1% |
| 35 to 39 Minutes | 0 | 0.0% |
| 40 to 44 Minutes | 0 | 0.0% |
| 45 to 59 Minutes | 8 | 3.3% |
| 60 to 89 Minutes | 7 | 2.9% |
| 90 or more Minutes | 11 | 4.5% |
Commute Time by Sex in Joseph
The most common commute times in Joseph are 10 to 14 minutes (54 commuters, 33.5%) for males and 15 to 19 minutes (22 commuters, 26.8%) for females.
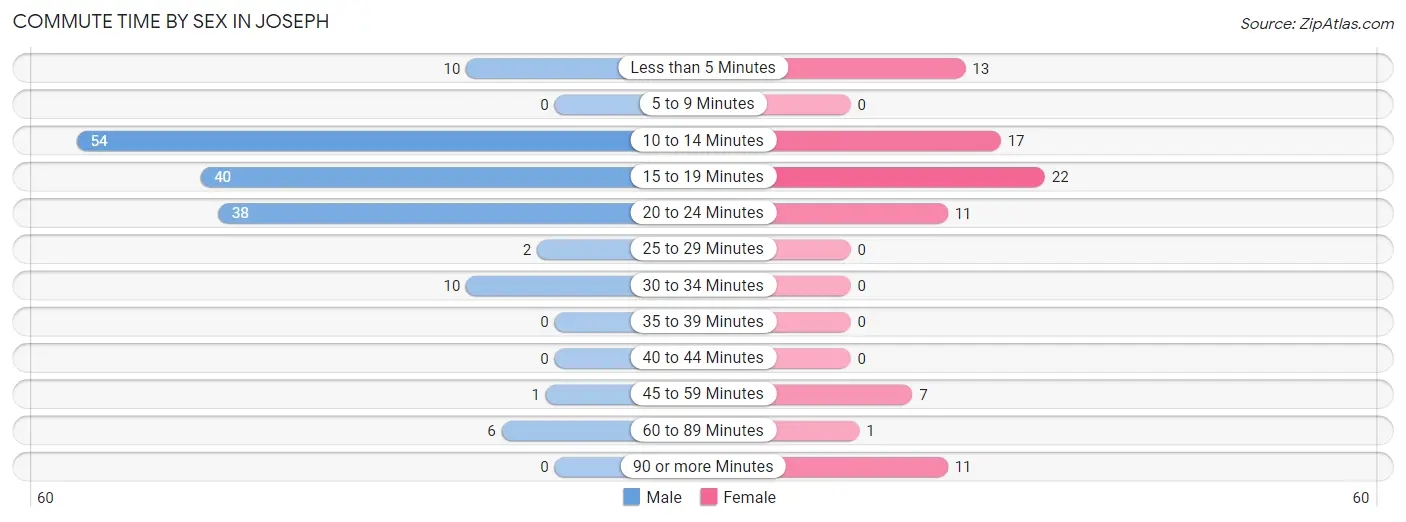
| Commute Time | Male | Female |
| Less than 5 Minutes | 10 (6.2%) | 13 (15.9%) |
| 5 to 9 Minutes | 0 (0.0%) | 0 (0.0%) |
| 10 to 14 Minutes | 54 (33.5%) | 17 (20.7%) |
| 15 to 19 Minutes | 40 (24.8%) | 22 (26.8%) |
| 20 to 24 Minutes | 38 (23.6%) | 11 (13.4%) |
| 25 to 29 Minutes | 2 (1.2%) | 0 (0.0%) |
| 30 to 34 Minutes | 10 (6.2%) | 0 (0.0%) |
| 35 to 39 Minutes | 0 (0.0%) | 0 (0.0%) |
| 40 to 44 Minutes | 0 (0.0%) | 0 (0.0%) |
| 45 to 59 Minutes | 1 (0.6%) | 7 (8.5%) |
| 60 to 89 Minutes | 6 (3.7%) | 1 (1.2%) |
| 90 or more Minutes | 0 (0.0%) | 11 (13.4%) |
Time of Departure to Work by Sex in Joseph
The most frequent times of departure to work in Joseph are 6:30 AM to 6:59 AM (44, 27.3%) for males and 8:00 AM to 8:29 AM (28, 34.2%) for females.
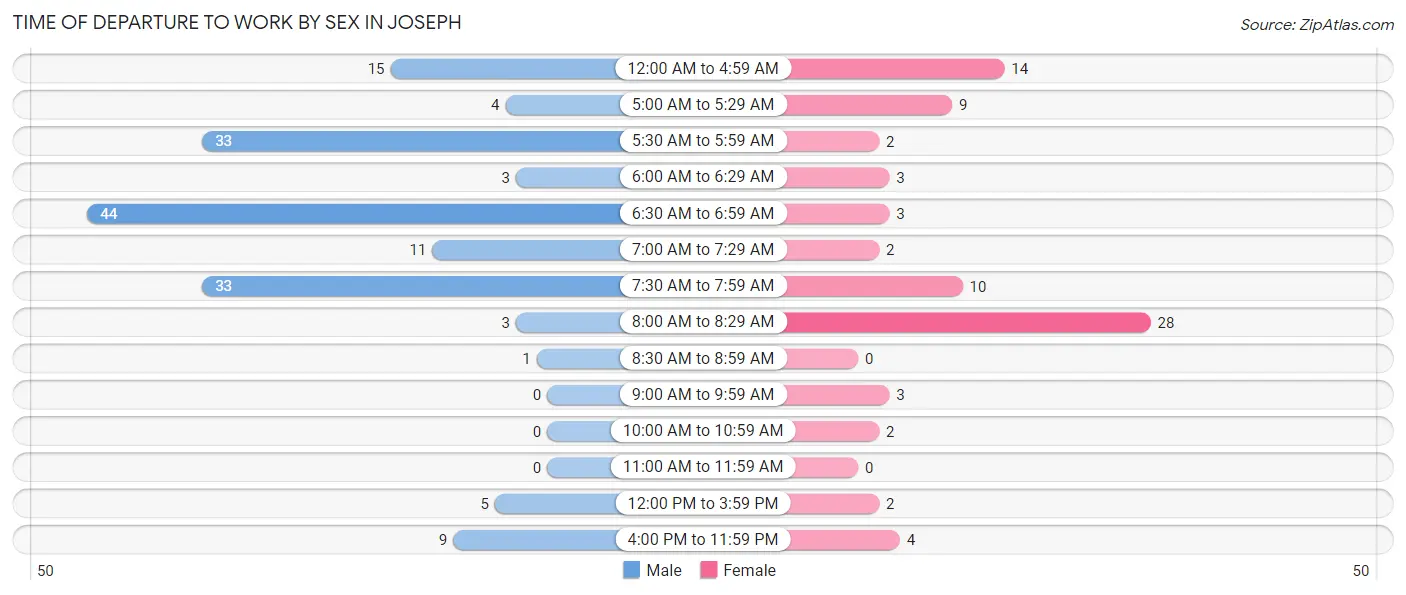
| Time of Departure | Male | Female |
| 12:00 AM to 4:59 AM | 15 (9.3%) | 14 (17.1%) |
| 5:00 AM to 5:29 AM | 4 (2.5%) | 9 (11.0%) |
| 5:30 AM to 5:59 AM | 33 (20.5%) | 2 (2.4%) |
| 6:00 AM to 6:29 AM | 3 (1.9%) | 3 (3.7%) |
| 6:30 AM to 6:59 AM | 44 (27.3%) | 3 (3.7%) |
| 7:00 AM to 7:29 AM | 11 (6.8%) | 2 (2.4%) |
| 7:30 AM to 7:59 AM | 33 (20.5%) | 10 (12.2%) |
| 8:00 AM to 8:29 AM | 3 (1.9%) | 28 (34.2%) |
| 8:30 AM to 8:59 AM | 1 (0.6%) | 0 (0.0%) |
| 9:00 AM to 9:59 AM | 0 (0.0%) | 3 (3.7%) |
| 10:00 AM to 10:59 AM | 0 (0.0%) | 2 (2.4%) |
| 11:00 AM to 11:59 AM | 0 (0.0%) | 0 (0.0%) |
| 12:00 PM to 3:59 PM | 5 (3.1%) | 2 (2.4%) |
| 4:00 PM to 11:59 PM | 9 (5.6%) | 4 (4.9%) |
| Total | 161 (100.0%) | 82 (100.0%) |
Housing Occupancy in Joseph
Occupancy by Ownership in Joseph
Of the total 141 dwellings in Joseph, owner-occupied units account for 116 (82.3%), while renter-occupied units make up 25 (17.7%).
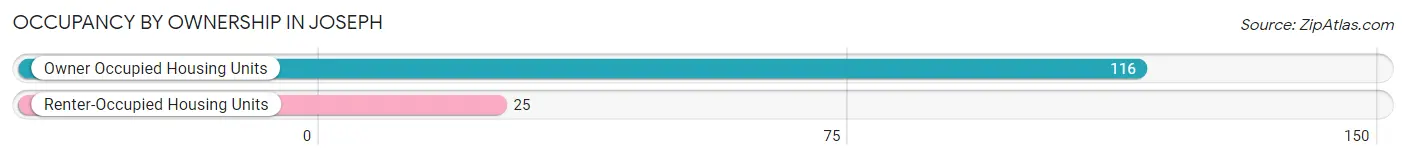
| Occupancy | # Housing Units | % Housing Units |
| Owner Occupied Housing Units | 116 | 82.3% |
| Renter-Occupied Housing Units | 25 | 17.7% |
| Total Occupied Housing Units | 141 | 100.0% |
Occupancy by Household Size in Joseph
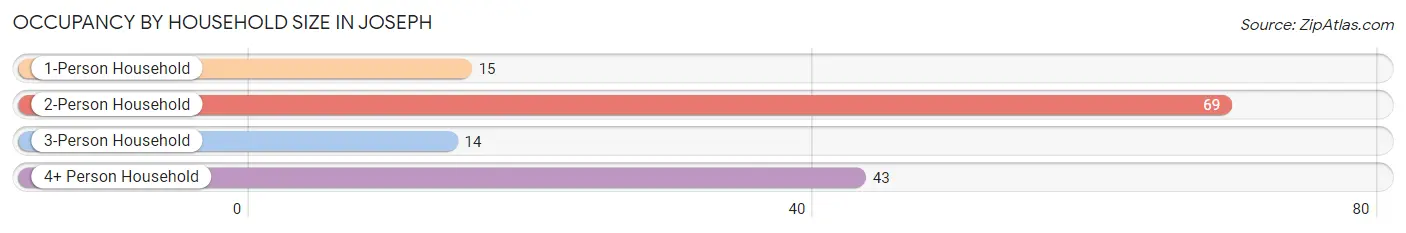
| Household Size | # Housing Units | % Housing Units |
| 1-Person Household | 15 | 10.6% |
| 2-Person Household | 69 | 48.9% |
| 3-Person Household | 14 | 9.9% |
| 4+ Person Household | 43 | 30.5% |
| Total Housing Units | 141 | 100.0% |
Occupancy by Ownership by Household Size in Joseph
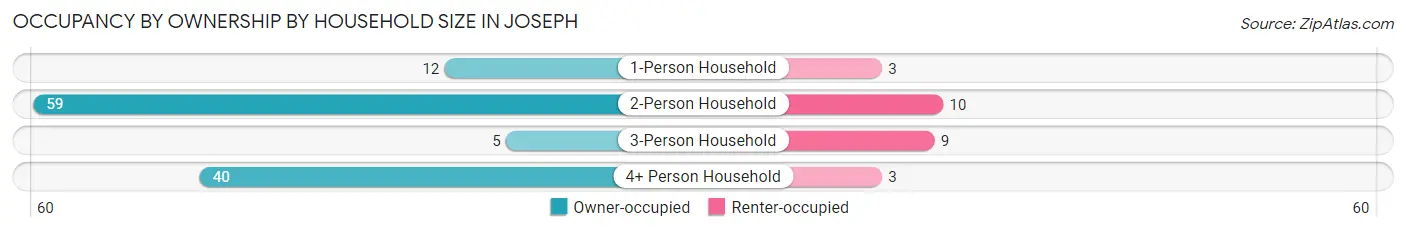
| Household Size | Owner-occupied | Renter-occupied |
| 1-Person Household | 12 (80.0%) | 3 (20.0%) |
| 2-Person Household | 59 (85.5%) | 10 (14.5%) |
| 3-Person Household | 5 (35.7%) | 9 (64.3%) |
| 4+ Person Household | 40 (93.0%) | 3 (7.0%) |
| Total Housing Units | 116 (82.3%) | 25 (17.7%) |
Occupancy by Educational Attainment in Joseph
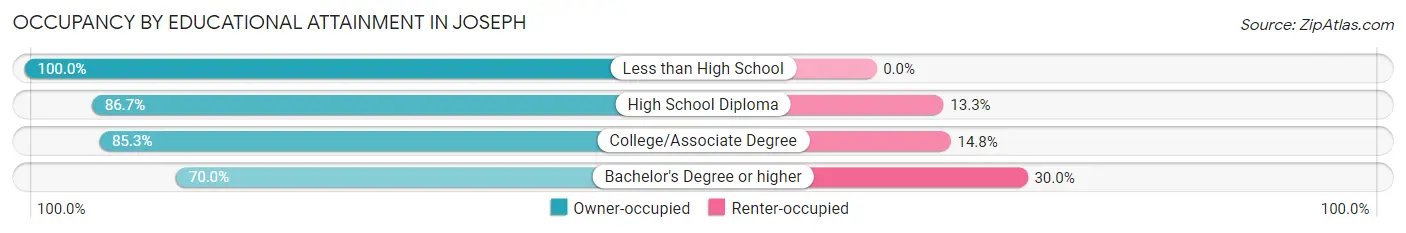
| Household Size | Owner-occupied | Renter-occupied |
| Less than High School | 10 (100.0%) | 0 (0.0%) |
| High School Diploma | 26 (86.7%) | 4 (13.3%) |
| College/Associate Degree | 52 (85.3%) | 9 (14.7%) |
| Bachelor's Degree or higher | 28 (70.0%) | 12 (30.0%) |
Occupancy by Age of Householder in Joseph
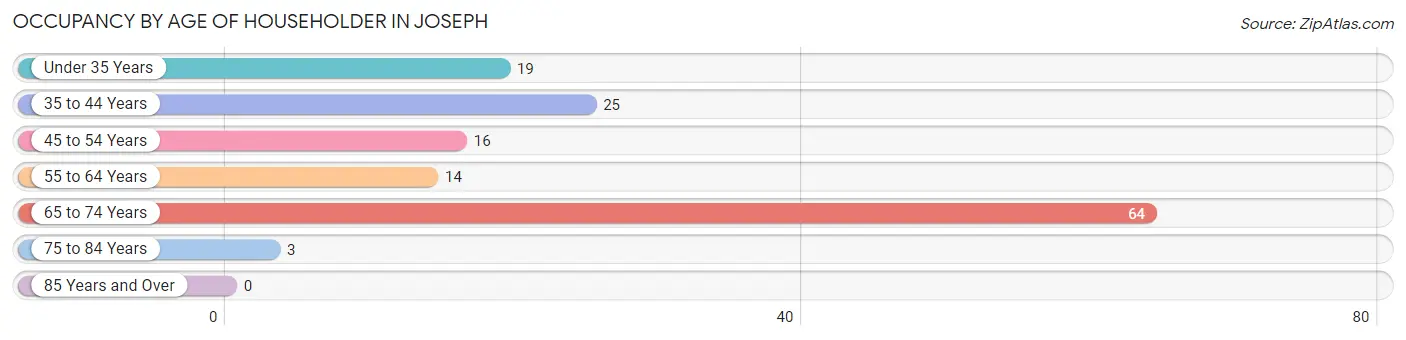
| Age Bracket | # Households | % Households |
| Under 35 Years | 19 | 13.5% |
| 35 to 44 Years | 25 | 17.7% |
| 45 to 54 Years | 16 | 11.4% |
| 55 to 64 Years | 14 | 9.9% |
| 65 to 74 Years | 64 | 45.4% |
| 75 to 84 Years | 3 | 2.1% |
| 85 Years and Over | 0 | 0.0% |
| Total | 141 | 100.0% |
Housing Finances in Joseph
Median Income by Occupancy in Joseph
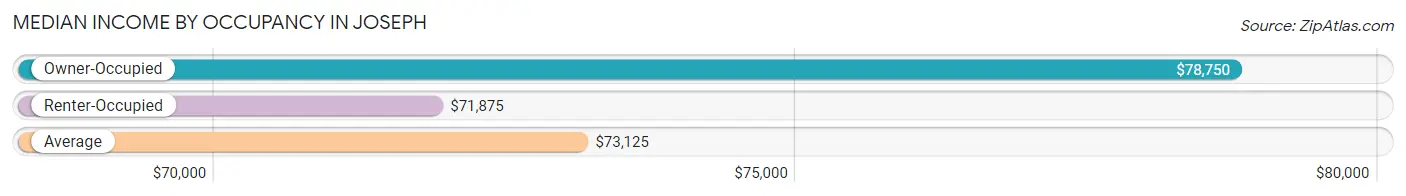
| Occupancy Type | # Households | Median Income |
| Owner-Occupied | 116 (82.3%) | $78,750 |
| Renter-Occupied | 25 (17.7%) | $71,875 |
| Average | 141 (100.0%) | $73,125 |
Occupancy by Householder Income Bracket in Joseph
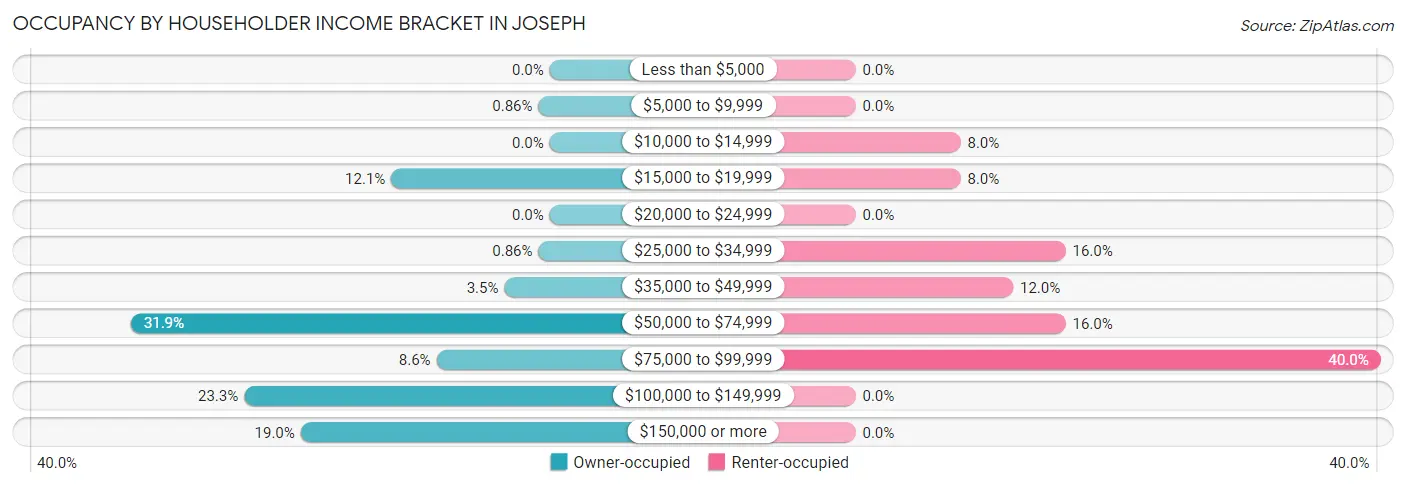
| Income Bracket | Owner-occupied | Renter-occupied |
| Less than $5,000 | 0 (0.0%) | 0 (0.0%) |
| $5,000 to $9,999 | 1 (0.9%) | 0 (0.0%) |
| $10,000 to $14,999 | 0 (0.0%) | 2 (8.0%) |
| $15,000 to $19,999 | 14 (12.1%) | 2 (8.0%) |
| $20,000 to $24,999 | 0 (0.0%) | 0 (0.0%) |
| $25,000 to $34,999 | 1 (0.9%) | 4 (16.0%) |
| $35,000 to $49,999 | 4 (3.5%) | 3 (12.0%) |
| $50,000 to $74,999 | 37 (31.9%) | 4 (16.0%) |
| $75,000 to $99,999 | 10 (8.6%) | 10 (40.0%) |
| $100,000 to $149,999 | 27 (23.3%) | 0 (0.0%) |
| $150,000 or more | 22 (19.0%) | 0 (0.0%) |
| Total | 116 (100.0%) | 25 (100.0%) |
Monthly Housing Cost Tiers in Joseph
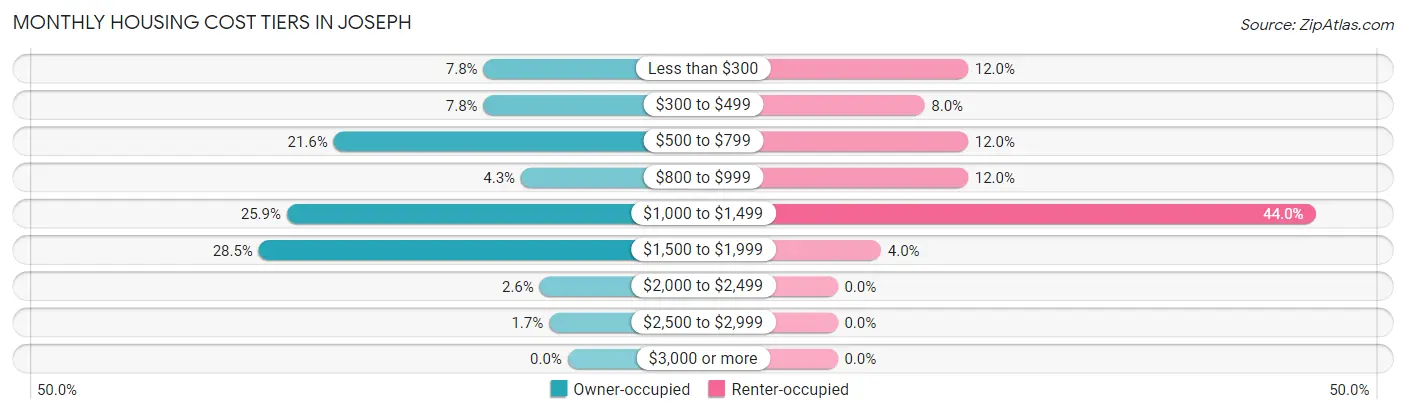
| Monthly Cost | Owner-occupied | Renter-occupied |
| Less than $300 | 9 (7.8%) | 3 (12.0%) |
| $300 to $499 | 9 (7.8%) | 2 (8.0%) |
| $500 to $799 | 25 (21.5%) | 3 (12.0%) |
| $800 to $999 | 5 (4.3%) | 3 (12.0%) |
| $1,000 to $1,499 | 30 (25.9%) | 11 (44.0%) |
| $1,500 to $1,999 | 33 (28.4%) | 1 (4.0%) |
| $2,000 to $2,499 | 3 (2.6%) | 0 (0.0%) |
| $2,500 to $2,999 | 2 (1.7%) | 0 (0.0%) |
| $3,000 or more | 0 (0.0%) | 0 (0.0%) |
| Total | 116 (100.0%) | 25 (100.0%) |
Physical Housing Characteristics in Joseph
Housing Structures in Joseph
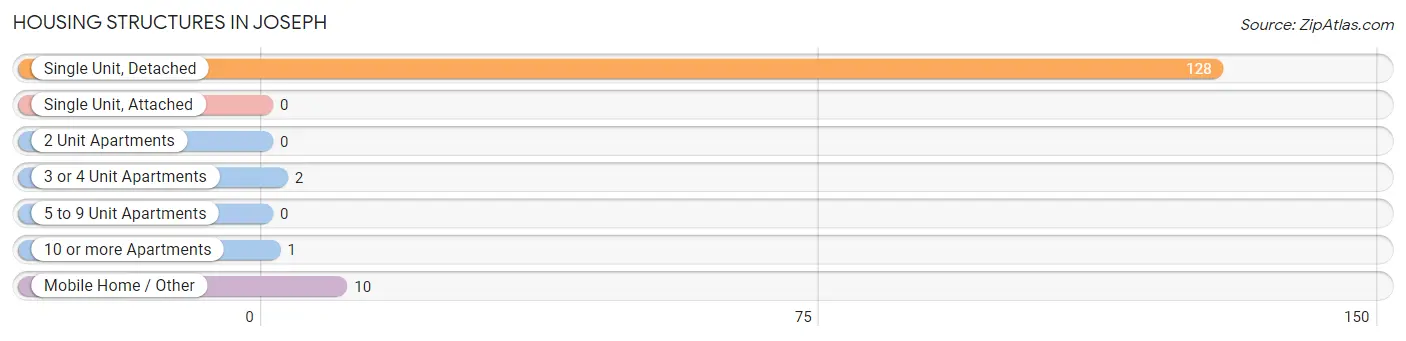
| Structure Type | # Housing Units | % Housing Units |
| Single Unit, Detached | 128 | 90.8% |
| Single Unit, Attached | 0 | 0.0% |
| 2 Unit Apartments | 0 | 0.0% |
| 3 or 4 Unit Apartments | 2 | 1.4% |
| 5 to 9 Unit Apartments | 0 | 0.0% |
| 10 or more Apartments | 1 | 0.7% |
| Mobile Home / Other | 10 | 7.1% |
| Total | 141 | 100.0% |
Housing Structures by Occupancy in Joseph
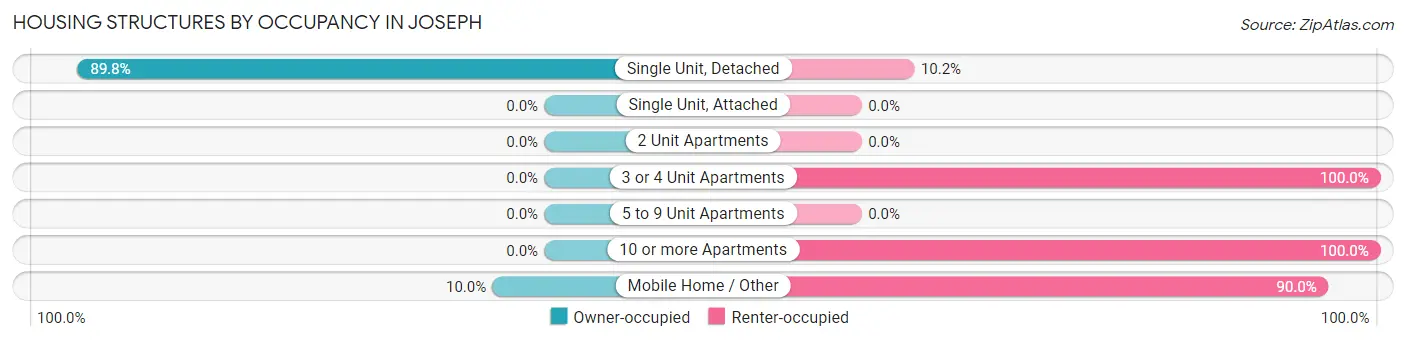
| Structure Type | Owner-occupied | Renter-occupied |
| Single Unit, Detached | 115 (89.8%) | 13 (10.2%) |
| Single Unit, Attached | 0 (0.0%) | 0 (0.0%) |
| 2 Unit Apartments | 0 (0.0%) | 0 (0.0%) |
| 3 or 4 Unit Apartments | 0 (0.0%) | 2 (100.0%) |
| 5 to 9 Unit Apartments | 0 (0.0%) | 0 (0.0%) |
| 10 or more Apartments | 0 (0.0%) | 1 (100.0%) |
| Mobile Home / Other | 1 (10.0%) | 9 (90.0%) |
| Total | 116 (82.3%) | 25 (17.7%) |
Housing Structures by Number of Rooms in Joseph
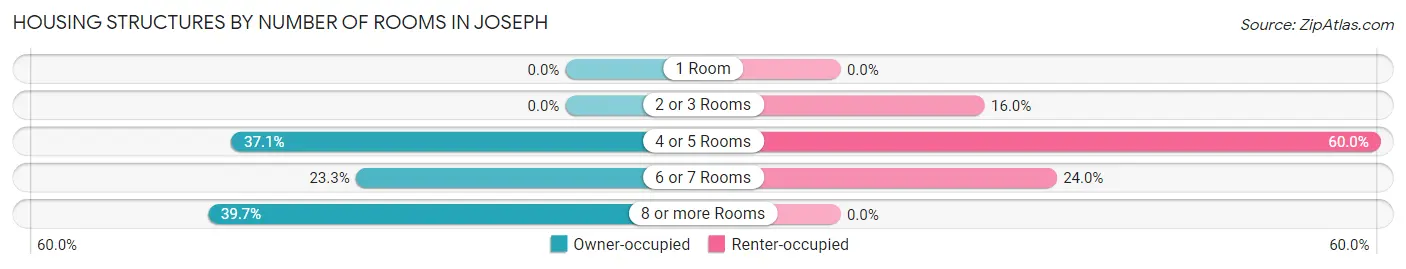
| Number of Rooms | Owner-occupied | Renter-occupied |
| 1 Room | 0 (0.0%) | 0 (0.0%) |
| 2 or 3 Rooms | 0 (0.0%) | 4 (16.0%) |
| 4 or 5 Rooms | 43 (37.1%) | 15 (60.0%) |
| 6 or 7 Rooms | 27 (23.3%) | 6 (24.0%) |
| 8 or more Rooms | 46 (39.7%) | 0 (0.0%) |
| Total | 116 (100.0%) | 25 (100.0%) |
Housing Structure by Heating Type in Joseph
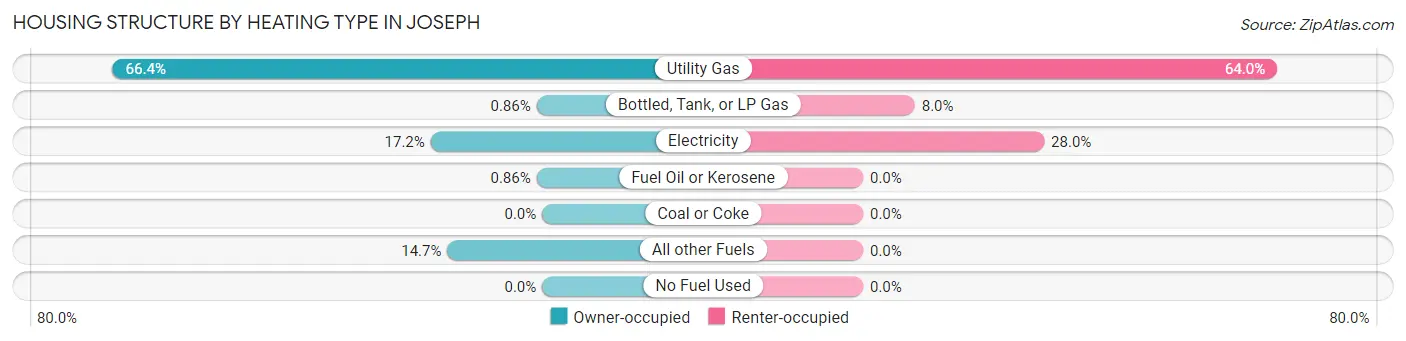
| Heating Type | Owner-occupied | Renter-occupied |
| Utility Gas | 77 (66.4%) | 16 (64.0%) |
| Bottled, Tank, or LP Gas | 1 (0.9%) | 2 (8.0%) |
| Electricity | 20 (17.2%) | 7 (28.0%) |
| Fuel Oil or Kerosene | 1 (0.9%) | 0 (0.0%) |
| Coal or Coke | 0 (0.0%) | 0 (0.0%) |
| All other Fuels | 17 (14.7%) | 0 (0.0%) |
| No Fuel Used | 0 (0.0%) | 0 (0.0%) |
| Total | 116 (100.0%) | 25 (100.0%) |
Household Vehicle Usage in Joseph
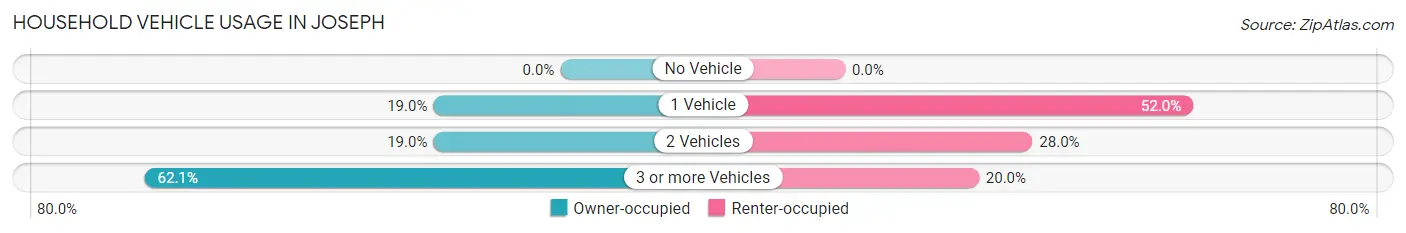
| Vehicles per Household | Owner-occupied | Renter-occupied |
| No Vehicle | 0 (0.0%) | 0 (0.0%) |
| 1 Vehicle | 22 (19.0%) | 13 (52.0%) |
| 2 Vehicles | 22 (19.0%) | 7 (28.0%) |
| 3 or more Vehicles | 72 (62.1%) | 5 (20.0%) |
| Total | 116 (100.0%) | 25 (100.0%) |
Real Estate & Mortgages in Joseph
Real Estate and Mortgage Overview in Joseph
| Characteristic | Without Mortgage | With Mortgage |
| Housing Units | 38 | 78 |
| Median Property Value | - | - |
| Median Household Income | $59,792 | $12 |
| Monthly Housing Costs | $517 | $0 |
| Real Estate Taxes | $2,278 | $2 |
Property Value by Mortgage Status in Joseph
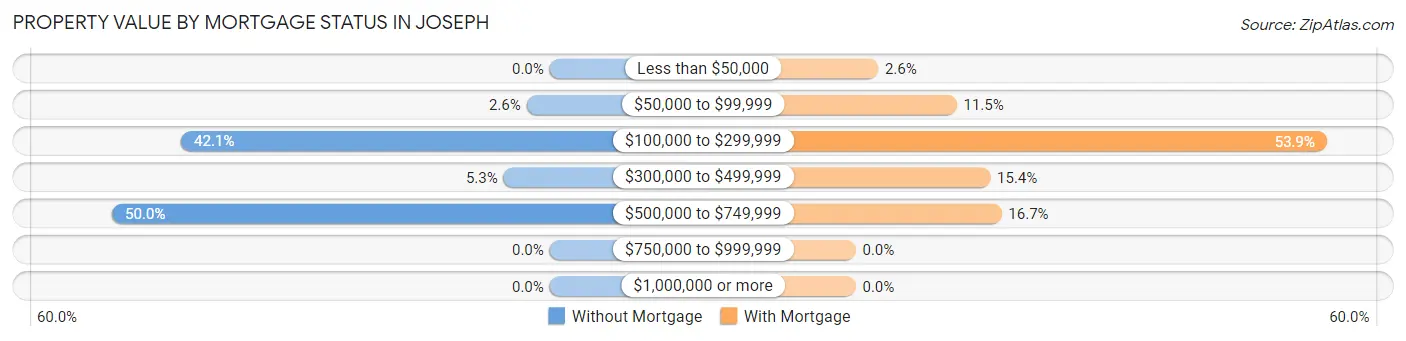
| Property Value | Without Mortgage | With Mortgage |
| Less than $50,000 | 0 (0.0%) | 2 (2.6%) |
| $50,000 to $99,999 | 1 (2.6%) | 9 (11.5%) |
| $100,000 to $299,999 | 16 (42.1%) | 42 (53.8%) |
| $300,000 to $499,999 | 2 (5.3%) | 12 (15.4%) |
| $500,000 to $749,999 | 19 (50.0%) | 13 (16.7%) |
| $750,000 to $999,999 | 0 (0.0%) | 0 (0.0%) |
| $1,000,000 or more | 0 (0.0%) | 0 (0.0%) |
| Total | 38 (100.0%) | 78 (100.0%) |
Household Income by Mortgage Status in Joseph
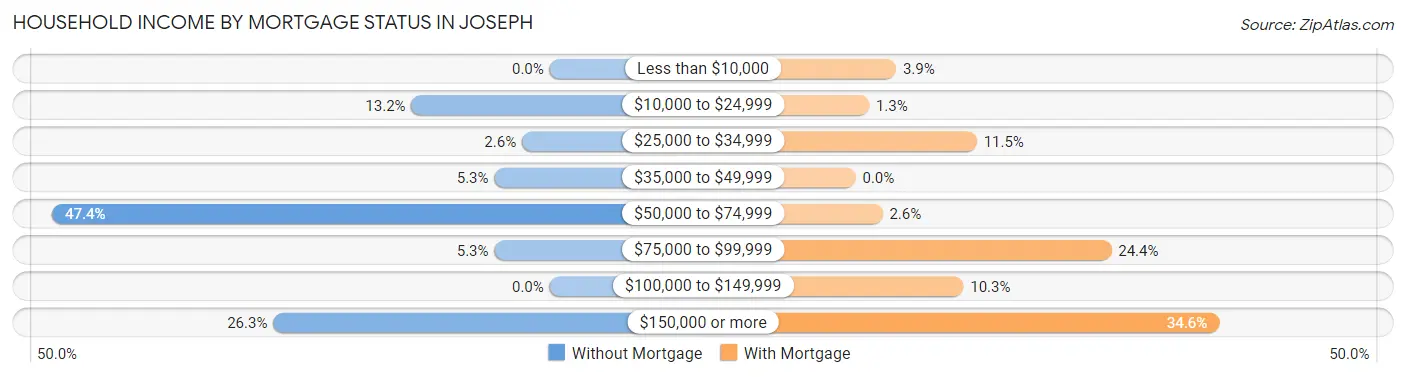
| Household Income | Without Mortgage | With Mortgage |
| Less than $10,000 | 0 (0.0%) | 3 (3.8%) |
| $10,000 to $24,999 | 5 (13.2%) | 1 (1.3%) |
| $25,000 to $34,999 | 1 (2.6%) | 9 (11.5%) |
| $35,000 to $49,999 | 2 (5.3%) | 0 (0.0%) |
| $50,000 to $74,999 | 18 (47.4%) | 2 (2.6%) |
| $75,000 to $99,999 | 2 (5.3%) | 19 (24.4%) |
| $100,000 to $149,999 | 0 (0.0%) | 8 (10.3%) |
| $150,000 or more | 10 (26.3%) | 27 (34.6%) |
| Total | 38 (100.0%) | 78 (100.0%) |
Property Value to Household Income Ratio in Joseph
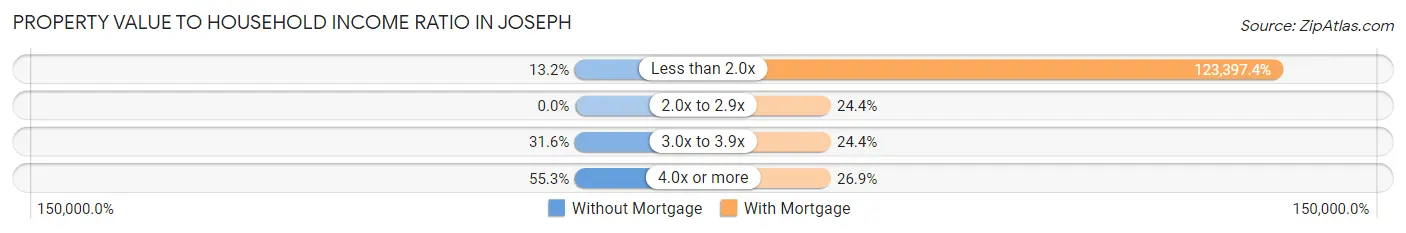
| Value-to-Income Ratio | Without Mortgage | With Mortgage |
| Less than 2.0x | 5 (13.2%) | 96,250 (123,397.4%) |
| 2.0x to 2.9x | 0 (0.0%) | 19 (24.4%) |
| 3.0x to 3.9x | 12 (31.6%) | 19 (24.4%) |
| 4.0x or more | 21 (55.3%) | 21 (26.9%) |
| Total | 38 (100.0%) | 78 (100.0%) |
Real Estate Taxes by Mortgage Status in Joseph
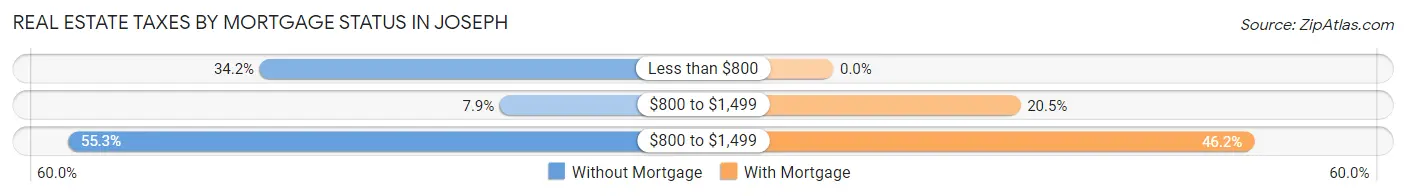
| Property Taxes | Without Mortgage | With Mortgage |
| Less than $800 | 13 (34.2%) | 0 (0.0%) |
| $800 to $1,499 | 3 (7.9%) | 16 (20.5%) |
| $800 to $1,499 | 21 (55.3%) | 36 (46.2%) |
| Total | 38 (100.0%) | 78 (100.0%) |
Health & Disability in Joseph
Health Insurance Coverage by Age in Joseph
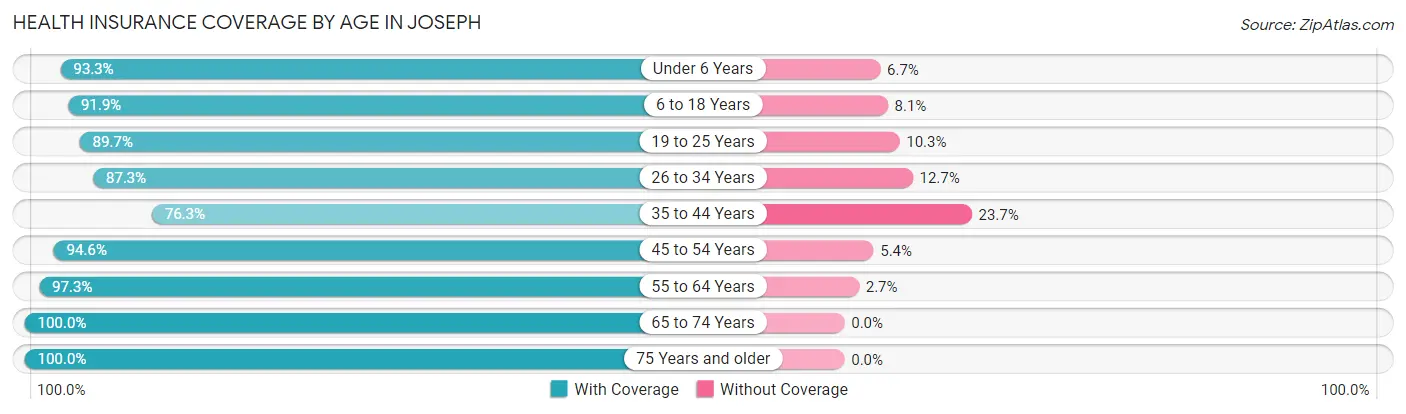
| Age Bracket | With Coverage | Without Coverage |
| Under 6 Years | 28 (93.3%) | 2 (6.7%) |
| 6 to 18 Years | 91 (91.9%) | 8 (8.1%) |
| 19 to 25 Years | 70 (89.7%) | 8 (10.3%) |
| 26 to 34 Years | 96 (87.3%) | 14 (12.7%) |
| 35 to 44 Years | 45 (76.3%) | 14 (23.7%) |
| 45 to 54 Years | 35 (94.6%) | 2 (5.4%) |
| 55 to 64 Years | 36 (97.3%) | 1 (2.7%) |
| 65 to 74 Years | 98 (100.0%) | 0 (0.0%) |
| 75 Years and older | 10 (100.0%) | 0 (0.0%) |
| Total | 509 (91.2%) | 49 (8.8%) |
Health Insurance Coverage by Citizenship Status in Joseph
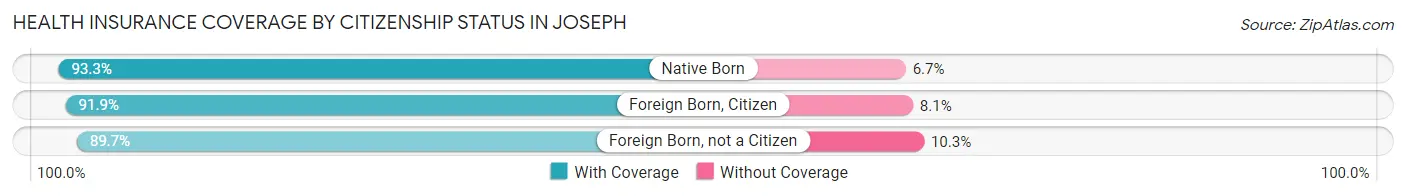
| Citizenship Status | With Coverage | Without Coverage |
| Native Born | 28 (93.3%) | 2 (6.7%) |
| Foreign Born, Citizen | 91 (91.9%) | 8 (8.1%) |
| Foreign Born, not a Citizen | 70 (89.7%) | 8 (10.3%) |
Health Insurance Coverage by Household Income in Joseph
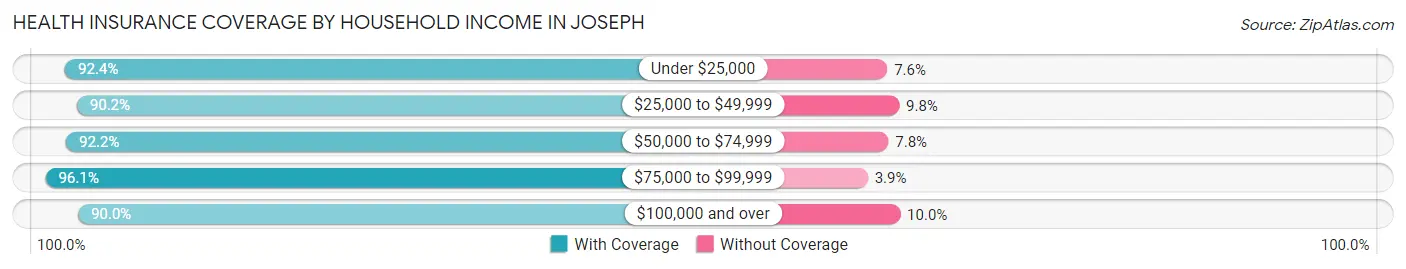
| Household Income | With Coverage | Without Coverage |
| Under $25,000 | 61 (92.4%) | 5 (7.6%) |
| $25,000 to $49,999 | 46 (90.2%) | 5 (9.8%) |
| $50,000 to $74,999 | 83 (92.2%) | 7 (7.8%) |
| $75,000 to $99,999 | 49 (96.1%) | 2 (3.9%) |
| $100,000 and over | 270 (90.0%) | 30 (10.0%) |
Public vs Private Health Insurance Coverage by Age in Joseph
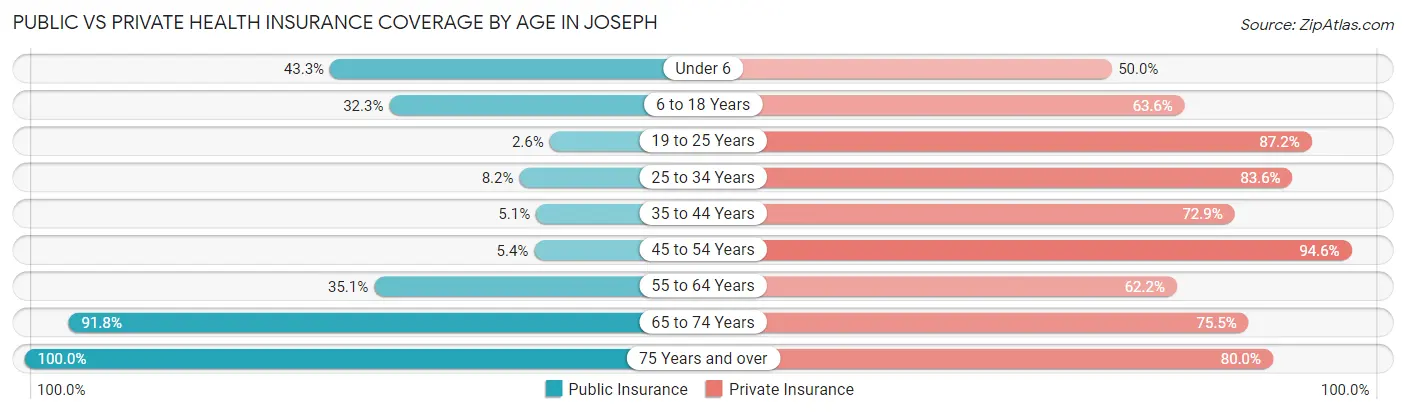
| Age Bracket | Public Insurance | Private Insurance |
| Under 6 | 13 (43.3%) | 15 (50.0%) |
| 6 to 18 Years | 32 (32.3%) | 63 (63.6%) |
| 19 to 25 Years | 2 (2.6%) | 68 (87.2%) |
| 25 to 34 Years | 9 (8.2%) | 92 (83.6%) |
| 35 to 44 Years | 3 (5.1%) | 43 (72.9%) |
| 45 to 54 Years | 2 (5.4%) | 35 (94.6%) |
| 55 to 64 Years | 13 (35.1%) | 23 (62.2%) |
| 65 to 74 Years | 90 (91.8%) | 74 (75.5%) |
| 75 Years and over | 10 (100.0%) | 8 (80.0%) |
| Total | 174 (31.2%) | 421 (75.4%) |
Disability Status by Sex by Age in Joseph
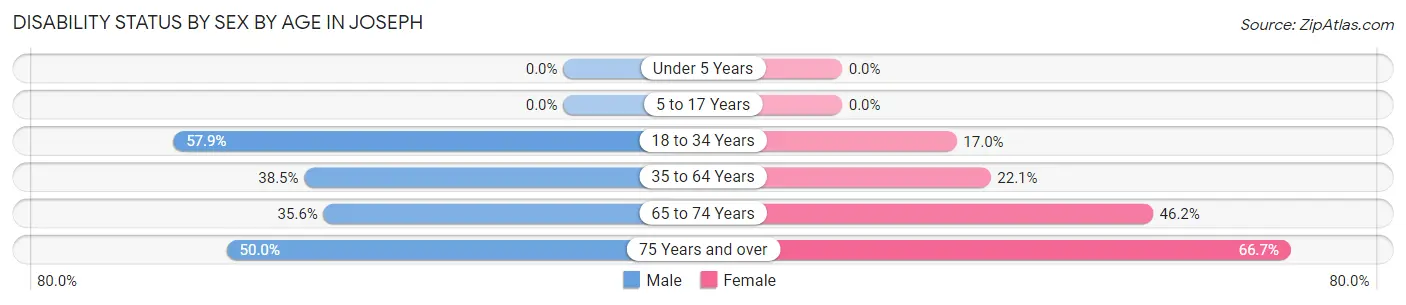
| Age Bracket | Male | Female |
| Under 5 Years | 0 (0.0%) | 0 (0.0%) |
| 5 to 17 Years | 0 (0.0%) | 0 (0.0%) |
| 18 to 34 Years | 84 (57.9%) | 8 (17.0%) |
| 35 to 64 Years | 25 (38.5%) | 15 (22.1%) |
| 65 to 74 Years | 21 (35.6%) | 18 (46.2%) |
| 75 Years and over | 2 (50.0%) | 4 (66.7%) |
Disability Class by Sex by Age in Joseph
Disability Class: Hearing Difficulty
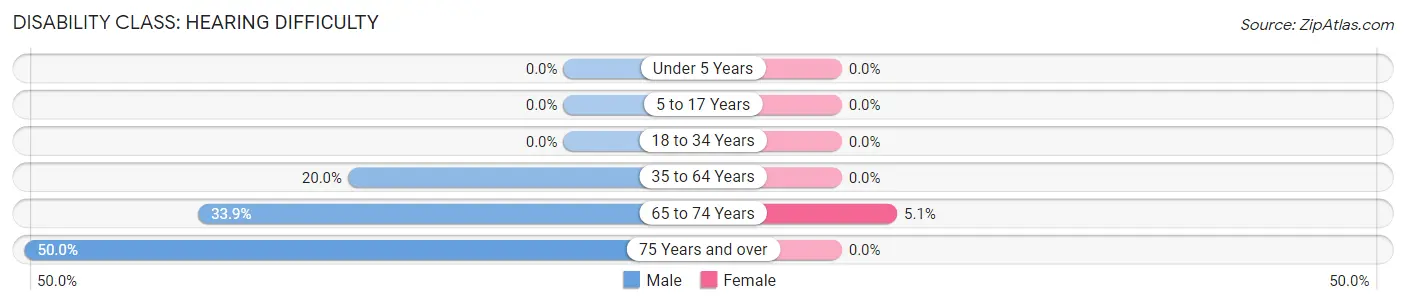
| Age Bracket | Male | Female |
| Under 5 Years | 0 (0.0%) | 0 (0.0%) |
| 5 to 17 Years | 0 (0.0%) | 0 (0.0%) |
| 18 to 34 Years | 0 (0.0%) | 0 (0.0%) |
| 35 to 64 Years | 13 (20.0%) | 0 (0.0%) |
| 65 to 74 Years | 20 (33.9%) | 2 (5.1%) |
| 75 Years and over | 2 (50.0%) | 0 (0.0%) |
Disability Class: Vision Difficulty
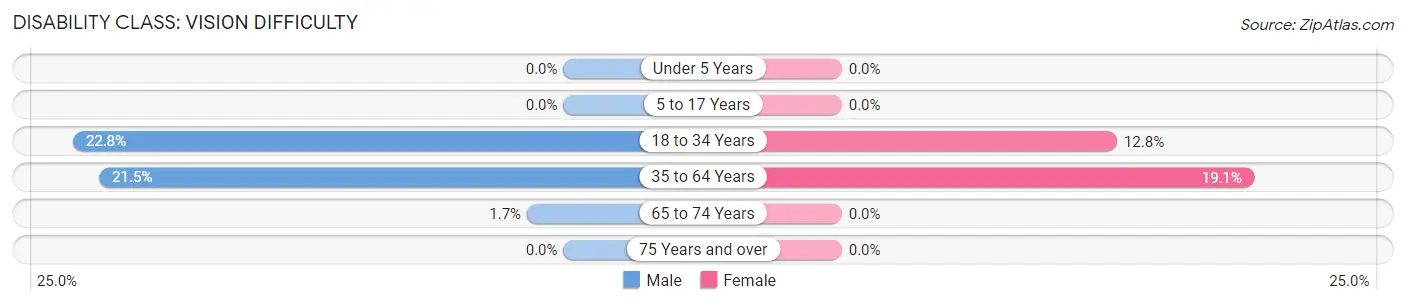
| Age Bracket | Male | Female |
| Under 5 Years | 0 (0.0%) | 0 (0.0%) |
| 5 to 17 Years | 0 (0.0%) | 0 (0.0%) |
| 18 to 34 Years | 33 (22.8%) | 6 (12.8%) |
| 35 to 64 Years | 14 (21.5%) | 13 (19.1%) |
| 65 to 74 Years | 1 (1.7%) | 0 (0.0%) |
| 75 Years and over | 0 (0.0%) | 0 (0.0%) |
Disability Class: Cognitive Difficulty
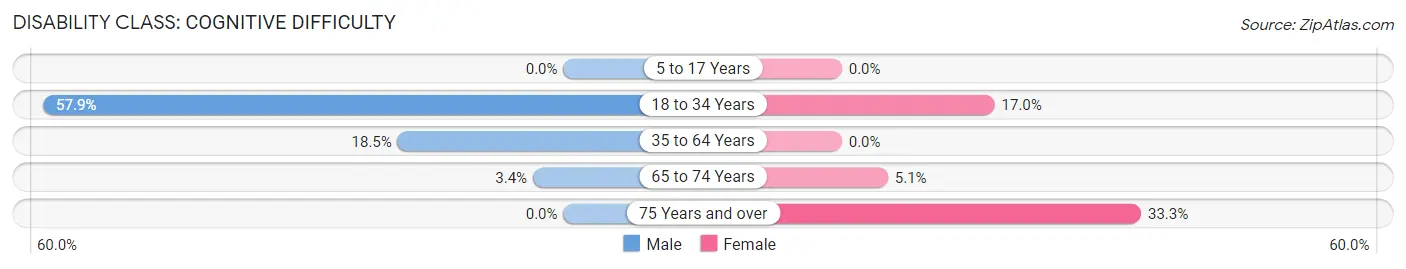
| Age Bracket | Male | Female |
| 5 to 17 Years | 0 (0.0%) | 0 (0.0%) |
| 18 to 34 Years | 84 (57.9%) | 8 (17.0%) |
| 35 to 64 Years | 12 (18.5%) | 0 (0.0%) |
| 65 to 74 Years | 2 (3.4%) | 2 (5.1%) |
| 75 Years and over | 0 (0.0%) | 2 (33.3%) |
Disability Class: Ambulatory Difficulty
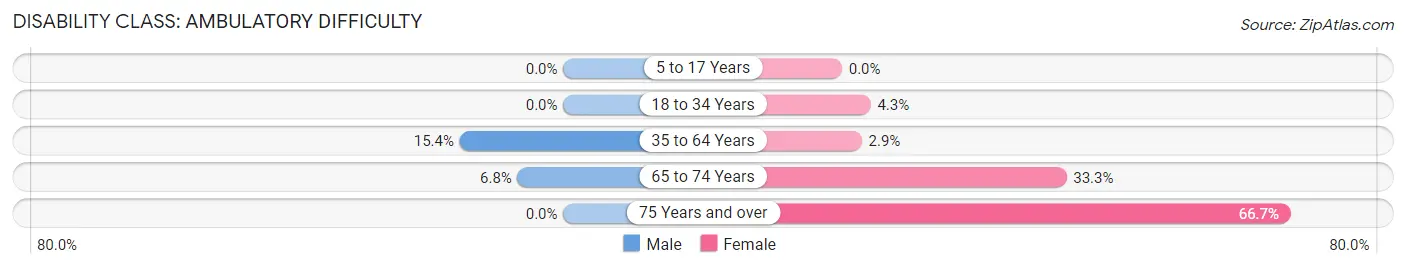
| Age Bracket | Male | Female |
| 5 to 17 Years | 0 (0.0%) | 0 (0.0%) |
| 18 to 34 Years | 0 (0.0%) | 2 (4.3%) |
| 35 to 64 Years | 10 (15.4%) | 2 (2.9%) |
| 65 to 74 Years | 4 (6.8%) | 13 (33.3%) |
| 75 Years and over | 0 (0.0%) | 4 (66.7%) |
Disability Class: Self-Care Difficulty
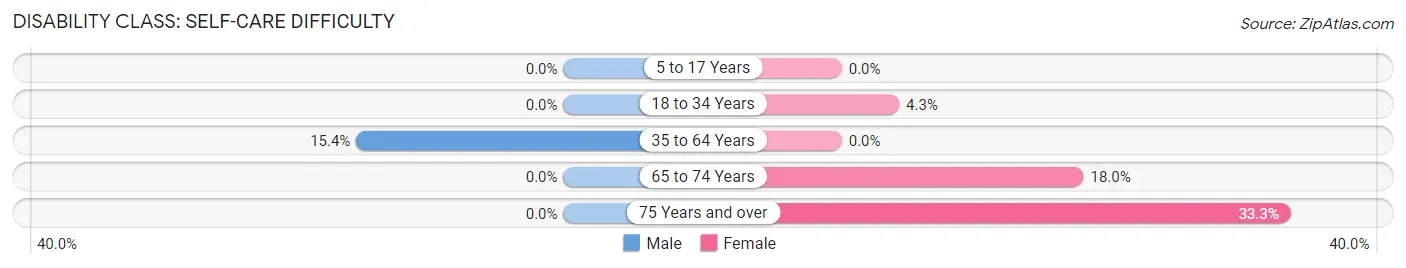
| Age Bracket | Male | Female |
| 5 to 17 Years | 0 (0.0%) | 0 (0.0%) |
| 18 to 34 Years | 0 (0.0%) | 2 (4.3%) |
| 35 to 64 Years | 10 (15.4%) | 0 (0.0%) |
| 65 to 74 Years | 0 (0.0%) | 7 (17.9%) |
| 75 Years and over | 0 (0.0%) | 2 (33.3%) |
Technology Access in Joseph
Computing Device Access in Joseph
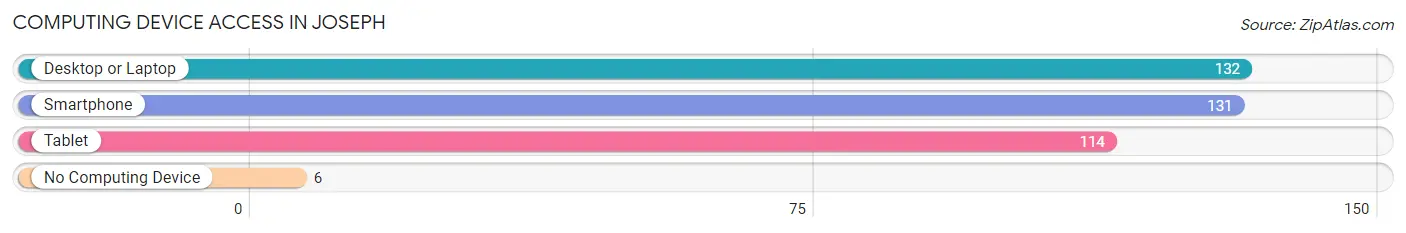
| Device Type | # Households | % Households |
| Desktop or Laptop | 132 | 93.6% |
| Smartphone | 131 | 92.9% |
| Tablet | 114 | 80.8% |
| No Computing Device | 6 | 4.3% |
| Total | 141 | 100.0% |
Internet Access in Joseph
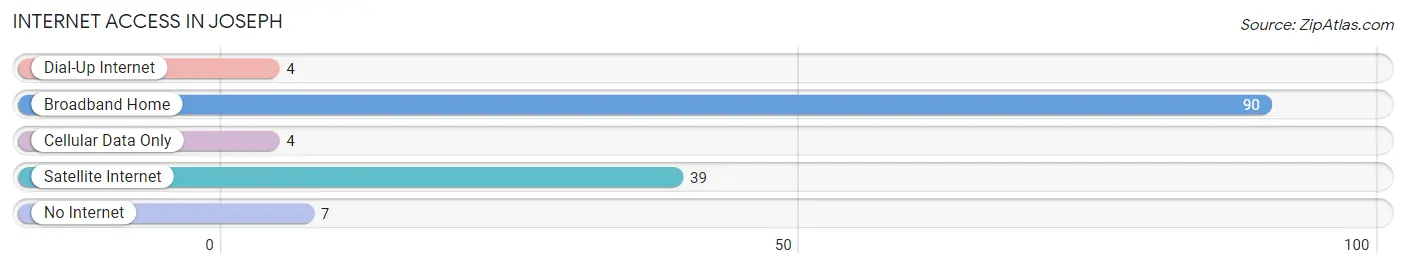
| Internet Type | # Households | % Households |
| Dial-Up Internet | 4 | 2.8% |
| Broadband Home | 90 | 63.8% |
| Cellular Data Only | 4 | 2.8% |
| Satellite Internet | 39 | 27.7% |
| No Internet | 7 | 5.0% |
| Total | 141 | 100.0% |
Joseph Summary
Joseph, Utah is a small city located in the southeastern corner of the state, near the Utah-Idaho border. It is part of the Cache Valley, a region of Utah known for its agricultural production and rural lifestyle. The city of Joseph has a population of approximately 1,500 people, and is the county seat of Cache County.
Geography
Joseph is located in the Cache Valley, a region of Utah known for its agricultural production and rural lifestyle. The city is situated at an elevation of 4,890 feet, and is surrounded by the Wasatch Mountains to the east and the Wellsville Mountains to the west. The city is located near the Utah-Idaho border, and is approximately 80 miles north of Salt Lake City.
The city of Joseph is located in a semi-arid climate, with hot summers and cold winters. The average annual temperature is approximately 50 degrees Fahrenheit, and the average annual precipitation is approximately 15 inches.
Economy
Joseph is a small city with a limited economy. The city’s primary industry is agriculture, with the majority of the population employed in farming and ranching. The city is also home to a number of small businesses, including restaurants, retail stores, and service providers.
The city is also home to a number of manufacturing companies, including a plastics factory and a metal fabrication plant. The city is also home to a number of government offices, including the Cache County Courthouse and the Cache County Sheriff’s Office.
Demographics
As of the 2010 census, the population of Joseph was 1,500 people. The racial makeup of the city was 95.3% White, 0.7% African American, 0.7% Native American, 0.7% Asian, 0.3% Pacific Islander, and 2.0% from two or more races. The median household income was $41,250, and the median family income was $48,750.
Conclusion
Joseph, Utah is a small city located in the southeastern corner of the state, near the Utah-Idaho border. It is part of the Cache Valley, a region of Utah known for its agricultural production and rural lifestyle. The city of Joseph has a population of approximately 1,500 people, and is the county seat of Cache County. The city’s primary industry is agriculture, with the majority of the population employed in farming and ranching. The city is also home to a number of small businesses, manufacturing companies, and government offices. The racial makeup of the city is predominantly White, with a small percentage of African American, Native American, Asian, and Pacific Islander residents. The median household income is $41,250, and the median family income is $48,750.
Common Questions
What is Per Capita Income in Joseph?
Per Capita income in Joseph is $32,360.
What is the Median Family Income in Joseph?
Median Family Income in Joseph is $77,344.
What is the Median Household income in Joseph?
Median Household Income in Joseph is $73,125.
What is Income or Wage Gap in Joseph?
Income or Wage Gap in Joseph is 29.2%.
Women in Joseph earn 70.8 cents for every dollar earned by a man.
What is Inequality or Gini Index in Joseph?
Inequality or Gini Index in Joseph is 0.44.
What is the Total Population of Joseph?
Total Population of Joseph is 558.
What is the Total Male Population of Joseph?
Total Male Population of Joseph is 355.
What is the Total Female Population of Joseph?
Total Female Population of Joseph is 203.
What is the Ratio of Males per 100 Females in Joseph?
There are 174.88 Males per 100 Females in Joseph.
What is the Ratio of Females per 100 Males in Joseph?
There are 57.18 Females per 100 Males in Joseph.
What is the Median Population Age in Joseph?
Median Population Age in Joseph is 32.3 Years.
What is the Average Family Size in Joseph
Average Family Size in Joseph is 4.4 People.
What is the Average Household Size in Joseph
Average Household Size in Joseph is 4.0 People.
How Large is the Labor Force in Joseph?
There are 301 People in the Labor Forcein in Joseph.
What is the Percentage of People in the Labor Force in Joseph?
66.2% of People are in the Labor Force in Joseph.
What is the Unemployment Rate in Joseph?
Unemployment Rate in Joseph is 11.3%.