Ivins, UT Map & Demographics
Ivins Map
Ivins Overview
$42,670
PER CAPITA INCOME
$95,223
AVG FAMILY INCOME
$67,354
AVG HOUSEHOLD INCOME
2.3%
WAGE / INCOME GAP [ % ]
97.7¢/ $1
WAGE / INCOME GAP [ $ ]
0.46
INEQUALITY / GINI INDEX
9,174
TOTAL POPULATION
4,653
MALE POPULATION
4,521
FEMALE POPULATION
102.92
MALES / 100 FEMALES
97.16
FEMALES / 100 MALES
52.4
MEDIAN AGE
2.9
AVG FAMILY SIZE
2.4
AVG HOUSEHOLD SIZE
3,670
LABOR FORCE [ PEOPLE ]
48.7%
PERCENT IN LABOR FORCE
6.2%
UNEMPLOYMENT RATE
Ivins Zip Codes
Ivins Area Codes
Income in Ivins
Income Overview in Ivins
Per Capita Income in Ivins is $42,670, while median incomes of families and households are $95,223 and $67,354 respectively.
| Characteristic | Number | Measure |
| Per Capita Income | 9,174 | $42,670 |
| Median Family Income | 2,667 | $95,223 |
| Mean Family Income | 2,667 | $109,821 |
| Median Household Income | 3,761 | $67,354 |
| Mean Household Income | 3,761 | $102,650 |
| Income Deficit | 2,667 | $0 |
| Wage / Income Gap (%) | 9,174 | 2.35% |
| Wage / Income Gap ($) | 9,174 | 97.65¢ per $1 |
| Gini / Inequality Index | 9,174 | 0.46 |
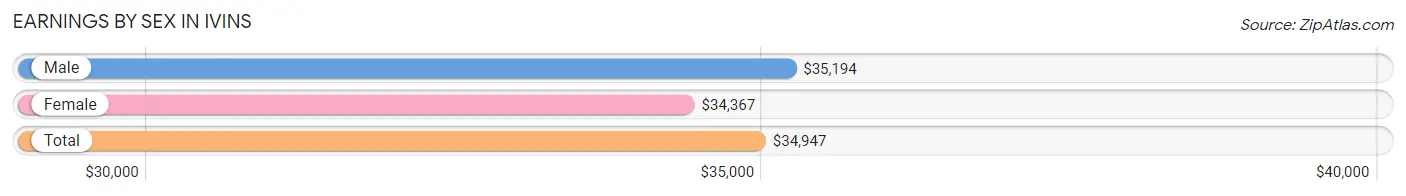
Earnings by Sex in Ivins
Average Earnings in Ivins are $34,947, $35,194 for men and $34,367 for women, a difference of 2.4%.
| Sex | Number | Average Earnings |
| Male | 2,411 (58.8%) | $35,194 |
| Female | 1,692 (41.2%) | $34,367 |
| Total | 4,103 (100.0%) | $34,947 |
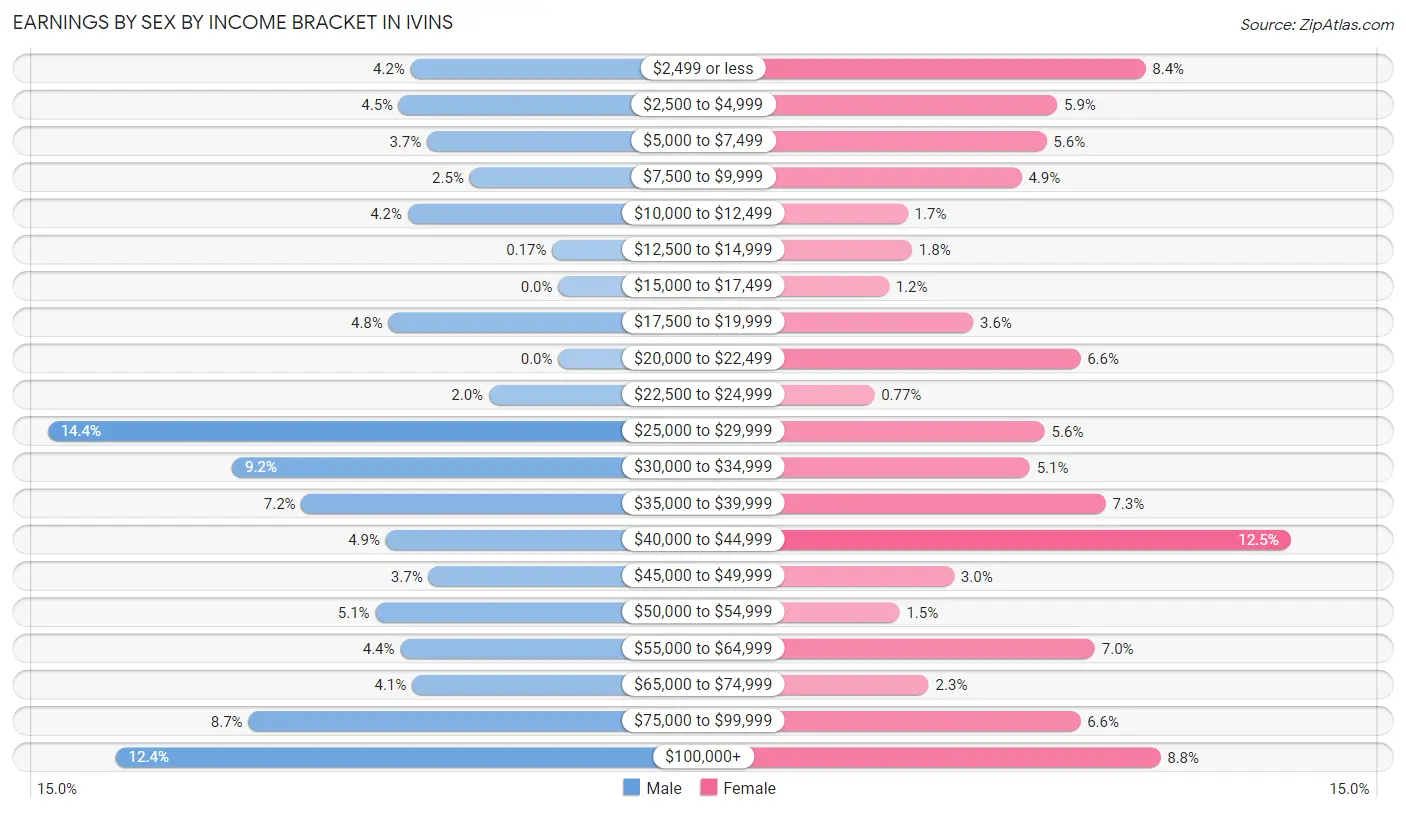
Earnings by Sex by Income Bracket in Ivins
The most common earnings brackets in Ivins are $25,000 to $29,999 for men (346 | 14.3%) and $40,000 to $44,999 for women (211 | 12.5%).
| Income | Male | Female |
| $2,499 or less | 100 (4.2%) | 142 (8.4%) |
| $2,500 to $4,999 | 108 (4.5%) | 100 (5.9%) |
| $5,000 to $7,499 | 89 (3.7%) | 95 (5.6%) |
| $7,500 to $9,999 | 60 (2.5%) | 83 (4.9%) |
| $10,000 to $12,499 | 102 (4.2%) | 29 (1.7%) |
| $12,500 to $14,999 | 4 (0.2%) | 31 (1.8%) |
| $15,000 to $17,499 | 0 (0.0%) | 20 (1.2%) |
| $17,500 to $19,999 | 115 (4.8%) | 60 (3.5%) |
| $20,000 to $22,499 | 0 (0.0%) | 111 (6.6%) |
| $22,500 to $24,999 | 47 (1.9%) | 13 (0.8%) |
| $25,000 to $29,999 | 346 (14.3%) | 94 (5.6%) |
| $30,000 to $34,999 | 221 (9.2%) | 87 (5.1%) |
| $35,000 to $39,999 | 174 (7.2%) | 123 (7.3%) |
| $40,000 to $44,999 | 117 (4.9%) | 211 (12.5%) |
| $45,000 to $49,999 | 88 (3.6%) | 51 (3.0%) |
| $50,000 to $54,999 | 124 (5.1%) | 25 (1.5%) |
| $55,000 to $64,999 | 107 (4.4%) | 118 (7.0%) |
| $65,000 to $74,999 | 99 (4.1%) | 39 (2.3%) |
| $75,000 to $99,999 | 210 (8.7%) | 111 (6.6%) |
| $100,000+ | 300 (12.4%) | 149 (8.8%) |
| Total | 2,411 (100.0%) | 1,692 (100.0%) |
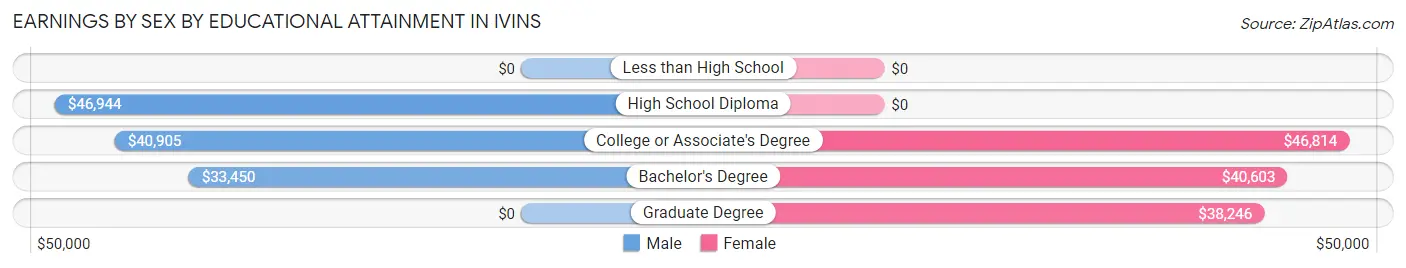
Earnings by Sex by Educational Attainment in Ivins
Average earnings in Ivins are $36,042 for men and $39,343 for women, a difference of 8.4%. Men with an educational attainment of high school diploma enjoy the highest average annual earnings of $46,944, while those with bachelor's degree education earn the least with $33,450. Women with an educational attainment of college or associate's degree earn the most with the average annual earnings of $46,814, while those with graduate degree education have the smallest earnings of $38,246.
| Educational Attainment | Male Income | Female Income |
| Less than High School | - | - |
| High School Diploma | $46,944 | $0 |
| College or Associate's Degree | $40,905 | $46,814 |
| Bachelor's Degree | $33,450 | $40,603 |
| Graduate Degree | - | - |
| Total | $36,042 | $39,343 |
Family Income in Ivins
Family Income Brackets in Ivins
According to the Ivins family income data, there are 581 families falling into the $100,000 to $149,999 income range, which is the most common income bracket and makes up 21.8% of all families. Conversely, the less than $10,000 income bracket is the least frequent group with only 13 families (0.5%) belonging to this category.
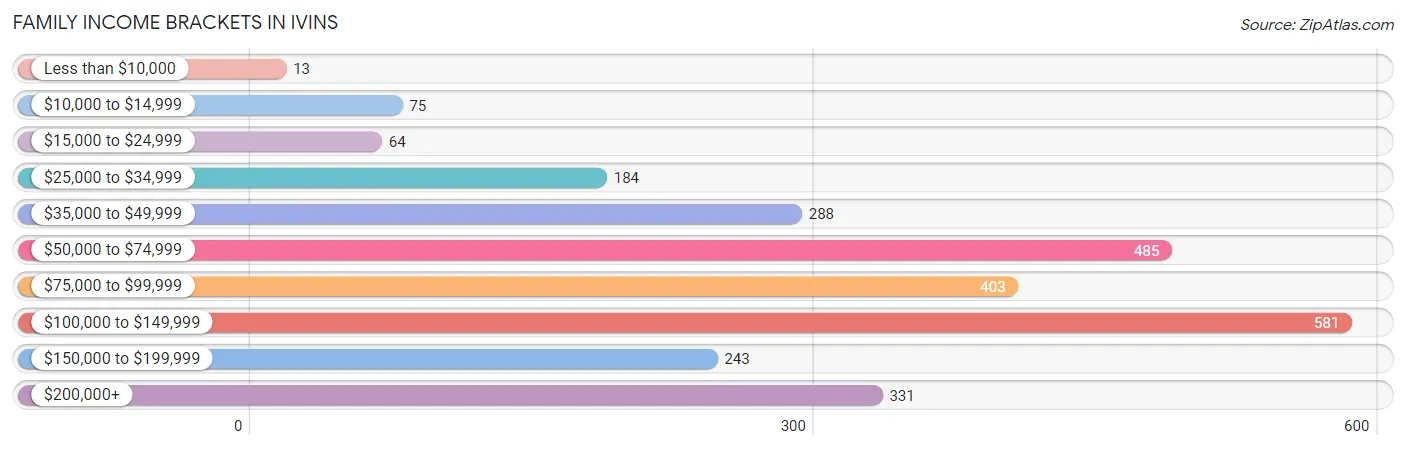
| Income Bracket | # Families | % Families |
| Less than $10,000 | 13 | 0.5% |
| $10,000 to $14,999 | 75 | 2.8% |
| $15,000 to $24,999 | 64 | 2.4% |
| $25,000 to $34,999 | 184 | 6.9% |
| $35,000 to $49,999 | 288 | 10.8% |
| $50,000 to $74,999 | 485 | 18.2% |
| $75,000 to $99,999 | 403 | 15.1% |
| $100,000 to $149,999 | 581 | 21.8% |
| $150,000 to $199,999 | 243 | 9.1% |
| $200,000+ | 331 | 12.4% |
Family Income by Famaliy Size in Ivins
2-person families (1,772 | 66.4%) account for the highest median family income in Ivins with $96,964 per family, while 2-person families (1,772 | 66.4%) have the highest median income of $48,482 per family member.
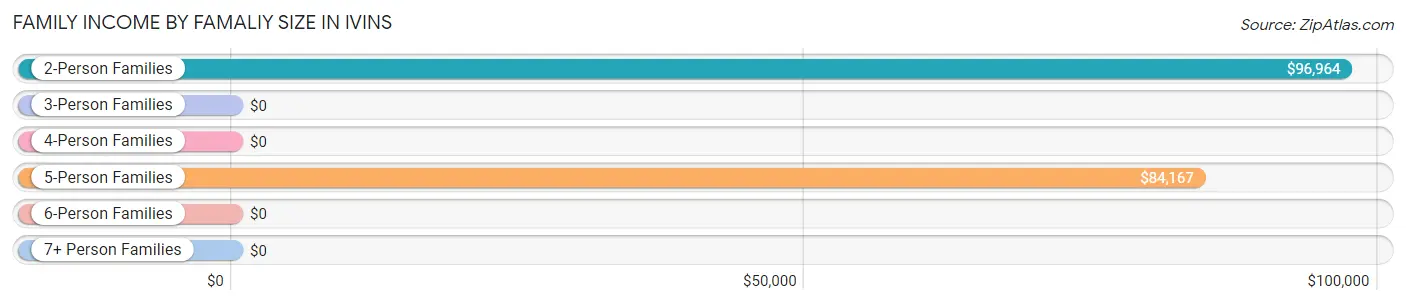
| Income Bracket | # Families | Median Income |
| 2-Person Families | 1,772 (66.4%) | $96,964 |
| 3-Person Families | 341 (12.8%) | $0 |
| 4-Person Families | 193 (7.2%) | $0 |
| 5-Person Families | 172 (6.5%) | $84,167 |
| 6-Person Families | 101 (3.8%) | $0 |
| 7+ Person Families | 88 (3.3%) | $0 |
| Total | 2,667 (100.0%) | $95,223 |
Family Income by Number of Earners in Ivins
The median family income in Ivins is $95,223, with families comprising 2 earners (860) having the highest median family income of $125,335, while families with 1 earner (672) have the lowest median family income of $47,030, accounting for 32.3% and 25.2% of families, respectively.
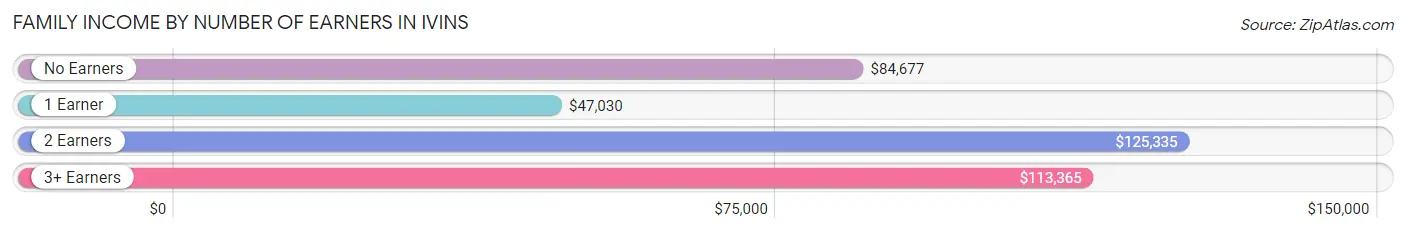
| Number of Earners | # Families | Median Income |
| No Earners | 932 (34.9%) | $84,677 |
| 1 Earner | 672 (25.2%) | $47,030 |
| 2 Earners | 860 (32.3%) | $125,335 |
| 3+ Earners | 203 (7.6%) | $113,365 |
| Total | 2,667 (100.0%) | $95,223 |
Household Income in Ivins
Household Income Brackets in Ivins
With 771 households falling in the category, the $50,000 to $74,999 income range is the most frequent in Ivins, accounting for 20.5% of all households. In contrast, only 109 households (2.9%) fall into the $10,000 to $14,999 income bracket, making it the least populous group.
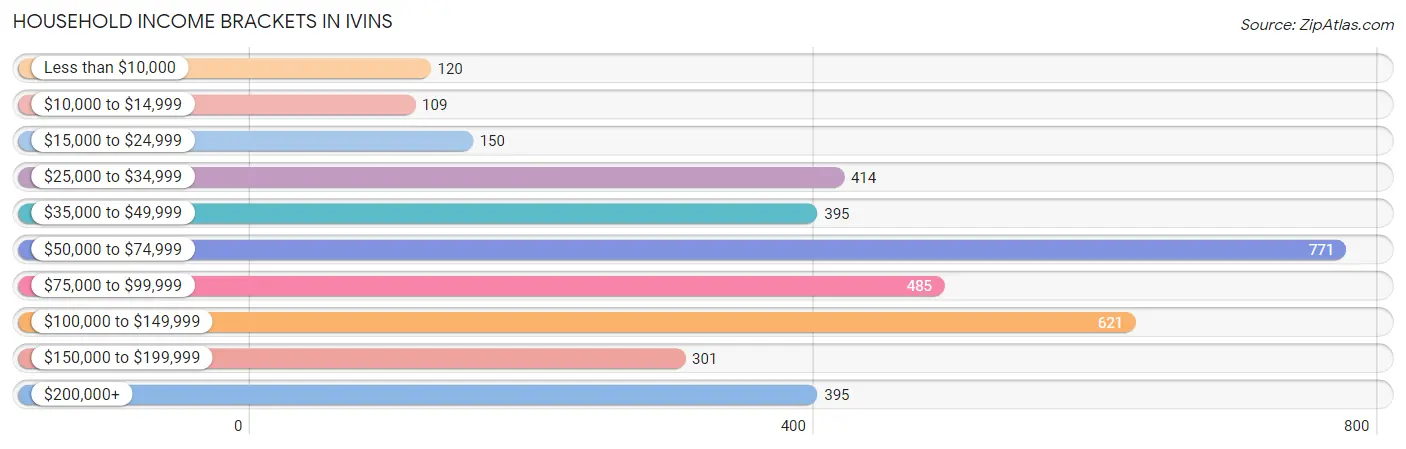
| Income Bracket | # Households | % Households |
| Less than $10,000 | 120 | 3.2% |
| $10,000 to $14,999 | 109 | 2.9% |
| $15,000 to $24,999 | 150 | 4.0% |
| $25,000 to $34,999 | 414 | 11.0% |
| $35,000 to $49,999 | 395 | 10.5% |
| $50,000 to $74,999 | 771 | 20.5% |
| $75,000 to $99,999 | 485 | 12.9% |
| $100,000 to $149,999 | 621 | 16.5% |
| $150,000 to $199,999 | 301 | 8.0% |
| $200,000+ | 395 | 10.5% |
Household Income by Householder Age in Ivins
The median household income in Ivins is $67,354, with the highest median household income of $101,765 found in the 45 to 64 years age bracket for the primary householder. A total of 1,202 households (32.0%) fall into this category. Meanwhile, the 15 to 24 years age bracket for the primary householder has the lowest median household income of $62,536, with 109 households (2.9%) in this group.
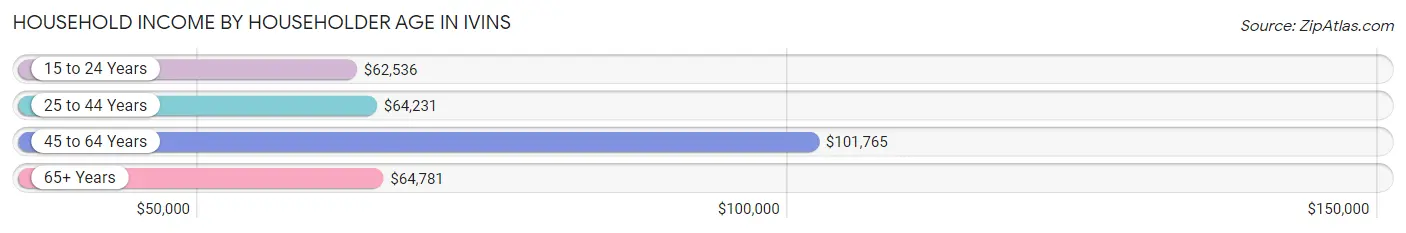
| Income Bracket | # Households | Median Income |
| 15 to 24 Years | 109 (2.9%) | $62,536 |
| 25 to 44 Years | 656 (17.4%) | $64,231 |
| 45 to 64 Years | 1,202 (32.0%) | $101,765 |
| 65+ Years | 1,794 (47.7%) | $64,781 |
| Total | 3,761 (100.0%) | $67,354 |
Poverty in Ivins
Income Below Poverty by Sex and Age in Ivins
With 8.5% poverty level for males and 13.9% for females among the residents of Ivins, under 5 year old males and 6 to 11 year old females are the most vulnerable to poverty, with 69 males (36.3%) and 168 females (43.3%) in their respective age groups living below the poverty level.
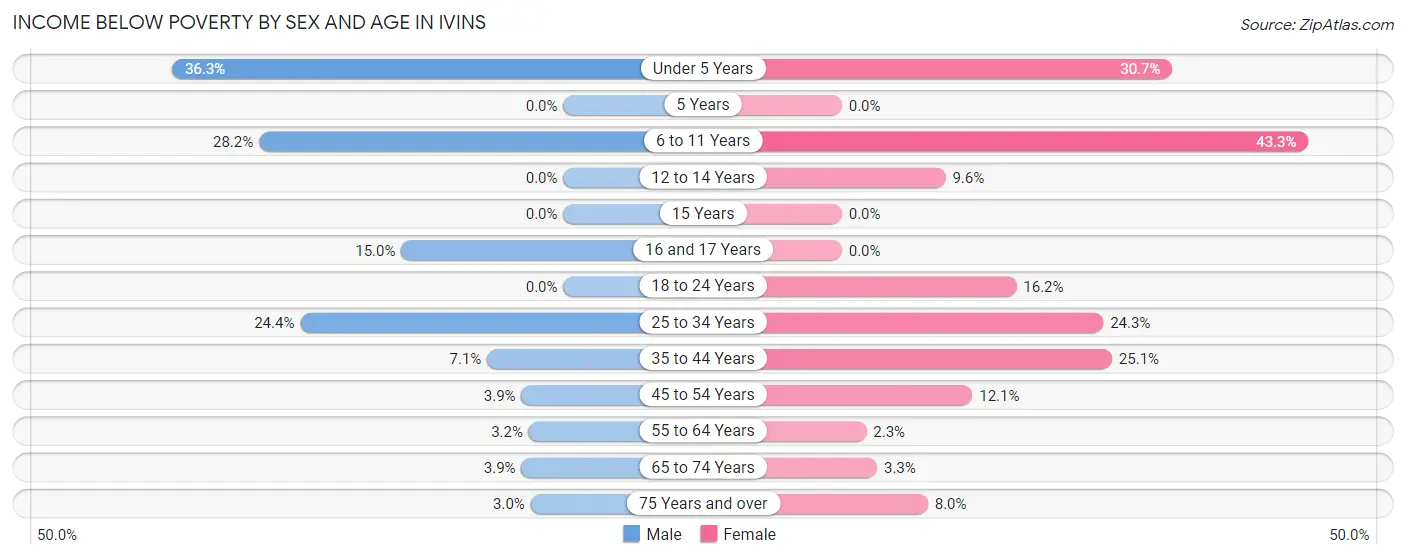
| Age Bracket | Male | Female |
| Under 5 Years | 69 (36.3%) | 73 (30.7%) |
| 5 Years | 0 (0.0%) | 0 (0.0%) |
| 6 to 11 Years | 85 (28.2%) | 168 (43.3%) |
| 12 to 14 Years | 0 (0.0%) | 20 (9.6%) |
| 15 Years | 0 (0.0%) | 0 (0.0%) |
| 16 and 17 Years | 17 (15.0%) | 0 (0.0%) |
| 18 to 24 Years | 0 (0.0%) | 58 (16.2%) |
| 25 to 34 Years | 94 (24.4%) | 82 (24.3%) |
| 35 to 44 Years | 36 (7.1%) | 89 (25.1%) |
| 45 to 54 Years | 23 (3.9%) | 50 (12.1%) |
| 55 to 64 Years | 20 (3.2%) | 14 (2.3%) |
| 65 to 74 Years | 32 (3.9%) | 31 (3.3%) |
| 75 Years and over | 20 (3.0%) | 40 (8.0%) |
| Total | 396 (8.5%) | 625 (13.9%) |
Income Above Poverty by Sex and Age in Ivins
According to the poverty statistics in Ivins, males aged 12 to 14 years and females aged 5 years are the age groups that are most secure financially, with 100.0% of males and 100.0% of females in these age groups living above the poverty line.
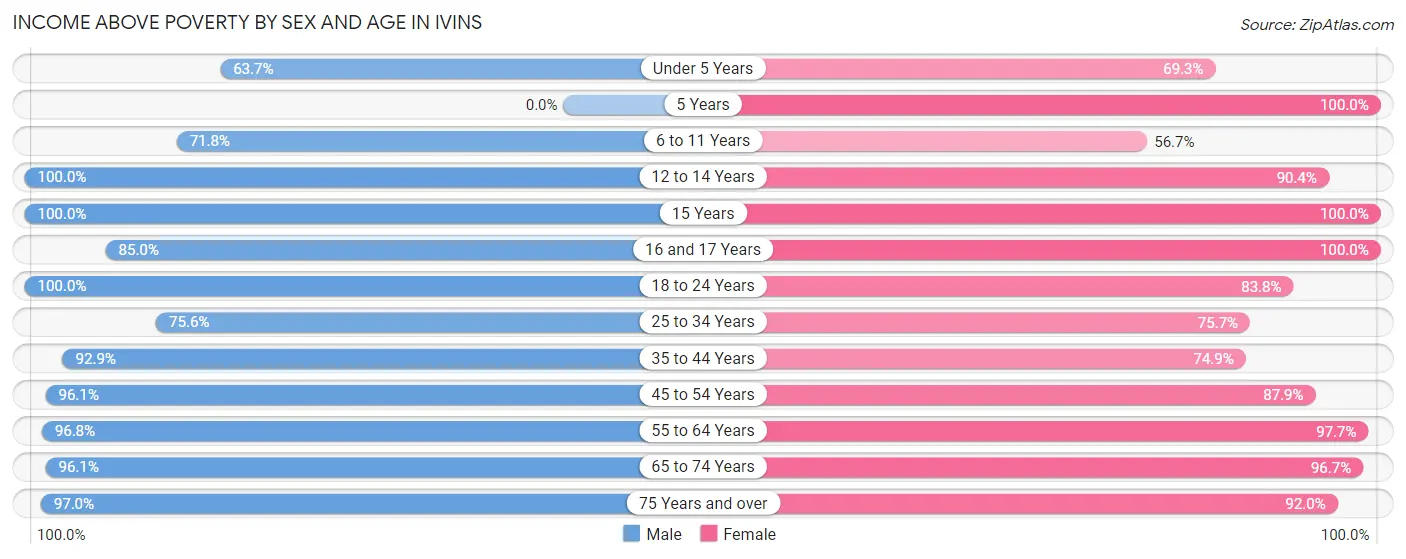
| Age Bracket | Male | Female |
| Under 5 Years | 121 (63.7%) | 165 (69.3%) |
| 5 Years | 0 (0.0%) | 23 (100.0%) |
| 6 to 11 Years | 216 (71.8%) | 220 (56.7%) |
| 12 to 14 Years | 109 (100.0%) | 188 (90.4%) |
| 15 Years | 176 (100.0%) | 5 (100.0%) |
| 16 and 17 Years | 96 (85.0%) | 92 (100.0%) |
| 18 to 24 Years | 164 (100.0%) | 300 (83.8%) |
| 25 to 34 Years | 291 (75.6%) | 256 (75.7%) |
| 35 to 44 Years | 473 (92.9%) | 266 (74.9%) |
| 45 to 54 Years | 569 (96.1%) | 363 (87.9%) |
| 55 to 64 Years | 603 (96.8%) | 601 (97.7%) |
| 65 to 74 Years | 790 (96.1%) | 917 (96.7%) |
| 75 Years and over | 640 (97.0%) | 461 (92.0%) |
| Total | 4,248 (91.5%) | 3,857 (86.1%) |
Income Below Poverty Among Married-Couple Families in Ivins
The poverty statistics for married-couple families in Ivins show that 5.5% or 127 of the total 2,301 families live below the poverty line. Families with 5 or more children have the highest poverty rate of 61.2%, comprising of 41 families. On the other hand, families with no children have the lowest poverty rate of 2.8%, which includes 47 families.
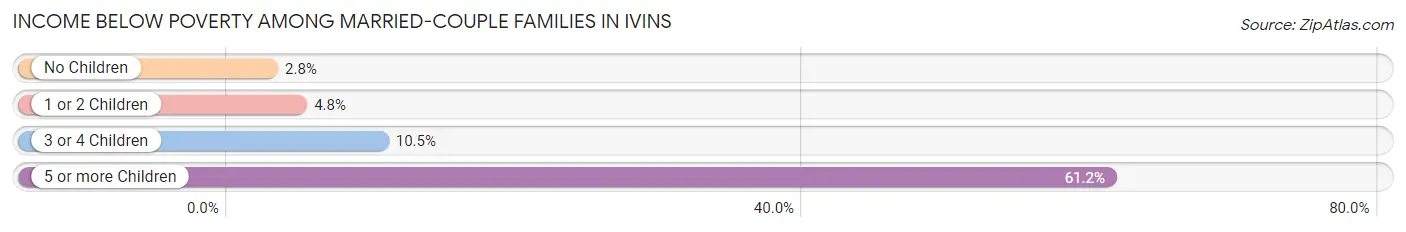
| Children | Above Poverty | Below Poverty |
| No Children | 1,636 (97.2%) | 47 (2.8%) |
| 1 or 2 Children | 316 (95.2%) | 16 (4.8%) |
| 3 or 4 Children | 196 (89.5%) | 23 (10.5%) |
| 5 or more Children | 26 (38.8%) | 41 (61.2%) |
| Total | 2,174 (94.5%) | 127 (5.5%) |
Income Below Poverty Among Single-Parent Households in Ivins
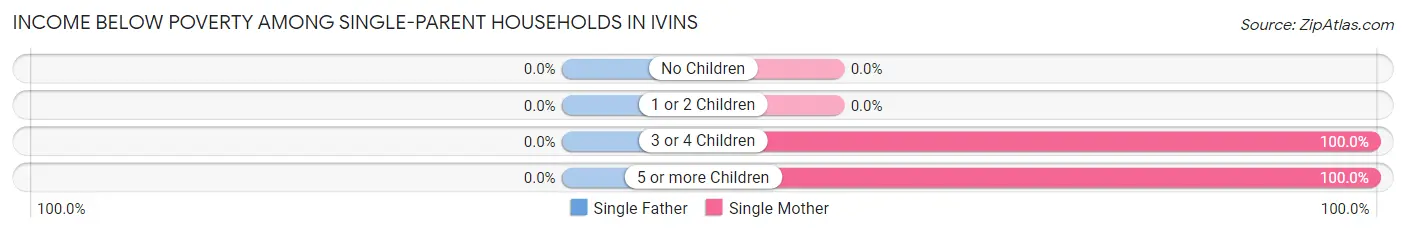
| Children | Single Father | Single Mother |
| No Children | 0 (0.0%) | 0 (0.0%) |
| 1 or 2 Children | 0 (0.0%) | 0 (0.0%) |
| 3 or 4 Children | 0 (0.0%) | 26 (100.0%) |
| 5 or more Children | 0 (0.0%) | 21 (100.0%) |
| Total | 0 (0.0%) | 47 (23.3%) |
Income Below Poverty Among Married-Couple vs Single-Parent Households in Ivins
The poverty data for Ivins shows that 127 of the married-couple family households (5.5%) and 47 of the single-parent households (12.8%) are living below the poverty level. Within the married-couple family households, those with 5 or more children have the highest poverty rate, with 41 households (61.2%) falling below the poverty line. Among the single-parent households, those with 3 or 4 children have the highest poverty rate, with 26 household (100.0%) living below poverty.
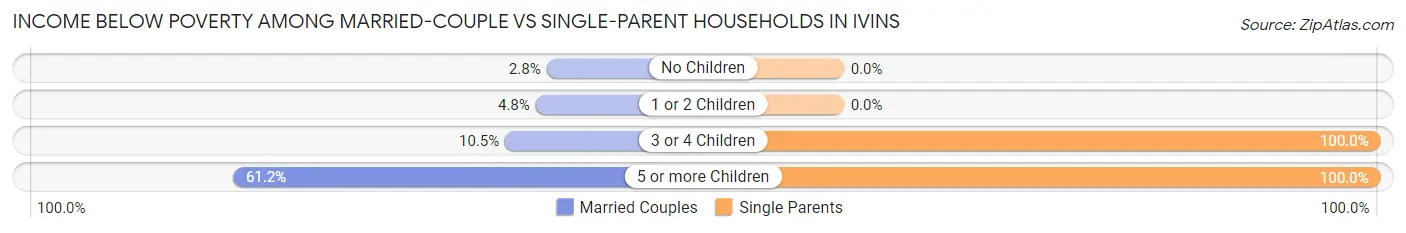
| Children | Married-Couple Families | Single-Parent Households |
| No Children | 47 (2.8%) | 0 (0.0%) |
| 1 or 2 Children | 16 (4.8%) | 0 (0.0%) |
| 3 or 4 Children | 23 (10.5%) | 26 (100.0%) |
| 5 or more Children | 41 (61.2%) | 21 (100.0%) |
| Total | 127 (5.5%) | 47 (12.8%) |
Race in Ivins
The most populous races in Ivins are White / Caucasian (8,438 | 92.0%), Hispanic or Latino (634 | 6.9%), and Two or more Races (450 | 4.9%).
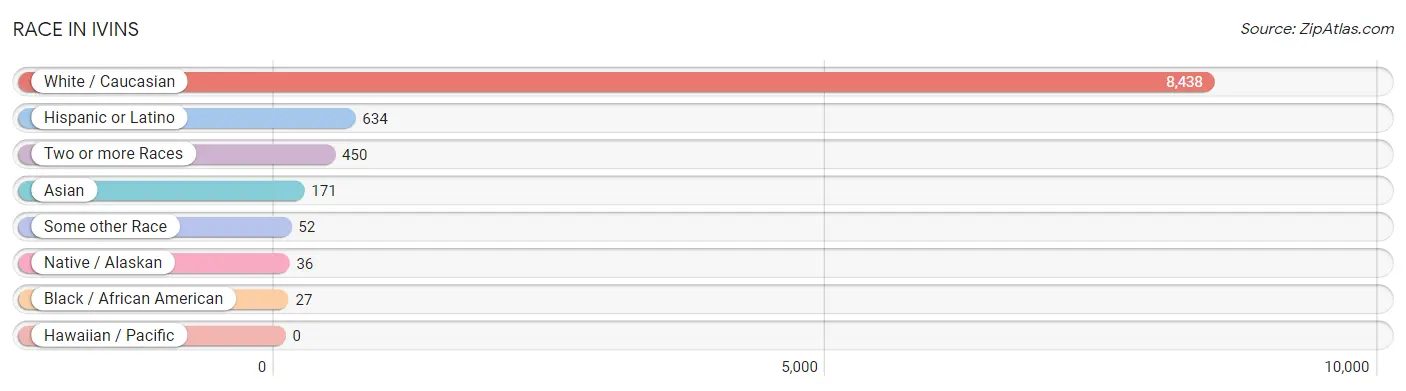
| Race | # Population | % Population |
| Asian | 171 | 1.9% |
| Black / African American | 27 | 0.3% |
| Hawaiian / Pacific | 0 | 0.0% |
| Hispanic or Latino | 634 | 6.9% |
| Native / Alaskan | 36 | 0.4% |
| White / Caucasian | 8,438 | 92.0% |
| Two or more Races | 450 | 4.9% |
| Some other Race | 52 | 0.6% |
| Total | 9,174 | 100.0% |
Ancestry in Ivins
The most populous ancestries reported in Ivins are English (2,647 | 28.8%), German (1,229 | 13.4%), American (926 | 10.1%), Norwegian (597 | 6.5%), and Mexican (511 | 5.6%), together accounting for 64.4% of all Ivins residents.
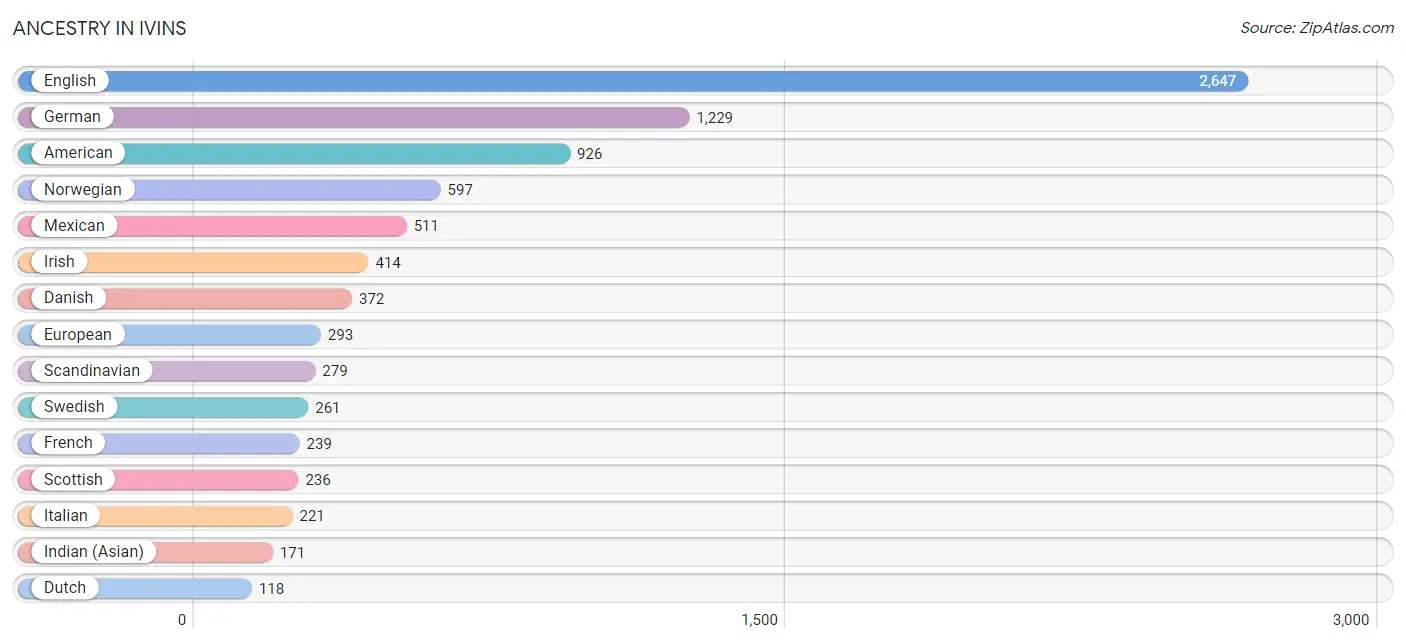
| Ancestry | # Population | % Population |
| American | 926 | 10.1% |
| Arab | 57 | 0.6% |
| Basque | 46 | 0.5% |
| Belgian | 15 | 0.2% |
| Bhutanese | 20 | 0.2% |
| Brazilian | 18 | 0.2% |
| British | 95 | 1.0% |
| Burmese | 101 | 1.1% |
| Cherokee | 18 | 0.2% |
| Chickasaw | 18 | 0.2% |
| Chilean | 27 | 0.3% |
| Czech | 30 | 0.3% |
| Czechoslovakian | 14 | 0.2% |
| Danish | 372 | 4.1% |
| Dutch | 118 | 1.3% |
| Eastern European | 44 | 0.5% |
| English | 2,647 | 28.8% |
| European | 293 | 3.2% |
| Finnish | 7 | 0.1% |
| French | 239 | 2.6% |
| French Canadian | 15 | 0.2% |
| German | 1,229 | 13.4% |
| Greek | 14 | 0.2% |
| Haitian | 12 | 0.1% |
| Hungarian | 73 | 0.8% |
| Icelander | 29 | 0.3% |
| Indian (Asian) | 171 | 1.9% |
| Irish | 414 | 4.5% |
| Italian | 221 | 2.4% |
| Korean | 100 | 1.1% |
| Latvian | 9 | 0.1% |
| Lebanese | 57 | 0.6% |
| Lithuanian | 21 | 0.2% |
| Mexican | 511 | 5.6% |
| Mexican American Indian | 10 | 0.1% |
| Native Hawaiian | 118 | 1.3% |
| Northern European | 34 | 0.4% |
| Norwegian | 597 | 6.5% |
| Polish | 32 | 0.4% |
| Portuguese | 73 | 0.8% |
| Puerto Rican | 13 | 0.1% |
| Romanian | 14 | 0.2% |
| Samoan | 118 | 1.3% |
| Scandinavian | 279 | 3.0% |
| Scotch-Irish | 113 | 1.2% |
| Scottish | 236 | 2.6% |
| Serbian | 15 | 0.2% |
| Slavic | 13 | 0.1% |
| Slovak | 15 | 0.2% |
| South American | 35 | 0.4% |
| Spaniard | 75 | 0.8% |
| Swedish | 261 | 2.8% |
| Swiss | 40 | 0.4% |
| Ukrainian | 112 | 1.2% |
| Uruguayan | 8 | 0.1% |
| Welsh | 54 | 0.6% | View All 56 Rows |
Immigrants in Ivins
The most numerous immigrant groups reported in Ivins came from Latin America (140 | 1.5%), Central America (88 | 1.0%), Mexico (88 | 1.0%), Asia (70 | 0.8%), and Eastern Asia (49 | 0.5%), together accounting for 4.7% of all Ivins residents.
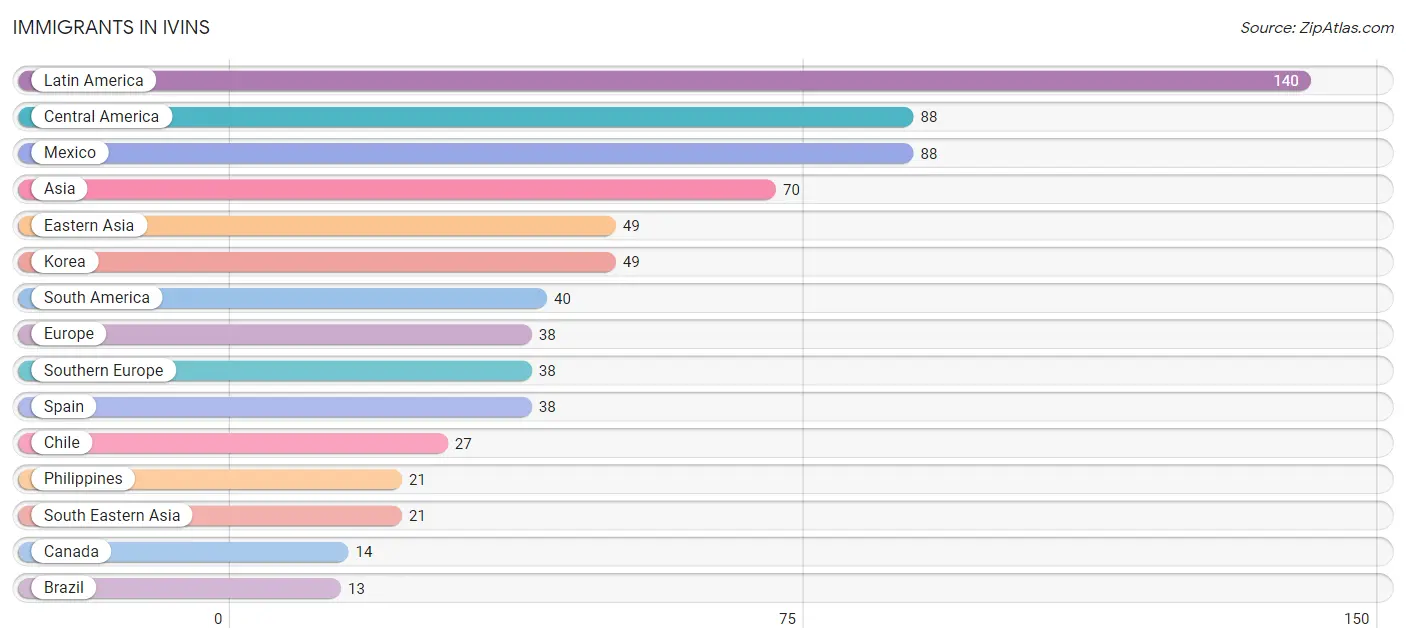
| Immigration Origin | # Population | % Population |
| Asia | 70 | 0.8% |
| Brazil | 13 | 0.1% |
| Canada | 14 | 0.2% |
| Caribbean | 12 | 0.1% |
| Central America | 88 | 1.0% |
| Chile | 27 | 0.3% |
| Eastern Asia | 49 | 0.5% |
| Europe | 38 | 0.4% |
| Haiti | 12 | 0.1% |
| Korea | 49 | 0.5% |
| Latin America | 140 | 1.5% |
| Mexico | 88 | 1.0% |
| Philippines | 21 | 0.2% |
| South America | 40 | 0.4% |
| South Eastern Asia | 21 | 0.2% |
| Southern Europe | 38 | 0.4% |
| Spain | 38 | 0.4% | View All 17 Rows |
Sex and Age in Ivins
Sex and Age in Ivins
The most populous age groups in Ivins are 75 to 79 Years (432 | 9.3%) for men and 65 to 69 Years (519 | 11.5%) for women.
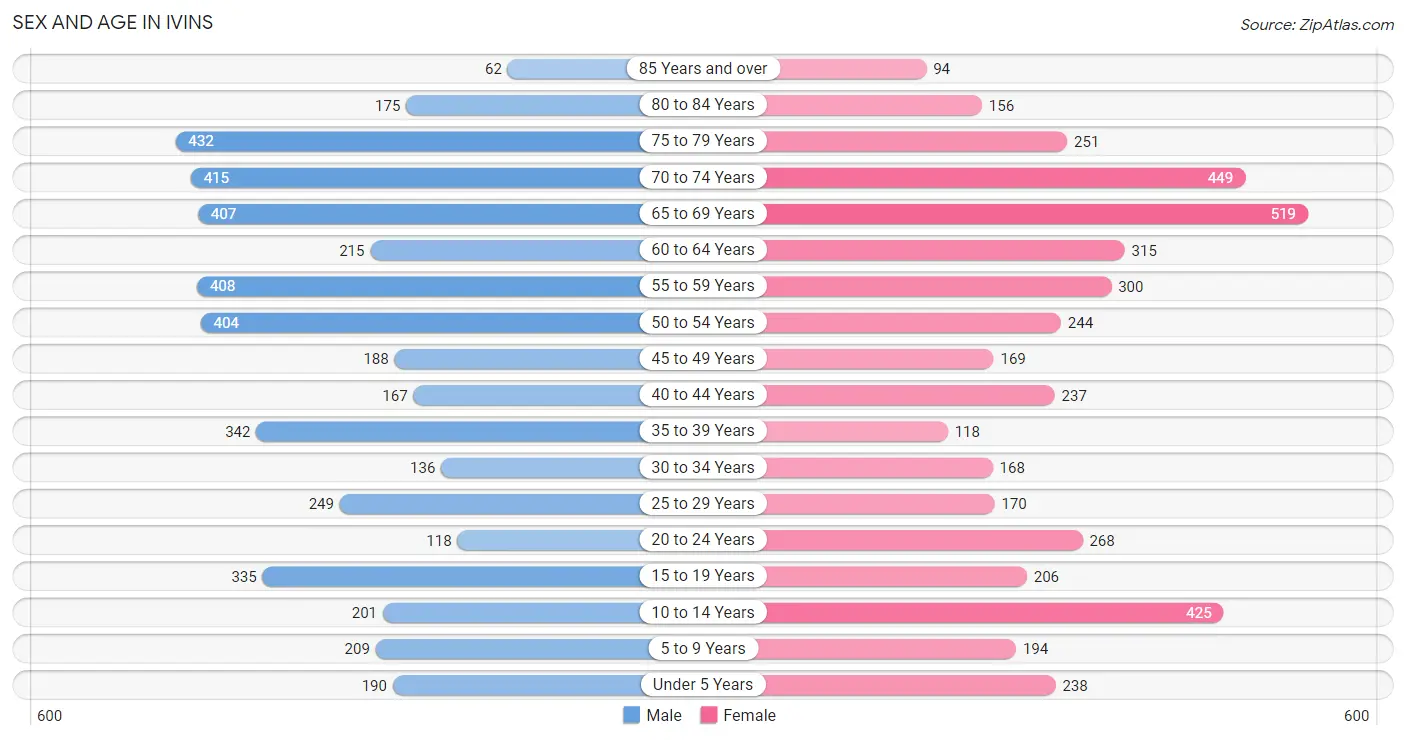
| Age Bracket | Male | Female |
| Under 5 Years | 190 (4.1%) | 238 (5.3%) |
| 5 to 9 Years | 209 (4.5%) | 194 (4.3%) |
| 10 to 14 Years | 201 (4.3%) | 425 (9.4%) |
| 15 to 19 Years | 335 (7.2%) | 206 (4.6%) |
| 20 to 24 Years | 118 (2.5%) | 268 (5.9%) |
| 25 to 29 Years | 249 (5.3%) | 170 (3.8%) |
| 30 to 34 Years | 136 (2.9%) | 168 (3.7%) |
| 35 to 39 Years | 342 (7.3%) | 118 (2.6%) |
| 40 to 44 Years | 167 (3.6%) | 237 (5.2%) |
| 45 to 49 Years | 188 (4.0%) | 169 (3.7%) |
| 50 to 54 Years | 404 (8.7%) | 244 (5.4%) |
| 55 to 59 Years | 408 (8.8%) | 300 (6.6%) |
| 60 to 64 Years | 215 (4.6%) | 315 (7.0%) |
| 65 to 69 Years | 407 (8.7%) | 519 (11.5%) |
| 70 to 74 Years | 415 (8.9%) | 449 (9.9%) |
| 75 to 79 Years | 432 (9.3%) | 251 (5.6%) |
| 80 to 84 Years | 175 (3.8%) | 156 (3.5%) |
| 85 Years and over | 62 (1.3%) | 94 (2.1%) |
| Total | 4,653 (100.0%) | 4,521 (100.0%) |
Families and Households in Ivins
Median Family Size in Ivins
The median family size in Ivins is 2.92 persons per family, with single female/mother families (202 | 7.6%) accounting for the largest median family size of 3.54 persons per family. On the other hand, married-couple families (2,301 | 86.3%) represent the smallest median family size with 2.85 persons per family.
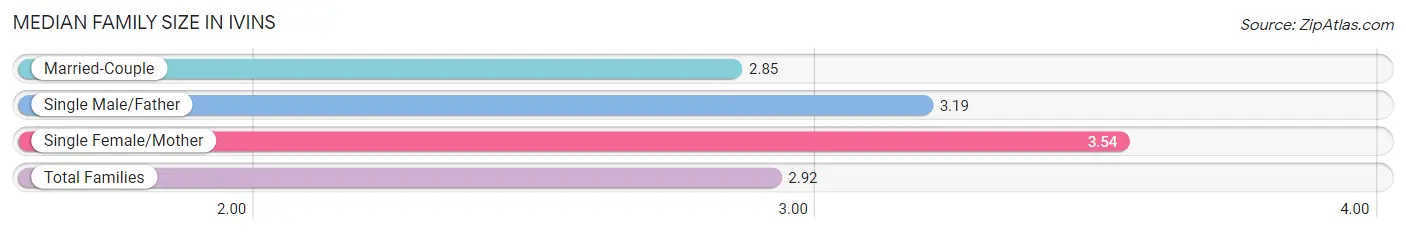
| Family Type | # Families | Family Size |
| Married-Couple | 2,301 (86.3%) | 2.85 |
| Single Male/Father | 164 (6.1%) | 3.19 |
| Single Female/Mother | 202 (7.6%) | 3.54 |
| Total Families | 2,667 (100.0%) | 2.92 |
Median Household Size in Ivins
The median household size in Ivins is 2.43 persons per household, with single female/mother households (202 | 5.4%) accounting for the largest median household size of 3.61 persons per household. non-family households (1,094 | 29.1%) represent the smallest median household size with 1.12 persons per household.
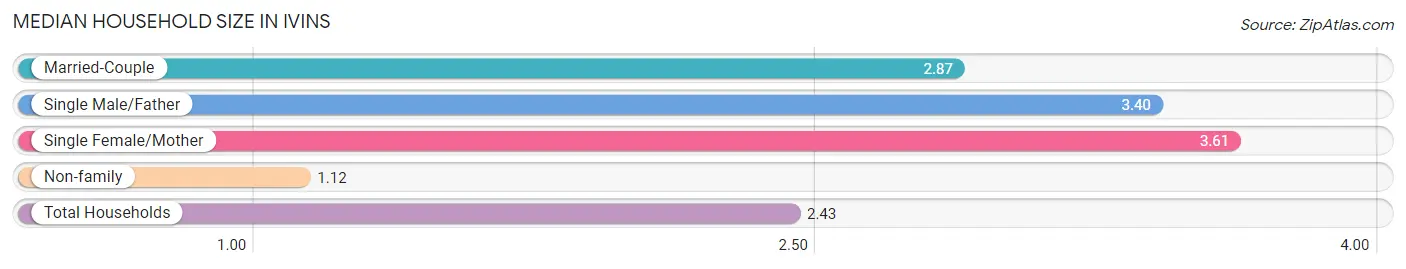
| Household Type | # Households | Household Size |
| Married-Couple | 2,301 (61.2%) | 2.87 |
| Single Male/Father | 164 (4.4%) | 3.40 |
| Single Female/Mother | 202 (5.4%) | 3.61 |
| Non-family | 1,094 (29.1%) | 1.12 |
| Total Households | 3,761 (100.0%) | 2.43 |
Household Size by Marriage Status in Ivins
Out of a total of 3,761 households in Ivins, 2,667 (70.9%) are family households, while 1,094 (29.1%) are nonfamily households. The most numerous type of family households are 2-person households, comprising 1,736, and the most common type of nonfamily households are 1-person households, comprising 952.
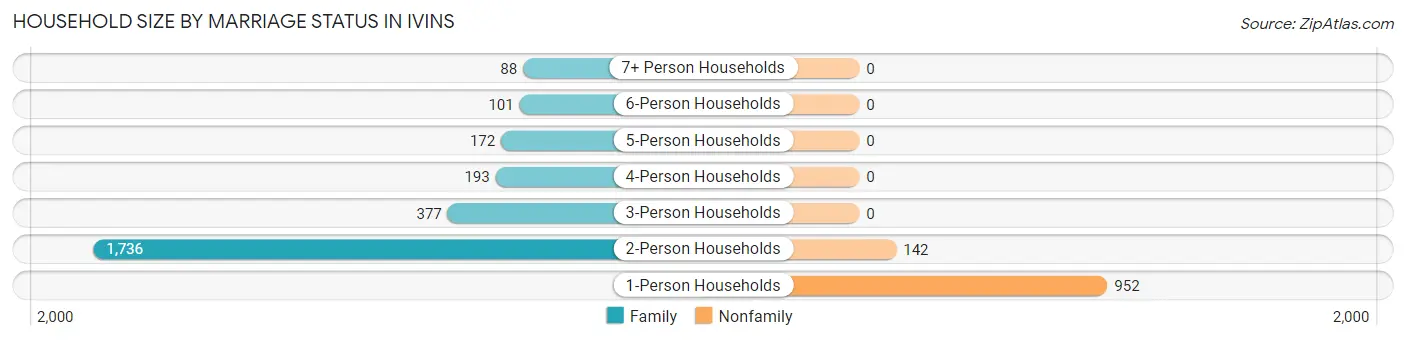
| Household Size | Family Households | Nonfamily Households |
| 1-Person Households | - | 952 (25.3%) |
| 2-Person Households | 1,736 (46.2%) | 142 (3.8%) |
| 3-Person Households | 377 (10.0%) | 0 (0.0%) |
| 4-Person Households | 193 (5.1%) | 0 (0.0%) |
| 5-Person Households | 172 (4.6%) | 0 (0.0%) |
| 6-Person Households | 101 (2.7%) | 0 (0.0%) |
| 7+ Person Households | 88 (2.3%) | 0 (0.0%) |
| Total | 2,667 (70.9%) | 1,094 (29.1%) |
Female Fertility in Ivins
Fertility by Age in Ivins
Average fertility rate in Ivins is 79.0 births per 1,000 women. Women in the age bracket of 20 to 34 years have the highest fertility rate with 178.0 births per 1,000 women. Women in the age bracket of 20 to 34 years acount for 100.0% of all women with births.
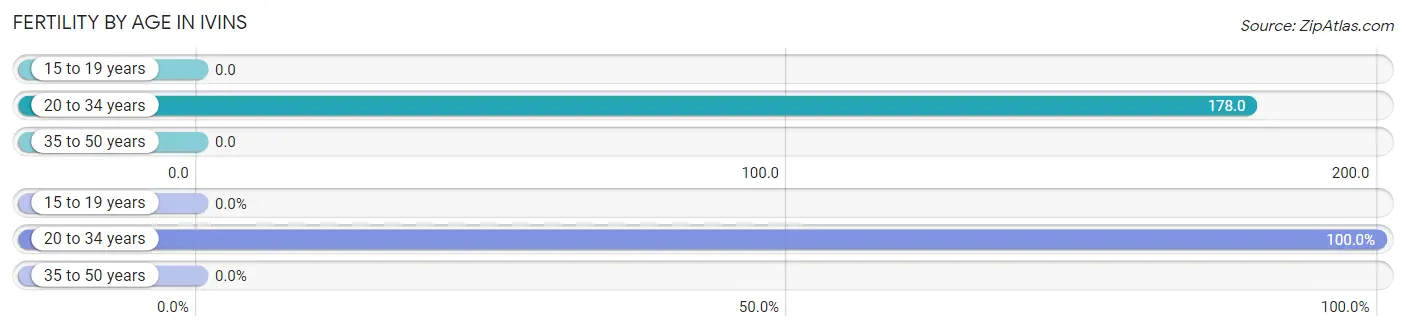
| Age Bracket | Women with Births | Births / 1,000 Women |
| 15 to 19 years | 0 (0.0%) | 0.0 |
| 20 to 34 years | 108 (100.0%) | 178.0 |
| 35 to 50 years | 0 (0.0%) | 0.0 |
| Total | 108 (100.0%) | 79.0 |
Fertility by Age by Marriage Status in Ivins
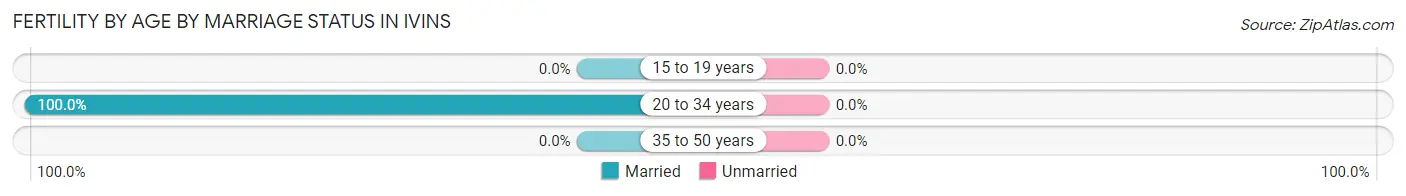
| Age Bracket | Married | Unmarried |
| 15 to 19 years | 0 (0.0%) | 0 (0.0%) |
| 20 to 34 years | 108 (100.0%) | 0 (0.0%) |
| 35 to 50 years | 0 (0.0%) | 0 (0.0%) |
| Total | 108 (100.0%) | 0 (0.0%) |
Fertility by Education in Ivins
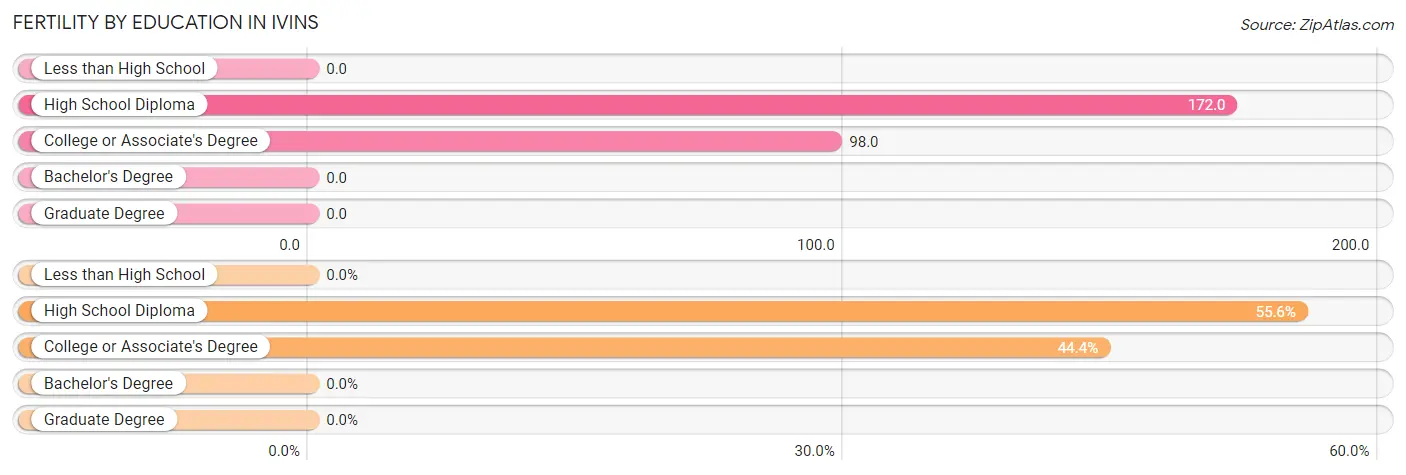
| Educational Attainment | Women with Births | Births / 1,000 Women |
| Less than High School | 0 (0.0%) | 0.0 |
| High School Diploma | 60 (55.6%) | 172.0 |
| College or Associate's Degree | 48 (44.4%) | 98.0 |
| Bachelor's Degree | 0 (0.0%) | 0.0 |
| Graduate Degree | 0 (0.0%) | 0.0 |
| Total | 108 (100.0%) | 79.0 |
Fertility by Education by Marriage Status in Ivins
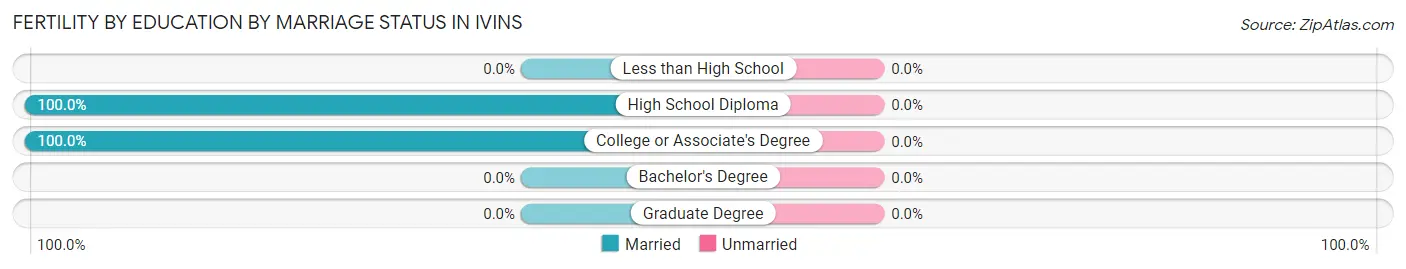
| Educational Attainment | Married | Unmarried |
| Less than High School | 0 (0.0%) | 0 (0.0%) |
| High School Diploma | 60 (100.0%) | 0 (0.0%) |
| College or Associate's Degree | 48 (100.0%) | 0 (0.0%) |
| Bachelor's Degree | 0 (0.0%) | 0 (0.0%) |
| Graduate Degree | 0 (0.0%) | 0 (0.0%) |
| Total | 108 (100.0%) | 0 (0.0%) |
Employment Characteristics in Ivins
Employment by Class of Employer in Ivins
Among the 3,429 employed individuals in Ivins, private company employees (2,197 | 64.1%), self-employed (incorporated) (391 | 11.4%), and self-employed (not incorporated) (251 | 7.3%) make up the most common classes of employment.
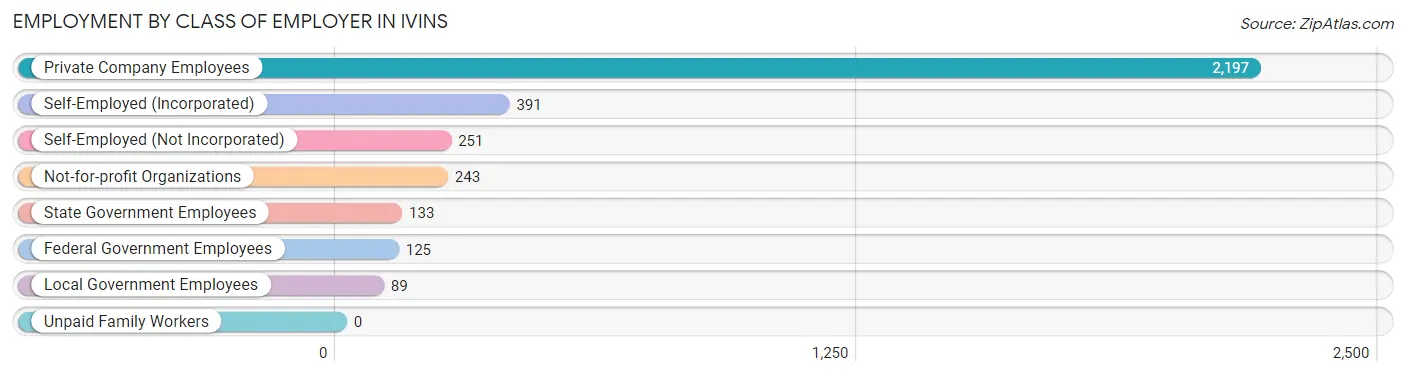
| Employer Class | # Employees | % Employees |
| Private Company Employees | 2,197 | 64.1% |
| Self-Employed (Incorporated) | 391 | 11.4% |
| Self-Employed (Not Incorporated) | 251 | 7.3% |
| Not-for-profit Organizations | 243 | 7.1% |
| Local Government Employees | 89 | 2.6% |
| State Government Employees | 133 | 3.9% |
| Federal Government Employees | 125 | 3.6% |
| Unpaid Family Workers | 0 | 0.0% |
| Total | 3,429 | 100.0% |
Employment Status by Age in Ivins
According to the labor force statistics for Ivins, out of the total population over 16 years of age (7,536), 48.7% or 3,670 individuals are in the labor force, with 6.2% or 228 of them unemployed. The age group with the highest labor force participation rate is 35 to 44 years, with 88.0% or 760 individuals in the labor force. Within the labor force, the 20 to 24 years age range has the highest percentage of unemployed individuals, with 28.3% or 78 of them being unemployed.
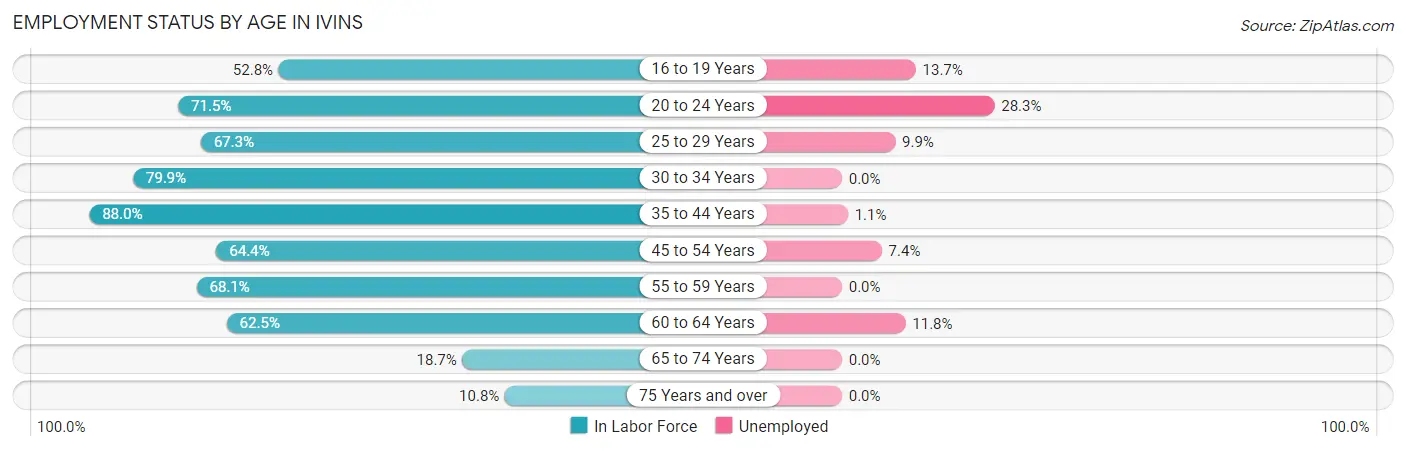
| Age Bracket | In Labor Force | Unemployed |
| 16 to 19 Years | 190 (52.8%) | 26 (13.7%) |
| 20 to 24 Years | 276 (71.5%) | 78 (28.3%) |
| 25 to 29 Years | 282 (67.3%) | 28 (9.9%) |
| 30 to 34 Years | 243 (79.9%) | 0 (0.0%) |
| 35 to 44 Years | 760 (88.0%) | 8 (1.1%) |
| 45 to 54 Years | 647 (64.4%) | 48 (7.4%) |
| 55 to 59 Years | 482 (68.1%) | 0 (0.0%) |
| 60 to 64 Years | 331 (62.5%) | 39 (11.8%) |
| 65 to 74 Years | 335 (18.7%) | 0 (0.0%) |
| 75 Years and over | 126 (10.8%) | 0 (0.0%) |
| Total | 3,670 (48.7%) | 228 (6.2%) |
Employment Status by Educational Attainment in Ivins
According to labor force statistics for Ivins, 71.7% of individuals (2,746) out of the total population between 25 and 64 years of age (3,830) are in the labor force, with 4.5% or 124 of them being unemployed. The group with the highest labor force participation rate are those with the educational attainment of less than high school, with 88.8% or 158 individuals in the labor force. Within the labor force, individuals with bachelor's degree or higher education have the highest percentage of unemployment, with 5.6% or 64 of them being unemployed.
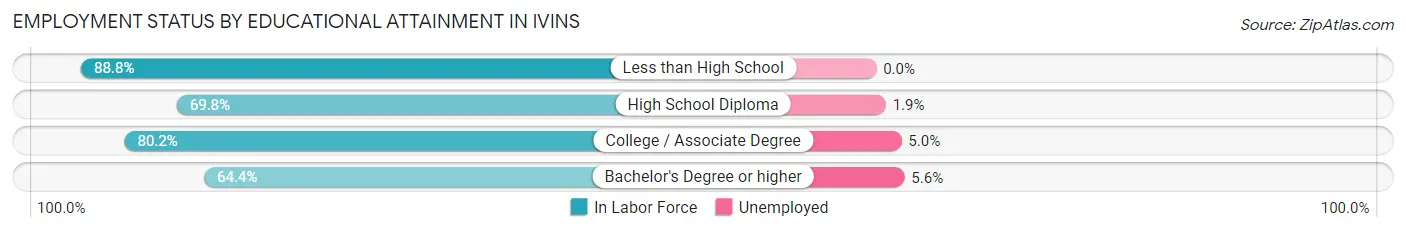
| Educational Attainment | In Labor Force | Unemployed |
| Less than High School | 158 (88.8%) | 0 (0.0%) |
| High School Diploma | 419 (69.8%) | 11 (1.9%) |
| College / Associate Degree | 1,027 (80.2%) | 64 (5.0%) |
| Bachelor's Degree or higher | 1,141 (64.4%) | 99 (5.6%) |
| Total | 2,746 (71.7%) | 172 (4.5%) |
Employment Occupations by Sex in Ivins
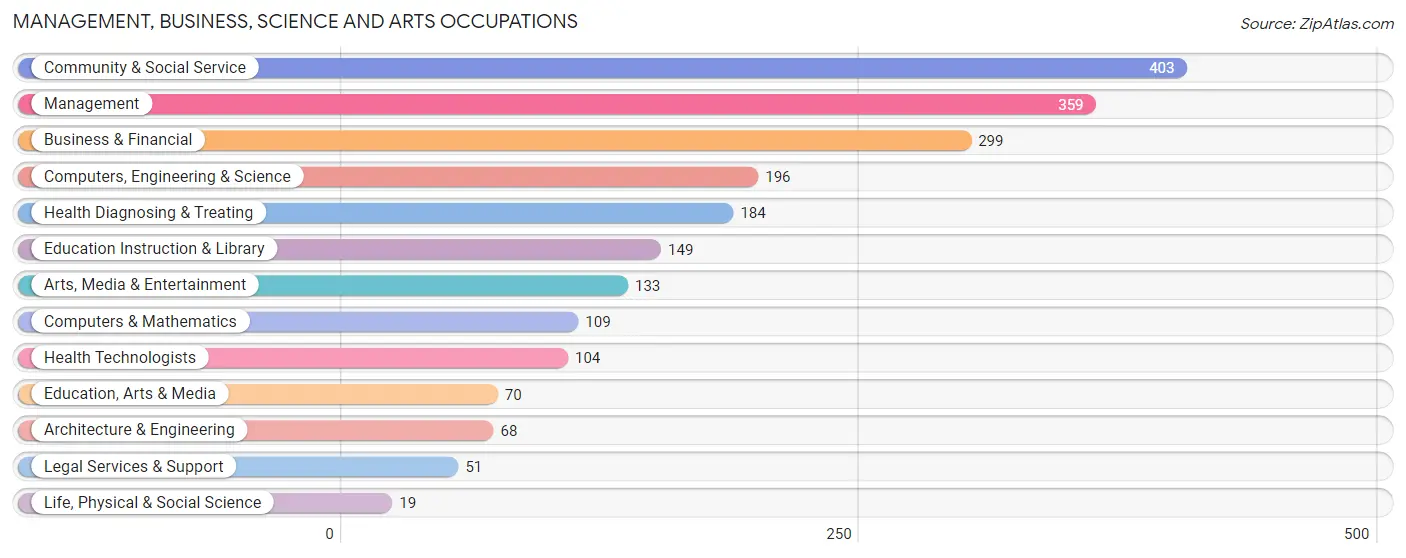
Management, Business, Science and Arts Occupations
The most common Management, Business, Science and Arts occupations in Ivins are Community & Social Service (403 | 11.8%), Management (359 | 10.5%), Business & Financial (299 | 8.7%), Computers, Engineering & Science (196 | 5.7%), and Health Diagnosing & Treating (184 | 5.4%).
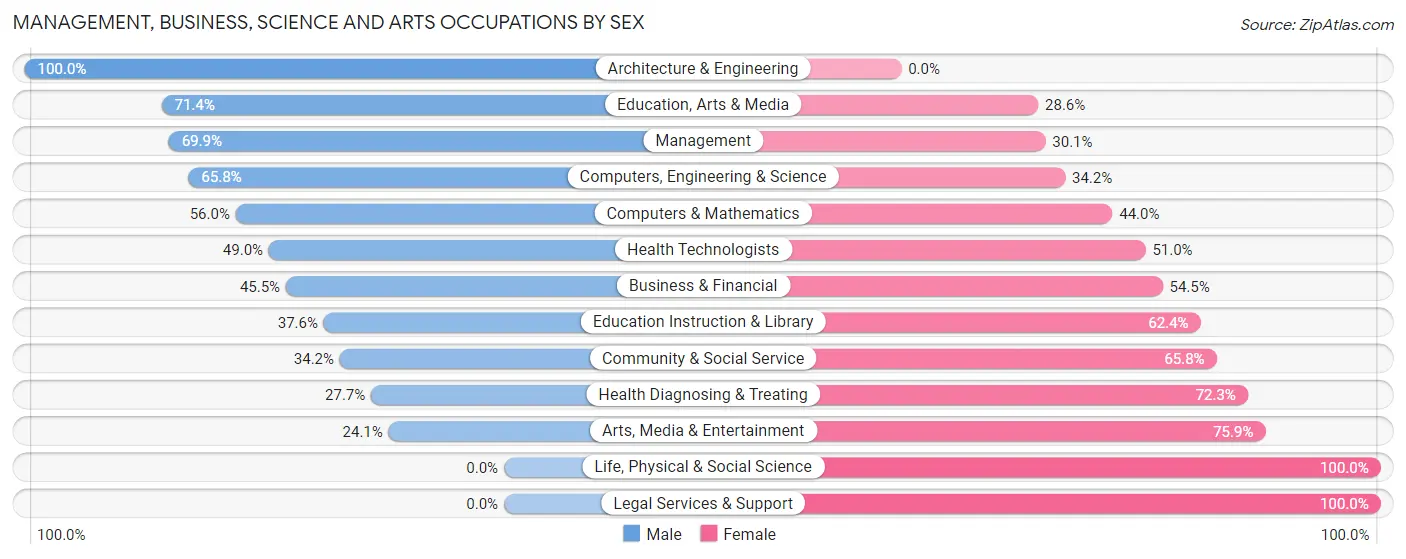
Management, Business, Science and Arts Occupations by Sex
Within the Management, Business, Science and Arts occupations in Ivins, the most male-oriented occupations are Architecture & Engineering (100.0%), Education, Arts & Media (71.4%), and Management (69.9%), while the most female-oriented occupations are Life, Physical & Social Science (100.0%), Legal Services & Support (100.0%), and Arts, Media & Entertainment (75.9%).
| Occupation | Male | Female |
| Management | 251 (69.9%) | 108 (30.1%) |
| Business & Financial | 136 (45.5%) | 163 (54.5%) |
| Computers, Engineering & Science | 129 (65.8%) | 67 (34.2%) |
| Computers & Mathematics | 61 (56.0%) | 48 (44.0%) |
| Architecture & Engineering | 68 (100.0%) | 0 (0.0%) |
| Life, Physical & Social Science | 0 (0.0%) | 19 (100.0%) |
| Community & Social Service | 138 (34.2%) | 265 (65.8%) |
| Education, Arts & Media | 50 (71.4%) | 20 (28.6%) |
| Legal Services & Support | 0 (0.0%) | 51 (100.0%) |
| Education Instruction & Library | 56 (37.6%) | 93 (62.4%) |
| Arts, Media & Entertainment | 32 (24.1%) | 101 (75.9%) |
| Health Diagnosing & Treating | 51 (27.7%) | 133 (72.3%) |
| Health Technologists | 51 (49.0%) | 53 (51.0%) |
| Total (Category) | 705 (48.9%) | 736 (51.1%) |
| Total (Overall) | 1,917 (55.9%) | 1,511 (44.1%) |
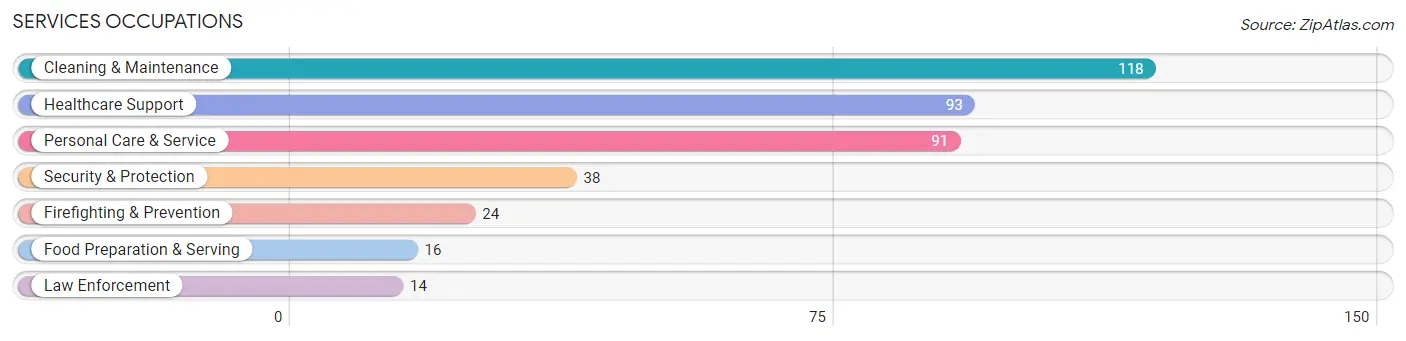
Services Occupations
The most common Services occupations in Ivins are Cleaning & Maintenance (118 | 3.4%), Healthcare Support (93 | 2.7%), Personal Care & Service (91 | 2.6%), Security & Protection (38 | 1.1%), and Firefighting & Prevention (24 | 0.7%).
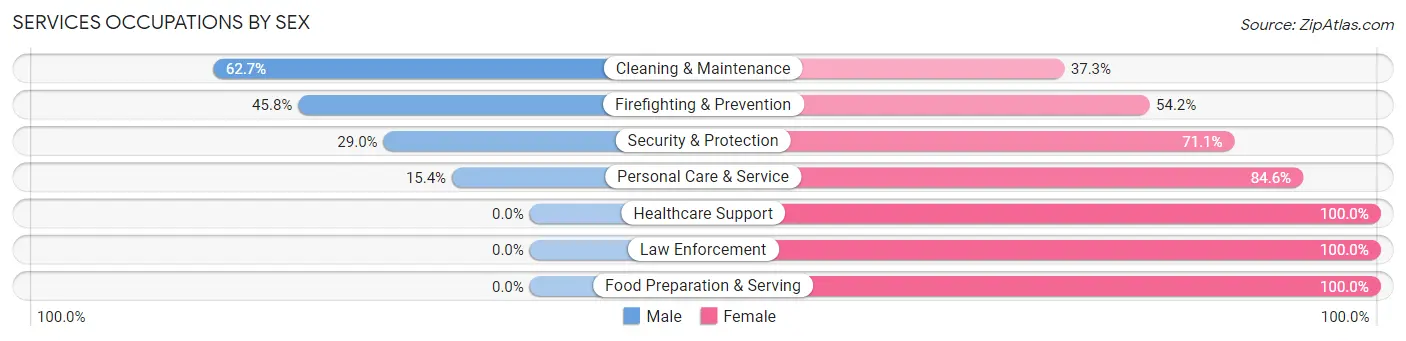
Services Occupations by Sex
Within the Services occupations in Ivins, the most male-oriented occupations are Cleaning & Maintenance (62.7%), Firefighting & Prevention (45.8%), and Security & Protection (28.9%), while the most female-oriented occupations are Healthcare Support (100.0%), Law Enforcement (100.0%), and Food Preparation & Serving (100.0%).
| Occupation | Male | Female |
| Healthcare Support | 0 (0.0%) | 93 (100.0%) |
| Security & Protection | 11 (28.9%) | 27 (71.1%) |
| Firefighting & Prevention | 11 (45.8%) | 13 (54.2%) |
| Law Enforcement | 0 (0.0%) | 14 (100.0%) |
| Food Preparation & Serving | 0 (0.0%) | 16 (100.0%) |
| Cleaning & Maintenance | 74 (62.7%) | 44 (37.3%) |
| Personal Care & Service | 14 (15.4%) | 77 (84.6%) |
| Total (Category) | 99 (27.8%) | 257 (72.2%) |
| Total (Overall) | 1,917 (55.9%) | 1,511 (44.1%) |
Sales and Office Occupations
The most common Sales and Office occupations in Ivins are Sales & Related (744 | 21.7%), and Office & Administration (371 | 10.8%).
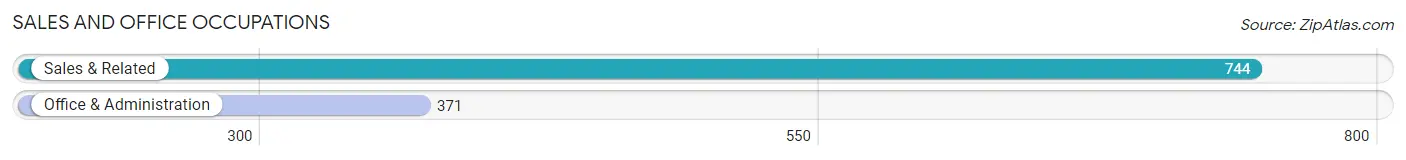
Sales and Office Occupations by Sex
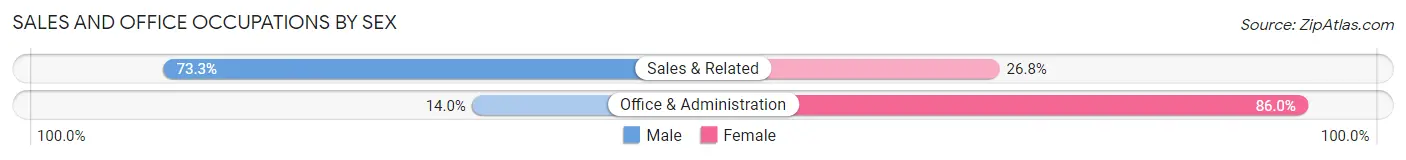
| Occupation | Male | Female |
| Sales & Related | 545 (73.3%) | 199 (26.8%) |
| Office & Administration | 52 (14.0%) | 319 (86.0%) |
| Total (Category) | 597 (53.5%) | 518 (46.5%) |
| Total (Overall) | 1,917 (55.9%) | 1,511 (44.1%) |
Natural Resources, Construction and Maintenance Occupations
The most common Natural Resources, Construction and Maintenance occupations in Ivins are , and Construction & Extraction (341 | 10.0%).
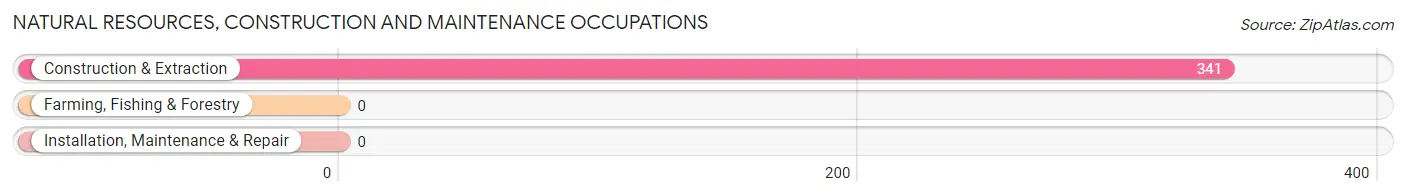
Natural Resources, Construction and Maintenance Occupations by Sex
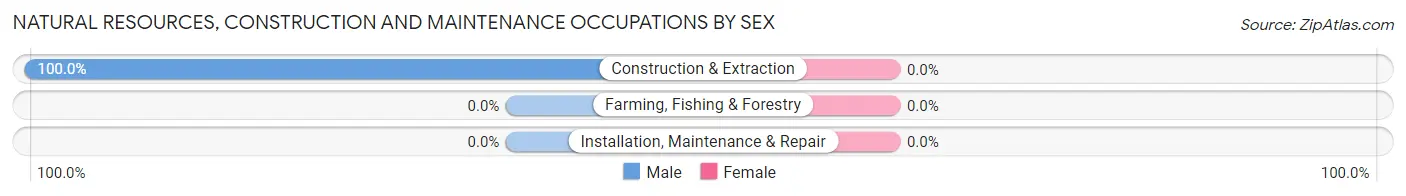
| Occupation | Male | Female |
| Farming, Fishing & Forestry | 0 (0.0%) | 0 (0.0%) |
| Construction & Extraction | 341 (100.0%) | 0 (0.0%) |
| Installation, Maintenance & Repair | 0 (0.0%) | 0 (0.0%) |
| Total (Category) | 341 (100.0%) | 0 (0.0%) |
| Total (Overall) | 1,917 (55.9%) | 1,511 (44.1%) |
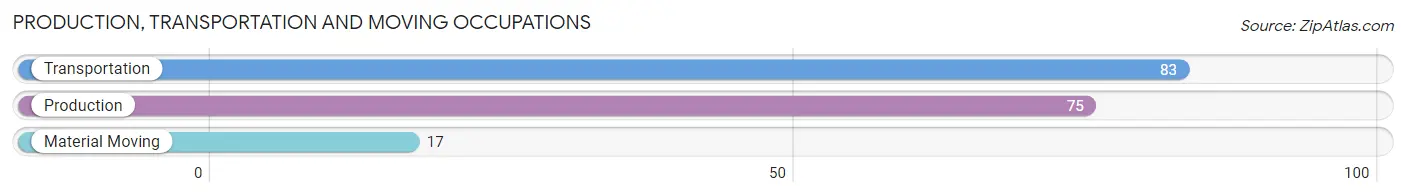
Production, Transportation and Moving Occupations
The most common Production, Transportation and Moving occupations in Ivins are Transportation (83 | 2.4%), Production (75 | 2.2%), and Material Moving (17 | 0.5%).
Production, Transportation and Moving Occupations by Sex
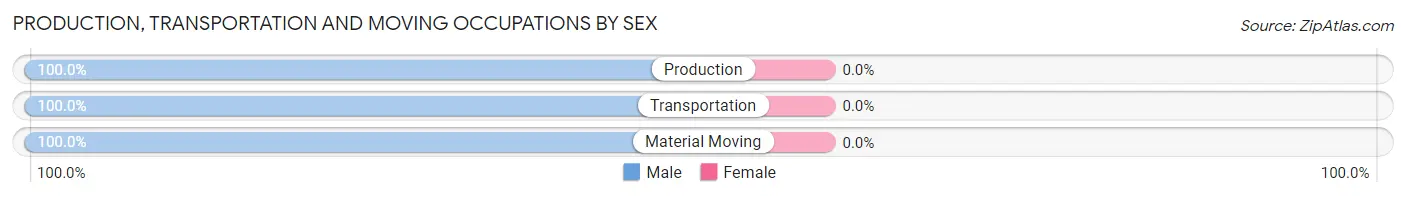
| Occupation | Male | Female |
| Production | 75 (100.0%) | 0 (0.0%) |
| Transportation | 83 (100.0%) | 0 (0.0%) |
| Material Moving | 17 (100.0%) | 0 (0.0%) |
| Total (Category) | 175 (100.0%) | 0 (0.0%) |
| Total (Overall) | 1,917 (55.9%) | 1,511 (44.1%) |
Employment Industries by Sex in Ivins
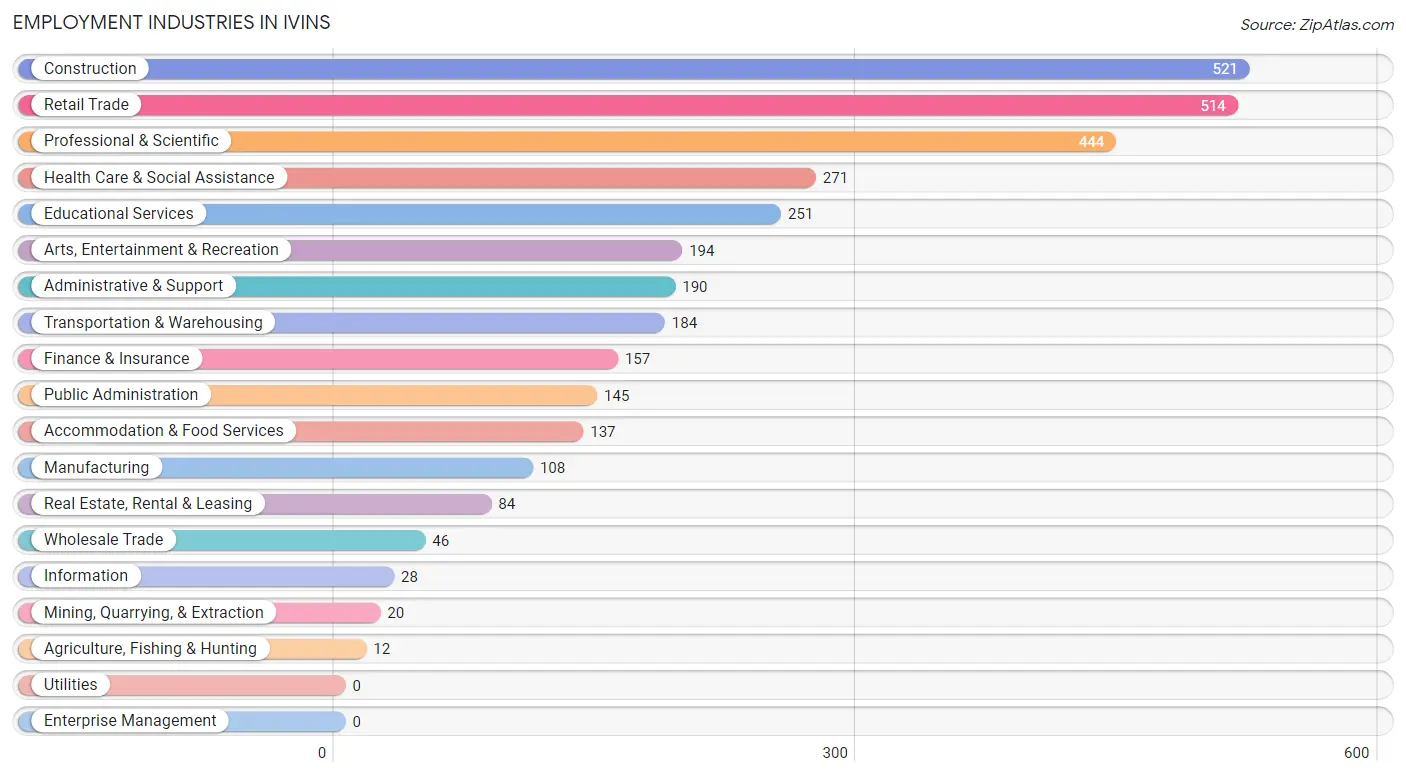
Employment Industries in Ivins
The major employment industries in Ivins include Construction (521 | 15.2%), Retail Trade (514 | 15.0%), Professional & Scientific (444 | 13.0%), Health Care & Social Assistance (271 | 7.9%), and Educational Services (251 | 7.3%).
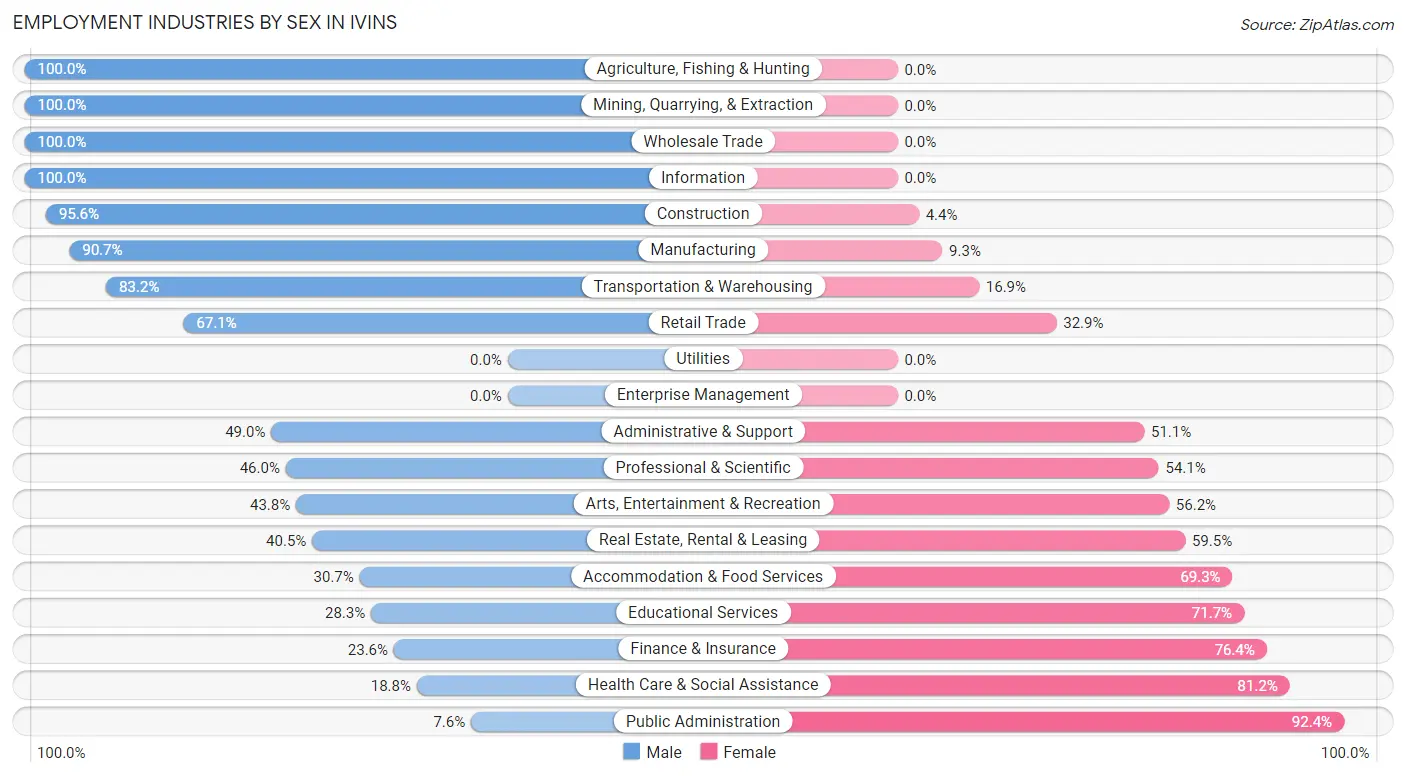
Employment Industries by Sex in Ivins
The Ivins industries that see more men than women are Agriculture, Fishing & Hunting (100.0%), Mining, Quarrying, & Extraction (100.0%), and Wholesale Trade (100.0%), whereas the industries that tend to have a higher number of women are Public Administration (92.4%), Health Care & Social Assistance (81.2%), and Finance & Insurance (76.4%).
| Industry | Male | Female |
| Agriculture, Fishing & Hunting | 12 (100.0%) | 0 (0.0%) |
| Mining, Quarrying, & Extraction | 20 (100.0%) | 0 (0.0%) |
| Construction | 498 (95.6%) | 23 (4.4%) |
| Manufacturing | 98 (90.7%) | 10 (9.3%) |
| Wholesale Trade | 46 (100.0%) | 0 (0.0%) |
| Retail Trade | 345 (67.1%) | 169 (32.9%) |
| Transportation & Warehousing | 153 (83.2%) | 31 (16.9%) |
| Utilities | 0 (0.0%) | 0 (0.0%) |
| Information | 28 (100.0%) | 0 (0.0%) |
| Finance & Insurance | 37 (23.6%) | 120 (76.4%) |
| Real Estate, Rental & Leasing | 34 (40.5%) | 50 (59.5%) |
| Professional & Scientific | 204 (46.0%) | 240 (54.0%) |
| Enterprise Management | 0 (0.0%) | 0 (0.0%) |
| Administrative & Support | 93 (48.9%) | 97 (51.0%) |
| Educational Services | 71 (28.3%) | 180 (71.7%) |
| Health Care & Social Assistance | 51 (18.8%) | 220 (81.2%) |
| Arts, Entertainment & Recreation | 85 (43.8%) | 109 (56.2%) |
| Accommodation & Food Services | 42 (30.7%) | 95 (69.3%) |
| Public Administration | 11 (7.6%) | 134 (92.4%) |
| Total | 1,917 (55.9%) | 1,511 (44.1%) |
Education in Ivins
School Enrollment in Ivins
The most common levels of schooling among the 1,938 students in Ivins are high school (533 | 27.5%), middle school (467 | 24.1%), and elementary school (392 | 20.2%).
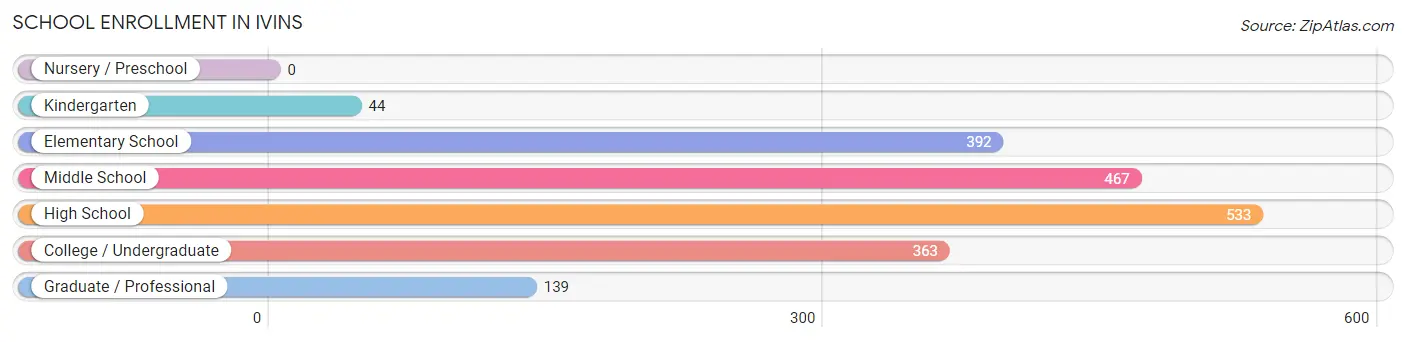
| School Level | # Students | % Students |
| Nursery / Preschool | 0 | 0.0% |
| Kindergarten | 44 | 2.3% |
| Elementary School | 392 | 20.2% |
| Middle School | 467 | 24.1% |
| High School | 533 | 27.5% |
| College / Undergraduate | 363 | 18.7% |
| Graduate / Professional | 139 | 7.2% |
| Total | 1,938 | 100.0% |
School Enrollment by Age by Funding Source in Ivins
Out of a total of 1,938 students who are enrolled in schools in Ivins, 169 (8.7%) attend a private institution, while the remaining 1,769 (91.3%) are enrolled in public schools. The age group of 35 years and over has the highest likelihood of being enrolled in private schools, with 53 (47.3% in the age bracket) enrolled. Conversely, the age group of 15 to 17 year olds has the lowest likelihood of being enrolled in a private school, with 381 (100.0% in the age bracket) attending a public institution.
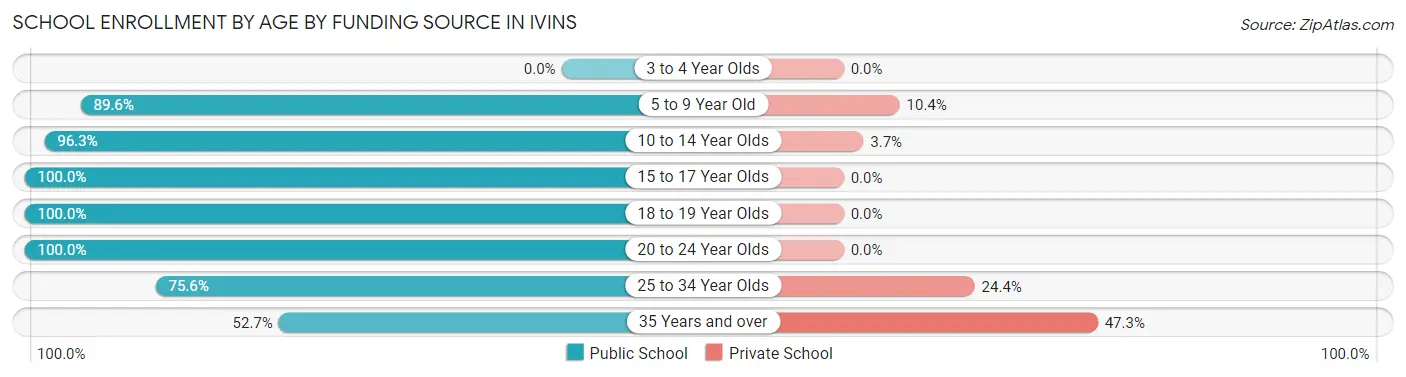
| Age Bracket | Public School | Private School |
| 3 to 4 Year Olds | 0 (0.0%) | 0 (0.0%) |
| 5 to 9 Year Old | 361 (89.6%) | 42 (10.4%) |
| 10 to 14 Year Olds | 603 (96.3%) | 23 (3.7%) |
| 15 to 17 Year Olds | 381 (100.0%) | 0 (0.0%) |
| 18 to 19 Year Olds | 73 (100.0%) | 0 (0.0%) |
| 20 to 24 Year Olds | 134 (100.0%) | 0 (0.0%) |
| 25 to 34 Year Olds | 158 (75.6%) | 51 (24.4%) |
| 35 Years and over | 59 (52.7%) | 53 (47.3%) |
| Total | 1,769 (91.3%) | 169 (8.7%) |
Educational Attainment by Field of Study in Ivins
Business (792 | 23.1%), education (490 | 14.3%), social sciences (324 | 9.5%), multidisciplinary studies (297 | 8.7%), and arts & humanities (251 | 7.3%) are the most common fields of study among 3,422 individuals in Ivins who have obtained a bachelor's degree or higher.
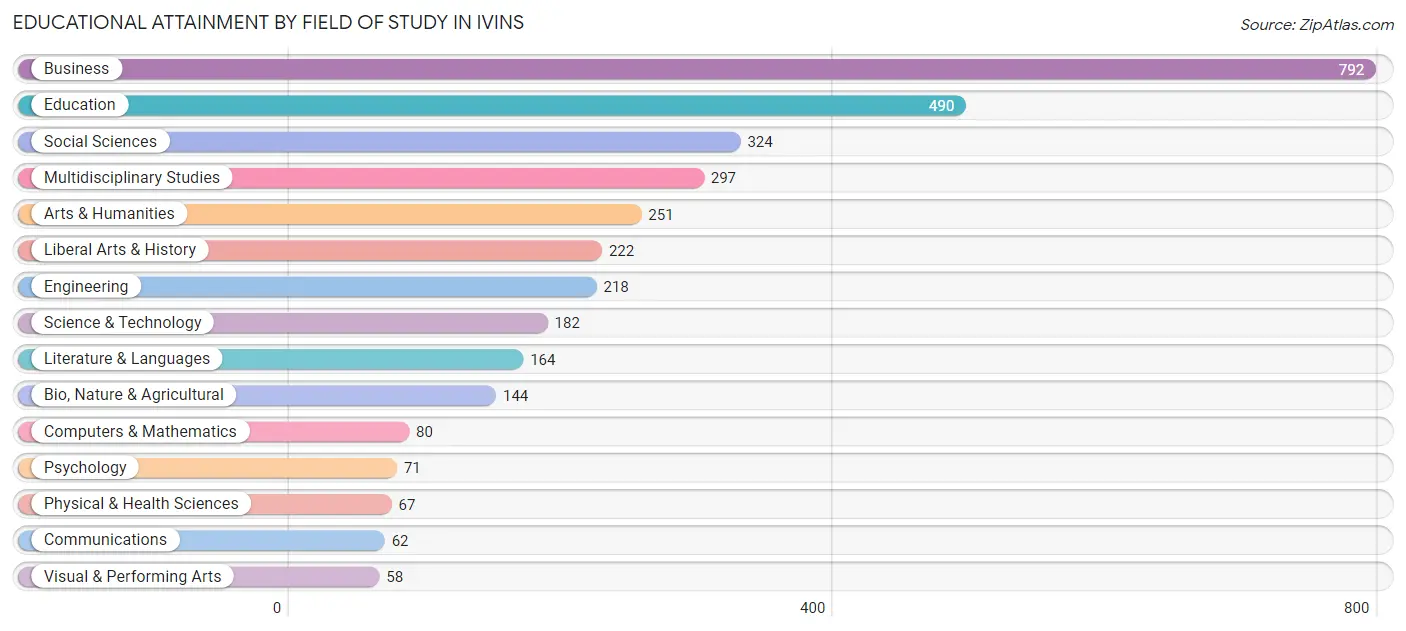
| Field of Study | # Graduates | % Graduates |
| Computers & Mathematics | 80 | 2.3% |
| Bio, Nature & Agricultural | 144 | 4.2% |
| Physical & Health Sciences | 67 | 2.0% |
| Psychology | 71 | 2.1% |
| Social Sciences | 324 | 9.5% |
| Engineering | 218 | 6.4% |
| Multidisciplinary Studies | 297 | 8.7% |
| Science & Technology | 182 | 5.3% |
| Business | 792 | 23.1% |
| Education | 490 | 14.3% |
| Literature & Languages | 164 | 4.8% |
| Liberal Arts & History | 222 | 6.5% |
| Visual & Performing Arts | 58 | 1.7% |
| Communications | 62 | 1.8% |
| Arts & Humanities | 251 | 7.3% |
| Total | 3,422 | 100.0% |
Transportation & Commute in Ivins
Vehicle Availability by Sex in Ivins
The most prevalent vehicle ownership categories in Ivins are males with 3 vehicles (706, accounting for 36.8%) and females with 3 vehicles (434, making up 47.0%).
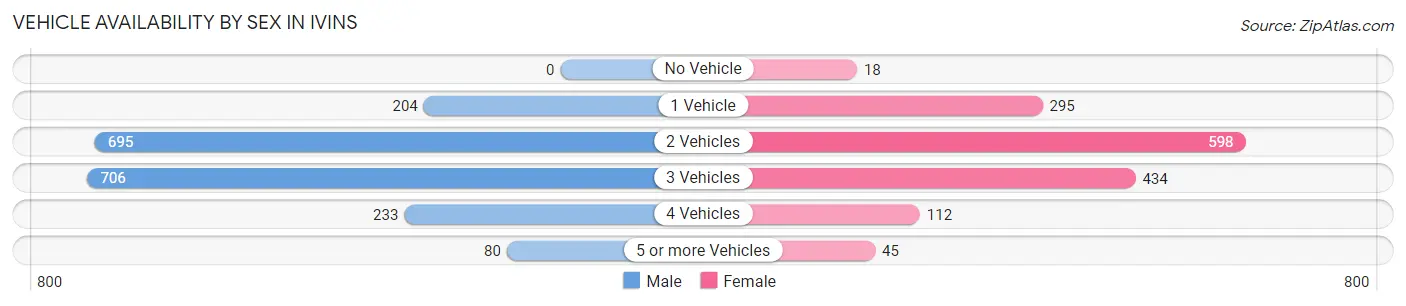
| Vehicles Available | Male | Female |
| No Vehicle | 0 (0.0%) | 18 (1.2%) |
| 1 Vehicle | 204 (10.6%) | 295 (19.6%) |
| 2 Vehicles | 695 (36.2%) | 598 (39.8%) |
| 3 Vehicles | 706 (36.8%) | 434 (28.9%) |
| 4 Vehicles | 233 (12.1%) | 112 (7.5%) |
| 5 or more Vehicles | 80 (4.2%) | 45 (3.0%) |
| Total | 1,918 (100.0%) | 1,502 (100.0%) |
Commute Time in Ivins
The most frequently occuring commute durations in Ivins are 20 to 24 minutes (635 commuters, 23.6%), 15 to 19 minutes (551 commuters, 20.5%), and 30 to 34 minutes (386 commuters, 14.4%).
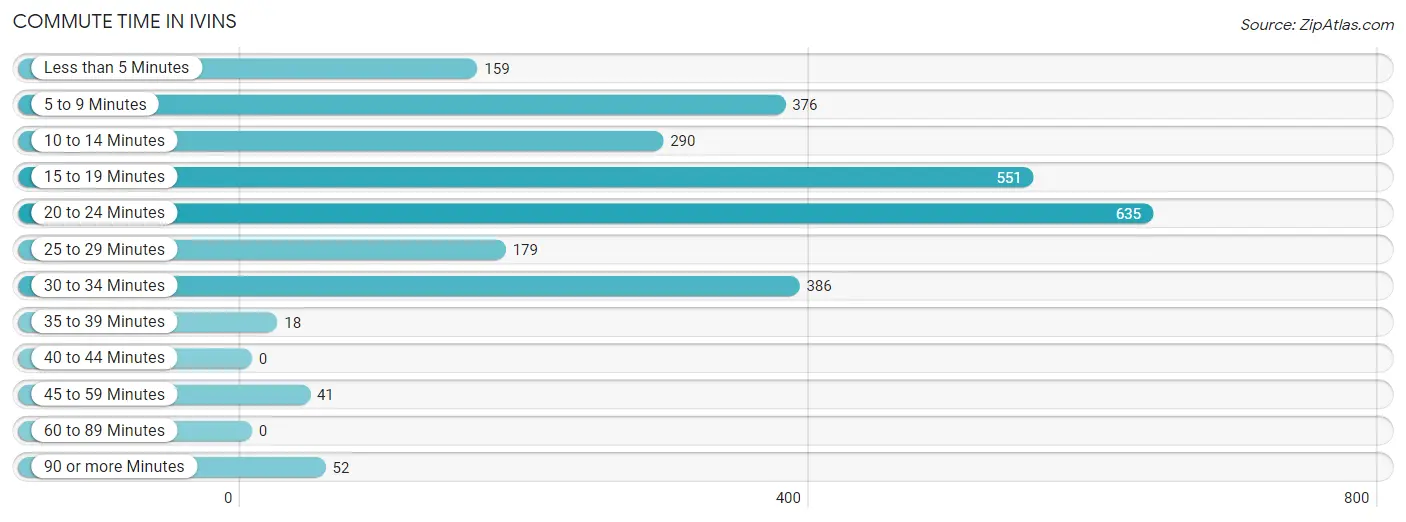
| Commute Time | # Commuters | % Commuters |
| Less than 5 Minutes | 159 | 5.9% |
| 5 to 9 Minutes | 376 | 14.0% |
| 10 to 14 Minutes | 290 | 10.8% |
| 15 to 19 Minutes | 551 | 20.5% |
| 20 to 24 Minutes | 635 | 23.6% |
| 25 to 29 Minutes | 179 | 6.7% |
| 30 to 34 Minutes | 386 | 14.4% |
| 35 to 39 Minutes | 18 | 0.7% |
| 40 to 44 Minutes | 0 | 0.0% |
| 45 to 59 Minutes | 41 | 1.5% |
| 60 to 89 Minutes | 0 | 0.0% |
| 90 or more Minutes | 52 | 1.9% |
Commute Time by Sex in Ivins
The most common commute times in Ivins are 15 to 19 minutes (425 commuters, 26.7%) for males and 20 to 24 minutes (442 commuters, 40.4%) for females.
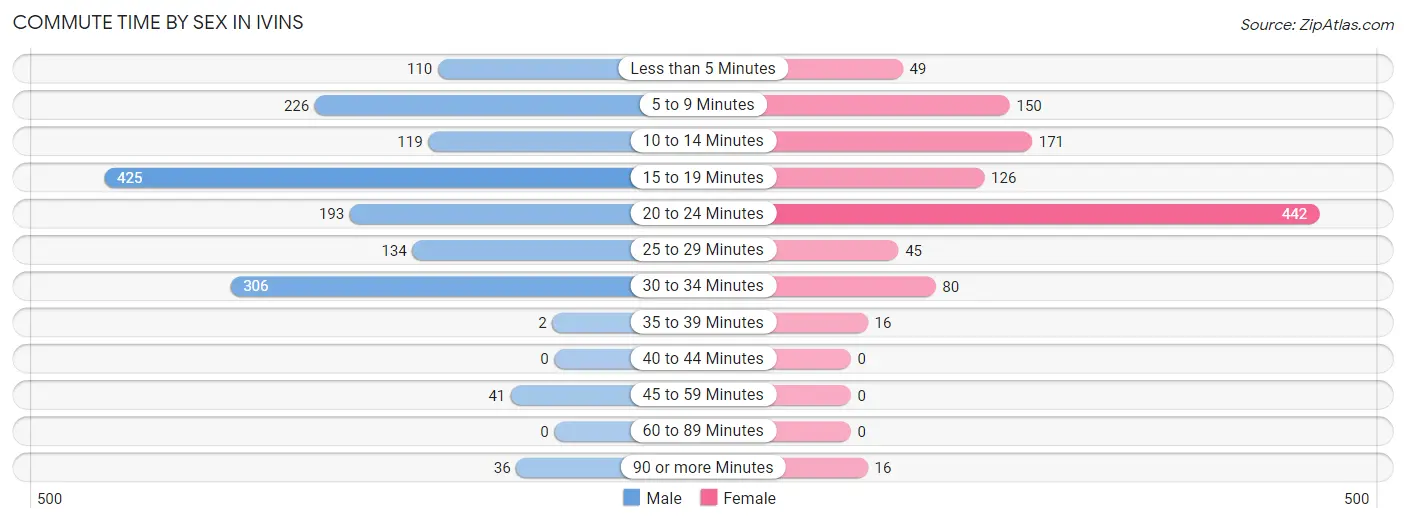
| Commute Time | Male | Female |
| Less than 5 Minutes | 110 (6.9%) | 49 (4.5%) |
| 5 to 9 Minutes | 226 (14.2%) | 150 (13.7%) |
| 10 to 14 Minutes | 119 (7.5%) | 171 (15.6%) |
| 15 to 19 Minutes | 425 (26.7%) | 126 (11.5%) |
| 20 to 24 Minutes | 193 (12.1%) | 442 (40.4%) |
| 25 to 29 Minutes | 134 (8.4%) | 45 (4.1%) |
| 30 to 34 Minutes | 306 (19.2%) | 80 (7.3%) |
| 35 to 39 Minutes | 2 (0.1%) | 16 (1.5%) |
| 40 to 44 Minutes | 0 (0.0%) | 0 (0.0%) |
| 45 to 59 Minutes | 41 (2.6%) | 0 (0.0%) |
| 60 to 89 Minutes | 0 (0.0%) | 0 (0.0%) |
| 90 or more Minutes | 36 (2.3%) | 16 (1.5%) |
Time of Departure to Work by Sex in Ivins
The most frequent times of departure to work in Ivins are 7:30 AM to 7:59 AM (328, 20.6%) for males and 9:00 AM to 9:59 AM (265, 24.2%) for females.
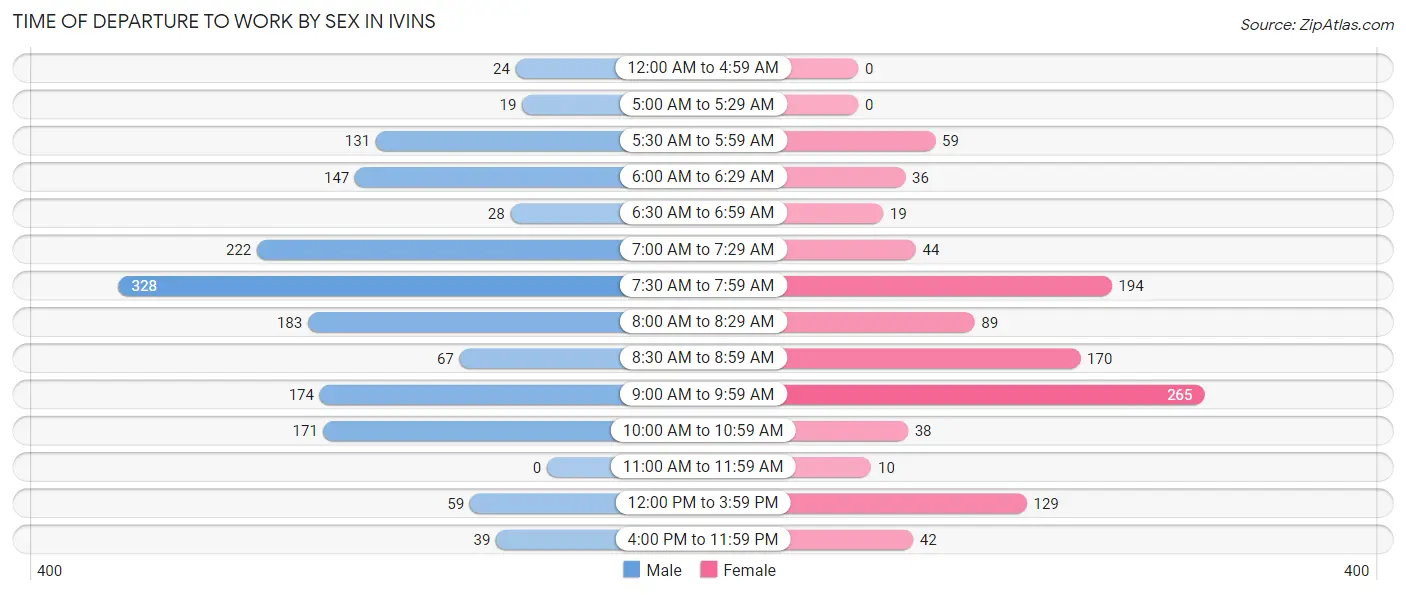
| Time of Departure | Male | Female |
| 12:00 AM to 4:59 AM | 24 (1.5%) | 0 (0.0%) |
| 5:00 AM to 5:29 AM | 19 (1.2%) | 0 (0.0%) |
| 5:30 AM to 5:59 AM | 131 (8.2%) | 59 (5.4%) |
| 6:00 AM to 6:29 AM | 147 (9.2%) | 36 (3.3%) |
| 6:30 AM to 6:59 AM | 28 (1.8%) | 19 (1.7%) |
| 7:00 AM to 7:29 AM | 222 (13.9%) | 44 (4.0%) |
| 7:30 AM to 7:59 AM | 328 (20.6%) | 194 (17.7%) |
| 8:00 AM to 8:29 AM | 183 (11.5%) | 89 (8.1%) |
| 8:30 AM to 8:59 AM | 67 (4.2%) | 170 (15.5%) |
| 9:00 AM to 9:59 AM | 174 (10.9%) | 265 (24.2%) |
| 10:00 AM to 10:59 AM | 171 (10.7%) | 38 (3.5%) |
| 11:00 AM to 11:59 AM | 0 (0.0%) | 10 (0.9%) |
| 12:00 PM to 3:59 PM | 59 (3.7%) | 129 (11.8%) |
| 4:00 PM to 11:59 PM | 39 (2.5%) | 42 (3.8%) |
| Total | 1,592 (100.0%) | 1,095 (100.0%) |
Housing Occupancy in Ivins
Occupancy by Ownership in Ivins
Of the total 3,761 dwellings in Ivins, owner-occupied units account for 3,014 (80.1%), while renter-occupied units make up 747 (19.9%).
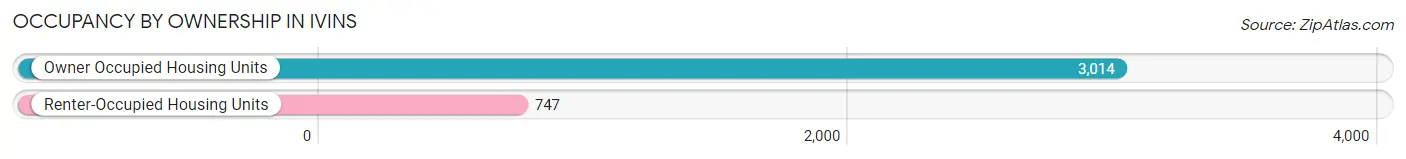
| Occupancy | # Housing Units | % Housing Units |
| Owner Occupied Housing Units | 3,014 | 80.1% |
| Renter-Occupied Housing Units | 747 | 19.9% |
| Total Occupied Housing Units | 3,761 | 100.0% |
Occupancy by Household Size in Ivins
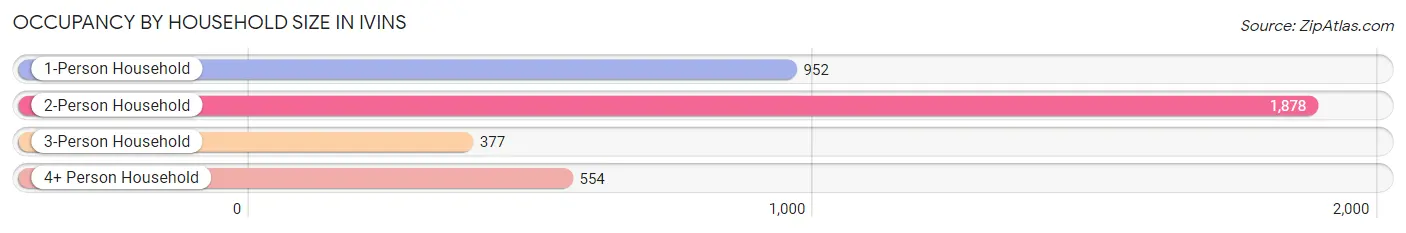
| Household Size | # Housing Units | % Housing Units |
| 1-Person Household | 952 | 25.3% |
| 2-Person Household | 1,878 | 49.9% |
| 3-Person Household | 377 | 10.0% |
| 4+ Person Household | 554 | 14.7% |
| Total Housing Units | 3,761 | 100.0% |
Occupancy by Ownership by Household Size in Ivins
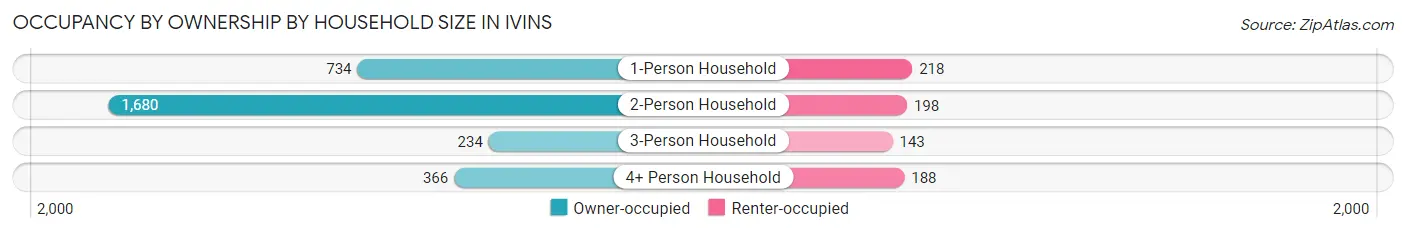
| Household Size | Owner-occupied | Renter-occupied |
| 1-Person Household | 734 (77.1%) | 218 (22.9%) |
| 2-Person Household | 1,680 (89.5%) | 198 (10.5%) |
| 3-Person Household | 234 (62.1%) | 143 (37.9%) |
| 4+ Person Household | 366 (66.1%) | 188 (33.9%) |
| Total Housing Units | 3,014 (80.1%) | 747 (19.9%) |
Occupancy by Educational Attainment in Ivins
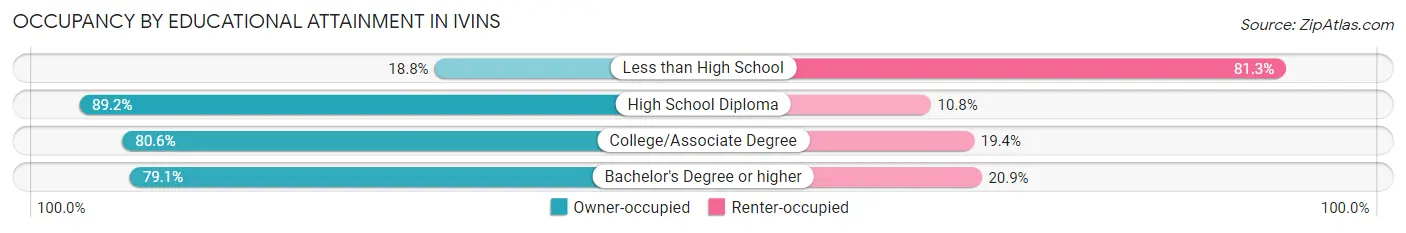
| Household Size | Owner-occupied | Renter-occupied |
| Less than High School | 15 (18.8%) | 65 (81.2%) |
| High School Diploma | 578 (89.2%) | 70 (10.8%) |
| College/Associate Degree | 1,124 (80.6%) | 270 (19.4%) |
| Bachelor's Degree or higher | 1,297 (79.1%) | 342 (20.9%) |
Occupancy by Age of Householder in Ivins
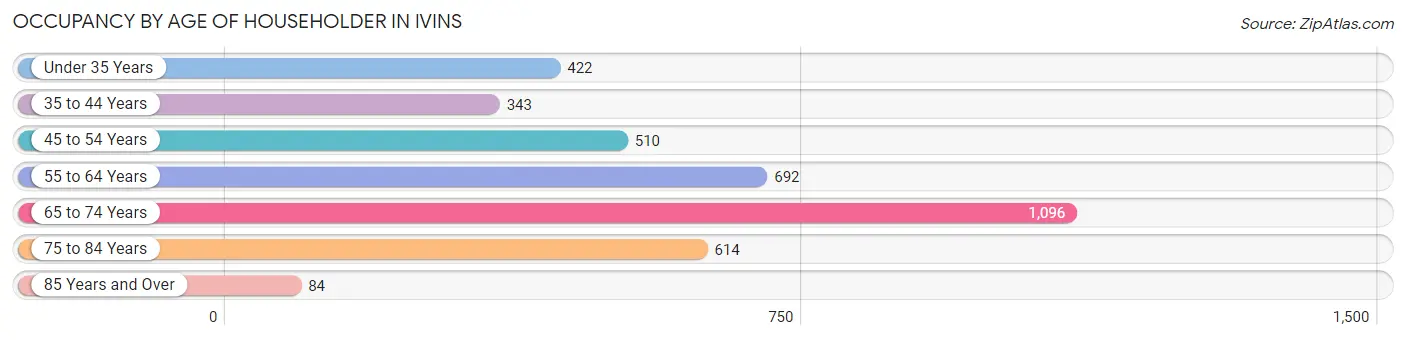
| Age Bracket | # Households | % Households |
| Under 35 Years | 422 | 11.2% |
| 35 to 44 Years | 343 | 9.1% |
| 45 to 54 Years | 510 | 13.6% |
| 55 to 64 Years | 692 | 18.4% |
| 65 to 74 Years | 1,096 | 29.1% |
| 75 to 84 Years | 614 | 16.3% |
| 85 Years and Over | 84 | 2.2% |
| Total | 3,761 | 100.0% |
Housing Finances in Ivins
Median Income by Occupancy in Ivins

| Occupancy Type | # Households | Median Income |
| Owner-Occupied | 3,014 (80.1%) | $68,214 |
| Renter-Occupied | 747 (19.9%) | $65,688 |
| Average | 3,761 (100.0%) | $67,354 |
Occupancy by Householder Income Bracket in Ivins
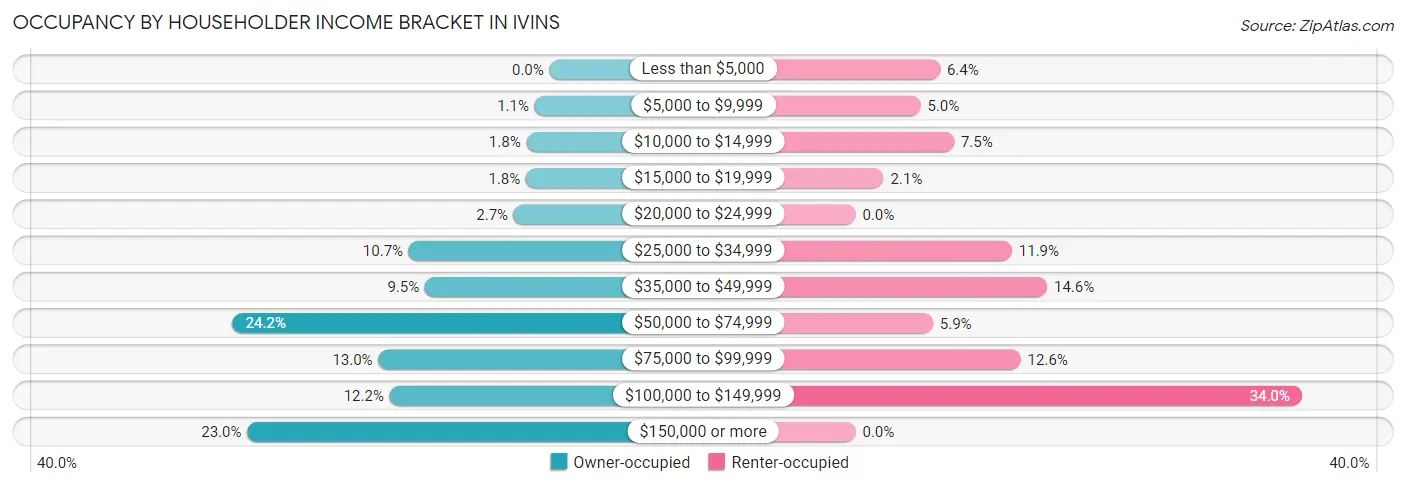
| Income Bracket | Owner-occupied | Renter-occupied |
| Less than $5,000 | 0 (0.0%) | 48 (6.4%) |
| $5,000 to $9,999 | 34 (1.1%) | 37 (5.0%) |
| $10,000 to $14,999 | 53 (1.8%) | 56 (7.5%) |
| $15,000 to $19,999 | 54 (1.8%) | 16 (2.1%) |
| $20,000 to $24,999 | 82 (2.7%) | 0 (0.0%) |
| $25,000 to $34,999 | 323 (10.7%) | 89 (11.9%) |
| $35,000 to $49,999 | 286 (9.5%) | 109 (14.6%) |
| $50,000 to $74,999 | 728 (24.1%) | 44 (5.9%) |
| $75,000 to $99,999 | 393 (13.0%) | 94 (12.6%) |
| $100,000 to $149,999 | 367 (12.2%) | 254 (34.0%) |
| $150,000 or more | 694 (23.0%) | 0 (0.0%) |
| Total | 3,014 (100.0%) | 747 (100.0%) |
Monthly Housing Cost Tiers in Ivins
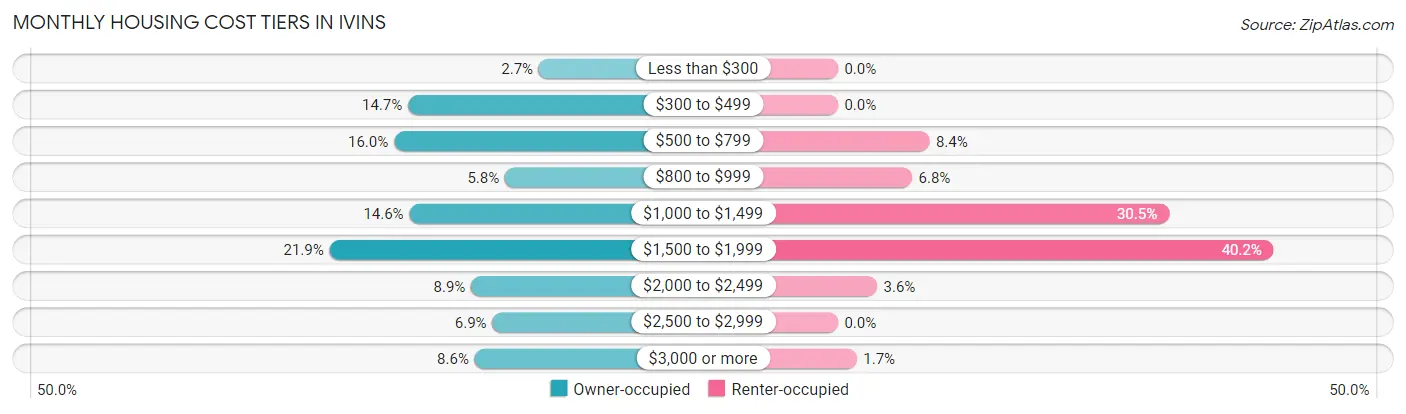
| Monthly Cost | Owner-occupied | Renter-occupied |
| Less than $300 | 80 (2.6%) | 0 (0.0%) |
| $300 to $499 | 443 (14.7%) | 0 (0.0%) |
| $500 to $799 | 482 (16.0%) | 63 (8.4%) |
| $800 to $999 | 174 (5.8%) | 51 (6.8%) |
| $1,000 to $1,499 | 439 (14.6%) | 228 (30.5%) |
| $1,500 to $1,999 | 661 (21.9%) | 300 (40.2%) |
| $2,000 to $2,499 | 268 (8.9%) | 27 (3.6%) |
| $2,500 to $2,999 | 209 (6.9%) | 0 (0.0%) |
| $3,000 or more | 258 (8.6%) | 13 (1.7%) |
| Total | 3,014 (100.0%) | 747 (100.0%) |
Physical Housing Characteristics in Ivins
Housing Structures in Ivins
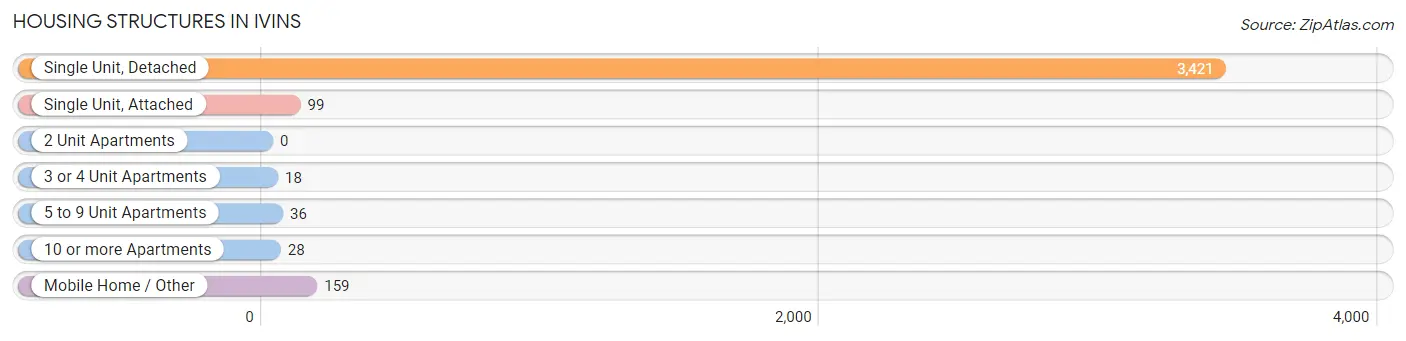
| Structure Type | # Housing Units | % Housing Units |
| Single Unit, Detached | 3,421 | 91.0% |
| Single Unit, Attached | 99 | 2.6% |
| 2 Unit Apartments | 0 | 0.0% |
| 3 or 4 Unit Apartments | 18 | 0.5% |
| 5 to 9 Unit Apartments | 36 | 1.0% |
| 10 or more Apartments | 28 | 0.7% |
| Mobile Home / Other | 159 | 4.2% |
| Total | 3,761 | 100.0% |
Housing Structures by Occupancy in Ivins
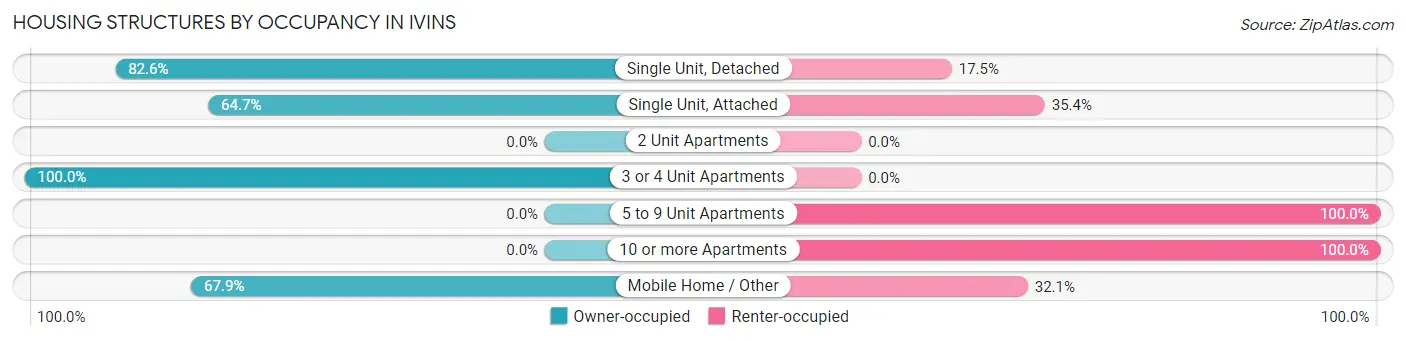
| Structure Type | Owner-occupied | Renter-occupied |
| Single Unit, Detached | 2,824 (82.6%) | 597 (17.4%) |
| Single Unit, Attached | 64 (64.6%) | 35 (35.3%) |
| 2 Unit Apartments | 0 (0.0%) | 0 (0.0%) |
| 3 or 4 Unit Apartments | 18 (100.0%) | 0 (0.0%) |
| 5 to 9 Unit Apartments | 0 (0.0%) | 36 (100.0%) |
| 10 or more Apartments | 0 (0.0%) | 28 (100.0%) |
| Mobile Home / Other | 108 (67.9%) | 51 (32.1%) |
| Total | 3,014 (80.1%) | 747 (19.9%) |
Housing Structures by Number of Rooms in Ivins
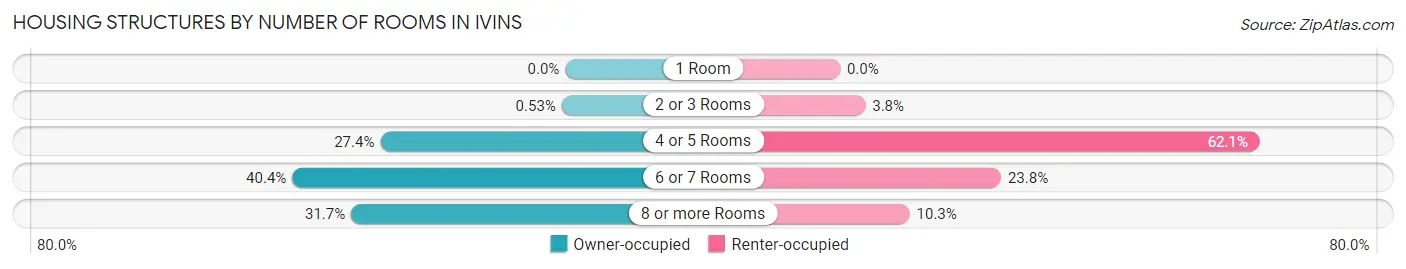
| Number of Rooms | Owner-occupied | Renter-occupied |
| 1 Room | 0 (0.0%) | 0 (0.0%) |
| 2 or 3 Rooms | 16 (0.5%) | 28 (3.7%) |
| 4 or 5 Rooms | 825 (27.4%) | 464 (62.1%) |
| 6 or 7 Rooms | 1,218 (40.4%) | 178 (23.8%) |
| 8 or more Rooms | 955 (31.7%) | 77 (10.3%) |
| Total | 3,014 (100.0%) | 747 (100.0%) |
Housing Structure by Heating Type in Ivins
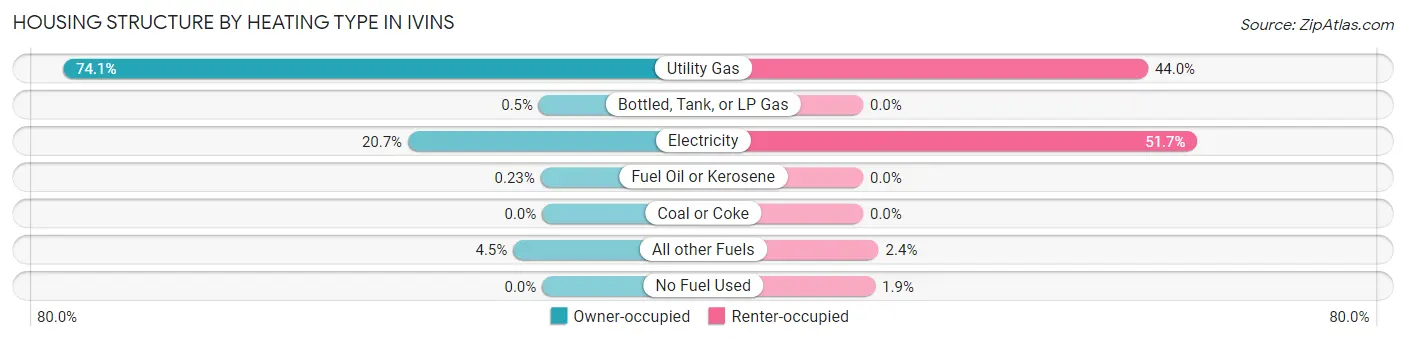
| Heating Type | Owner-occupied | Renter-occupied |
| Utility Gas | 2,232 (74.1%) | 329 (44.0%) |
| Bottled, Tank, or LP Gas | 15 (0.5%) | 0 (0.0%) |
| Electricity | 625 (20.7%) | 386 (51.7%) |
| Fuel Oil or Kerosene | 7 (0.2%) | 0 (0.0%) |
| Coal or Coke | 0 (0.0%) | 0 (0.0%) |
| All other Fuels | 135 (4.5%) | 18 (2.4%) |
| No Fuel Used | 0 (0.0%) | 14 (1.9%) |
| Total | 3,014 (100.0%) | 747 (100.0%) |
Household Vehicle Usage in Ivins
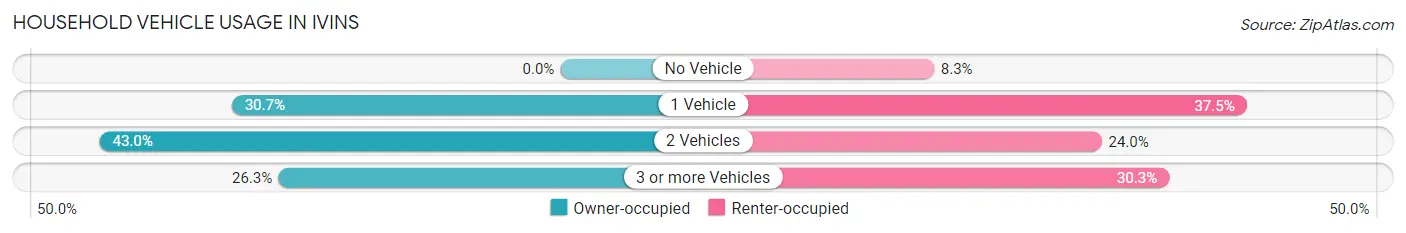
| Vehicles per Household | Owner-occupied | Renter-occupied |
| No Vehicle | 0 (0.0%) | 62 (8.3%) |
| 1 Vehicle | 924 (30.7%) | 280 (37.5%) |
| 2 Vehicles | 1,296 (43.0%) | 179 (24.0%) |
| 3 or more Vehicles | 794 (26.3%) | 226 (30.2%) |
| Total | 3,014 (100.0%) | 747 (100.0%) |
Real Estate & Mortgages in Ivins
Real Estate and Mortgage Overview in Ivins
| Characteristic | Without Mortgage | With Mortgage |
| Housing Units | 1,107 | 1,907 |
| Median Property Value | $494,300 | $438,400 |
| Median Household Income | $62,440 | $483 |
| Monthly Housing Costs | $518 | $258 |
| Real Estate Taxes | $2,290 | $26 |
Property Value by Mortgage Status in Ivins
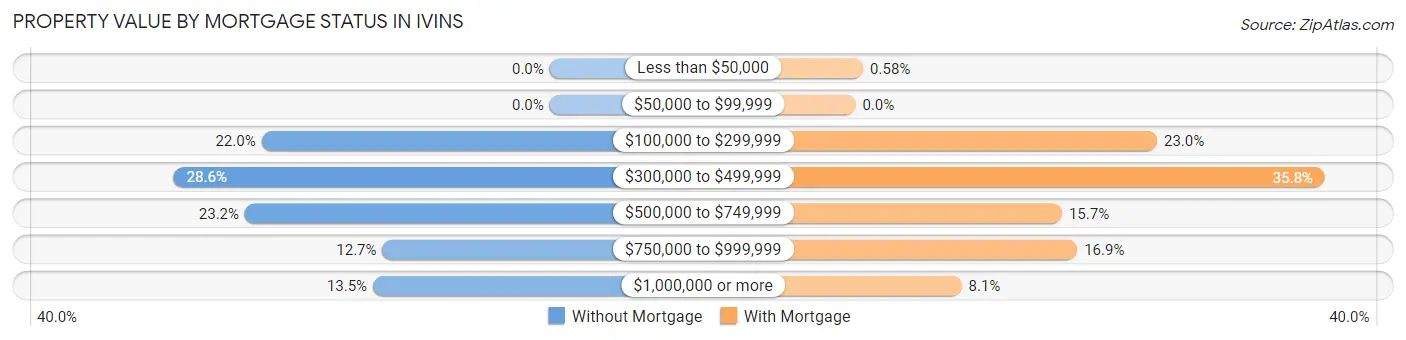
| Property Value | Without Mortgage | With Mortgage |
| Less than $50,000 | 0 (0.0%) | 11 (0.6%) |
| $50,000 to $99,999 | 0 (0.0%) | 0 (0.0%) |
| $100,000 to $299,999 | 243 (22.0%) | 438 (23.0%) |
| $300,000 to $499,999 | 317 (28.6%) | 682 (35.8%) |
| $500,000 to $749,999 | 257 (23.2%) | 300 (15.7%) |
| $750,000 to $999,999 | 141 (12.7%) | 322 (16.9%) |
| $1,000,000 or more | 149 (13.5%) | 154 (8.1%) |
| Total | 1,107 (100.0%) | 1,907 (100.0%) |
Household Income by Mortgage Status in Ivins
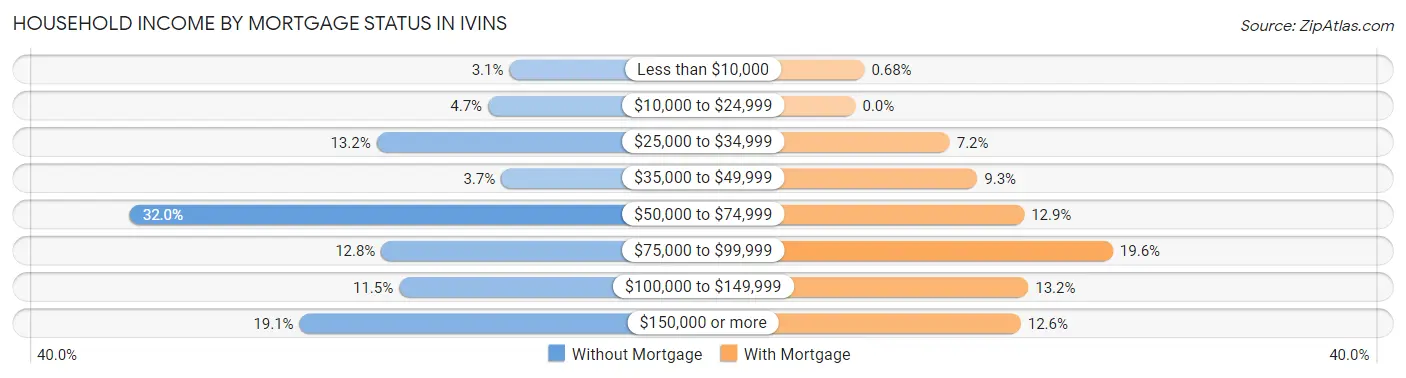
| Household Income | Without Mortgage | With Mortgage |
| Less than $10,000 | 34 (3.1%) | 13 (0.7%) |
| $10,000 to $24,999 | 52 (4.7%) | 0 (0.0%) |
| $25,000 to $34,999 | 146 (13.2%) | 137 (7.2%) |
| $35,000 to $49,999 | 41 (3.7%) | 177 (9.3%) |
| $50,000 to $74,999 | 354 (32.0%) | 245 (12.9%) |
| $75,000 to $99,999 | 142 (12.8%) | 374 (19.6%) |
| $100,000 to $149,999 | 127 (11.5%) | 251 (13.2%) |
| $150,000 or more | 211 (19.1%) | 240 (12.6%) |
| Total | 1,107 (100.0%) | 1,907 (100.0%) |
Property Value to Household Income Ratio in Ivins
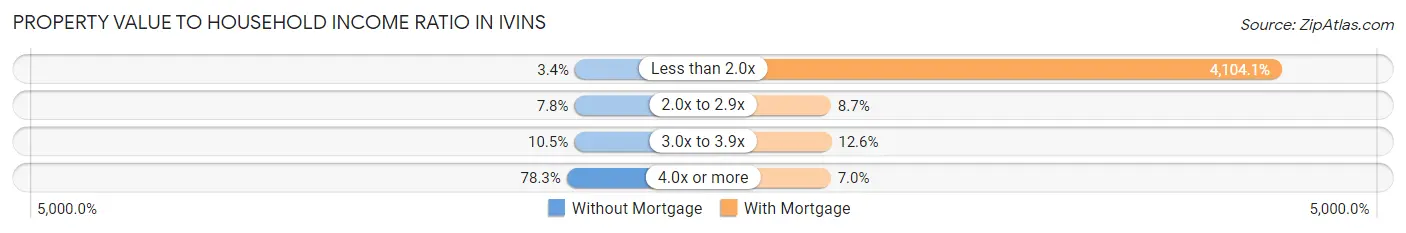
| Value-to-Income Ratio | Without Mortgage | With Mortgage |
| Less than 2.0x | 38 (3.4%) | 78,265 (4,104.1%) |
| 2.0x to 2.9x | 86 (7.8%) | 166 (8.7%) |
| 3.0x to 3.9x | 116 (10.5%) | 240 (12.6%) |
| 4.0x or more | 867 (78.3%) | 134 (7.0%) |
| Total | 1,107 (100.0%) | 1,907 (100.0%) |
Real Estate Taxes by Mortgage Status in Ivins
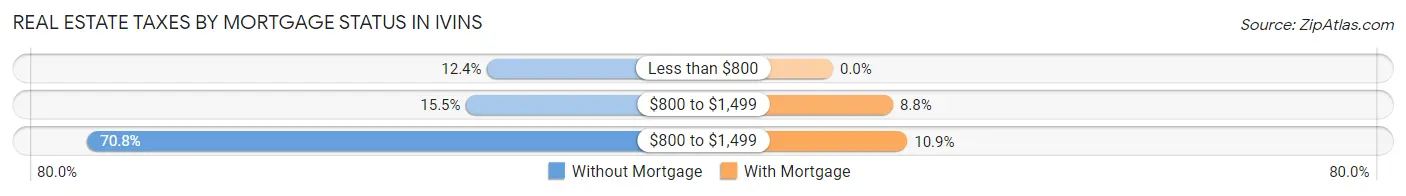
| Property Taxes | Without Mortgage | With Mortgage |
| Less than $800 | 137 (12.4%) | 0 (0.0%) |
| $800 to $1,499 | 171 (15.4%) | 167 (8.8%) |
| $800 to $1,499 | 784 (70.8%) | 207 (10.8%) |
| Total | 1,107 (100.0%) | 1,907 (100.0%) |
Health & Disability in Ivins
Health Insurance Coverage by Age in Ivins
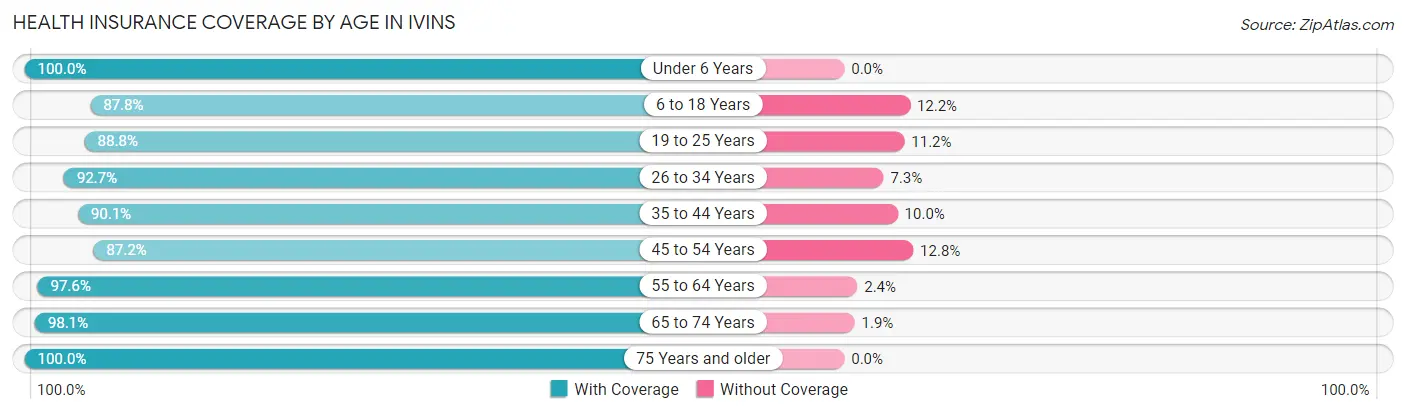
| Age Bracket | With Coverage | Without Coverage |
| Under 6 Years | 451 (100.0%) | 0 (0.0%) |
| 6 to 18 Years | 1,334 (87.8%) | 186 (12.2%) |
| 19 to 25 Years | 436 (88.8%) | 55 (11.2%) |
| 26 to 34 Years | 583 (92.7%) | 46 (7.3%) |
| 35 to 44 Years | 778 (90.0%) | 86 (10.0%) |
| 45 to 54 Years | 876 (87.2%) | 129 (12.8%) |
| 55 to 64 Years | 1,208 (97.6%) | 30 (2.4%) |
| 65 to 74 Years | 1,736 (98.1%) | 34 (1.9%) |
| 75 Years and older | 1,161 (100.0%) | 0 (0.0%) |
| Total | 8,563 (93.8%) | 566 (6.2%) |
Health Insurance Coverage by Citizenship Status in Ivins
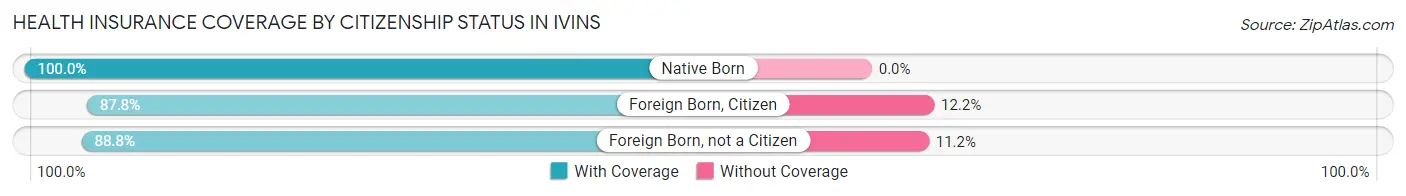
| Citizenship Status | With Coverage | Without Coverage |
| Native Born | 451 (100.0%) | 0 (0.0%) |
| Foreign Born, Citizen | 1,334 (87.8%) | 186 (12.2%) |
| Foreign Born, not a Citizen | 436 (88.8%) | 55 (11.2%) |
Health Insurance Coverage by Household Income in Ivins
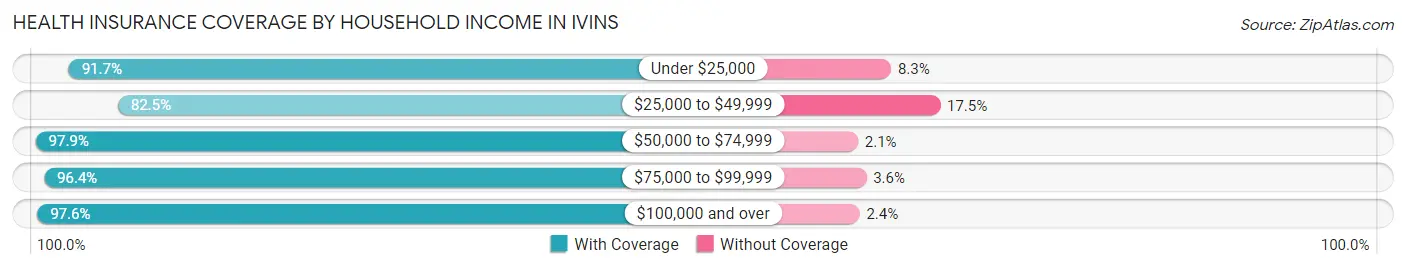
| Household Income | With Coverage | Without Coverage |
| Under $25,000 | 842 (91.7%) | 76 (8.3%) |
| $25,000 to $49,999 | 1,460 (82.5%) | 309 (17.5%) |
| $50,000 to $74,999 | 1,797 (97.9%) | 38 (2.1%) |
| $75,000 to $99,999 | 1,167 (96.4%) | 44 (3.6%) |
| $100,000 and over | 3,297 (97.6%) | 80 (2.4%) |
Public vs Private Health Insurance Coverage by Age in Ivins
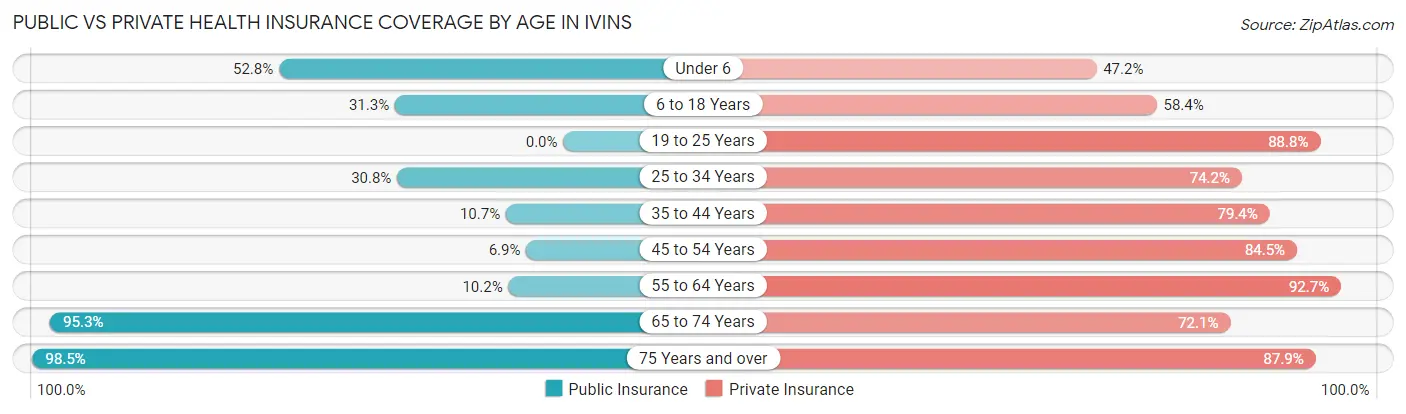
| Age Bracket | Public Insurance | Private Insurance |
| Under 6 | 238 (52.8%) | 213 (47.2%) |
| 6 to 18 Years | 475 (31.2%) | 888 (58.4%) |
| 19 to 25 Years | 0 (0.0%) | 436 (88.8%) |
| 25 to 34 Years | 194 (30.8%) | 467 (74.2%) |
| 35 to 44 Years | 92 (10.6%) | 686 (79.4%) |
| 45 to 54 Years | 69 (6.9%) | 849 (84.5%) |
| 55 to 64 Years | 126 (10.2%) | 1,147 (92.6%) |
| 65 to 74 Years | 1,686 (95.3%) | 1,276 (72.1%) |
| 75 Years and over | 1,144 (98.5%) | 1,021 (87.9%) |
| Total | 4,024 (44.1%) | 6,983 (76.5%) |
Disability Status by Sex by Age in Ivins
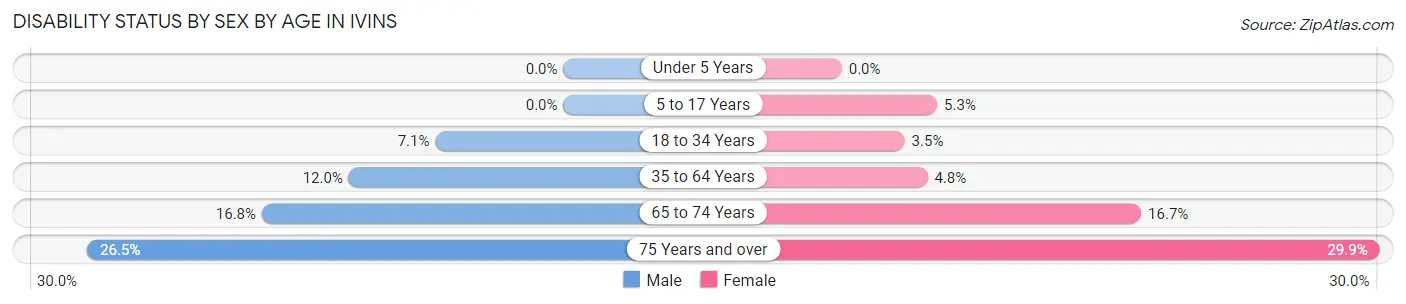
| Age Bracket | Male | Female |
| Under 5 Years | 0 (0.0%) | 0 (0.0%) |
| 5 to 17 Years | 0 (0.0%) | 38 (5.3%) |
| 18 to 34 Years | 38 (7.1%) | 25 (3.5%) |
| 35 to 64 Years | 206 (11.9%) | 66 (4.8%) |
| 65 to 74 Years | 138 (16.8%) | 158 (16.7%) |
| 75 Years and over | 175 (26.5%) | 150 (29.9%) |
Disability Class by Sex by Age in Ivins
Disability Class: Hearing Difficulty
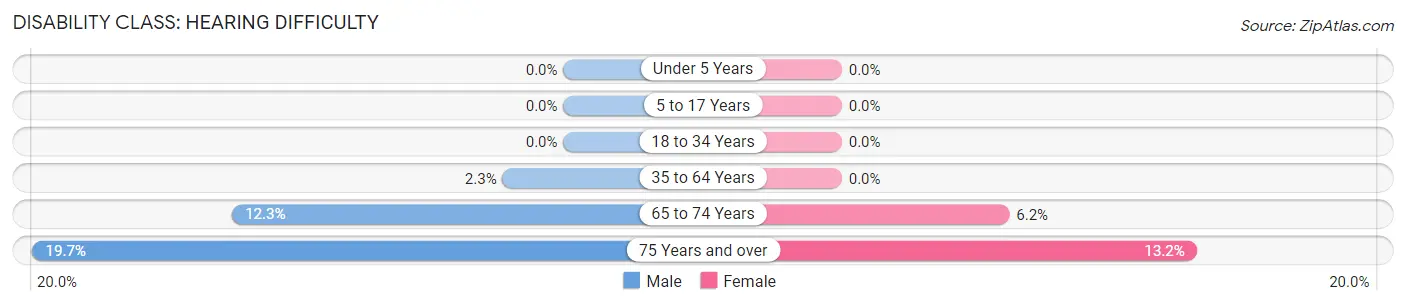
| Age Bracket | Male | Female |
| Under 5 Years | 0 (0.0%) | 0 (0.0%) |
| 5 to 17 Years | 0 (0.0%) | 0 (0.0%) |
| 18 to 34 Years | 0 (0.0%) | 0 (0.0%) |
| 35 to 64 Years | 39 (2.3%) | 0 (0.0%) |
| 65 to 74 Years | 101 (12.3%) | 59 (6.2%) |
| 75 Years and over | 130 (19.7%) | 66 (13.2%) |
Disability Class: Vision Difficulty
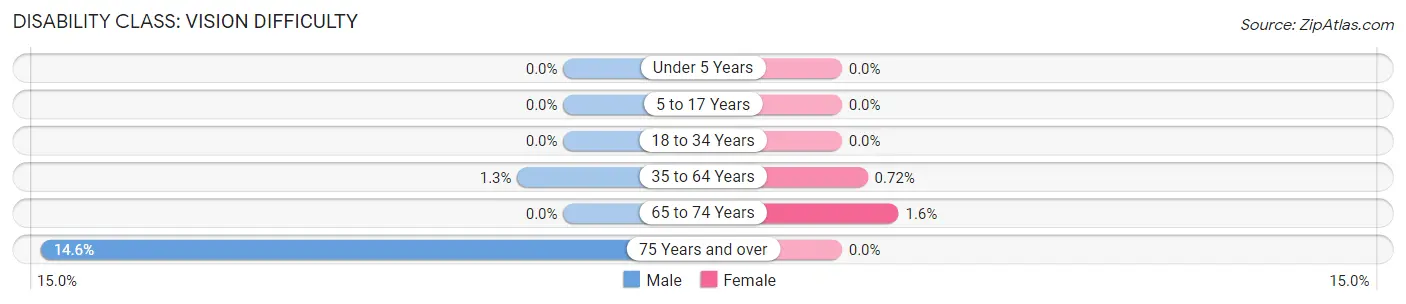
| Age Bracket | Male | Female |
| Under 5 Years | 0 (0.0%) | 0 (0.0%) |
| 5 to 17 Years | 0 (0.0%) | 0 (0.0%) |
| 18 to 34 Years | 0 (0.0%) | 0 (0.0%) |
| 35 to 64 Years | 22 (1.3%) | 10 (0.7%) |
| 65 to 74 Years | 0 (0.0%) | 15 (1.6%) |
| 75 Years and over | 96 (14.5%) | 0 (0.0%) |
Disability Class: Cognitive Difficulty
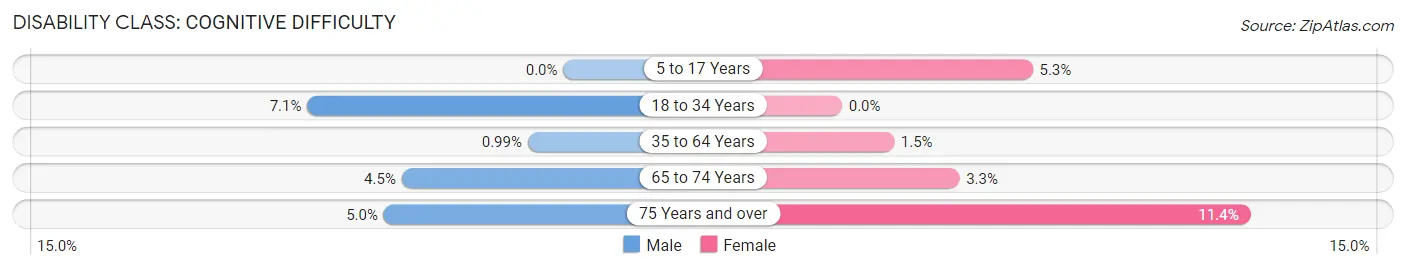
| Age Bracket | Male | Female |
| 5 to 17 Years | 0 (0.0%) | 38 (5.3%) |
| 18 to 34 Years | 38 (7.1%) | 0 (0.0%) |
| 35 to 64 Years | 17 (1.0%) | 20 (1.5%) |
| 65 to 74 Years | 37 (4.5%) | 31 (3.3%) |
| 75 Years and over | 33 (5.0%) | 57 (11.4%) |
Disability Class: Ambulatory Difficulty
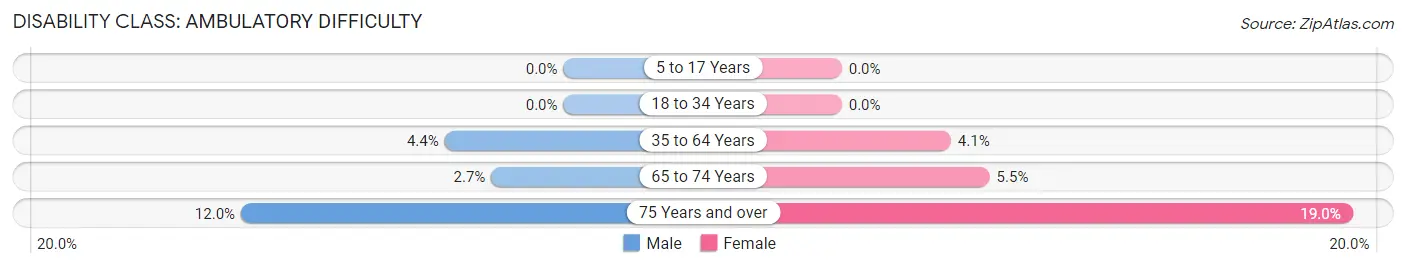
| Age Bracket | Male | Female |
| 5 to 17 Years | 0 (0.0%) | 0 (0.0%) |
| 18 to 34 Years | 0 (0.0%) | 0 (0.0%) |
| 35 to 64 Years | 76 (4.4%) | 56 (4.1%) |
| 65 to 74 Years | 22 (2.7%) | 52 (5.5%) |
| 75 Years and over | 79 (12.0%) | 95 (19.0%) |
Disability Class: Self-Care Difficulty
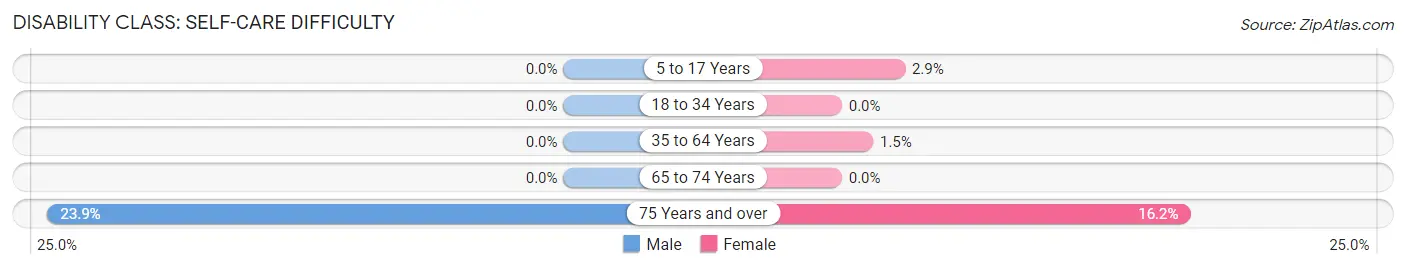
| Age Bracket | Male | Female |
| 5 to 17 Years | 0 (0.0%) | 21 (2.9%) |
| 18 to 34 Years | 0 (0.0%) | 0 (0.0%) |
| 35 to 64 Years | 0 (0.0%) | 20 (1.5%) |
| 65 to 74 Years | 0 (0.0%) | 0 (0.0%) |
| 75 Years and over | 158 (23.9%) | 81 (16.2%) |
Technology Access in Ivins
Computing Device Access in Ivins
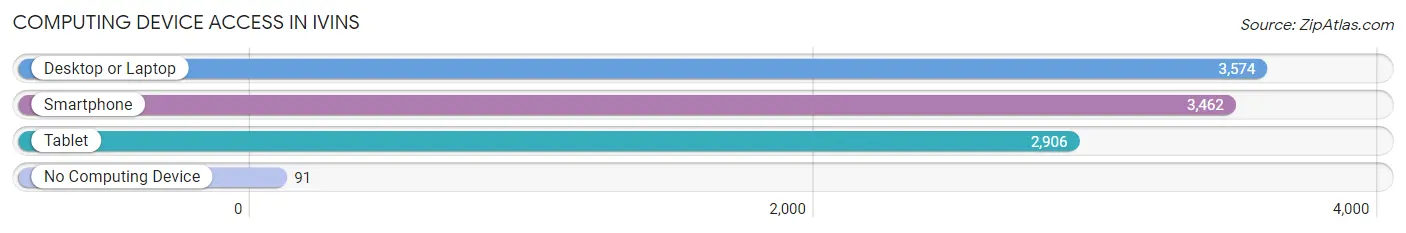
| Device Type | # Households | % Households |
| Desktop or Laptop | 3,574 | 95.0% |
| Smartphone | 3,462 | 92.0% |
| Tablet | 2,906 | 77.3% |
| No Computing Device | 91 | 2.4% |
| Total | 3,761 | 100.0% |
Internet Access in Ivins
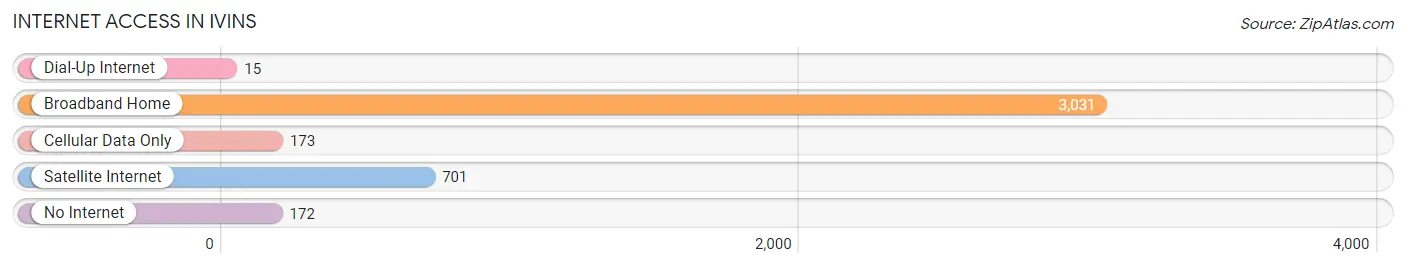
| Internet Type | # Households | % Households |
| Dial-Up Internet | 15 | 0.4% |
| Broadband Home | 3,031 | 80.6% |
| Cellular Data Only | 173 | 4.6% |
| Satellite Internet | 701 | 18.6% |
| No Internet | 172 | 4.6% |
| Total | 3,761 | 100.0% |
Ivins Summary
Ivins, Utah is a small city located in the southwestern corner of the state, just north of St. George. It is part of Washington County and is home to approximately 10,000 people. The city was founded in 1871 by Mormon settlers and was named after Anthony W. Ivins, a prominent leader in the Church of Jesus Christ of Latter-day Saints.
Geography
Ivins is located in the southwestern corner of Utah, just north of St. George. It is part of Washington County and is bordered by the Virgin River to the east and the Santa Clara River to the west. The city is situated at an elevation of 2,890 feet and covers an area of 8.3 square miles. The climate is arid and semi-arid, with hot summers and mild winters.
Economy
Ivins has a diverse economy, with a mix of agriculture, manufacturing, retail, and tourism. The city is home to several large employers, including the Tuacahn Center for the Arts, the Red Mountain Resort, and the Ivins City Corporation. Agriculture is a major industry in the area, with the production of hay, alfalfa, and other crops. Manufacturing is also important, with several companies producing furniture, clothing, and other goods. Retail is also a major part of the economy, with several stores and restaurants located in the city. Tourism is also a major industry, with the nearby Tuacahn Center for the Arts and the Red Mountain Resort drawing visitors from around the world.
Demographics
As of the 2010 census, Ivins had a population of 9,898. The racial makeup of the city was 91.3% White, 0.7% African American, 0.7% Native American, 0.7% Asian, 0.2% Pacific Islander, 4.2% from other races, and 2.1% from two or more races. Hispanic or Latino of any race were 8.3% of the population.
The median income for a household in the city was $45,938, and the median income for a family was $50,938. The per capita income for the city was $20,938. About 8.3% of families and 10.3% of the population were below the poverty line, including 14.3% of those under age 18 and 6.3% of those age 65 or over.
Conclusion
Ivins, Utah is a small city located in the southwestern corner of the state, just north of St. George. It is part of Washington County and is home to approximately 10,000 people. The city was founded in 1871 by Mormon settlers and was named after Anthony W. Ivins, a prominent leader in the Church of Jesus Christ of Latter-day Saints. Ivins has a diverse economy, with a mix of agriculture, manufacturing, retail, and tourism. The city is home to several large employers, including the Tuacahn Center for the Arts, the Red Mountain Resort, and the Ivins City Corporation. As of the 2010 census, Ivins had a population of 9,898. The racial makeup of the city was 91.3% White, 0.7% African American, 0.7% Native American, 0.7% Asian, 0.2% Pacific Islander, 4.2% from other races, and 2.1% from two or more races. The median income for a household in the city was $45,938, and the median income for a family was $50,938. Ivins is a vibrant city with a diverse economy and a strong sense of community.
Common Questions
What is Per Capita Income in Ivins?
Per Capita income in Ivins is $42,670.
What is the Median Family Income in Ivins?
Median Family Income in Ivins is $95,223.
What is the Median Household income in Ivins?
Median Household Income in Ivins is $67,354.
What is Income or Wage Gap in Ivins?
Income or Wage Gap in Ivins is 2.3%.
Women in Ivins earn 97.7 cents for every dollar earned by a man.
What is Inequality or Gini Index in Ivins?
Inequality or Gini Index in Ivins is 0.46.
What is the Total Population of Ivins?
Total Population of Ivins is 9,174.
What is the Total Male Population of Ivins?
Total Male Population of Ivins is 4,653.
What is the Total Female Population of Ivins?
Total Female Population of Ivins is 4,521.
What is the Ratio of Males per 100 Females in Ivins?
There are 102.92 Males per 100 Females in Ivins.
What is the Ratio of Females per 100 Males in Ivins?
There are 97.16 Females per 100 Males in Ivins.
What is the Median Population Age in Ivins?
Median Population Age in Ivins is 52.4 Years.
What is the Average Family Size in Ivins
Average Family Size in Ivins is 2.9 People.
What is the Average Household Size in Ivins
Average Household Size in Ivins is 2.4 People.
How Large is the Labor Force in Ivins?
There are 3,670 People in the Labor Forcein in Ivins.
What is the Percentage of People in the Labor Force in Ivins?
48.7% of People are in the Labor Force in Ivins.
What is the Unemployment Rate in Ivins?
Unemployment Rate in Ivins is 6.2%.