Centerfield, UT Map & Demographics
Centerfield Map
Centerfield Overview
$26,771
PER CAPITA INCOME
$94,063
AVG FAMILY INCOME
$68,333
AVG HOUSEHOLD INCOME
55.2%
WAGE / INCOME GAP [ % ]
44.8¢/ $1
WAGE / INCOME GAP [ $ ]
0.37
INEQUALITY / GINI INDEX
1,353
TOTAL POPULATION
692
MALE POPULATION
661
FEMALE POPULATION
104.69
MALES / 100 FEMALES
95.52
FEMALES / 100 MALES
35.5
MEDIAN AGE
3.8
AVG FAMILY SIZE
3.1
AVG HOUSEHOLD SIZE
731
LABOR FORCE [ PEOPLE ]
66.2%
PERCENT IN LABOR FORCE
5.5%
UNEMPLOYMENT RATE
Centerfield Zip Codes
Centerfield Area Codes
Income in Centerfield
Income Overview in Centerfield
Per Capita Income in Centerfield is $26,771, while median incomes of families and households are $94,063 and $68,333 respectively.
| Characteristic | Number | Measure |
| Per Capita Income | 1,353 | $26,771 |
| Median Family Income | 307 | $94,063 |
| Mean Family Income | 307 | $95,131 |
| Median Household Income | 420 | $68,333 |
| Mean Household Income | 420 | $80,967 |
| Income Deficit | 307 | $0 |
| Wage / Income Gap (%) | 1,353 | 55.25% |
| Wage / Income Gap ($) | 1,353 | 44.75¢ per $1 |
| Gini / Inequality Index | 1,353 | 0.37 |
Earnings by Sex in Centerfield
Average Earnings in Centerfield are $32,807, $48,727 for men and $21,806 for women, a difference of 55.2%.
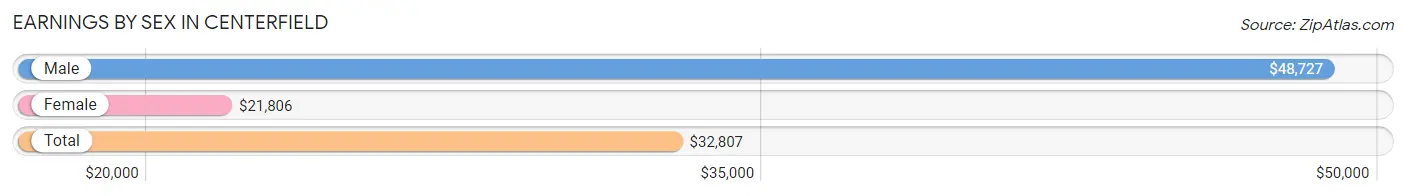
| Sex | Number | Average Earnings |
| Male | 423 (55.7%) | $48,727 |
| Female | 337 (44.3%) | $21,806 |
| Total | 760 (100.0%) | $32,807 |
Earnings by Sex by Income Bracket in Centerfield
The most common earnings brackets in Centerfield are $45,000 to $49,999 for men (57 | 13.5%) and $20,000 to $22,499 for women (45 | 13.4%).
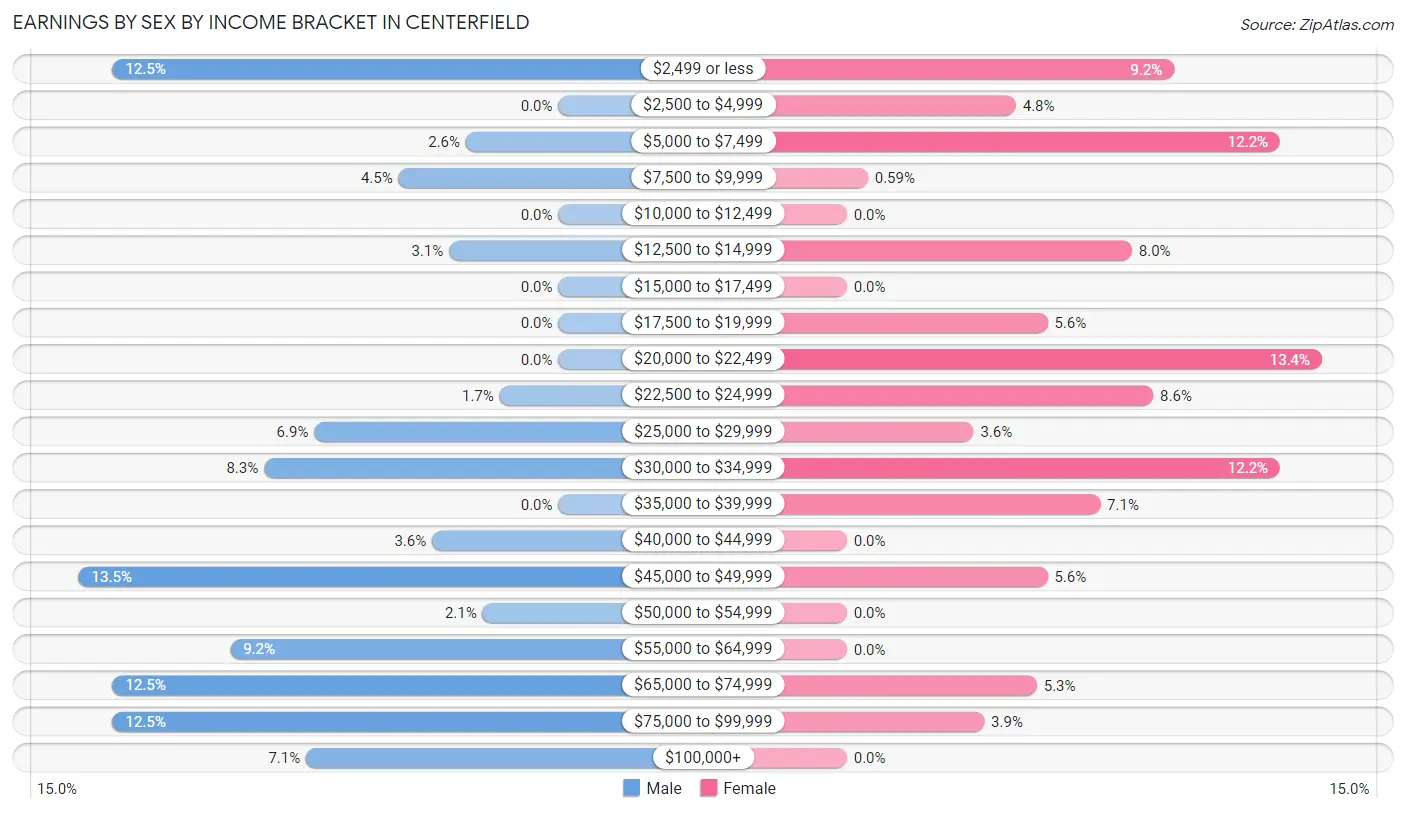
| Income | Male | Female |
| $2,499 or less | 53 (12.5%) | 31 (9.2%) |
| $2,500 to $4,999 | 0 (0.0%) | 16 (4.8%) |
| $5,000 to $7,499 | 11 (2.6%) | 41 (12.2%) |
| $7,500 to $9,999 | 19 (4.5%) | 2 (0.6%) |
| $10,000 to $12,499 | 0 (0.0%) | 0 (0.0%) |
| $12,500 to $14,999 | 13 (3.1%) | 27 (8.0%) |
| $15,000 to $17,499 | 0 (0.0%) | 0 (0.0%) |
| $17,500 to $19,999 | 0 (0.0%) | 19 (5.6%) |
| $20,000 to $22,499 | 0 (0.0%) | 45 (13.4%) |
| $22,500 to $24,999 | 7 (1.7%) | 29 (8.6%) |
| $25,000 to $29,999 | 29 (6.9%) | 12 (3.6%) |
| $30,000 to $34,999 | 35 (8.3%) | 41 (12.2%) |
| $35,000 to $39,999 | 0 (0.0%) | 24 (7.1%) |
| $40,000 to $44,999 | 15 (3.5%) | 0 (0.0%) |
| $45,000 to $49,999 | 57 (13.5%) | 19 (5.6%) |
| $50,000 to $54,999 | 9 (2.1%) | 0 (0.0%) |
| $55,000 to $64,999 | 39 (9.2%) | 0 (0.0%) |
| $65,000 to $74,999 | 53 (12.5%) | 18 (5.3%) |
| $75,000 to $99,999 | 53 (12.5%) | 13 (3.9%) |
| $100,000+ | 30 (7.1%) | 0 (0.0%) |
| Total | 423 (100.0%) | 337 (100.0%) |
Earnings by Sex by Educational Attainment in Centerfield
Average earnings in Centerfield are $63,125 for men and $23,276 for women, a difference of 63.1%. Men with an educational attainment of college or associate's degree enjoy the highest average annual earnings of $69,375, while those with bachelor's degree education earn the least with $56,667. Women with an educational attainment of college or associate's degree earn the most with the average annual earnings of $32,917, while those with high school diploma education have the smallest earnings of $23,190.
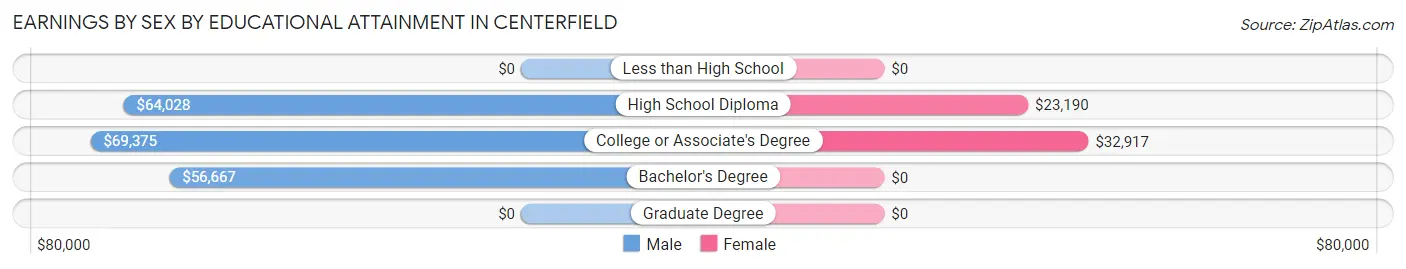
| Educational Attainment | Male Income | Female Income |
| Less than High School | - | - |
| High School Diploma | $64,028 | $23,190 |
| College or Associate's Degree | $69,375 | $32,917 |
| Bachelor's Degree | $56,667 | $0 |
| Graduate Degree | - | - |
| Total | $63,125 | $23,276 |
Family Income in Centerfield
Family Income Brackets in Centerfield
According to the Centerfield family income data, there are 87 families falling into the $100,000 to $149,999 income range, which is the most common income bracket and makes up 28.3% of all families.
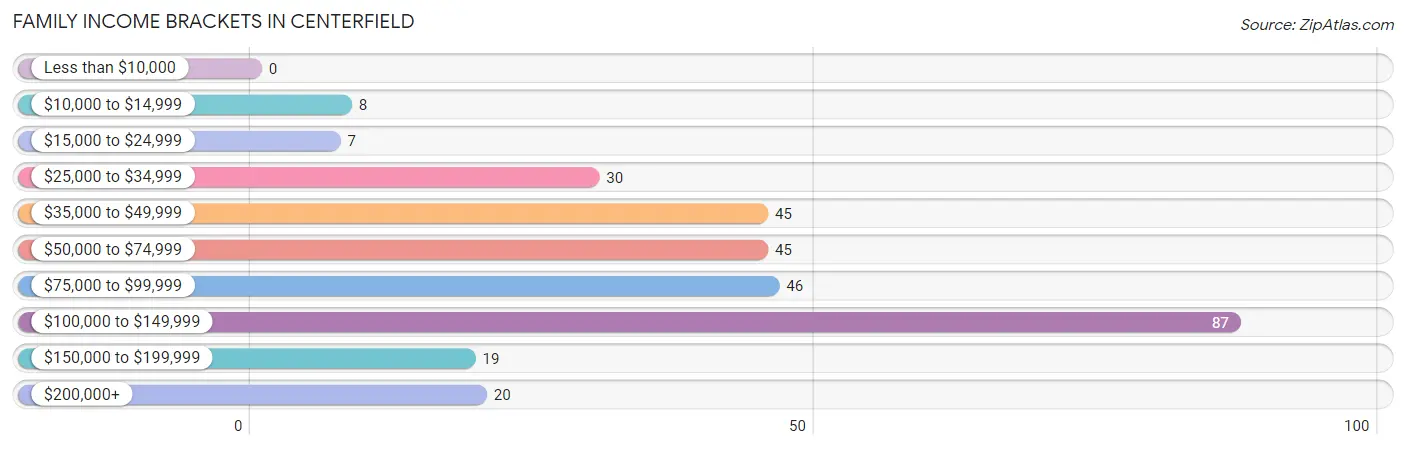
| Income Bracket | # Families | % Families |
| Less than $10,000 | 0 | 0.0% |
| $10,000 to $14,999 | 8 | 2.6% |
| $15,000 to $24,999 | 7 | 2.3% |
| $25,000 to $34,999 | 30 | 9.8% |
| $35,000 to $49,999 | 45 | 14.7% |
| $50,000 to $74,999 | 45 | 14.7% |
| $75,000 to $99,999 | 46 | 15.0% |
| $100,000 to $149,999 | 87 | 28.3% |
| $150,000 to $199,999 | 19 | 6.2% |
| $200,000+ | 20 | 6.5% |
Family Income by Famaliy Size in Centerfield
4-person families (52 | 16.9%) account for the highest median family income in Centerfield with $132,222 per family, while 2-person families (88 | 28.7%) have the highest median income of $45,156 per family member.
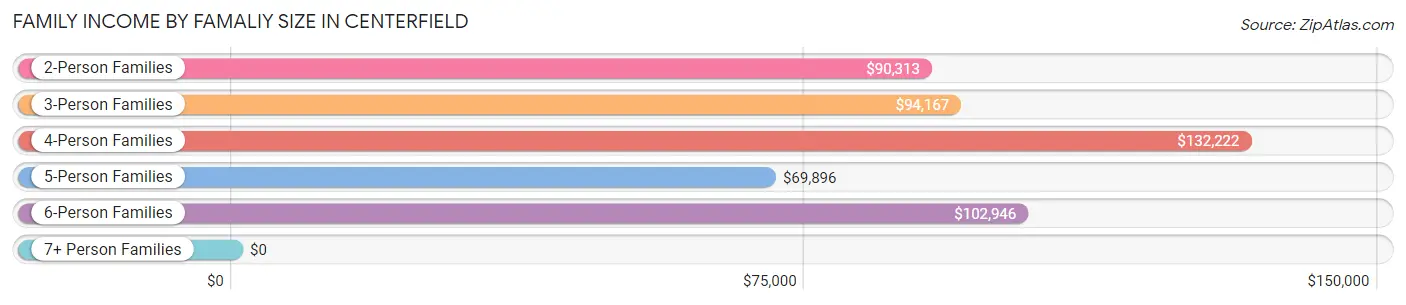
| Income Bracket | # Families | Median Income |
| 2-Person Families | 88 (28.7%) | $90,313 |
| 3-Person Families | 100 (32.6%) | $94,167 |
| 4-Person Families | 52 (16.9%) | $132,222 |
| 5-Person Families | 23 (7.5%) | $69,896 |
| 6-Person Families | 23 (7.5%) | $102,946 |
| 7+ Person Families | 21 (6.8%) | $0 |
| Total | 307 (100.0%) | $94,063 |
Family Income by Number of Earners in Centerfield
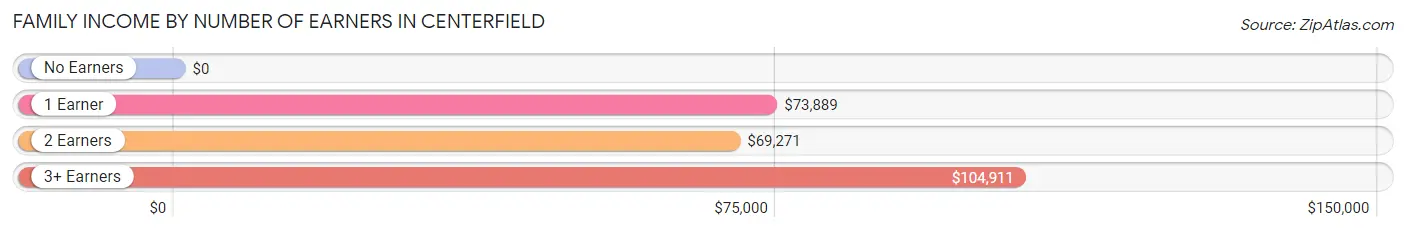
| Number of Earners | # Families | Median Income |
| No Earners | 19 (6.2%) | $0 |
| 1 Earner | 108 (35.2%) | $73,889 |
| 2 Earners | 97 (31.6%) | $69,271 |
| 3+ Earners | 83 (27.0%) | $104,911 |
| Total | 307 (100.0%) | $94,063 |
Household Income in Centerfield
Household Income Brackets in Centerfield
With 87 households falling in the category, the $100,000 to $149,999 income range is the most frequent in Centerfield, accounting for 20.7% of all households.
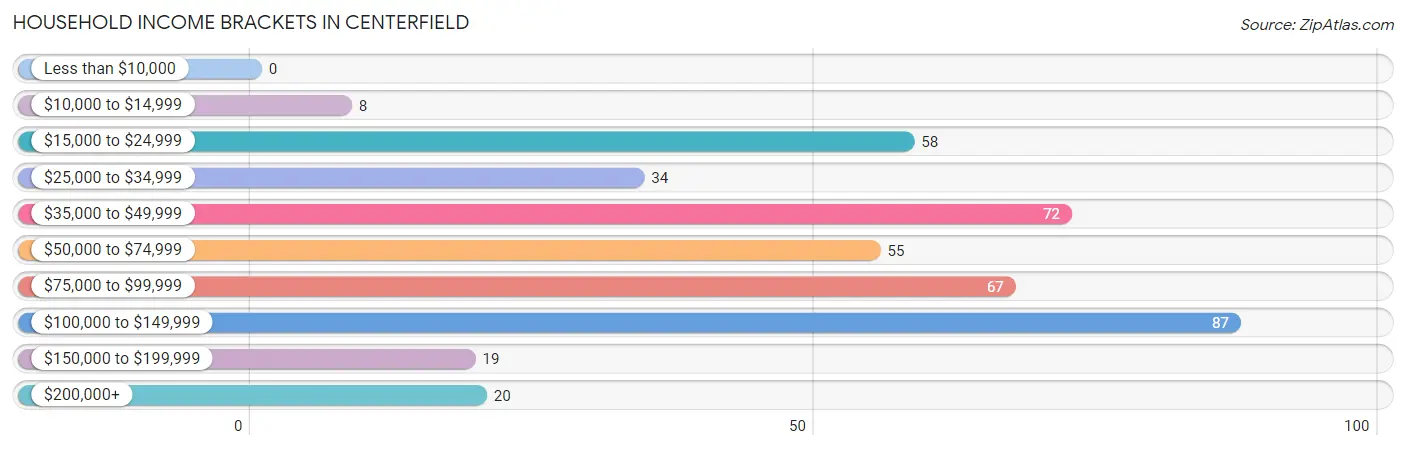
| Income Bracket | # Households | % Households |
| Less than $10,000 | 0 | 0.0% |
| $10,000 to $14,999 | 8 | 1.9% |
| $15,000 to $24,999 | 58 | 13.8% |
| $25,000 to $34,999 | 34 | 8.1% |
| $35,000 to $49,999 | 72 | 17.1% |
| $50,000 to $74,999 | 55 | 13.1% |
| $75,000 to $99,999 | 67 | 16.0% |
| $100,000 to $149,999 | 87 | 20.7% |
| $150,000 to $199,999 | 19 | 4.5% |
| $200,000+ | 20 | 4.8% |
Household Income by Householder Age in Centerfield
The median household income in Centerfield is $68,333, with the highest median household income of $92,344 found in the 45 to 64 years age bracket for the primary householder. A total of 181 households (43.1%) fall into this category. Meanwhile, the 15 to 24 years age bracket for the primary householder has the lowest median household income of $0, with 14 households (3.3%) in this group.
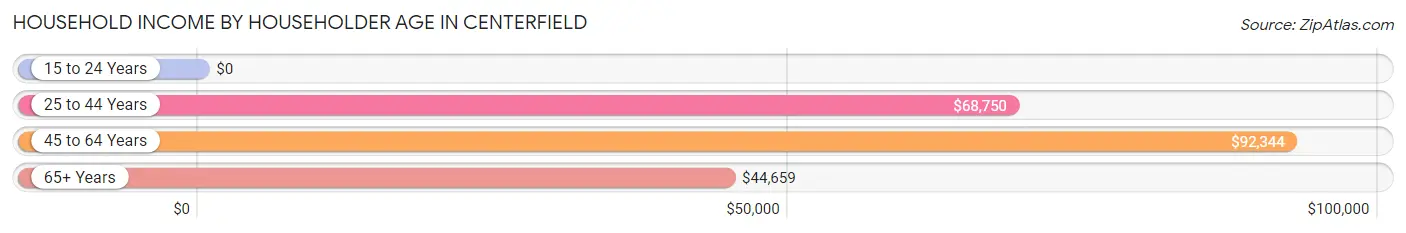
| Income Bracket | # Households | Median Income |
| 15 to 24 Years | 14 (3.3%) | $0 |
| 25 to 44 Years | 124 (29.5%) | $68,750 |
| 45 to 64 Years | 181 (43.1%) | $92,344 |
| 65+ Years | 101 (24.0%) | $44,659 |
| Total | 420 (100.0%) | $68,333 |
Poverty in Centerfield
Income Below Poverty by Sex and Age in Centerfield
With 9.8% poverty level for males and 14.9% for females among the residents of Centerfield, under 5 year old males and 25 to 34 year old females are the most vulnerable to poverty, with 26 males (54.2%) and 52 females (52.5%) in their respective age groups living below the poverty level.
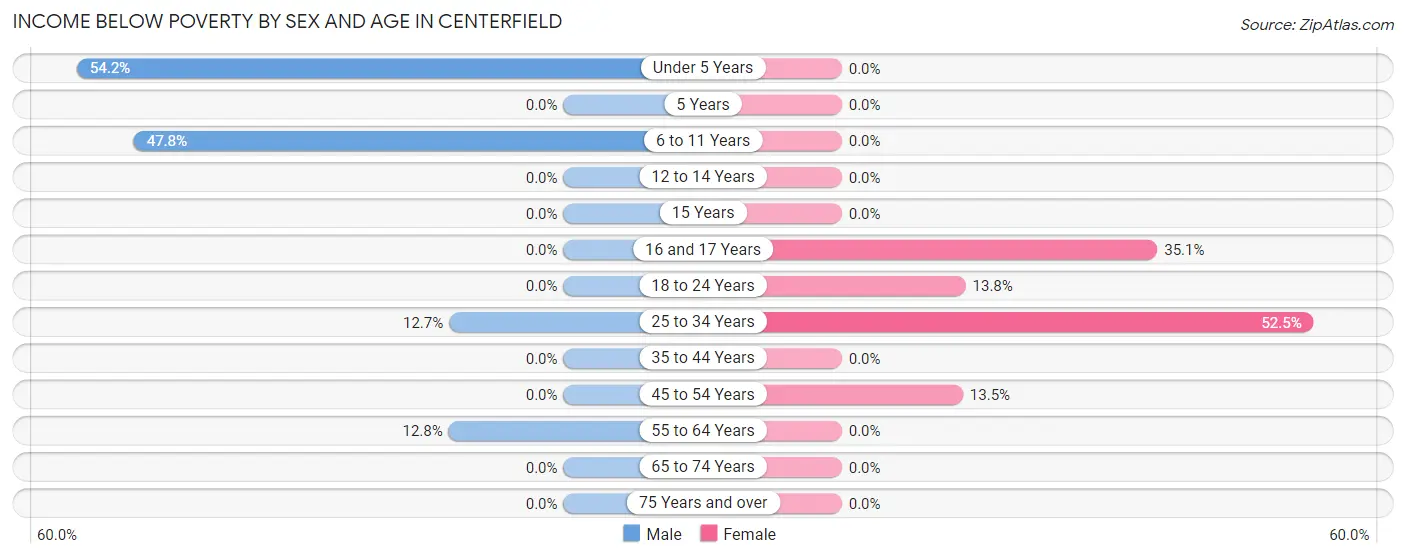
| Age Bracket | Male | Female |
| Under 5 Years | 26 (54.2%) | 0 (0.0%) |
| 5 Years | 0 (0.0%) | 0 (0.0%) |
| 6 to 11 Years | 22 (47.8%) | 0 (0.0%) |
| 12 to 14 Years | 0 (0.0%) | 0 (0.0%) |
| 15 Years | 0 (0.0%) | 0 (0.0%) |
| 16 and 17 Years | 0 (0.0%) | 13 (35.1%) |
| 18 to 24 Years | 0 (0.0%) | 12 (13.8%) |
| 25 to 34 Years | 7 (12.7%) | 52 (52.5%) |
| 35 to 44 Years | 0 (0.0%) | 0 (0.0%) |
| 45 to 54 Years | 0 (0.0%) | 17 (13.5%) |
| 55 to 64 Years | 11 (12.8%) | 0 (0.0%) |
| 65 to 74 Years | 0 (0.0%) | 0 (0.0%) |
| 75 Years and over | 0 (0.0%) | 0 (0.0%) |
| Total | 66 (9.8%) | 94 (14.9%) |
Income Above Poverty by Sex and Age in Centerfield
According to the poverty statistics in Centerfield, males aged 5 years and females aged under 5 years are the age groups that are most secure financially, with 100.0% of males and 100.0% of females in these age groups living above the poverty line.
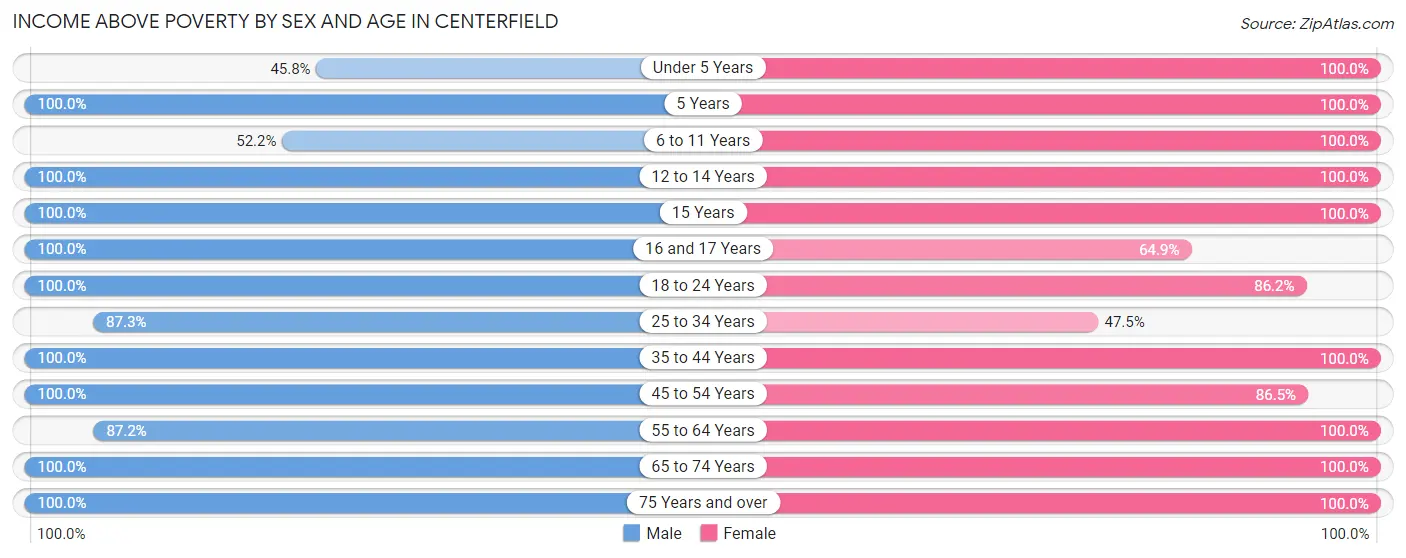
| Age Bracket | Male | Female |
| Under 5 Years | 22 (45.8%) | 20 (100.0%) |
| 5 Years | 3 (100.0%) | 3 (100.0%) |
| 6 to 11 Years | 24 (52.2%) | 48 (100.0%) |
| 12 to 14 Years | 48 (100.0%) | 17 (100.0%) |
| 15 Years | 11 (100.0%) | 5 (100.0%) |
| 16 and 17 Years | 30 (100.0%) | 24 (64.9%) |
| 18 to 24 Years | 113 (100.0%) | 75 (86.2%) |
| 25 to 34 Years | 48 (87.3%) | 47 (47.5%) |
| 35 to 44 Years | 62 (100.0%) | 64 (100.0%) |
| 45 to 54 Years | 86 (100.0%) | 109 (86.5%) |
| 55 to 64 Years | 75 (87.2%) | 62 (100.0%) |
| 65 to 74 Years | 55 (100.0%) | 50 (100.0%) |
| 75 Years and over | 28 (100.0%) | 14 (100.0%) |
| Total | 605 (90.2%) | 538 (85.1%) |
Income Below Poverty Among Married-Couple Families in Centerfield
The poverty statistics for married-couple families in Centerfield show that 6.9% or 18 of the total 262 families live below the poverty line. Families with 3 or 4 children have the highest poverty rate of 27.5%, comprising of 11 families. On the other hand, families with no children have the lowest poverty rate of 0.0%, which includes 0 families.
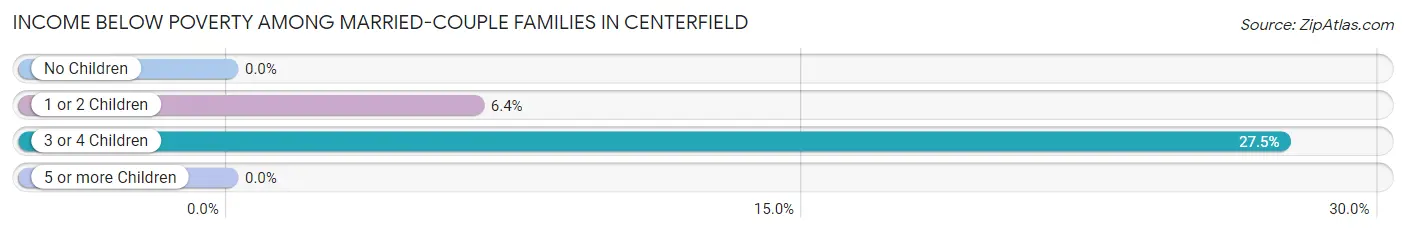
| Children | Above Poverty | Below Poverty |
| No Children | 110 (100.0%) | 0 (0.0%) |
| 1 or 2 Children | 102 (93.6%) | 7 (6.4%) |
| 3 or 4 Children | 29 (72.5%) | 11 (27.5%) |
| 5 or more Children | 3 (100.0%) | 0 (0.0%) |
| Total | 244 (93.1%) | 18 (6.9%) |
Income Below Poverty Among Single-Parent Households in Centerfield
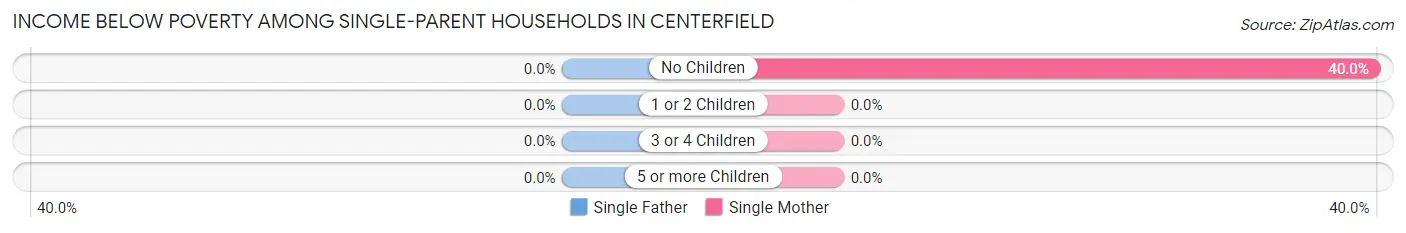
| Children | Single Father | Single Mother |
| No Children | 0 (0.0%) | 8 (40.0%) |
| 1 or 2 Children | 0 (0.0%) | 0 (0.0%) |
| 3 or 4 Children | 0 (0.0%) | 0 (0.0%) |
| 5 or more Children | 0 (0.0%) | 0 (0.0%) |
| Total | 0 (0.0%) | 8 (17.8%) |
Income Below Poverty Among Married-Couple vs Single-Parent Households in Centerfield
The poverty data for Centerfield shows that 18 of the married-couple family households (6.9%) and 8 of the single-parent households (17.8%) are living below the poverty level. Within the married-couple family households, those with 3 or 4 children have the highest poverty rate, with 11 households (27.5%) falling below the poverty line. Among the single-parent households, those with no children have the highest poverty rate, with 8 household (40.0%) living below poverty.
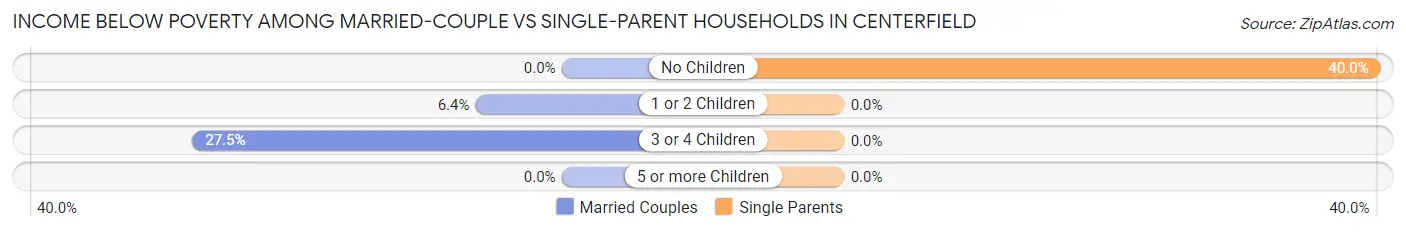
| Children | Married-Couple Families | Single-Parent Households |
| No Children | 0 (0.0%) | 8 (40.0%) |
| 1 or 2 Children | 7 (6.4%) | 0 (0.0%) |
| 3 or 4 Children | 11 (27.5%) | 0 (0.0%) |
| 5 or more Children | 0 (0.0%) | 0 (0.0%) |
| Total | 18 (6.9%) | 8 (17.8%) |
Race in Centerfield
The most populous races in Centerfield are White / Caucasian (1,184 | 87.5%), Hispanic or Latino (128 | 9.5%), and Some other Race (126 | 9.3%).
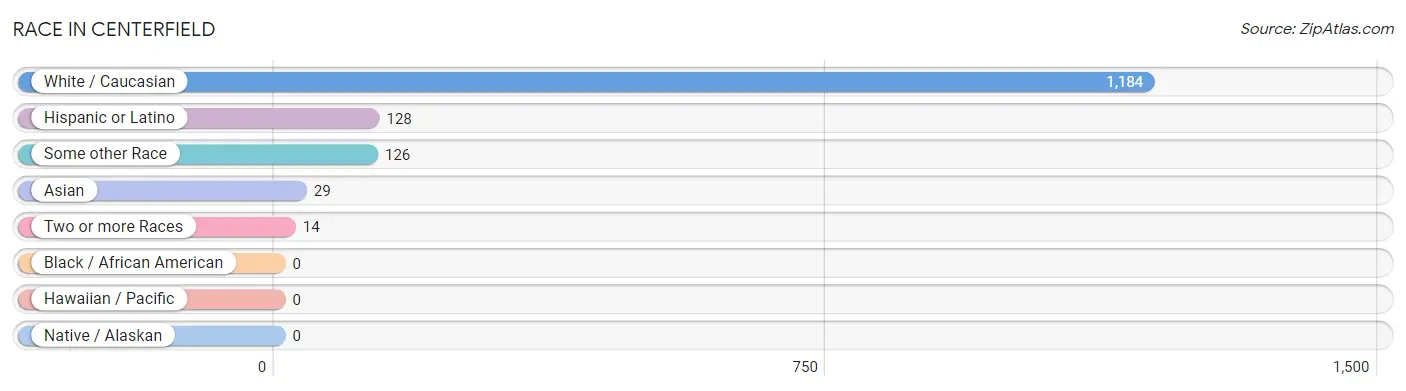
| Race | # Population | % Population |
| Asian | 29 | 2.1% |
| Black / African American | 0 | 0.0% |
| Hawaiian / Pacific | 0 | 0.0% |
| Hispanic or Latino | 128 | 9.5% |
| Native / Alaskan | 0 | 0.0% |
| White / Caucasian | 1,184 | 87.5% |
| Two or more Races | 14 | 1.0% |
| Some other Race | 126 | 9.3% |
| Total | 1,353 | 100.0% |
Ancestry in Centerfield
The most populous ancestries reported in Centerfield are English (356 | 26.3%), German (319 | 23.6%), Danish (273 | 20.2%), Mexican (128 | 9.5%), and Swedish (96 | 7.1%), together accounting for 86.6% of all Centerfield residents.
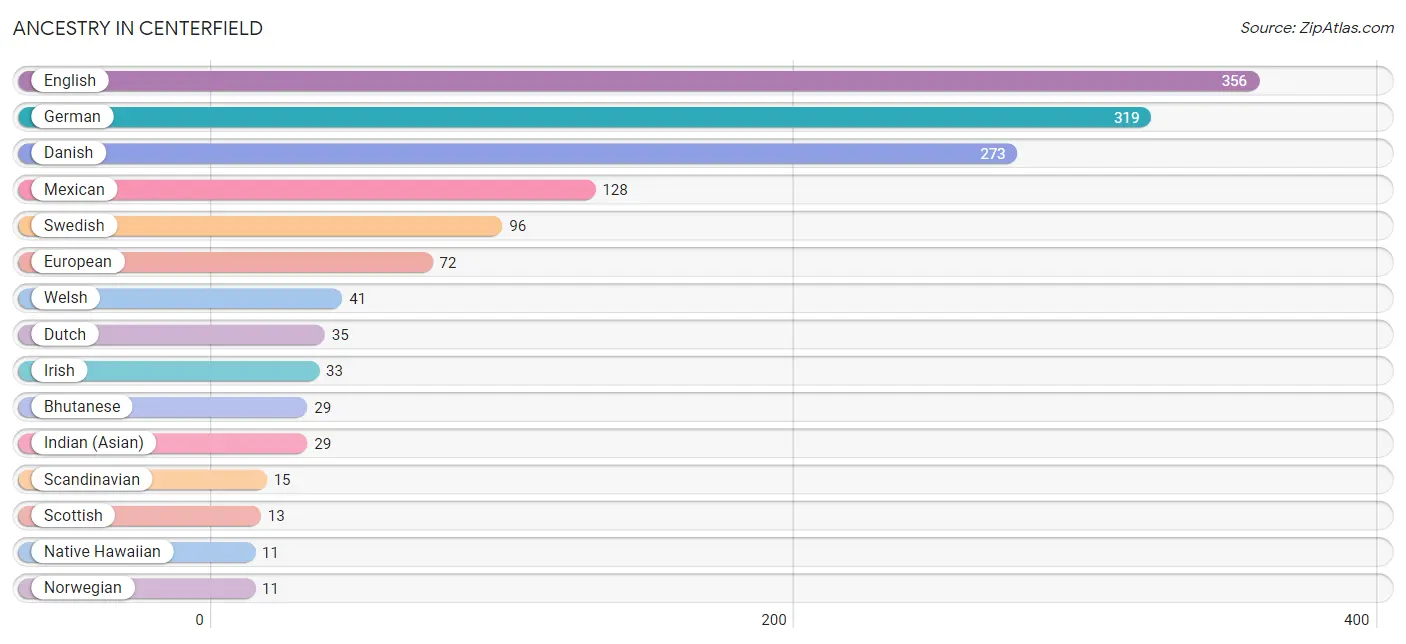
| Ancestry | # Population | % Population |
| Bhutanese | 29 | 2.1% |
| British | 8 | 0.6% |
| Danish | 273 | 20.2% |
| Dutch | 35 | 2.6% |
| English | 356 | 26.3% |
| European | 72 | 5.3% |
| French | 3 | 0.2% |
| German | 319 | 23.6% |
| Indian (Asian) | 29 | 2.1% |
| Irish | 33 | 2.4% |
| Mexican | 128 | 9.5% |
| Native Hawaiian | 11 | 0.8% |
| Norwegian | 11 | 0.8% |
| Pakistani | 3 | 0.2% |
| Scandinavian | 15 | 1.1% |
| Scottish | 13 | 1.0% |
| Swedish | 96 | 7.1% |
| Swiss | 2 | 0.2% |
| Welsh | 41 | 3.0% | View All 19 Rows |
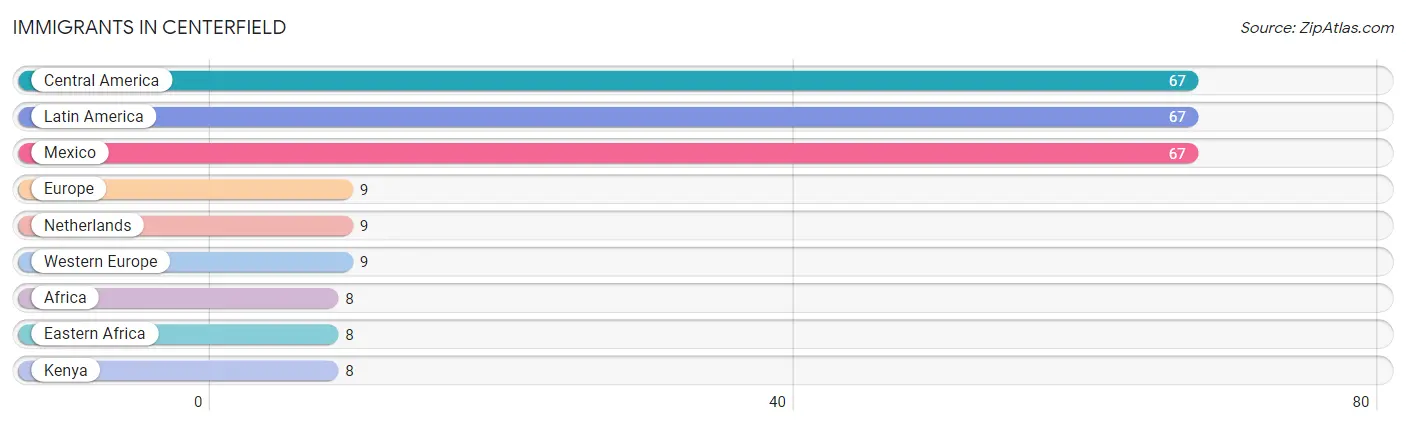
Immigrants in Centerfield
The most numerous immigrant groups reported in Centerfield came from Central America (67 | 5.0%), Latin America (67 | 5.0%), Mexico (67 | 5.0%), Europe (9 | 0.7%), and Netherlands (9 | 0.7%), together accounting for 16.2% of all Centerfield residents.
| Immigration Origin | # Population | % Population |
| Africa | 8 | 0.6% |
| Central America | 67 | 5.0% |
| Eastern Africa | 8 | 0.6% |
| Europe | 9 | 0.7% |
| Kenya | 8 | 0.6% |
| Latin America | 67 | 5.0% |
| Mexico | 67 | 5.0% |
| Netherlands | 9 | 0.7% |
| Western Europe | 9 | 0.7% | View All 9 Rows |
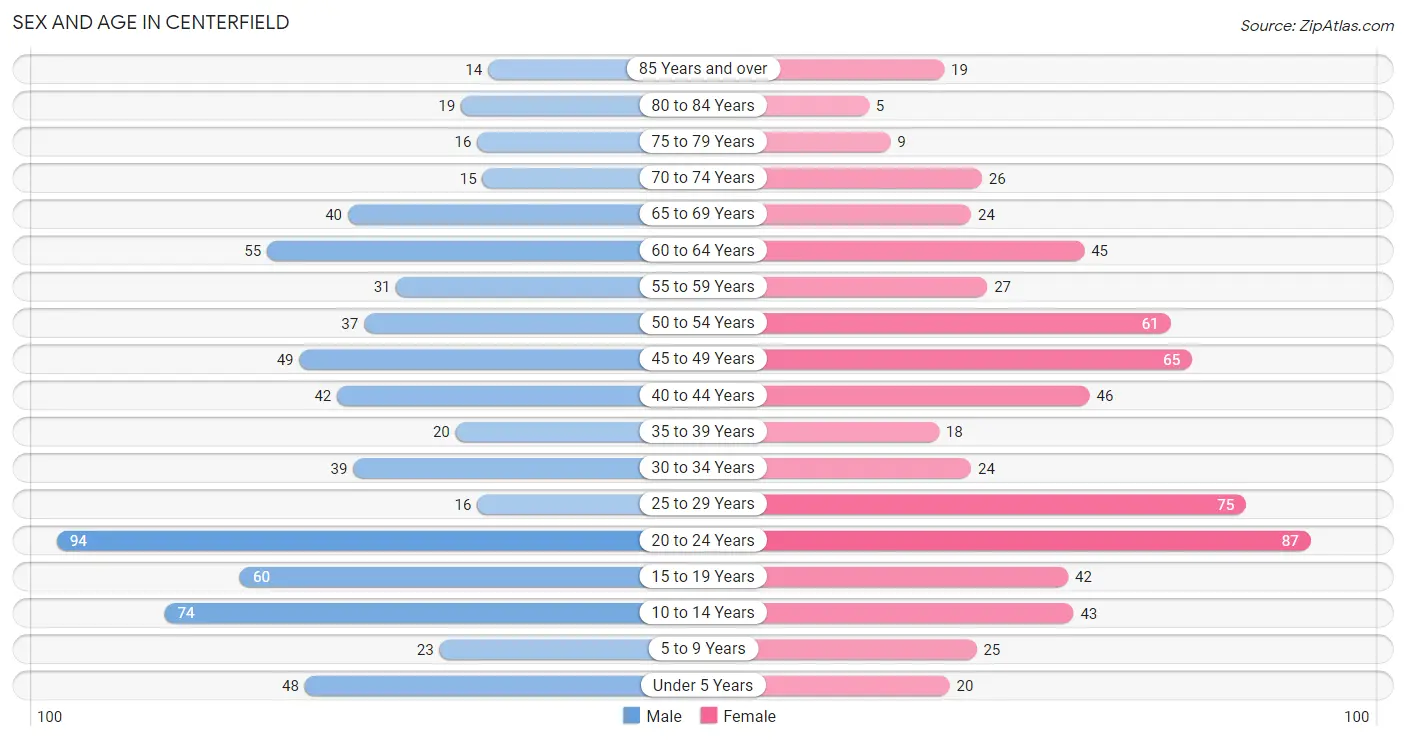
Sex and Age in Centerfield
Sex and Age in Centerfield
The most populous age groups in Centerfield are 20 to 24 Years (94 | 13.6%) for men and 20 to 24 Years (87 | 13.2%) for women.
| Age Bracket | Male | Female |
| Under 5 Years | 48 (6.9%) | 20 (3.0%) |
| 5 to 9 Years | 23 (3.3%) | 25 (3.8%) |
| 10 to 14 Years | 74 (10.7%) | 43 (6.5%) |
| 15 to 19 Years | 60 (8.7%) | 42 (6.4%) |
| 20 to 24 Years | 94 (13.6%) | 87 (13.2%) |
| 25 to 29 Years | 16 (2.3%) | 75 (11.4%) |
| 30 to 34 Years | 39 (5.6%) | 24 (3.6%) |
| 35 to 39 Years | 20 (2.9%) | 18 (2.7%) |
| 40 to 44 Years | 42 (6.1%) | 46 (7.0%) |
| 45 to 49 Years | 49 (7.1%) | 65 (9.8%) |
| 50 to 54 Years | 37 (5.3%) | 61 (9.2%) |
| 55 to 59 Years | 31 (4.5%) | 27 (4.1%) |
| 60 to 64 Years | 55 (8.0%) | 45 (6.8%) |
| 65 to 69 Years | 40 (5.8%) | 24 (3.6%) |
| 70 to 74 Years | 15 (2.2%) | 26 (3.9%) |
| 75 to 79 Years | 16 (2.3%) | 9 (1.4%) |
| 80 to 84 Years | 19 (2.8%) | 5 (0.8%) |
| 85 Years and over | 14 (2.0%) | 19 (2.9%) |
| Total | 692 (100.0%) | 661 (100.0%) |
Families and Households in Centerfield
Median Family Size in Centerfield
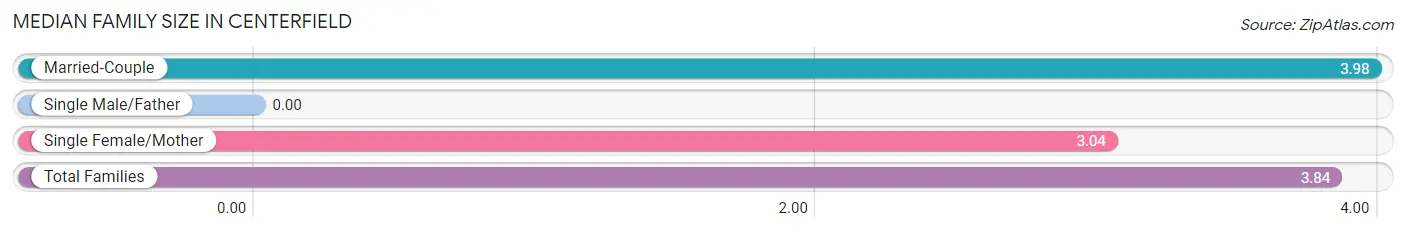
| Family Type | # Families | Family Size |
| Married-Couple | 262 (85.3%) | 3.98 |
| Single Male/Father | 0 (0.0%) | - |
| Single Female/Mother | 45 (14.7%) | 3.04 |
| Total Families | 307 (100.0%) | 3.84 |
Median Household Size in Centerfield
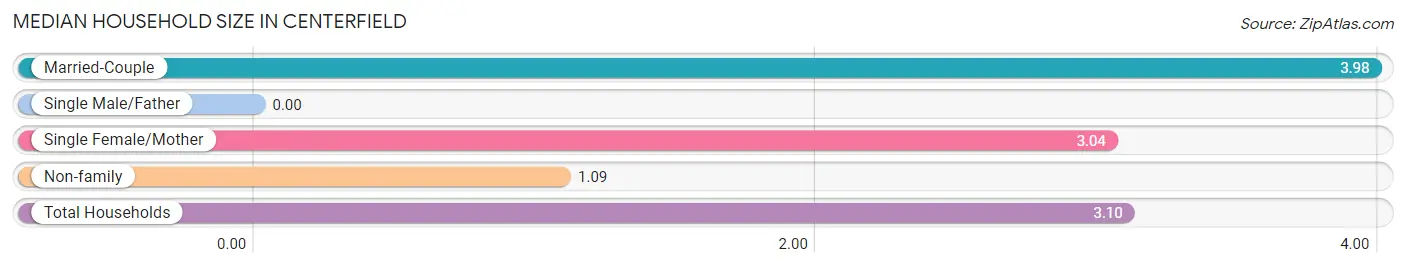
| Household Type | # Households | Household Size |
| Married-Couple | 262 (62.4%) | 3.98 |
| Single Male/Father | 0 (0.0%) | - |
| Single Female/Mother | 45 (10.7%) | 3.04 |
| Non-family | 113 (26.9%) | 1.09 |
| Total Households | 420 (100.0%) | 3.10 |
Household Size by Marriage Status in Centerfield
Out of a total of 420 households in Centerfield, 307 (73.1%) are family households, while 113 (26.9%) are nonfamily households. The most numerous type of family households are 3-person households, comprising 100, and the most common type of nonfamily households are 1-person households, comprising 102.
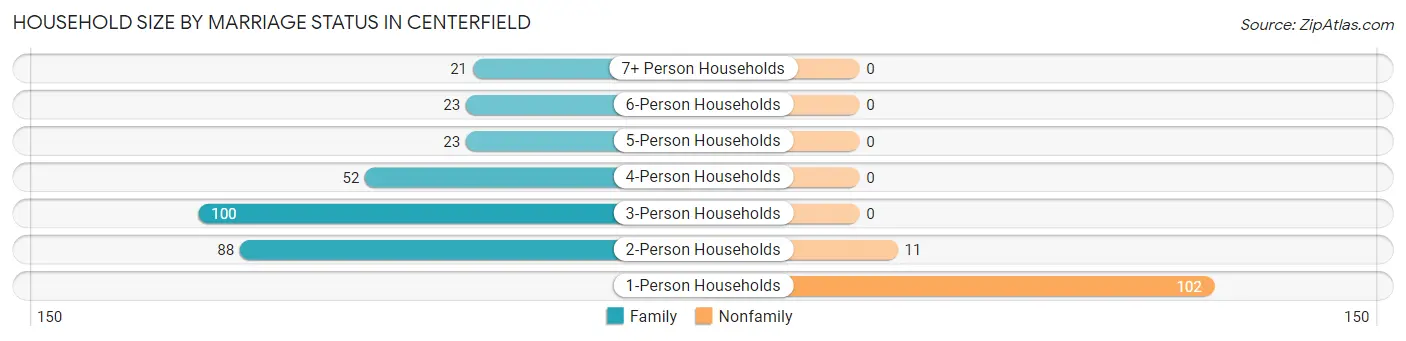
| Household Size | Family Households | Nonfamily Households |
| 1-Person Households | - | 102 (24.3%) |
| 2-Person Households | 88 (20.9%) | 11 (2.6%) |
| 3-Person Households | 100 (23.8%) | 0 (0.0%) |
| 4-Person Households | 52 (12.4%) | 0 (0.0%) |
| 5-Person Households | 23 (5.5%) | 0 (0.0%) |
| 6-Person Households | 23 (5.5%) | 0 (0.0%) |
| 7+ Person Households | 21 (5.0%) | 0 (0.0%) |
| Total | 307 (73.1%) | 113 (26.9%) |
Female Fertility in Centerfield
Fertility by Age in Centerfield
Average fertility rate in Centerfield is 21.0 births per 1,000 women. Women in the age bracket of 20 to 34 years have the highest fertility rate with 43.0 births per 1,000 women. Women in the age bracket of 20 to 34 years acount for 100.0% of all women with births.
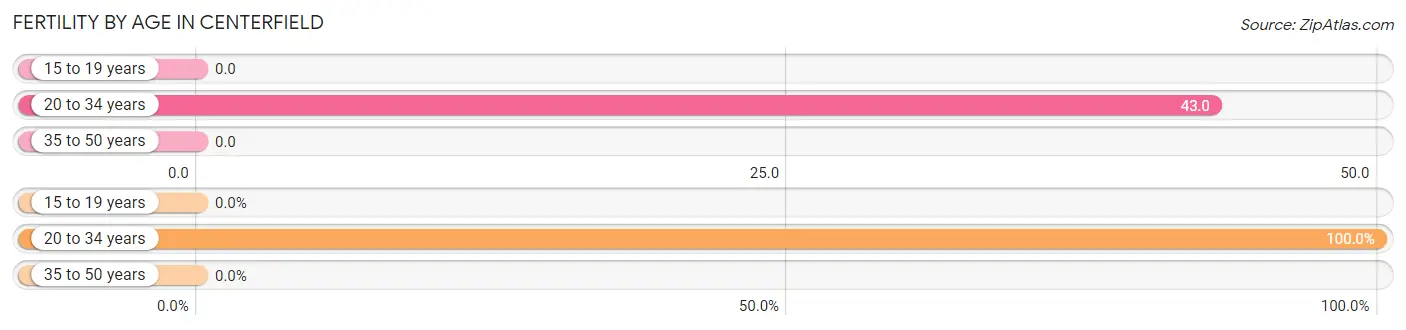
| Age Bracket | Women with Births | Births / 1,000 Women |
| 15 to 19 years | 0 (0.0%) | 0.0 |
| 20 to 34 years | 8 (100.0%) | 43.0 |
| 35 to 50 years | 0 (0.0%) | 0.0 |
| Total | 8 (100.0%) | 21.0 |
Fertility by Age by Marriage Status in Centerfield
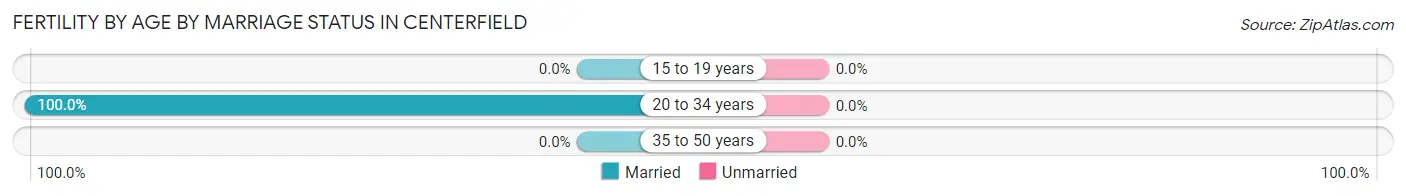
| Age Bracket | Married | Unmarried |
| 15 to 19 years | 0 (0.0%) | 0 (0.0%) |
| 20 to 34 years | 8 (100.0%) | 0 (0.0%) |
| 35 to 50 years | 0 (0.0%) | 0 (0.0%) |
| Total | 8 (100.0%) | 0 (0.0%) |
Fertility by Education in Centerfield
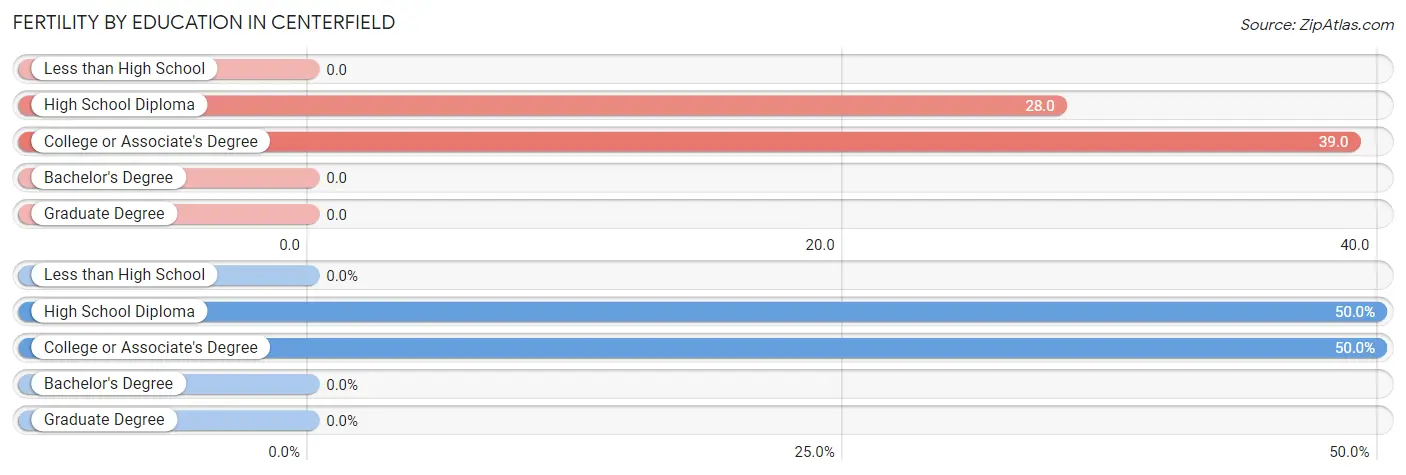
| Educational Attainment | Women with Births | Births / 1,000 Women |
| Less than High School | 0 (0.0%) | 0.0 |
| High School Diploma | 4 (50.0%) | 28.0 |
| College or Associate's Degree | 4 (50.0%) | 39.0 |
| Bachelor's Degree | 0 (0.0%) | 0.0 |
| Graduate Degree | 0 (0.0%) | 0.0 |
| Total | 8 (100.0%) | 21.0 |
Fertility by Education by Marriage Status in Centerfield
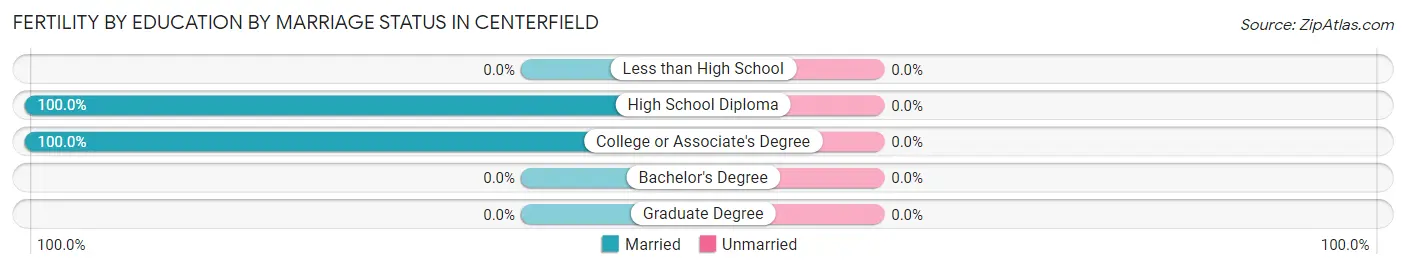
| Educational Attainment | Married | Unmarried |
| Less than High School | 0 (0.0%) | 0 (0.0%) |
| High School Diploma | 4 (100.0%) | 0 (0.0%) |
| College or Associate's Degree | 4 (100.0%) | 0 (0.0%) |
| Bachelor's Degree | 0 (0.0%) | 0 (0.0%) |
| Graduate Degree | 0 (0.0%) | 0 (0.0%) |
| Total | 8 (100.0%) | 0 (0.0%) |
Employment Characteristics in Centerfield
Employment by Class of Employer in Centerfield
Among the 657 employed individuals in Centerfield, private company employees (405 | 61.6%), state government employees (113 | 17.2%), and self-employed (not incorporated) (51 | 7.8%) make up the most common classes of employment.
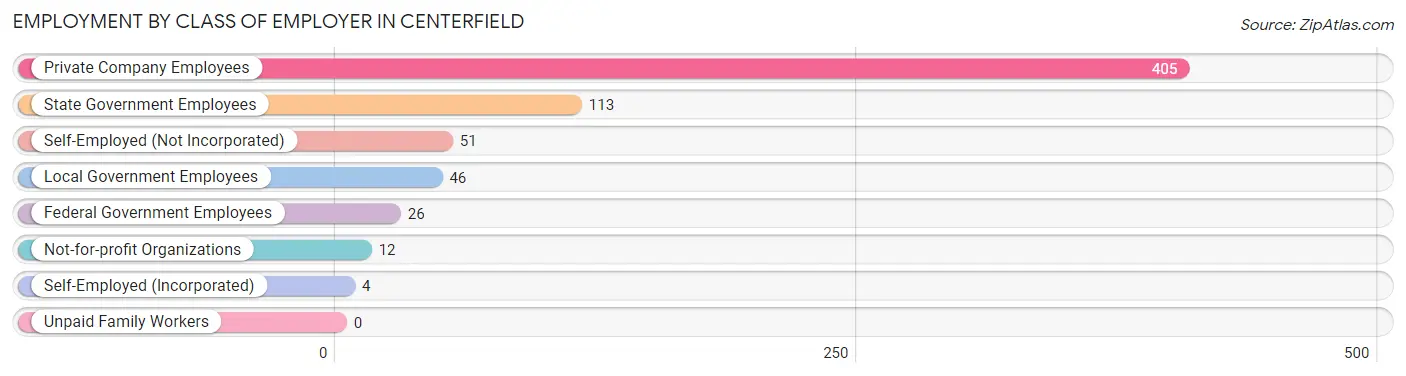
| Employer Class | # Employees | % Employees |
| Private Company Employees | 405 | 61.6% |
| Self-Employed (Incorporated) | 4 | 0.6% |
| Self-Employed (Not Incorporated) | 51 | 7.8% |
| Not-for-profit Organizations | 12 | 1.8% |
| Local Government Employees | 46 | 7.0% |
| State Government Employees | 113 | 17.2% |
| Federal Government Employees | 26 | 4.0% |
| Unpaid Family Workers | 0 | 0.0% |
| Total | 657 | 100.0% |
Employment Status by Age in Centerfield
According to the labor force statistics for Centerfield, out of the total population over 16 years of age (1,104), 66.2% or 731 individuals are in the labor force, with 5.5% or 40 of them unemployed. The age group with the highest labor force participation rate is 30 to 34 years, with 93.7% or 59 individuals in the labor force. Within the labor force, the 55 to 59 years age range has the highest percentage of unemployed individuals, with 24.1% or 13 of them being unemployed.
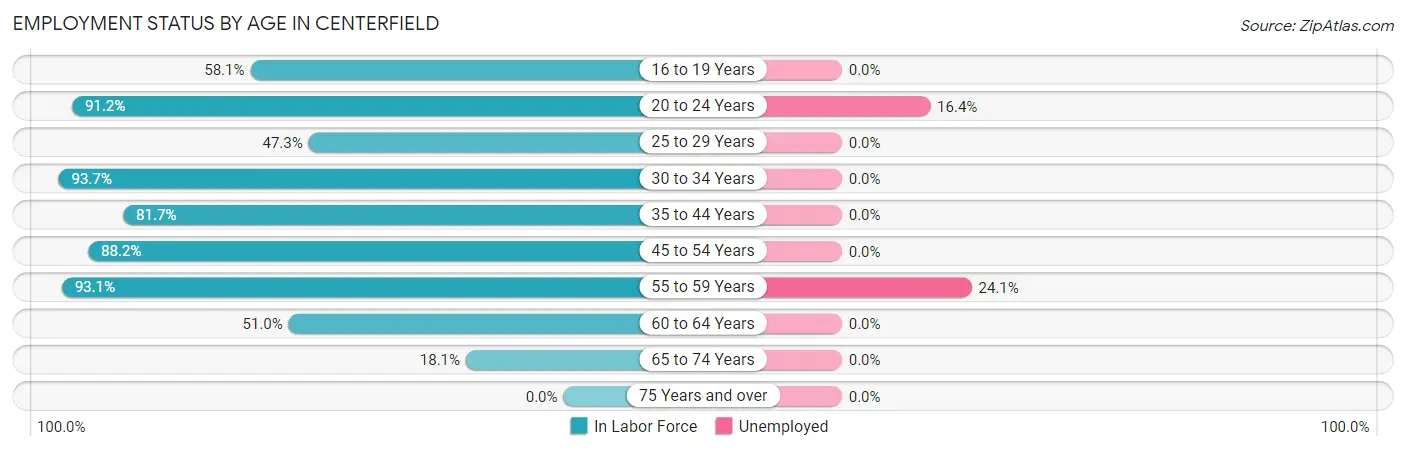
| Age Bracket | In Labor Force | Unemployed |
| 16 to 19 Years | 50 (58.1%) | 0 (0.0%) |
| 20 to 24 Years | 165 (91.2%) | 27 (16.4%) |
| 25 to 29 Years | 43 (47.3%) | 0 (0.0%) |
| 30 to 34 Years | 59 (93.7%) | 0 (0.0%) |
| 35 to 44 Years | 103 (81.7%) | 0 (0.0%) |
| 45 to 54 Years | 187 (88.2%) | 0 (0.0%) |
| 55 to 59 Years | 54 (93.1%) | 13 (24.1%) |
| 60 to 64 Years | 51 (51.0%) | 0 (0.0%) |
| 65 to 74 Years | 19 (18.1%) | 0 (0.0%) |
| 75 Years and over | 0 (0.0%) | 0 (0.0%) |
| Total | 731 (66.2%) | 40 (5.5%) |
Employment Status by Educational Attainment in Centerfield
According to labor force statistics for Centerfield, 76.5% of individuals (497) out of the total population between 25 and 64 years of age (650) are in the labor force, with 2.6% or 13 of them being unemployed. The group with the highest labor force participation rate are those with the educational attainment of bachelor's degree or higher, with 95.1% or 78 individuals in the labor force. Within the labor force, individuals with high school diploma education have the highest percentage of unemployment, with 6.3% or 13 of them being unemployed.
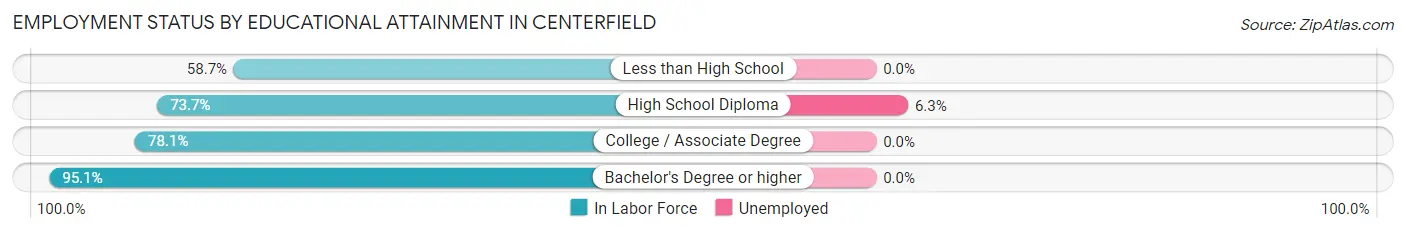
| Educational Attainment | In Labor Force | Unemployed |
| Less than High School | 37 (58.7%) | 0 (0.0%) |
| High School Diploma | 207 (73.7%) | 18 (6.3%) |
| College / Associate Degree | 175 (78.1%) | 0 (0.0%) |
| Bachelor's Degree or higher | 78 (95.1%) | 0 (0.0%) |
| Total | 497 (76.5%) | 17 (2.6%) |
Employment Occupations by Sex in Centerfield
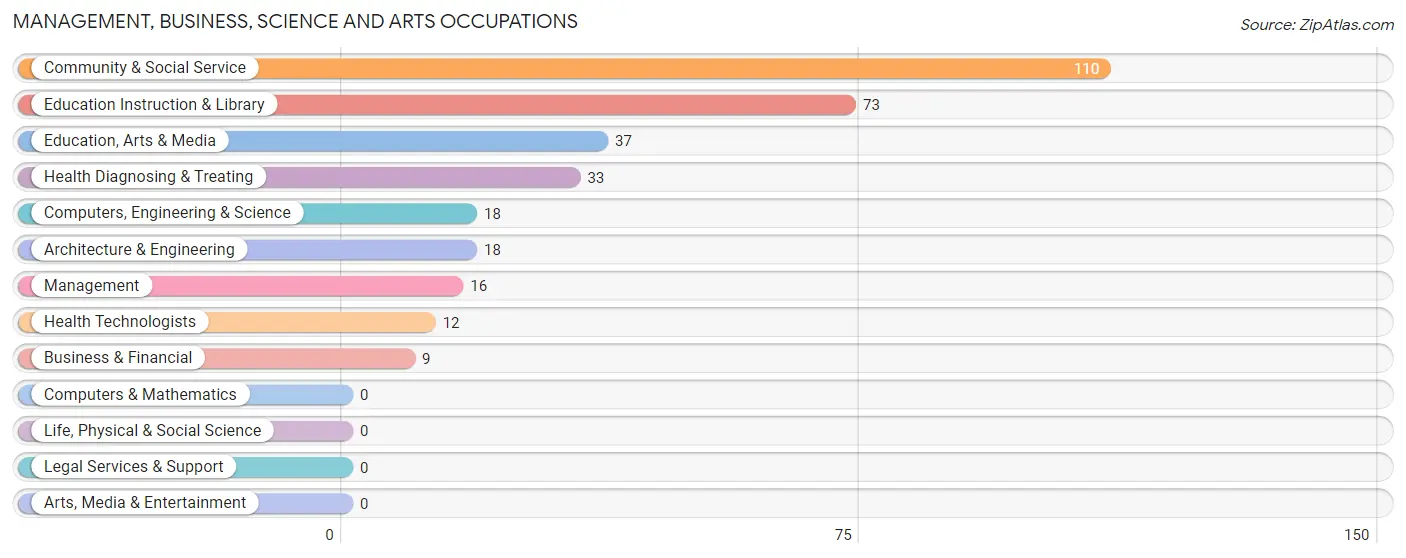
Management, Business, Science and Arts Occupations
The most common Management, Business, Science and Arts occupations in Centerfield are Community & Social Service (110 | 15.9%), Education Instruction & Library (73 | 10.6%), Education, Arts & Media (37 | 5.3%), Health Diagnosing & Treating (33 | 4.8%), and Computers, Engineering & Science (18 | 2.6%).
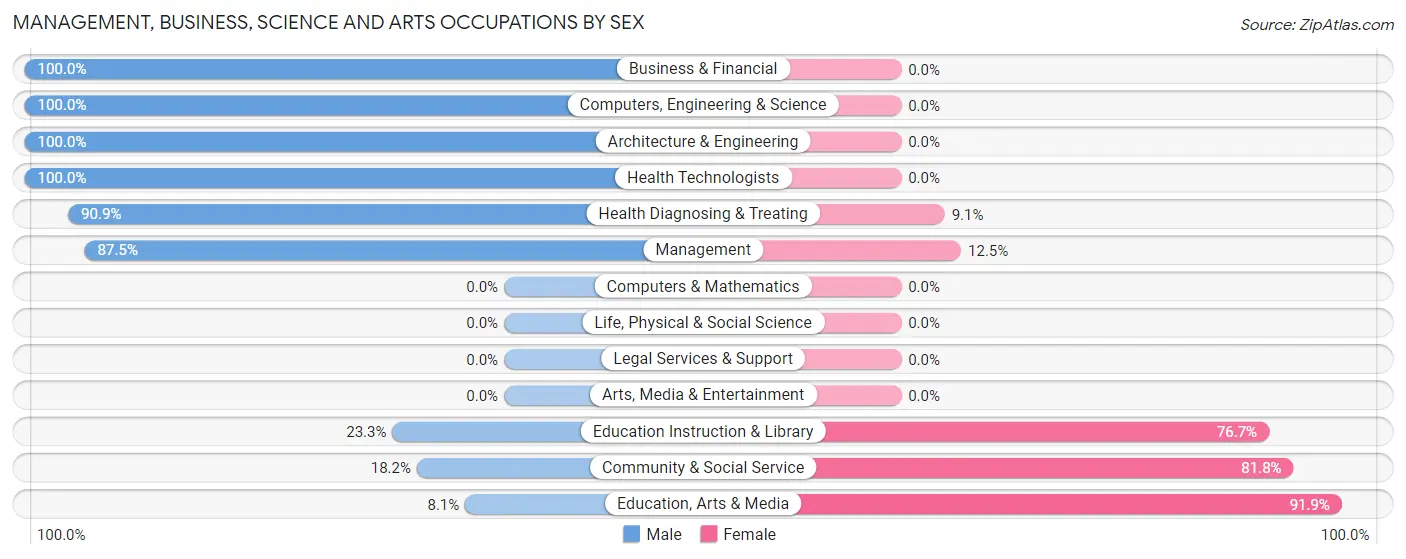
Management, Business, Science and Arts Occupations by Sex
Within the Management, Business, Science and Arts occupations in Centerfield, the most male-oriented occupations are Business & Financial (100.0%), Computers, Engineering & Science (100.0%), and Architecture & Engineering (100.0%), while the most female-oriented occupations are Education, Arts & Media (91.9%), Community & Social Service (81.8%), and Education Instruction & Library (76.7%).
| Occupation | Male | Female |
| Management | 14 (87.5%) | 2 (12.5%) |
| Business & Financial | 9 (100.0%) | 0 (0.0%) |
| Computers, Engineering & Science | 18 (100.0%) | 0 (0.0%) |
| Computers & Mathematics | 0 (0.0%) | 0 (0.0%) |
| Architecture & Engineering | 18 (100.0%) | 0 (0.0%) |
| Life, Physical & Social Science | 0 (0.0%) | 0 (0.0%) |
| Community & Social Service | 20 (18.2%) | 90 (81.8%) |
| Education, Arts & Media | 3 (8.1%) | 34 (91.9%) |
| Legal Services & Support | 0 (0.0%) | 0 (0.0%) |
| Education Instruction & Library | 17 (23.3%) | 56 (76.7%) |
| Arts, Media & Entertainment | 0 (0.0%) | 0 (0.0%) |
| Health Diagnosing & Treating | 30 (90.9%) | 3 (9.1%) |
| Health Technologists | 12 (100.0%) | 0 (0.0%) |
| Total (Category) | 91 (48.9%) | 95 (51.1%) |
| Total (Overall) | 381 (55.1%) | 310 (44.9%) |
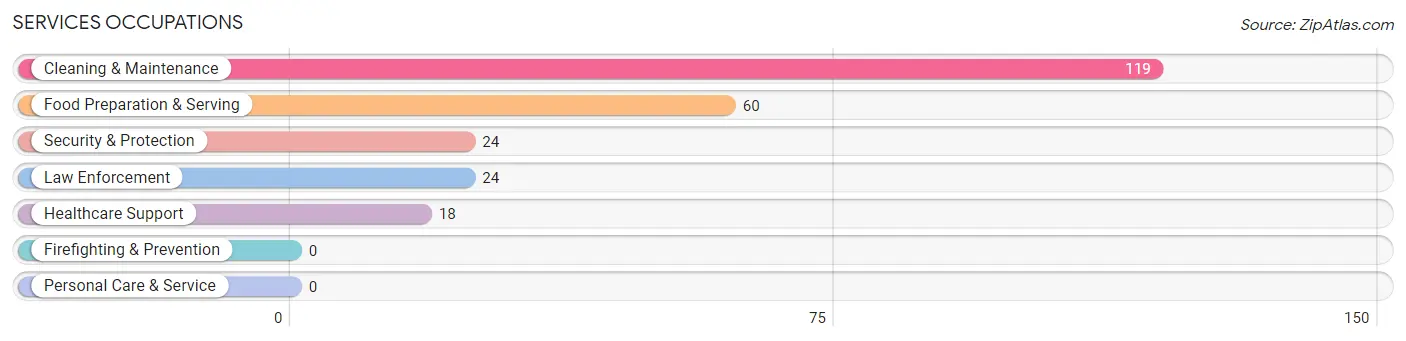
Services Occupations
The most common Services occupations in Centerfield are Cleaning & Maintenance (119 | 17.2%), Food Preparation & Serving (60 | 8.7%), Security & Protection (24 | 3.5%), Law Enforcement (24 | 3.5%), and Healthcare Support (18 | 2.6%).
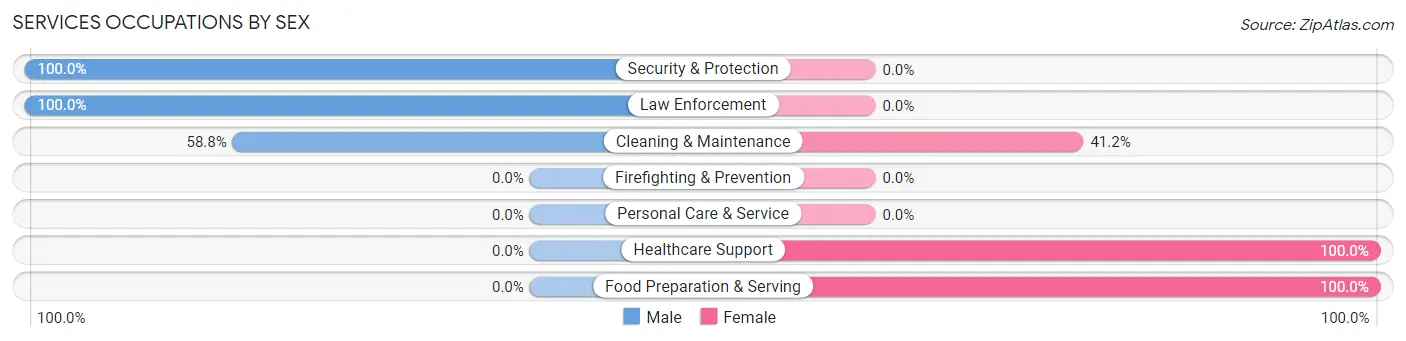
Services Occupations by Sex
Within the Services occupations in Centerfield, the most male-oriented occupations are Security & Protection (100.0%), Law Enforcement (100.0%), and Cleaning & Maintenance (58.8%), while the most female-oriented occupations are Healthcare Support (100.0%), Food Preparation & Serving (100.0%), and Cleaning & Maintenance (41.2%).
| Occupation | Male | Female |
| Healthcare Support | 0 (0.0%) | 18 (100.0%) |
| Security & Protection | 24 (100.0%) | 0 (0.0%) |
| Firefighting & Prevention | 0 (0.0%) | 0 (0.0%) |
| Law Enforcement | 24 (100.0%) | 0 (0.0%) |
| Food Preparation & Serving | 0 (0.0%) | 60 (100.0%) |
| Cleaning & Maintenance | 70 (58.8%) | 49 (41.2%) |
| Personal Care & Service | 0 (0.0%) | 0 (0.0%) |
| Total (Category) | 94 (42.5%) | 127 (57.5%) |
| Total (Overall) | 381 (55.1%) | 310 (44.9%) |
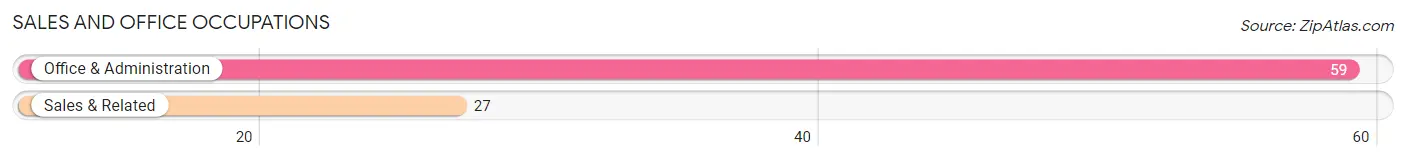
Sales and Office Occupations
The most common Sales and Office occupations in Centerfield are Office & Administration (59 | 8.5%), and Sales & Related (27 | 3.9%).
Sales and Office Occupations by Sex
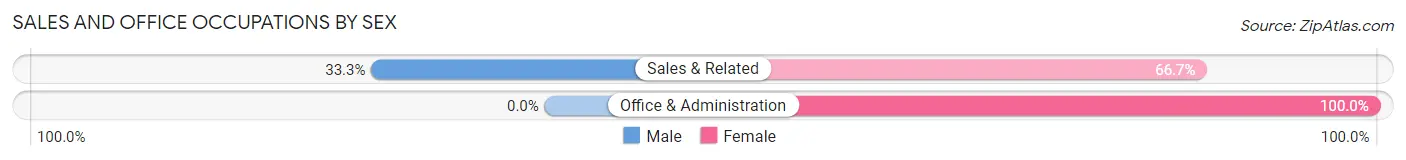
| Occupation | Male | Female |
| Sales & Related | 9 (33.3%) | 18 (66.7%) |
| Office & Administration | 0 (0.0%) | 59 (100.0%) |
| Total (Category) | 9 (10.5%) | 77 (89.5%) |
| Total (Overall) | 381 (55.1%) | 310 (44.9%) |
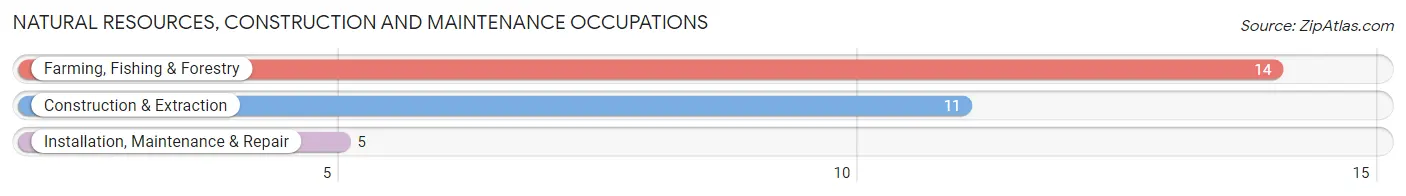
Natural Resources, Construction and Maintenance Occupations
The most common Natural Resources, Construction and Maintenance occupations in Centerfield are Farming, Fishing & Forestry (14 | 2.0%), Construction & Extraction (11 | 1.6%), and Installation, Maintenance & Repair (5 | 0.7%).
Natural Resources, Construction and Maintenance Occupations by Sex
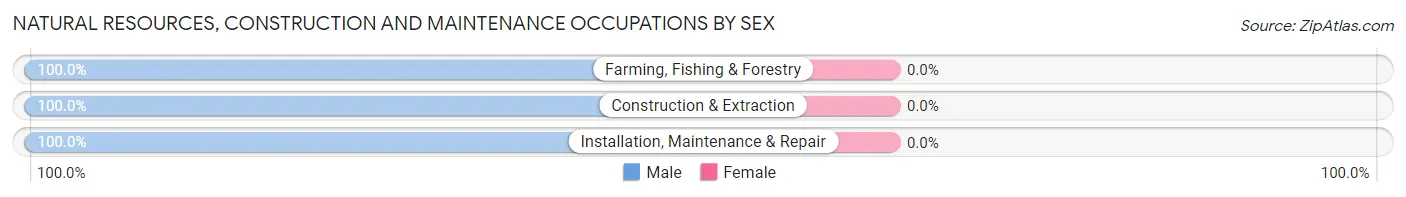
| Occupation | Male | Female |
| Farming, Fishing & Forestry | 14 (100.0%) | 0 (0.0%) |
| Construction & Extraction | 11 (100.0%) | 0 (0.0%) |
| Installation, Maintenance & Repair | 5 (100.0%) | 0 (0.0%) |
| Total (Category) | 30 (100.0%) | 0 (0.0%) |
| Total (Overall) | 381 (55.1%) | 310 (44.9%) |
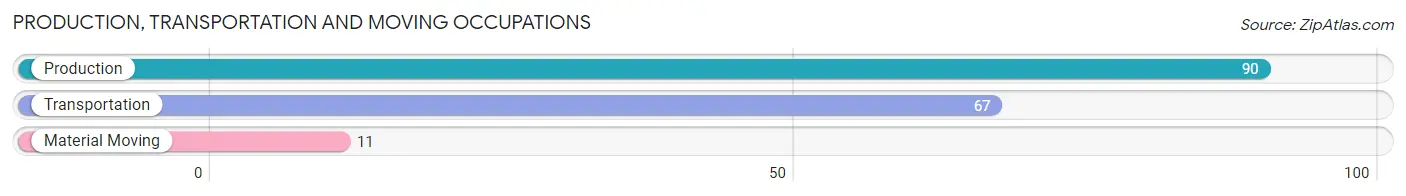
Production, Transportation and Moving Occupations
The most common Production, Transportation and Moving occupations in Centerfield are Production (90 | 13.0%), Transportation (67 | 9.7%), and Material Moving (11 | 1.6%).
Production, Transportation and Moving Occupations by Sex
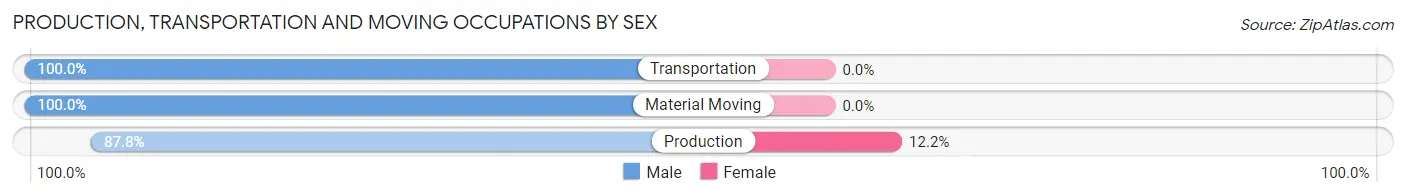
| Occupation | Male | Female |
| Production | 79 (87.8%) | 11 (12.2%) |
| Transportation | 67 (100.0%) | 0 (0.0%) |
| Material Moving | 11 (100.0%) | 0 (0.0%) |
| Total (Category) | 157 (93.4%) | 11 (6.6%) |
| Total (Overall) | 381 (55.1%) | 310 (44.9%) |
Employment Industries by Sex in Centerfield
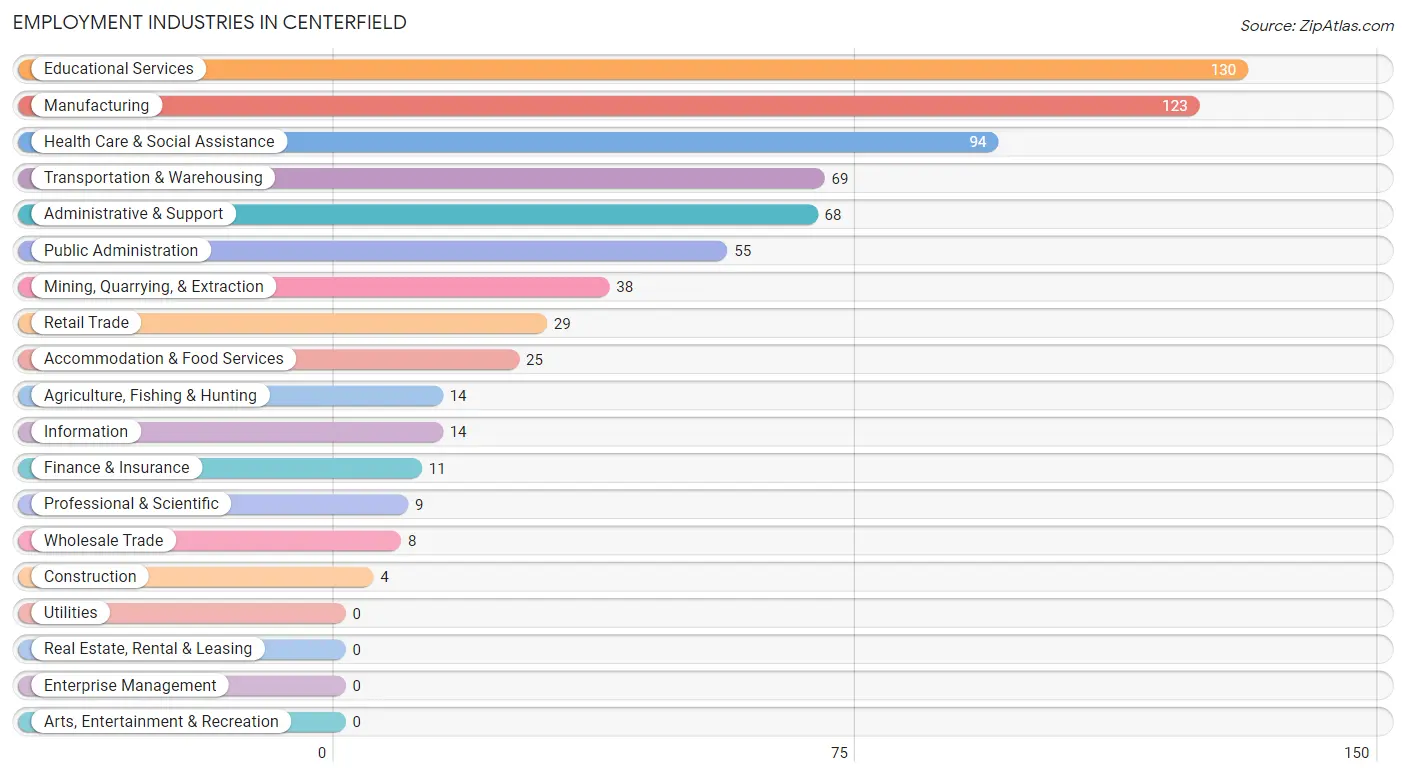
Employment Industries in Centerfield
The major employment industries in Centerfield include Educational Services (130 | 18.8%), Manufacturing (123 | 17.8%), Health Care & Social Assistance (94 | 13.6%), Transportation & Warehousing (69 | 10.0%), and Administrative & Support (68 | 9.8%).
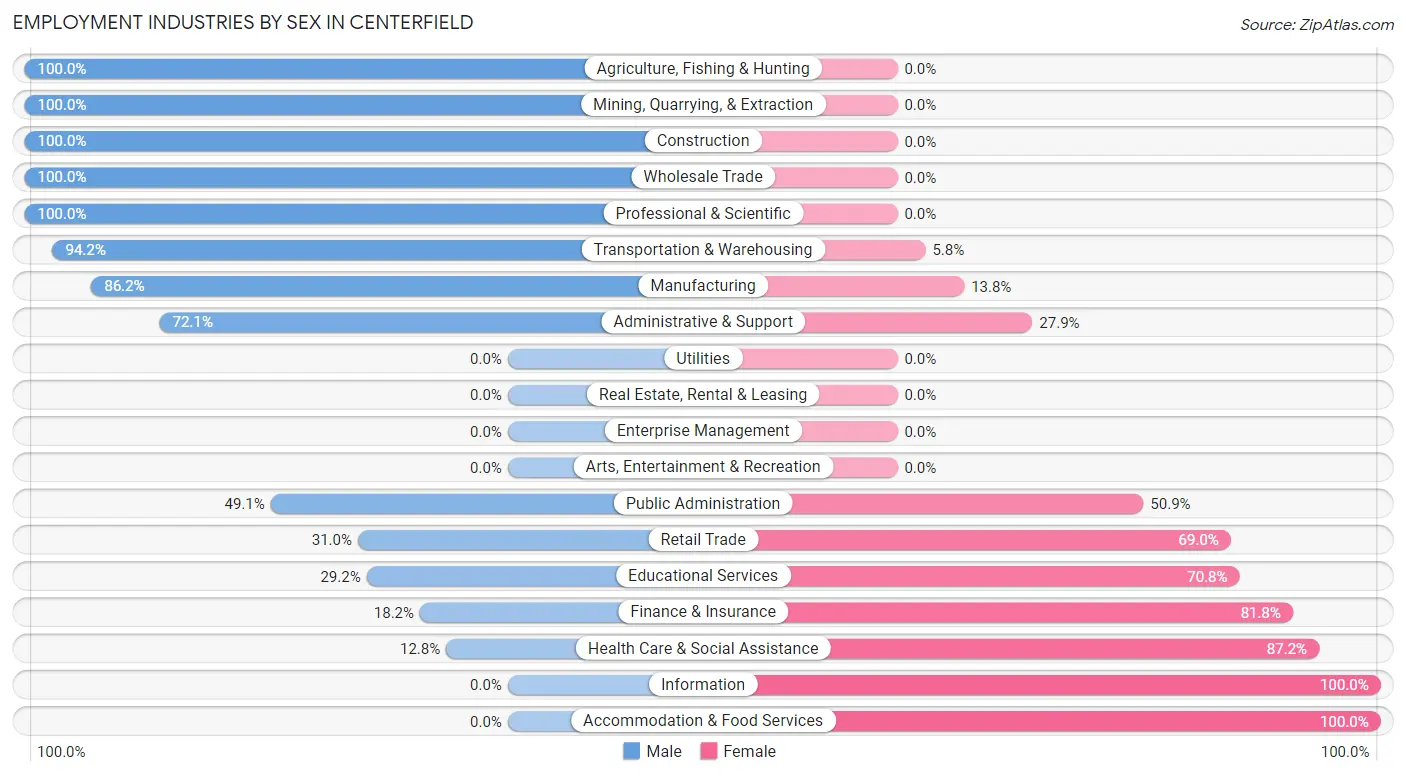
Employment Industries by Sex in Centerfield
The Centerfield industries that see more men than women are Agriculture, Fishing & Hunting (100.0%), Mining, Quarrying, & Extraction (100.0%), and Construction (100.0%), whereas the industries that tend to have a higher number of women are Information (100.0%), Accommodation & Food Services (100.0%), and Health Care & Social Assistance (87.2%).
| Industry | Male | Female |
| Agriculture, Fishing & Hunting | 14 (100.0%) | 0 (0.0%) |
| Mining, Quarrying, & Extraction | 38 (100.0%) | 0 (0.0%) |
| Construction | 4 (100.0%) | 0 (0.0%) |
| Manufacturing | 106 (86.2%) | 17 (13.8%) |
| Wholesale Trade | 8 (100.0%) | 0 (0.0%) |
| Retail Trade | 9 (31.0%) | 20 (69.0%) |
| Transportation & Warehousing | 65 (94.2%) | 4 (5.8%) |
| Utilities | 0 (0.0%) | 0 (0.0%) |
| Information | 0 (0.0%) | 14 (100.0%) |
| Finance & Insurance | 2 (18.2%) | 9 (81.8%) |
| Real Estate, Rental & Leasing | 0 (0.0%) | 0 (0.0%) |
| Professional & Scientific | 9 (100.0%) | 0 (0.0%) |
| Enterprise Management | 0 (0.0%) | 0 (0.0%) |
| Administrative & Support | 49 (72.1%) | 19 (27.9%) |
| Educational Services | 38 (29.2%) | 92 (70.8%) |
| Health Care & Social Assistance | 12 (12.8%) | 82 (87.2%) |
| Arts, Entertainment & Recreation | 0 (0.0%) | 0 (0.0%) |
| Accommodation & Food Services | 0 (0.0%) | 25 (100.0%) |
| Public Administration | 27 (49.1%) | 28 (50.9%) |
| Total | 381 (55.1%) | 310 (44.9%) |
Education in Centerfield
School Enrollment in Centerfield
The most common levels of schooling among the 274 students in Centerfield are middle school (103 | 37.6%), high school (92 | 33.6%), and kindergarten (31 | 11.3%).
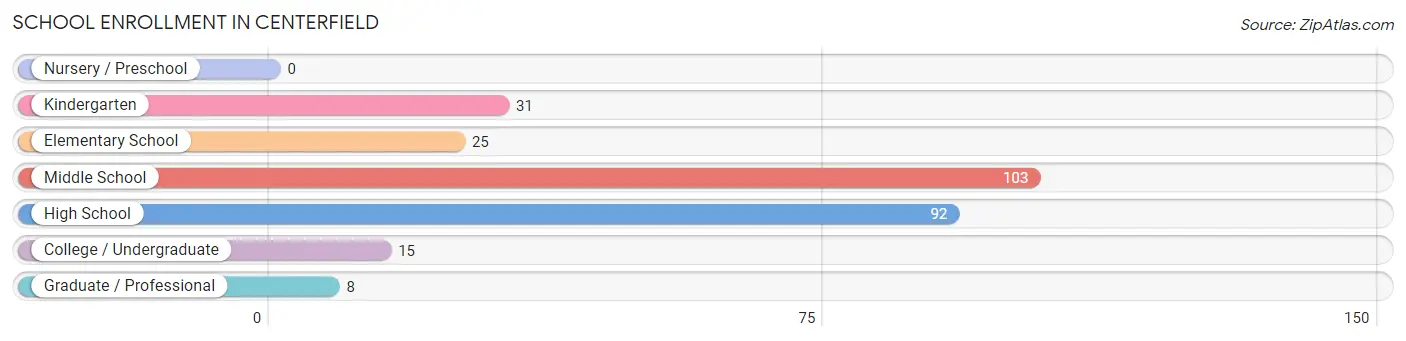
| School Level | # Students | % Students |
| Nursery / Preschool | 0 | 0.0% |
| Kindergarten | 31 | 11.3% |
| Elementary School | 25 | 9.1% |
| Middle School | 103 | 37.6% |
| High School | 92 | 33.6% |
| College / Undergraduate | 15 | 5.5% |
| Graduate / Professional | 8 | 2.9% |
| Total | 274 | 100.0% |
School Enrollment by Age by Funding Source in Centerfield
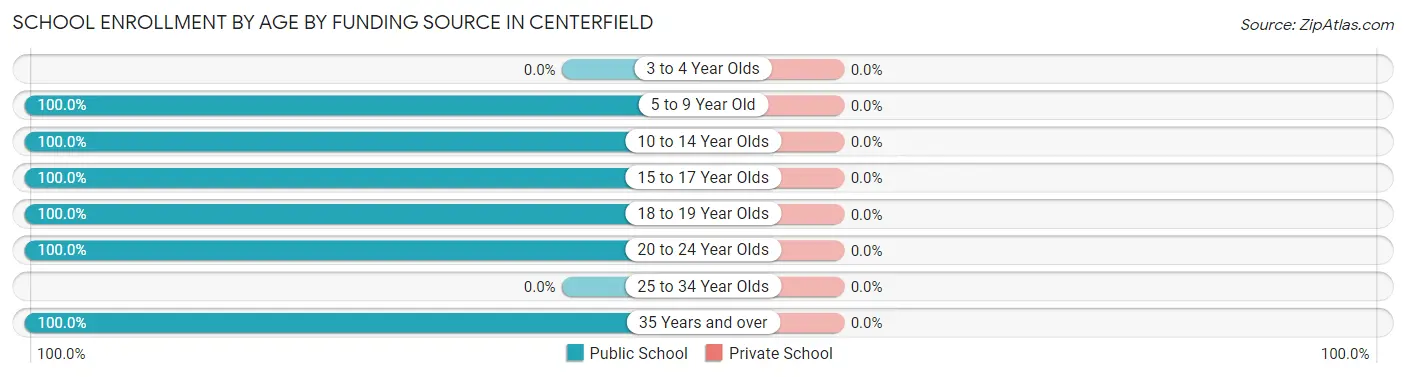
| Age Bracket | Public School | Private School |
| 3 to 4 Year Olds | 0 (0.0%) | 0 (0.0%) |
| 5 to 9 Year Old | 45 (100.0%) | 0 (0.0%) |
| 10 to 14 Year Olds | 117 (100.0%) | 0 (0.0%) |
| 15 to 17 Year Olds | 83 (100.0%) | 0 (0.0%) |
| 18 to 19 Year Olds | 19 (100.0%) | 0 (0.0%) |
| 20 to 24 Year Olds | 2 (100.0%) | 0 (0.0%) |
| 25 to 34 Year Olds | 0 (0.0%) | 0 (0.0%) |
| 35 Years and over | 8 (100.0%) | 0 (0.0%) |
| Total | 274 (100.0%) | 0 (0.0%) |
Educational Attainment by Field of Study in Centerfield
Literature & languages (38 | 26.2%), psychology (31 | 21.4%), education (30 | 20.7%), bio, nature & agricultural (17 | 11.7%), and physical & health sciences (9 | 6.2%) are the most common fields of study among 145 individuals in Centerfield who have obtained a bachelor's degree or higher.
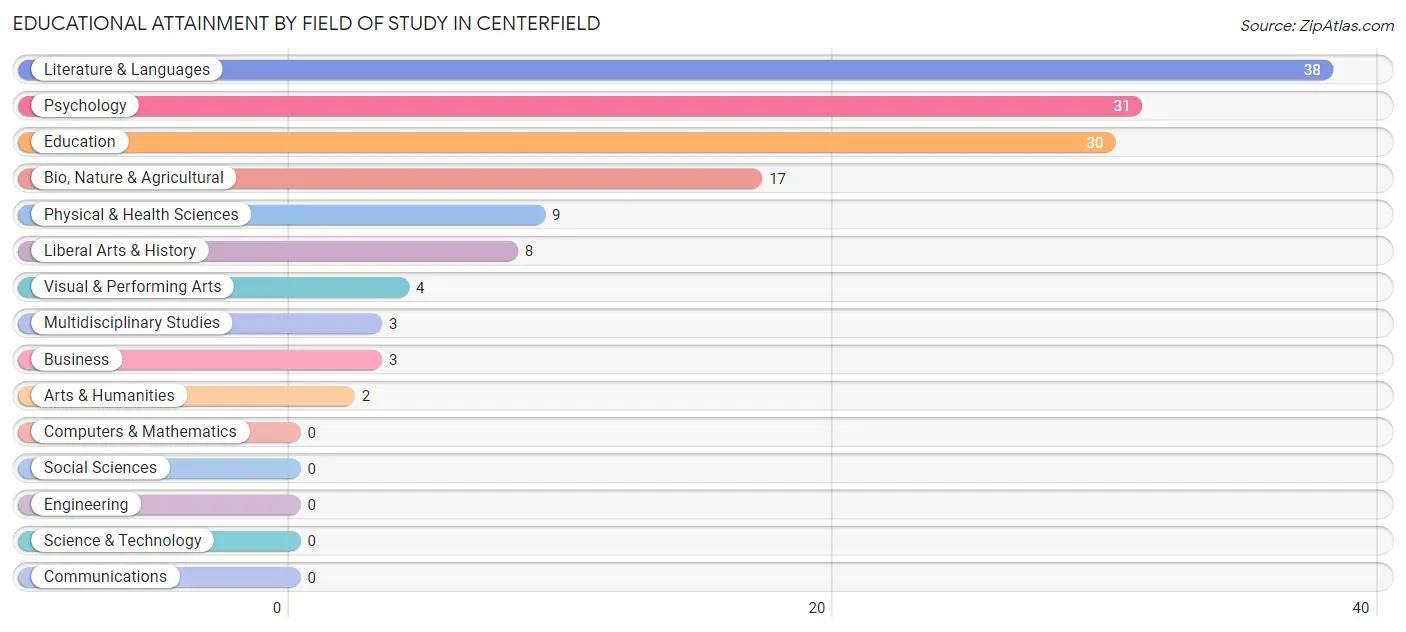
| Field of Study | # Graduates | % Graduates |
| Computers & Mathematics | 0 | 0.0% |
| Bio, Nature & Agricultural | 17 | 11.7% |
| Physical & Health Sciences | 9 | 6.2% |
| Psychology | 31 | 21.4% |
| Social Sciences | 0 | 0.0% |
| Engineering | 0 | 0.0% |
| Multidisciplinary Studies | 3 | 2.1% |
| Science & Technology | 0 | 0.0% |
| Business | 3 | 2.1% |
| Education | 30 | 20.7% |
| Literature & Languages | 38 | 26.2% |
| Liberal Arts & History | 8 | 5.5% |
| Visual & Performing Arts | 4 | 2.8% |
| Communications | 0 | 0.0% |
| Arts & Humanities | 2 | 1.4% |
| Total | 145 | 100.0% |
Transportation & Commute in Centerfield
Vehicle Availability by Sex in Centerfield
The most prevalent vehicle ownership categories in Centerfield are males with 3 vehicles (123, accounting for 34.7%) and females with 3 vehicles (90, making up 40.6%).
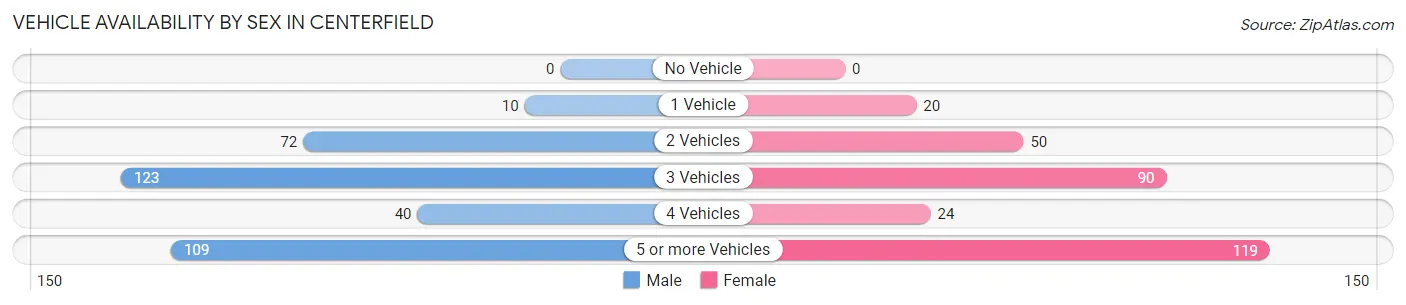
| Vehicles Available | Male | Female |
| No Vehicle | 0 (0.0%) | 0 (0.0%) |
| 1 Vehicle | 10 (2.8%) | 20 (6.6%) |
| 2 Vehicles | 72 (20.3%) | 50 (16.5%) |
| 3 Vehicles | 123 (34.7%) | 90 (29.7%) |
| 4 Vehicles | 40 (11.3%) | 24 (7.9%) |
| 5 or more Vehicles | 109 (30.8%) | 119 (39.3%) |
| Total | 354 (100.0%) | 303 (100.0%) |
Commute Time in Centerfield
The most frequently occuring commute durations in Centerfield are 5 to 9 minutes (243 commuters, 37.6%), 30 to 34 minutes (94 commuters, 14.5%), and less than 5 minutes (91 commuters, 14.1%).
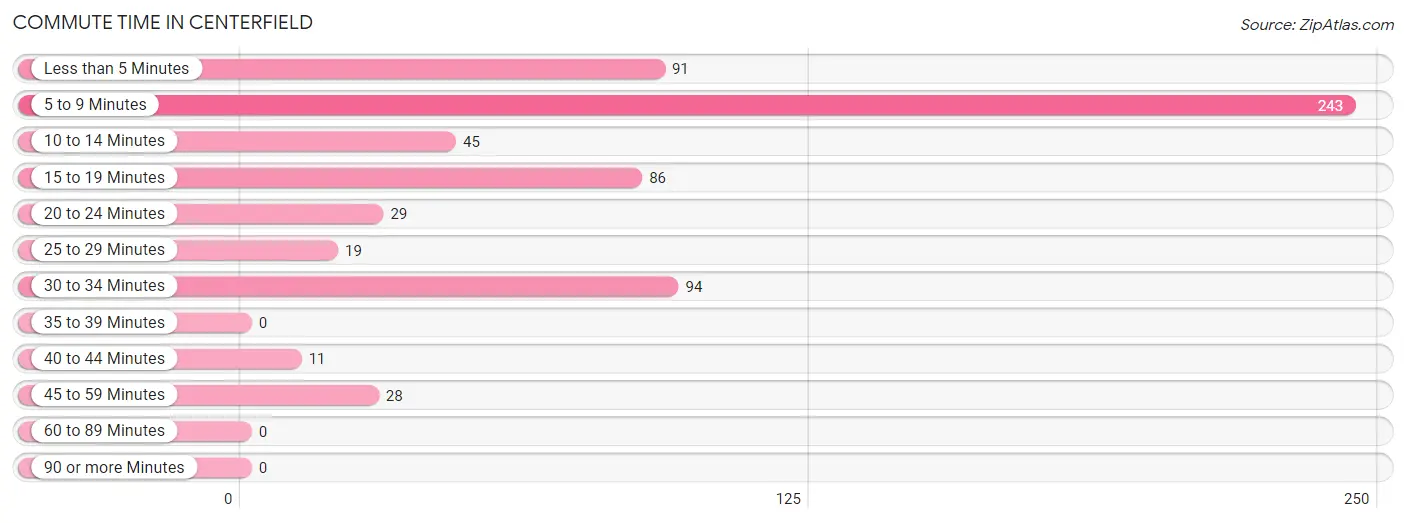
| Commute Time | # Commuters | % Commuters |
| Less than 5 Minutes | 91 | 14.1% |
| 5 to 9 Minutes | 243 | 37.6% |
| 10 to 14 Minutes | 45 | 7.0% |
| 15 to 19 Minutes | 86 | 13.3% |
| 20 to 24 Minutes | 29 | 4.5% |
| 25 to 29 Minutes | 19 | 2.9% |
| 30 to 34 Minutes | 94 | 14.5% |
| 35 to 39 Minutes | 0 | 0.0% |
| 40 to 44 Minutes | 11 | 1.7% |
| 45 to 59 Minutes | 28 | 4.3% |
| 60 to 89 Minutes | 0 | 0.0% |
| 90 or more Minutes | 0 | 0.0% |
Commute Time by Sex in Centerfield
The most common commute times in Centerfield are 15 to 19 minutes (85 commuters, 24.1%) for males and 5 to 9 minutes (176 commuters, 59.9%) for females.
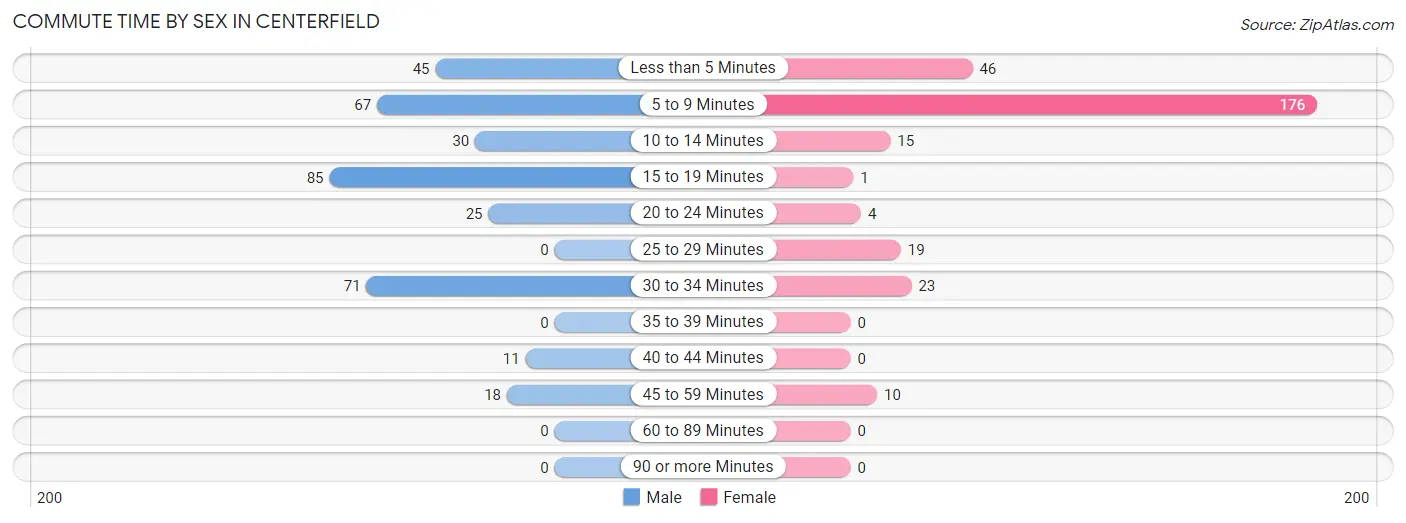
| Commute Time | Male | Female |
| Less than 5 Minutes | 45 (12.8%) | 46 (15.7%) |
| 5 to 9 Minutes | 67 (19.0%) | 176 (59.9%) |
| 10 to 14 Minutes | 30 (8.5%) | 15 (5.1%) |
| 15 to 19 Minutes | 85 (24.1%) | 1 (0.3%) |
| 20 to 24 Minutes | 25 (7.1%) | 4 (1.4%) |
| 25 to 29 Minutes | 0 (0.0%) | 19 (6.5%) |
| 30 to 34 Minutes | 71 (20.2%) | 23 (7.8%) |
| 35 to 39 Minutes | 0 (0.0%) | 0 (0.0%) |
| 40 to 44 Minutes | 11 (3.1%) | 0 (0.0%) |
| 45 to 59 Minutes | 18 (5.1%) | 10 (3.4%) |
| 60 to 89 Minutes | 0 (0.0%) | 0 (0.0%) |
| 90 or more Minutes | 0 (0.0%) | 0 (0.0%) |
Time of Departure to Work by Sex in Centerfield
The most frequent times of departure to work in Centerfield are 5:00 AM to 5:29 AM (99, 28.1%) for males and 7:30 AM to 7:59 AM (80, 27.2%) for females.
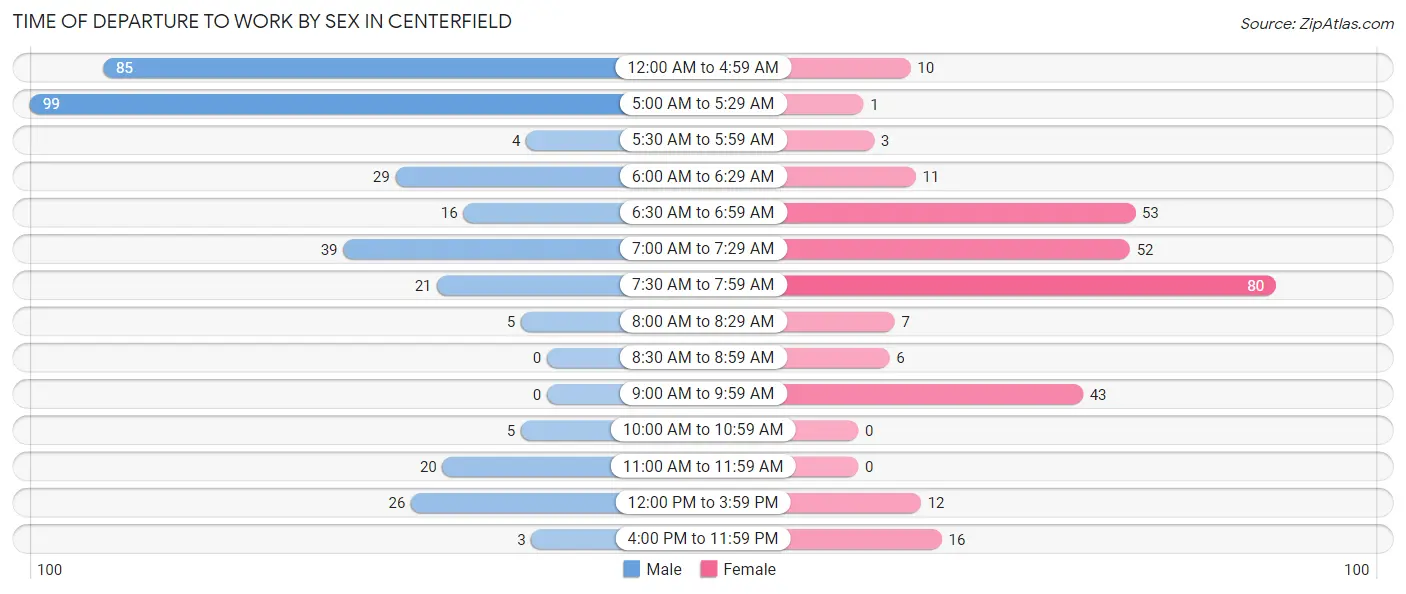
| Time of Departure | Male | Female |
| 12:00 AM to 4:59 AM | 85 (24.1%) | 10 (3.4%) |
| 5:00 AM to 5:29 AM | 99 (28.1%) | 1 (0.3%) |
| 5:30 AM to 5:59 AM | 4 (1.1%) | 3 (1.0%) |
| 6:00 AM to 6:29 AM | 29 (8.2%) | 11 (3.7%) |
| 6:30 AM to 6:59 AM | 16 (4.5%) | 53 (18.0%) |
| 7:00 AM to 7:29 AM | 39 (11.1%) | 52 (17.7%) |
| 7:30 AM to 7:59 AM | 21 (6.0%) | 80 (27.2%) |
| 8:00 AM to 8:29 AM | 5 (1.4%) | 7 (2.4%) |
| 8:30 AM to 8:59 AM | 0 (0.0%) | 6 (2.0%) |
| 9:00 AM to 9:59 AM | 0 (0.0%) | 43 (14.6%) |
| 10:00 AM to 10:59 AM | 5 (1.4%) | 0 (0.0%) |
| 11:00 AM to 11:59 AM | 20 (5.7%) | 0 (0.0%) |
| 12:00 PM to 3:59 PM | 26 (7.4%) | 12 (4.1%) |
| 4:00 PM to 11:59 PM | 3 (0.9%) | 16 (5.4%) |
| Total | 352 (100.0%) | 294 (100.0%) |
Housing Occupancy in Centerfield
Occupancy by Ownership in Centerfield
Of the total 420 dwellings in Centerfield, owner-occupied units account for 369 (87.9%), while renter-occupied units make up 51 (12.1%).
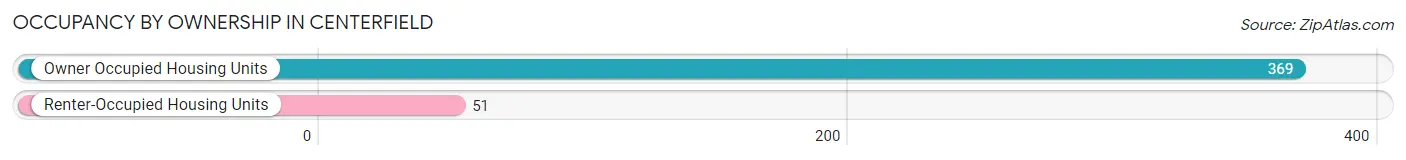
| Occupancy | # Housing Units | % Housing Units |
| Owner Occupied Housing Units | 369 | 87.9% |
| Renter-Occupied Housing Units | 51 | 12.1% |
| Total Occupied Housing Units | 420 | 100.0% |
Occupancy by Household Size in Centerfield
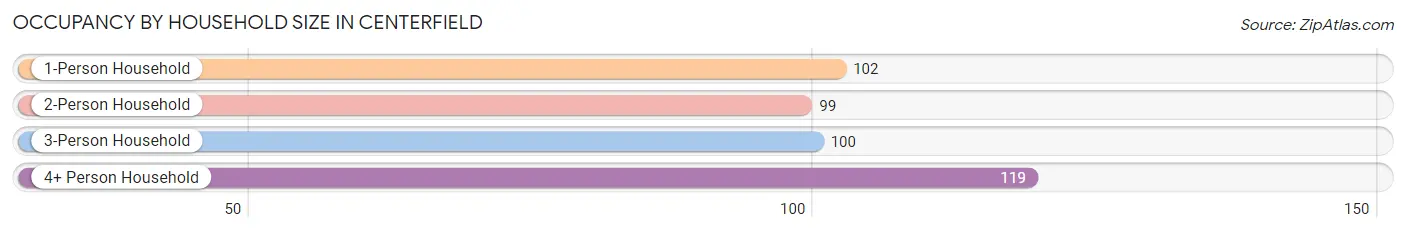
| Household Size | # Housing Units | % Housing Units |
| 1-Person Household | 102 | 24.3% |
| 2-Person Household | 99 | 23.6% |
| 3-Person Household | 100 | 23.8% |
| 4+ Person Household | 119 | 28.3% |
| Total Housing Units | 420 | 100.0% |
Occupancy by Ownership by Household Size in Centerfield
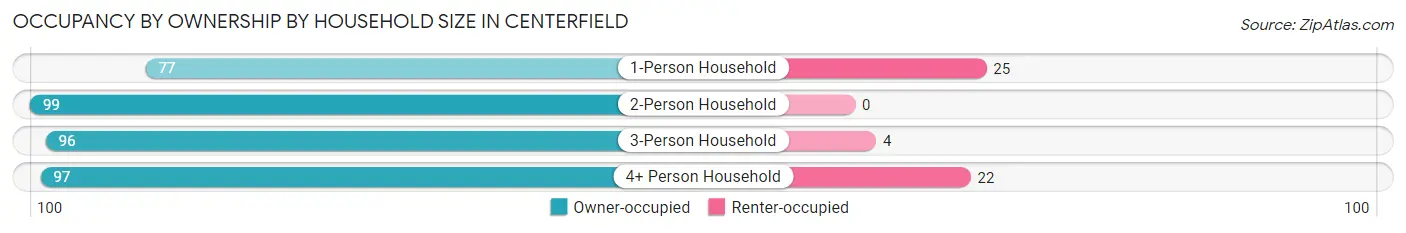
| Household Size | Owner-occupied | Renter-occupied |
| 1-Person Household | 77 (75.5%) | 25 (24.5%) |
| 2-Person Household | 99 (100.0%) | 0 (0.0%) |
| 3-Person Household | 96 (96.0%) | 4 (4.0%) |
| 4+ Person Household | 97 (81.5%) | 22 (18.5%) |
| Total Housing Units | 369 (87.9%) | 51 (12.1%) |
Occupancy by Educational Attainment in Centerfield
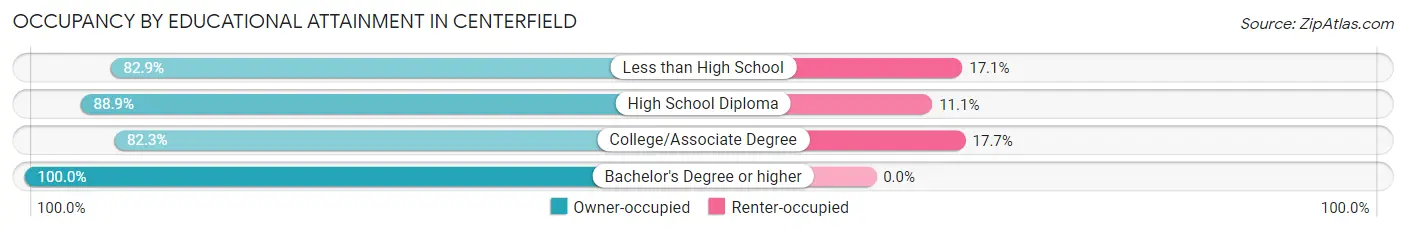
| Household Size | Owner-occupied | Renter-occupied |
| Less than High School | 34 (82.9%) | 7 (17.1%) |
| High School Diploma | 152 (88.9%) | 19 (11.1%) |
| College/Associate Degree | 116 (82.3%) | 25 (17.7%) |
| Bachelor's Degree or higher | 67 (100.0%) | 0 (0.0%) |
Occupancy by Age of Householder in Centerfield
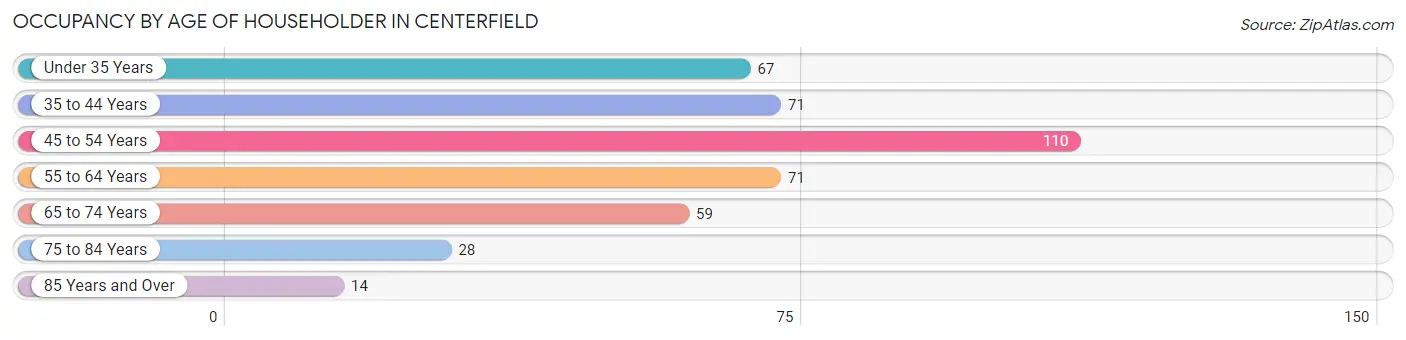
| Age Bracket | # Households | % Households |
| Under 35 Years | 67 | 16.0% |
| 35 to 44 Years | 71 | 16.9% |
| 45 to 54 Years | 110 | 26.2% |
| 55 to 64 Years | 71 | 16.9% |
| 65 to 74 Years | 59 | 14.1% |
| 75 to 84 Years | 28 | 6.7% |
| 85 Years and Over | 14 | 3.3% |
| Total | 420 | 100.0% |
Housing Finances in Centerfield
Median Income by Occupancy in Centerfield
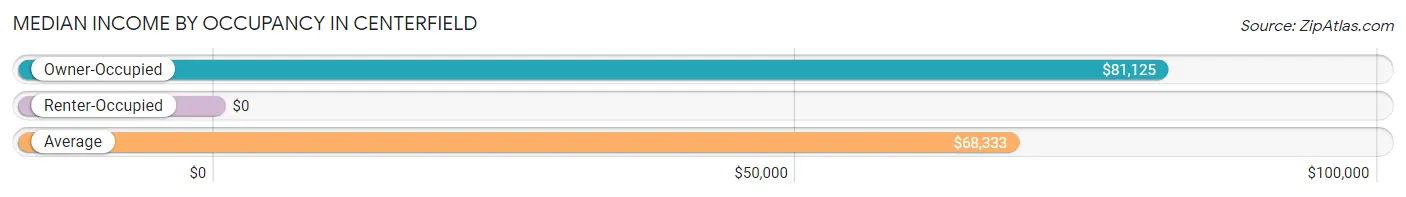
| Occupancy Type | # Households | Median Income |
| Owner-Occupied | 369 (87.9%) | $81,125 |
| Renter-Occupied | 51 (12.1%) | $0 |
| Average | 420 (100.0%) | $68,333 |
Occupancy by Householder Income Bracket in Centerfield
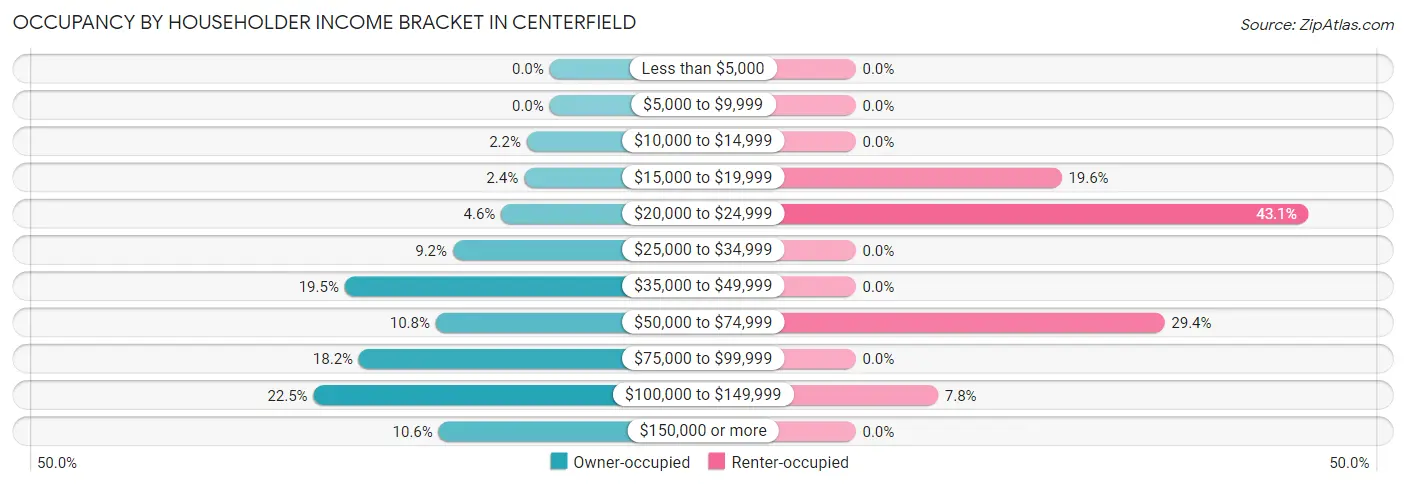
| Income Bracket | Owner-occupied | Renter-occupied |
| Less than $5,000 | 0 (0.0%) | 0 (0.0%) |
| $5,000 to $9,999 | 0 (0.0%) | 0 (0.0%) |
| $10,000 to $14,999 | 8 (2.2%) | 0 (0.0%) |
| $15,000 to $19,999 | 9 (2.4%) | 10 (19.6%) |
| $20,000 to $24,999 | 17 (4.6%) | 22 (43.1%) |
| $25,000 to $34,999 | 34 (9.2%) | 0 (0.0%) |
| $35,000 to $49,999 | 72 (19.5%) | 0 (0.0%) |
| $50,000 to $74,999 | 40 (10.8%) | 15 (29.4%) |
| $75,000 to $99,999 | 67 (18.2%) | 0 (0.0%) |
| $100,000 to $149,999 | 83 (22.5%) | 4 (7.8%) |
| $150,000 or more | 39 (10.6%) | 0 (0.0%) |
| Total | 369 (100.0%) | 51 (100.0%) |
Monthly Housing Cost Tiers in Centerfield
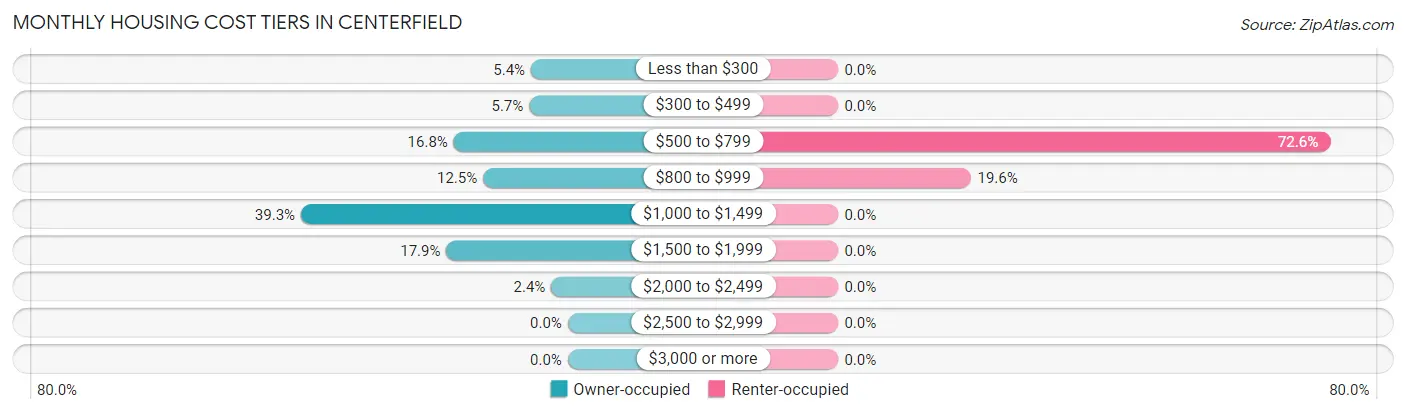
| Monthly Cost | Owner-occupied | Renter-occupied |
| Less than $300 | 20 (5.4%) | 0 (0.0%) |
| $300 to $499 | 21 (5.7%) | 0 (0.0%) |
| $500 to $799 | 62 (16.8%) | 37 (72.6%) |
| $800 to $999 | 46 (12.5%) | 10 (19.6%) |
| $1,000 to $1,499 | 145 (39.3%) | 0 (0.0%) |
| $1,500 to $1,999 | 66 (17.9%) | 0 (0.0%) |
| $2,000 to $2,499 | 9 (2.4%) | 0 (0.0%) |
| $2,500 to $2,999 | 0 (0.0%) | 0 (0.0%) |
| $3,000 or more | 0 (0.0%) | 0 (0.0%) |
| Total | 369 (100.0%) | 51 (100.0%) |
Physical Housing Characteristics in Centerfield
Housing Structures in Centerfield
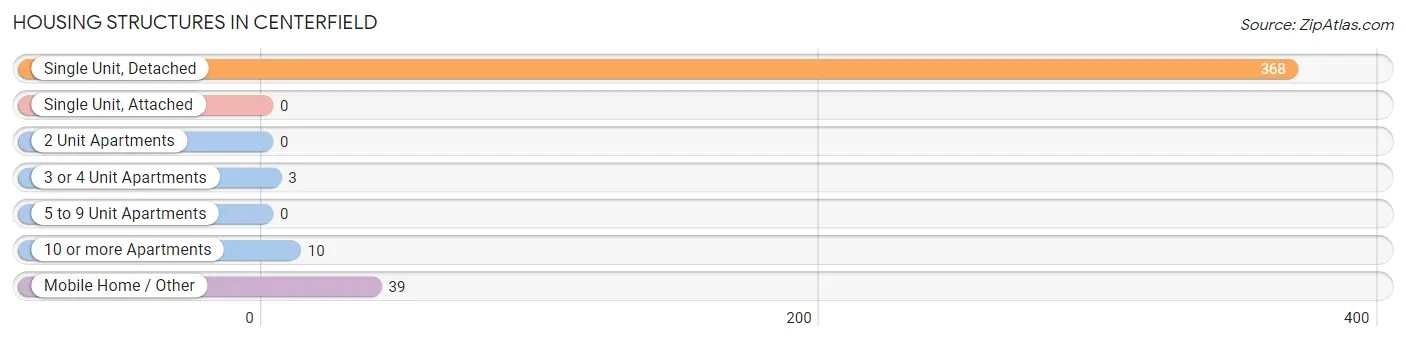
| Structure Type | # Housing Units | % Housing Units |
| Single Unit, Detached | 368 | 87.6% |
| Single Unit, Attached | 0 | 0.0% |
| 2 Unit Apartments | 0 | 0.0% |
| 3 or 4 Unit Apartments | 3 | 0.7% |
| 5 to 9 Unit Apartments | 0 | 0.0% |
| 10 or more Apartments | 10 | 2.4% |
| Mobile Home / Other | 39 | 9.3% |
| Total | 420 | 100.0% |
Housing Structures by Occupancy in Centerfield
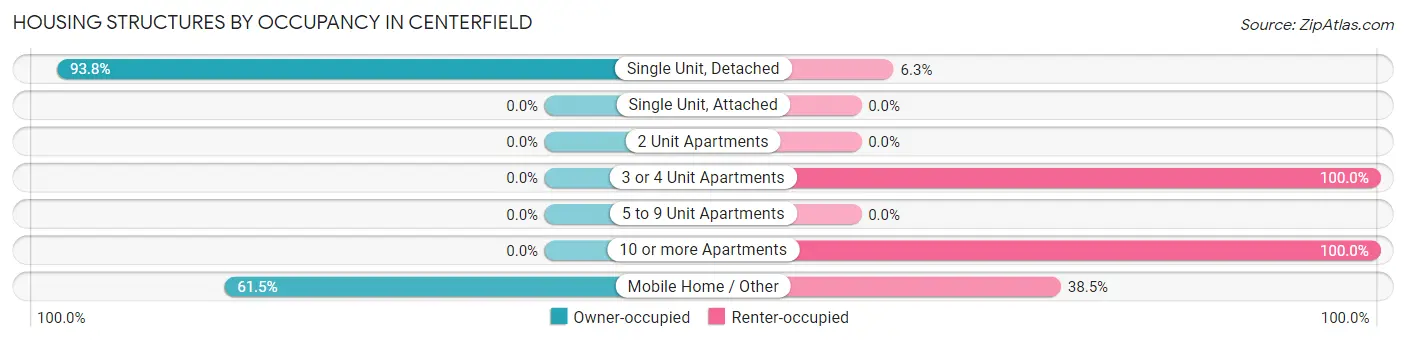
| Structure Type | Owner-occupied | Renter-occupied |
| Single Unit, Detached | 345 (93.8%) | 23 (6.2%) |
| Single Unit, Attached | 0 (0.0%) | 0 (0.0%) |
| 2 Unit Apartments | 0 (0.0%) | 0 (0.0%) |
| 3 or 4 Unit Apartments | 0 (0.0%) | 3 (100.0%) |
| 5 to 9 Unit Apartments | 0 (0.0%) | 0 (0.0%) |
| 10 or more Apartments | 0 (0.0%) | 10 (100.0%) |
| Mobile Home / Other | 24 (61.5%) | 15 (38.5%) |
| Total | 369 (87.9%) | 51 (12.1%) |
Housing Structures by Number of Rooms in Centerfield
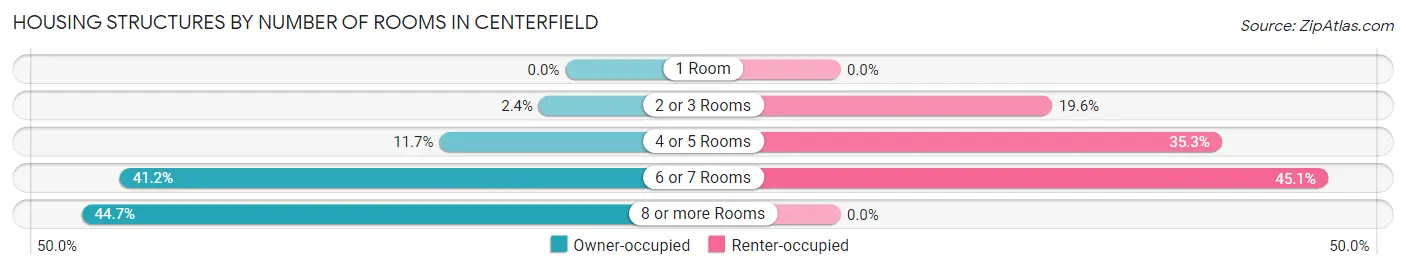
| Number of Rooms | Owner-occupied | Renter-occupied |
| 1 Room | 0 (0.0%) | 0 (0.0%) |
| 2 or 3 Rooms | 9 (2.4%) | 10 (19.6%) |
| 4 or 5 Rooms | 43 (11.7%) | 18 (35.3%) |
| 6 or 7 Rooms | 152 (41.2%) | 23 (45.1%) |
| 8 or more Rooms | 165 (44.7%) | 0 (0.0%) |
| Total | 369 (100.0%) | 51 (100.0%) |
Housing Structure by Heating Type in Centerfield
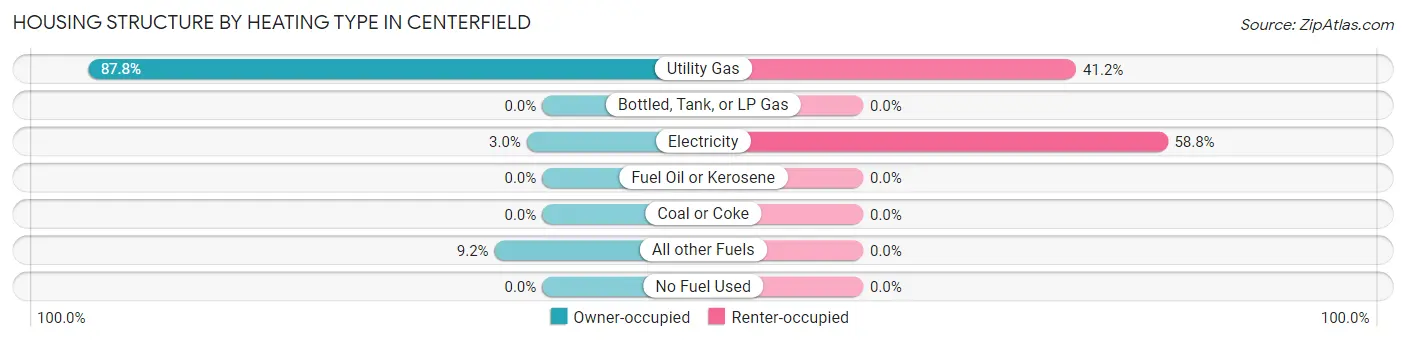
| Heating Type | Owner-occupied | Renter-occupied |
| Utility Gas | 324 (87.8%) | 21 (41.2%) |
| Bottled, Tank, or LP Gas | 0 (0.0%) | 0 (0.0%) |
| Electricity | 11 (3.0%) | 30 (58.8%) |
| Fuel Oil or Kerosene | 0 (0.0%) | 0 (0.0%) |
| Coal or Coke | 0 (0.0%) | 0 (0.0%) |
| All other Fuels | 34 (9.2%) | 0 (0.0%) |
| No Fuel Used | 0 (0.0%) | 0 (0.0%) |
| Total | 369 (100.0%) | 51 (100.0%) |
Household Vehicle Usage in Centerfield
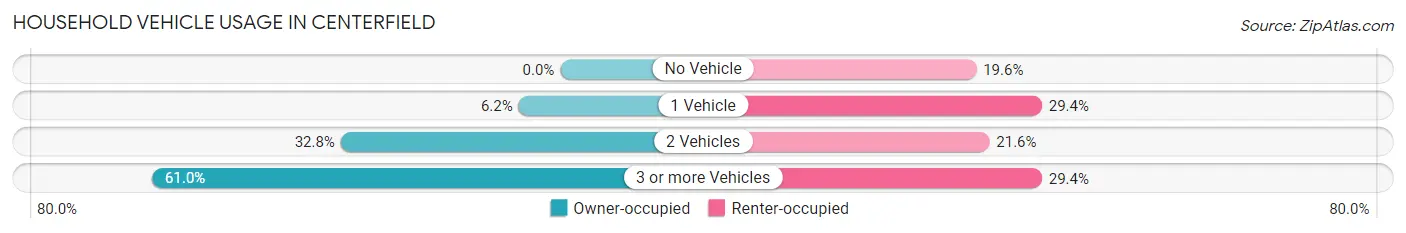
| Vehicles per Household | Owner-occupied | Renter-occupied |
| No Vehicle | 0 (0.0%) | 10 (19.6%) |
| 1 Vehicle | 23 (6.2%) | 15 (29.4%) |
| 2 Vehicles | 121 (32.8%) | 11 (21.6%) |
| 3 or more Vehicles | 225 (61.0%) | 15 (29.4%) |
| Total | 369 (100.0%) | 51 (100.0%) |
Real Estate & Mortgages in Centerfield
Real Estate and Mortgage Overview in Centerfield
| Characteristic | Without Mortgage | With Mortgage |
| Housing Units | 96 | 273 |
| Median Property Value | $330,000 | $234,600 |
| Median Household Income | $41,500 | $15 |
| Monthly Housing Costs | $600 | $0 |
| Real Estate Taxes | $1,964 | $11 |
Property Value by Mortgage Status in Centerfield
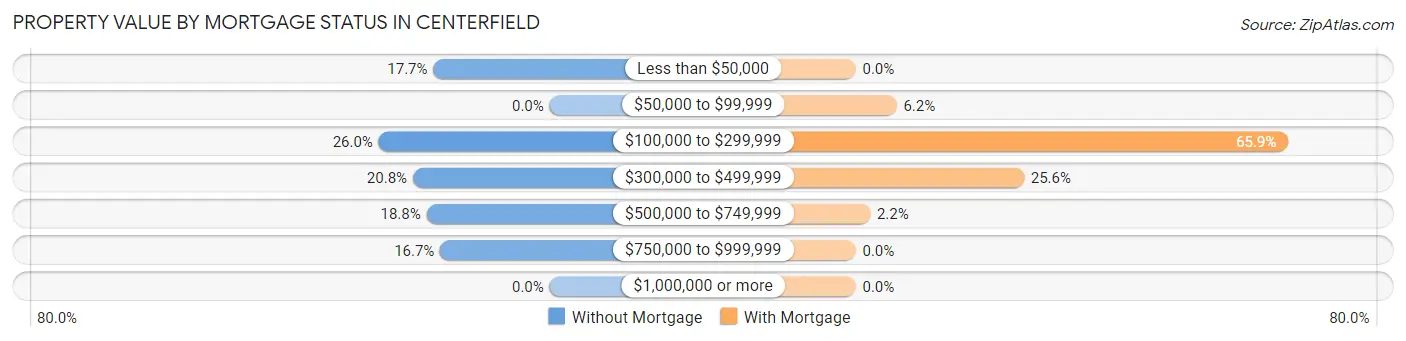
| Property Value | Without Mortgage | With Mortgage |
| Less than $50,000 | 17 (17.7%) | 0 (0.0%) |
| $50,000 to $99,999 | 0 (0.0%) | 17 (6.2%) |
| $100,000 to $299,999 | 25 (26.0%) | 180 (65.9%) |
| $300,000 to $499,999 | 20 (20.8%) | 70 (25.6%) |
| $500,000 to $749,999 | 18 (18.8%) | 6 (2.2%) |
| $750,000 to $999,999 | 16 (16.7%) | 0 (0.0%) |
| $1,000,000 or more | 0 (0.0%) | 0 (0.0%) |
| Total | 96 (100.0%) | 273 (100.0%) |
Household Income by Mortgage Status in Centerfield
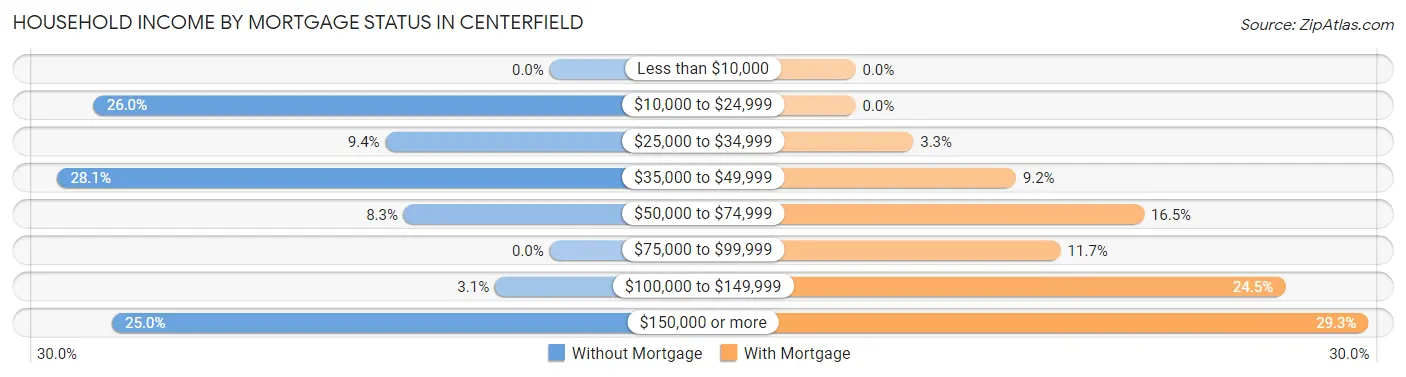
| Household Income | Without Mortgage | With Mortgage |
| Less than $10,000 | 0 (0.0%) | 0 (0.0%) |
| $10,000 to $24,999 | 25 (26.0%) | 0 (0.0%) |
| $25,000 to $34,999 | 9 (9.4%) | 9 (3.3%) |
| $35,000 to $49,999 | 27 (28.1%) | 25 (9.2%) |
| $50,000 to $74,999 | 8 (8.3%) | 45 (16.5%) |
| $75,000 to $99,999 | 0 (0.0%) | 32 (11.7%) |
| $100,000 to $149,999 | 3 (3.1%) | 67 (24.5%) |
| $150,000 or more | 24 (25.0%) | 80 (29.3%) |
| Total | 96 (100.0%) | 273 (100.0%) |
Property Value to Household Income Ratio in Centerfield
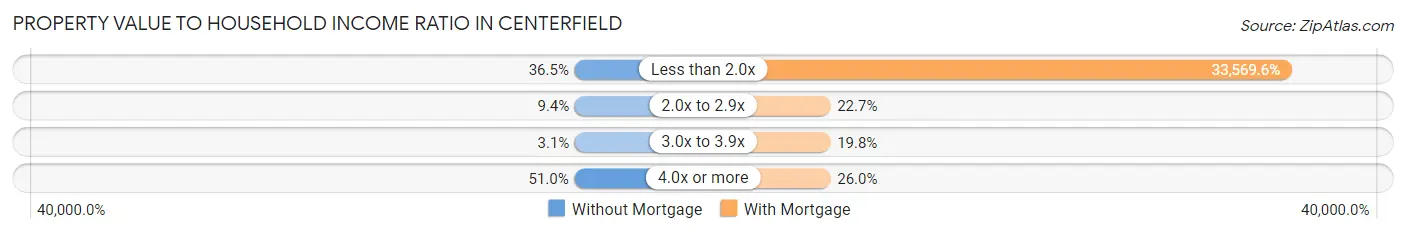
| Value-to-Income Ratio | Without Mortgage | With Mortgage |
| Less than 2.0x | 35 (36.5%) | 91,645 (33,569.6%) |
| 2.0x to 2.9x | 9 (9.4%) | 62 (22.7%) |
| 3.0x to 3.9x | 3 (3.1%) | 54 (19.8%) |
| 4.0x or more | 49 (51.0%) | 71 (26.0%) |
| Total | 96 (100.0%) | 273 (100.0%) |
Real Estate Taxes by Mortgage Status in Centerfield
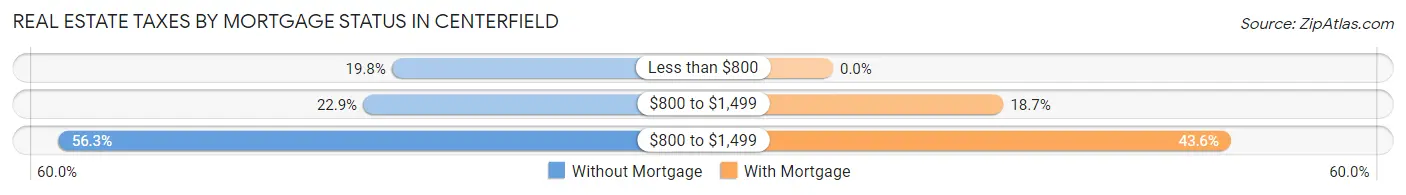
| Property Taxes | Without Mortgage | With Mortgage |
| Less than $800 | 19 (19.8%) | 0 (0.0%) |
| $800 to $1,499 | 22 (22.9%) | 51 (18.7%) |
| $800 to $1,499 | 54 (56.2%) | 119 (43.6%) |
| Total | 96 (100.0%) | 273 (100.0%) |
Health & Disability in Centerfield
Health Insurance Coverage by Age in Centerfield
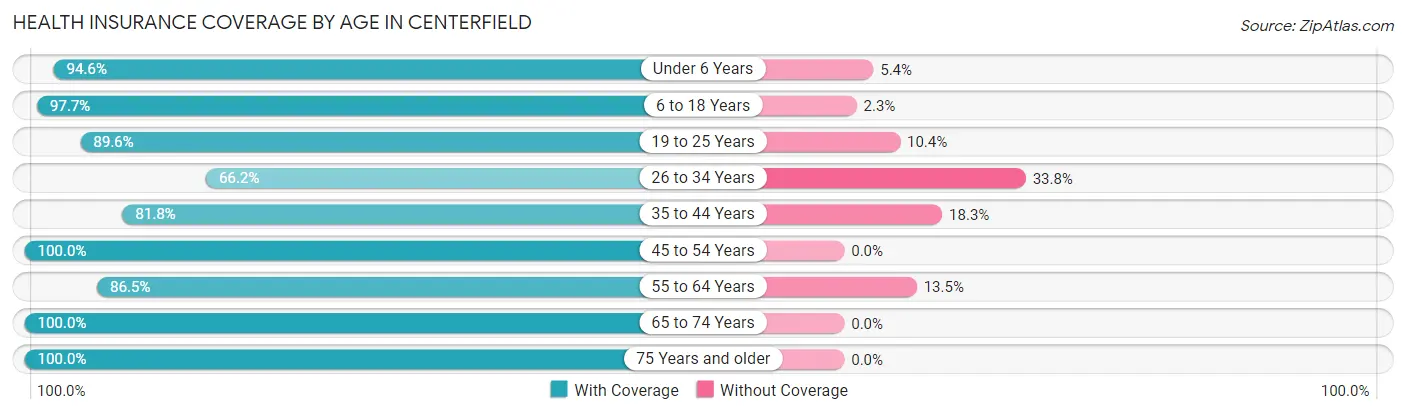
| Age Bracket | With Coverage | Without Coverage |
| Under 6 Years | 70 (94.6%) | 4 (5.4%) |
| 6 to 18 Years | 255 (97.7%) | 6 (2.3%) |
| 19 to 25 Years | 181 (89.6%) | 21 (10.4%) |
| 26 to 34 Years | 88 (66.2%) | 45 (33.8%) |
| 35 to 44 Years | 103 (81.8%) | 23 (18.2%) |
| 45 to 54 Years | 212 (100.0%) | 0 (0.0%) |
| 55 to 64 Years | 128 (86.5%) | 20 (13.5%) |
| 65 to 74 Years | 105 (100.0%) | 0 (0.0%) |
| 75 Years and older | 42 (100.0%) | 0 (0.0%) |
| Total | 1,184 (90.9%) | 119 (9.1%) |
Health Insurance Coverage by Citizenship Status in Centerfield
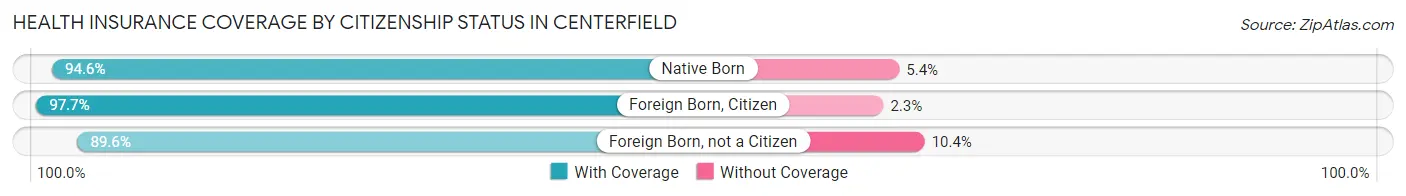
| Citizenship Status | With Coverage | Without Coverage |
| Native Born | 70 (94.6%) | 4 (5.4%) |
| Foreign Born, Citizen | 255 (97.7%) | 6 (2.3%) |
| Foreign Born, not a Citizen | 181 (89.6%) | 21 (10.4%) |
Health Insurance Coverage by Household Income in Centerfield
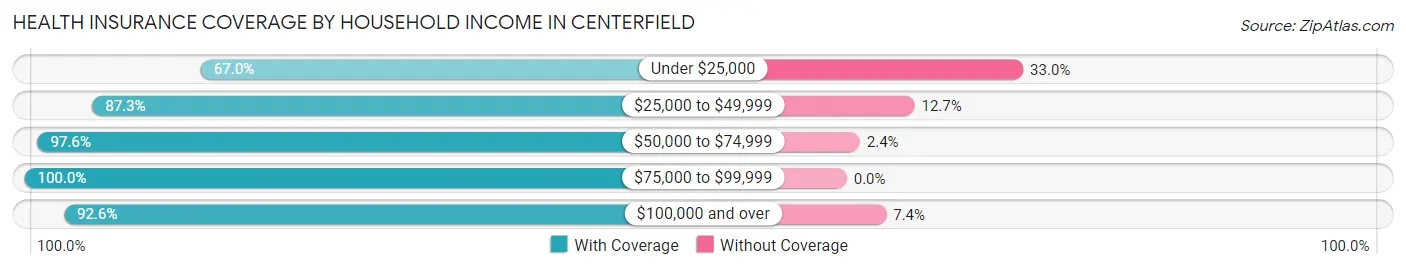
| Household Income | With Coverage | Without Coverage |
| Under $25,000 | 75 (67.0%) | 37 (33.0%) |
| $25,000 to $49,999 | 282 (87.3%) | 41 (12.7%) |
| $50,000 to $74,999 | 160 (97.6%) | 4 (2.4%) |
| $75,000 to $99,999 | 204 (100.0%) | 0 (0.0%) |
| $100,000 and over | 463 (92.6%) | 37 (7.4%) |
Public vs Private Health Insurance Coverage by Age in Centerfield
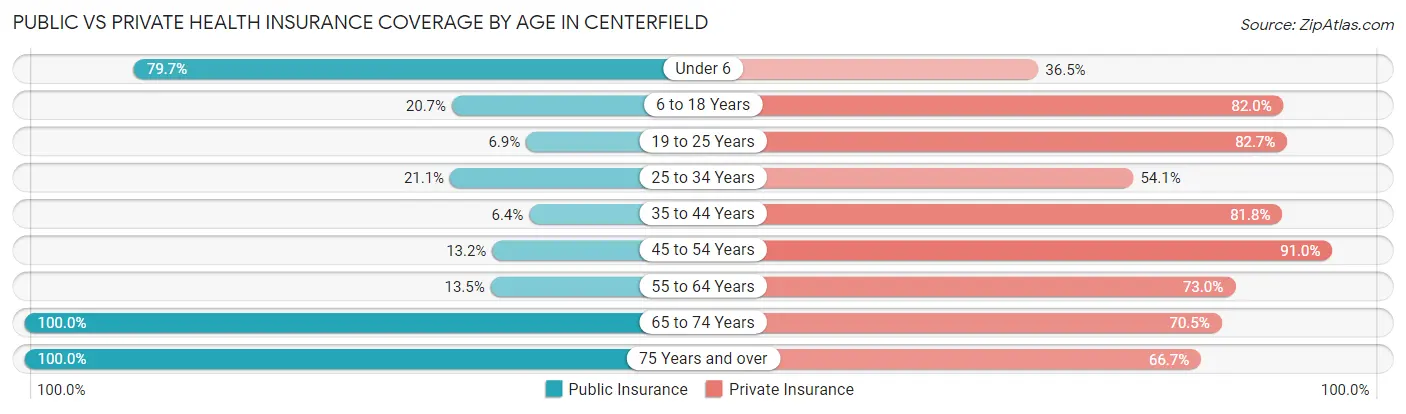
| Age Bracket | Public Insurance | Private Insurance |
| Under 6 | 59 (79.7%) | 27 (36.5%) |
| 6 to 18 Years | 54 (20.7%) | 214 (82.0%) |
| 19 to 25 Years | 14 (6.9%) | 167 (82.7%) |
| 25 to 34 Years | 28 (21.0%) | 72 (54.1%) |
| 35 to 44 Years | 8 (6.4%) | 103 (81.8%) |
| 45 to 54 Years | 28 (13.2%) | 193 (91.0%) |
| 55 to 64 Years | 20 (13.5%) | 108 (73.0%) |
| 65 to 74 Years | 105 (100.0%) | 74 (70.5%) |
| 75 Years and over | 42 (100.0%) | 28 (66.7%) |
| Total | 358 (27.5%) | 986 (75.7%) |
Disability Status by Sex by Age in Centerfield
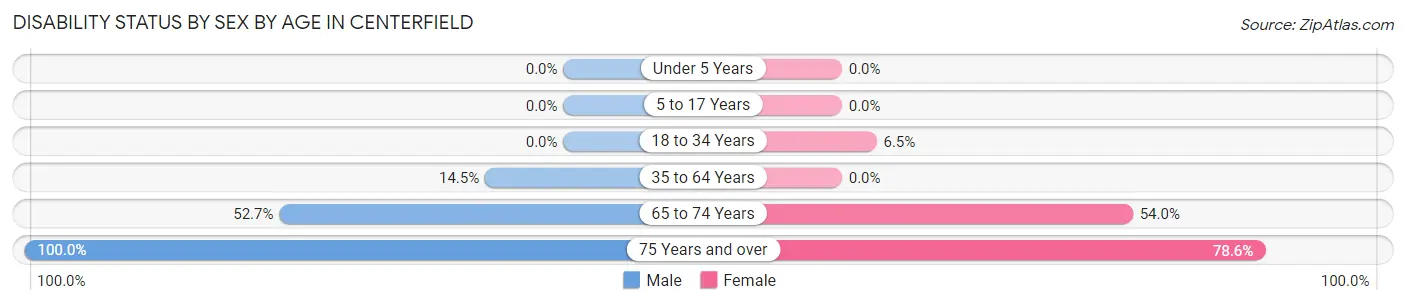
| Age Bracket | Male | Female |
| Under 5 Years | 0 (0.0%) | 0 (0.0%) |
| 5 to 17 Years | 0 (0.0%) | 0 (0.0%) |
| 18 to 34 Years | 0 (0.0%) | 12 (6.5%) |
| 35 to 64 Years | 34 (14.5%) | 0 (0.0%) |
| 65 to 74 Years | 29 (52.7%) | 27 (54.0%) |
| 75 Years and over | 28 (100.0%) | 11 (78.6%) |
Disability Class by Sex by Age in Centerfield
Disability Class: Hearing Difficulty
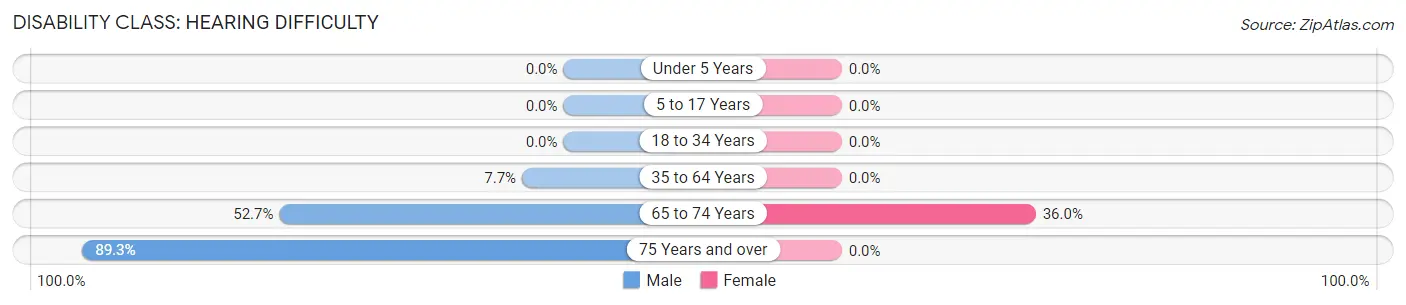
| Age Bracket | Male | Female |
| Under 5 Years | 0 (0.0%) | 0 (0.0%) |
| 5 to 17 Years | 0 (0.0%) | 0 (0.0%) |
| 18 to 34 Years | 0 (0.0%) | 0 (0.0%) |
| 35 to 64 Years | 18 (7.7%) | 0 (0.0%) |
| 65 to 74 Years | 29 (52.7%) | 18 (36.0%) |
| 75 Years and over | 25 (89.3%) | 0 (0.0%) |
Disability Class: Vision Difficulty
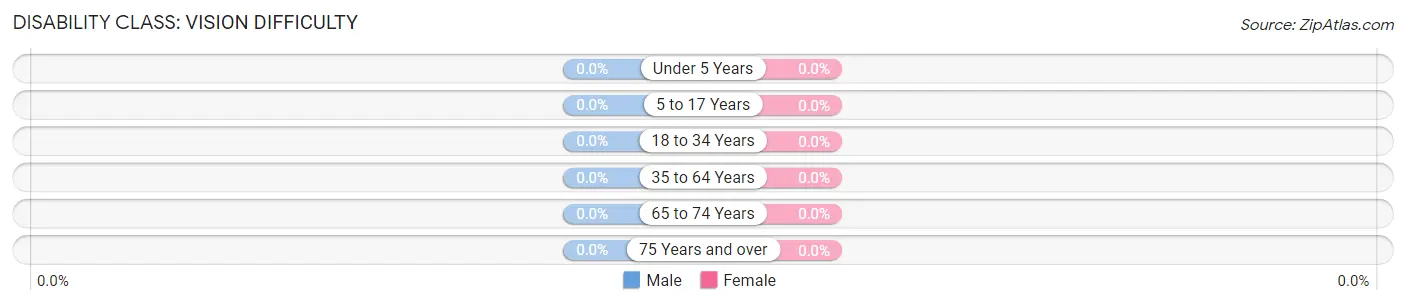
| Age Bracket | Male | Female |
| Under 5 Years | 0 (0.0%) | 0 (0.0%) |
| 5 to 17 Years | 0 (0.0%) | 0 (0.0%) |
| 18 to 34 Years | 0 (0.0%) | 0 (0.0%) |
| 35 to 64 Years | 0 (0.0%) | 0 (0.0%) |
| 65 to 74 Years | 0 (0.0%) | 0 (0.0%) |
| 75 Years and over | 0 (0.0%) | 0 (0.0%) |
Disability Class: Cognitive Difficulty
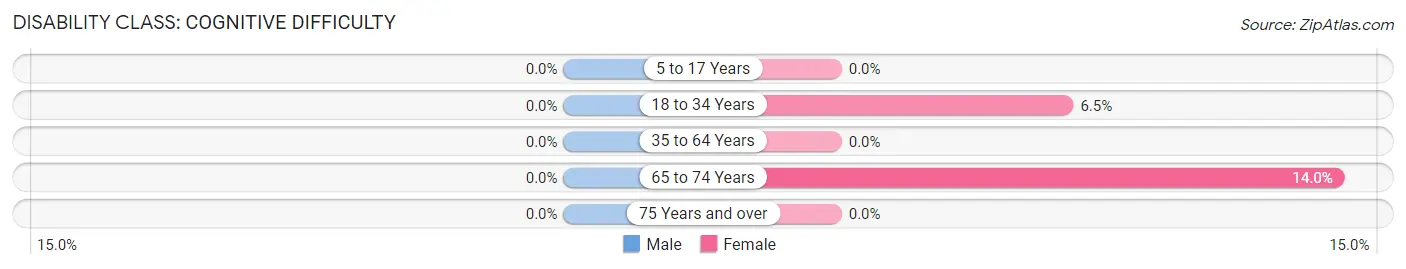
| Age Bracket | Male | Female |
| 5 to 17 Years | 0 (0.0%) | 0 (0.0%) |
| 18 to 34 Years | 0 (0.0%) | 12 (6.5%) |
| 35 to 64 Years | 0 (0.0%) | 0 (0.0%) |
| 65 to 74 Years | 0 (0.0%) | 7 (14.0%) |
| 75 Years and over | 0 (0.0%) | 0 (0.0%) |
Disability Class: Ambulatory Difficulty
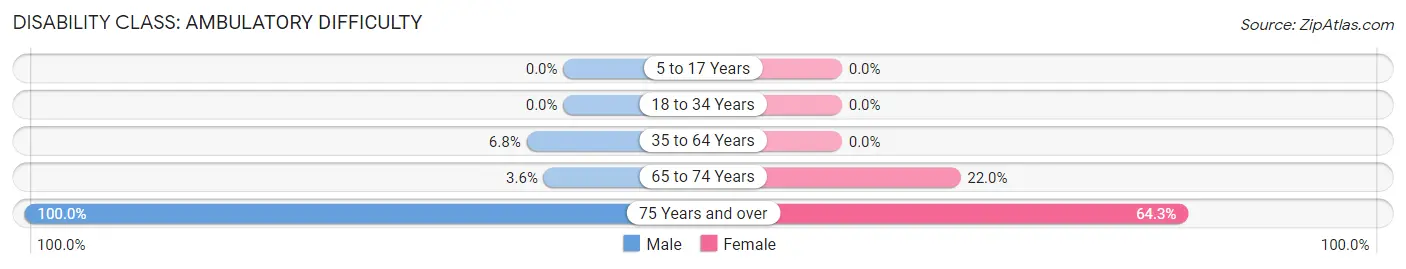
| Age Bracket | Male | Female |
| 5 to 17 Years | 0 (0.0%) | 0 (0.0%) |
| 18 to 34 Years | 0 (0.0%) | 0 (0.0%) |
| 35 to 64 Years | 16 (6.8%) | 0 (0.0%) |
| 65 to 74 Years | 2 (3.6%) | 11 (22.0%) |
| 75 Years and over | 28 (100.0%) | 9 (64.3%) |
Disability Class: Self-Care Difficulty
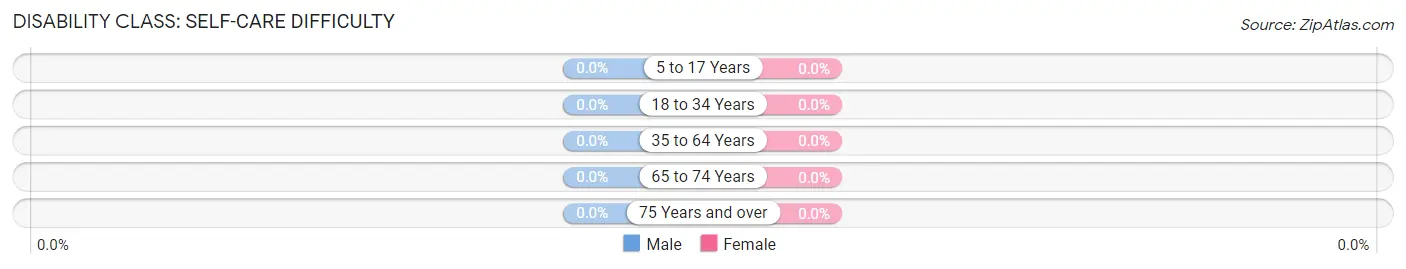
| Age Bracket | Male | Female |
| 5 to 17 Years | 0 (0.0%) | 0 (0.0%) |
| 18 to 34 Years | 0 (0.0%) | 0 (0.0%) |
| 35 to 64 Years | 0 (0.0%) | 0 (0.0%) |
| 65 to 74 Years | 0 (0.0%) | 0 (0.0%) |
| 75 Years and over | 0 (0.0%) | 0 (0.0%) |
Technology Access in Centerfield
Computing Device Access in Centerfield
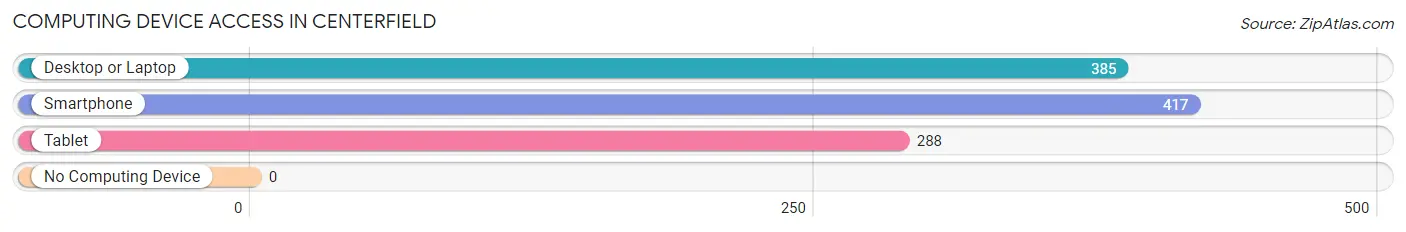
| Device Type | # Households | % Households |
| Desktop or Laptop | 385 | 91.7% |
| Smartphone | 417 | 99.3% |
| Tablet | 288 | 68.6% |
| No Computing Device | 0 | 0.0% |
| Total | 420 | 100.0% |
Internet Access in Centerfield
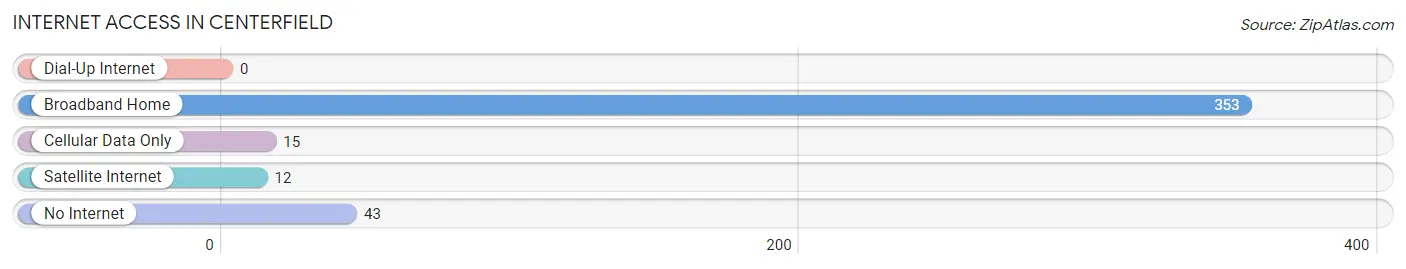
| Internet Type | # Households | % Households |
| Dial-Up Internet | 0 | 0.0% |
| Broadband Home | 353 | 84.1% |
| Cellular Data Only | 15 | 3.6% |
| Satellite Internet | 12 | 2.9% |
| No Internet | 43 | 10.2% |
| Total | 420 | 100.0% |
Centerfield Summary
Centerfield, Utah is a small city located in Sanpete County, Utah. It is situated in the central part of the state, about 90 miles south of Salt Lake City. The city is located in a rural area, surrounded by farmland and small towns. The population of Centerfield was 1,845 in the 2010 census.
History
The area that is now Centerfield was first settled in 1859 by a group of Mormon pioneers. The town was originally called “Manti” after the nearby city of Manti, Utah. In 1876, the name was changed to Centerfield, after the nearby town of Centerfield, Utah.
The town was incorporated in 1891 and has remained a small, rural community ever since. The town has a rich history of farming and ranching, and the local economy has been largely based on agriculture.
Geography
Centerfield is located in the central part of Utah, about 90 miles south of Salt Lake City. The city is situated in a rural area, surrounded by farmland and small towns. The city is located in the Sanpete Valley, which is part of the Great Basin region.
The city is located at an elevation of 4,890 feet above sea level. The climate is semi-arid, with hot summers and cold winters. The average annual precipitation is about 12 inches.
Economy
The economy of Centerfield is largely based on agriculture. The city is home to several farms and ranches, and the local economy is heavily dependent on the production of livestock, hay, and other agricultural products.
The city also has a small manufacturing sector, with several small businesses producing a variety of products. The city is also home to several retail stores, restaurants, and other businesses.
Demographics
As of the 2010 census, the population of Centerfield was 1,845. The racial makeup of the city was 95.3% White, 0.3% African American, 0.3% Native American, 0.3% Asian, 0.1% Pacific Islander, 1.2% from other races, and 2.5% from two or more races. Hispanic or Latino of any race were 4.2% of the population.
The median income for a household in the city was $37,917, and the median income for a family was $45,625. The per capita income for the city was $17,845. About 11.2% of families and 14.2% of the population were below the poverty line, including 17.2% of those under age 18 and 8.3% of those age 65 or over.
Conclusion
Centerfield, Utah is a small city located in Sanpete County, Utah. It is situated in the central part of the state, about 90 miles south of Salt Lake City. The city is located in a rural area, surrounded by farmland and small towns. The population of Centerfield was 1,845 in the 2010 census. The economy of Centerfield is largely based on agriculture, and the city is home to several farms and ranches. The racial makeup of the city was 95.3% White, 0.3% African American, 0.3% Native American, 0.3% Asian, 0.1% Pacific Islander, 1.2% from other races, and 2.5% from two or more races. The median income for a household in the city was $37,917, and the median income for a family was $45,625.
Common Questions
What is Per Capita Income in Centerfield?
Per Capita income in Centerfield is $26,771.
What is the Median Family Income in Centerfield?
Median Family Income in Centerfield is $94,063.
What is the Median Household income in Centerfield?
Median Household Income in Centerfield is $68,333.
What is Income or Wage Gap in Centerfield?
Income or Wage Gap in Centerfield is 55.2%.
Women in Centerfield earn 44.8 cents for every dollar earned by a man.
What is Inequality or Gini Index in Centerfield?
Inequality or Gini Index in Centerfield is 0.37.
What is the Total Population of Centerfield?
Total Population of Centerfield is 1,353.
What is the Total Male Population of Centerfield?
Total Male Population of Centerfield is 692.
What is the Total Female Population of Centerfield?
Total Female Population of Centerfield is 661.
What is the Ratio of Males per 100 Females in Centerfield?
There are 104.69 Males per 100 Females in Centerfield.
What is the Ratio of Females per 100 Males in Centerfield?
There are 95.52 Females per 100 Males in Centerfield.
What is the Median Population Age in Centerfield?
Median Population Age in Centerfield is 35.5 Years.
What is the Average Family Size in Centerfield
Average Family Size in Centerfield is 3.8 People.
What is the Average Household Size in Centerfield
Average Household Size in Centerfield is 3.1 People.
How Large is the Labor Force in Centerfield?
There are 731 People in the Labor Forcein in Centerfield.
What is the Percentage of People in the Labor Force in Centerfield?
66.2% of People are in the Labor Force in Centerfield.
What is the Unemployment Rate in Centerfield?
Unemployment Rate in Centerfield is 5.5%.