Bluebell, UT Map & Demographics
Bluebell Map
Bluebell Overview
$34,045
PER CAPITA INCOME
$95,179
AVG FAMILY INCOME
$88,750
AVG HOUSEHOLD INCOME
0.14
INEQUALITY / GINI INDEX
242
TOTAL POPULATION
106
MALE POPULATION
136
FEMALE POPULATION
77.94
MALES / 100 FEMALES
128.30
FEMALES / 100 MALES
24.9
MEDIAN AGE
3.1
AVG FAMILY SIZE
3.0
AVG HOUSEHOLD SIZE
132
LABOR FORCE [ PEOPLE ]
67.3%
PERCENT IN LABOR FORCE
Bluebell Zip Codes
Bluebell Area Codes
Income in Bluebell
Income Overview in Bluebell
Per Capita Income in Bluebell is $34,045, while median incomes of families and households are $95,179 and $88,750 respectively.
| Characteristic | Number | Measure |
| Per Capita Income | 242 | $34,045 |
| Median Family Income | 75 | $95,179 |
| Mean Family Income | 75 | $105,675 |
| Median Household Income | 82 | $88,750 |
| Mean Household Income | 82 | $103,288 |
| Income Deficit | 75 | $0 |
| Wage / Income Gap (%) | 242 | 0.00% |
| Wage / Income Gap ($) | 242 | 100.00¢ per $1 |
| Gini / Inequality Index | 242 | 0.14 |
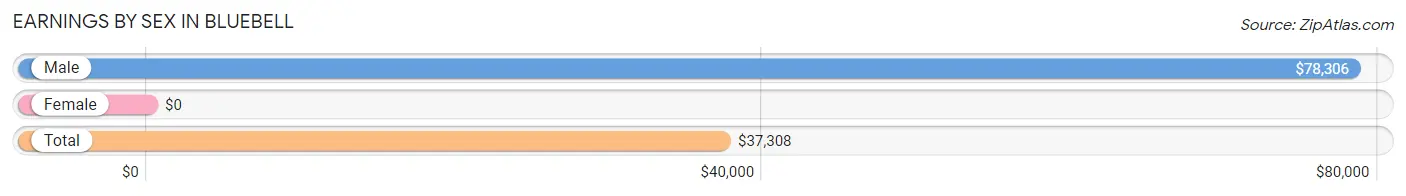
Earnings by Sex in Bluebell
| Sex | Number | Average Earnings |
| Male | 66 (50.0%) | $78,306 |
| Female | 66 (50.0%) | $0 |
| Total | 132 (100.0%) | $37,308 |
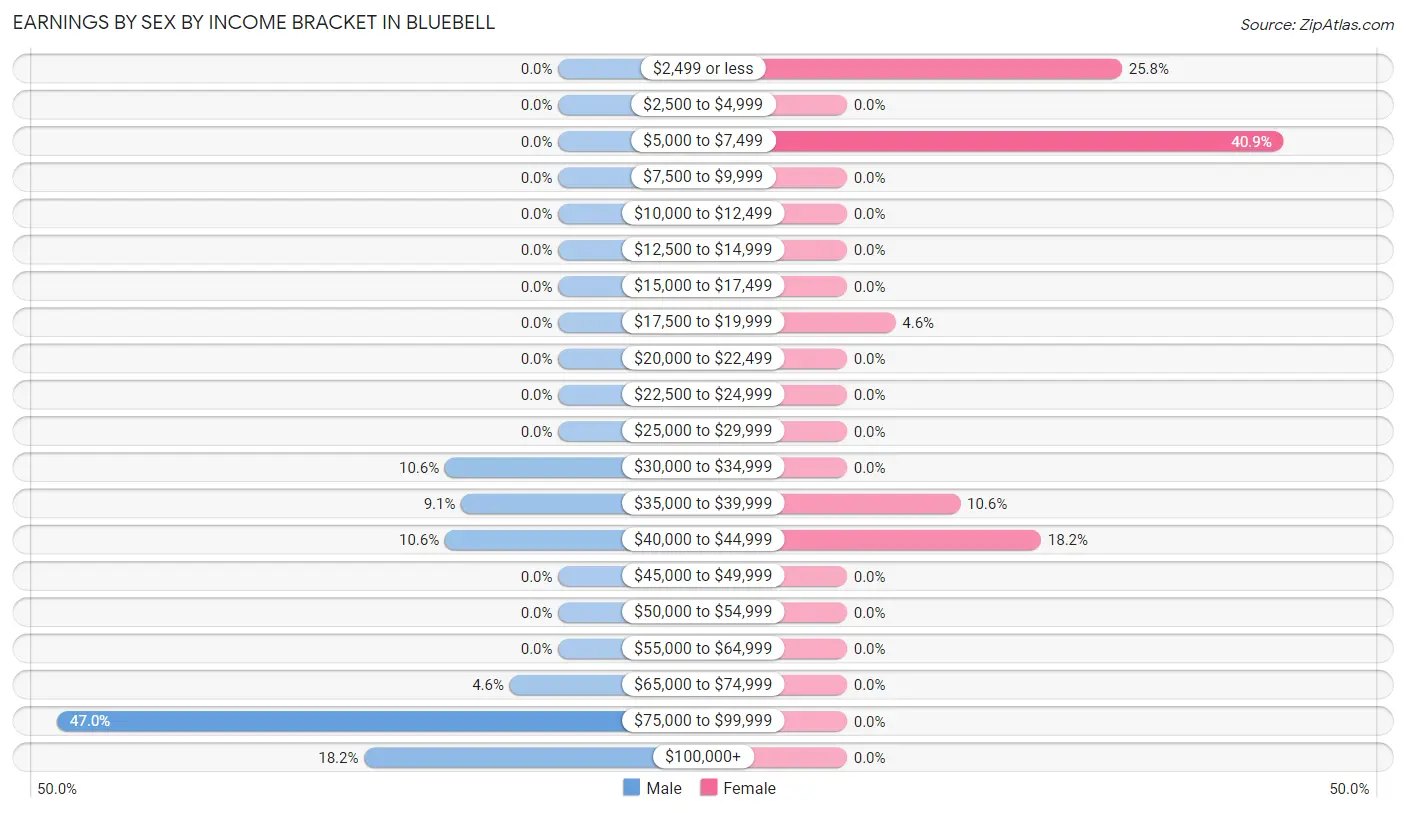
Earnings by Sex by Income Bracket in Bluebell
The most common earnings brackets in Bluebell are $75,000 to $99,999 for men (31 | 47.0%) and $5,000 to $7,499 for women (27 | 40.9%).
| Income | Male | Female |
| $2,499 or less | 0 (0.0%) | 17 (25.8%) |
| $2,500 to $4,999 | 0 (0.0%) | 0 (0.0%) |
| $5,000 to $7,499 | 0 (0.0%) | 27 (40.9%) |
| $7,500 to $9,999 | 0 (0.0%) | 0 (0.0%) |
| $10,000 to $12,499 | 0 (0.0%) | 0 (0.0%) |
| $12,500 to $14,999 | 0 (0.0%) | 0 (0.0%) |
| $15,000 to $17,499 | 0 (0.0%) | 0 (0.0%) |
| $17,500 to $19,999 | 0 (0.0%) | 3 (4.5%) |
| $20,000 to $22,499 | 0 (0.0%) | 0 (0.0%) |
| $22,500 to $24,999 | 0 (0.0%) | 0 (0.0%) |
| $25,000 to $29,999 | 0 (0.0%) | 0 (0.0%) |
| $30,000 to $34,999 | 7 (10.6%) | 0 (0.0%) |
| $35,000 to $39,999 | 6 (9.1%) | 7 (10.6%) |
| $40,000 to $44,999 | 7 (10.6%) | 12 (18.2%) |
| $45,000 to $49,999 | 0 (0.0%) | 0 (0.0%) |
| $50,000 to $54,999 | 0 (0.0%) | 0 (0.0%) |
| $55,000 to $64,999 | 0 (0.0%) | 0 (0.0%) |
| $65,000 to $74,999 | 3 (4.5%) | 0 (0.0%) |
| $75,000 to $99,999 | 31 (47.0%) | 0 (0.0%) |
| $100,000+ | 12 (18.2%) | 0 (0.0%) |
| Total | 66 (100.0%) | 66 (100.0%) |
Earnings by Sex by Educational Attainment in Bluebell
| Educational Attainment | Male Income | Female Income |
| Less than High School | - | - |
| High School Diploma | - | - |
| College or Associate's Degree | - | - |
| Bachelor's Degree | - | - |
| Graduate Degree | - | - |
| Total | $70,833 | $37,143 |
Family Income in Bluebell
Family Income Brackets in Bluebell
According to the Bluebell family income data, there are 38 families falling into the $75,000 to $99,999 income range, which is the most common income bracket and makes up 50.7% of all families.
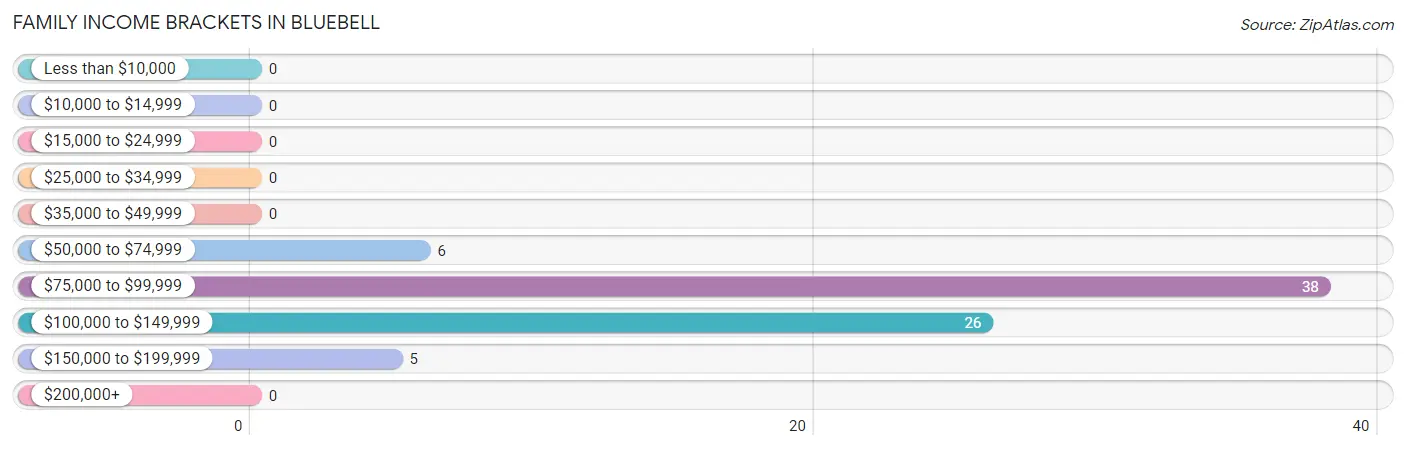
| Income Bracket | # Families | % Families |
| Less than $10,000 | 0 | 0.0% |
| $10,000 to $14,999 | 0 | 0.0% |
| $15,000 to $24,999 | 0 | 0.0% |
| $25,000 to $34,999 | 0 | 0.0% |
| $35,000 to $49,999 | 0 | 0.0% |
| $50,000 to $74,999 | 6 | 8.0% |
| $75,000 to $99,999 | 38 | 50.7% |
| $100,000 to $149,999 | 26 | 34.7% |
| $150,000 to $199,999 | 5 | 6.7% |
| $200,000+ | 0 | 0.0% |
Family Income by Famaliy Size in Bluebell
2-person families (32 | 42.7%) account for the highest median family income in Bluebell with $105,000 per family, while 2-person families (32 | 42.7%) have the highest median income of $52,500 per family member.
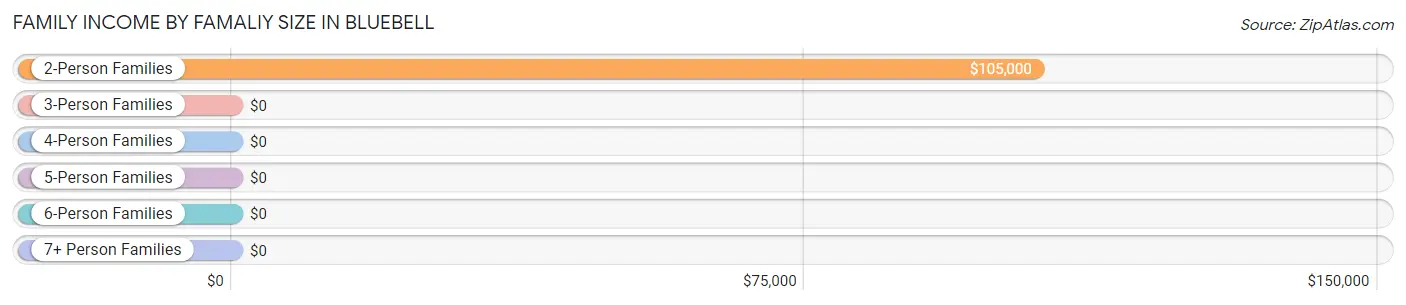
| Income Bracket | # Families | Median Income |
| 2-Person Families | 32 (42.7%) | $105,000 |
| 3-Person Families | 24 (32.0%) | $0 |
| 4-Person Families | 15 (20.0%) | $0 |
| 5-Person Families | 0 (0.0%) | $0 |
| 6-Person Families | 0 (0.0%) | $0 |
| 7+ Person Families | 4 (5.3%) | $0 |
| Total | 75 (100.0%) | $95,179 |
Family Income by Number of Earners in Bluebell

| Number of Earners | # Families | Median Income |
| No Earners | 11 (14.7%) | $0 |
| 1 Earner | 11 (14.7%) | $0 |
| 2 Earners | 53 (70.7%) | $87,135 |
| 3+ Earners | 0 (0.0%) | $0 |
| Total | 75 (100.0%) | $95,179 |
Household Income in Bluebell
Household Income Brackets in Bluebell
With 45 households falling in the category, the $75,000 to $99,999 income range is the most frequent in Bluebell, accounting for 54.9% of all households.
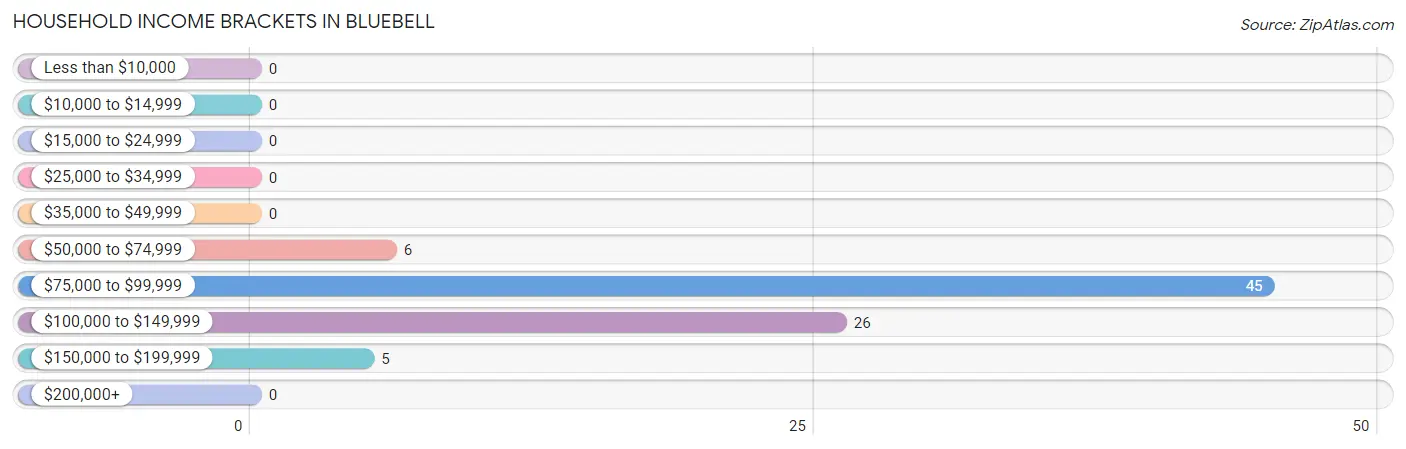
| Income Bracket | # Households | % Households |
| Less than $10,000 | 0 | 0.0% |
| $10,000 to $14,999 | 0 | 0.0% |
| $15,000 to $24,999 | 0 | 0.0% |
| $25,000 to $34,999 | 0 | 0.0% |
| $35,000 to $49,999 | 0 | 0.0% |
| $50,000 to $74,999 | 6 | 7.3% |
| $75,000 to $99,999 | 45 | 54.9% |
| $100,000 to $149,999 | 26 | 31.7% |
| $150,000 to $199,999 | 5 | 6.1% |
| $200,000+ | 0 | 0.0% |
Household Income by Householder Age in Bluebell
The median household income in Bluebell is $88,750, with the highest median household income of $118,438 found in the 45 to 64 years age bracket for the primary householder. A total of 34 households (41.5%) fall into this category. Meanwhile, the 15 to 24 years age bracket for the primary householder has the lowest median household income of $0, with 24 households (29.3%) in this group.
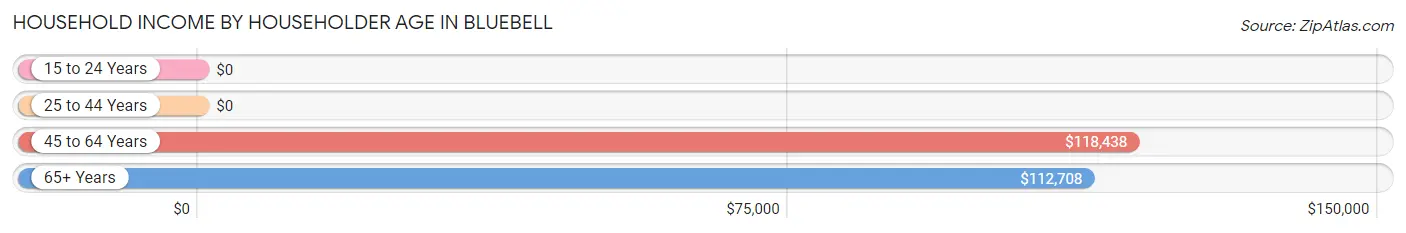
| Income Bracket | # Households | Median Income |
| 15 to 24 Years | 24 (29.3%) | $0 |
| 25 to 44 Years | 3 (3.7%) | $0 |
| 45 to 64 Years | 34 (41.5%) | $118,438 |
| 65+ Years | 21 (25.6%) | $112,708 |
| Total | 82 (100.0%) | $88,750 |
Poverty in Bluebell
Income Below Poverty by Sex and Age in Bluebell
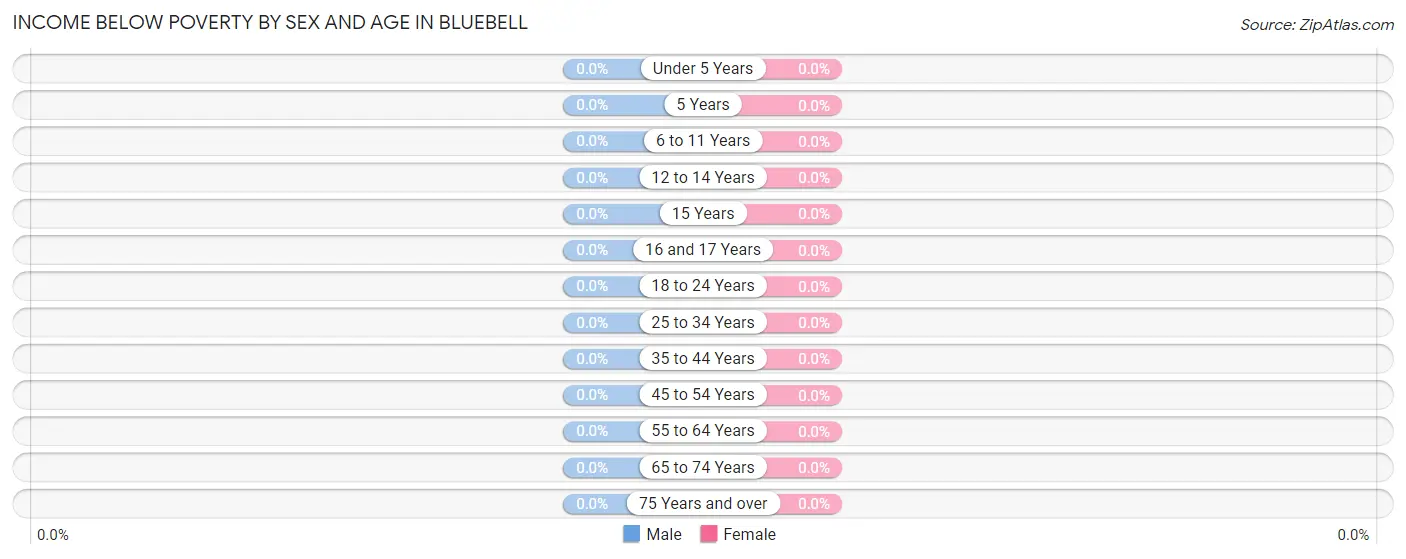
| Age Bracket | Male | Female |
| Under 5 Years | 0 (0.0%) | 0 (0.0%) |
| 5 Years | 0 (0.0%) | 0 (0.0%) |
| 6 to 11 Years | 0 (0.0%) | 0 (0.0%) |
| 12 to 14 Years | 0 (0.0%) | 0 (0.0%) |
| 15 Years | 0 (0.0%) | 0 (0.0%) |
| 16 and 17 Years | 0 (0.0%) | 0 (0.0%) |
| 18 to 24 Years | 0 (0.0%) | 0 (0.0%) |
| 25 to 34 Years | 0 (0.0%) | 0 (0.0%) |
| 35 to 44 Years | 0 (0.0%) | 0 (0.0%) |
| 45 to 54 Years | 0 (0.0%) | 0 (0.0%) |
| 55 to 64 Years | 0 (0.0%) | 0 (0.0%) |
| 65 to 74 Years | 0 (0.0%) | 0 (0.0%) |
| 75 Years and over | 0 (0.0%) | 0 (0.0%) |
| Total | 0 (0.0%) | 0 (0.0%) |
Income Above Poverty by Sex and Age in Bluebell
According to the poverty statistics in Bluebell, males aged under 5 years and females aged under 5 years are the age groups that are most secure financially, with 100.0% of males and 100.0% of females in these age groups living above the poverty line.
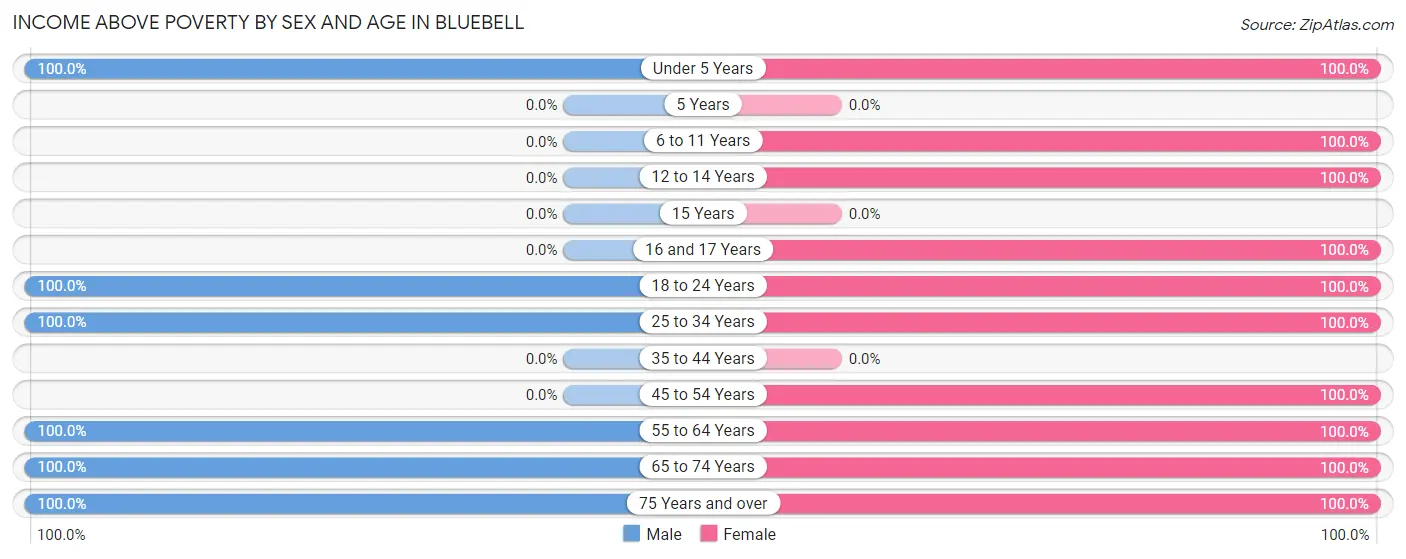
| Age Bracket | Male | Female |
| Under 5 Years | 20 (100.0%) | 12 (100.0%) |
| 5 Years | 0 (0.0%) | 0 (0.0%) |
| 6 to 11 Years | 0 (0.0%) | 7 (100.0%) |
| 12 to 14 Years | 0 (0.0%) | 7 (100.0%) |
| 15 Years | 0 (0.0%) | 0 (0.0%) |
| 16 and 17 Years | 0 (0.0%) | 14 (100.0%) |
| 18 to 24 Years | 24 (100.0%) | 40 (100.0%) |
| 25 to 34 Years | 10 (100.0%) | 7 (100.0%) |
| 35 to 44 Years | 0 (0.0%) | 0 (0.0%) |
| 45 to 54 Years | 0 (0.0%) | 20 (100.0%) |
| 55 to 64 Years | 26 (100.0%) | 14 (100.0%) |
| 65 to 74 Years | 14 (100.0%) | 10 (100.0%) |
| 75 Years and over | 12 (100.0%) | 5 (100.0%) |
| Total | 106 (100.0%) | 136 (100.0%) |
Income Below Poverty Among Married-Couple Families in Bluebell
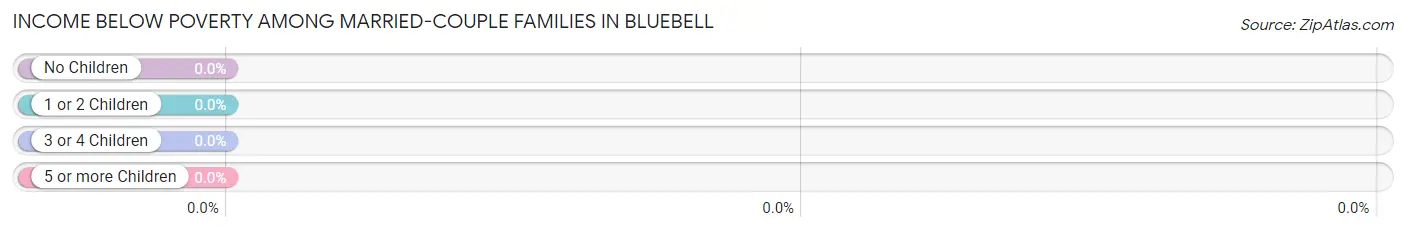
| Children | Above Poverty | Below Poverty |
| No Children | 32 (100.0%) | 0 (0.0%) |
| 1 or 2 Children | 39 (100.0%) | 0 (0.0%) |
| 3 or 4 Children | 4 (100.0%) | 0 (0.0%) |
| 5 or more Children | 0 (0.0%) | 0 (0.0%) |
| Total | 75 (100.0%) | 0 (0.0%) |
Income Below Poverty Among Single-Parent Households in Bluebell
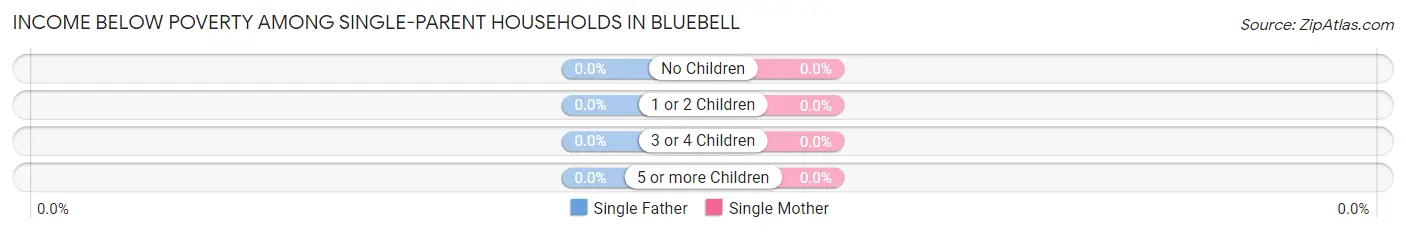
| Children | Single Father | Single Mother |
| No Children | 0 (0.0%) | 0 (0.0%) |
| 1 or 2 Children | 0 (0.0%) | 0 (0.0%) |
| 3 or 4 Children | 0 (0.0%) | 0 (0.0%) |
| 5 or more Children | 0 (0.0%) | 0 (0.0%) |
| Total | 0 (0.0%) | 0 (0.0%) |
Income Below Poverty Among Married-Couple vs Single-Parent Households in Bluebell
| Children | Married-Couple Families | Single-Parent Households |
| No Children | 0 (0.0%) | 0 (0.0%) |
| 1 or 2 Children | 0 (0.0%) | 0 (0.0%) |
| 3 or 4 Children | 0 (0.0%) | 0 (0.0%) |
| 5 or more Children | 0 (0.0%) | 0 (0.0%) |
| Total | 0 (0.0%) | 0 (0.0%) |
Race in Bluebell
The most populous races in Bluebell are , and White / Caucasian (242 | 100.0%).
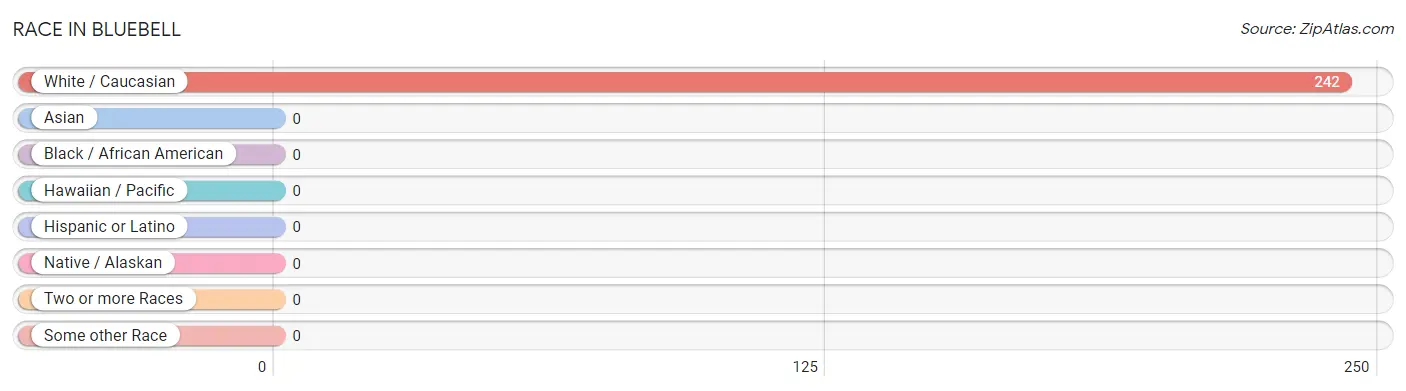
| Race | # Population | % Population |
| Asian | 0 | 0.0% |
| Black / African American | 0 | 0.0% |
| Hawaiian / Pacific | 0 | 0.0% |
| Hispanic or Latino | 0 | 0.0% |
| Native / Alaskan | 0 | 0.0% |
| White / Caucasian | 242 | 100.0% |
| Two or more Races | 0 | 0.0% |
| Some other Race | 0 | 0.0% |
| Total | 242 | 100.0% |
Ancestry in Bluebell
The most populous ancestries reported in Bluebell are English (108 | 44.6%), Irish (25 | 10.3%), Welsh (11 | 4.5%), French (8 | 3.3%), and Swiss (7 | 2.9%), together accounting for 65.7% of all Bluebell residents.
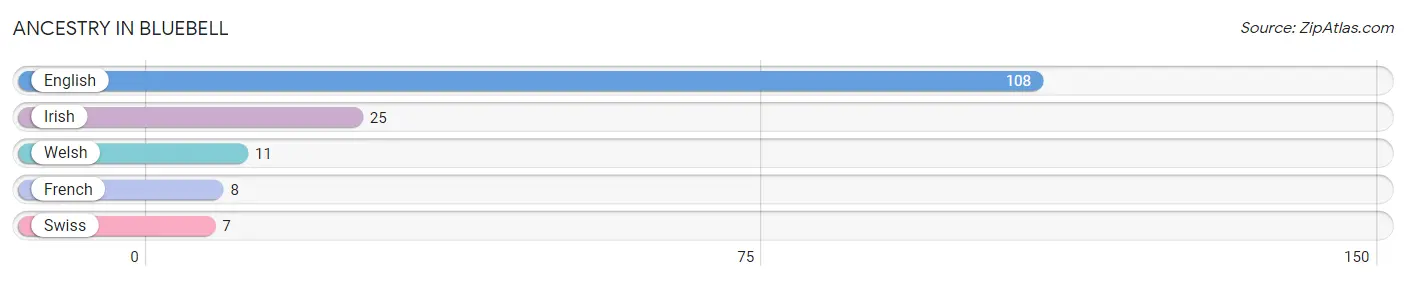
| Ancestry | # Population | % Population |
| English | 108 | 44.6% |
| French | 8 | 3.3% |
| Irish | 25 | 10.3% |
| Swiss | 7 | 2.9% |
| Welsh | 11 | 4.5% | View All 5 Rows |
Immigrants in Bluebell

| Immigration Origin | # Population | % Population | View All 0 Rows |
Sex and Age in Bluebell
Sex and Age in Bluebell
The most populous age groups in Bluebell are 20 to 24 Years (24 | 22.6%) for men and 20 to 24 Years (40 | 29.4%) for women.
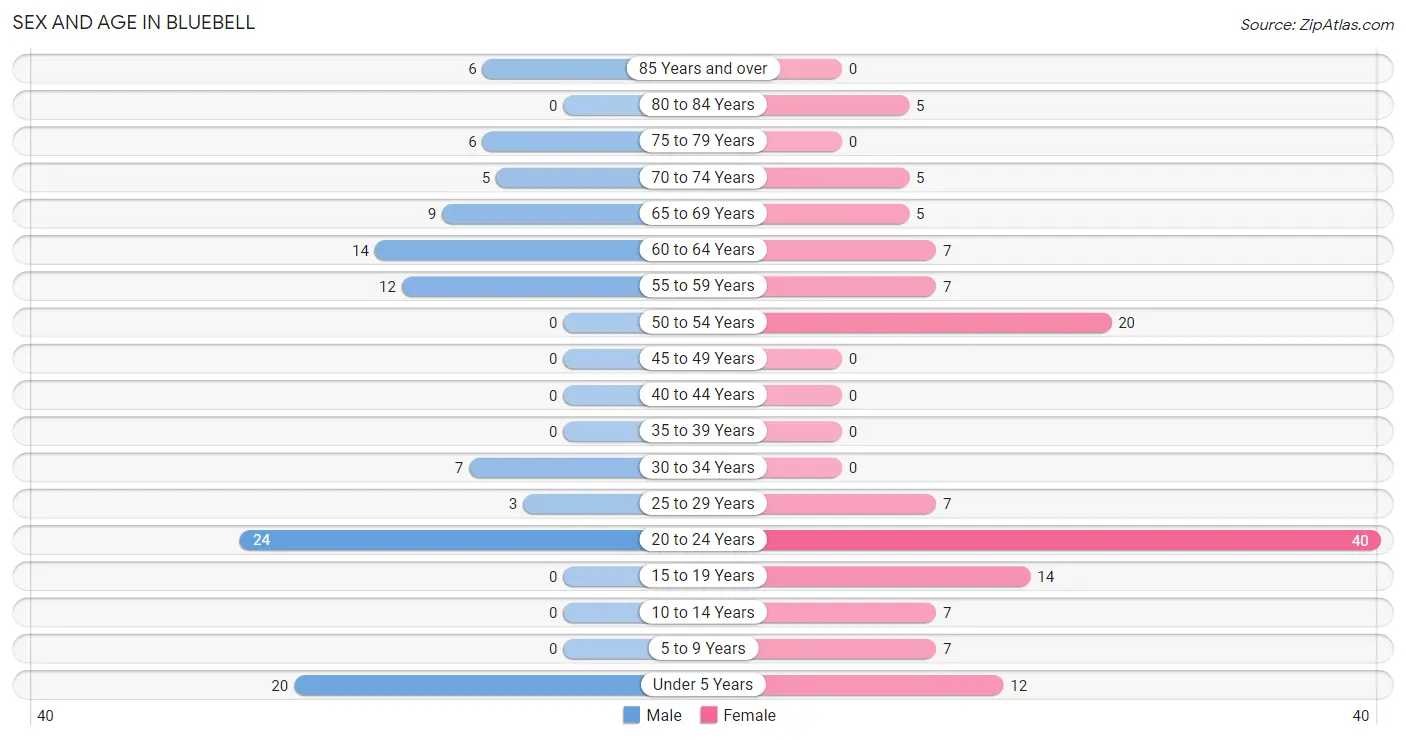
| Age Bracket | Male | Female |
| Under 5 Years | 20 (18.9%) | 12 (8.8%) |
| 5 to 9 Years | 0 (0.0%) | 7 (5.1%) |
| 10 to 14 Years | 0 (0.0%) | 7 (5.1%) |
| 15 to 19 Years | 0 (0.0%) | 14 (10.3%) |
| 20 to 24 Years | 24 (22.6%) | 40 (29.4%) |
| 25 to 29 Years | 3 (2.8%) | 7 (5.1%) |
| 30 to 34 Years | 7 (6.6%) | 0 (0.0%) |
| 35 to 39 Years | 0 (0.0%) | 0 (0.0%) |
| 40 to 44 Years | 0 (0.0%) | 0 (0.0%) |
| 45 to 49 Years | 0 (0.0%) | 0 (0.0%) |
| 50 to 54 Years | 0 (0.0%) | 20 (14.7%) |
| 55 to 59 Years | 12 (11.3%) | 7 (5.1%) |
| 60 to 64 Years | 14 (13.2%) | 7 (5.1%) |
| 65 to 69 Years | 9 (8.5%) | 5 (3.7%) |
| 70 to 74 Years | 5 (4.7%) | 5 (3.7%) |
| 75 to 79 Years | 6 (5.7%) | 0 (0.0%) |
| 80 to 84 Years | 0 (0.0%) | 5 (3.7%) |
| 85 Years and over | 6 (5.7%) | 0 (0.0%) |
| Total | 106 (100.0%) | 136 (100.0%) |
Families and Households in Bluebell
Median Family Size in Bluebell
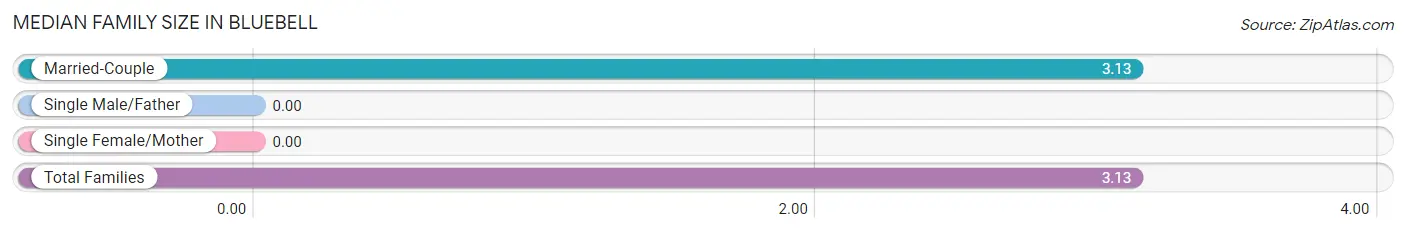
| Family Type | # Families | Family Size |
| Married-Couple | 75 (100.0%) | 3.13 |
| Single Male/Father | 0 (0.0%) | - |
| Single Female/Mother | 0 (0.0%) | - |
| Total Families | 75 (100.0%) | 3.13 |
Median Household Size in Bluebell
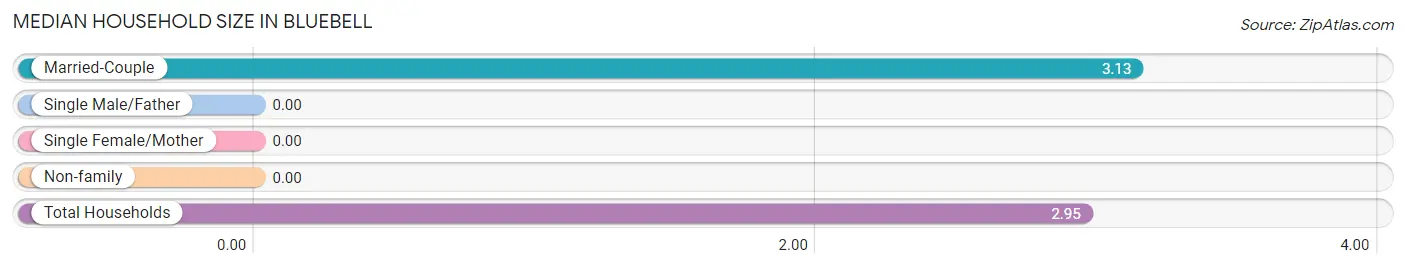
| Household Type | # Households | Household Size |
| Married-Couple | 75 (91.5%) | 3.13 |
| Single Male/Father | 0 (0.0%) | - |
| Single Female/Mother | 0 (0.0%) | - |
| Non-family | 7 (8.5%) | - |
| Total Households | 82 (100.0%) | 2.95 |
Household Size by Marriage Status in Bluebell
Out of a total of 82 households in Bluebell, 75 (91.5%) are family households, while 7 (8.5%) are nonfamily households. The most numerous type of family households are 2-person households, comprising 32, and the most common type of nonfamily households are 1-person households, comprising 7.
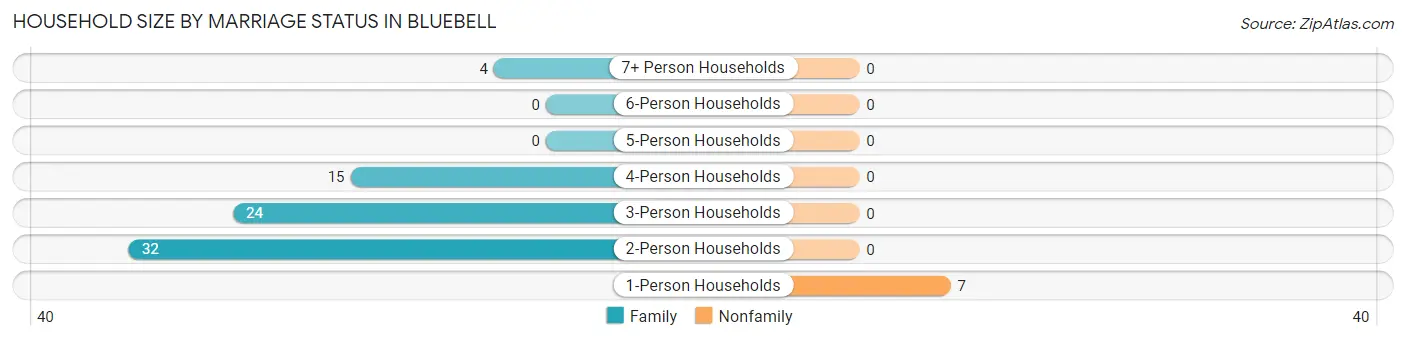
| Household Size | Family Households | Nonfamily Households |
| 1-Person Households | - | 7 (8.5%) |
| 2-Person Households | 32 (39.0%) | 0 (0.0%) |
| 3-Person Households | 24 (29.3%) | 0 (0.0%) |
| 4-Person Households | 15 (18.3%) | 0 (0.0%) |
| 5-Person Households | 0 (0.0%) | 0 (0.0%) |
| 6-Person Households | 0 (0.0%) | 0 (0.0%) |
| 7+ Person Households | 4 (4.9%) | 0 (0.0%) |
| Total | 75 (91.5%) | 7 (8.5%) |
Female Fertility in Bluebell
Fertility by Age in Bluebell
Average fertility rate in Bluebell is 115.0 births per 1,000 women. Women in the age bracket of 20 to 34 years have the highest fertility rate with 149.0 births per 1,000 women. Women in the age bracket of 20 to 34 years acount for 100.0% of all women with births.
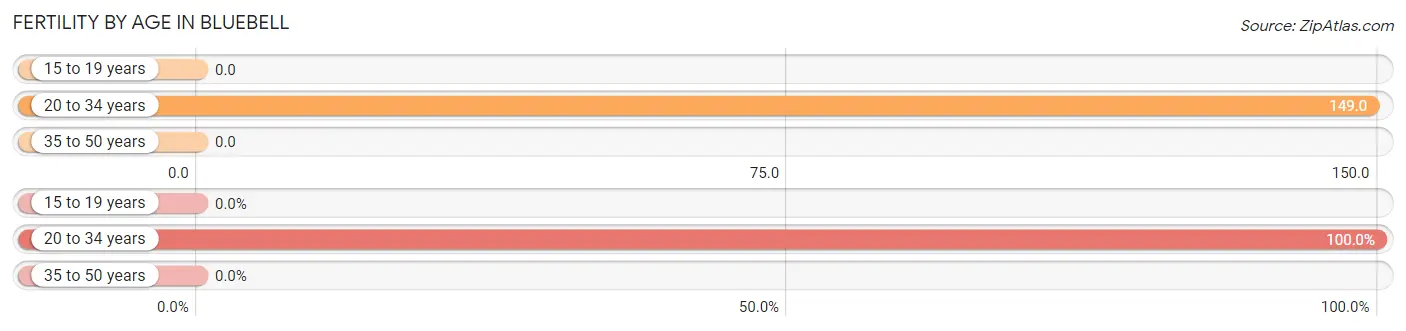
| Age Bracket | Women with Births | Births / 1,000 Women |
| 15 to 19 years | 0 (0.0%) | 0.0 |
| 20 to 34 years | 7 (100.0%) | 149.0 |
| 35 to 50 years | 0 (0.0%) | 0.0 |
| Total | 7 (100.0%) | 115.0 |
Fertility by Age by Marriage Status in Bluebell
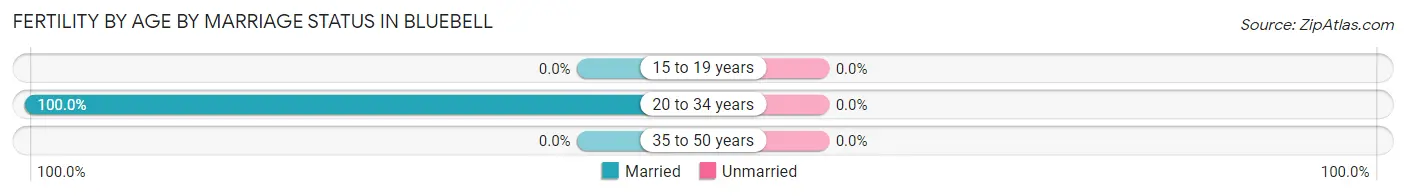
| Age Bracket | Married | Unmarried |
| 15 to 19 years | 0 (0.0%) | 0 (0.0%) |
| 20 to 34 years | 7 (100.0%) | 0 (0.0%) |
| 35 to 50 years | 0 (0.0%) | 0 (0.0%) |
| Total | 7 (100.0%) | 0 (0.0%) |
Fertility by Education in Bluebell
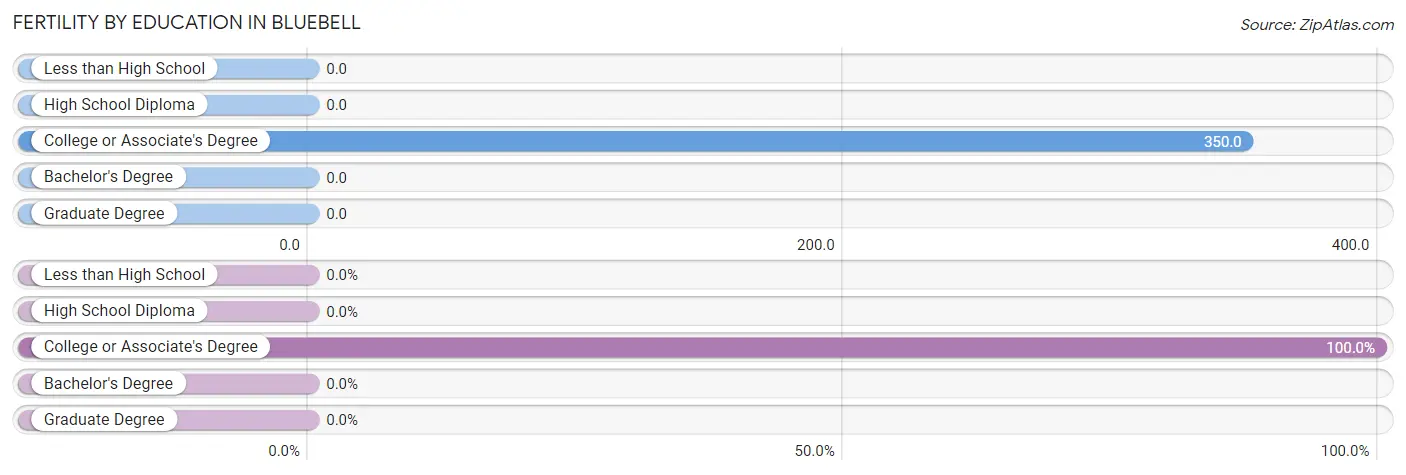
| Educational Attainment | Women with Births | Births / 1,000 Women |
| Less than High School | 0 (0.0%) | 0.0 |
| High School Diploma | 0 (0.0%) | 0.0 |
| College or Associate's Degree | 7 (100.0%) | 350.0 |
| Bachelor's Degree | 0 (0.0%) | 0.0 |
| Graduate Degree | 0 (0.0%) | 0.0 |
| Total | 7 (100.0%) | 115.0 |
Fertility by Education by Marriage Status in Bluebell
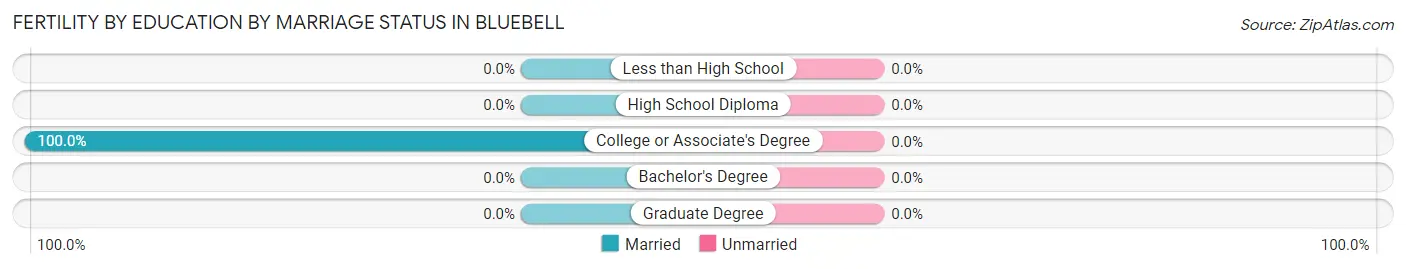
| Educational Attainment | Married | Unmarried |
| Less than High School | 0 (0.0%) | 0 (0.0%) |
| High School Diploma | 0 (0.0%) | 0 (0.0%) |
| College or Associate's Degree | 7 (100.0%) | 0 (0.0%) |
| Bachelor's Degree | 0 (0.0%) | 0 (0.0%) |
| Graduate Degree | 0 (0.0%) | 0 (0.0%) |
| Total | 7 (100.0%) | 0 (0.0%) |
Employment Characteristics in Bluebell
Employment by Class of Employer in Bluebell
Among the 132 employed individuals in Bluebell, private company employees (98 | 74.2%), local government employees (21 | 15.9%), and not-for-profit organizations (7 | 5.3%) make up the most common classes of employment.
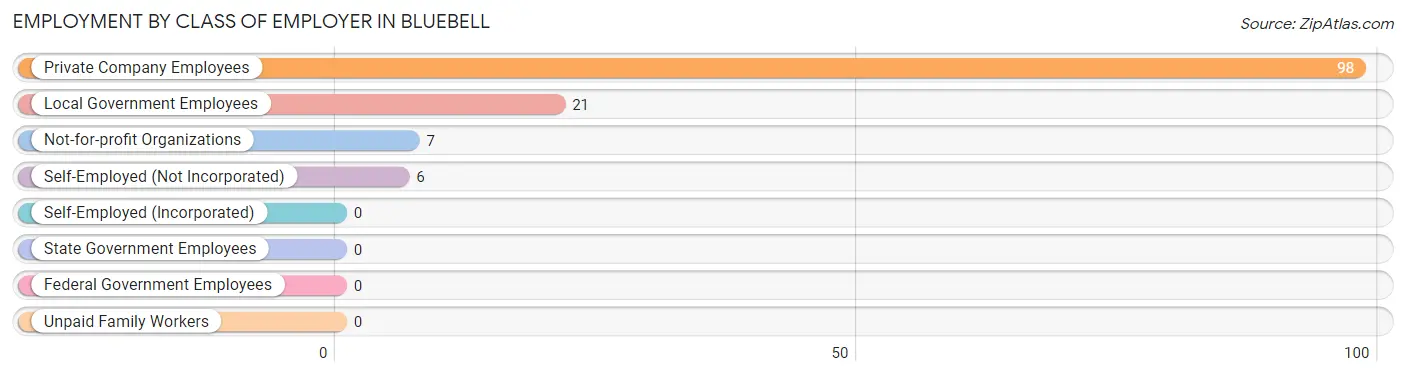
| Employer Class | # Employees | % Employees |
| Private Company Employees | 98 | 74.2% |
| Self-Employed (Incorporated) | 0 | 0.0% |
| Self-Employed (Not Incorporated) | 6 | 4.5% |
| Not-for-profit Organizations | 7 | 5.3% |
| Local Government Employees | 21 | 15.9% |
| State Government Employees | 0 | 0.0% |
| Federal Government Employees | 0 | 0.0% |
| Unpaid Family Workers | 0 | 0.0% |
| Total | 132 | 100.0% |
Employment Status by Age in Bluebell
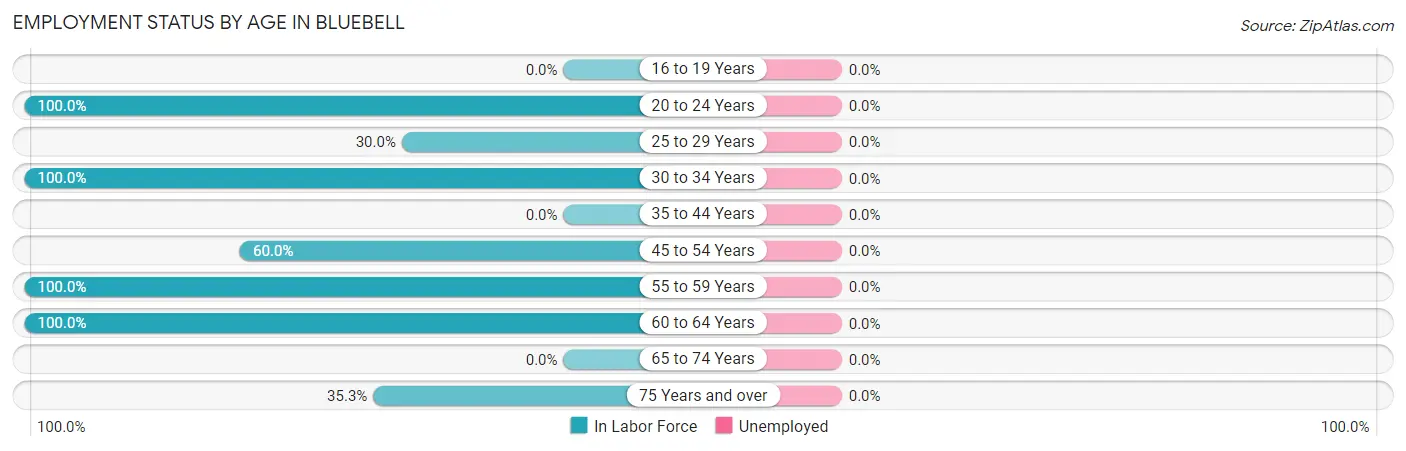
| Age Bracket | In Labor Force | Unemployed |
| 16 to 19 Years | 0 (0.0%) | 0 (0.0%) |
| 20 to 24 Years | 64 (100.0%) | 0 (0.0%) |
| 25 to 29 Years | 3 (30.0%) | 0 (0.0%) |
| 30 to 34 Years | 7 (100.0%) | 0 (0.0%) |
| 35 to 44 Years | 0 (0.0%) | 0 (0.0%) |
| 45 to 54 Years | 12 (60.0%) | 0 (0.0%) |
| 55 to 59 Years | 19 (100.0%) | 0 (0.0%) |
| 60 to 64 Years | 21 (100.0%) | 0 (0.0%) |
| 65 to 74 Years | 0 (0.0%) | 0 (0.0%) |
| 75 Years and over | 6 (35.3%) | 0 (0.0%) |
| Total | 132 (67.3%) | 0 (0.0%) |
Employment Status by Educational Attainment in Bluebell
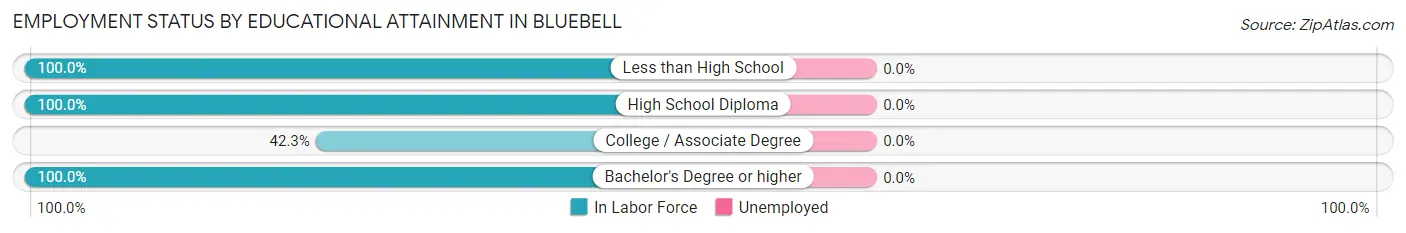
| Educational Attainment | In Labor Force | Unemployed |
| Less than High School | 14 (100.0%) | 0 (0.0%) |
| High School Diploma | 23 (100.0%) | 0 (0.0%) |
| College / Associate Degree | 11 (42.3%) | 0 (0.0%) |
| Bachelor's Degree or higher | 14 (100.0%) | 0 (0.0%) |
| Total | 62 (80.5%) | 0 (0.0%) |
Employment Occupations by Sex in Bluebell
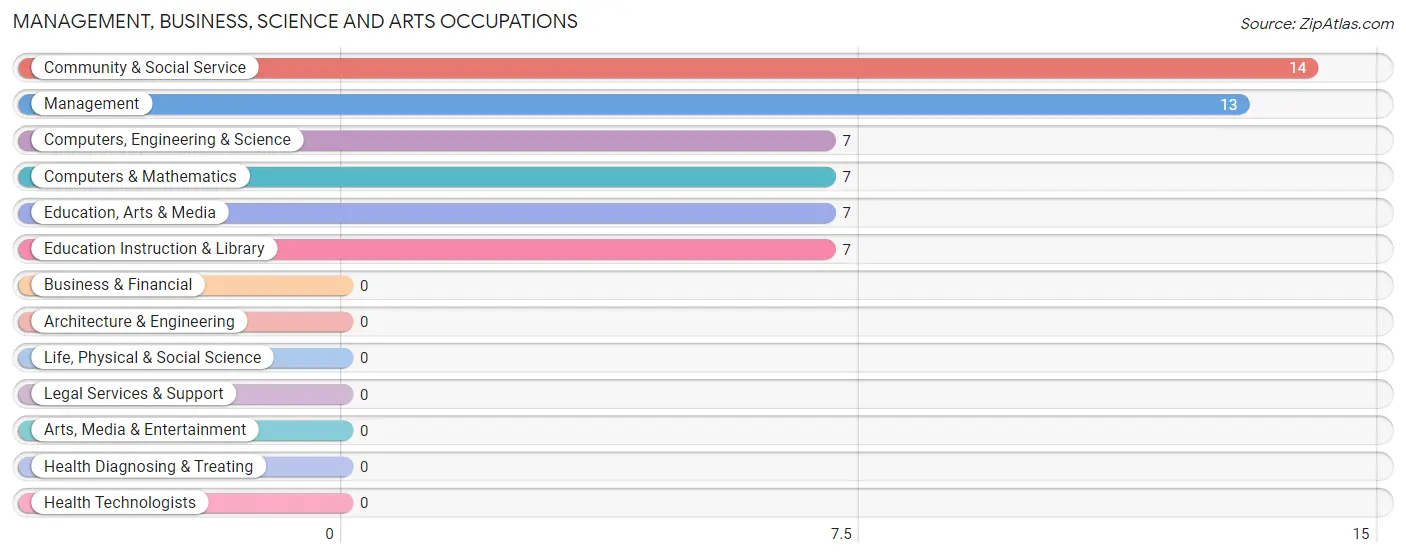
Management, Business, Science and Arts Occupations
The most common Management, Business, Science and Arts occupations in Bluebell are Community & Social Service (14 | 10.6%), Management (13 | 9.9%), Computers, Engineering & Science (7 | 5.3%), Computers & Mathematics (7 | 5.3%), and Education, Arts & Media (7 | 5.3%).
Management, Business, Science and Arts Occupations by Sex
Within the Management, Business, Science and Arts occupations in Bluebell, the most male-oriented occupations are Management (100.0%), Computers, Engineering & Science (100.0%), and Computers & Mathematics (100.0%), while the most female-oriented occupations are Community & Social Service (100.0%), Education, Arts & Media (100.0%), and Education Instruction & Library (100.0%).
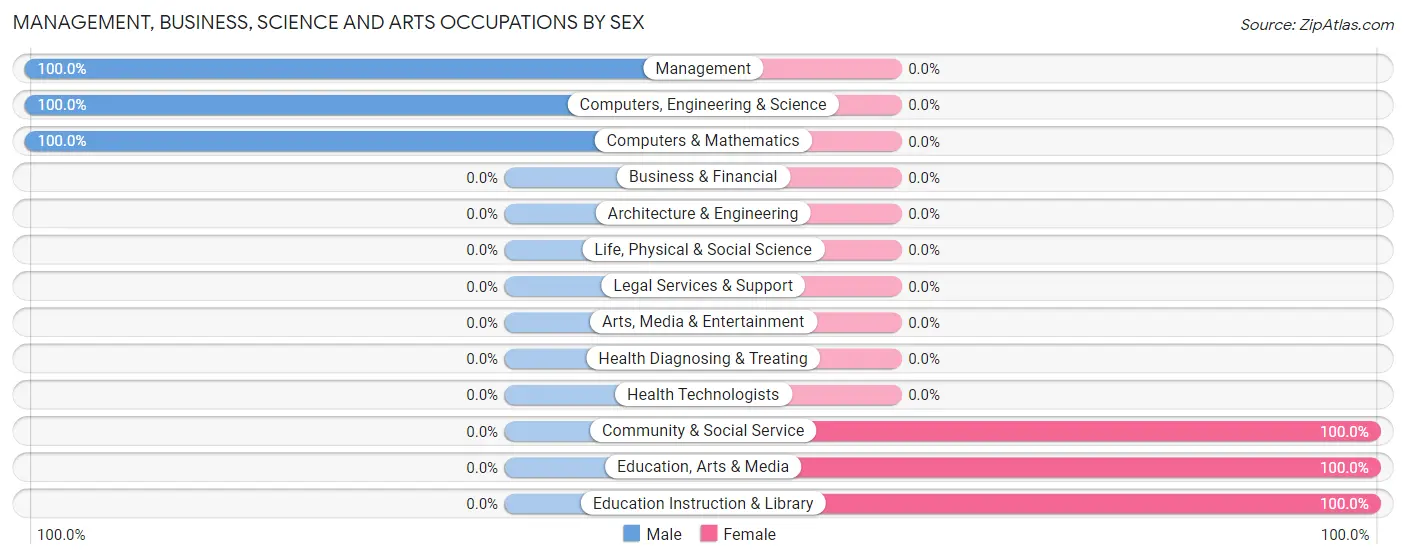
| Occupation | Male | Female |
| Management | 13 (100.0%) | 0 (0.0%) |
| Business & Financial | 0 (0.0%) | 0 (0.0%) |
| Computers, Engineering & Science | 7 (100.0%) | 0 (0.0%) |
| Computers & Mathematics | 7 (100.0%) | 0 (0.0%) |
| Architecture & Engineering | 0 (0.0%) | 0 (0.0%) |
| Life, Physical & Social Science | 0 (0.0%) | 0 (0.0%) |
| Community & Social Service | 0 (0.0%) | 14 (100.0%) |
| Education, Arts & Media | 0 (0.0%) | 7 (100.0%) |
| Legal Services & Support | 0 (0.0%) | 0 (0.0%) |
| Education Instruction & Library | 0 (0.0%) | 7 (100.0%) |
| Arts, Media & Entertainment | 0 (0.0%) | 0 (0.0%) |
| Health Diagnosing & Treating | 0 (0.0%) | 0 (0.0%) |
| Health Technologists | 0 (0.0%) | 0 (0.0%) |
| Total (Category) | 20 (58.8%) | 14 (41.2%) |
| Total (Overall) | 66 (50.0%) | 66 (50.0%) |
Services Occupations
The most common Services occupations in Bluebell are Food Preparation & Serving (27 | 20.4%), and Cleaning & Maintenance (7 | 5.3%).
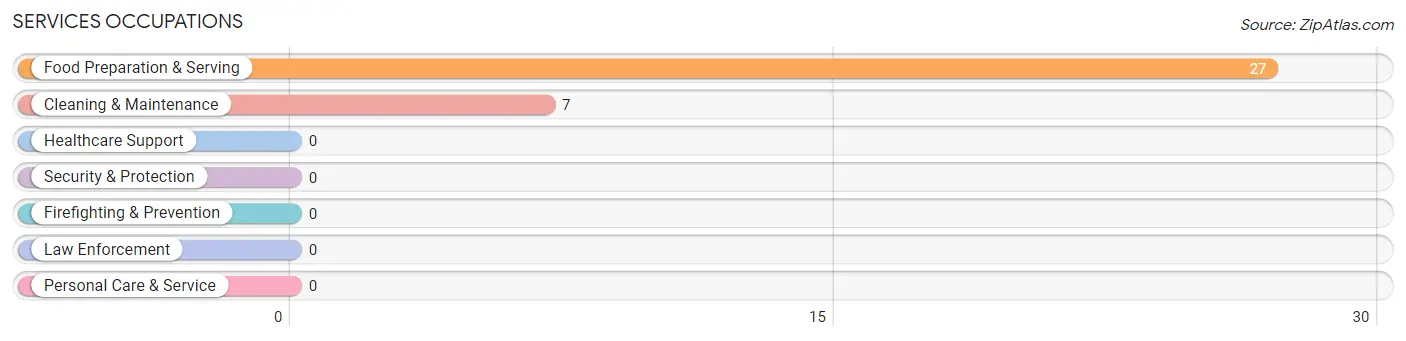
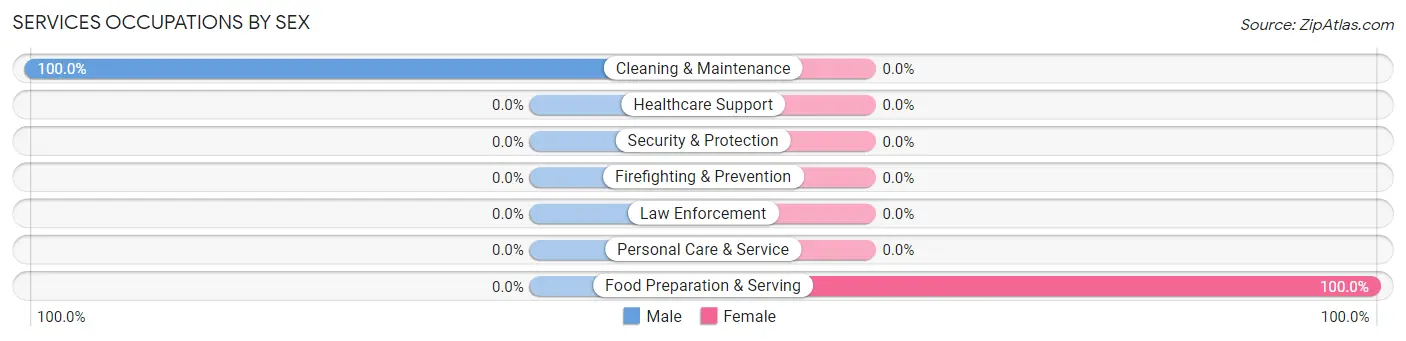
Services Occupations by Sex
| Occupation | Male | Female |
| Healthcare Support | 0 (0.0%) | 0 (0.0%) |
| Security & Protection | 0 (0.0%) | 0 (0.0%) |
| Firefighting & Prevention | 0 (0.0%) | 0 (0.0%) |
| Law Enforcement | 0 (0.0%) | 0 (0.0%) |
| Food Preparation & Serving | 0 (0.0%) | 27 (100.0%) |
| Cleaning & Maintenance | 7 (100.0%) | 0 (0.0%) |
| Personal Care & Service | 0 (0.0%) | 0 (0.0%) |
| Total (Category) | 7 (20.6%) | 27 (79.4%) |
| Total (Overall) | 66 (50.0%) | 66 (50.0%) |
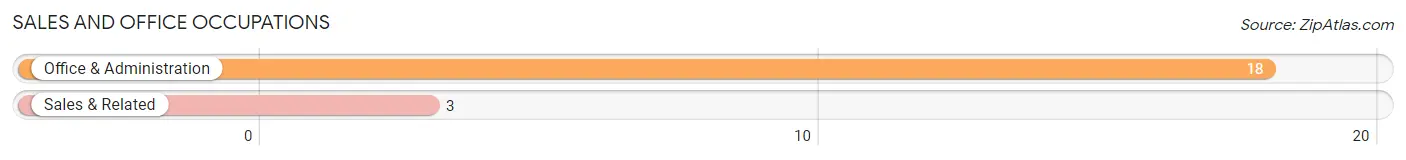
Sales and Office Occupations
The most common Sales and Office occupations in Bluebell are Office & Administration (18 | 13.6%), and Sales & Related (3 | 2.3%).
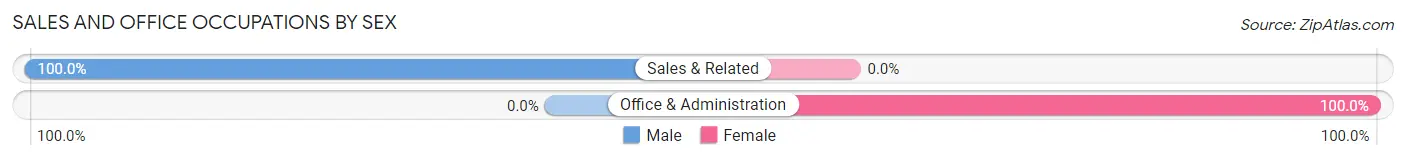
Sales and Office Occupations by Sex
| Occupation | Male | Female |
| Sales & Related | 3 (100.0%) | 0 (0.0%) |
| Office & Administration | 0 (0.0%) | 18 (100.0%) |
| Total (Category) | 3 (14.3%) | 18 (85.7%) |
| Total (Overall) | 66 (50.0%) | 66 (50.0%) |
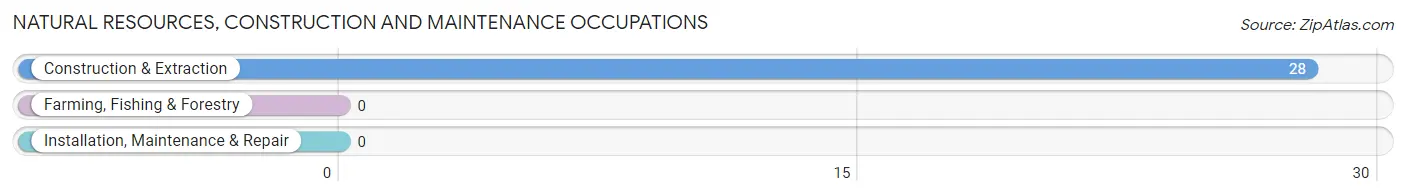
Natural Resources, Construction and Maintenance Occupations
The most common Natural Resources, Construction and Maintenance occupations in Bluebell are , and Construction & Extraction (28 | 21.2%).
Natural Resources, Construction and Maintenance Occupations by Sex
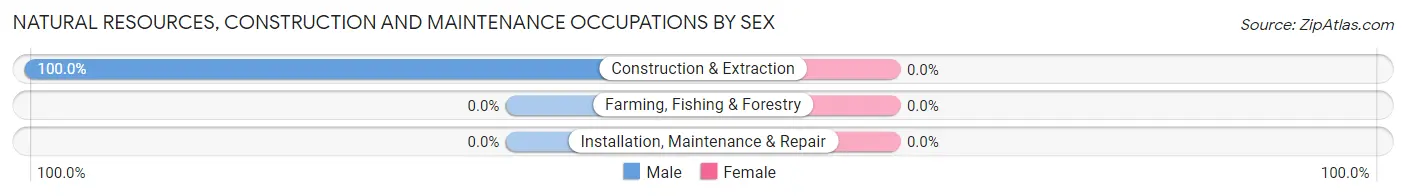
| Occupation | Male | Female |
| Farming, Fishing & Forestry | 0 (0.0%) | 0 (0.0%) |
| Construction & Extraction | 28 (100.0%) | 0 (0.0%) |
| Installation, Maintenance & Repair | 0 (0.0%) | 0 (0.0%) |
| Total (Category) | 28 (100.0%) | 0 (0.0%) |
| Total (Overall) | 66 (50.0%) | 66 (50.0%) |
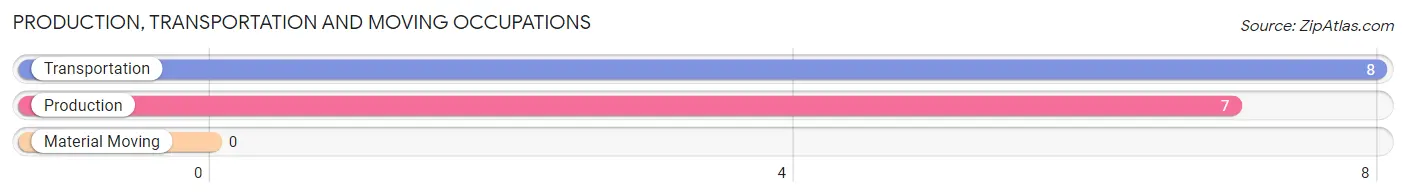
Production, Transportation and Moving Occupations
The most common Production, Transportation and Moving occupations in Bluebell are Transportation (8 | 6.1%), and Production (7 | 5.3%).
Production, Transportation and Moving Occupations by Sex
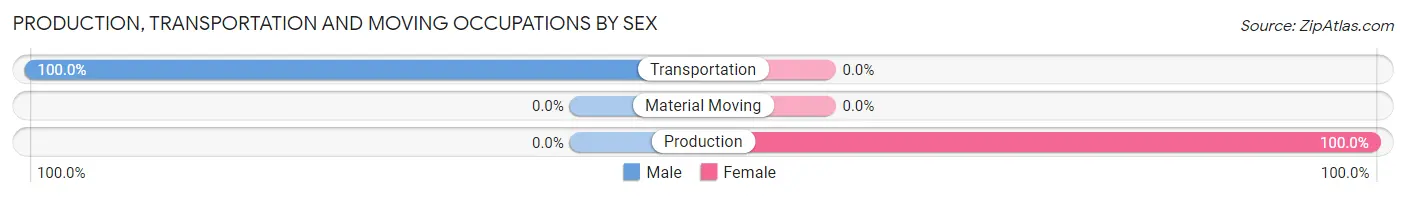
| Occupation | Male | Female |
| Production | 0 (0.0%) | 7 (100.0%) |
| Transportation | 8 (100.0%) | 0 (0.0%) |
| Material Moving | 0 (0.0%) | 0 (0.0%) |
| Total (Category) | 8 (53.3%) | 7 (46.7%) |
| Total (Overall) | 66 (50.0%) | 66 (50.0%) |
Employment Industries by Sex in Bluebell
Employment Industries in Bluebell
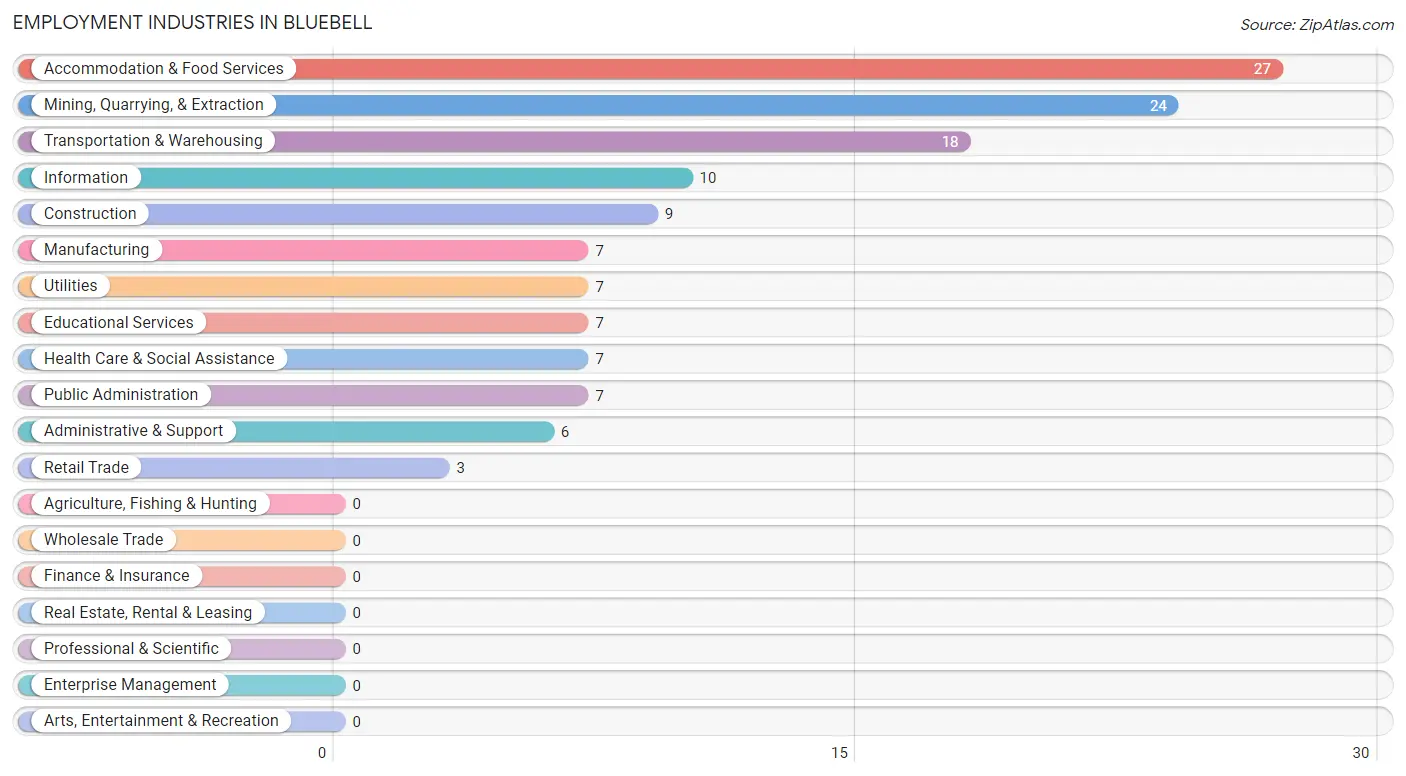
The major employment industries in Bluebell include Accommodation & Food Services (27 | 20.4%), Mining, Quarrying, & Extraction (24 | 18.2%), Transportation & Warehousing (18 | 13.6%), Information (10 | 7.6%), and Construction (9 | 6.8%).
Employment Industries by Sex in Bluebell
The Bluebell industries that see more men than women are Mining, Quarrying, & Extraction (100.0%), Retail Trade (100.0%), and Utilities (100.0%), whereas the industries that tend to have a higher number of women are Manufacturing (100.0%), Educational Services (100.0%), and Health Care & Social Assistance (100.0%).
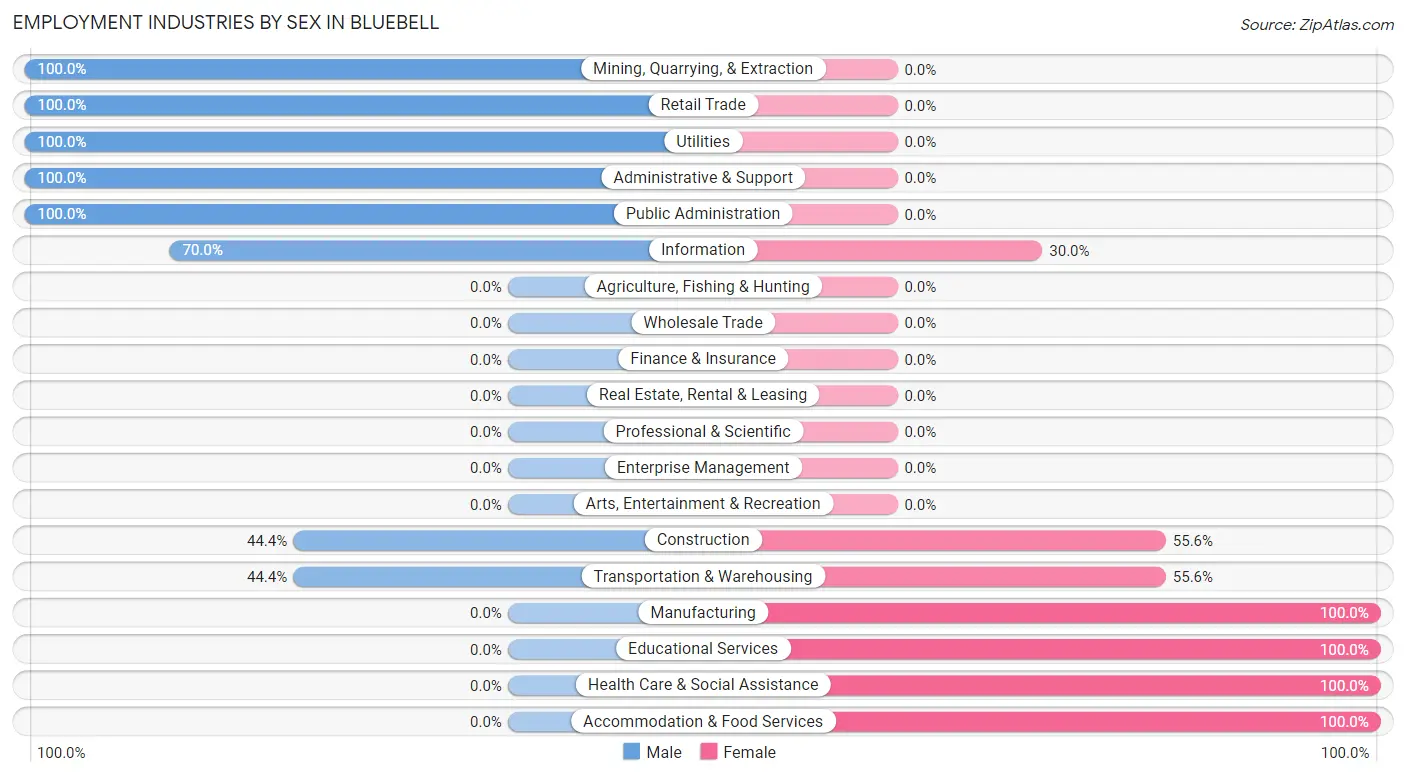
| Industry | Male | Female |
| Agriculture, Fishing & Hunting | 0 (0.0%) | 0 (0.0%) |
| Mining, Quarrying, & Extraction | 24 (100.0%) | 0 (0.0%) |
| Construction | 4 (44.4%) | 5 (55.6%) |
| Manufacturing | 0 (0.0%) | 7 (100.0%) |
| Wholesale Trade | 0 (0.0%) | 0 (0.0%) |
| Retail Trade | 3 (100.0%) | 0 (0.0%) |
| Transportation & Warehousing | 8 (44.4%) | 10 (55.6%) |
| Utilities | 7 (100.0%) | 0 (0.0%) |
| Information | 7 (70.0%) | 3 (30.0%) |
| Finance & Insurance | 0 (0.0%) | 0 (0.0%) |
| Real Estate, Rental & Leasing | 0 (0.0%) | 0 (0.0%) |
| Professional & Scientific | 0 (0.0%) | 0 (0.0%) |
| Enterprise Management | 0 (0.0%) | 0 (0.0%) |
| Administrative & Support | 6 (100.0%) | 0 (0.0%) |
| Educational Services | 0 (0.0%) | 7 (100.0%) |
| Health Care & Social Assistance | 0 (0.0%) | 7 (100.0%) |
| Arts, Entertainment & Recreation | 0 (0.0%) | 0 (0.0%) |
| Accommodation & Food Services | 0 (0.0%) | 27 (100.0%) |
| Public Administration | 7 (100.0%) | 0 (0.0%) |
| Total | 66 (50.0%) | 66 (50.0%) |
Education in Bluebell
School Enrollment in Bluebell
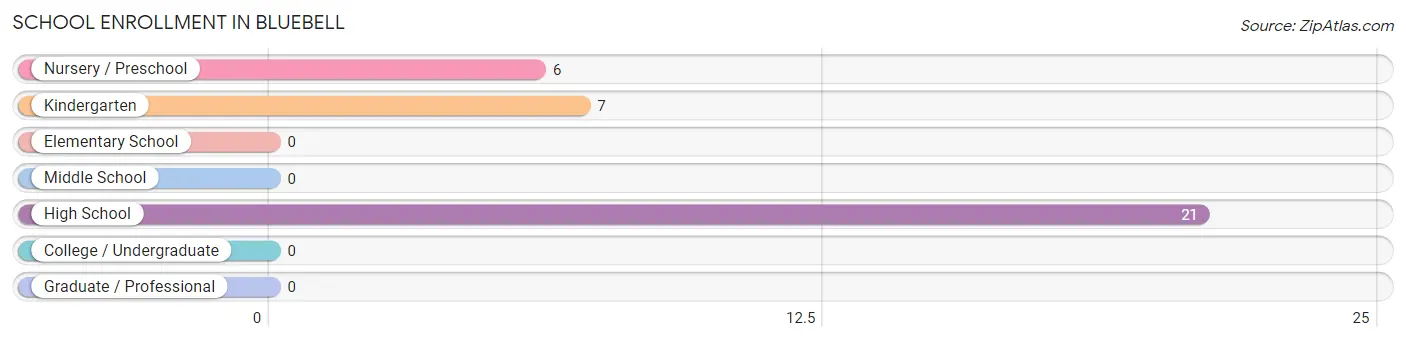
The most common levels of schooling among the 34 students in Bluebell are high school (21 | 61.8%), kindergarten (7 | 20.6%), and nursery / preschool (6 | 17.6%).
| School Level | # Students | % Students |
| Nursery / Preschool | 6 | 17.6% |
| Kindergarten | 7 | 20.6% |
| Elementary School | 0 | 0.0% |
| Middle School | 0 | 0.0% |
| High School | 21 | 61.8% |
| College / Undergraduate | 0 | 0.0% |
| Graduate / Professional | 0 | 0.0% |
| Total | 34 | 100.0% |
School Enrollment by Age by Funding Source in Bluebell
Out of a total of 34 students who are enrolled in schools in Bluebell, 6 (17.6%) attend a private institution, while the remaining 28 (82.4%) are enrolled in public schools. The age group of 3 to 4 year olds has the highest likelihood of being enrolled in private schools, with 6 (100.0% in the age bracket) enrolled. Conversely, the age group of 5 to 9 year old has the lowest likelihood of being enrolled in a private school, with 7 (100.0% in the age bracket) attending a public institution.
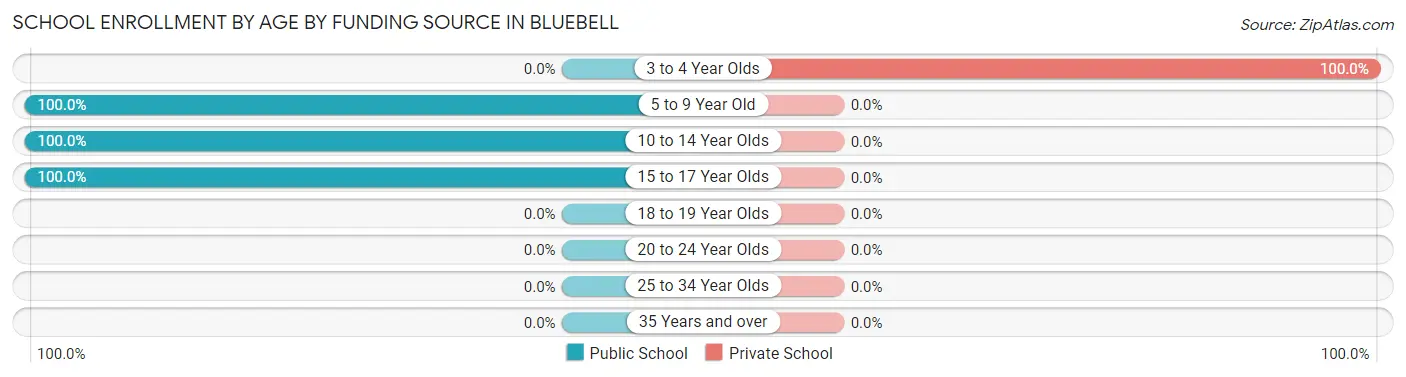
| Age Bracket | Public School | Private School |
| 3 to 4 Year Olds | 0 (0.0%) | 6 (100.0%) |
| 5 to 9 Year Old | 7 (100.0%) | 0 (0.0%) |
| 10 to 14 Year Olds | 7 (100.0%) | 0 (0.0%) |
| 15 to 17 Year Olds | 14 (100.0%) | 0 (0.0%) |
| 18 to 19 Year Olds | 0 (0.0%) | 0 (0.0%) |
| 20 to 24 Year Olds | 0 (0.0%) | 0 (0.0%) |
| 25 to 34 Year Olds | 0 (0.0%) | 0 (0.0%) |
| 35 Years and over | 0 (0.0%) | 0 (0.0%) |
| Total | 28 (82.4%) | 6 (17.6%) |
Educational Attainment by Field of Study in Bluebell
Education (12 | 40.0%), psychology (7 | 23.3%), computers & mathematics (6 | 20.0%), and arts & humanities (5 | 16.7%) are the most common fields of study among 30 individuals in Bluebell who have obtained a bachelor's degree or higher.
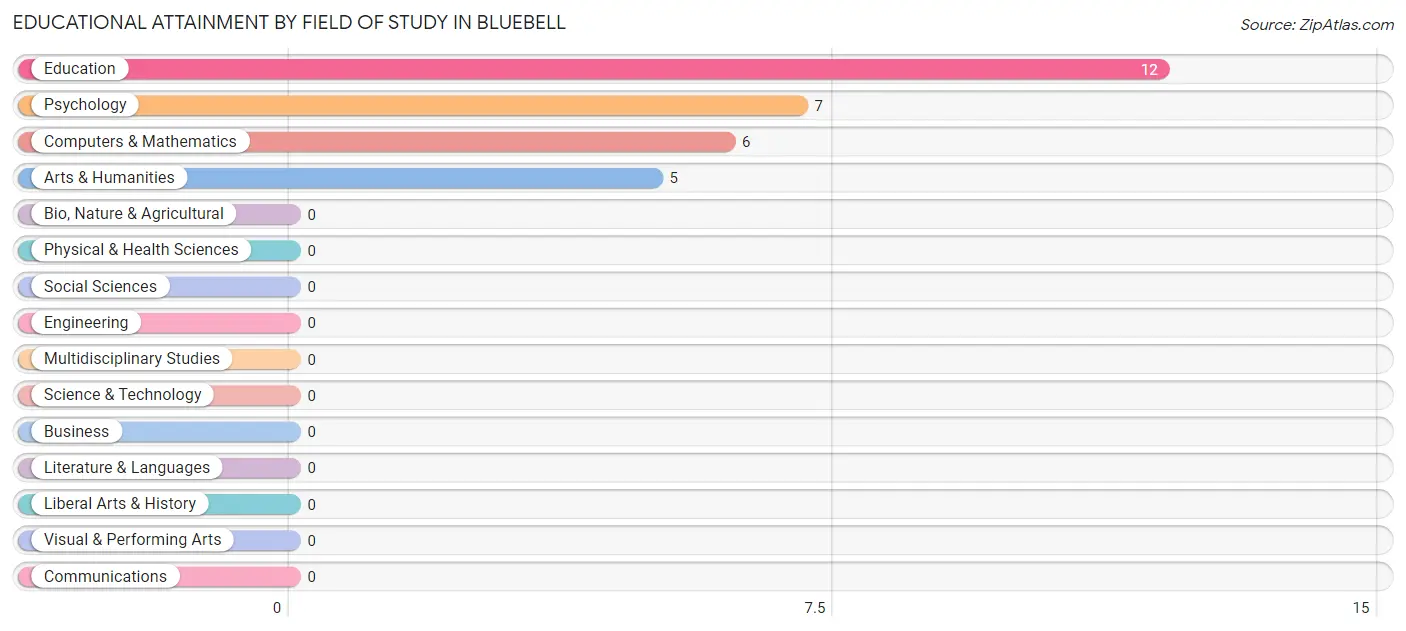
| Field of Study | # Graduates | % Graduates |
| Computers & Mathematics | 6 | 20.0% |
| Bio, Nature & Agricultural | 0 | 0.0% |
| Physical & Health Sciences | 0 | 0.0% |
| Psychology | 7 | 23.3% |
| Social Sciences | 0 | 0.0% |
| Engineering | 0 | 0.0% |
| Multidisciplinary Studies | 0 | 0.0% |
| Science & Technology | 0 | 0.0% |
| Business | 0 | 0.0% |
| Education | 12 | 40.0% |
| Literature & Languages | 0 | 0.0% |
| Liberal Arts & History | 0 | 0.0% |
| Visual & Performing Arts | 0 | 0.0% |
| Communications | 0 | 0.0% |
| Arts & Humanities | 5 | 16.7% |
| Total | 30 | 100.0% |
Transportation & Commute in Bluebell
Vehicle Availability by Sex in Bluebell
The most prevalent vehicle ownership categories in Bluebell are males with 3 vehicles (35, accounting for 53.0%) and females with 3 vehicles (39, making up 53.0%).
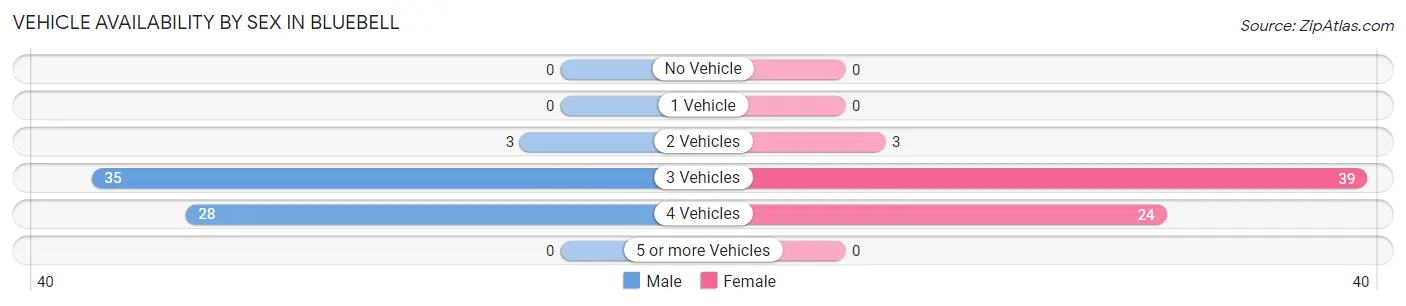
| Vehicles Available | Male | Female |
| No Vehicle | 0 (0.0%) | 0 (0.0%) |
| 1 Vehicle | 0 (0.0%) | 0 (0.0%) |
| 2 Vehicles | 3 (4.5%) | 3 (4.5%) |
| 3 Vehicles | 35 (53.0%) | 39 (59.1%) |
| 4 Vehicles | 28 (42.4%) | 24 (36.4%) |
| 5 or more Vehicles | 0 (0.0%) | 0 (0.0%) |
| Total | 66 (100.0%) | 66 (100.0%) |
Commute Time in Bluebell
The most frequently occuring commute durations in Bluebell are 30 to 34 minutes (57 commuters, 50.0%), 20 to 24 minutes (50 commuters, 43.9%), and 5 to 9 minutes (7 commuters, 6.1%).
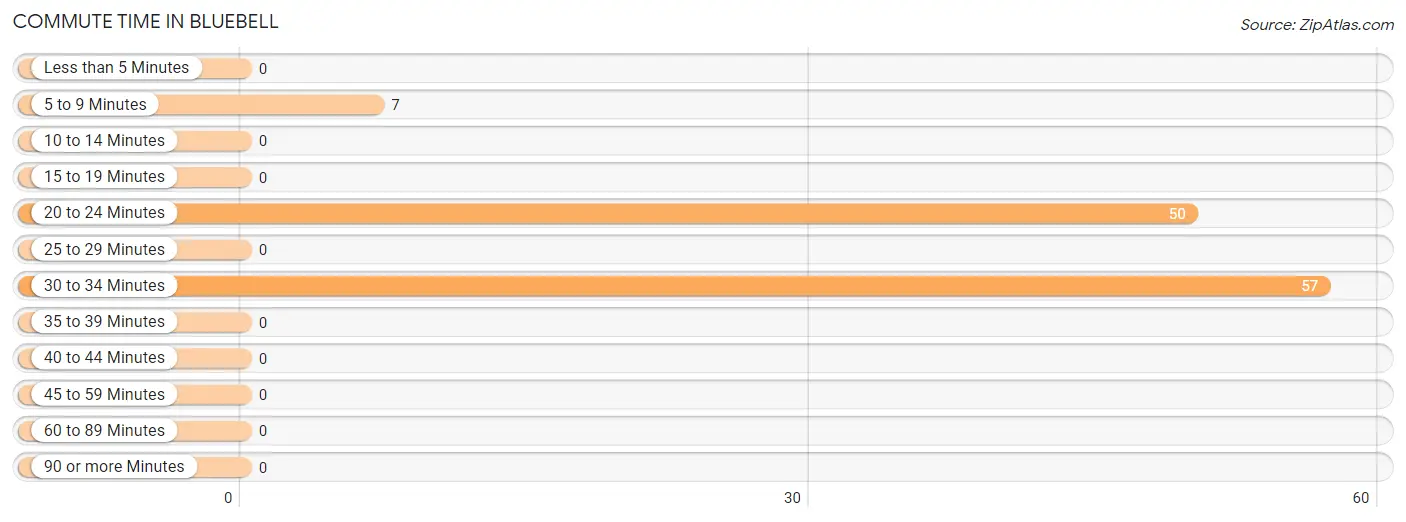
| Commute Time | # Commuters | % Commuters |
| Less than 5 Minutes | 0 | 0.0% |
| 5 to 9 Minutes | 7 | 6.1% |
| 10 to 14 Minutes | 0 | 0.0% |
| 15 to 19 Minutes | 0 | 0.0% |
| 20 to 24 Minutes | 50 | 43.9% |
| 25 to 29 Minutes | 0 | 0.0% |
| 30 to 34 Minutes | 57 | 50.0% |
| 35 to 39 Minutes | 0 | 0.0% |
| 40 to 44 Minutes | 0 | 0.0% |
| 45 to 59 Minutes | 0 | 0.0% |
| 60 to 89 Minutes | 0 | 0.0% |
| 90 or more Minutes | 0 | 0.0% |
Commute Time by Sex in Bluebell
The most common commute times in Bluebell are 20 to 24 minutes (31 commuters, 53.4%) for males and 30 to 34 minutes (30 commuters, 53.6%) for females.
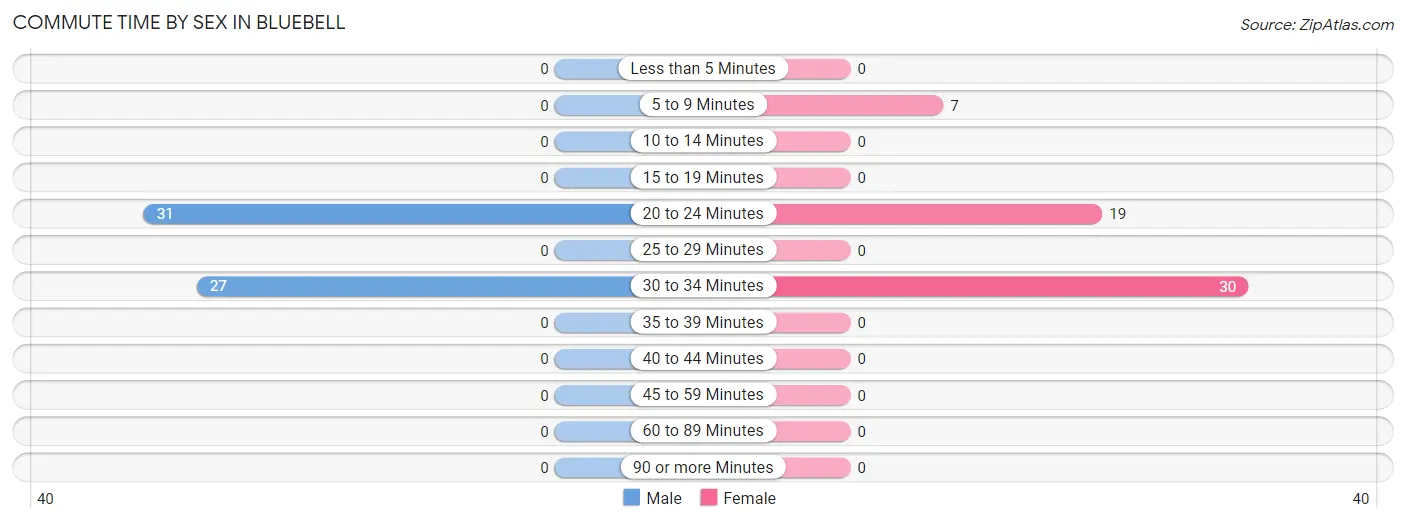
| Commute Time | Male | Female |
| Less than 5 Minutes | 0 (0.0%) | 0 (0.0%) |
| 5 to 9 Minutes | 0 (0.0%) | 7 (12.5%) |
| 10 to 14 Minutes | 0 (0.0%) | 0 (0.0%) |
| 15 to 19 Minutes | 0 (0.0%) | 0 (0.0%) |
| 20 to 24 Minutes | 31 (53.4%) | 19 (33.9%) |
| 25 to 29 Minutes | 0 (0.0%) | 0 (0.0%) |
| 30 to 34 Minutes | 27 (46.6%) | 30 (53.6%) |
| 35 to 39 Minutes | 0 (0.0%) | 0 (0.0%) |
| 40 to 44 Minutes | 0 (0.0%) | 0 (0.0%) |
| 45 to 59 Minutes | 0 (0.0%) | 0 (0.0%) |
| 60 to 89 Minutes | 0 (0.0%) | 0 (0.0%) |
| 90 or more Minutes | 0 (0.0%) | 0 (0.0%) |
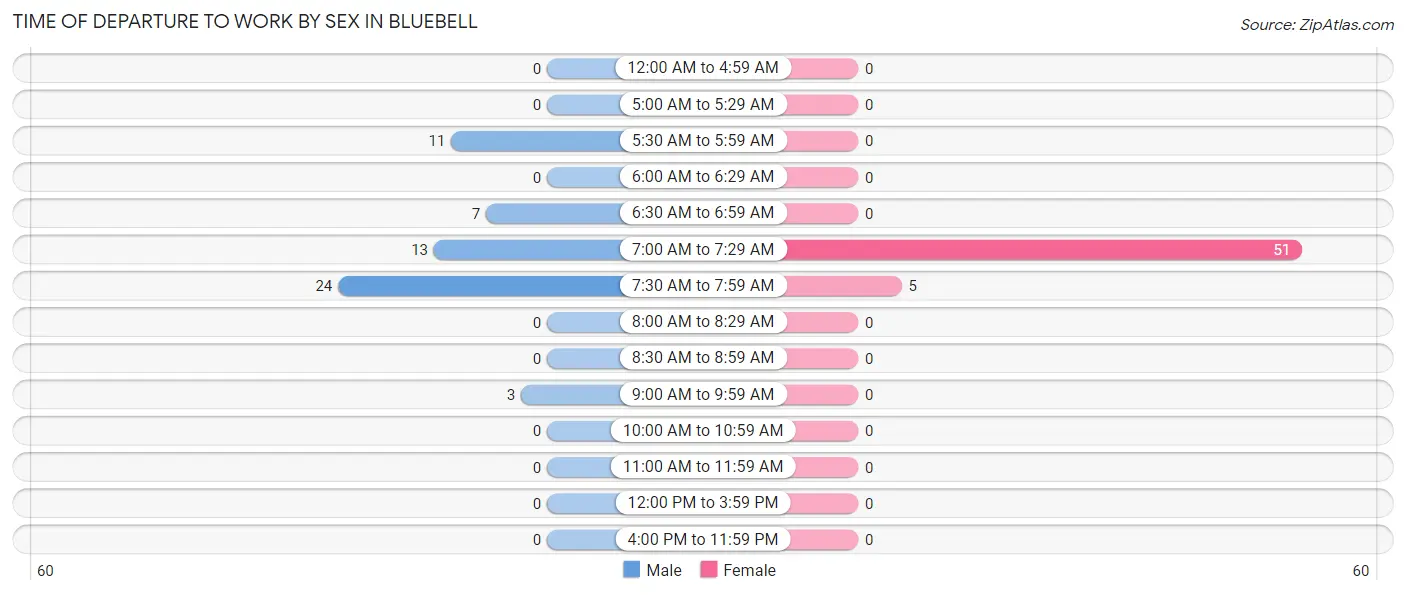
Time of Departure to Work by Sex in Bluebell
The most frequent times of departure to work in Bluebell are 7:30 AM to 7:59 AM (24, 41.4%) for males and 7:00 AM to 7:29 AM (51, 91.1%) for females.
| Time of Departure | Male | Female |
| 12:00 AM to 4:59 AM | 0 (0.0%) | 0 (0.0%) |
| 5:00 AM to 5:29 AM | 0 (0.0%) | 0 (0.0%) |
| 5:30 AM to 5:59 AM | 11 (19.0%) | 0 (0.0%) |
| 6:00 AM to 6:29 AM | 0 (0.0%) | 0 (0.0%) |
| 6:30 AM to 6:59 AM | 7 (12.1%) | 0 (0.0%) |
| 7:00 AM to 7:29 AM | 13 (22.4%) | 51 (91.1%) |
| 7:30 AM to 7:59 AM | 24 (41.4%) | 5 (8.9%) |
| 8:00 AM to 8:29 AM | 0 (0.0%) | 0 (0.0%) |
| 8:30 AM to 8:59 AM | 0 (0.0%) | 0 (0.0%) |
| 9:00 AM to 9:59 AM | 3 (5.2%) | 0 (0.0%) |
| 10:00 AM to 10:59 AM | 0 (0.0%) | 0 (0.0%) |
| 11:00 AM to 11:59 AM | 0 (0.0%) | 0 (0.0%) |
| 12:00 PM to 3:59 PM | 0 (0.0%) | 0 (0.0%) |
| 4:00 PM to 11:59 PM | 0 (0.0%) | 0 (0.0%) |
| Total | 58 (100.0%) | 56 (100.0%) |
Housing Occupancy in Bluebell
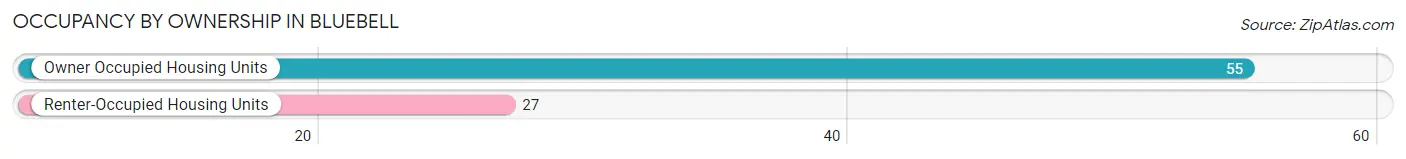
Occupancy by Ownership in Bluebell
Of the total 82 dwellings in Bluebell, owner-occupied units account for 55 (67.1%), while renter-occupied units make up 27 (32.9%).
| Occupancy | # Housing Units | % Housing Units |
| Owner Occupied Housing Units | 55 | 67.1% |
| Renter-Occupied Housing Units | 27 | 32.9% |
| Total Occupied Housing Units | 82 | 100.0% |
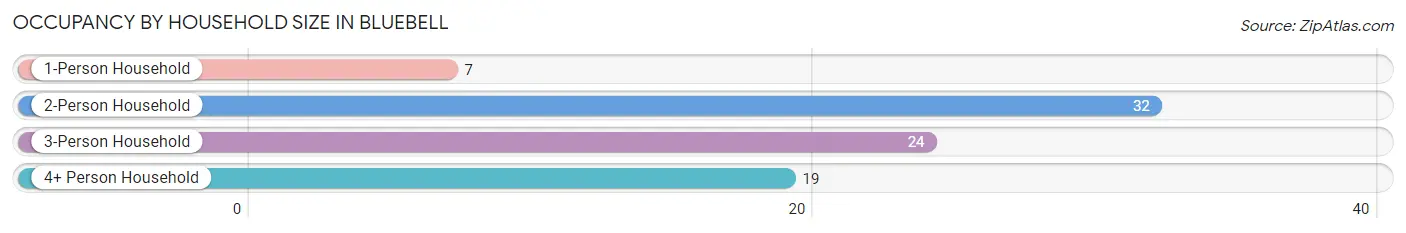
Occupancy by Household Size in Bluebell
| Household Size | # Housing Units | % Housing Units |
| 1-Person Household | 7 | 8.5% |
| 2-Person Household | 32 | 39.0% |
| 3-Person Household | 24 | 29.3% |
| 4+ Person Household | 19 | 23.2% |
| Total Housing Units | 82 | 100.0% |
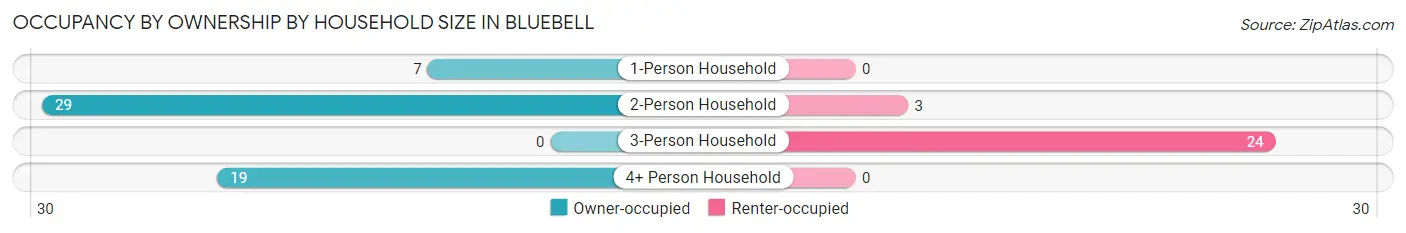
Occupancy by Ownership by Household Size in Bluebell
| Household Size | Owner-occupied | Renter-occupied |
| 1-Person Household | 7 (100.0%) | 0 (0.0%) |
| 2-Person Household | 29 (90.6%) | 3 (9.4%) |
| 3-Person Household | 0 (0.0%) | 24 (100.0%) |
| 4+ Person Household | 19 (100.0%) | 0 (0.0%) |
| Total Housing Units | 55 (67.1%) | 27 (32.9%) |
Occupancy by Educational Attainment in Bluebell
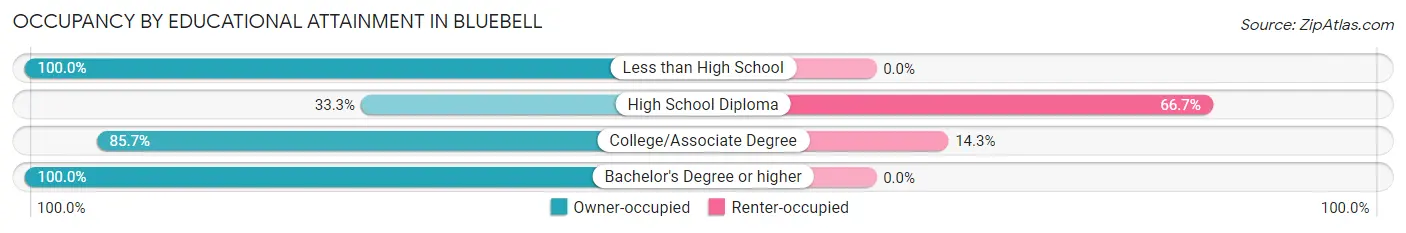
| Household Size | Owner-occupied | Renter-occupied |
| Less than High School | 5 (100.0%) | 0 (0.0%) |
| High School Diploma | 12 (33.3%) | 24 (66.7%) |
| College/Associate Degree | 18 (85.7%) | 3 (14.3%) |
| Bachelor's Degree or higher | 20 (100.0%) | 0 (0.0%) |
Occupancy by Age of Householder in Bluebell
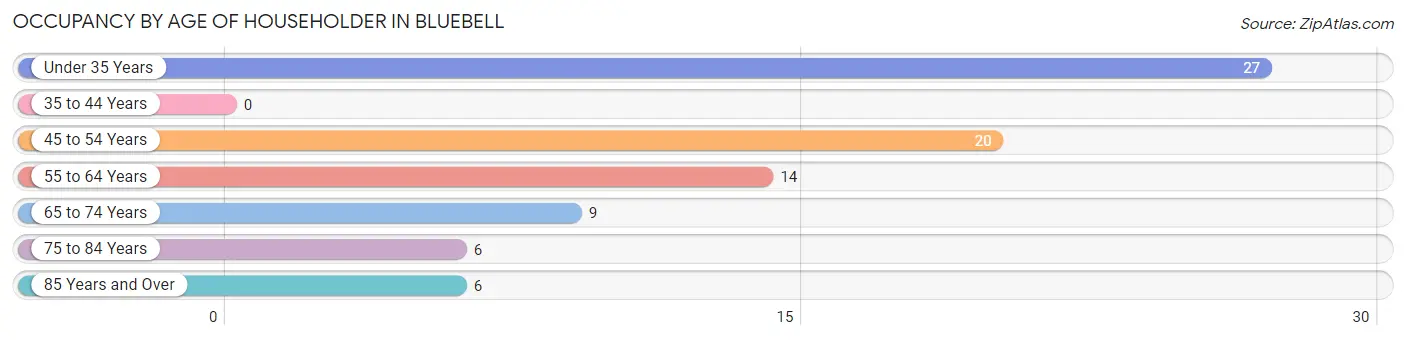
| Age Bracket | # Households | % Households |
| Under 35 Years | 27 | 32.9% |
| 35 to 44 Years | 0 | 0.0% |
| 45 to 54 Years | 20 | 24.4% |
| 55 to 64 Years | 14 | 17.1% |
| 65 to 74 Years | 9 | 11.0% |
| 75 to 84 Years | 6 | 7.3% |
| 85 Years and Over | 6 | 7.3% |
| Total | 82 | 100.0% |
Housing Finances in Bluebell
Median Income by Occupancy in Bluebell
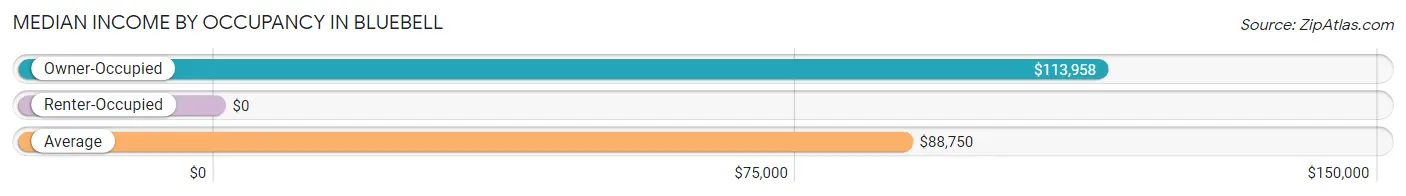
| Occupancy Type | # Households | Median Income |
| Owner-Occupied | 55 (67.1%) | $113,958 |
| Renter-Occupied | 27 (32.9%) | $0 |
| Average | 82 (100.0%) | $88,750 |
Occupancy by Householder Income Bracket in Bluebell
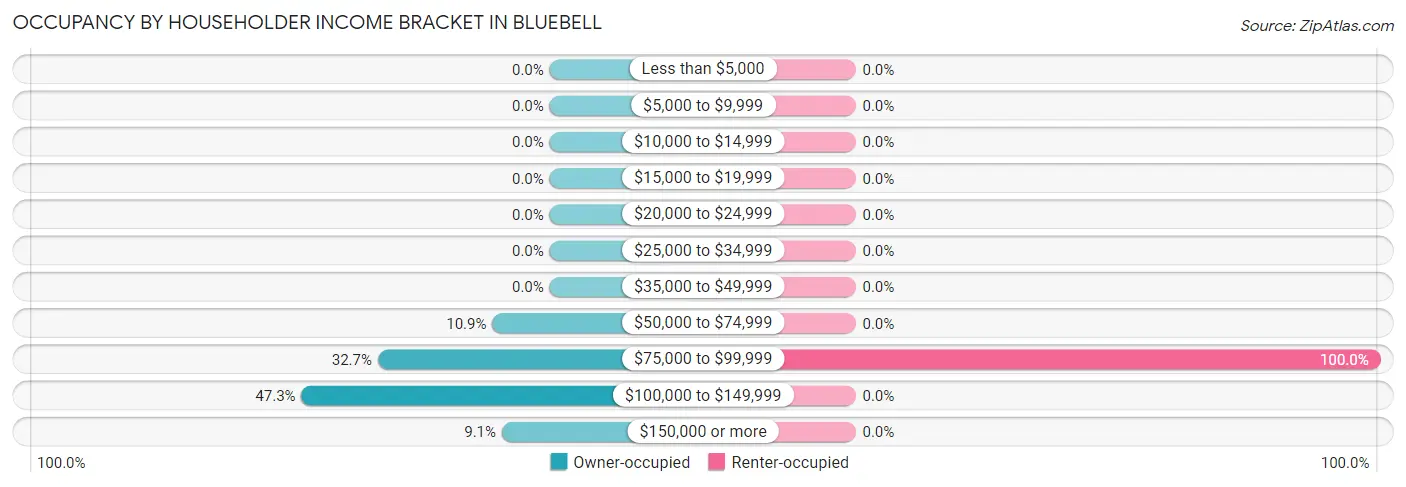
| Income Bracket | Owner-occupied | Renter-occupied |
| Less than $5,000 | 0 (0.0%) | 0 (0.0%) |
| $5,000 to $9,999 | 0 (0.0%) | 0 (0.0%) |
| $10,000 to $14,999 | 0 (0.0%) | 0 (0.0%) |
| $15,000 to $19,999 | 0 (0.0%) | 0 (0.0%) |
| $20,000 to $24,999 | 0 (0.0%) | 0 (0.0%) |
| $25,000 to $34,999 | 0 (0.0%) | 0 (0.0%) |
| $35,000 to $49,999 | 0 (0.0%) | 0 (0.0%) |
| $50,000 to $74,999 | 6 (10.9%) | 0 (0.0%) |
| $75,000 to $99,999 | 18 (32.7%) | 27 (100.0%) |
| $100,000 to $149,999 | 26 (47.3%) | 0 (0.0%) |
| $150,000 or more | 5 (9.1%) | 0 (0.0%) |
| Total | 55 (100.0%) | 27 (100.0%) |
Monthly Housing Cost Tiers in Bluebell
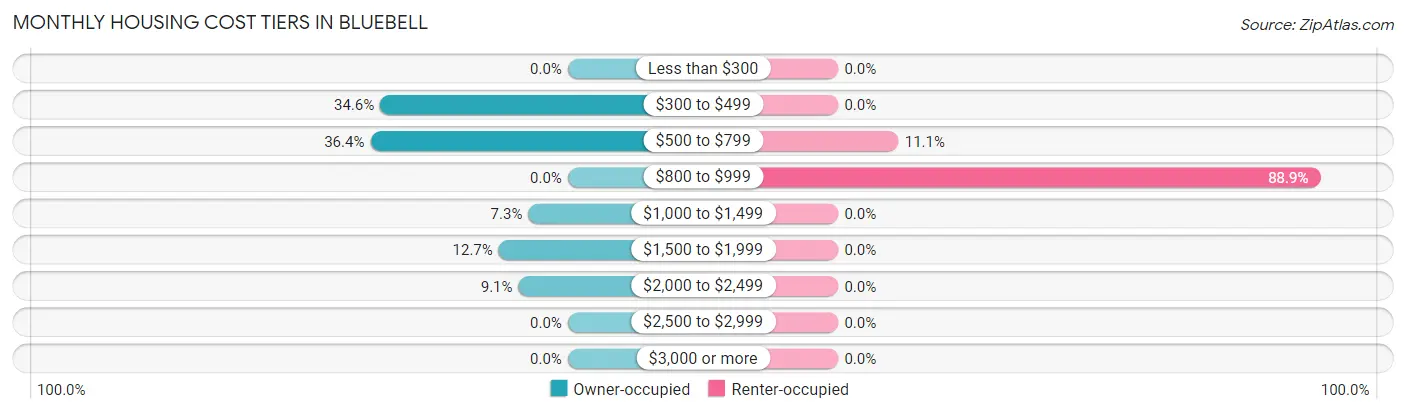
| Monthly Cost | Owner-occupied | Renter-occupied |
| Less than $300 | 0 (0.0%) | 0 (0.0%) |
| $300 to $499 | 19 (34.5%) | 0 (0.0%) |
| $500 to $799 | 20 (36.4%) | 3 (11.1%) |
| $800 to $999 | 0 (0.0%) | 24 (88.9%) |
| $1,000 to $1,499 | 4 (7.3%) | 0 (0.0%) |
| $1,500 to $1,999 | 7 (12.7%) | 0 (0.0%) |
| $2,000 to $2,499 | 5 (9.1%) | 0 (0.0%) |
| $2,500 to $2,999 | 0 (0.0%) | 0 (0.0%) |
| $3,000 or more | 0 (0.0%) | 0 (0.0%) |
| Total | 55 (100.0%) | 27 (100.0%) |
Physical Housing Characteristics in Bluebell
Housing Structures in Bluebell
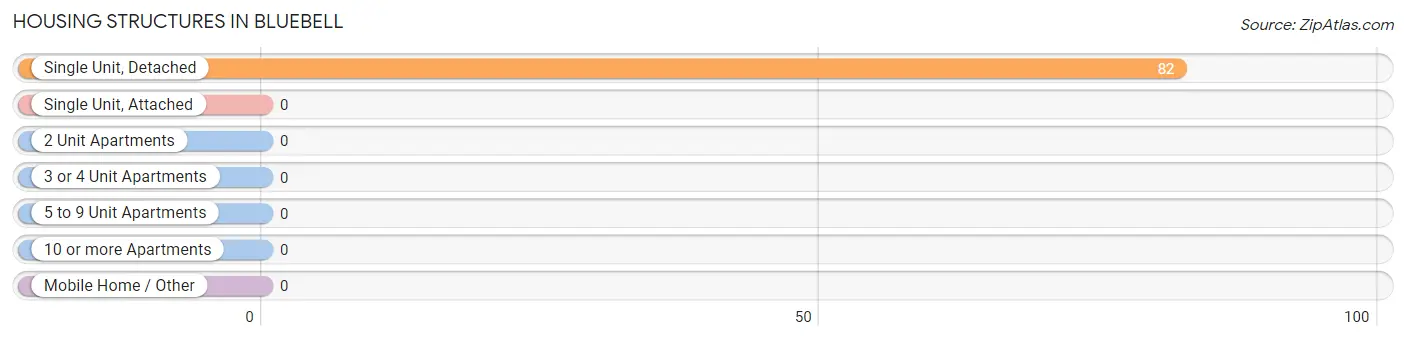
| Structure Type | # Housing Units | % Housing Units |
| Single Unit, Detached | 82 | 100.0% |
| Single Unit, Attached | 0 | 0.0% |
| 2 Unit Apartments | 0 | 0.0% |
| 3 or 4 Unit Apartments | 0 | 0.0% |
| 5 to 9 Unit Apartments | 0 | 0.0% |
| 10 or more Apartments | 0 | 0.0% |
| Mobile Home / Other | 0 | 0.0% |
| Total | 82 | 100.0% |
Housing Structures by Occupancy in Bluebell
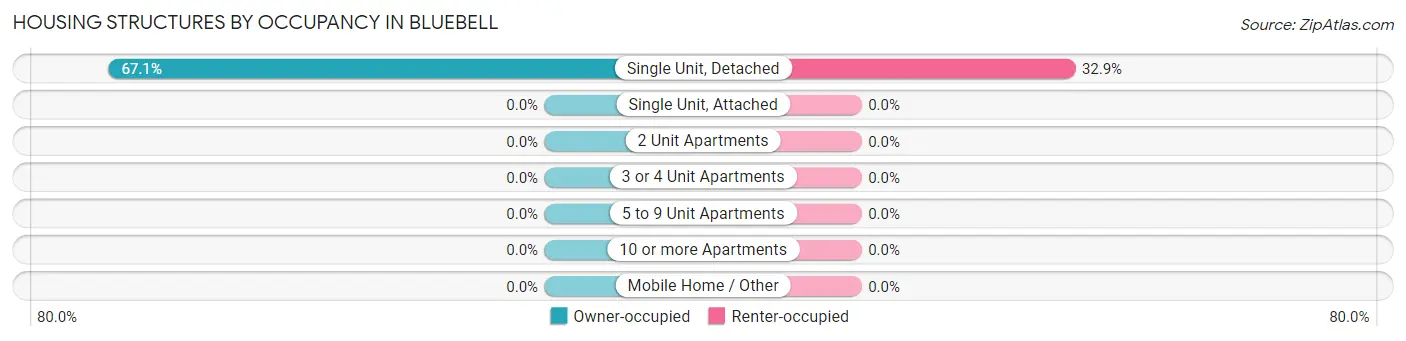
| Structure Type | Owner-occupied | Renter-occupied |
| Single Unit, Detached | 55 (67.1%) | 27 (32.9%) |
| Single Unit, Attached | 0 (0.0%) | 0 (0.0%) |
| 2 Unit Apartments | 0 (0.0%) | 0 (0.0%) |
| 3 or 4 Unit Apartments | 0 (0.0%) | 0 (0.0%) |
| 5 to 9 Unit Apartments | 0 (0.0%) | 0 (0.0%) |
| 10 or more Apartments | 0 (0.0%) | 0 (0.0%) |
| Mobile Home / Other | 0 (0.0%) | 0 (0.0%) |
| Total | 55 (67.1%) | 27 (32.9%) |
Housing Structures by Number of Rooms in Bluebell
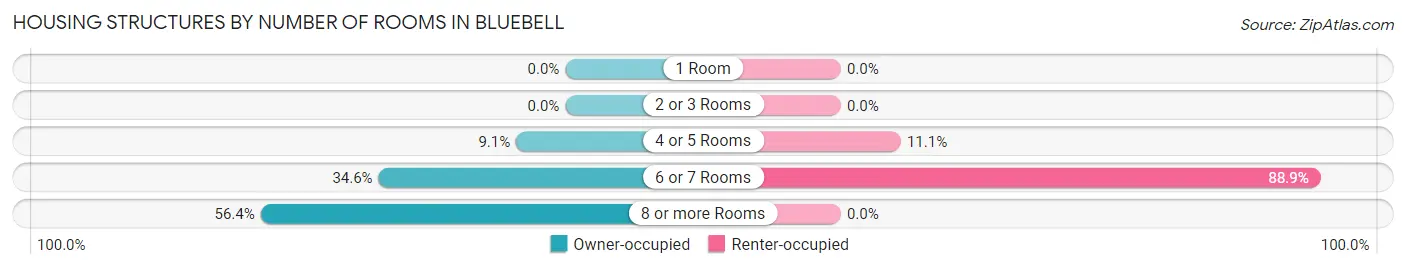
| Number of Rooms | Owner-occupied | Renter-occupied |
| 1 Room | 0 (0.0%) | 0 (0.0%) |
| 2 or 3 Rooms | 0 (0.0%) | 0 (0.0%) |
| 4 or 5 Rooms | 5 (9.1%) | 3 (11.1%) |
| 6 or 7 Rooms | 19 (34.5%) | 24 (88.9%) |
| 8 or more Rooms | 31 (56.4%) | 0 (0.0%) |
| Total | 55 (100.0%) | 27 (100.0%) |
Housing Structure by Heating Type in Bluebell
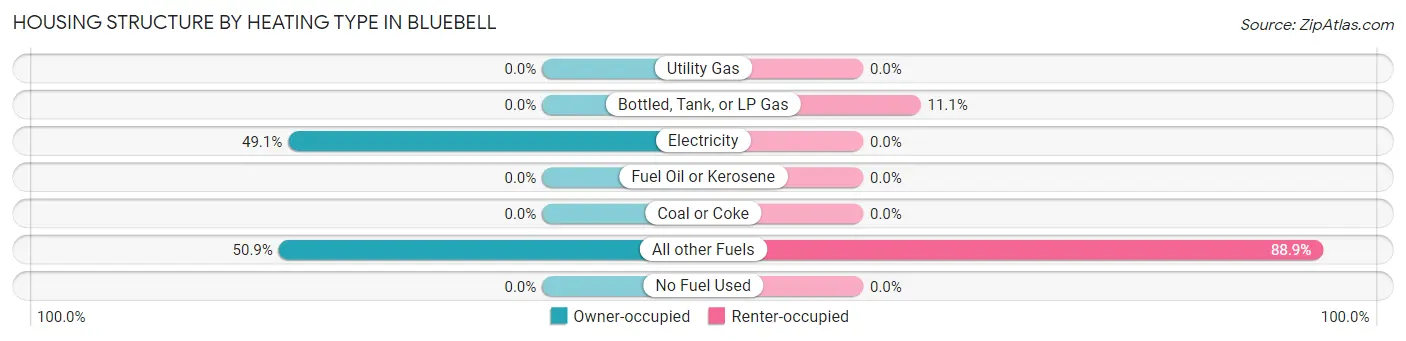
| Heating Type | Owner-occupied | Renter-occupied |
| Utility Gas | 0 (0.0%) | 0 (0.0%) |
| Bottled, Tank, or LP Gas | 0 (0.0%) | 3 (11.1%) |
| Electricity | 27 (49.1%) | 0 (0.0%) |
| Fuel Oil or Kerosene | 0 (0.0%) | 0 (0.0%) |
| Coal or Coke | 0 (0.0%) | 0 (0.0%) |
| All other Fuels | 28 (50.9%) | 24 (88.9%) |
| No Fuel Used | 0 (0.0%) | 0 (0.0%) |
| Total | 55 (100.0%) | 27 (100.0%) |
Household Vehicle Usage in Bluebell
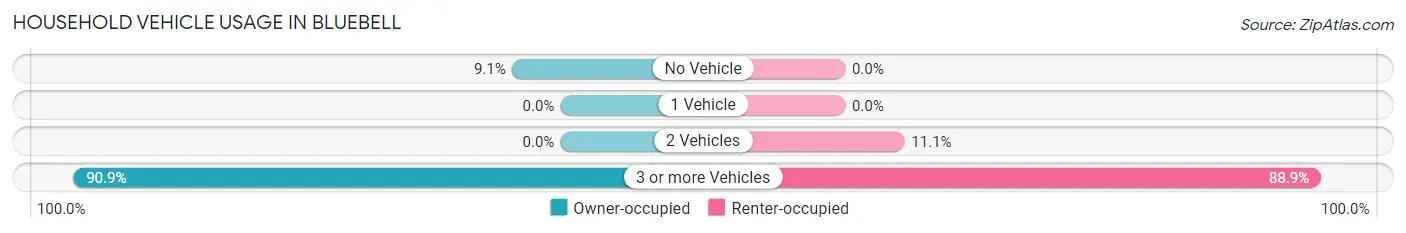
| Vehicles per Household | Owner-occupied | Renter-occupied |
| No Vehicle | 5 (9.1%) | 0 (0.0%) |
| 1 Vehicle | 0 (0.0%) | 0 (0.0%) |
| 2 Vehicles | 0 (0.0%) | 3 (11.1%) |
| 3 or more Vehicles | 50 (90.9%) | 24 (88.9%) |
| Total | 55 (100.0%) | 27 (100.0%) |
Real Estate & Mortgages in Bluebell
Real Estate and Mortgage Overview in Bluebell
| Characteristic | Without Mortgage | With Mortgage |
| Housing Units | 39 | 16 |
| Median Property Value | $289,300 | $311,100 |
| Median Household Income | $117,656 | $5 |
| Monthly Housing Costs | $504 | $0 |
| Real Estate Taxes | $1,750 | $0 |
Property Value by Mortgage Status in Bluebell
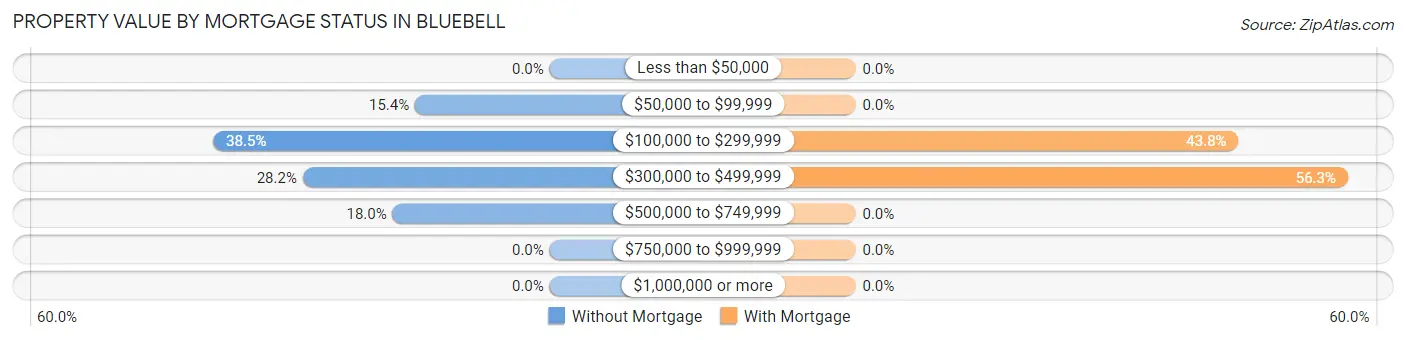
| Property Value | Without Mortgage | With Mortgage |
| Less than $50,000 | 0 (0.0%) | 0 (0.0%) |
| $50,000 to $99,999 | 6 (15.4%) | 0 (0.0%) |
| $100,000 to $299,999 | 15 (38.5%) | 7 (43.8%) |
| $300,000 to $499,999 | 11 (28.2%) | 9 (56.2%) |
| $500,000 to $749,999 | 7 (17.9%) | 0 (0.0%) |
| $750,000 to $999,999 | 0 (0.0%) | 0 (0.0%) |
| $1,000,000 or more | 0 (0.0%) | 0 (0.0%) |
| Total | 39 (100.0%) | 16 (100.0%) |
Household Income by Mortgage Status in Bluebell
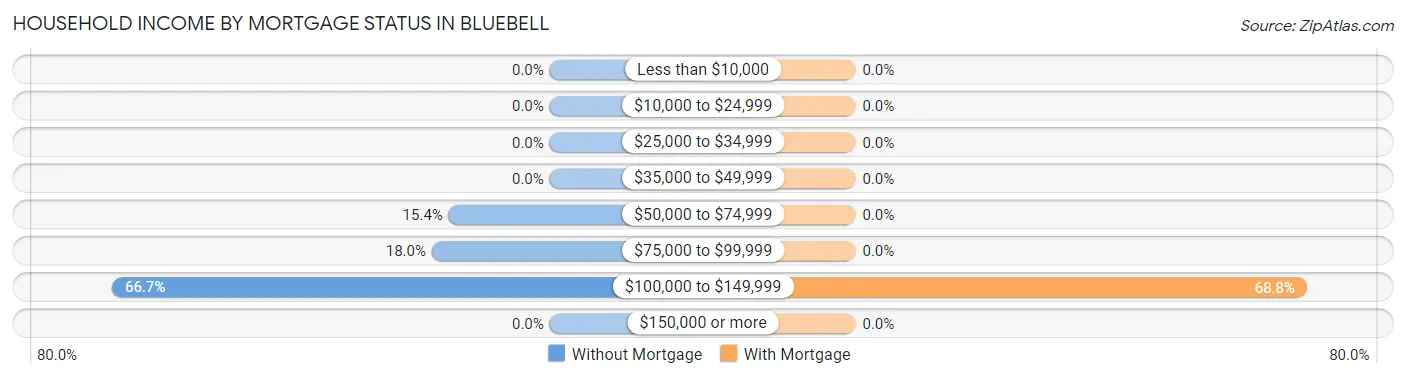
| Household Income | Without Mortgage | With Mortgage |
| Less than $10,000 | 0 (0.0%) | 0 (0.0%) |
| $10,000 to $24,999 | 0 (0.0%) | 0 (0.0%) |
| $25,000 to $34,999 | 0 (0.0%) | 0 (0.0%) |
| $35,000 to $49,999 | 0 (0.0%) | 0 (0.0%) |
| $50,000 to $74,999 | 6 (15.4%) | 0 (0.0%) |
| $75,000 to $99,999 | 7 (17.9%) | 0 (0.0%) |
| $100,000 to $149,999 | 26 (66.7%) | 11 (68.8%) |
| $150,000 or more | 0 (0.0%) | 0 (0.0%) |
| Total | 39 (100.0%) | 16 (100.0%) |
Property Value to Household Income Ratio in Bluebell
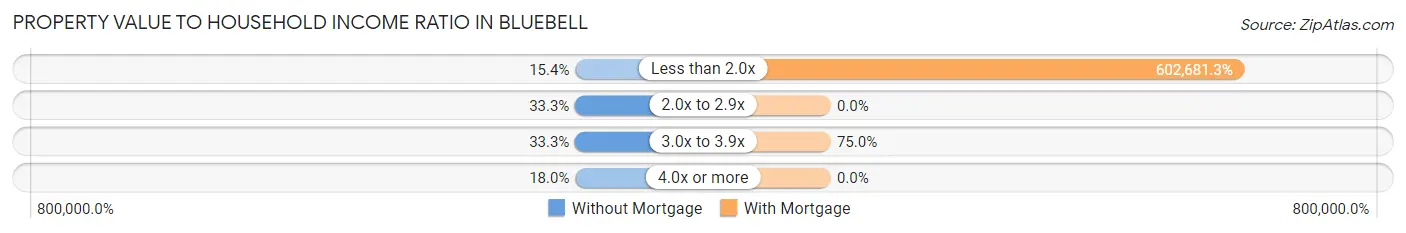
| Value-to-Income Ratio | Without Mortgage | With Mortgage |
| Less than 2.0x | 6 (15.4%) | 96,429 (602,681.2%) |
| 2.0x to 2.9x | 13 (33.3%) | 0 (0.0%) |
| 3.0x to 3.9x | 13 (33.3%) | 12 (75.0%) |
| 4.0x or more | 7 (17.9%) | 0 (0.0%) |
| Total | 39 (100.0%) | 16 (100.0%) |
Real Estate Taxes by Mortgage Status in Bluebell
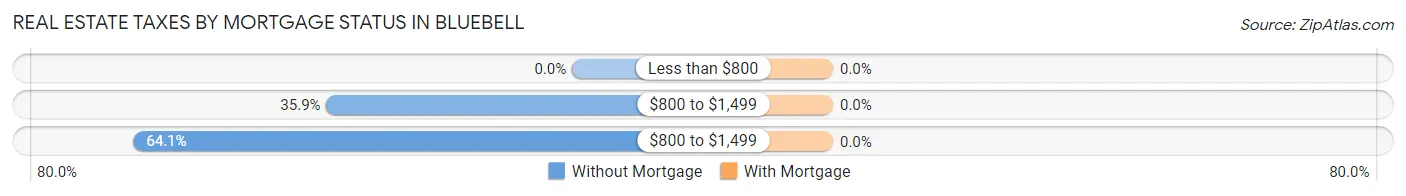
| Property Taxes | Without Mortgage | With Mortgage |
| Less than $800 | 0 (0.0%) | 0 (0.0%) |
| $800 to $1,499 | 14 (35.9%) | 0 (0.0%) |
| $800 to $1,499 | 25 (64.1%) | 0 (0.0%) |
| Total | 39 (100.0%) | 16 (100.0%) |
Health & Disability in Bluebell
Health Insurance Coverage by Age in Bluebell
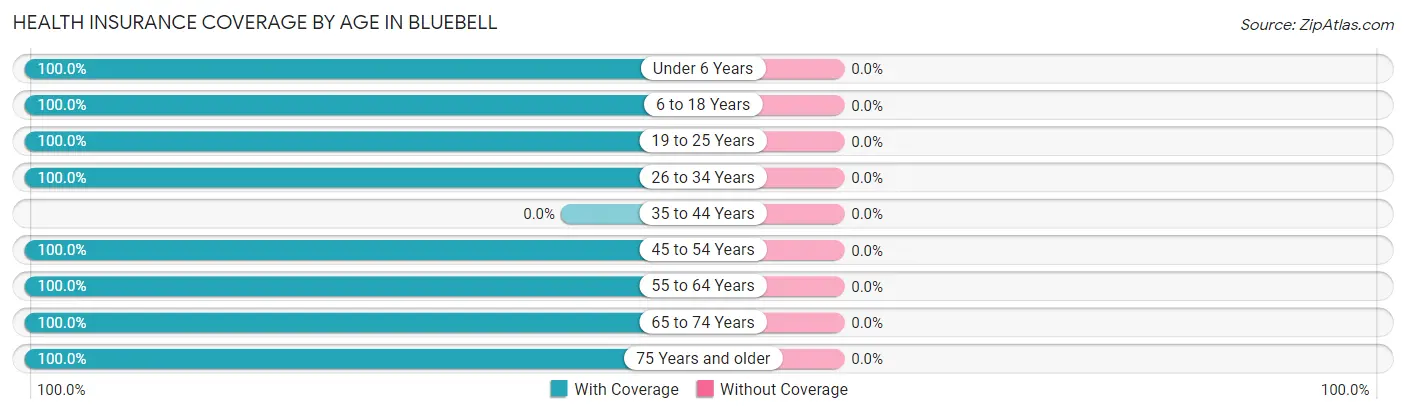
| Age Bracket | With Coverage | Without Coverage |
| Under 6 Years | 32 (100.0%) | 0 (0.0%) |
| 6 to 18 Years | 28 (100.0%) | 0 (0.0%) |
| 19 to 25 Years | 64 (100.0%) | 0 (0.0%) |
| 26 to 34 Years | 17 (100.0%) | 0 (0.0%) |
| 35 to 44 Years | 0 (0.0%) | 0 (0.0%) |
| 45 to 54 Years | 20 (100.0%) | 0 (0.0%) |
| 55 to 64 Years | 40 (100.0%) | 0 (0.0%) |
| 65 to 74 Years | 24 (100.0%) | 0 (0.0%) |
| 75 Years and older | 17 (100.0%) | 0 (0.0%) |
| Total | 242 (100.0%) | 0 (0.0%) |
Health Insurance Coverage by Citizenship Status in Bluebell
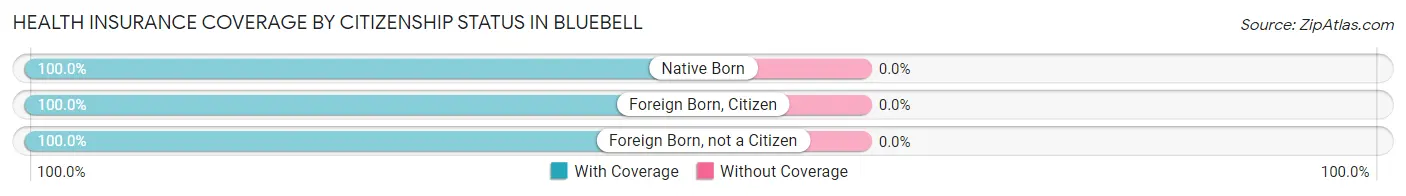
| Citizenship Status | With Coverage | Without Coverage |
| Native Born | 32 (100.0%) | 0 (0.0%) |
| Foreign Born, Citizen | 28 (100.0%) | 0 (0.0%) |
| Foreign Born, not a Citizen | 64 (100.0%) | 0 (0.0%) |
Health Insurance Coverage by Household Income in Bluebell
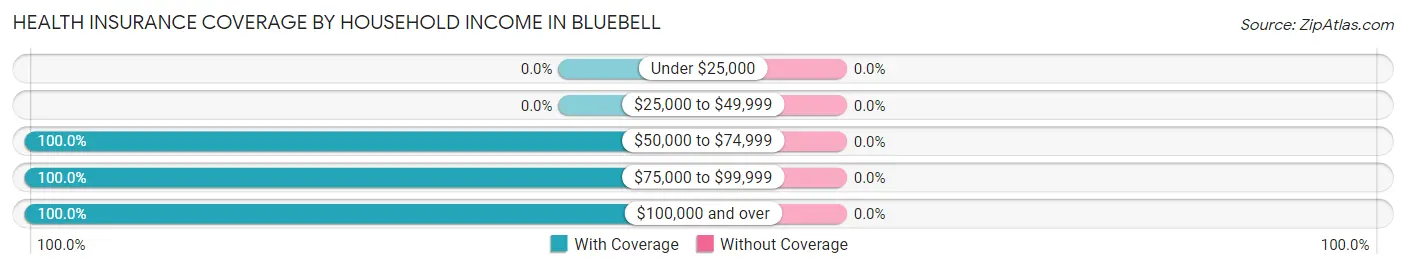
| Household Income | With Coverage | Without Coverage |
| Under $25,000 | 0 (0.0%) | 0 (0.0%) |
| $25,000 to $49,999 | 0 (0.0%) | 0 (0.0%) |
| $50,000 to $74,999 | 13 (100.0%) | 0 (0.0%) |
| $75,000 to $99,999 | 140 (100.0%) | 0 (0.0%) |
| $100,000 and over | 89 (100.0%) | 0 (0.0%) |
Public vs Private Health Insurance Coverage by Age in Bluebell
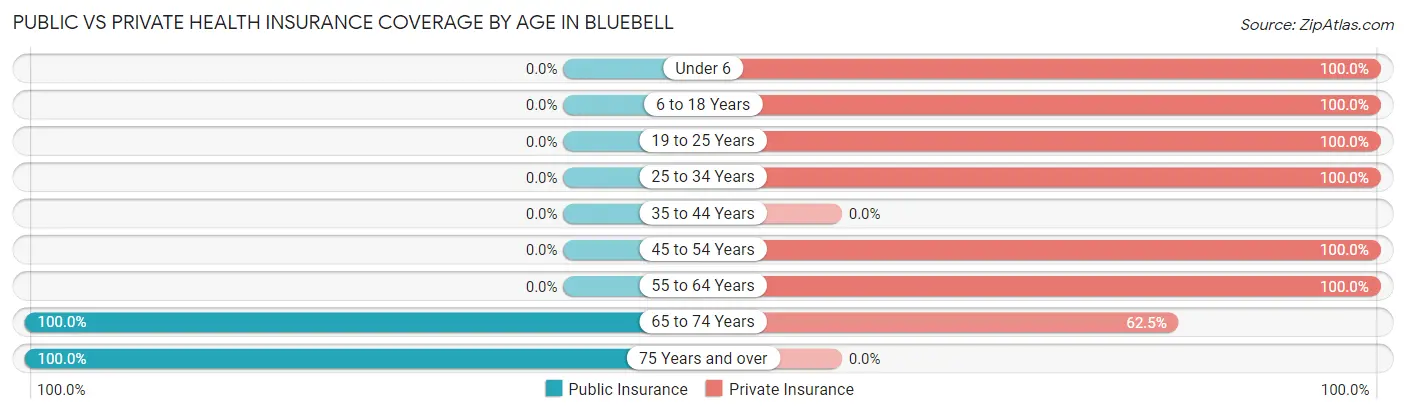
| Age Bracket | Public Insurance | Private Insurance |
| Under 6 | 0 (0.0%) | 32 (100.0%) |
| 6 to 18 Years | 0 (0.0%) | 28 (100.0%) |
| 19 to 25 Years | 0 (0.0%) | 64 (100.0%) |
| 25 to 34 Years | 0 (0.0%) | 17 (100.0%) |
| 35 to 44 Years | 0 (0.0%) | 0 (0.0%) |
| 45 to 54 Years | 0 (0.0%) | 20 (100.0%) |
| 55 to 64 Years | 0 (0.0%) | 40 (100.0%) |
| 65 to 74 Years | 24 (100.0%) | 15 (62.5%) |
| 75 Years and over | 17 (100.0%) | 0 (0.0%) |
| Total | 41 (16.9%) | 216 (89.3%) |
Disability Status by Sex by Age in Bluebell
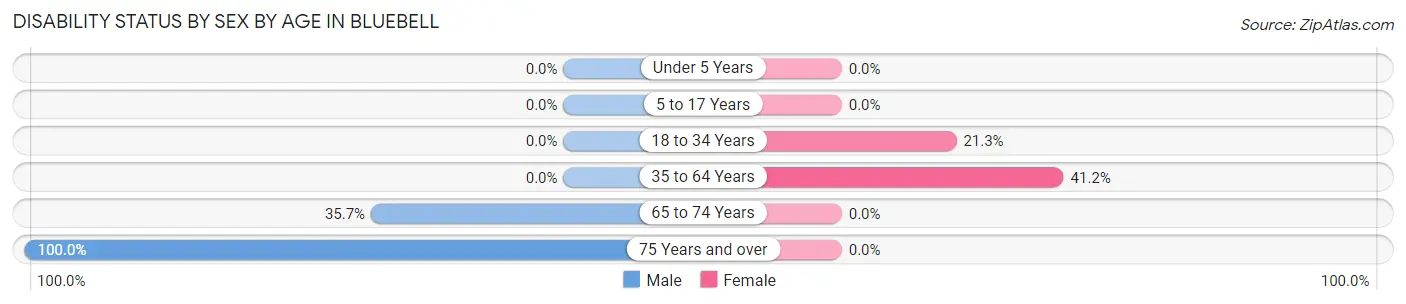
| Age Bracket | Male | Female |
| Under 5 Years | 0 (0.0%) | 0 (0.0%) |
| 5 to 17 Years | 0 (0.0%) | 0 (0.0%) |
| 18 to 34 Years | 0 (0.0%) | 10 (21.3%) |
| 35 to 64 Years | 0 (0.0%) | 14 (41.2%) |
| 65 to 74 Years | 5 (35.7%) | 0 (0.0%) |
| 75 Years and over | 12 (100.0%) | 0 (0.0%) |
Disability Class by Sex by Age in Bluebell
Disability Class: Hearing Difficulty
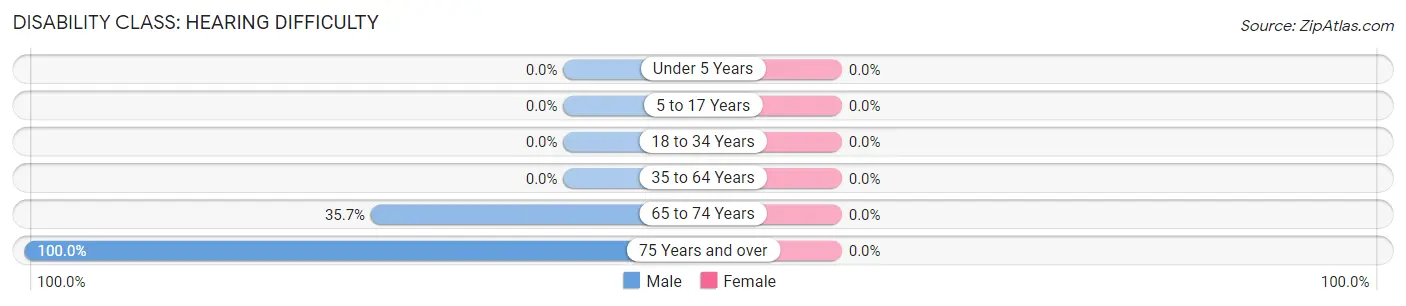
| Age Bracket | Male | Female |
| Under 5 Years | 0 (0.0%) | 0 (0.0%) |
| 5 to 17 Years | 0 (0.0%) | 0 (0.0%) |
| 18 to 34 Years | 0 (0.0%) | 0 (0.0%) |
| 35 to 64 Years | 0 (0.0%) | 0 (0.0%) |
| 65 to 74 Years | 5 (35.7%) | 0 (0.0%) |
| 75 Years and over | 12 (100.0%) | 0 (0.0%) |
Disability Class: Vision Difficulty
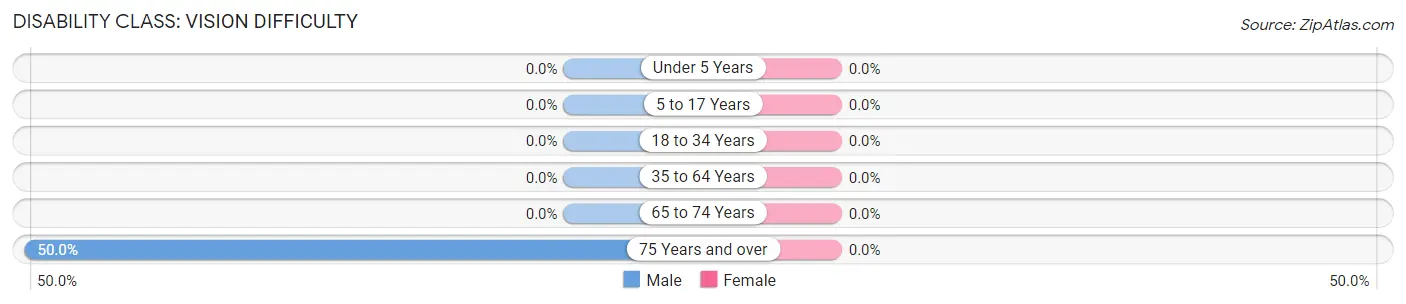
| Age Bracket | Male | Female |
| Under 5 Years | 0 (0.0%) | 0 (0.0%) |
| 5 to 17 Years | 0 (0.0%) | 0 (0.0%) |
| 18 to 34 Years | 0 (0.0%) | 0 (0.0%) |
| 35 to 64 Years | 0 (0.0%) | 0 (0.0%) |
| 65 to 74 Years | 0 (0.0%) | 0 (0.0%) |
| 75 Years and over | 6 (50.0%) | 0 (0.0%) |
Disability Class: Cognitive Difficulty
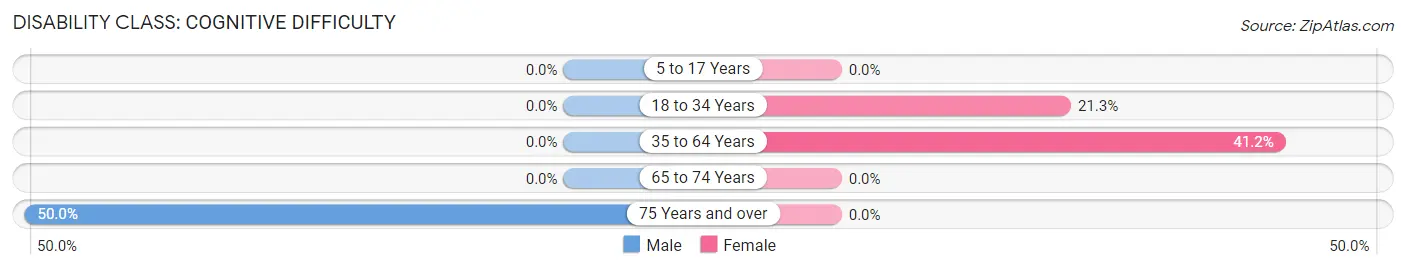
| Age Bracket | Male | Female |
| 5 to 17 Years | 0 (0.0%) | 0 (0.0%) |
| 18 to 34 Years | 0 (0.0%) | 10 (21.3%) |
| 35 to 64 Years | 0 (0.0%) | 14 (41.2%) |
| 65 to 74 Years | 0 (0.0%) | 0 (0.0%) |
| 75 Years and over | 6 (50.0%) | 0 (0.0%) |
Disability Class: Ambulatory Difficulty
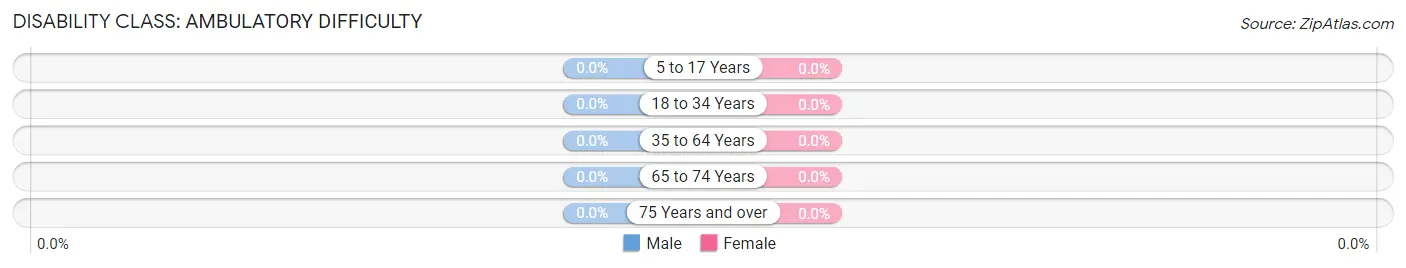
| Age Bracket | Male | Female |
| 5 to 17 Years | 0 (0.0%) | 0 (0.0%) |
| 18 to 34 Years | 0 (0.0%) | 0 (0.0%) |
| 35 to 64 Years | 0 (0.0%) | 0 (0.0%) |
| 65 to 74 Years | 0 (0.0%) | 0 (0.0%) |
| 75 Years and over | 0 (0.0%) | 0 (0.0%) |
Disability Class: Self-Care Difficulty
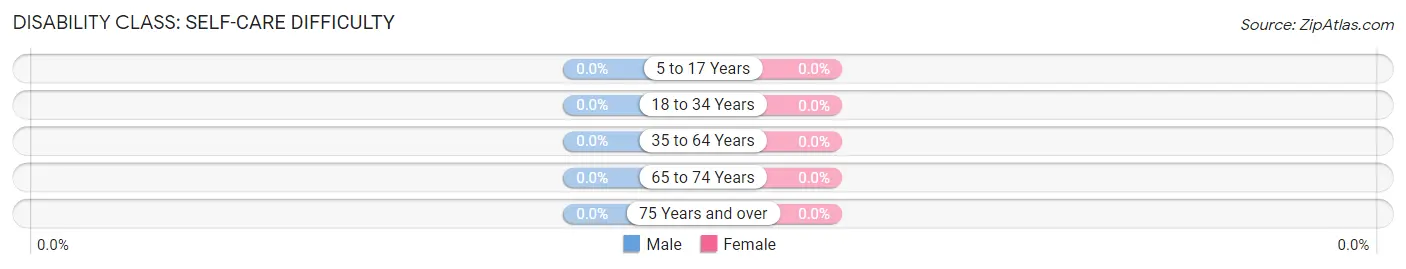
| Age Bracket | Male | Female |
| 5 to 17 Years | 0 (0.0%) | 0 (0.0%) |
| 18 to 34 Years | 0 (0.0%) | 0 (0.0%) |
| 35 to 64 Years | 0 (0.0%) | 0 (0.0%) |
| 65 to 74 Years | 0 (0.0%) | 0 (0.0%) |
| 75 Years and over | 0 (0.0%) | 0 (0.0%) |
Technology Access in Bluebell
Computing Device Access in Bluebell
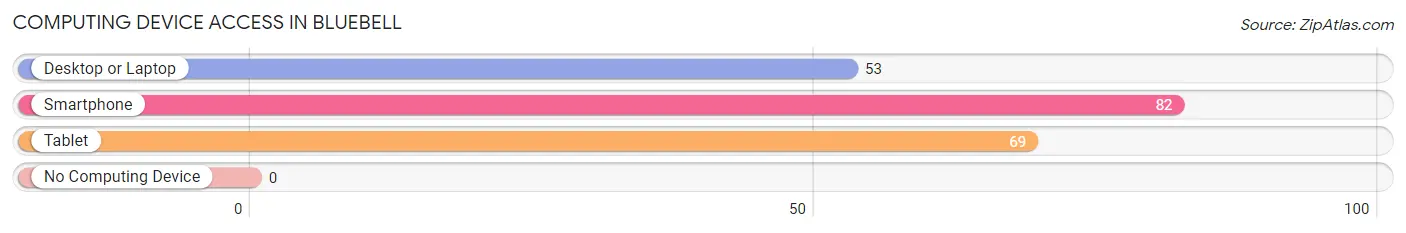
| Device Type | # Households | % Households |
| Desktop or Laptop | 53 | 64.6% |
| Smartphone | 82 | 100.0% |
| Tablet | 69 | 84.2% |
| No Computing Device | 0 | 0.0% |
| Total | 82 | 100.0% |
Internet Access in Bluebell
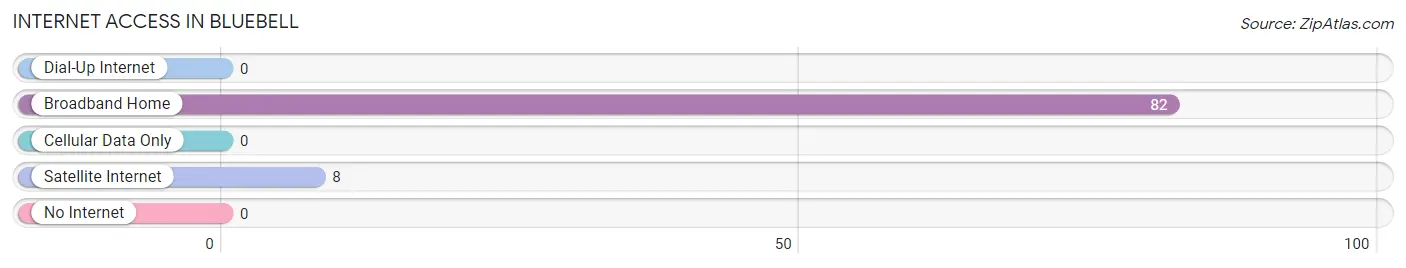
| Internet Type | # Households | % Households |
| Dial-Up Internet | 0 | 0.0% |
| Broadband Home | 82 | 100.0% |
| Cellular Data Only | 0 | 0.0% |
| Satellite Internet | 8 | 9.8% |
| No Internet | 0 | 0.0% |
| Total | 82 | 100.0% |
Bluebell Summary
Bellbell, Utah is a small town located in the southwestern corner of the state. It is situated in the foothills of the Wasatch Mountains, and is surrounded by the Uinta National Forest. The town is located in the Uintah Basin, and is the county seat of Uintah County. The population of Bellbell was estimated to be 1,845 in 2020.
History
Bellbell was first settled in 1876 by a group of Mormon pioneers. The town was named after the bluebell flower, which was abundant in the area. The town was incorporated in 1883, and the first post office was established in 1884.
The town grew slowly, but steadily, and by the early 1900s, it had become a thriving agricultural community. The town was home to several businesses, including a bank, a hotel, a general store, and a blacksmith shop.
In the 1920s, the town began to experience a period of growth and prosperity. The town was home to several large businesses, including a lumber mill, a brickyard, and a dairy. The town also had a movie theater, a bowling alley, and a library.
In the 1950s, the town began to experience a decline in population. This was due to the closure of several businesses, as well as the decline of the agricultural industry. The town was also affected by the construction of the Flaming Gorge Dam, which flooded much of the surrounding area.
Geography
Bellbell is located in the Uintah Basin, in the foothills of the Wasatch Mountains. The town is situated at an elevation of 4,890 feet, and is surrounded by the Uinta National Forest. The town is located near the Green River, and is approximately 30 miles from the Utah-Wyoming border.
The climate in Bellbell is semi-arid, with hot summers and cold winters. The average annual temperature is around 50 degrees Fahrenheit, and the average annual precipitation is around 12 inches.
Economy
The economy of Bellbell is largely based on agriculture and tourism. The town is home to several farms, which produce a variety of crops, including hay, alfalfa, and wheat. The town is also home to several tourist attractions, including the Flaming Gorge National Recreation Area, the Uintah National Forest, and the Dinosaur National Monument.
The town is also home to several businesses, including a grocery store, a hardware store, and a gas station. The town is also home to several restaurants, including a Mexican restaurant, a pizza parlor, and a steakhouse.
Demographics
The population of Bellbell was estimated to be 1,845 in 2020. The racial makeup of the town is predominantly white, with a small percentage of Native American, Hispanic, and African American residents. The median household income in the town is around $45,000, and the median home value is around $150,000. The town has a high school graduation rate of around 90%, and the unemployment rate is around 4%.
Common Questions
What is Per Capita Income in Bluebell?
Per Capita income in Bluebell is $34,045.
What is the Median Family Income in Bluebell?
Median Family Income in Bluebell is $95,179.
What is the Median Household income in Bluebell?
Median Household Income in Bluebell is $88,750.
What is Inequality or Gini Index in Bluebell?
Inequality or Gini Index in Bluebell is 0.14.
What is the Total Population of Bluebell?
Total Population of Bluebell is 242.
What is the Total Male Population of Bluebell?
Total Male Population of Bluebell is 106.
What is the Total Female Population of Bluebell?
Total Female Population of Bluebell is 136.
What is the Ratio of Males per 100 Females in Bluebell?
There are 77.94 Males per 100 Females in Bluebell.
What is the Ratio of Females per 100 Males in Bluebell?
There are 128.30 Females per 100 Males in Bluebell.
What is the Median Population Age in Bluebell?
Median Population Age in Bluebell is 24.9 Years.
What is the Average Family Size in Bluebell
Average Family Size in Bluebell is 3.1 People.
What is the Average Household Size in Bluebell
Average Household Size in Bluebell is 3.0 People.
How Large is the Labor Force in Bluebell?
There are 132 People in the Labor Forcein in Bluebell.
What is the Percentage of People in the Labor Force in Bluebell?
67.3% of People are in the Labor Force in Bluebell.