Milford, UT Map & Demographics
Milford Map
Milford Overview
$27,028
PER CAPITA INCOME
$90,433
AVG FAMILY INCOME
$83,783
AVG HOUSEHOLD INCOME
50.7%
WAGE / INCOME GAP [ % ]
49.3¢/ $1
WAGE / INCOME GAP [ $ ]
0.33
INEQUALITY / GINI INDEX
1,786
TOTAL POPULATION
996
MALE POPULATION
790
FEMALE POPULATION
126.08
MALES / 100 FEMALES
79.32
FEMALES / 100 MALES
24.8
MEDIAN AGE
4.0
AVG FAMILY SIZE
3.6
AVG HOUSEHOLD SIZE
850
LABOR FORCE [ PEOPLE ]
65.9%
PERCENT IN LABOR FORCE
6.7%
UNEMPLOYMENT RATE
Milford Zip Codes
Milford Area Codes
Income in Milford
Income Overview in Milford
Per Capita Income in Milford is $27,028, while median incomes of families and households are $90,433 and $83,783 respectively.
| Characteristic | Number | Measure |
| Per Capita Income | 1,786 | $27,028 |
| Median Family Income | 391 | $90,433 |
| Mean Family Income | 391 | $99,849 |
| Median Household Income | 485 | $83,783 |
| Mean Household Income | 485 | $92,418 |
| Income Deficit | 391 | $0 |
| Wage / Income Gap (%) | 1,786 | 50.70% |
| Wage / Income Gap ($) | 1,786 | 49.30¢ per $1 |
| Gini / Inequality Index | 1,786 | 0.33 |
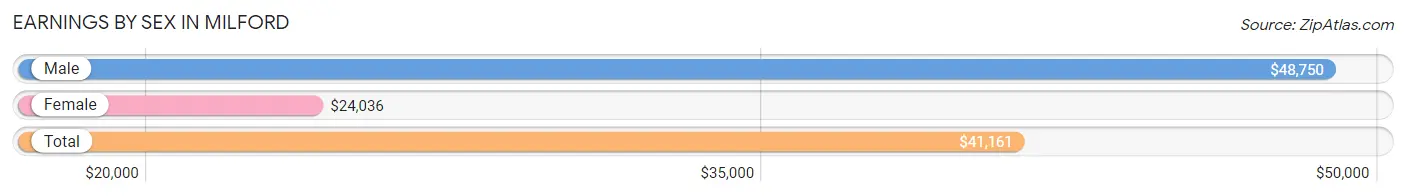
Earnings by Sex in Milford
Average Earnings in Milford are $41,161, $48,750 for men and $24,036 for women, a difference of 50.7%.
| Sex | Number | Average Earnings |
| Male | 544 (61.8%) | $48,750 |
| Female | 337 (38.3%) | $24,036 |
| Total | 881 (100.0%) | $41,161 |
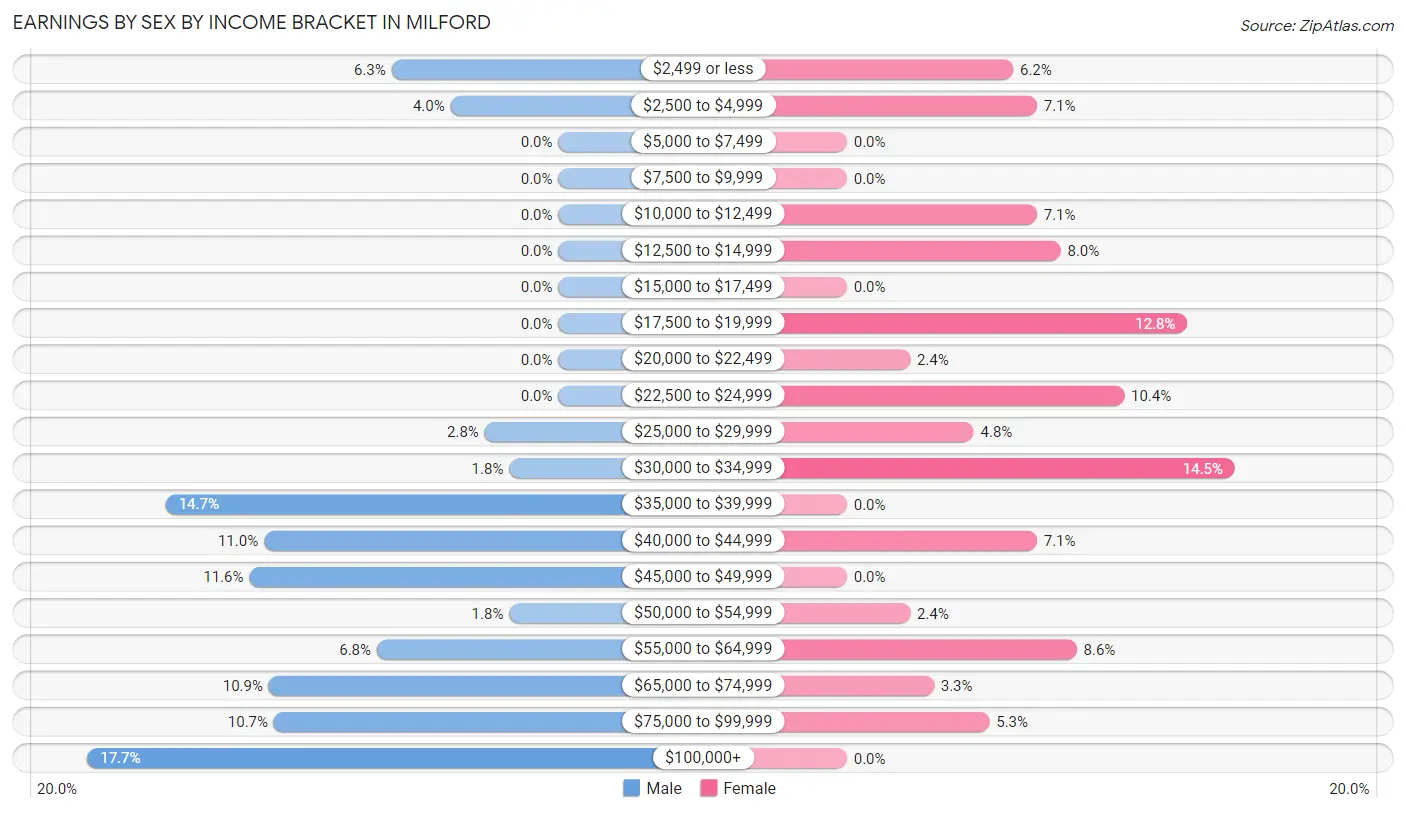
Earnings by Sex by Income Bracket in Milford
The most common earnings brackets in Milford are $100,000+ for men (96 | 17.6%) and $30,000 to $34,999 for women (49 | 14.5%).
| Income | Male | Female |
| $2,499 or less | 34 (6.2%) | 21 (6.2%) |
| $2,500 to $4,999 | 22 (4.0%) | 24 (7.1%) |
| $5,000 to $7,499 | 0 (0.0%) | 0 (0.0%) |
| $7,500 to $9,999 | 0 (0.0%) | 0 (0.0%) |
| $10,000 to $12,499 | 0 (0.0%) | 24 (7.1%) |
| $12,500 to $14,999 | 0 (0.0%) | 27 (8.0%) |
| $15,000 to $17,499 | 0 (0.0%) | 0 (0.0%) |
| $17,500 to $19,999 | 0 (0.0%) | 43 (12.8%) |
| $20,000 to $22,499 | 0 (0.0%) | 8 (2.4%) |
| $22,500 to $24,999 | 0 (0.0%) | 35 (10.4%) |
| $25,000 to $29,999 | 15 (2.8%) | 16 (4.8%) |
| $30,000 to $34,999 | 10 (1.8%) | 49 (14.5%) |
| $35,000 to $39,999 | 80 (14.7%) | 0 (0.0%) |
| $40,000 to $44,999 | 60 (11.0%) | 24 (7.1%) |
| $45,000 to $49,999 | 63 (11.6%) | 0 (0.0%) |
| $50,000 to $54,999 | 10 (1.8%) | 8 (2.4%) |
| $55,000 to $64,999 | 37 (6.8%) | 29 (8.6%) |
| $65,000 to $74,999 | 59 (10.8%) | 11 (3.3%) |
| $75,000 to $99,999 | 58 (10.7%) | 18 (5.3%) |
| $100,000+ | 96 (17.6%) | 0 (0.0%) |
| Total | 544 (100.0%) | 337 (100.0%) |
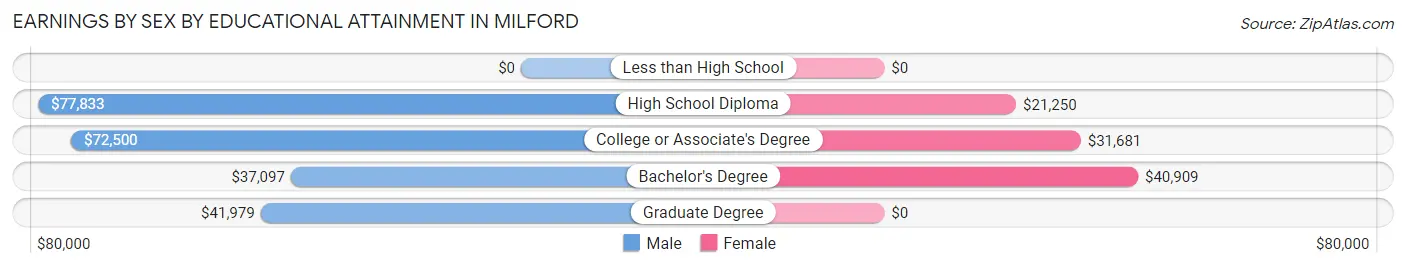
Earnings by Sex by Educational Attainment in Milford
Average earnings in Milford are $58,516 for men and $31,293 for women, a difference of 46.5%. Men with an educational attainment of high school diploma enjoy the highest average annual earnings of $77,833, while those with bachelor's degree education earn the least with $37,097. Women with an educational attainment of bachelor's degree earn the most with the average annual earnings of $40,909, while those with high school diploma education have the smallest earnings of $21,250.
| Educational Attainment | Male Income | Female Income |
| Less than High School | - | - |
| High School Diploma | $77,833 | $21,250 |
| College or Associate's Degree | $72,500 | $31,681 |
| Bachelor's Degree | $37,097 | $40,909 |
| Graduate Degree | $41,979 | $0 |
| Total | $58,516 | $31,293 |
Family Income in Milford
Family Income Brackets in Milford
According to the Milford family income data, there are 105 families falling into the $100,000 to $149,999 income range, which is the most common income bracket and makes up 26.9% of all families.
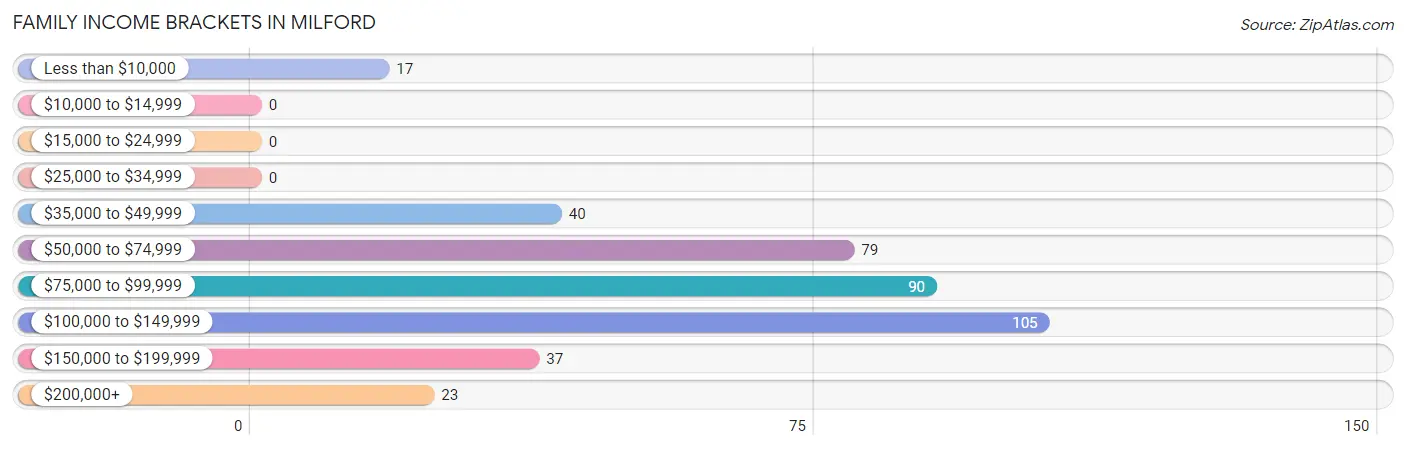
| Income Bracket | # Families | % Families |
| Less than $10,000 | 17 | 4.3% |
| $10,000 to $14,999 | 0 | 0.0% |
| $15,000 to $24,999 | 0 | 0.0% |
| $25,000 to $34,999 | 0 | 0.0% |
| $35,000 to $49,999 | 40 | 10.2% |
| $50,000 to $74,999 | 79 | 20.2% |
| $75,000 to $99,999 | 90 | 23.0% |
| $100,000 to $149,999 | 105 | 26.9% |
| $150,000 to $199,999 | 37 | 9.5% |
| $200,000+ | 23 | 5.9% |
Family Income by Famaliy Size in Milford
5-person families (67 | 17.1%) account for the highest median family income in Milford with $138,523 per family, while 2-person families (153 | 39.1%) have the highest median income of $38,264 per family member.
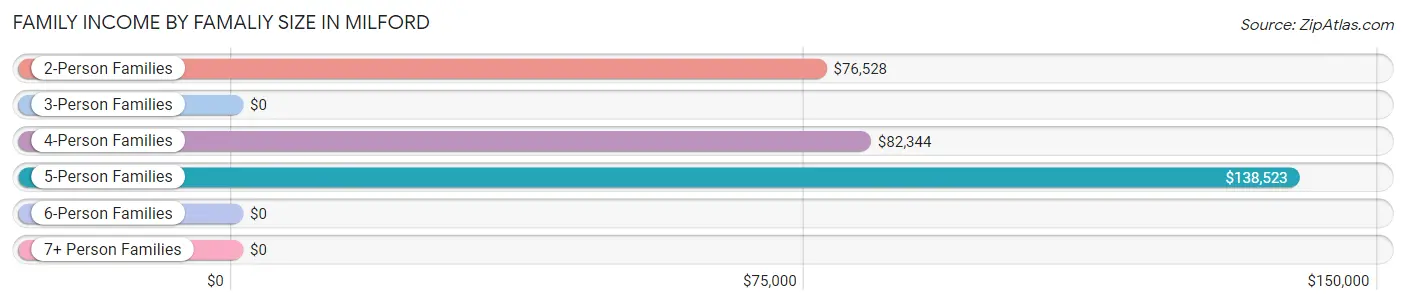
| Income Bracket | # Families | Median Income |
| 2-Person Families | 153 (39.1%) | $76,528 |
| 3-Person Families | 29 (7.4%) | $0 |
| 4-Person Families | 115 (29.4%) | $82,344 |
| 5-Person Families | 67 (17.1%) | $138,523 |
| 6-Person Families | 27 (6.9%) | $0 |
| 7+ Person Families | 0 (0.0%) | $0 |
| Total | 391 (100.0%) | $90,433 |
Family Income by Number of Earners in Milford
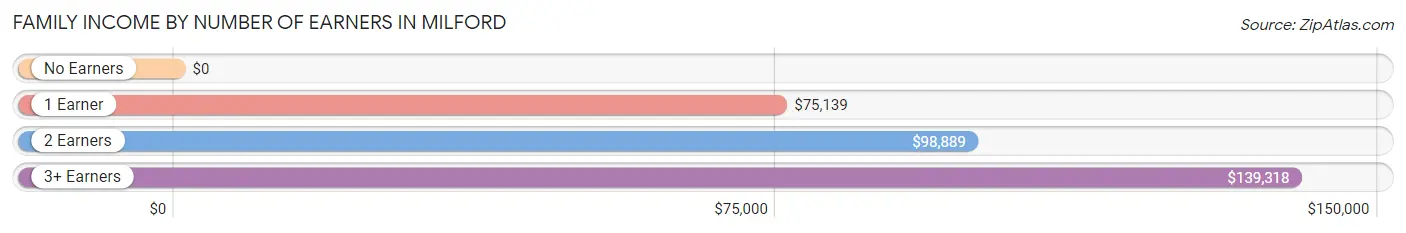
| Number of Earners | # Families | Median Income |
| No Earners | 68 (17.4%) | $0 |
| 1 Earner | 45 (11.5%) | $75,139 |
| 2 Earners | 220 (56.3%) | $98,889 |
| 3+ Earners | 58 (14.8%) | $139,318 |
| Total | 391 (100.0%) | $90,433 |
Household Income in Milford
Household Income Brackets in Milford
With 124 households falling in the category, the $100,000 to $149,999 income range is the most frequent in Milford, accounting for 25.6% of all households. In contrast, only 6 households (1.2%) fall into the $10,000 to $14,999 income bracket, making it the least populous group.
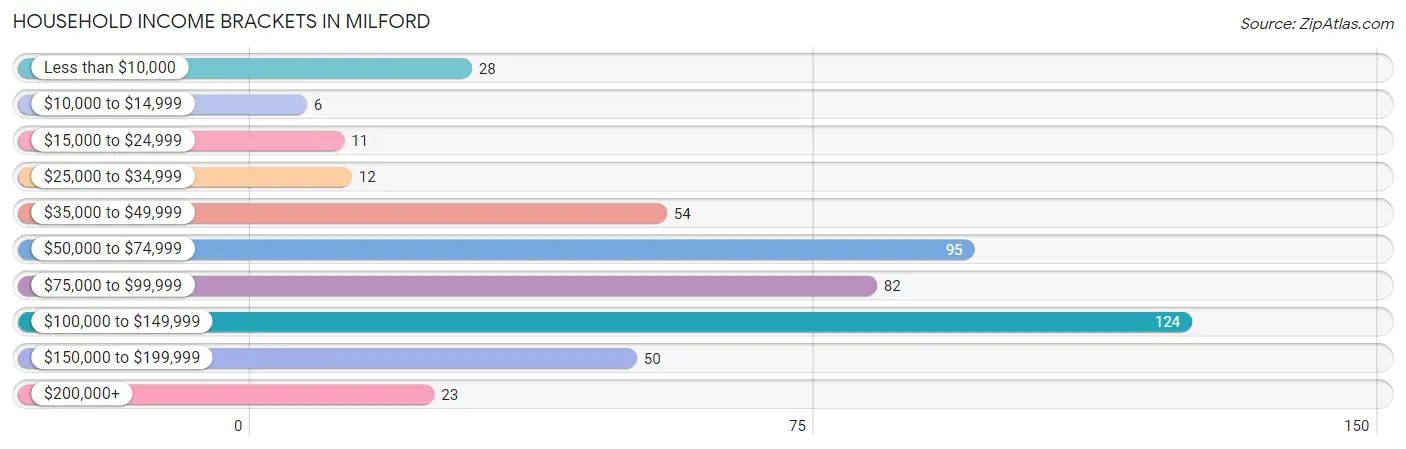
| Income Bracket | # Households | % Households |
| Less than $10,000 | 28 | 5.8% |
| $10,000 to $14,999 | 6 | 1.2% |
| $15,000 to $24,999 | 11 | 2.3% |
| $25,000 to $34,999 | 12 | 2.5% |
| $35,000 to $49,999 | 54 | 11.1% |
| $50,000 to $74,999 | 95 | 19.6% |
| $75,000 to $99,999 | 82 | 16.9% |
| $100,000 to $149,999 | 124 | 25.6% |
| $150,000 to $199,999 | 50 | 10.3% |
| $200,000+ | 23 | 4.7% |
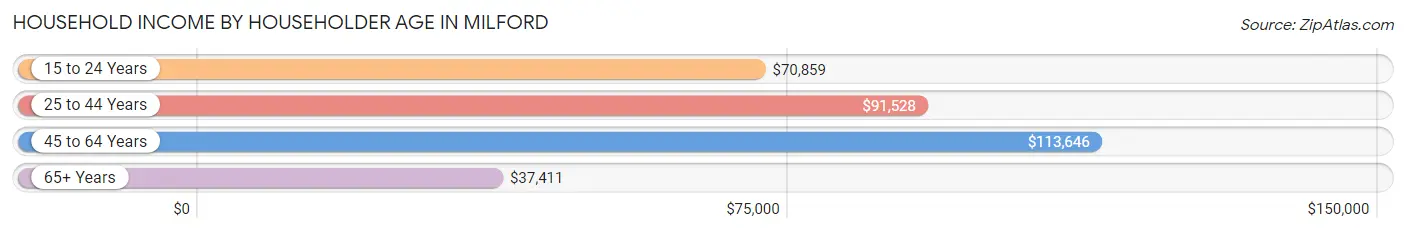
Household Income by Householder Age in Milford
The median household income in Milford is $83,783, with the highest median household income of $113,646 found in the 45 to 64 years age bracket for the primary householder. A total of 155 households (32.0%) fall into this category. Meanwhile, the 65+ years age bracket for the primary householder has the lowest median household income of $37,411, with 71 households (14.6%) in this group.
| Income Bracket | # Households | Median Income |
| 15 to 24 Years | 51 (10.5%) | $70,859 |
| 25 to 44 Years | 208 (42.9%) | $91,528 |
| 45 to 64 Years | 155 (32.0%) | $113,646 |
| 65+ Years | 71 (14.6%) | $37,411 |
| Total | 485 (100.0%) | $83,783 |
Poverty in Milford
Income Below Poverty by Sex and Age in Milford
With 10.1% poverty level for males and 2.9% for females among the residents of Milford, 65 to 74 year old males and 45 to 54 year old females are the most vulnerable to poverty, with 11 males (31.4%) and 9 females (20.9%) in their respective age groups living below the poverty level.
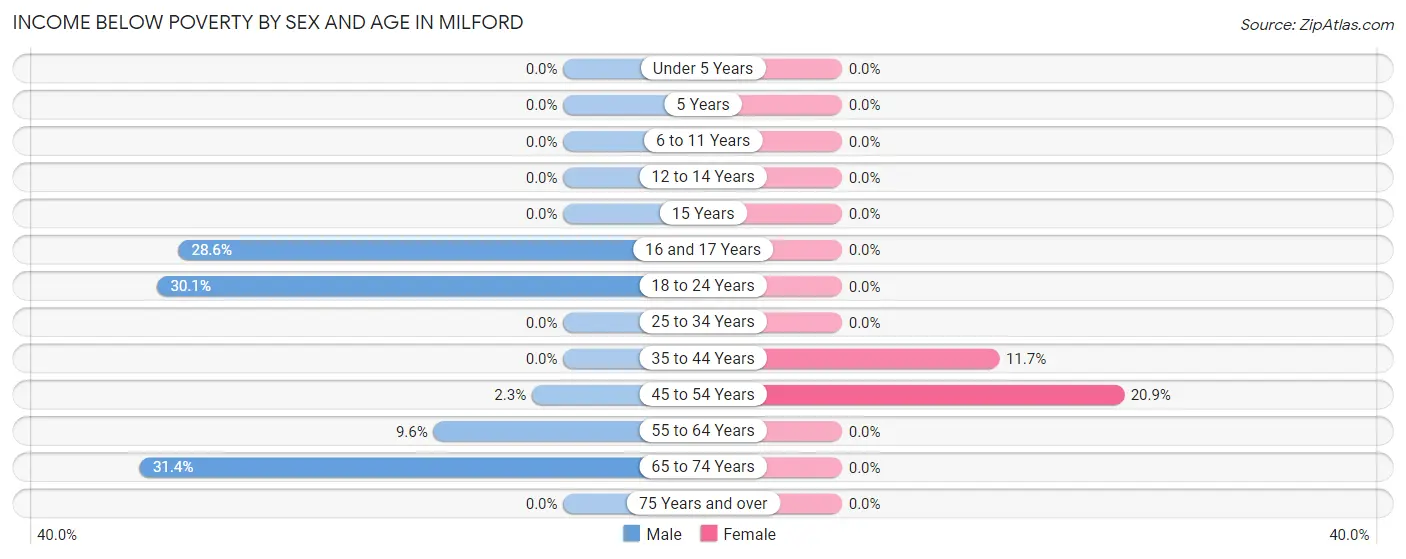
| Age Bracket | Male | Female |
| Under 5 Years | 0 (0.0%) | 0 (0.0%) |
| 5 Years | 0 (0.0%) | 0 (0.0%) |
| 6 to 11 Years | 0 (0.0%) | 0 (0.0%) |
| 12 to 14 Years | 0 (0.0%) | 0 (0.0%) |
| 15 Years | 0 (0.0%) | 0 (0.0%) |
| 16 and 17 Years | 10 (28.6%) | 0 (0.0%) |
| 18 to 24 Years | 69 (30.1%) | 0 (0.0%) |
| 25 to 34 Years | 0 (0.0%) | 0 (0.0%) |
| 35 to 44 Years | 0 (0.0%) | 14 (11.7%) |
| 45 to 54 Years | 1 (2.3%) | 9 (20.9%) |
| 55 to 64 Years | 8 (9.6%) | 0 (0.0%) |
| 65 to 74 Years | 11 (31.4%) | 0 (0.0%) |
| 75 Years and over | 0 (0.0%) | 0 (0.0%) |
| Total | 99 (10.1%) | 23 (2.9%) |
Income Above Poverty by Sex and Age in Milford
According to the poverty statistics in Milford, males aged under 5 years and females aged under 5 years are the age groups that are most secure financially, with 100.0% of males and 100.0% of females in these age groups living above the poverty line.
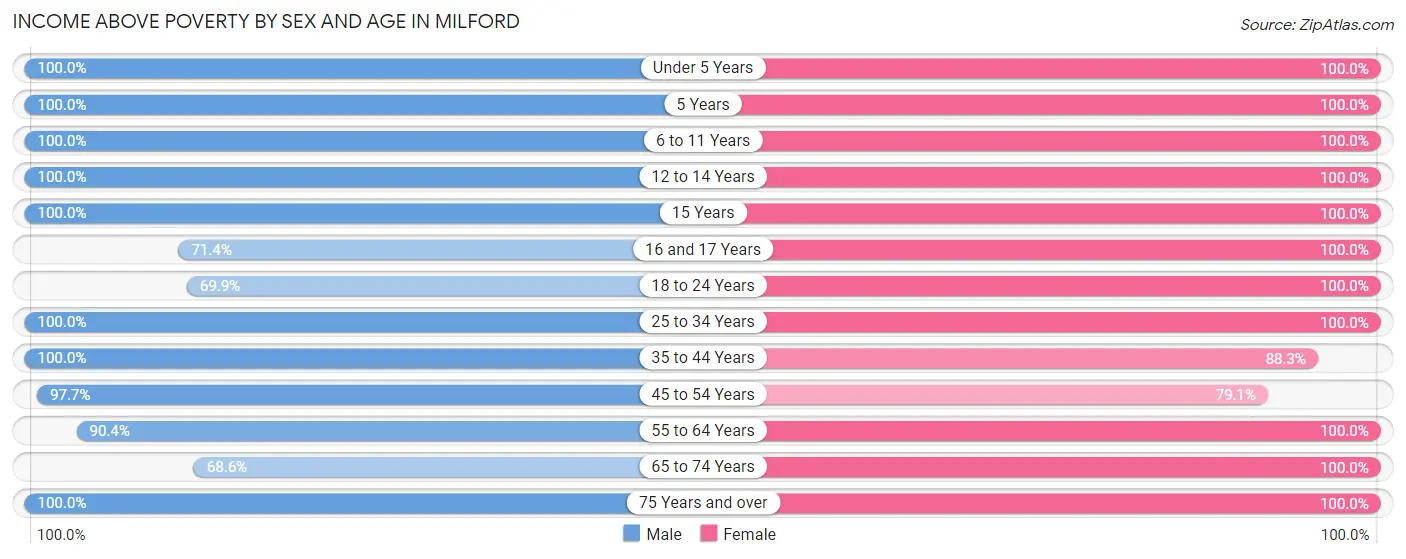
| Age Bracket | Male | Female |
| Under 5 Years | 73 (100.0%) | 40 (100.0%) |
| 5 Years | 20 (100.0%) | 6 (100.0%) |
| 6 to 11 Years | 44 (100.0%) | 131 (100.0%) |
| 12 to 14 Years | 76 (100.0%) | 73 (100.0%) |
| 15 Years | 20 (100.0%) | 12 (100.0%) |
| 16 and 17 Years | 25 (71.4%) | 57 (100.0%) |
| 18 to 24 Years | 160 (69.9%) | 81 (100.0%) |
| 25 to 34 Years | 143 (100.0%) | 74 (100.0%) |
| 35 to 44 Years | 139 (100.0%) | 106 (88.3%) |
| 45 to 54 Years | 42 (97.7%) | 34 (79.1%) |
| 55 to 64 Years | 75 (90.4%) | 106 (100.0%) |
| 65 to 74 Years | 24 (68.6%) | 8 (100.0%) |
| 75 Years and over | 38 (100.0%) | 33 (100.0%) |
| Total | 879 (89.9%) | 761 (97.1%) |
Income Below Poverty Among Married-Couple Families in Milford
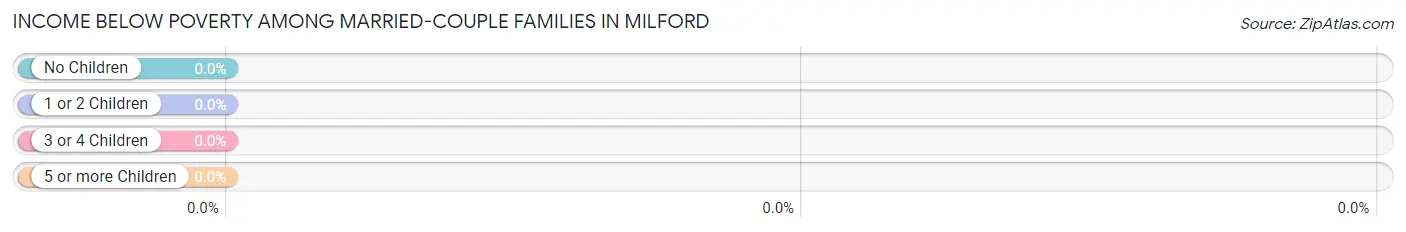
| Children | Above Poverty | Below Poverty |
| No Children | 132 (100.0%) | 0 (0.0%) |
| 1 or 2 Children | 161 (100.0%) | 0 (0.0%) |
| 3 or 4 Children | 49 (100.0%) | 0 (0.0%) |
| 5 or more Children | 0 (0.0%) | 0 (0.0%) |
| Total | 342 (100.0%) | 0 (0.0%) |
Income Below Poverty Among Single-Parent Households in Milford
According to the poverty data in Milford, 25.0% or 8 single-father households and 52.9% or 9 single-mother households are living below the poverty line. Among single-father households, those with 1 or 2 children have the highest poverty rate, with 8 households (100.0%) experiencing poverty. Likewise, among single-mother households, those with no children have the highest poverty rate, with 9 households (52.9%) falling below the poverty line.
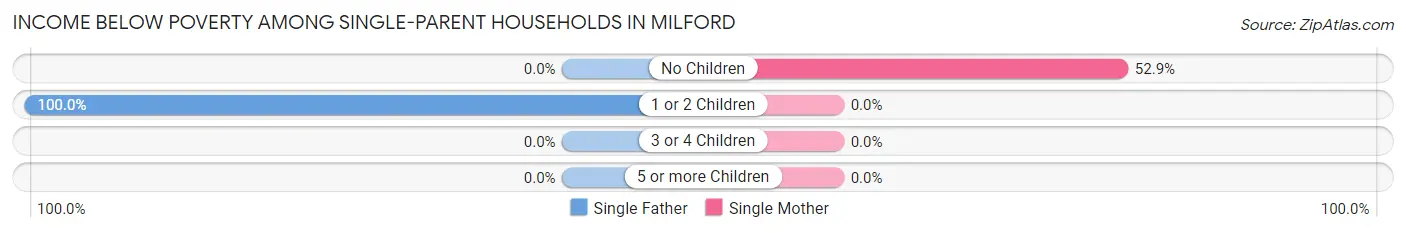
| Children | Single Father | Single Mother |
| No Children | 0 (0.0%) | 9 (52.9%) |
| 1 or 2 Children | 8 (100.0%) | 0 (0.0%) |
| 3 or 4 Children | 0 (0.0%) | 0 (0.0%) |
| 5 or more Children | 0 (0.0%) | 0 (0.0%) |
| Total | 8 (25.0%) | 9 (52.9%) |
Income Below Poverty Among Married-Couple vs Single-Parent Households in Milford
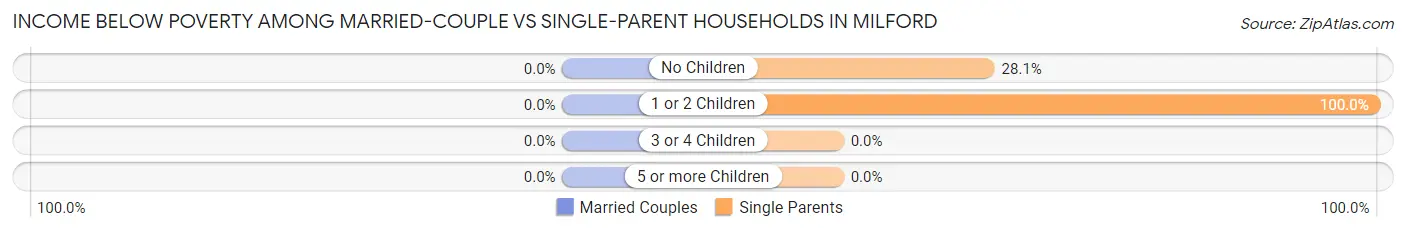
| Children | Married-Couple Families | Single-Parent Households |
| No Children | 0 (0.0%) | 9 (28.1%) |
| 1 or 2 Children | 0 (0.0%) | 8 (100.0%) |
| 3 or 4 Children | 0 (0.0%) | 0 (0.0%) |
| 5 or more Children | 0 (0.0%) | 0 (0.0%) |
| Total | 0 (0.0%) | 17 (34.7%) |
Race in Milford
The most populous races in Milford are White / Caucasian (1,547 | 86.6%), Hispanic or Latino (277 | 15.5%), and Some other Race (140 | 7.8%).
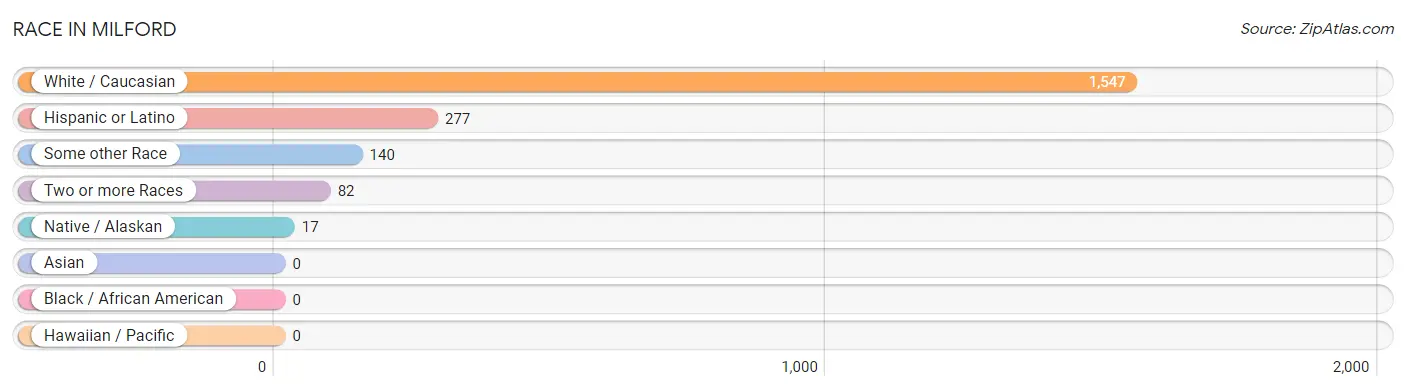
| Race | # Population | % Population |
| Asian | 0 | 0.0% |
| Black / African American | 0 | 0.0% |
| Hawaiian / Pacific | 0 | 0.0% |
| Hispanic or Latino | 277 | 15.5% |
| Native / Alaskan | 17 | 0.9% |
| White / Caucasian | 1,547 | 86.6% |
| Two or more Races | 82 | 4.6% |
| Some other Race | 140 | 7.8% |
| Total | 1,786 | 100.0% |
Ancestry in Milford
The most populous ancestries reported in Milford are English (675 | 37.8%), Mexican (250 | 14.0%), German (142 | 8.0%), American (128 | 7.2%), and European (128 | 7.2%), together accounting for 74.1% of all Milford residents.
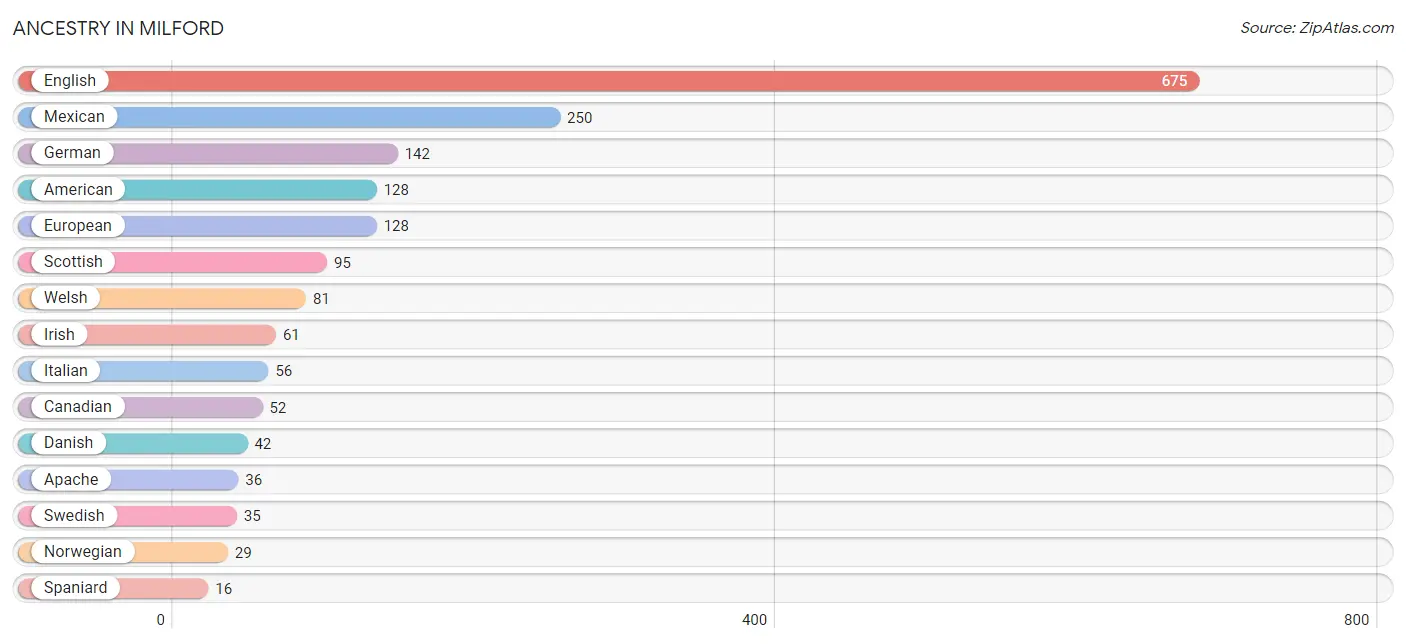
| Ancestry | # Population | % Population |
| American | 128 | 7.2% |
| Apache | 36 | 2.0% |
| Canadian | 52 | 2.9% |
| Danish | 42 | 2.4% |
| Dutch | 3 | 0.2% |
| English | 675 | 37.8% |
| European | 128 | 7.2% |
| German | 142 | 8.0% |
| Irish | 61 | 3.4% |
| Italian | 56 | 3.1% |
| Mexican | 250 | 14.0% |
| Navajo | 5 | 0.3% |
| Norwegian | 29 | 1.6% |
| Polish | 10 | 0.6% |
| Scottish | 95 | 5.3% |
| Spaniard | 16 | 0.9% |
| Swedish | 35 | 2.0% |
| Welsh | 81 | 4.5% | View All 18 Rows |
Immigrants in Milford
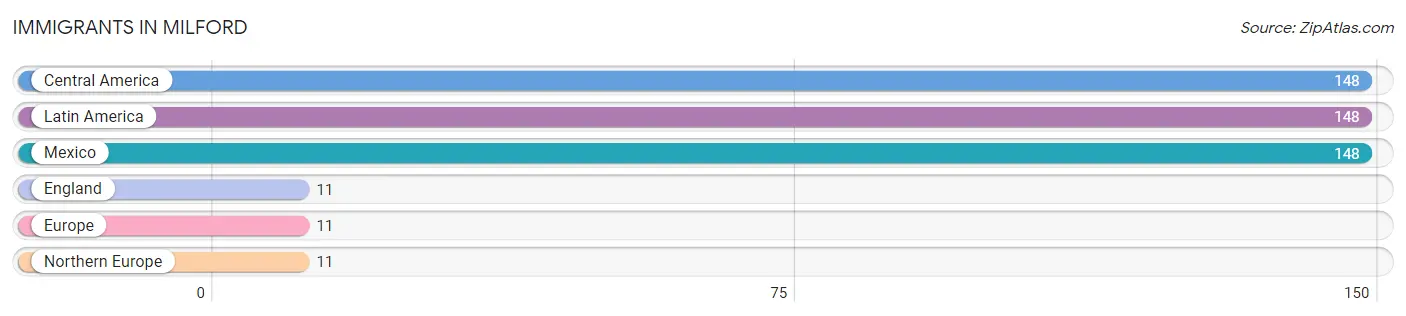
The most numerous immigrant groups reported in Milford came from Central America (148 | 8.3%), Latin America (148 | 8.3%), Mexico (148 | 8.3%), England (11 | 0.6%), and Europe (11 | 0.6%), together accounting for 26.1% of all Milford residents.
| Immigration Origin | # Population | % Population |
| Central America | 148 | 8.3% |
| England | 11 | 0.6% |
| Europe | 11 | 0.6% |
| Latin America | 148 | 8.3% |
| Mexico | 148 | 8.3% |
| Northern Europe | 11 | 0.6% | View All 6 Rows |
Sex and Age in Milford
Sex and Age in Milford
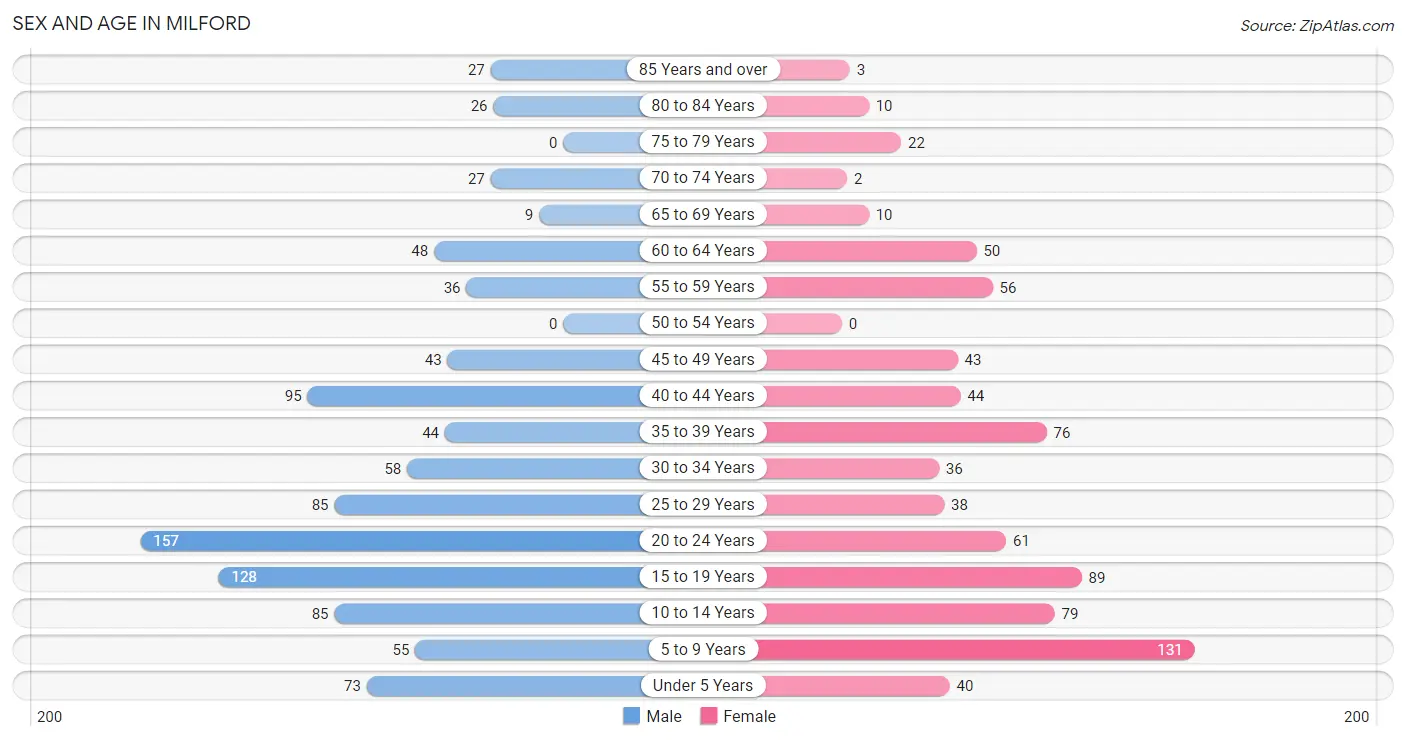
The most populous age groups in Milford are 20 to 24 Years (157 | 15.8%) for men and 5 to 9 Years (131 | 16.6%) for women.
| Age Bracket | Male | Female |
| Under 5 Years | 73 (7.3%) | 40 (5.1%) |
| 5 to 9 Years | 55 (5.5%) | 131 (16.6%) |
| 10 to 14 Years | 85 (8.5%) | 79 (10.0%) |
| 15 to 19 Years | 128 (12.9%) | 89 (11.3%) |
| 20 to 24 Years | 157 (15.8%) | 61 (7.7%) |
| 25 to 29 Years | 85 (8.5%) | 38 (4.8%) |
| 30 to 34 Years | 58 (5.8%) | 36 (4.6%) |
| 35 to 39 Years | 44 (4.4%) | 76 (9.6%) |
| 40 to 44 Years | 95 (9.5%) | 44 (5.6%) |
| 45 to 49 Years | 43 (4.3%) | 43 (5.4%) |
| 50 to 54 Years | 0 (0.0%) | 0 (0.0%) |
| 55 to 59 Years | 36 (3.6%) | 56 (7.1%) |
| 60 to 64 Years | 48 (4.8%) | 50 (6.3%) |
| 65 to 69 Years | 9 (0.9%) | 10 (1.3%) |
| 70 to 74 Years | 27 (2.7%) | 2 (0.3%) |
| 75 to 79 Years | 0 (0.0%) | 22 (2.8%) |
| 80 to 84 Years | 26 (2.6%) | 10 (1.3%) |
| 85 Years and over | 27 (2.7%) | 3 (0.4%) |
| Total | 996 (100.0%) | 790 (100.0%) |
Families and Households in Milford
Median Family Size in Milford
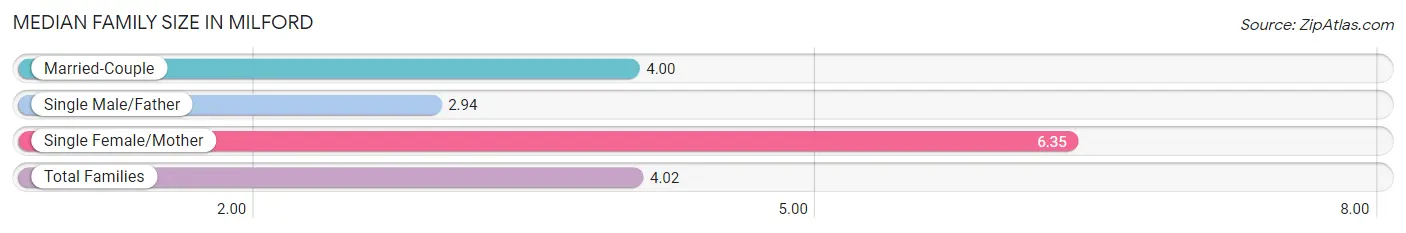
The median family size in Milford is 4.02 persons per family, with single female/mother families (17 | 4.3%) accounting for the largest median family size of 6.35 persons per family. On the other hand, single male/father families (32 | 8.2%) represent the smallest median family size with 2.94 persons per family.
| Family Type | # Families | Family Size |
| Married-Couple | 342 (87.5%) | 4.00 |
| Single Male/Father | 32 (8.2%) | 2.94 |
| Single Female/Mother | 17 (4.3%) | 6.35 |
| Total Families | 391 (100.0%) | 4.02 |
Median Household Size in Milford
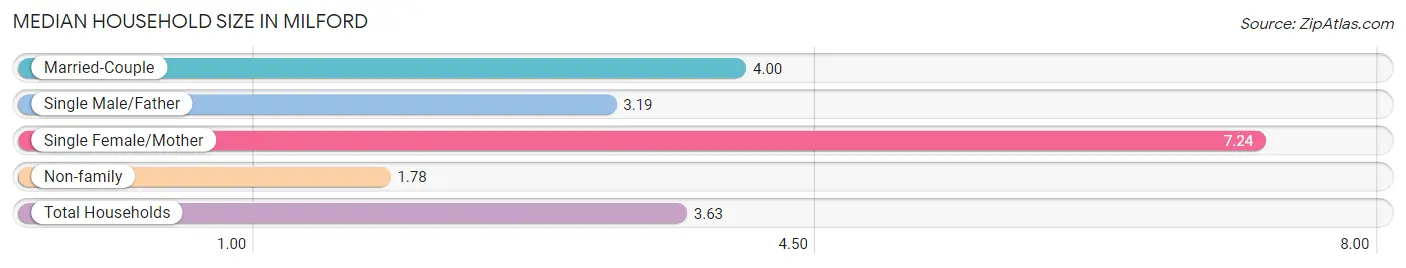
The median household size in Milford is 3.63 persons per household, with single female/mother households (17 | 3.5%) accounting for the largest median household size of 7.24 persons per household. non-family households (94 | 19.4%) represent the smallest median household size with 1.78 persons per household.
| Household Type | # Households | Household Size |
| Married-Couple | 342 (70.5%) | 4.00 |
| Single Male/Father | 32 (6.6%) | 3.19 |
| Single Female/Mother | 17 (3.5%) | 7.24 |
| Non-family | 94 (19.4%) | 1.78 |
| Total Households | 485 (100.0%) | 3.63 |
Household Size by Marriage Status in Milford
Out of a total of 485 households in Milford, 391 (80.6%) are family households, while 94 (19.4%) are nonfamily households. The most numerous type of family households are 2-person households, comprising 145, and the most common type of nonfamily households are 1-person households, comprising 73.
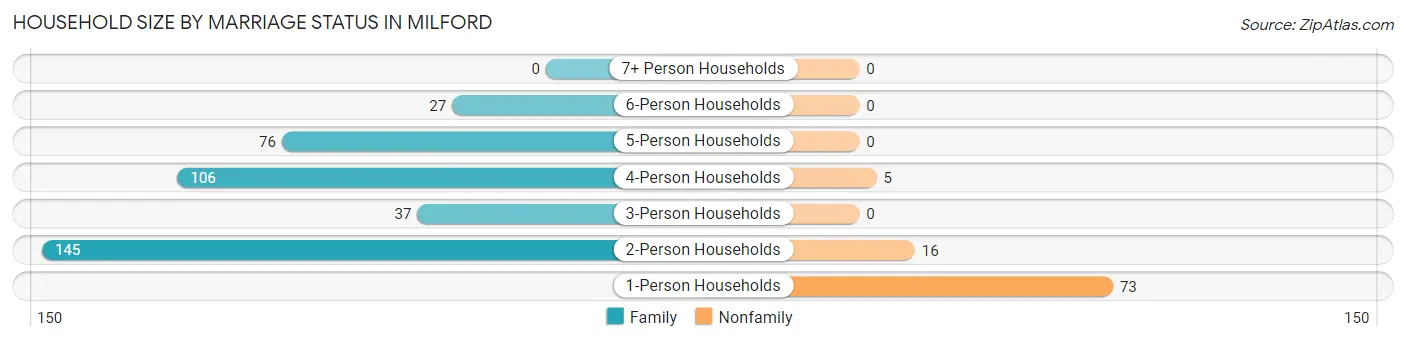
| Household Size | Family Households | Nonfamily Households |
| 1-Person Households | - | 73 (15.0%) |
| 2-Person Households | 145 (29.9%) | 16 (3.3%) |
| 3-Person Households | 37 (7.6%) | 0 (0.0%) |
| 4-Person Households | 106 (21.9%) | 5 (1.0%) |
| 5-Person Households | 76 (15.7%) | 0 (0.0%) |
| 6-Person Households | 27 (5.6%) | 0 (0.0%) |
| 7+ Person Households | 0 (0.0%) | 0 (0.0%) |
| Total | 391 (80.6%) | 94 (19.4%) |
Female Fertility in Milford
Fertility by Age in Milford
Average fertility rate in Milford is 21.0 births per 1,000 women. Women in the age bracket of 35 to 50 years have the highest fertility rate with 49.0 births per 1,000 women. Women in the age bracket of 35 to 50 years acount for 100.0% of all women with births.
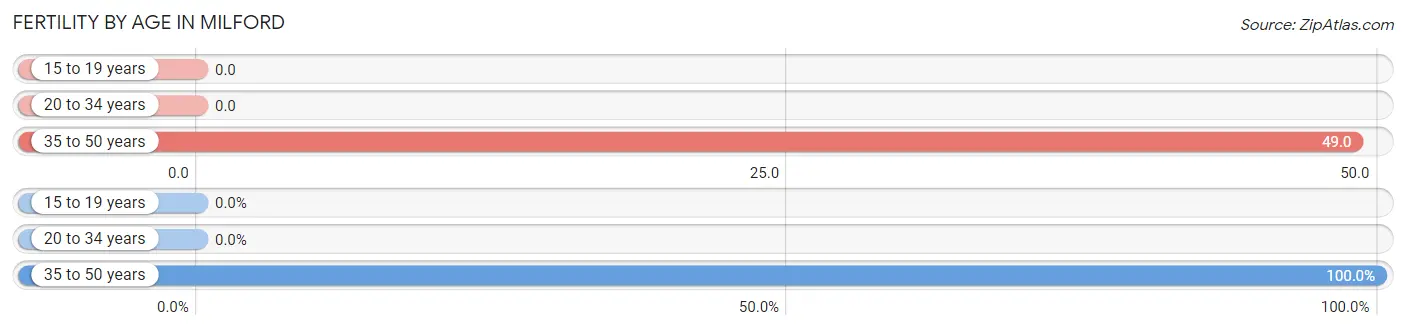
| Age Bracket | Women with Births | Births / 1,000 Women |
| 15 to 19 years | 0 (0.0%) | 0.0 |
| 20 to 34 years | 0 (0.0%) | 0.0 |
| 35 to 50 years | 8 (100.0%) | 49.0 |
| Total | 8 (100.0%) | 21.0 |
Fertility by Age by Marriage Status in Milford
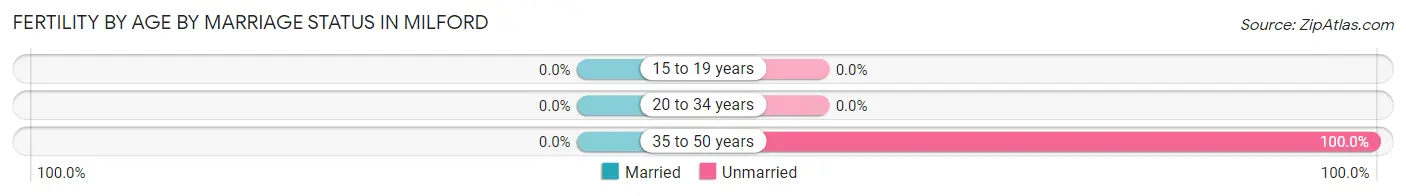
| Age Bracket | Married | Unmarried |
| 15 to 19 years | 0 (0.0%) | 0 (0.0%) |
| 20 to 34 years | 0 (0.0%) | 0 (0.0%) |
| 35 to 50 years | 0 (0.0%) | 8 (100.0%) |
| Total | 0 (0.0%) | 8 (100.0%) |
Fertility by Education in Milford
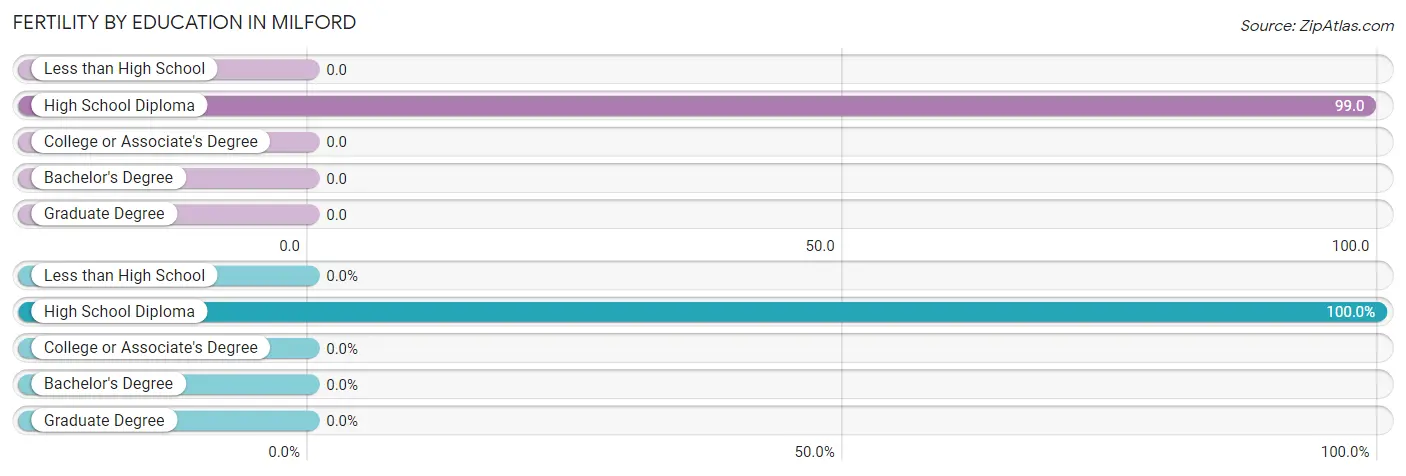
| Educational Attainment | Women with Births | Births / 1,000 Women |
| Less than High School | 0 (0.0%) | 0.0 |
| High School Diploma | 8 (100.0%) | 99.0 |
| College or Associate's Degree | 0 (0.0%) | 0.0 |
| Bachelor's Degree | 0 (0.0%) | 0.0 |
| Graduate Degree | 0 (0.0%) | 0.0 |
| Total | 8 (100.0%) | 21.0 |
Fertility by Education by Marriage Status in Milford
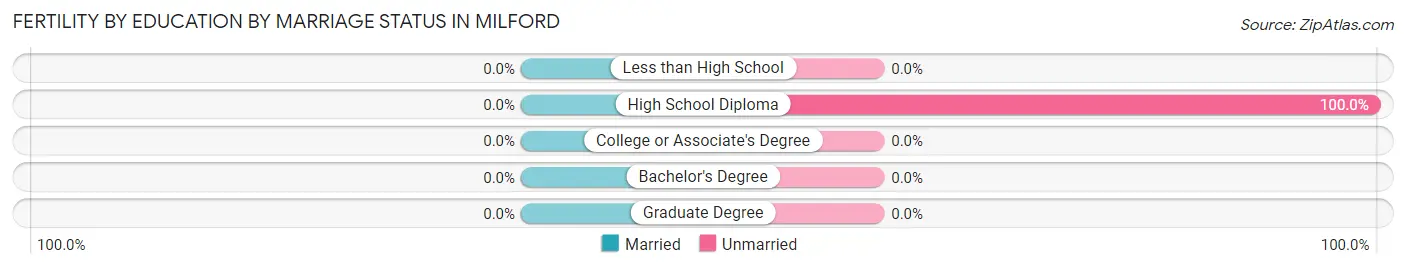
| Educational Attainment | Married | Unmarried |
| Less than High School | 0 (0.0%) | 0 (0.0%) |
| High School Diploma | 0 (0.0%) | 8 (100.0%) |
| College or Associate's Degree | 0 (0.0%) | 0 (0.0%) |
| Bachelor's Degree | 0 (0.0%) | 0 (0.0%) |
| Graduate Degree | 0 (0.0%) | 0 (0.0%) |
| Total | 0 (0.0%) | 8 (100.0%) |
Employment Characteristics in Milford
Employment by Class of Employer in Milford
Among the 765 employed individuals in Milford, private company employees (541 | 70.7%), local government employees (71 | 9.3%), and not-for-profit organizations (59 | 7.7%) make up the most common classes of employment.
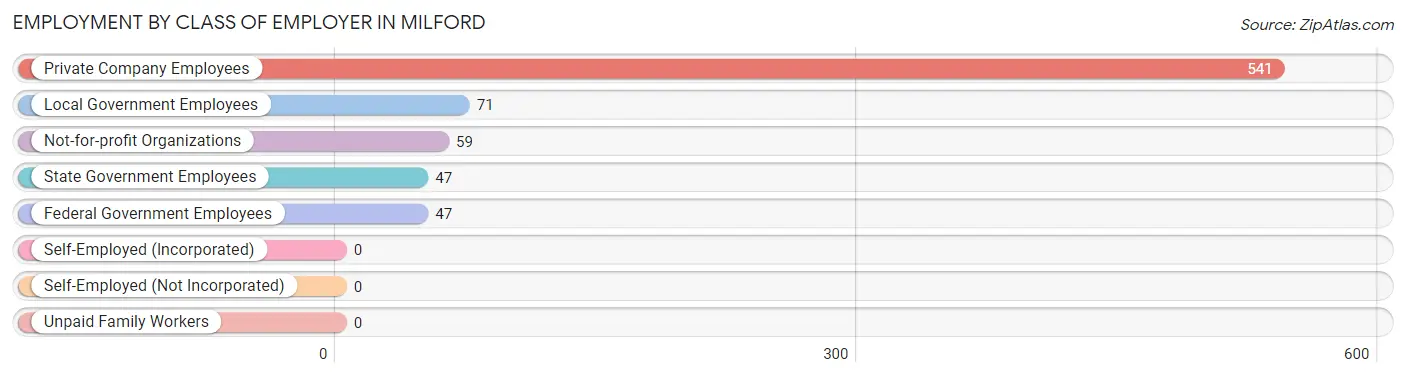
| Employer Class | # Employees | % Employees |
| Private Company Employees | 541 | 70.7% |
| Self-Employed (Incorporated) | 0 | 0.0% |
| Self-Employed (Not Incorporated) | 0 | 0.0% |
| Not-for-profit Organizations | 59 | 7.7% |
| Local Government Employees | 71 | 9.3% |
| State Government Employees | 47 | 6.1% |
| Federal Government Employees | 47 | 6.1% |
| Unpaid Family Workers | 0 | 0.0% |
| Total | 765 | 100.0% |
Employment Status by Age in Milford
According to the labor force statistics for Milford, out of the total population over 16 years of age (1,290), 65.9% or 850 individuals are in the labor force, with 6.7% or 57 of them unemployed. The age group with the highest labor force participation rate is 25 to 29 years, with 100.0% or 123 individuals in the labor force. Within the labor force, the 20 to 24 years age range has the highest percentage of unemployed individuals, with 27.4% or 45 of them being unemployed.
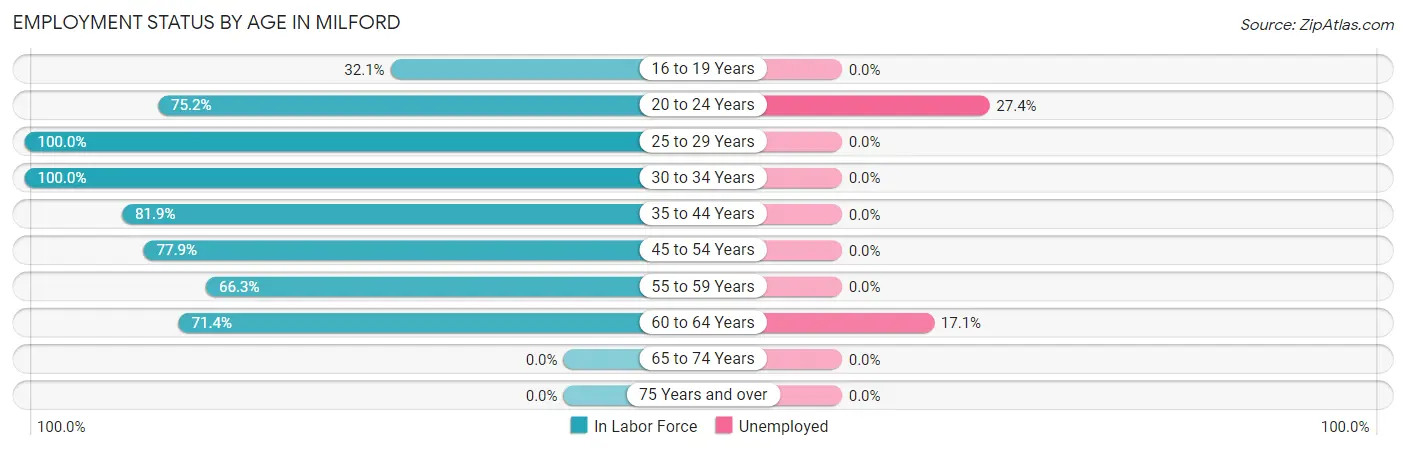
| Age Bracket | In Labor Force | Unemployed |
| 16 to 19 Years | 59 (32.1%) | 0 (0.0%) |
| 20 to 24 Years | 164 (75.2%) | 45 (27.4%) |
| 25 to 29 Years | 123 (100.0%) | 0 (0.0%) |
| 30 to 34 Years | 94 (100.0%) | 0 (0.0%) |
| 35 to 44 Years | 212 (81.9%) | 0 (0.0%) |
| 45 to 54 Years | 67 (77.9%) | 0 (0.0%) |
| 55 to 59 Years | 61 (66.3%) | 0 (0.0%) |
| 60 to 64 Years | 70 (71.4%) | 12 (17.1%) |
| 65 to 74 Years | 0 (0.0%) | 0 (0.0%) |
| 75 Years and over | 0 (0.0%) | 0 (0.0%) |
| Total | 850 (65.9%) | 57 (6.7%) |
Employment Status by Educational Attainment in Milford
According to labor force statistics for Milford, 83.4% of individuals (627) out of the total population between 25 and 64 years of age (752) are in the labor force, with 1.9% or 12 of them being unemployed. The group with the highest labor force participation rate are those with the educational attainment of bachelor's degree or higher, with 97.8% or 225 individuals in the labor force. Within the labor force, individuals with college / associate degree education have the highest percentage of unemployment, with 5.4% or 12 of them being unemployed.
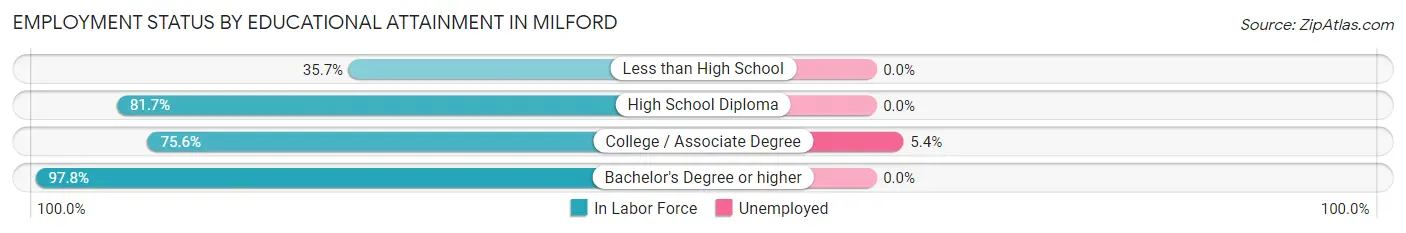
| Educational Attainment | In Labor Force | Unemployed |
| Less than High School | 5 (35.7%) | 0 (0.0%) |
| High School Diploma | 174 (81.7%) | 0 (0.0%) |
| College / Associate Degree | 223 (75.6%) | 16 (5.4%) |
| Bachelor's Degree or higher | 225 (97.8%) | 0 (0.0%) |
| Total | 627 (83.4%) | 14 (1.9%) |
Employment Occupations by Sex in Milford
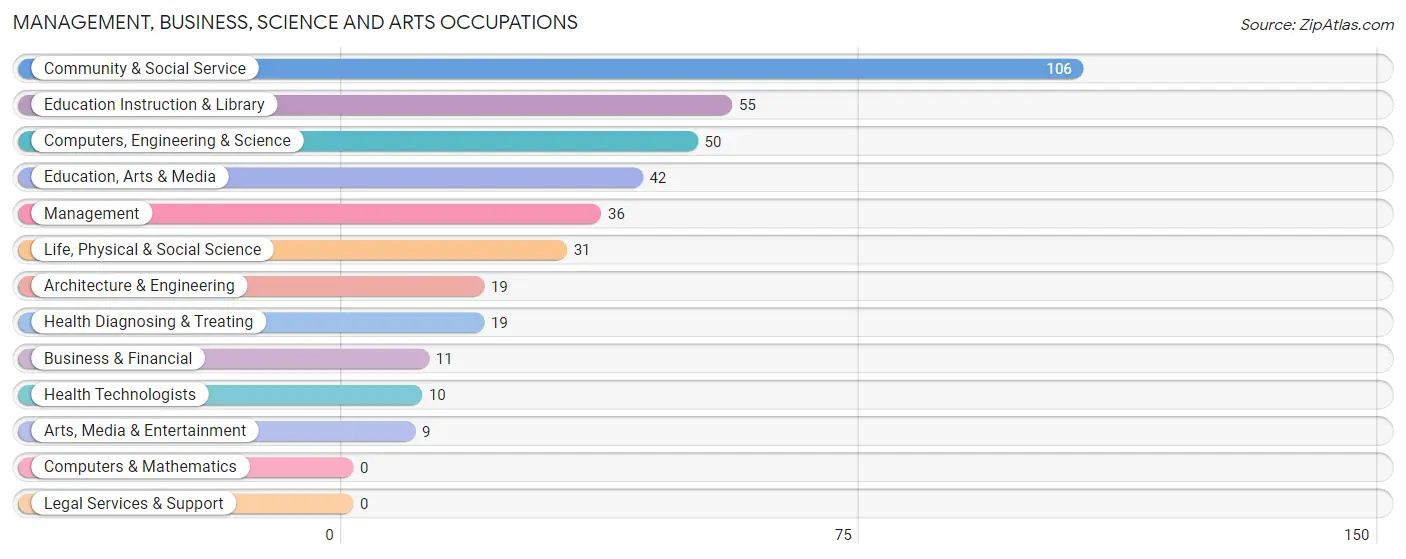
Management, Business, Science and Arts Occupations
The most common Management, Business, Science and Arts occupations in Milford are Community & Social Service (106 | 13.4%), Education Instruction & Library (55 | 6.9%), Computers, Engineering & Science (50 | 6.3%), Education, Arts & Media (42 | 5.3%), and Management (36 | 4.5%).
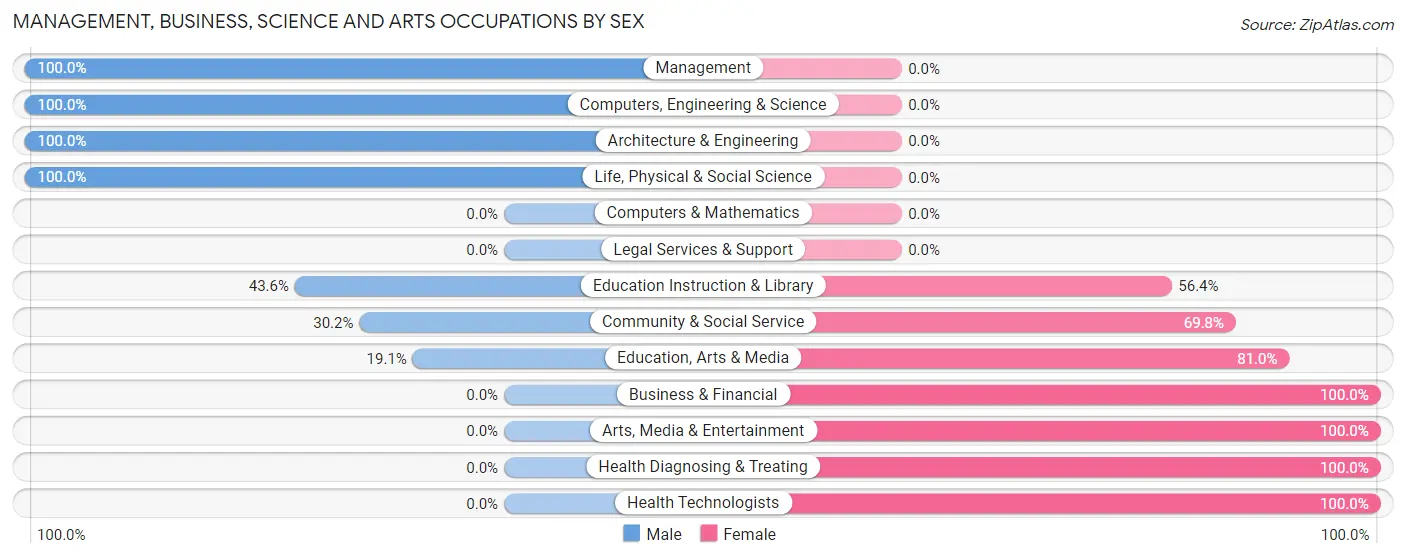
Management, Business, Science and Arts Occupations by Sex
Within the Management, Business, Science and Arts occupations in Milford, the most male-oriented occupations are Management (100.0%), Computers, Engineering & Science (100.0%), and Architecture & Engineering (100.0%), while the most female-oriented occupations are Business & Financial (100.0%), Arts, Media & Entertainment (100.0%), and Health Diagnosing & Treating (100.0%).
| Occupation | Male | Female |
| Management | 36 (100.0%) | 0 (0.0%) |
| Business & Financial | 0 (0.0%) | 11 (100.0%) |
| Computers, Engineering & Science | 50 (100.0%) | 0 (0.0%) |
| Computers & Mathematics | 0 (0.0%) | 0 (0.0%) |
| Architecture & Engineering | 19 (100.0%) | 0 (0.0%) |
| Life, Physical & Social Science | 31 (100.0%) | 0 (0.0%) |
| Community & Social Service | 32 (30.2%) | 74 (69.8%) |
| Education, Arts & Media | 8 (19.1%) | 34 (80.9%) |
| Legal Services & Support | 0 (0.0%) | 0 (0.0%) |
| Education Instruction & Library | 24 (43.6%) | 31 (56.4%) |
| Arts, Media & Entertainment | 0 (0.0%) | 9 (100.0%) |
| Health Diagnosing & Treating | 0 (0.0%) | 19 (100.0%) |
| Health Technologists | 0 (0.0%) | 10 (100.0%) |
| Total (Category) | 118 (53.1%) | 104 (46.9%) |
| Total (Overall) | 476 (60.0%) | 317 (40.0%) |
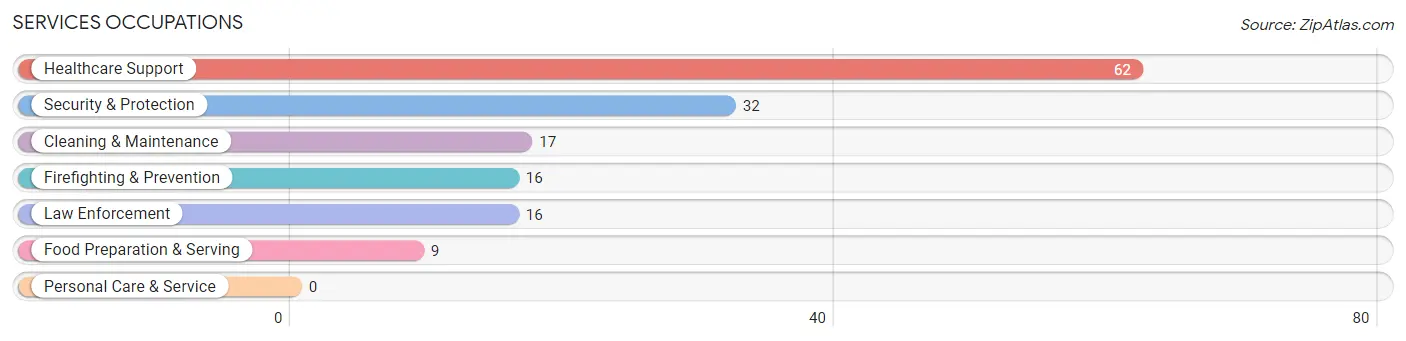
Services Occupations
The most common Services occupations in Milford are Healthcare Support (62 | 7.8%), Security & Protection (32 | 4.0%), Cleaning & Maintenance (17 | 2.1%), Firefighting & Prevention (16 | 2.0%), and Law Enforcement (16 | 2.0%).
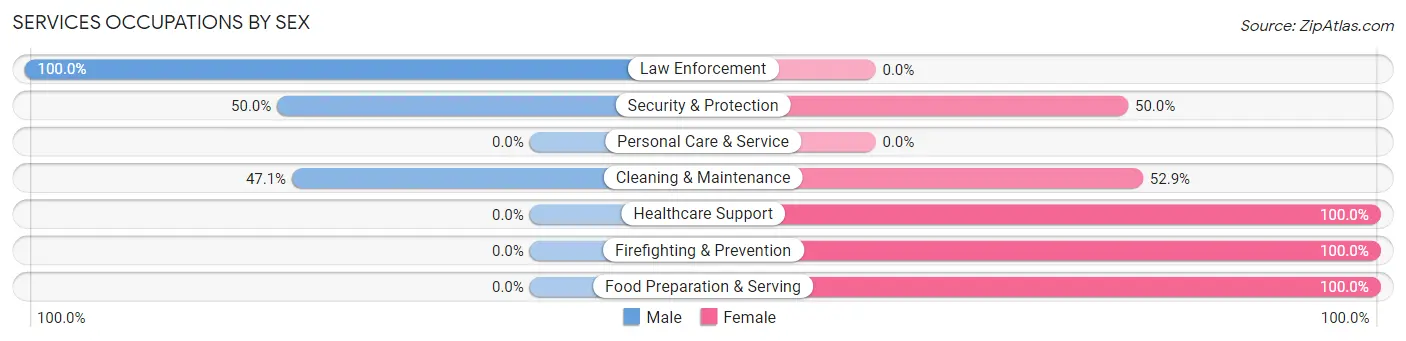
Services Occupations by Sex
Within the Services occupations in Milford, the most male-oriented occupations are Law Enforcement (100.0%), Security & Protection (50.0%), and Cleaning & Maintenance (47.1%), while the most female-oriented occupations are Healthcare Support (100.0%), Firefighting & Prevention (100.0%), and Food Preparation & Serving (100.0%).
| Occupation | Male | Female |
| Healthcare Support | 0 (0.0%) | 62 (100.0%) |
| Security & Protection | 16 (50.0%) | 16 (50.0%) |
| Firefighting & Prevention | 0 (0.0%) | 16 (100.0%) |
| Law Enforcement | 16 (100.0%) | 0 (0.0%) |
| Food Preparation & Serving | 0 (0.0%) | 9 (100.0%) |
| Cleaning & Maintenance | 8 (47.1%) | 9 (52.9%) |
| Personal Care & Service | 0 (0.0%) | 0 (0.0%) |
| Total (Category) | 24 (20.0%) | 96 (80.0%) |
| Total (Overall) | 476 (60.0%) | 317 (40.0%) |
Sales and Office Occupations
The most common Sales and Office occupations in Milford are , and Office & Administration (51 | 6.4%).
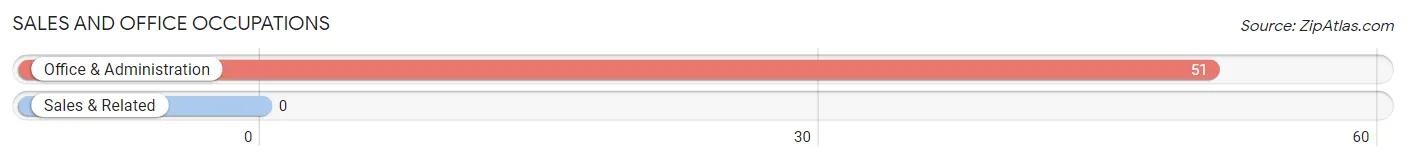
Sales and Office Occupations by Sex
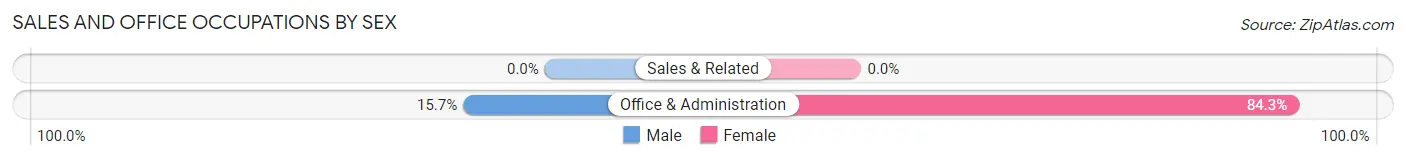
| Occupation | Male | Female |
| Sales & Related | 0 (0.0%) | 0 (0.0%) |
| Office & Administration | 8 (15.7%) | 43 (84.3%) |
| Total (Category) | 8 (15.7%) | 43 (84.3%) |
| Total (Overall) | 476 (60.0%) | 317 (40.0%) |
Natural Resources, Construction and Maintenance Occupations
The most common Natural Resources, Construction and Maintenance occupations in Milford are Farming, Fishing & Forestry (131 | 16.5%), Construction & Extraction (104 | 13.1%), and Installation, Maintenance & Repair (9 | 1.1%).
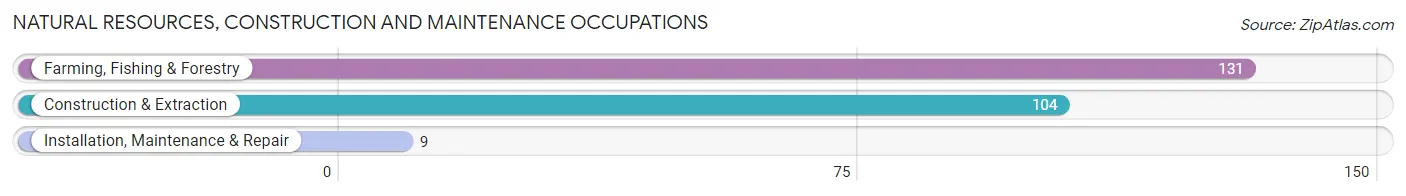
Natural Resources, Construction and Maintenance Occupations by Sex
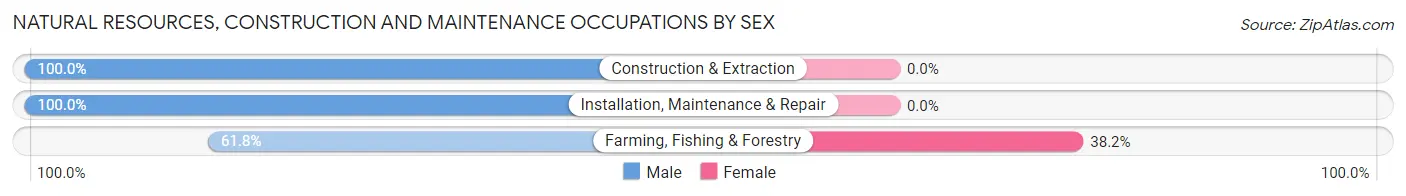
| Occupation | Male | Female |
| Farming, Fishing & Forestry | 81 (61.8%) | 50 (38.2%) |
| Construction & Extraction | 104 (100.0%) | 0 (0.0%) |
| Installation, Maintenance & Repair | 9 (100.0%) | 0 (0.0%) |
| Total (Category) | 194 (79.5%) | 50 (20.5%) |
| Total (Overall) | 476 (60.0%) | 317 (40.0%) |
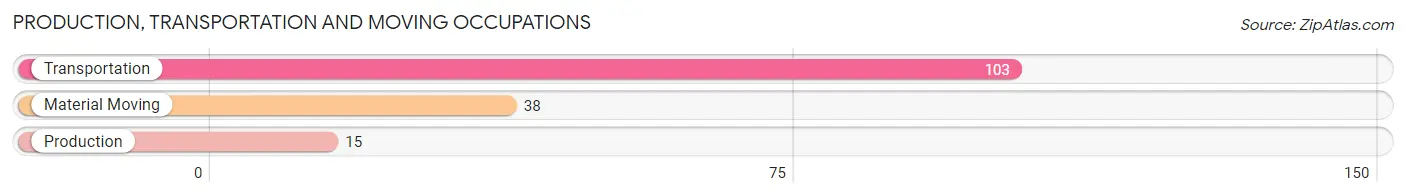
Production, Transportation and Moving Occupations
The most common Production, Transportation and Moving occupations in Milford are Transportation (103 | 13.0%), Material Moving (38 | 4.8%), and Production (15 | 1.9%).
Production, Transportation and Moving Occupations by Sex
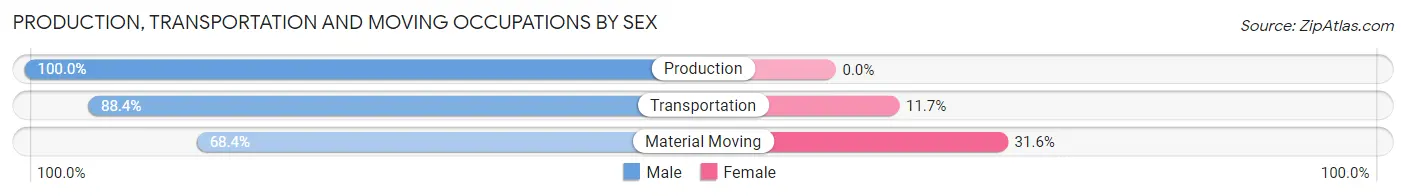
| Occupation | Male | Female |
| Production | 15 (100.0%) | 0 (0.0%) |
| Transportation | 91 (88.3%) | 12 (11.7%) |
| Material Moving | 26 (68.4%) | 12 (31.6%) |
| Total (Category) | 132 (84.6%) | 24 (15.4%) |
| Total (Overall) | 476 (60.0%) | 317 (40.0%) |
Employment Industries by Sex in Milford
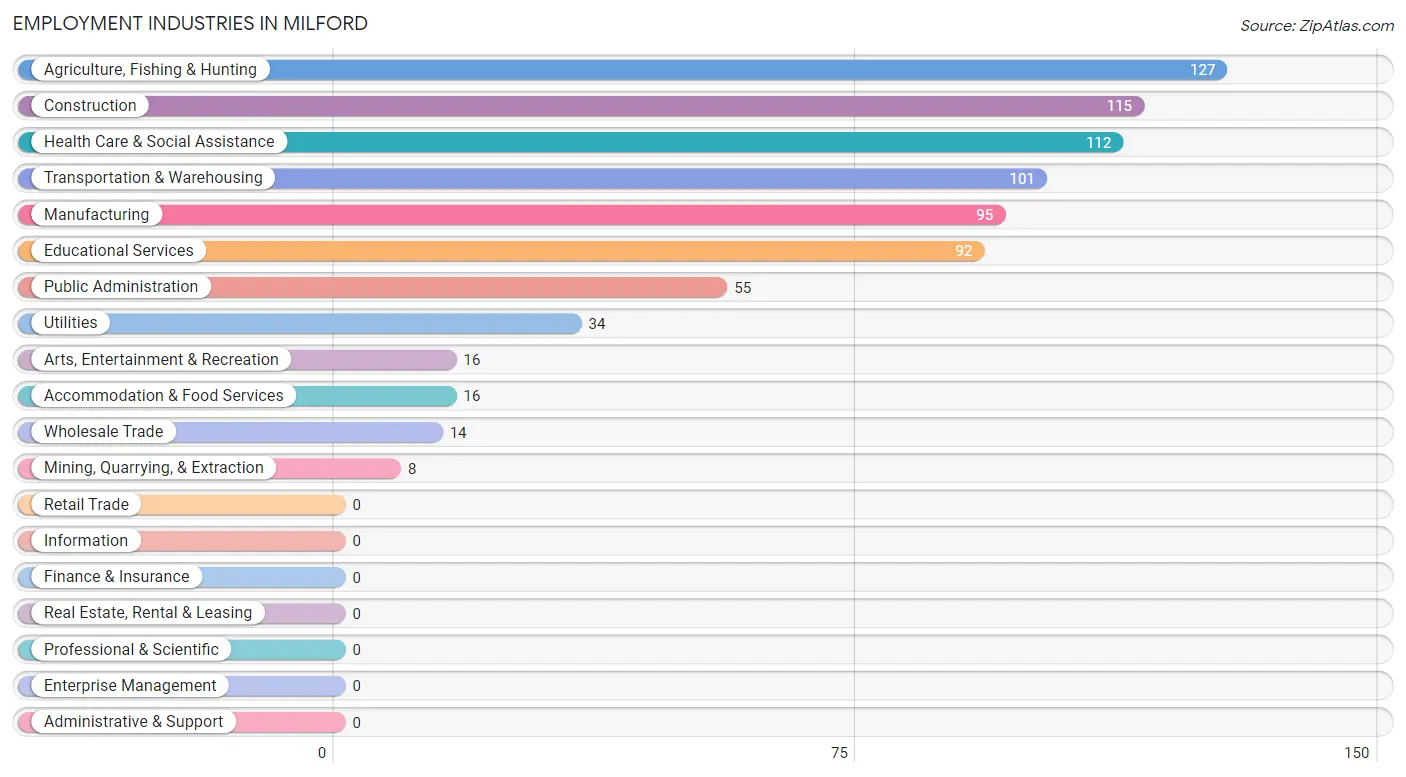
Employment Industries in Milford
The major employment industries in Milford include Agriculture, Fishing & Hunting (127 | 16.0%), Construction (115 | 14.5%), Health Care & Social Assistance (112 | 14.1%), Transportation & Warehousing (101 | 12.7%), and Manufacturing (95 | 12.0%).
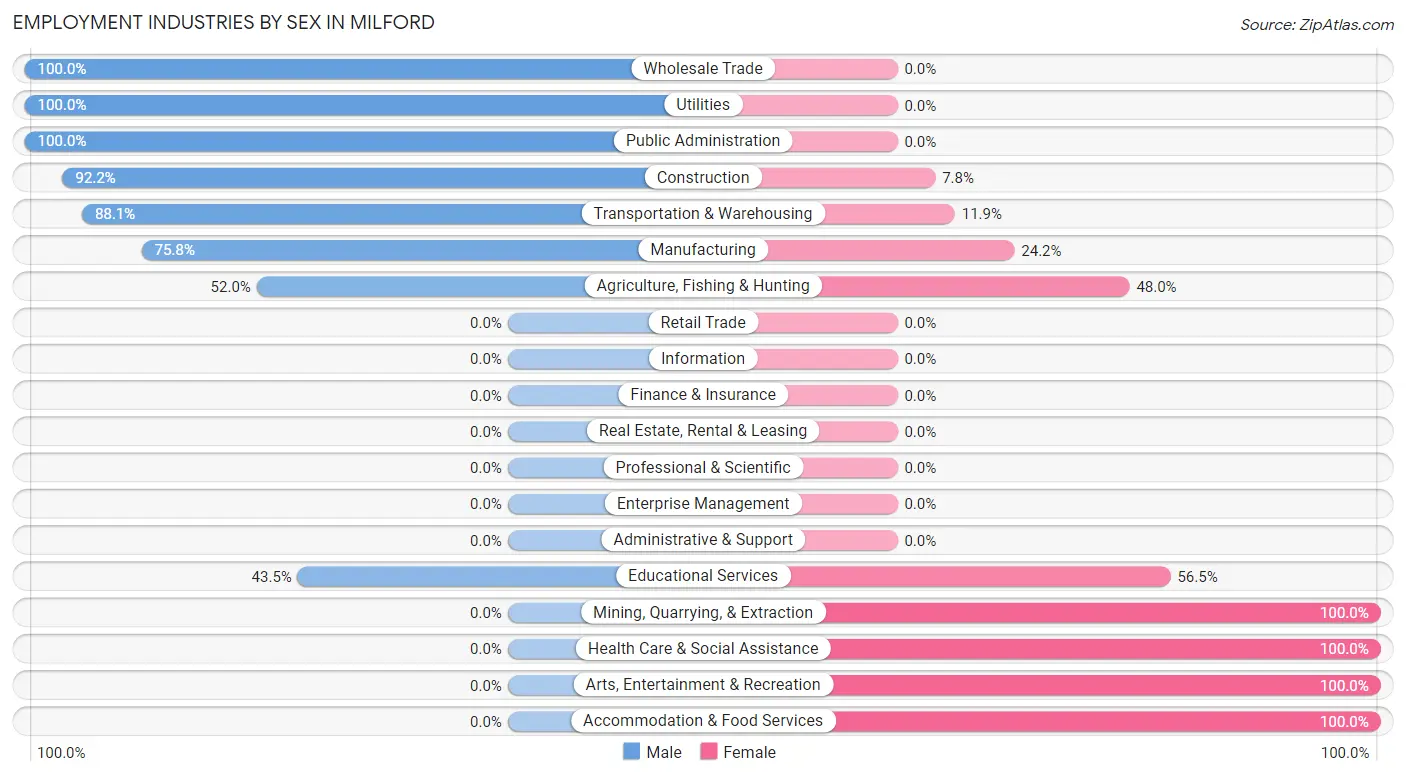
Employment Industries by Sex in Milford
The Milford industries that see more men than women are Wholesale Trade (100.0%), Utilities (100.0%), and Public Administration (100.0%), whereas the industries that tend to have a higher number of women are Mining, Quarrying, & Extraction (100.0%), Health Care & Social Assistance (100.0%), and Arts, Entertainment & Recreation (100.0%).
| Industry | Male | Female |
| Agriculture, Fishing & Hunting | 66 (52.0%) | 61 (48.0%) |
| Mining, Quarrying, & Extraction | 0 (0.0%) | 8 (100.0%) |
| Construction | 106 (92.2%) | 9 (7.8%) |
| Manufacturing | 72 (75.8%) | 23 (24.2%) |
| Wholesale Trade | 14 (100.0%) | 0 (0.0%) |
| Retail Trade | 0 (0.0%) | 0 (0.0%) |
| Transportation & Warehousing | 89 (88.1%) | 12 (11.9%) |
| Utilities | 34 (100.0%) | 0 (0.0%) |
| Information | 0 (0.0%) | 0 (0.0%) |
| Finance & Insurance | 0 (0.0%) | 0 (0.0%) |
| Real Estate, Rental & Leasing | 0 (0.0%) | 0 (0.0%) |
| Professional & Scientific | 0 (0.0%) | 0 (0.0%) |
| Enterprise Management | 0 (0.0%) | 0 (0.0%) |
| Administrative & Support | 0 (0.0%) | 0 (0.0%) |
| Educational Services | 40 (43.5%) | 52 (56.5%) |
| Health Care & Social Assistance | 0 (0.0%) | 112 (100.0%) |
| Arts, Entertainment & Recreation | 0 (0.0%) | 16 (100.0%) |
| Accommodation & Food Services | 0 (0.0%) | 16 (100.0%) |
| Public Administration | 55 (100.0%) | 0 (0.0%) |
| Total | 476 (60.0%) | 317 (40.0%) |
Education in Milford
School Enrollment in Milford
The most common levels of schooling among the 600 students in Milford are high school (184 | 30.7%), elementary school (151 | 25.2%), and middle school (131 | 21.8%).
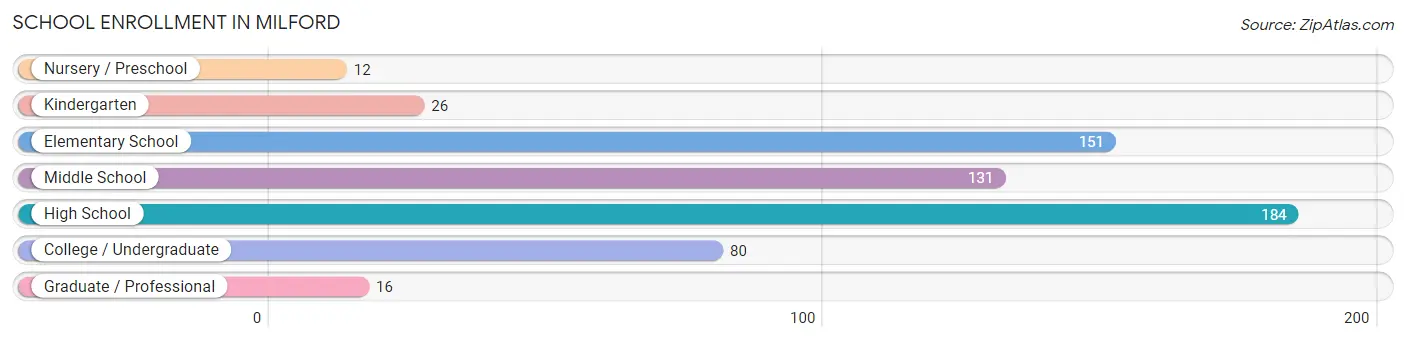
| School Level | # Students | % Students |
| Nursery / Preschool | 12 | 2.0% |
| Kindergarten | 26 | 4.3% |
| Elementary School | 151 | 25.2% |
| Middle School | 131 | 21.8% |
| High School | 184 | 30.7% |
| College / Undergraduate | 80 | 13.3% |
| Graduate / Professional | 16 | 2.7% |
| Total | 600 | 100.0% |
School Enrollment by Age by Funding Source in Milford
Out of a total of 600 students who are enrolled in schools in Milford, 23 (3.8%) attend a private institution, while the remaining 577 (96.2%) are enrolled in public schools. The age group of 3 to 4 year olds has the highest likelihood of being enrolled in private schools, with 12 (100.0% in the age bracket) enrolled. Conversely, the age group of 5 to 9 year old has the lowest likelihood of being enrolled in a private school, with 177 (100.0% in the age bracket) attending a public institution.
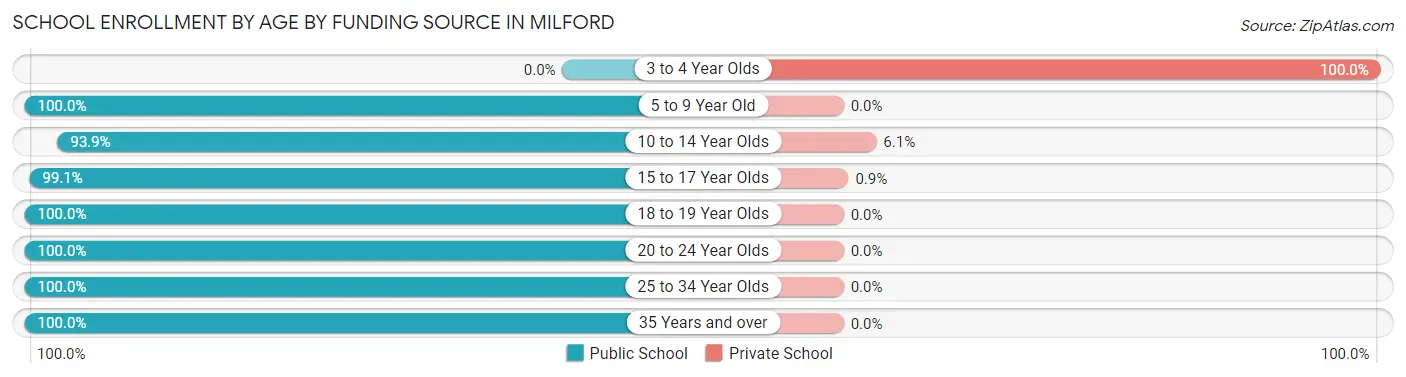
| Age Bracket | Public School | Private School |
| 3 to 4 Year Olds | 0 (0.0%) | 12 (100.0%) |
| 5 to 9 Year Old | 177 (100.0%) | 0 (0.0%) |
| 10 to 14 Year Olds | 154 (93.9%) | 10 (6.1%) |
| 15 to 17 Year Olds | 110 (99.1%) | 1 (0.9%) |
| 18 to 19 Year Olds | 65 (100.0%) | 0 (0.0%) |
| 20 to 24 Year Olds | 47 (100.0%) | 0 (0.0%) |
| 25 to 34 Year Olds | 6 (100.0%) | 0 (0.0%) |
| 35 Years and over | 18 (100.0%) | 0 (0.0%) |
| Total | 577 (96.2%) | 23 (3.8%) |
Educational Attainment by Field of Study in Milford
Bio, nature & agricultural (56 | 23.0%), engineering (37 | 15.2%), science & technology (33 | 13.5%), education (29 | 11.9%), and business (20 | 8.2%) are the most common fields of study among 244 individuals in Milford who have obtained a bachelor's degree or higher.
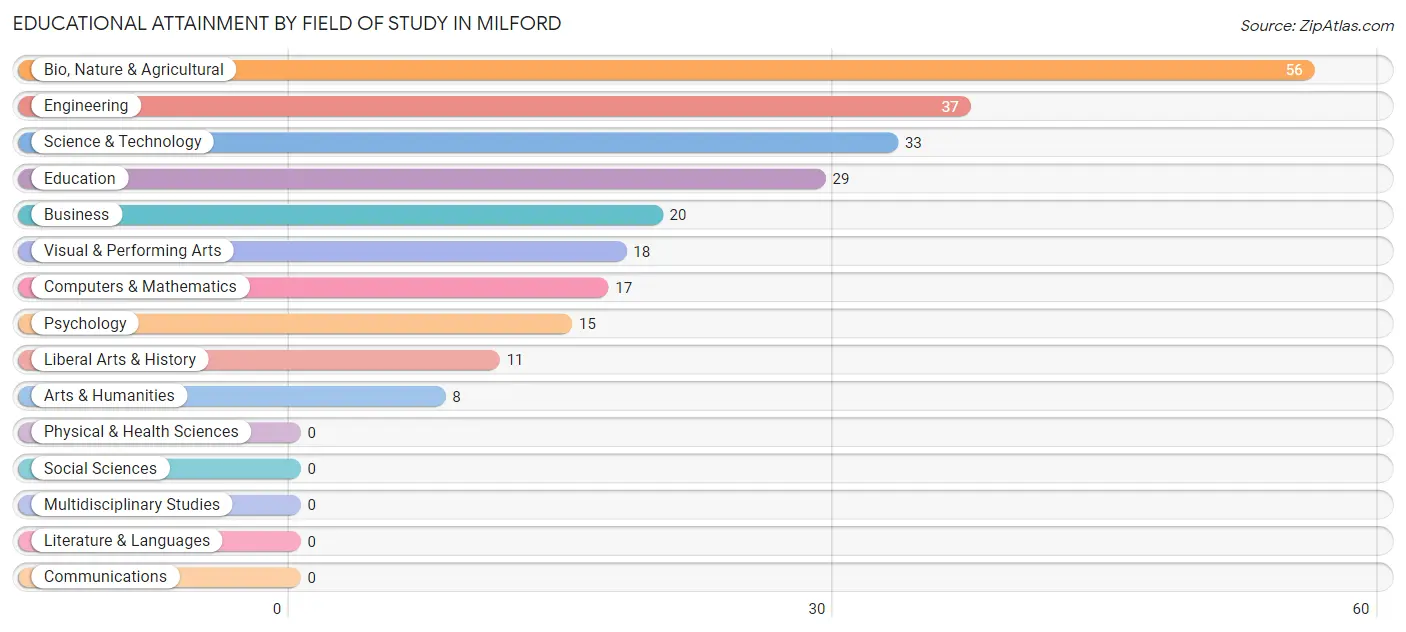
| Field of Study | # Graduates | % Graduates |
| Computers & Mathematics | 17 | 7.0% |
| Bio, Nature & Agricultural | 56 | 23.0% |
| Physical & Health Sciences | 0 | 0.0% |
| Psychology | 15 | 6.1% |
| Social Sciences | 0 | 0.0% |
| Engineering | 37 | 15.2% |
| Multidisciplinary Studies | 0 | 0.0% |
| Science & Technology | 33 | 13.5% |
| Business | 20 | 8.2% |
| Education | 29 | 11.9% |
| Literature & Languages | 0 | 0.0% |
| Liberal Arts & History | 11 | 4.5% |
| Visual & Performing Arts | 18 | 7.4% |
| Communications | 0 | 0.0% |
| Arts & Humanities | 8 | 3.3% |
| Total | 244 | 100.0% |
Transportation & Commute in Milford
Vehicle Availability by Sex in Milford
The most prevalent vehicle ownership categories in Milford are males with 5 or more vehicles (130, accounting for 28.3%) and females with 5 or more vehicles (55, making up 42.5%).
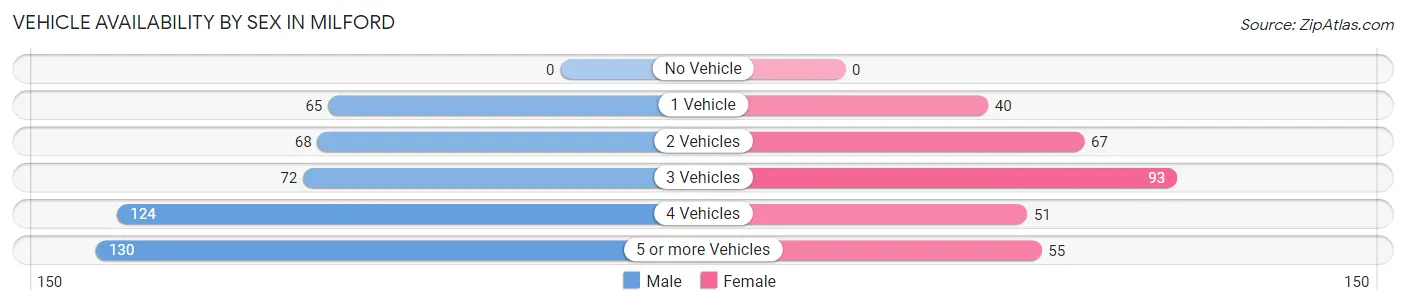
| Vehicles Available | Male | Female |
| No Vehicle | 0 (0.0%) | 0 (0.0%) |
| 1 Vehicle | 65 (14.2%) | 40 (13.1%) |
| 2 Vehicles | 68 (14.8%) | 67 (21.9%) |
| 3 Vehicles | 72 (15.7%) | 93 (30.4%) |
| 4 Vehicles | 124 (27.0%) | 51 (16.7%) |
| 5 or more Vehicles | 130 (28.3%) | 55 (18.0%) |
| Total | 459 (100.0%) | 306 (100.0%) |
Commute Time in Milford
The most frequently occuring commute durations in Milford are less than 5 minutes (212 commuters, 28.0%), 5 to 9 minutes (178 commuters, 23.5%), and 20 to 24 minutes (70 commuters, 9.2%).
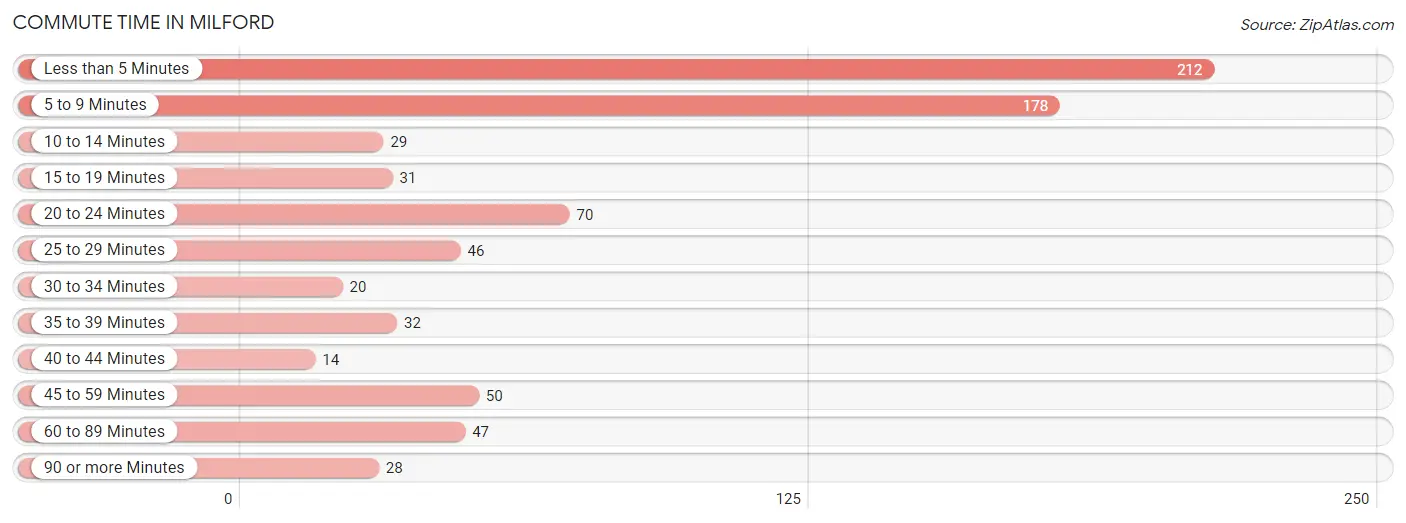
| Commute Time | # Commuters | % Commuters |
| Less than 5 Minutes | 212 | 28.0% |
| 5 to 9 Minutes | 178 | 23.5% |
| 10 to 14 Minutes | 29 | 3.8% |
| 15 to 19 Minutes | 31 | 4.1% |
| 20 to 24 Minutes | 70 | 9.2% |
| 25 to 29 Minutes | 46 | 6.1% |
| 30 to 34 Minutes | 20 | 2.6% |
| 35 to 39 Minutes | 32 | 4.2% |
| 40 to 44 Minutes | 14 | 1.8% |
| 45 to 59 Minutes | 50 | 6.6% |
| 60 to 89 Minutes | 47 | 6.2% |
| 90 or more Minutes | 28 | 3.7% |
Commute Time by Sex in Milford
The most common commute times in Milford are 5 to 9 minutes (127 commuters, 28.2%) for males and less than 5 minutes (155 commuters, 50.6%) for females.
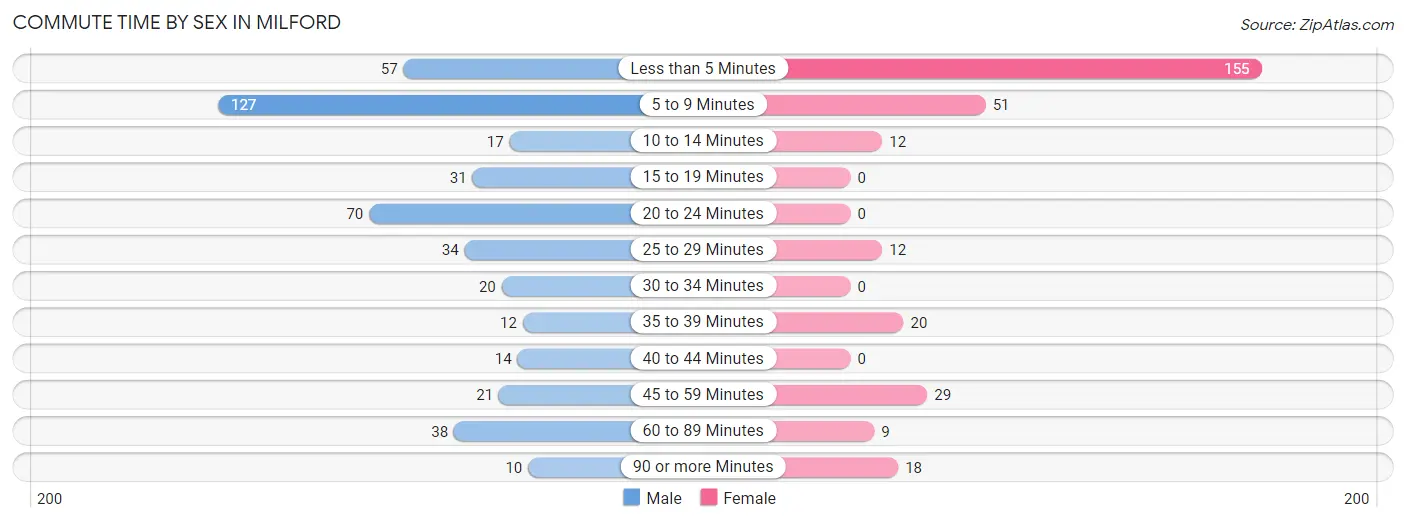
| Commute Time | Male | Female |
| Less than 5 Minutes | 57 (12.6%) | 155 (50.6%) |
| 5 to 9 Minutes | 127 (28.2%) | 51 (16.7%) |
| 10 to 14 Minutes | 17 (3.8%) | 12 (3.9%) |
| 15 to 19 Minutes | 31 (6.9%) | 0 (0.0%) |
| 20 to 24 Minutes | 70 (15.5%) | 0 (0.0%) |
| 25 to 29 Minutes | 34 (7.5%) | 12 (3.9%) |
| 30 to 34 Minutes | 20 (4.4%) | 0 (0.0%) |
| 35 to 39 Minutes | 12 (2.7%) | 20 (6.5%) |
| 40 to 44 Minutes | 14 (3.1%) | 0 (0.0%) |
| 45 to 59 Minutes | 21 (4.7%) | 29 (9.5%) |
| 60 to 89 Minutes | 38 (8.4%) | 9 (2.9%) |
| 90 or more Minutes | 10 (2.2%) | 18 (5.9%) |
Time of Departure to Work by Sex in Milford
The most frequent times of departure to work in Milford are 5:30 AM to 5:59 AM (125, 27.7%) for males and 5:30 AM to 5:59 AM (57, 18.6%) for females.
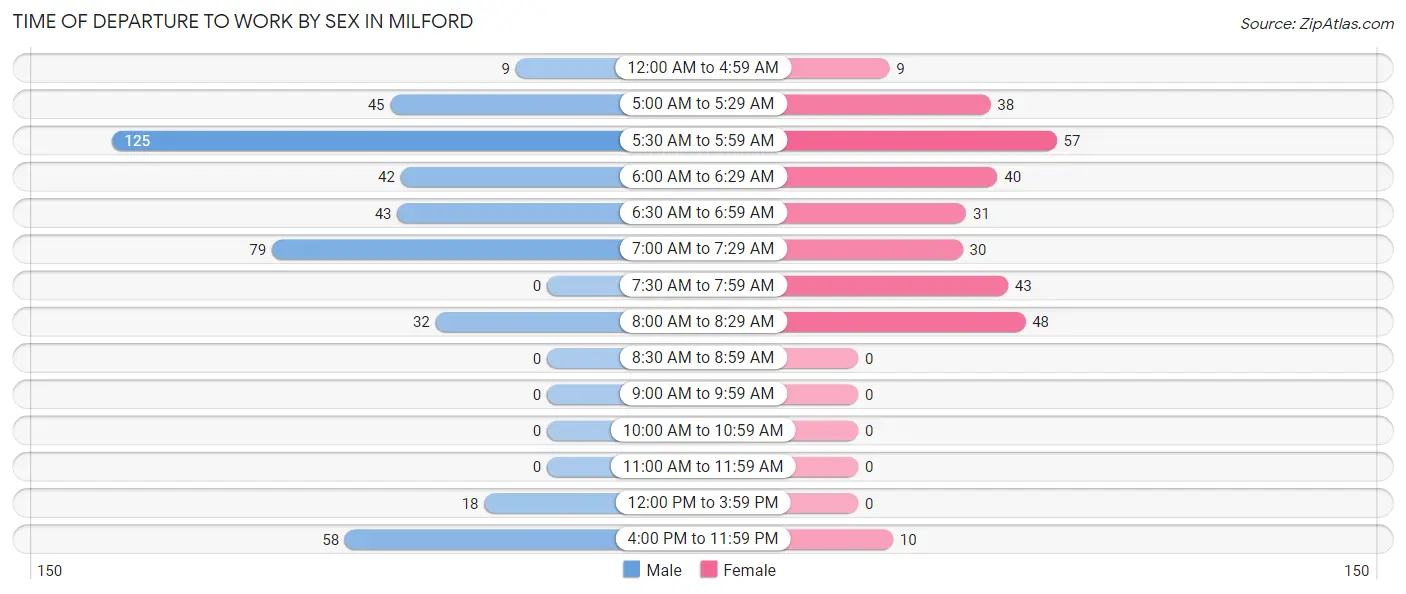
| Time of Departure | Male | Female |
| 12:00 AM to 4:59 AM | 9 (2.0%) | 9 (2.9%) |
| 5:00 AM to 5:29 AM | 45 (10.0%) | 38 (12.4%) |
| 5:30 AM to 5:59 AM | 125 (27.7%) | 57 (18.6%) |
| 6:00 AM to 6:29 AM | 42 (9.3%) | 40 (13.1%) |
| 6:30 AM to 6:59 AM | 43 (9.5%) | 31 (10.1%) |
| 7:00 AM to 7:29 AM | 79 (17.5%) | 30 (9.8%) |
| 7:30 AM to 7:59 AM | 0 (0.0%) | 43 (14.1%) |
| 8:00 AM to 8:29 AM | 32 (7.1%) | 48 (15.7%) |
| 8:30 AM to 8:59 AM | 0 (0.0%) | 0 (0.0%) |
| 9:00 AM to 9:59 AM | 0 (0.0%) | 0 (0.0%) |
| 10:00 AM to 10:59 AM | 0 (0.0%) | 0 (0.0%) |
| 11:00 AM to 11:59 AM | 0 (0.0%) | 0 (0.0%) |
| 12:00 PM to 3:59 PM | 18 (4.0%) | 0 (0.0%) |
| 4:00 PM to 11:59 PM | 58 (12.9%) | 10 (3.3%) |
| Total | 451 (100.0%) | 306 (100.0%) |
Housing Occupancy in Milford
Occupancy by Ownership in Milford
Of the total 485 dwellings in Milford, owner-occupied units account for 346 (71.3%), while renter-occupied units make up 139 (28.7%).
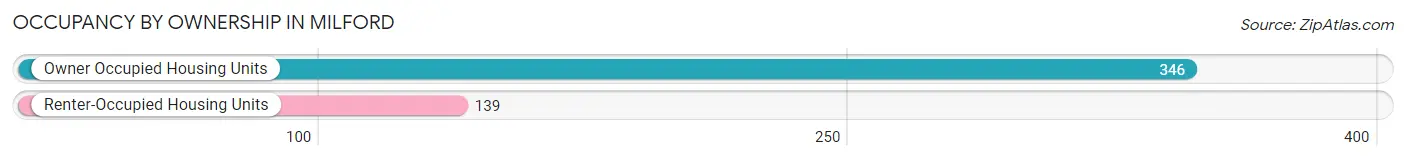
| Occupancy | # Housing Units | % Housing Units |
| Owner Occupied Housing Units | 346 | 71.3% |
| Renter-Occupied Housing Units | 139 | 28.7% |
| Total Occupied Housing Units | 485 | 100.0% |
Occupancy by Household Size in Milford
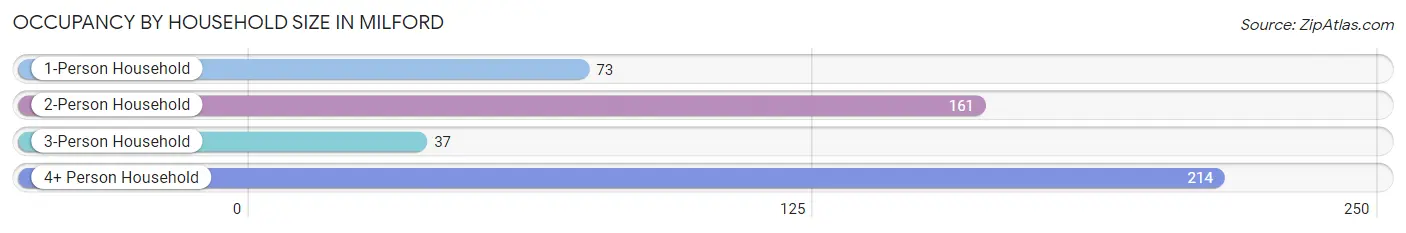
| Household Size | # Housing Units | % Housing Units |
| 1-Person Household | 73 | 15.0% |
| 2-Person Household | 161 | 33.2% |
| 3-Person Household | 37 | 7.6% |
| 4+ Person Household | 214 | 44.1% |
| Total Housing Units | 485 | 100.0% |
Occupancy by Ownership by Household Size in Milford
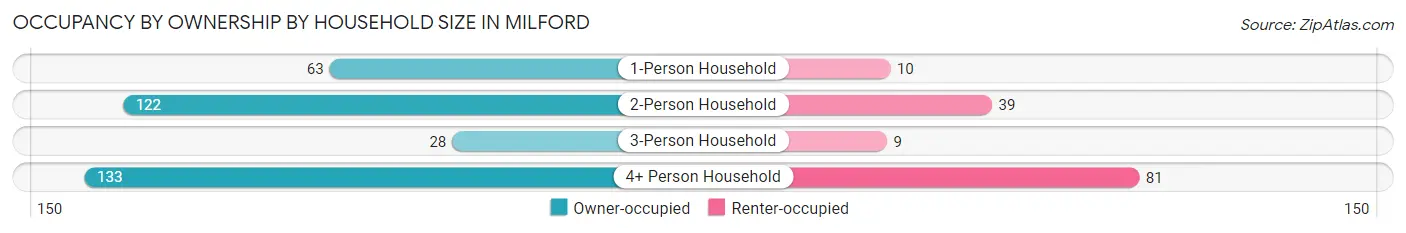
| Household Size | Owner-occupied | Renter-occupied |
| 1-Person Household | 63 (86.3%) | 10 (13.7%) |
| 2-Person Household | 122 (75.8%) | 39 (24.2%) |
| 3-Person Household | 28 (75.7%) | 9 (24.3%) |
| 4+ Person Household | 133 (62.2%) | 81 (37.9%) |
| Total Housing Units | 346 (71.3%) | 139 (28.7%) |
Occupancy by Educational Attainment in Milford
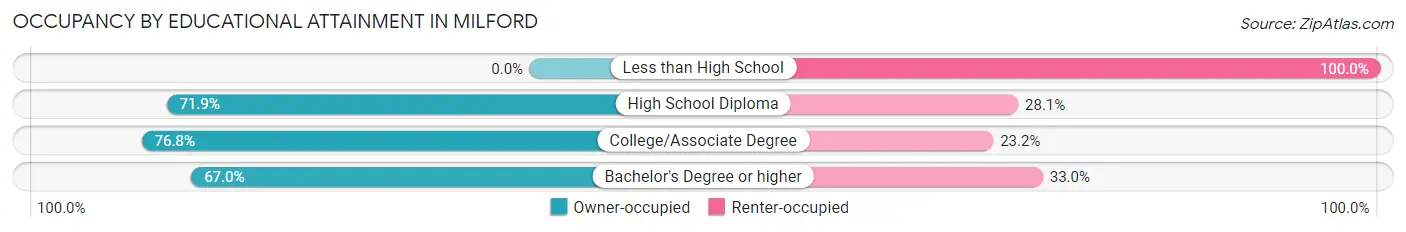
| Household Size | Owner-occupied | Renter-occupied |
| Less than High School | 0 (0.0%) | 9 (100.0%) |
| High School Diploma | 120 (71.9%) | 47 (28.1%) |
| College/Associate Degree | 149 (76.8%) | 45 (23.2%) |
| Bachelor's Degree or higher | 77 (67.0%) | 38 (33.0%) |
Occupancy by Age of Householder in Milford
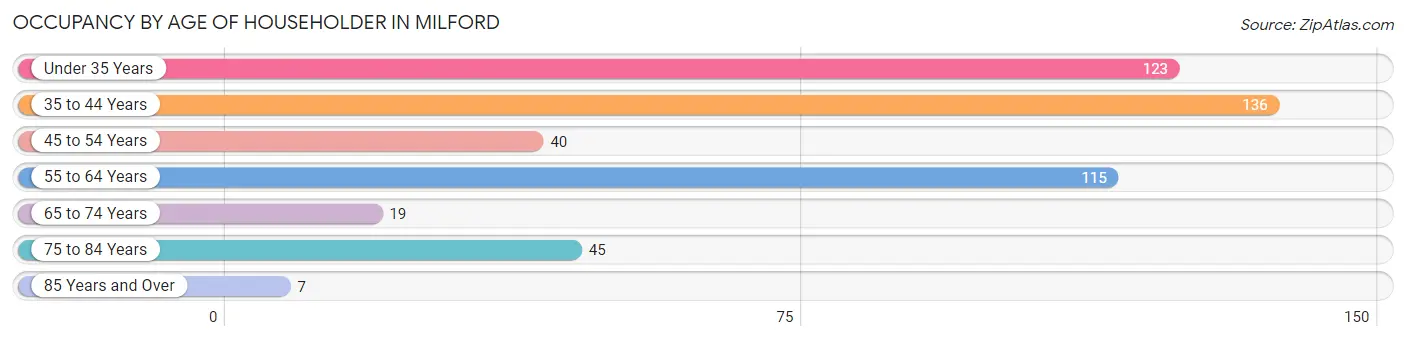
| Age Bracket | # Households | % Households |
| Under 35 Years | 123 | 25.4% |
| 35 to 44 Years | 136 | 28.0% |
| 45 to 54 Years | 40 | 8.3% |
| 55 to 64 Years | 115 | 23.7% |
| 65 to 74 Years | 19 | 3.9% |
| 75 to 84 Years | 45 | 9.3% |
| 85 Years and Over | 7 | 1.4% |
| Total | 485 | 100.0% |
Housing Finances in Milford
Median Income by Occupancy in Milford
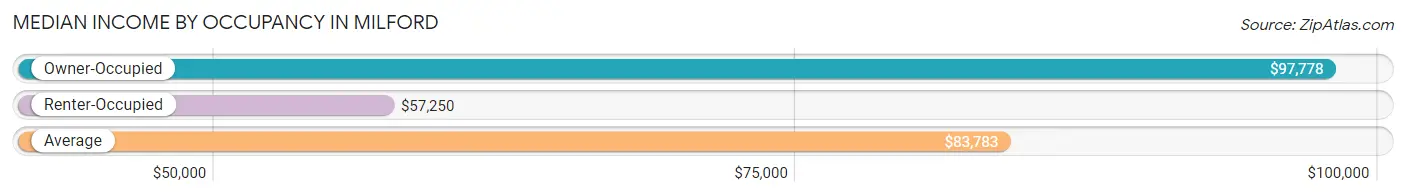
| Occupancy Type | # Households | Median Income |
| Owner-Occupied | 346 (71.3%) | $97,778 |
| Renter-Occupied | 139 (28.7%) | $57,250 |
| Average | 485 (100.0%) | $83,783 |
Occupancy by Householder Income Bracket in Milford
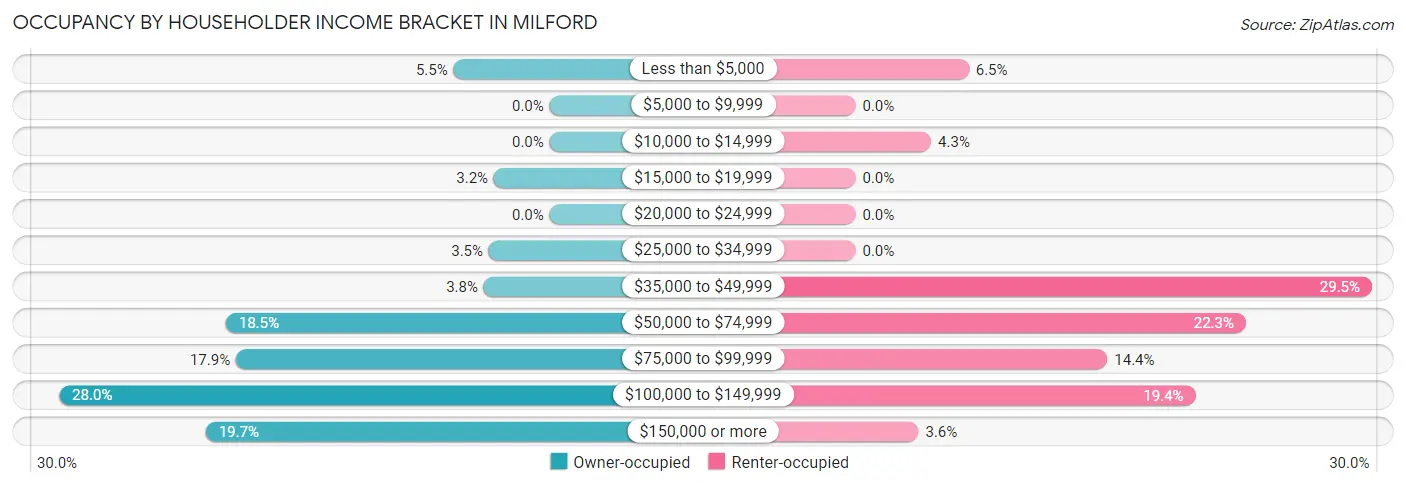
| Income Bracket | Owner-occupied | Renter-occupied |
| Less than $5,000 | 19 (5.5%) | 9 (6.5%) |
| $5,000 to $9,999 | 0 (0.0%) | 0 (0.0%) |
| $10,000 to $14,999 | 0 (0.0%) | 6 (4.3%) |
| $15,000 to $19,999 | 11 (3.2%) | 0 (0.0%) |
| $20,000 to $24,999 | 0 (0.0%) | 0 (0.0%) |
| $25,000 to $34,999 | 12 (3.5%) | 0 (0.0%) |
| $35,000 to $49,999 | 13 (3.8%) | 41 (29.5%) |
| $50,000 to $74,999 | 64 (18.5%) | 31 (22.3%) |
| $75,000 to $99,999 | 62 (17.9%) | 20 (14.4%) |
| $100,000 to $149,999 | 97 (28.0%) | 27 (19.4%) |
| $150,000 or more | 68 (19.7%) | 5 (3.6%) |
| Total | 346 (100.0%) | 139 (100.0%) |
Monthly Housing Cost Tiers in Milford
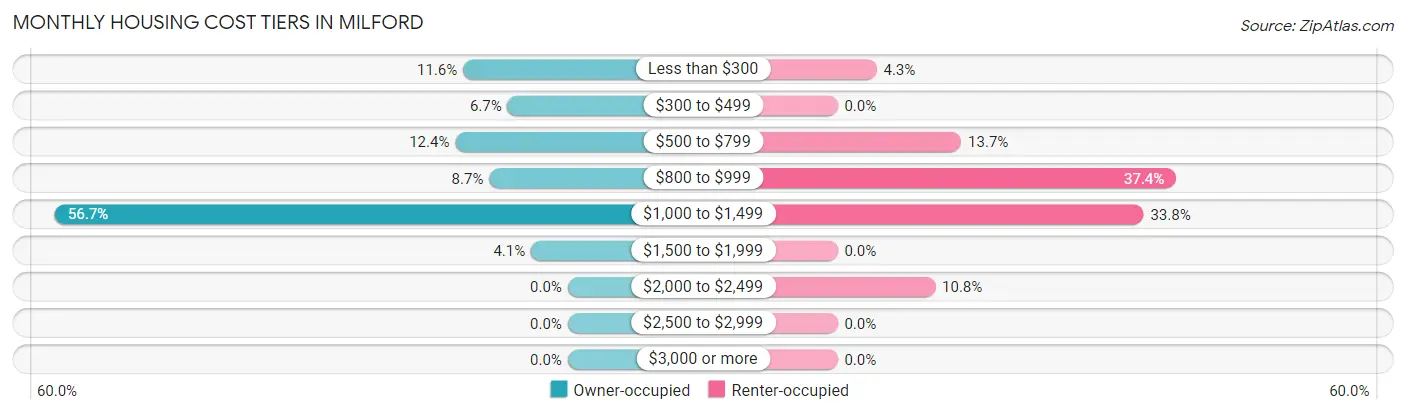
| Monthly Cost | Owner-occupied | Renter-occupied |
| Less than $300 | 40 (11.6%) | 6 (4.3%) |
| $300 to $499 | 23 (6.7%) | 0 (0.0%) |
| $500 to $799 | 43 (12.4%) | 19 (13.7%) |
| $800 to $999 | 30 (8.7%) | 52 (37.4%) |
| $1,000 to $1,499 | 196 (56.7%) | 47 (33.8%) |
| $1,500 to $1,999 | 14 (4.1%) | 0 (0.0%) |
| $2,000 to $2,499 | 0 (0.0%) | 15 (10.8%) |
| $2,500 to $2,999 | 0 (0.0%) | 0 (0.0%) |
| $3,000 or more | 0 (0.0%) | 0 (0.0%) |
| Total | 346 (100.0%) | 139 (100.0%) |
Physical Housing Characteristics in Milford
Housing Structures in Milford
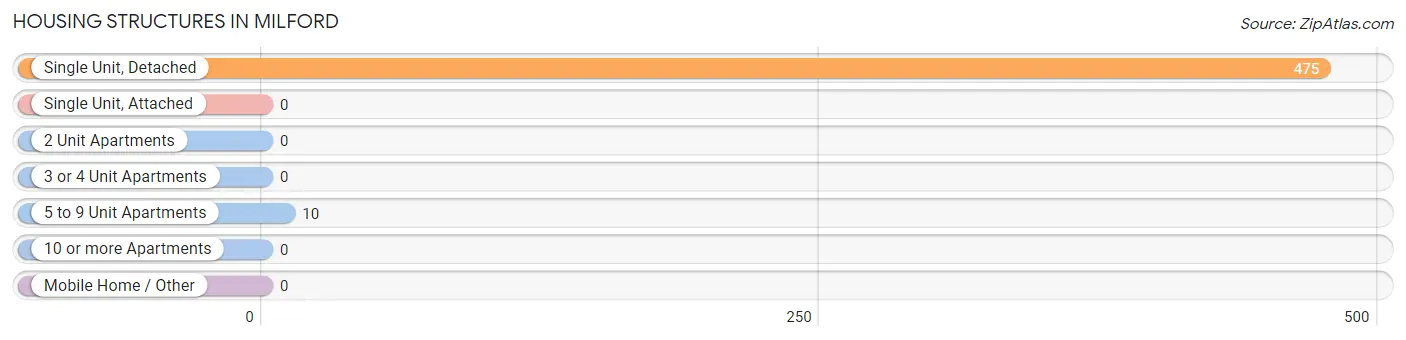
| Structure Type | # Housing Units | % Housing Units |
| Single Unit, Detached | 475 | 97.9% |
| Single Unit, Attached | 0 | 0.0% |
| 2 Unit Apartments | 0 | 0.0% |
| 3 or 4 Unit Apartments | 0 | 0.0% |
| 5 to 9 Unit Apartments | 10 | 2.1% |
| 10 or more Apartments | 0 | 0.0% |
| Mobile Home / Other | 0 | 0.0% |
| Total | 485 | 100.0% |
Housing Structures by Occupancy in Milford
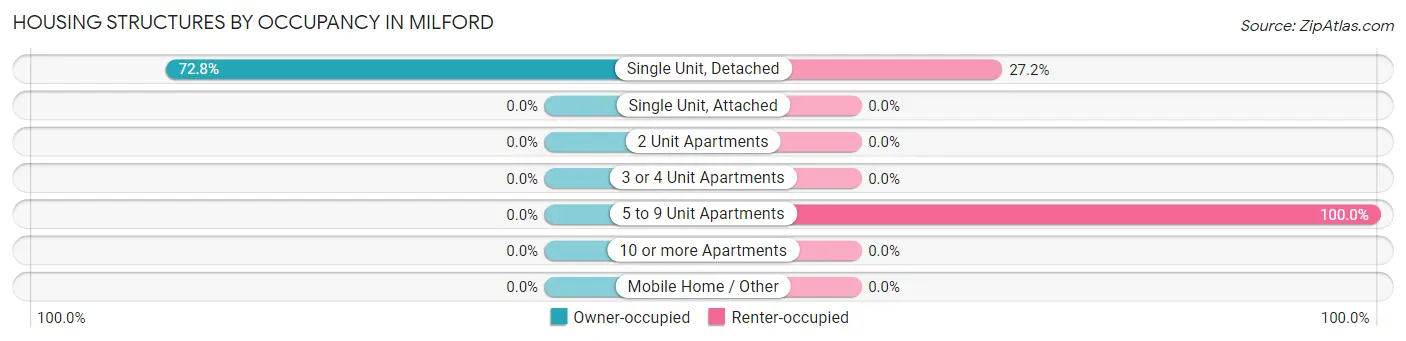
| Structure Type | Owner-occupied | Renter-occupied |
| Single Unit, Detached | 346 (72.8%) | 129 (27.2%) |
| Single Unit, Attached | 0 (0.0%) | 0 (0.0%) |
| 2 Unit Apartments | 0 (0.0%) | 0 (0.0%) |
| 3 or 4 Unit Apartments | 0 (0.0%) | 0 (0.0%) |
| 5 to 9 Unit Apartments | 0 (0.0%) | 10 (100.0%) |
| 10 or more Apartments | 0 (0.0%) | 0 (0.0%) |
| Mobile Home / Other | 0 (0.0%) | 0 (0.0%) |
| Total | 346 (71.3%) | 139 (28.7%) |
Housing Structures by Number of Rooms in Milford
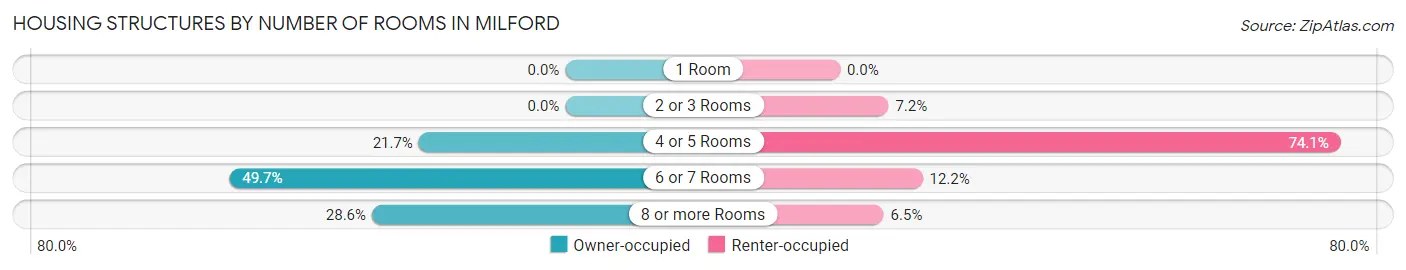
| Number of Rooms | Owner-occupied | Renter-occupied |
| 1 Room | 0 (0.0%) | 0 (0.0%) |
| 2 or 3 Rooms | 0 (0.0%) | 10 (7.2%) |
| 4 or 5 Rooms | 75 (21.7%) | 103 (74.1%) |
| 6 or 7 Rooms | 172 (49.7%) | 17 (12.2%) |
| 8 or more Rooms | 99 (28.6%) | 9 (6.5%) |
| Total | 346 (100.0%) | 139 (100.0%) |
Housing Structure by Heating Type in Milford
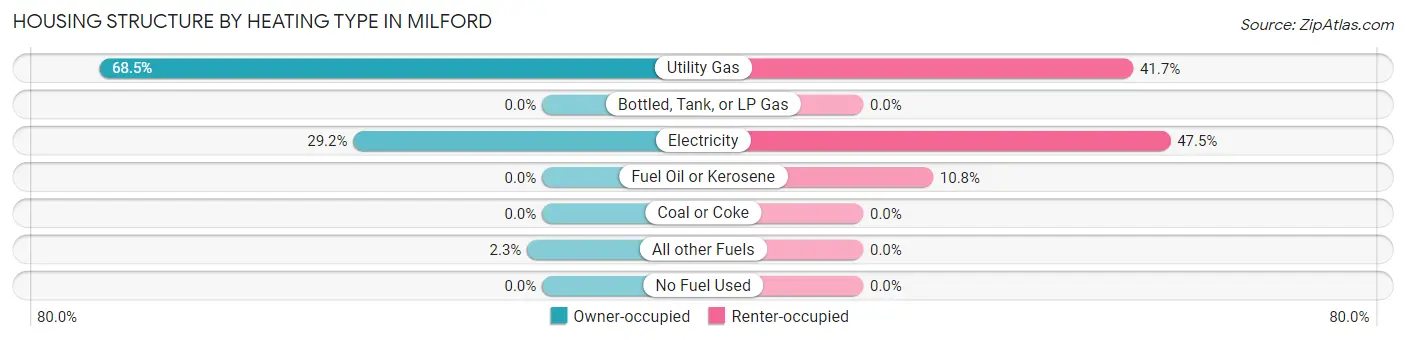
| Heating Type | Owner-occupied | Renter-occupied |
| Utility Gas | 237 (68.5%) | 58 (41.7%) |
| Bottled, Tank, or LP Gas | 0 (0.0%) | 0 (0.0%) |
| Electricity | 101 (29.2%) | 66 (47.5%) |
| Fuel Oil or Kerosene | 0 (0.0%) | 15 (10.8%) |
| Coal or Coke | 0 (0.0%) | 0 (0.0%) |
| All other Fuels | 8 (2.3%) | 0 (0.0%) |
| No Fuel Used | 0 (0.0%) | 0 (0.0%) |
| Total | 346 (100.0%) | 139 (100.0%) |
Household Vehicle Usage in Milford
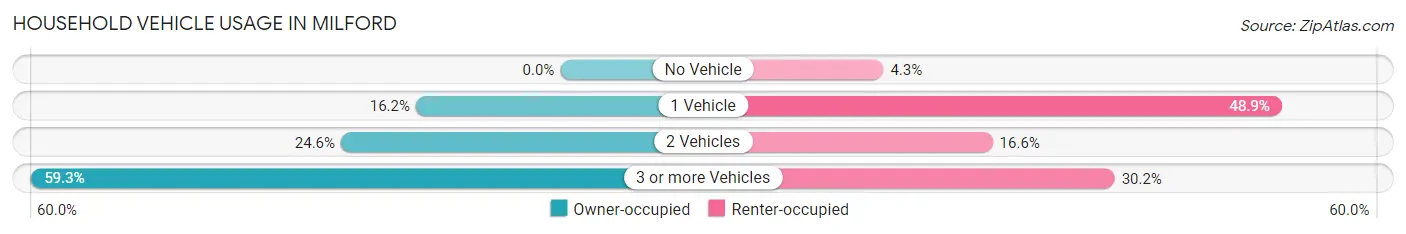
| Vehicles per Household | Owner-occupied | Renter-occupied |
| No Vehicle | 0 (0.0%) | 6 (4.3%) |
| 1 Vehicle | 56 (16.2%) | 68 (48.9%) |
| 2 Vehicles | 85 (24.6%) | 23 (16.6%) |
| 3 or more Vehicles | 205 (59.3%) | 42 (30.2%) |
| Total | 346 (100.0%) | 139 (100.0%) |
Real Estate & Mortgages in Milford
Real Estate and Mortgage Overview in Milford
| Characteristic | Without Mortgage | With Mortgage |
| Housing Units | 72 | 274 |
| Median Property Value | - | - |
| Median Household Income | $68,611 | $63 |
| Monthly Housing Costs | $278 | $0 |
| Real Estate Taxes | $560 | $0 |
Property Value by Mortgage Status in Milford
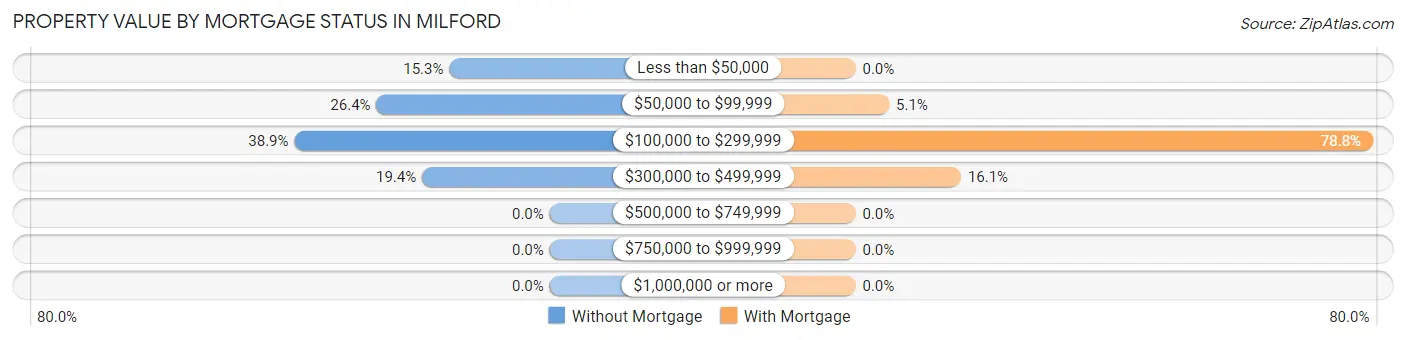
| Property Value | Without Mortgage | With Mortgage |
| Less than $50,000 | 11 (15.3%) | 0 (0.0%) |
| $50,000 to $99,999 | 19 (26.4%) | 14 (5.1%) |
| $100,000 to $299,999 | 28 (38.9%) | 216 (78.8%) |
| $300,000 to $499,999 | 14 (19.4%) | 44 (16.1%) |
| $500,000 to $749,999 | 0 (0.0%) | 0 (0.0%) |
| $750,000 to $999,999 | 0 (0.0%) | 0 (0.0%) |
| $1,000,000 or more | 0 (0.0%) | 0 (0.0%) |
| Total | 72 (100.0%) | 274 (100.0%) |
Household Income by Mortgage Status in Milford
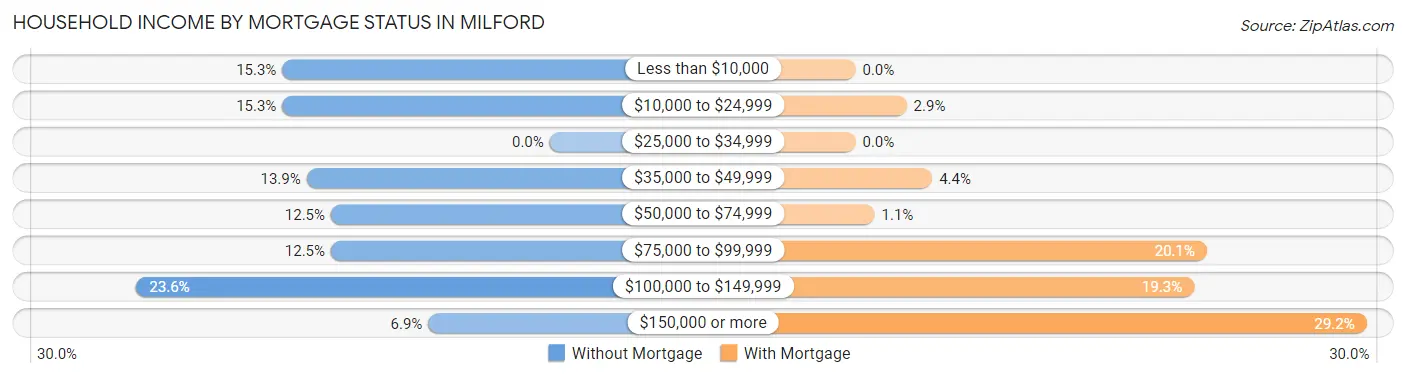
| Household Income | Without Mortgage | With Mortgage |
| Less than $10,000 | 11 (15.3%) | 0 (0.0%) |
| $10,000 to $24,999 | 11 (15.3%) | 8 (2.9%) |
| $25,000 to $34,999 | 0 (0.0%) | 0 (0.0%) |
| $35,000 to $49,999 | 10 (13.9%) | 12 (4.4%) |
| $50,000 to $74,999 | 9 (12.5%) | 3 (1.1%) |
| $75,000 to $99,999 | 9 (12.5%) | 55 (20.1%) |
| $100,000 to $149,999 | 17 (23.6%) | 53 (19.3%) |
| $150,000 or more | 5 (6.9%) | 80 (29.2%) |
| Total | 72 (100.0%) | 274 (100.0%) |
Property Value to Household Income Ratio in Milford
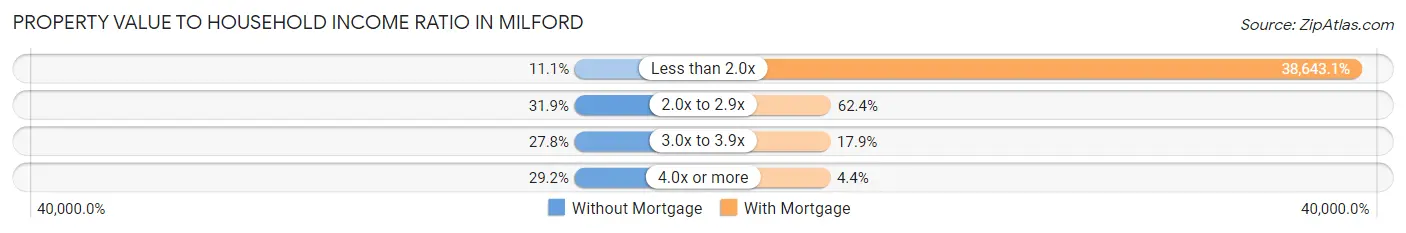
| Value-to-Income Ratio | Without Mortgage | With Mortgage |
| Less than 2.0x | 8 (11.1%) | 105,882 (38,643.1%) |
| 2.0x to 2.9x | 23 (31.9%) | 171 (62.4%) |
| 3.0x to 3.9x | 20 (27.8%) | 49 (17.9%) |
| 4.0x or more | 21 (29.2%) | 12 (4.4%) |
| Total | 72 (100.0%) | 274 (100.0%) |
Real Estate Taxes by Mortgage Status in Milford
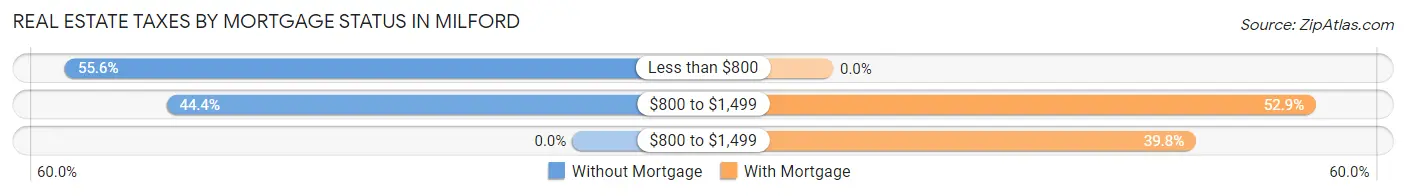
| Property Taxes | Without Mortgage | With Mortgage |
| Less than $800 | 40 (55.6%) | 0 (0.0%) |
| $800 to $1,499 | 32 (44.4%) | 145 (52.9%) |
| $800 to $1,499 | 0 (0.0%) | 109 (39.8%) |
| Total | 72 (100.0%) | 274 (100.0%) |
Health & Disability in Milford
Health Insurance Coverage by Age in Milford
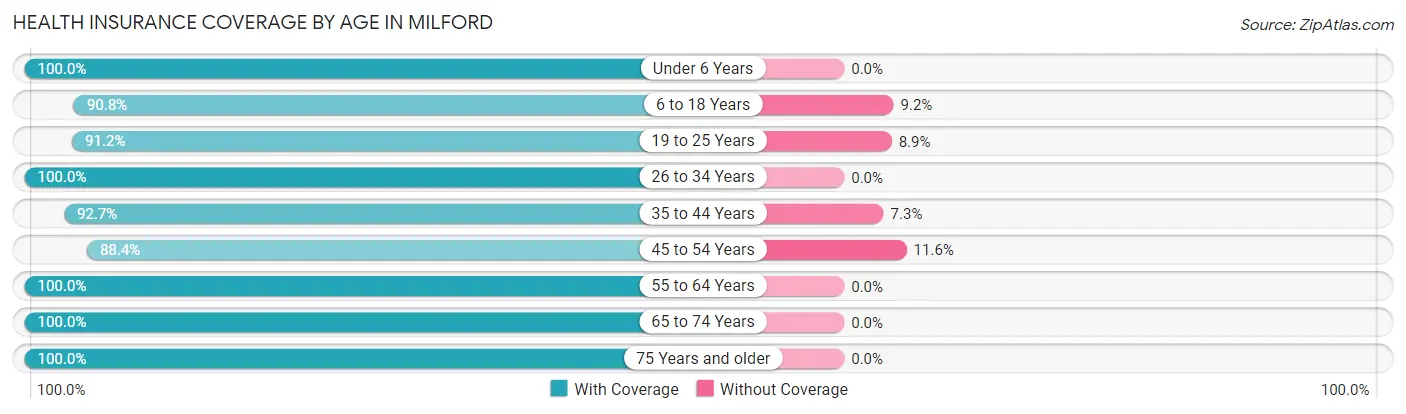
| Age Bracket | With Coverage | Without Coverage |
| Under 6 Years | 139 (100.0%) | 0 (0.0%) |
| 6 to 18 Years | 464 (90.8%) | 47 (9.2%) |
| 19 to 25 Years | 237 (91.1%) | 23 (8.8%) |
| 26 to 34 Years | 204 (100.0%) | 0 (0.0%) |
| 35 to 44 Years | 240 (92.7%) | 19 (7.3%) |
| 45 to 54 Years | 76 (88.4%) | 10 (11.6%) |
| 55 to 64 Years | 189 (100.0%) | 0 (0.0%) |
| 65 to 74 Years | 43 (100.0%) | 0 (0.0%) |
| 75 Years and older | 71 (100.0%) | 0 (0.0%) |
| Total | 1,663 (94.4%) | 99 (5.6%) |
Health Insurance Coverage by Citizenship Status in Milford
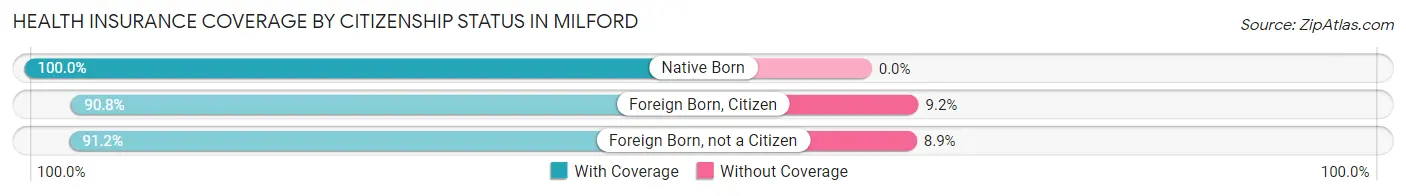
| Citizenship Status | With Coverage | Without Coverage |
| Native Born | 139 (100.0%) | 0 (0.0%) |
| Foreign Born, Citizen | 464 (90.8%) | 47 (9.2%) |
| Foreign Born, not a Citizen | 237 (91.1%) | 23 (8.8%) |
Health Insurance Coverage by Household Income in Milford
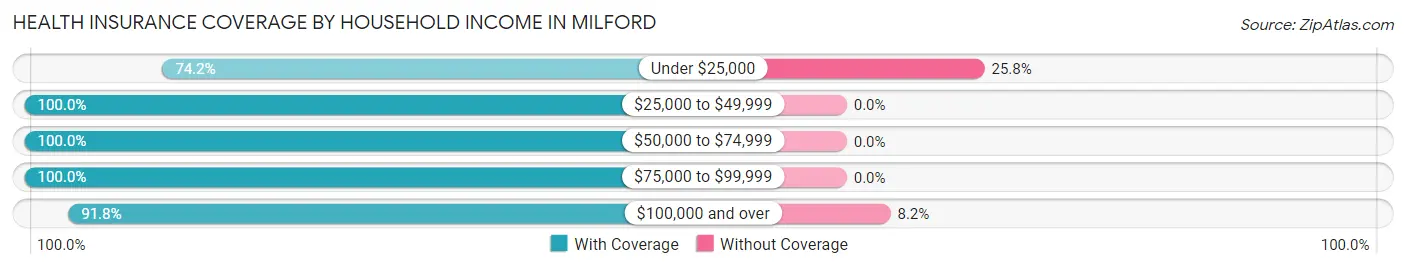
| Household Income | With Coverage | Without Coverage |
| Under $25,000 | 92 (74.2%) | 32 (25.8%) |
| $25,000 to $49,999 | 132 (100.0%) | 0 (0.0%) |
| $50,000 to $74,999 | 321 (100.0%) | 0 (0.0%) |
| $75,000 to $99,999 | 378 (100.0%) | 0 (0.0%) |
| $100,000 and over | 740 (91.8%) | 66 (8.2%) |
Public vs Private Health Insurance Coverage by Age in Milford
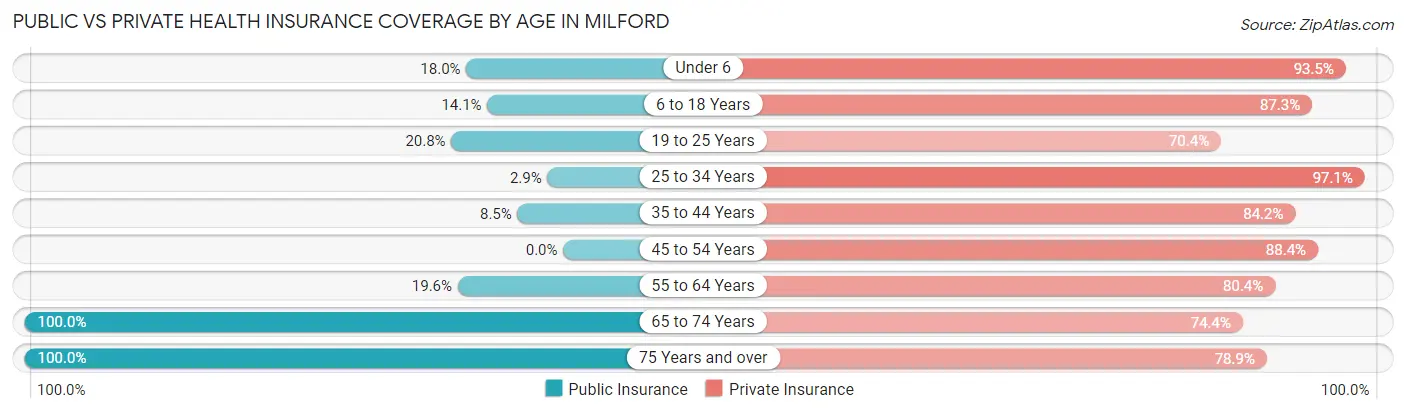
| Age Bracket | Public Insurance | Private Insurance |
| Under 6 | 25 (18.0%) | 130 (93.5%) |
| 6 to 18 Years | 72 (14.1%) | 446 (87.3%) |
| 19 to 25 Years | 54 (20.8%) | 183 (70.4%) |
| 25 to 34 Years | 6 (2.9%) | 198 (97.1%) |
| 35 to 44 Years | 22 (8.5%) | 218 (84.2%) |
| 45 to 54 Years | 0 (0.0%) | 76 (88.4%) |
| 55 to 64 Years | 37 (19.6%) | 152 (80.4%) |
| 65 to 74 Years | 43 (100.0%) | 32 (74.4%) |
| 75 Years and over | 71 (100.0%) | 56 (78.9%) |
| Total | 330 (18.7%) | 1,491 (84.6%) |
Disability Status by Sex by Age in Milford
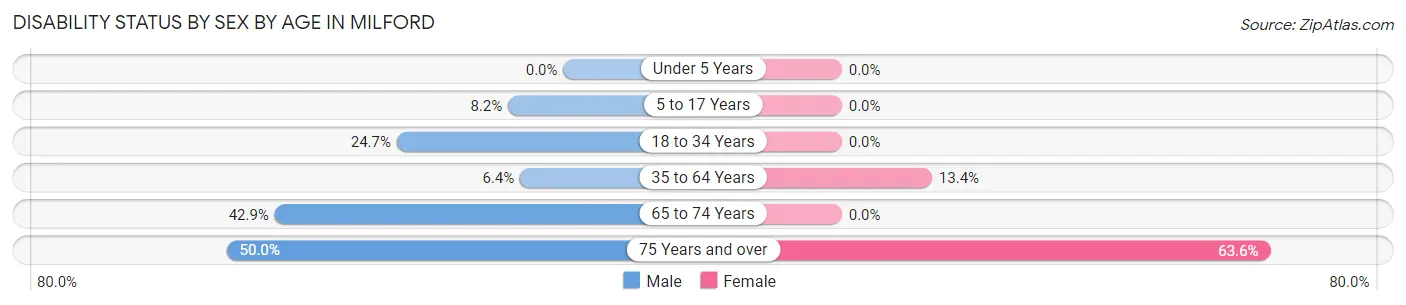
| Age Bracket | Male | Female |
| Under 5 Years | 0 (0.0%) | 0 (0.0%) |
| 5 to 17 Years | 16 (8.2%) | 0 (0.0%) |
| 18 to 34 Years | 92 (24.7%) | 0 (0.0%) |
| 35 to 64 Years | 17 (6.4%) | 36 (13.4%) |
| 65 to 74 Years | 15 (42.9%) | 0 (0.0%) |
| 75 Years and over | 19 (50.0%) | 21 (63.6%) |
Disability Class by Sex by Age in Milford
Disability Class: Hearing Difficulty
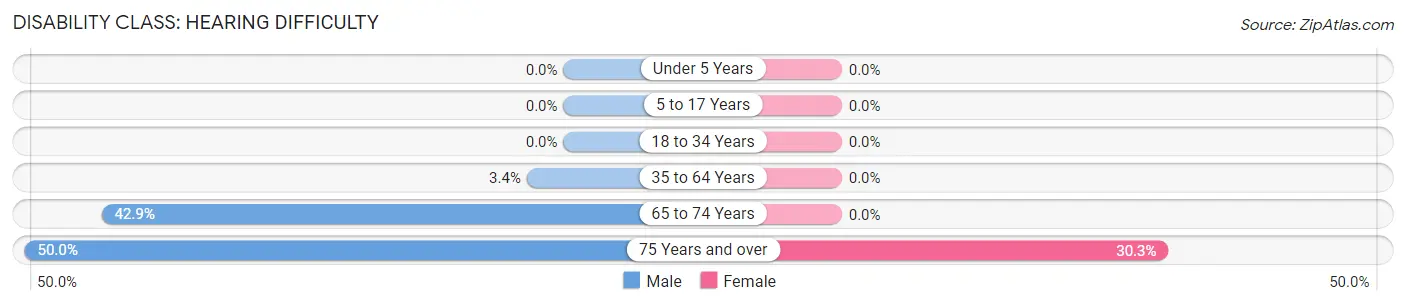
| Age Bracket | Male | Female |
| Under 5 Years | 0 (0.0%) | 0 (0.0%) |
| 5 to 17 Years | 0 (0.0%) | 0 (0.0%) |
| 18 to 34 Years | 0 (0.0%) | 0 (0.0%) |
| 35 to 64 Years | 9 (3.4%) | 0 (0.0%) |
| 65 to 74 Years | 15 (42.9%) | 0 (0.0%) |
| 75 Years and over | 19 (50.0%) | 10 (30.3%) |
Disability Class: Vision Difficulty
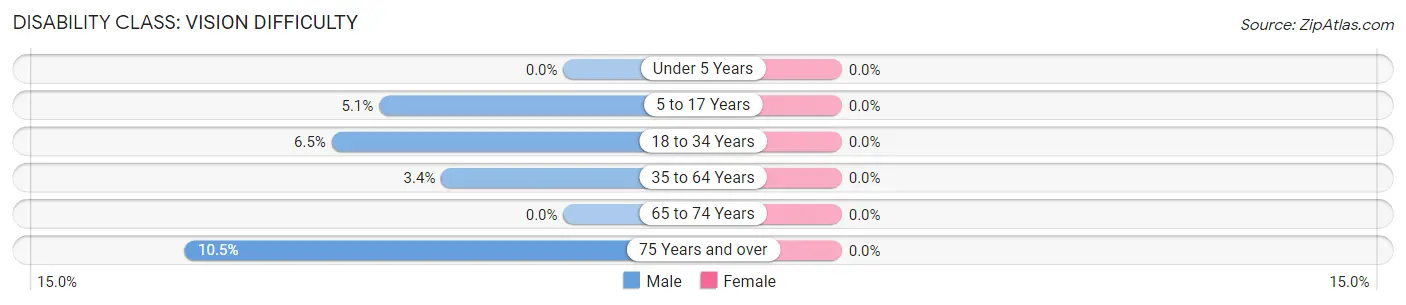
| Age Bracket | Male | Female |
| Under 5 Years | 0 (0.0%) | 0 (0.0%) |
| 5 to 17 Years | 10 (5.1%) | 0 (0.0%) |
| 18 to 34 Years | 24 (6.5%) | 0 (0.0%) |
| 35 to 64 Years | 9 (3.4%) | 0 (0.0%) |
| 65 to 74 Years | 0 (0.0%) | 0 (0.0%) |
| 75 Years and over | 4 (10.5%) | 0 (0.0%) |
Disability Class: Cognitive Difficulty
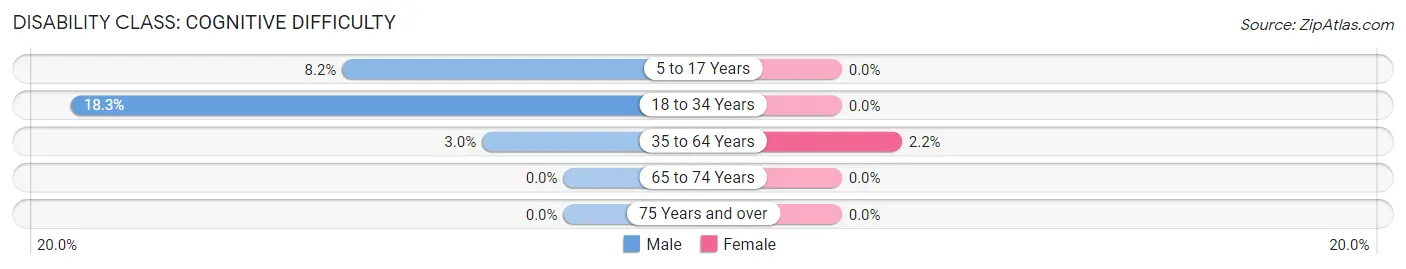
| Age Bracket | Male | Female |
| 5 to 17 Years | 16 (8.2%) | 0 (0.0%) |
| 18 to 34 Years | 68 (18.3%) | 0 (0.0%) |
| 35 to 64 Years | 8 (3.0%) | 6 (2.2%) |
| 65 to 74 Years | 0 (0.0%) | 0 (0.0%) |
| 75 Years and over | 0 (0.0%) | 0 (0.0%) |
Disability Class: Ambulatory Difficulty
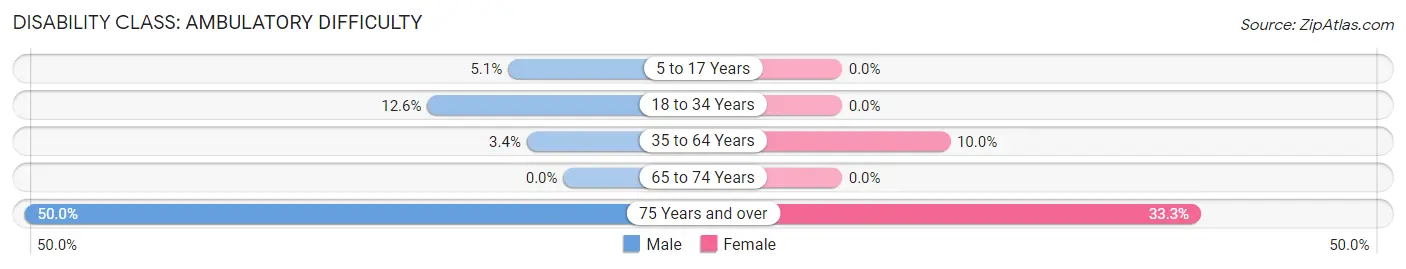
| Age Bracket | Male | Female |
| 5 to 17 Years | 10 (5.1%) | 0 (0.0%) |
| 18 to 34 Years | 47 (12.6%) | 0 (0.0%) |
| 35 to 64 Years | 9 (3.4%) | 27 (10.0%) |
| 65 to 74 Years | 0 (0.0%) | 0 (0.0%) |
| 75 Years and over | 19 (50.0%) | 11 (33.3%) |
Disability Class: Self-Care Difficulty
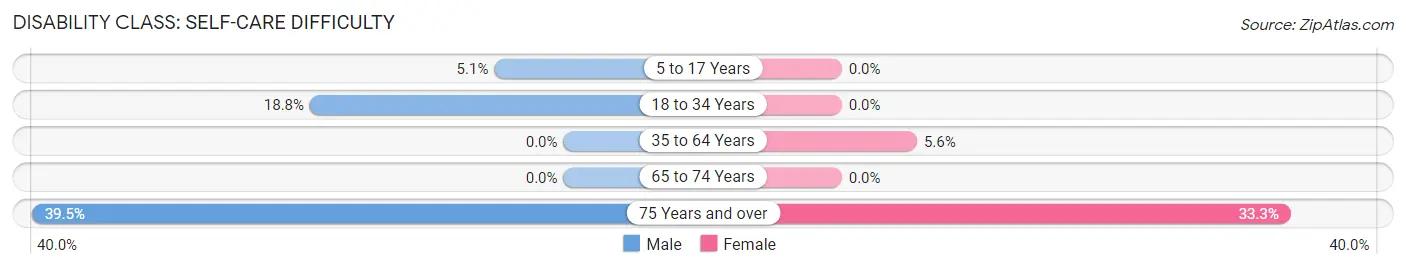
| Age Bracket | Male | Female |
| 5 to 17 Years | 10 (5.1%) | 0 (0.0%) |
| 18 to 34 Years | 70 (18.8%) | 0 (0.0%) |
| 35 to 64 Years | 0 (0.0%) | 15 (5.6%) |
| 65 to 74 Years | 0 (0.0%) | 0 (0.0%) |
| 75 Years and over | 15 (39.5%) | 11 (33.3%) |
Technology Access in Milford
Computing Device Access in Milford
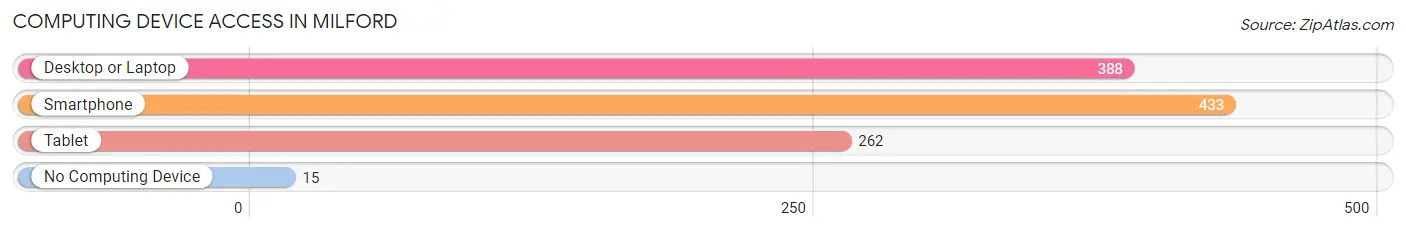
| Device Type | # Households | % Households |
| Desktop or Laptop | 388 | 80.0% |
| Smartphone | 433 | 89.3% |
| Tablet | 262 | 54.0% |
| No Computing Device | 15 | 3.1% |
| Total | 485 | 100.0% |
Internet Access in Milford
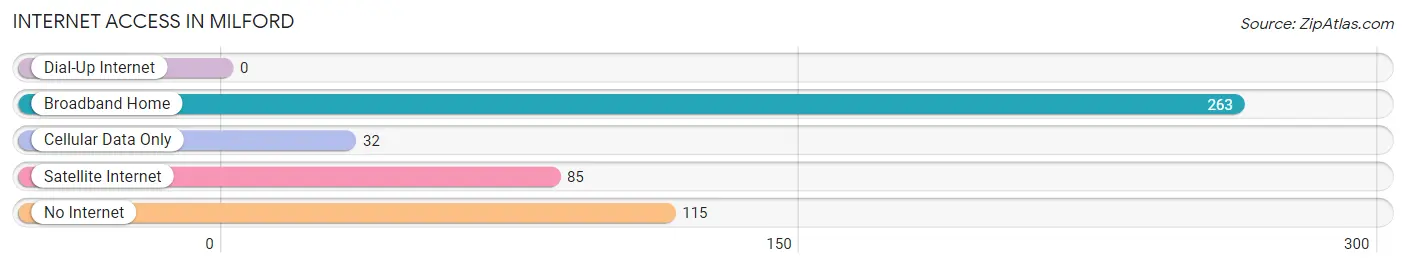
| Internet Type | # Households | % Households |
| Dial-Up Internet | 0 | 0.0% |
| Broadband Home | 263 | 54.2% |
| Cellular Data Only | 32 | 6.6% |
| Satellite Internet | 85 | 17.5% |
| No Internet | 115 | 23.7% |
| Total | 485 | 100.0% |
Milford Summary
Milford, Utah is a small city located in Beaver County, Utah. It is situated in the western part of the state, near the Nevada border. The city is located in the Great Basin region of the United States, and is part of the larger Wasatch Front metropolitan area. As of the 2010 census, the population of Milford was 1,427.
History
Milford was first settled in 1864 by a group of Mormon pioneers led by William Milford. The town was originally named Milford City, but the name was later shortened to Milford. The town was incorporated in 1891.
In the early years, Milford was an agricultural community, with the main crops being wheat, corn, and hay. The town also had a number of small businesses, including a general store, a blacksmith shop, and a hotel.
In the early 1900s, Milford began to experience a period of growth and development. The town was connected to the railroad in 1906, and the first bank was established in 1907. The town also had a number of other businesses, including a newspaper, a movie theater, and a flour mill.
Geography
Milford is located in western Utah, near the Nevada border. The city is situated in the Great Basin region of the United States, and is part of the larger Wasatch Front metropolitan area. The city is located at an elevation of 4,890 feet (1,490 m).
The city is located in a semi-arid climate, with hot summers and cold winters. The average annual precipitation is 8.5 inches (216 mm).
Economy
The economy of Milford is largely based on agriculture and tourism. The city is home to a number of farms, which produce a variety of crops, including wheat, corn, hay, and alfalfa. The city is also home to a number of tourist attractions, including the Great Basin National Park, the Milford Museum, and the Milford Lake State Park.
Demographics
As of the 2010 census, the population of Milford was 1,427. The racial makeup of the city was 91.2% White, 0.2% African American, 0.7% Native American, 0.2% Asian, 0.1% Pacific Islander, 5.3% from other races, and 2.3% from two or more races. Hispanic or Latino of any race were 8.3% of the population.
The median income for a household in the city was $37,917, and the median income for a family was $41,250. The per capita income for the city was $17,845. About 11.2% of families and 13.2% of the population were below the poverty line, including 17.2% of those under age 18 and 8.3% of those age 65 or over.
Common Questions
What is Per Capita Income in Milford?
Per Capita income in Milford is $27,028.
What is the Median Family Income in Milford?
Median Family Income in Milford is $90,433.
What is the Median Household income in Milford?
Median Household Income in Milford is $83,783.
What is Income or Wage Gap in Milford?
Income or Wage Gap in Milford is 50.7%.
Women in Milford earn 49.3 cents for every dollar earned by a man.
What is Inequality or Gini Index in Milford?
Inequality or Gini Index in Milford is 0.33.
What is the Total Population of Milford?
Total Population of Milford is 1,786.
What is the Total Male Population of Milford?
Total Male Population of Milford is 996.
What is the Total Female Population of Milford?
Total Female Population of Milford is 790.
What is the Ratio of Males per 100 Females in Milford?
There are 126.08 Males per 100 Females in Milford.
What is the Ratio of Females per 100 Males in Milford?
There are 79.32 Females per 100 Males in Milford.
What is the Median Population Age in Milford?
Median Population Age in Milford is 24.8 Years.
What is the Average Family Size in Milford
Average Family Size in Milford is 4.0 People.
What is the Average Household Size in Milford
Average Household Size in Milford is 3.6 People.
How Large is the Labor Force in Milford?
There are 850 People in the Labor Forcein in Milford.
What is the Percentage of People in the Labor Force in Milford?
65.9% of People are in the Labor Force in Milford.
What is the Unemployment Rate in Milford?
Unemployment Rate in Milford is 6.7%.