Helper, UT Map & Demographics
Helper Map
Helper Overview
$28,039
PER CAPITA INCOME
$64,432
AVG FAMILY INCOME
$59,323
AVG HOUSEHOLD INCOME
60.6%
WAGE / INCOME GAP [ % ]
39.4¢/ $1
WAGE / INCOME GAP [ $ ]
0.38
INEQUALITY / GINI INDEX
2,482
TOTAL POPULATION
1,244
MALE POPULATION
1,238
FEMALE POPULATION
100.48
MALES / 100 FEMALES
99.52
FEMALES / 100 MALES
43.2
MEDIAN AGE
2.8
AVG FAMILY SIZE
2.3
AVG HOUSEHOLD SIZE
1,209
LABOR FORCE [ PEOPLE ]
60.1%
PERCENT IN LABOR FORCE
5.1%
UNEMPLOYMENT RATE
Helper Zip Codes
Helper Area Codes
Income in Helper
Income Overview in Helper
Per Capita Income in Helper is $28,039, while median incomes of families and households are $64,432 and $59,323 respectively.
| Characteristic | Number | Measure |
| Per Capita Income | 2,482 | $28,039 |
| Median Family Income | 737 | $64,432 |
| Mean Family Income | 737 | $69,848 |
| Median Household Income | 1,073 | $59,323 |
| Mean Household Income | 1,073 | $66,073 |
| Income Deficit | 737 | $0 |
| Wage / Income Gap (%) | 2,482 | 60.58% |
| Wage / Income Gap ($) | 2,482 | 39.42¢ per $1 |
| Gini / Inequality Index | 2,482 | 0.38 |
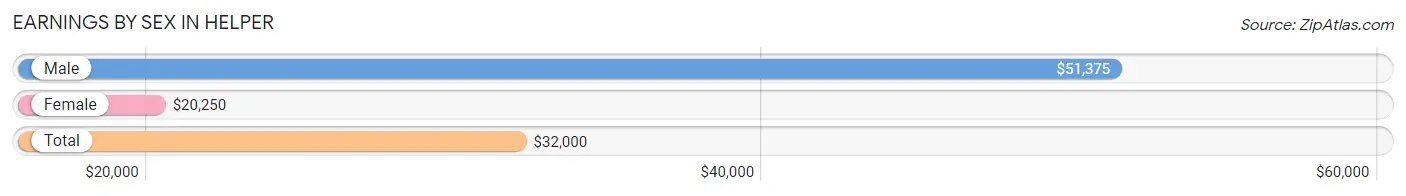
Earnings by Sex in Helper
Average Earnings in Helper are $32,000, $51,375 for men and $20,250 for women, a difference of 60.6%.
| Sex | Number | Average Earnings |
| Male | 632 (51.1%) | $51,375 |
| Female | 604 (48.9%) | $20,250 |
| Total | 1,236 (100.0%) | $32,000 |
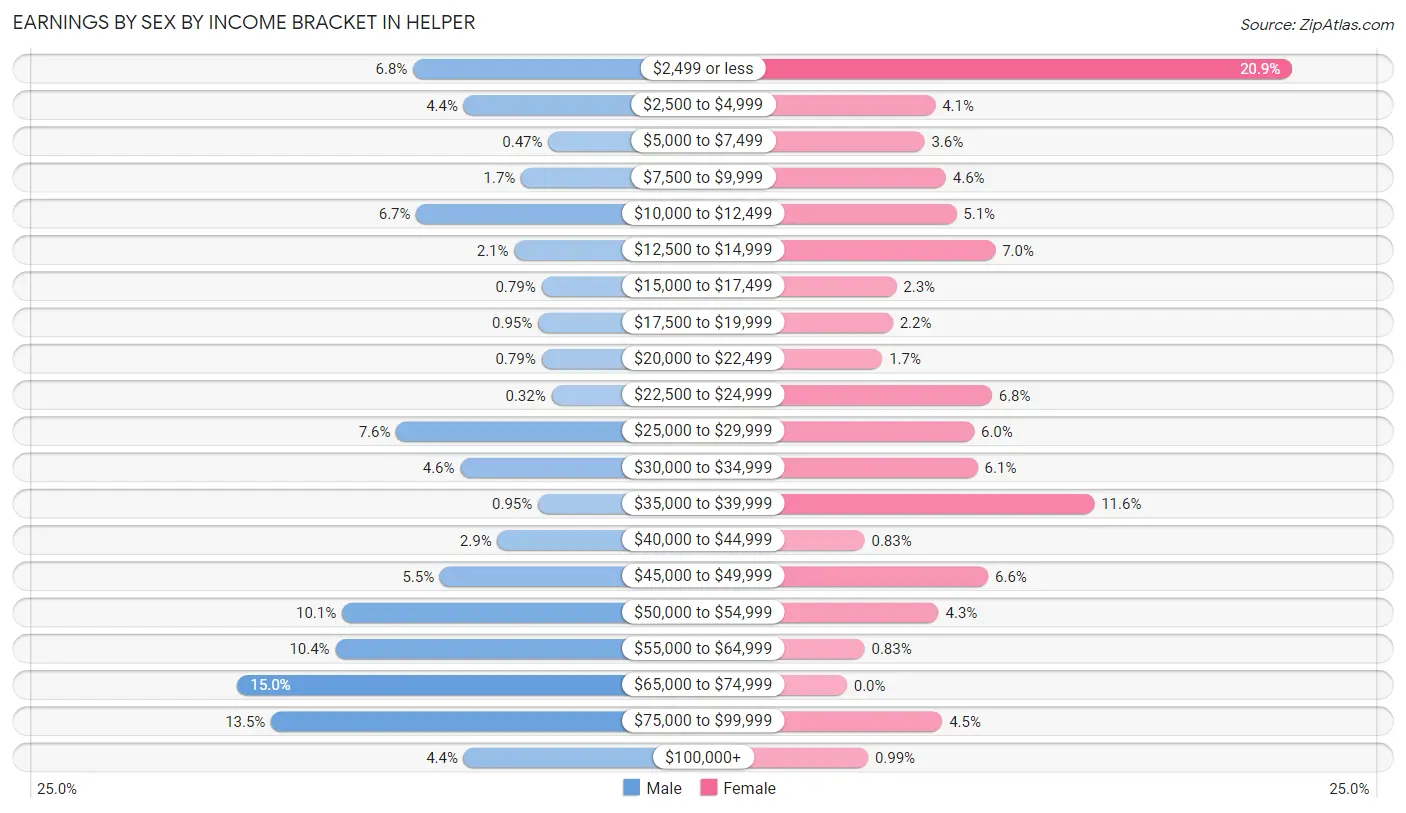
Earnings by Sex by Income Bracket in Helper
The most common earnings brackets in Helper are $65,000 to $74,999 for men (95 | 15.0%) and $2,499 or less for women (126 | 20.9%).
| Income | Male | Female |
| $2,499 or less | 43 (6.8%) | 126 (20.9%) |
| $2,500 to $4,999 | 28 (4.4%) | 25 (4.1%) |
| $5,000 to $7,499 | 3 (0.5%) | 22 (3.6%) |
| $7,500 to $9,999 | 11 (1.7%) | 28 (4.6%) |
| $10,000 to $12,499 | 42 (6.7%) | 31 (5.1%) |
| $12,500 to $14,999 | 13 (2.1%) | 42 (7.0%) |
| $15,000 to $17,499 | 5 (0.8%) | 14 (2.3%) |
| $17,500 to $19,999 | 6 (0.9%) | 13 (2.1%) |
| $20,000 to $22,499 | 5 (0.8%) | 10 (1.7%) |
| $22,500 to $24,999 | 2 (0.3%) | 41 (6.8%) |
| $25,000 to $29,999 | 48 (7.6%) | 36 (6.0%) |
| $30,000 to $34,999 | 29 (4.6%) | 37 (6.1%) |
| $35,000 to $39,999 | 6 (0.9%) | 70 (11.6%) |
| $40,000 to $44,999 | 18 (2.9%) | 5 (0.8%) |
| $45,000 to $49,999 | 35 (5.5%) | 40 (6.6%) |
| $50,000 to $54,999 | 64 (10.1%) | 26 (4.3%) |
| $55,000 to $64,999 | 66 (10.4%) | 5 (0.8%) |
| $65,000 to $74,999 | 95 (15.0%) | 0 (0.0%) |
| $75,000 to $99,999 | 85 (13.5%) | 27 (4.5%) |
| $100,000+ | 28 (4.4%) | 6 (1.0%) |
| Total | 632 (100.0%) | 604 (100.0%) |
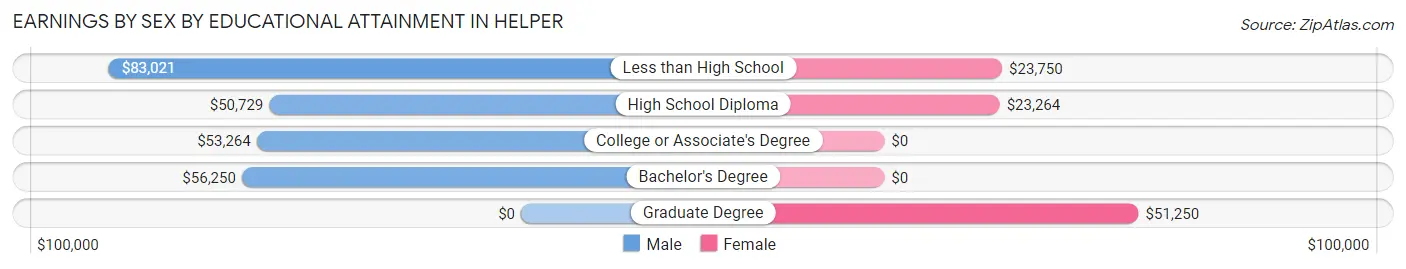
Earnings by Sex by Educational Attainment in Helper
Average earnings in Helper are $52,552 for men and $19,231 for women, a difference of 63.4%. Men with an educational attainment of less than high school enjoy the highest average annual earnings of $83,021, while those with high school diploma education earn the least with $50,729. Women with an educational attainment of graduate degree earn the most with the average annual earnings of $51,250, while those with high school diploma education have the smallest earnings of $23,264.
| Educational Attainment | Male Income | Female Income |
| Less than High School | $83,021 | $23,750 |
| High School Diploma | $50,729 | $23,264 |
| College or Associate's Degree | $53,264 | $0 |
| Bachelor's Degree | $56,250 | $0 |
| Graduate Degree | - | - |
| Total | $52,552 | $19,231 |
Family Income in Helper
Family Income Brackets in Helper
According to the Helper family income data, there are 192 families falling into the $75,000 to $99,999 income range, which is the most common income bracket and makes up 26.1% of all families.
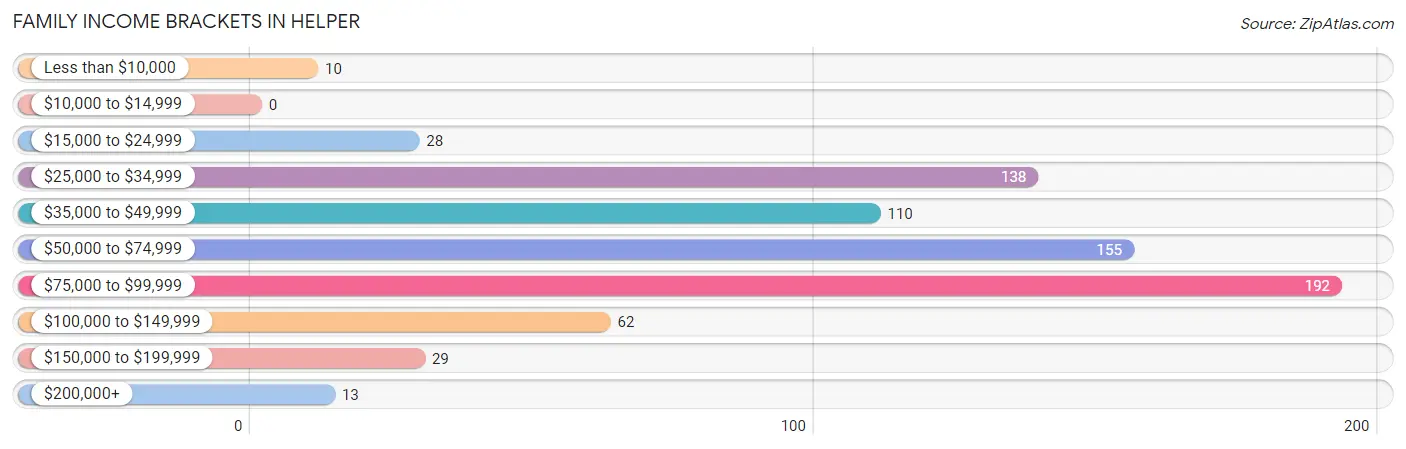
| Income Bracket | # Families | % Families |
| Less than $10,000 | 10 | 1.4% |
| $10,000 to $14,999 | 0 | 0.0% |
| $15,000 to $24,999 | 28 | 3.8% |
| $25,000 to $34,999 | 138 | 18.7% |
| $35,000 to $49,999 | 110 | 14.9% |
| $50,000 to $74,999 | 155 | 21.0% |
| $75,000 to $99,999 | 192 | 26.1% |
| $100,000 to $149,999 | 62 | 8.4% |
| $150,000 to $199,999 | 29 | 3.9% |
| $200,000+ | 13 | 1.8% |
Family Income by Famaliy Size in Helper
4-person families (61 | 8.3%) account for the highest median family income in Helper with $83,750 per family, while 2-person families (446 | 60.5%) have the highest median income of $28,584 per family member.
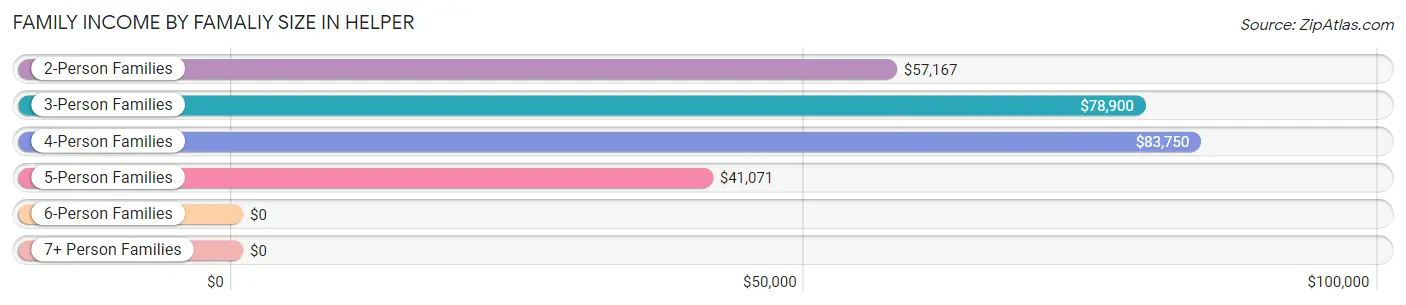
| Income Bracket | # Families | Median Income |
| 2-Person Families | 446 (60.5%) | $57,167 |
| 3-Person Families | 144 (19.5%) | $78,900 |
| 4-Person Families | 61 (8.3%) | $83,750 |
| 5-Person Families | 38 (5.2%) | $41,071 |
| 6-Person Families | 41 (5.6%) | $0 |
| 7+ Person Families | 7 (0.9%) | $0 |
| Total | 737 (100.0%) | $64,432 |
Family Income by Number of Earners in Helper
The median family income in Helper is $64,432, with families comprising 3+ earners (66) having the highest median family income of $92,875, while families with no earners (120) have the lowest median family income of $46,818, accounting for 9.0% and 16.3% of families, respectively.
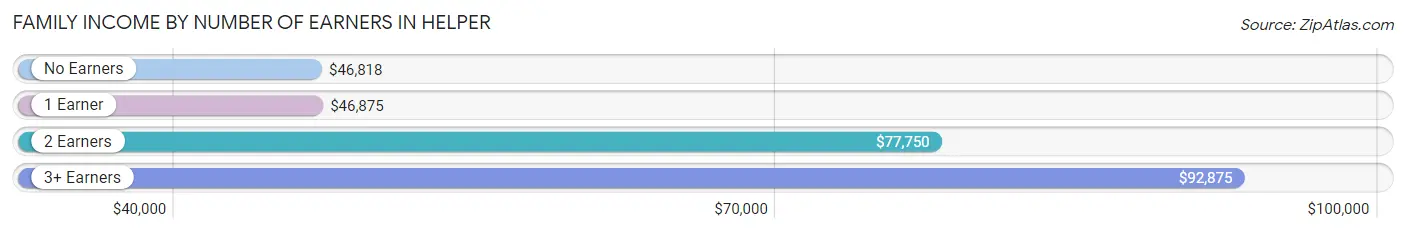
| Number of Earners | # Families | Median Income |
| No Earners | 120 (16.3%) | $46,818 |
| 1 Earner | 315 (42.7%) | $46,875 |
| 2 Earners | 236 (32.0%) | $77,750 |
| 3+ Earners | 66 (9.0%) | $92,875 |
| Total | 737 (100.0%) | $64,432 |
Household Income in Helper
Household Income Brackets in Helper
With 254 households falling in the category, the $50,000 to $74,999 income range is the most frequent in Helper, accounting for 23.7% of all households. In contrast, only 18 households (1.7%) fall into the $200,000+ income bracket, making it the least populous group.
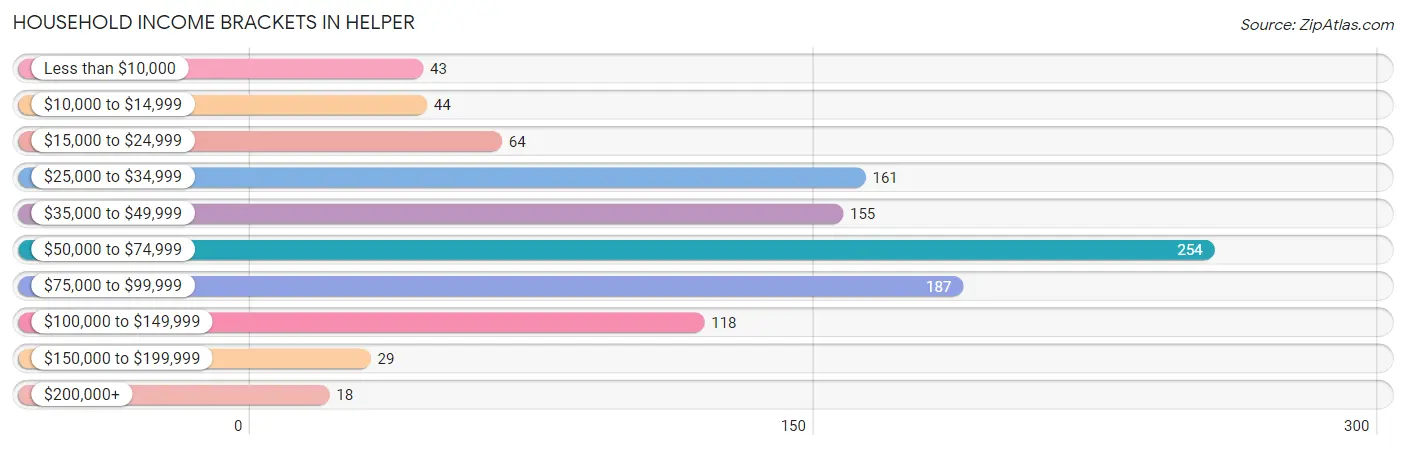
| Income Bracket | # Households | % Households |
| Less than $10,000 | 43 | 4.0% |
| $10,000 to $14,999 | 44 | 4.1% |
| $15,000 to $24,999 | 64 | 6.0% |
| $25,000 to $34,999 | 161 | 15.0% |
| $35,000 to $49,999 | 155 | 14.4% |
| $50,000 to $74,999 | 254 | 23.7% |
| $75,000 to $99,999 | 187 | 17.4% |
| $100,000 to $149,999 | 118 | 11.0% |
| $150,000 to $199,999 | 29 | 2.7% |
| $200,000+ | 18 | 1.7% |
Household Income by Householder Age in Helper
The median household income in Helper is $59,323, with the highest median household income of $64,931 found in the 15 to 24 years age bracket for the primary householder. A total of 73 households (6.8%) fall into this category. Meanwhile, the 65+ years age bracket for the primary householder has the lowest median household income of $56,111, with 316 households (29.4%) in this group.
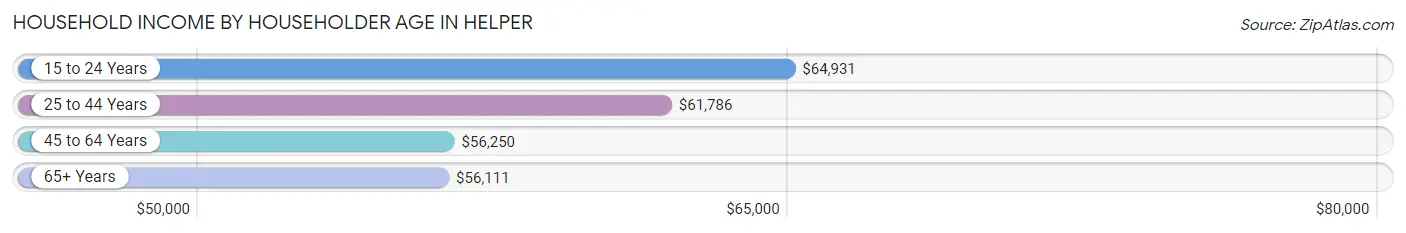
| Income Bracket | # Households | Median Income |
| 15 to 24 Years | 73 (6.8%) | $64,931 |
| 25 to 44 Years | 302 (28.1%) | $61,786 |
| 45 to 64 Years | 382 (35.6%) | $56,250 |
| 65+ Years | 316 (29.4%) | $56,111 |
| Total | 1,073 (100.0%) | $59,323 |
Poverty in Helper
Income Below Poverty by Sex and Age in Helper
With 13.0% poverty level for males and 15.2% for females among the residents of Helper, under 5 year old males and 6 to 11 year old females are the most vulnerable to poverty, with 30 males (53.6%) and 52 females (58.4%) in their respective age groups living below the poverty level.
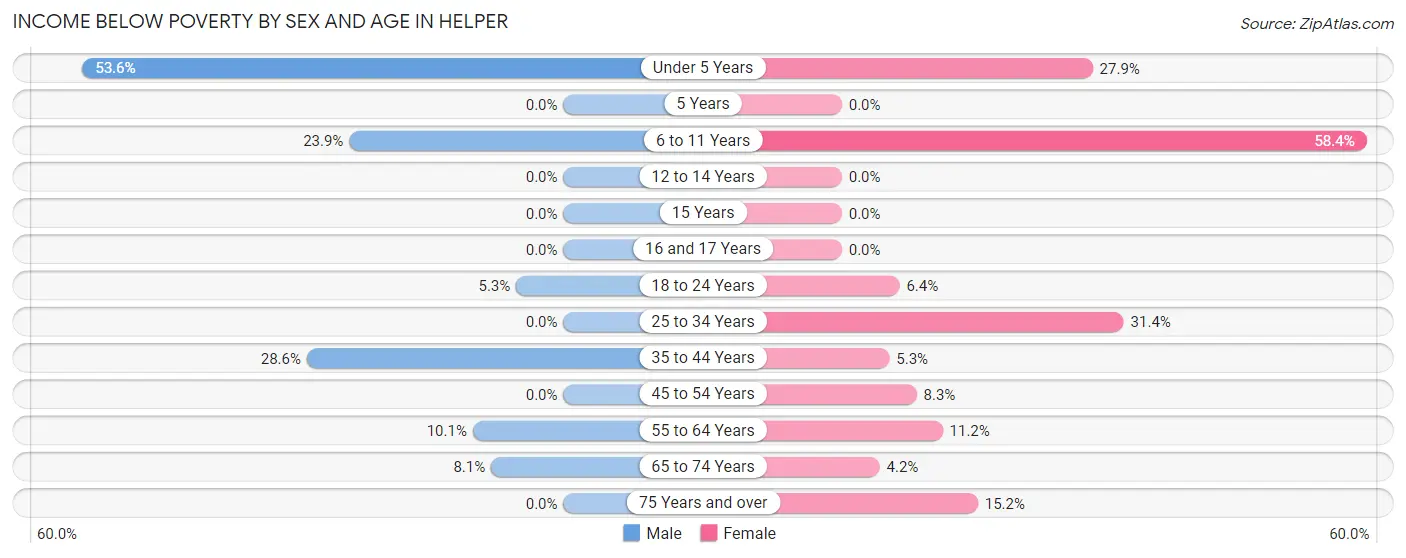
| Age Bracket | Male | Female |
| Under 5 Years | 30 (53.6%) | 19 (27.9%) |
| 5 Years | 0 (0.0%) | 0 (0.0%) |
| 6 to 11 Years | 31 (23.8%) | 52 (58.4%) |
| 12 to 14 Years | 0 (0.0%) | 0 (0.0%) |
| 15 Years | 0 (0.0%) | 0 (0.0%) |
| 16 and 17 Years | 0 (0.0%) | 0 (0.0%) |
| 18 to 24 Years | 5 (5.3%) | 7 (6.4%) |
| 25 to 34 Years | 0 (0.0%) | 43 (31.4%) |
| 35 to 44 Years | 62 (28.6%) | 7 (5.3%) |
| 45 to 54 Years | 0 (0.0%) | 10 (8.3%) |
| 55 to 64 Years | 22 (10.1%) | 31 (11.2%) |
| 65 to 74 Years | 12 (8.1%) | 4 (4.2%) |
| 75 Years and over | 0 (0.0%) | 15 (15.1%) |
| Total | 162 (13.0%) | 188 (15.2%) |
Income Above Poverty by Sex and Age in Helper
According to the poverty statistics in Helper, males aged 5 years and females aged 5 years are the age groups that are most secure financially, with 100.0% of males and 100.0% of females in these age groups living above the poverty line.
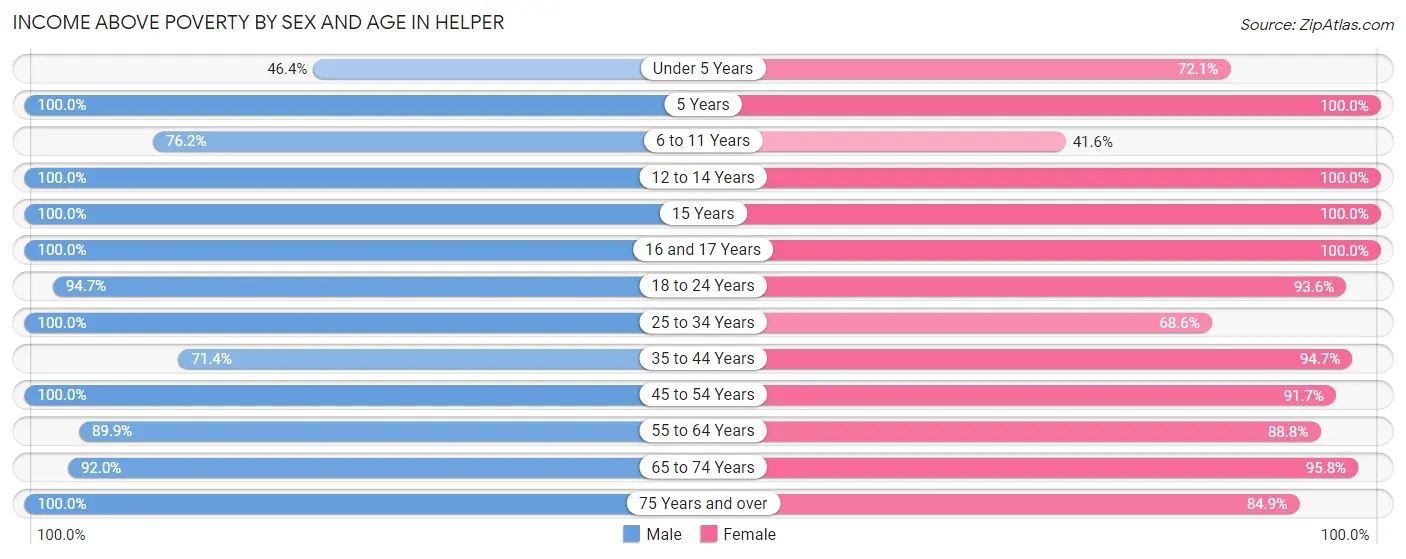
| Age Bracket | Male | Female |
| Under 5 Years | 26 (46.4%) | 49 (72.1%) |
| 5 Years | 5 (100.0%) | 4 (100.0%) |
| 6 to 11 Years | 99 (76.1%) | 37 (41.6%) |
| 12 to 14 Years | 18 (100.0%) | 59 (100.0%) |
| 15 Years | 35 (100.0%) | 6 (100.0%) |
| 16 and 17 Years | 10 (100.0%) | 44 (100.0%) |
| 18 to 24 Years | 90 (94.7%) | 102 (93.6%) |
| 25 to 34 Years | 112 (100.0%) | 94 (68.6%) |
| 35 to 44 Years | 155 (71.4%) | 125 (94.7%) |
| 45 to 54 Years | 105 (100.0%) | 110 (91.7%) |
| 55 to 64 Years | 196 (89.9%) | 245 (88.8%) |
| 65 to 74 Years | 137 (91.9%) | 91 (95.8%) |
| 75 Years and over | 94 (100.0%) | 84 (84.9%) |
| Total | 1,082 (87.0%) | 1,050 (84.8%) |
Income Below Poverty Among Married-Couple Families in Helper
The poverty statistics for married-couple families in Helper show that 7.1% or 45 of the total 633 families live below the poverty line. Families with 3 or 4 children have the highest poverty rate of 38.8%, comprising of 31 families. On the other hand, families with 5 or more children have the lowest poverty rate of 0.0%, which includes 0 families.
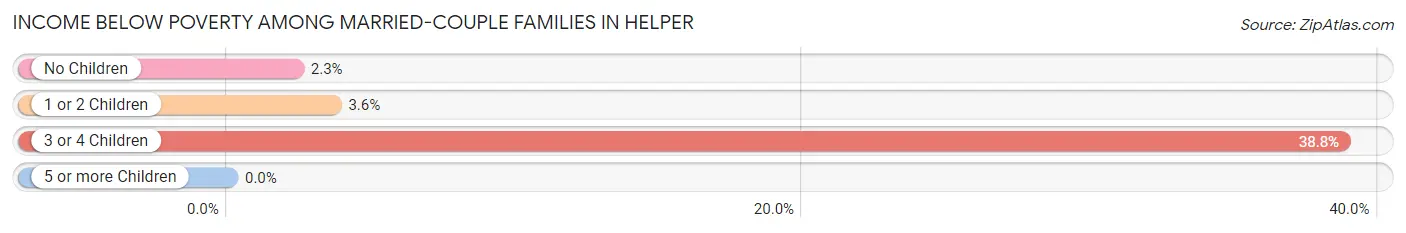
| Children | Above Poverty | Below Poverty |
| No Children | 426 (97.7%) | 10 (2.3%) |
| 1 or 2 Children | 107 (96.4%) | 4 (3.6%) |
| 3 or 4 Children | 49 (61.3%) | 31 (38.8%) |
| 5 or more Children | 6 (100.0%) | 0 (0.0%) |
| Total | 588 (92.9%) | 45 (7.1%) |
Income Below Poverty Among Single-Parent Households in Helper
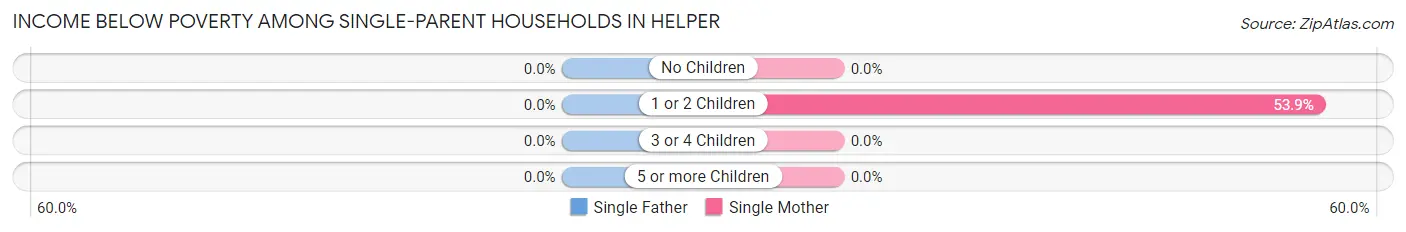
| Children | Single Father | Single Mother |
| No Children | 0 (0.0%) | 0 (0.0%) |
| 1 or 2 Children | 0 (0.0%) | 7 (53.8%) |
| 3 or 4 Children | 0 (0.0%) | 0 (0.0%) |
| 5 or more Children | 0 (0.0%) | 0 (0.0%) |
| Total | 0 (0.0%) | 7 (13.7%) |
Income Below Poverty Among Married-Couple vs Single-Parent Households in Helper
The poverty data for Helper shows that 45 of the married-couple family households (7.1%) and 7 of the single-parent households (6.7%) are living below the poverty level. Within the married-couple family households, those with 3 or 4 children have the highest poverty rate, with 31 households (38.8%) falling below the poverty line. Among the single-parent households, those with 1 or 2 children have the highest poverty rate, with 7 household (30.4%) living below poverty.
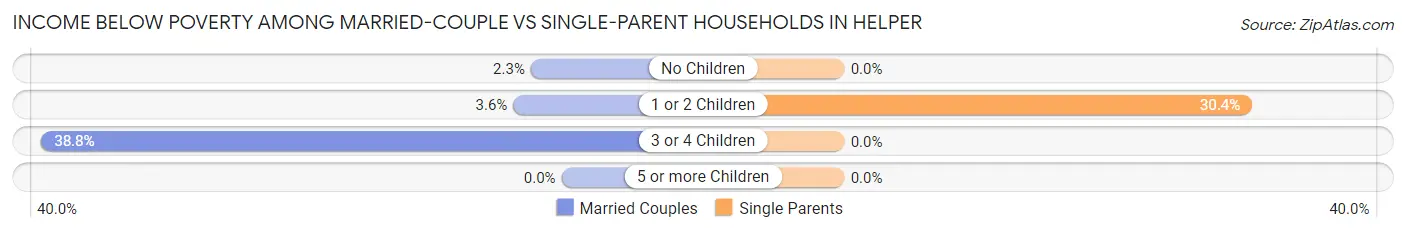
| Children | Married-Couple Families | Single-Parent Households |
| No Children | 10 (2.3%) | 0 (0.0%) |
| 1 or 2 Children | 4 (3.6%) | 7 (30.4%) |
| 3 or 4 Children | 31 (38.8%) | 0 (0.0%) |
| 5 or more Children | 0 (0.0%) | 0 (0.0%) |
| Total | 45 (7.1%) | 7 (6.7%) |
Race in Helper
The most populous races in Helper are White / Caucasian (2,359 | 95.0%), Hispanic or Latino (206 | 8.3%), and Two or more Races (96 | 3.9%).
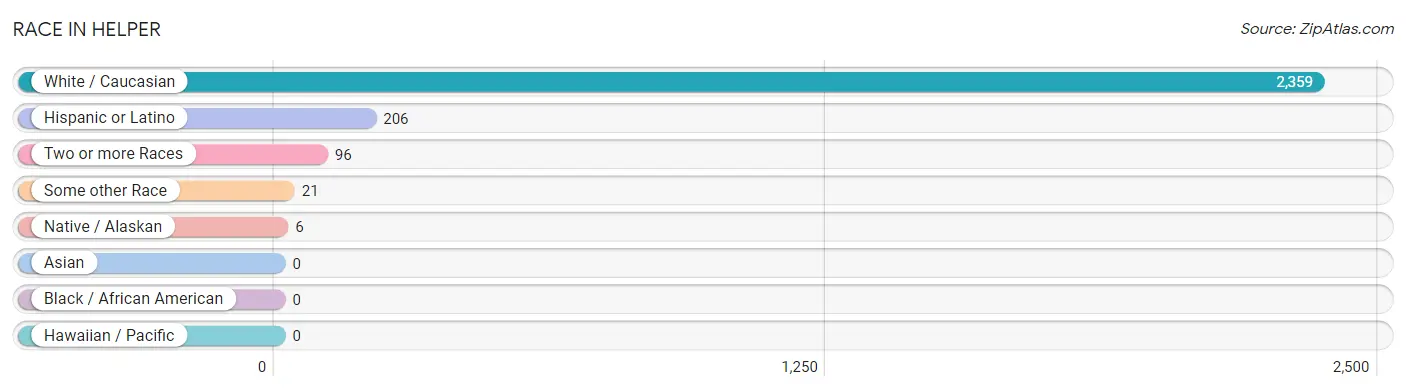
| Race | # Population | % Population |
| Asian | 0 | 0.0% |
| Black / African American | 0 | 0.0% |
| Hawaiian / Pacific | 0 | 0.0% |
| Hispanic or Latino | 206 | 8.3% |
| Native / Alaskan | 6 | 0.2% |
| White / Caucasian | 2,359 | 95.0% |
| Two or more Races | 96 | 3.9% |
| Some other Race | 21 | 0.9% |
| Total | 2,482 | 100.0% |
Ancestry in Helper
The most populous ancestries reported in Helper are English (510 | 20.5%), German (468 | 18.9%), Italian (248 | 10.0%), Irish (228 | 9.2%), and European (200 | 8.1%), together accounting for 66.6% of all Helper residents.
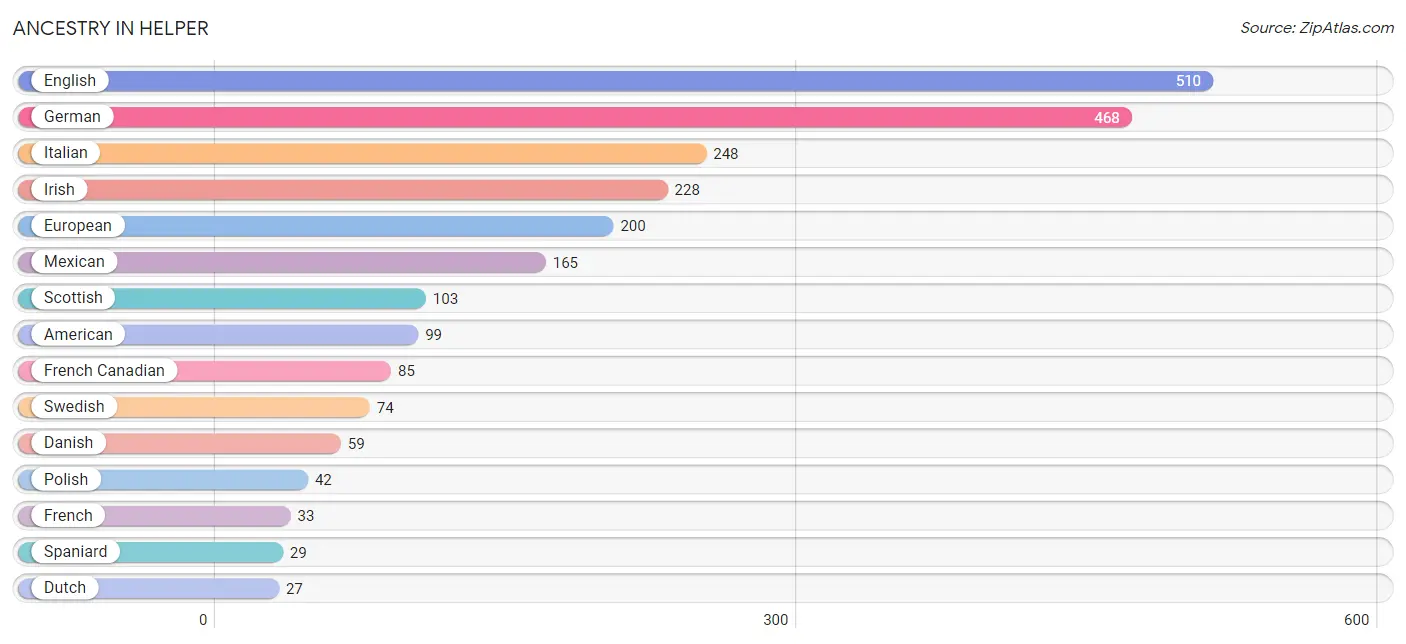
| Ancestry | # Population | % Population |
| American | 99 | 4.0% |
| Apache | 6 | 0.2% |
| Austrian | 9 | 0.4% |
| Bhutanese | 20 | 0.8% |
| British | 10 | 0.4% |
| Croatian | 9 | 0.4% |
| Danish | 59 | 2.4% |
| Dutch | 27 | 1.1% |
| English | 510 | 20.5% |
| European | 200 | 8.1% |
| French | 33 | 1.3% |
| French Canadian | 85 | 3.4% |
| German | 468 | 18.9% |
| Greek | 17 | 0.7% |
| Icelander | 8 | 0.3% |
| Irish | 228 | 9.2% |
| Italian | 248 | 10.0% |
| Korean | 6 | 0.2% |
| Mexican | 165 | 6.7% |
| Norwegian | 14 | 0.6% |
| Polish | 42 | 1.7% |
| Romanian | 5 | 0.2% |
| Russian | 2 | 0.1% |
| Scandinavian | 7 | 0.3% |
| Scotch-Irish | 24 | 1.0% |
| Scottish | 103 | 4.2% |
| Slavic | 5 | 0.2% |
| Slovene | 6 | 0.2% |
| South American | 7 | 0.3% |
| Spaniard | 29 | 1.2% |
| Spanish | 5 | 0.2% |
| Swedish | 74 | 3.0% |
| Venezuelan | 7 | 0.3% |
| Welsh | 5 | 0.2% |
| Yugoslavian | 6 | 0.2% | View All 35 Rows |
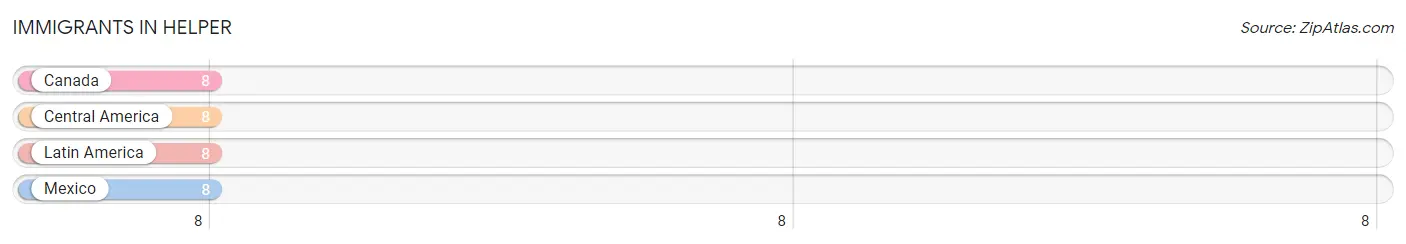
Immigrants in Helper
The most numerous immigrant groups reported in Helper came from Canada (8 | 0.3%), Central America (8 | 0.3%), Latin America (8 | 0.3%), and Mexico (8 | 0.3%), together accounting for 1.3% of all Helper residents.
| Immigration Origin | # Population | % Population |
| Canada | 8 | 0.3% |
| Central America | 8 | 0.3% |
| Latin America | 8 | 0.3% |
| Mexico | 8 | 0.3% | View All 4 Rows |
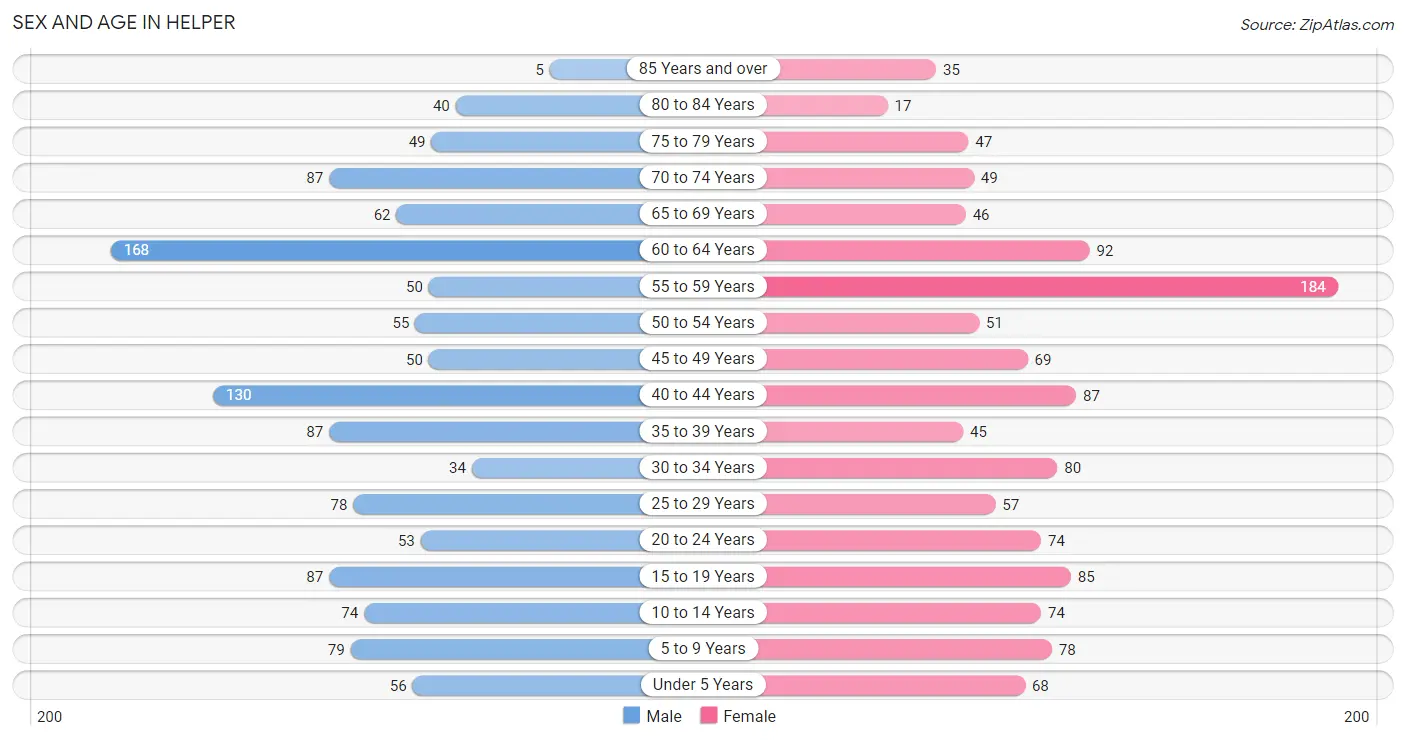
Sex and Age in Helper
Sex and Age in Helper
The most populous age groups in Helper are 60 to 64 Years (168 | 13.5%) for men and 55 to 59 Years (184 | 14.9%) for women.
| Age Bracket | Male | Female |
| Under 5 Years | 56 (4.5%) | 68 (5.5%) |
| 5 to 9 Years | 79 (6.4%) | 78 (6.3%) |
| 10 to 14 Years | 74 (5.9%) | 74 (6.0%) |
| 15 to 19 Years | 87 (7.0%) | 85 (6.9%) |
| 20 to 24 Years | 53 (4.3%) | 74 (6.0%) |
| 25 to 29 Years | 78 (6.3%) | 57 (4.6%) |
| 30 to 34 Years | 34 (2.7%) | 80 (6.5%) |
| 35 to 39 Years | 87 (7.0%) | 45 (3.6%) |
| 40 to 44 Years | 130 (10.4%) | 87 (7.0%) |
| 45 to 49 Years | 50 (4.0%) | 69 (5.6%) |
| 50 to 54 Years | 55 (4.4%) | 51 (4.1%) |
| 55 to 59 Years | 50 (4.0%) | 184 (14.9%) |
| 60 to 64 Years | 168 (13.5%) | 92 (7.4%) |
| 65 to 69 Years | 62 (5.0%) | 46 (3.7%) |
| 70 to 74 Years | 87 (7.0%) | 49 (4.0%) |
| 75 to 79 Years | 49 (3.9%) | 47 (3.8%) |
| 80 to 84 Years | 40 (3.2%) | 17 (1.4%) |
| 85 Years and over | 5 (0.4%) | 35 (2.8%) |
| Total | 1,244 (100.0%) | 1,238 (100.0%) |
Families and Households in Helper
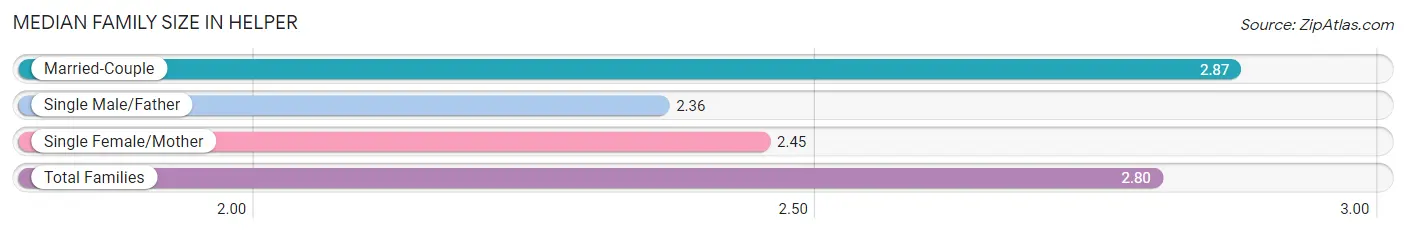
Median Family Size in Helper
The median family size in Helper is 2.80 persons per family, with married-couple families (633 | 85.9%) accounting for the largest median family size of 2.87 persons per family. On the other hand, single male/father families (53 | 7.2%) represent the smallest median family size with 2.36 persons per family.
| Family Type | # Families | Family Size |
| Married-Couple | 633 (85.9%) | 2.87 |
| Single Male/Father | 53 (7.2%) | 2.36 |
| Single Female/Mother | 51 (6.9%) | 2.45 |
| Total Families | 737 (100.0%) | 2.80 |
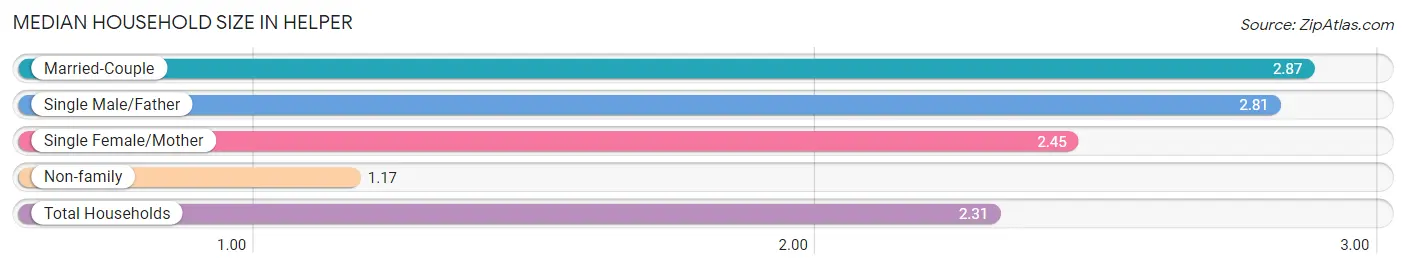
Median Household Size in Helper
The median household size in Helper is 2.31 persons per household, with married-couple households (633 | 59.0%) accounting for the largest median household size of 2.87 persons per household. non-family households (336 | 31.3%) represent the smallest median household size with 1.17 persons per household.
| Household Type | # Households | Household Size |
| Married-Couple | 633 (59.0%) | 2.87 |
| Single Male/Father | 53 (4.9%) | 2.81 |
| Single Female/Mother | 51 (4.8%) | 2.45 |
| Non-family | 336 (31.3%) | 1.17 |
| Total Households | 1,073 (100.0%) | 2.31 |
Household Size by Marriage Status in Helper
Out of a total of 1,073 households in Helper, 737 (68.7%) are family households, while 336 (31.3%) are nonfamily households. The most numerous type of family households are 2-person households, comprising 417, and the most common type of nonfamily households are 1-person households, comprising 274.
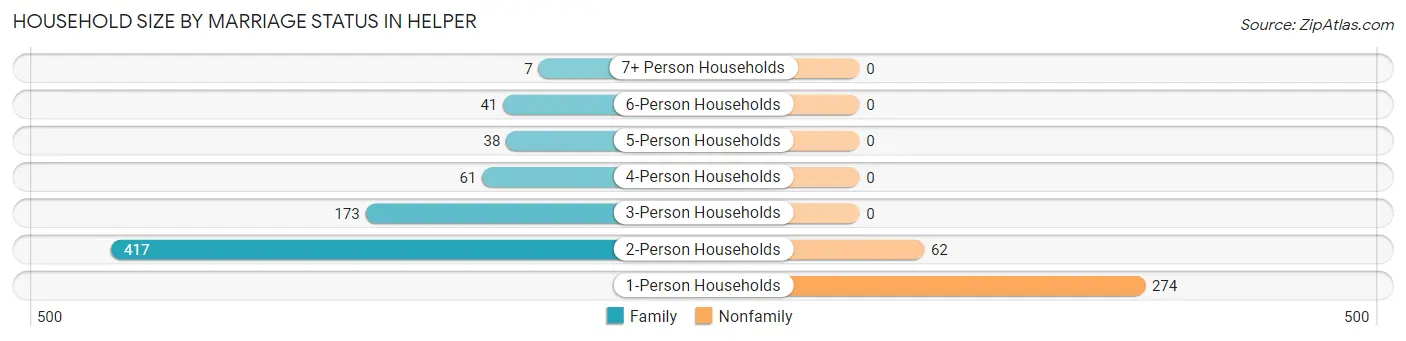
| Household Size | Family Households | Nonfamily Households |
| 1-Person Households | - | 274 (25.5%) |
| 2-Person Households | 417 (38.9%) | 62 (5.8%) |
| 3-Person Households | 173 (16.1%) | 0 (0.0%) |
| 4-Person Households | 61 (5.7%) | 0 (0.0%) |
| 5-Person Households | 38 (3.5%) | 0 (0.0%) |
| 6-Person Households | 41 (3.8%) | 0 (0.0%) |
| 7+ Person Households | 7 (0.6%) | 0 (0.0%) |
| Total | 737 (68.7%) | 336 (31.3%) |
Female Fertility in Helper
Fertility by Age in Helper
Average fertility rate in Helper is 65.0 births per 1,000 women. Women in the age bracket of 20 to 34 years have the highest fertility rate with 161.0 births per 1,000 women. Women in the age bracket of 20 to 34 years acount for 100.0% of all women with births.
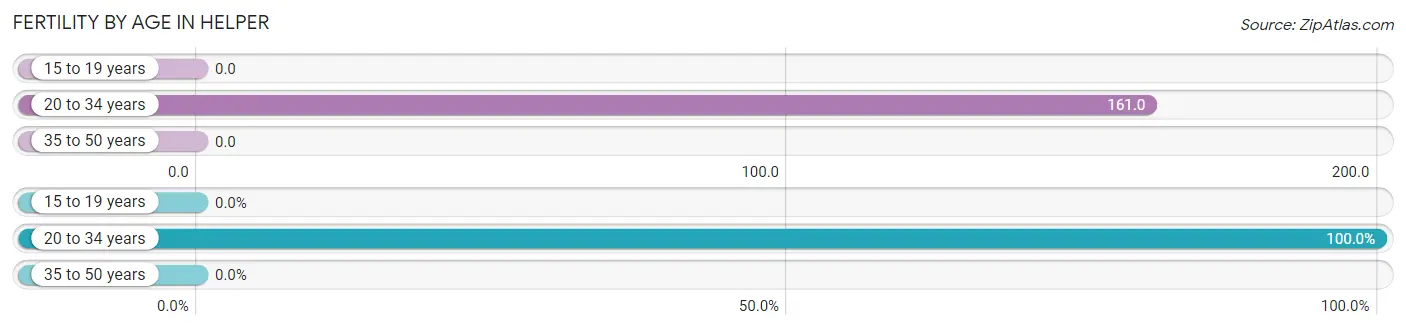
| Age Bracket | Women with Births | Births / 1,000 Women |
| 15 to 19 years | 0 (0.0%) | 0.0 |
| 20 to 34 years | 34 (100.0%) | 161.0 |
| 35 to 50 years | 0 (0.0%) | 0.0 |
| Total | 34 (100.0%) | 65.0 |
Fertility by Age by Marriage Status in Helper
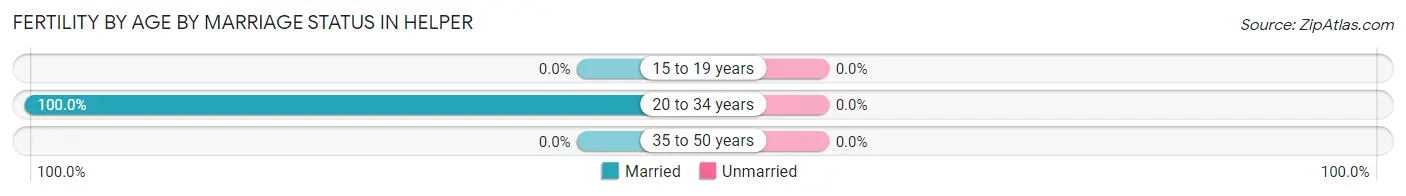
| Age Bracket | Married | Unmarried |
| 15 to 19 years | 0 (0.0%) | 0 (0.0%) |
| 20 to 34 years | 34 (100.0%) | 0 (0.0%) |
| 35 to 50 years | 0 (0.0%) | 0 (0.0%) |
| Total | 34 (100.0%) | 0 (0.0%) |
Fertility by Education in Helper
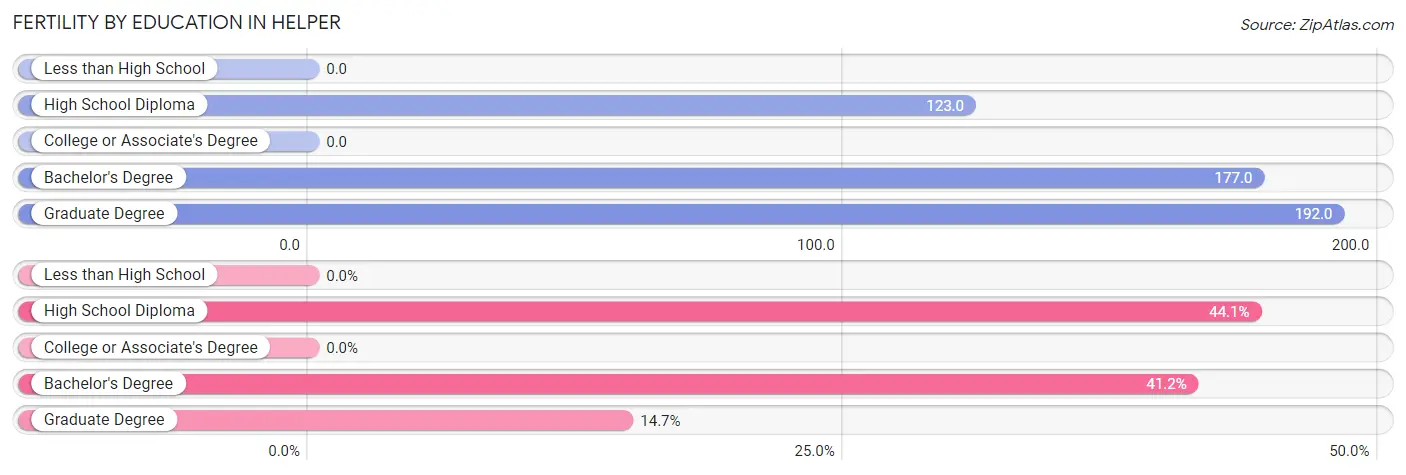
| Educational Attainment | Women with Births | Births / 1,000 Women |
| Less than High School | 0 (0.0%) | 0.0 |
| High School Diploma | 15 (44.1%) | 123.0 |
| College or Associate's Degree | 0 (0.0%) | 0.0 |
| Bachelor's Degree | 14 (41.2%) | 177.0 |
| Graduate Degree | 5 (14.7%) | 192.0 |
| Total | 34 (100.0%) | 65.0 |
Fertility by Education by Marriage Status in Helper
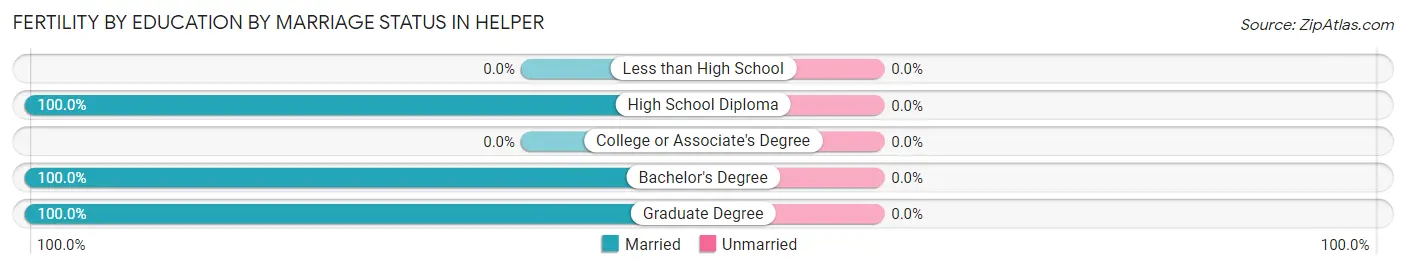
| Educational Attainment | Married | Unmarried |
| Less than High School | 0 (0.0%) | 0 (0.0%) |
| High School Diploma | 15 (100.0%) | 0 (0.0%) |
| College or Associate's Degree | 0 (0.0%) | 0 (0.0%) |
| Bachelor's Degree | 14 (100.0%) | 0 (0.0%) |
| Graduate Degree | 5 (100.0%) | 0 (0.0%) |
| Total | 34 (100.0%) | 0 (0.0%) |
Employment Characteristics in Helper
Employment by Class of Employer in Helper
Among the 1,116 employed individuals in Helper, private company employees (666 | 59.7%), state government employees (156 | 14.0%), and local government employees (155 | 13.9%) make up the most common classes of employment.
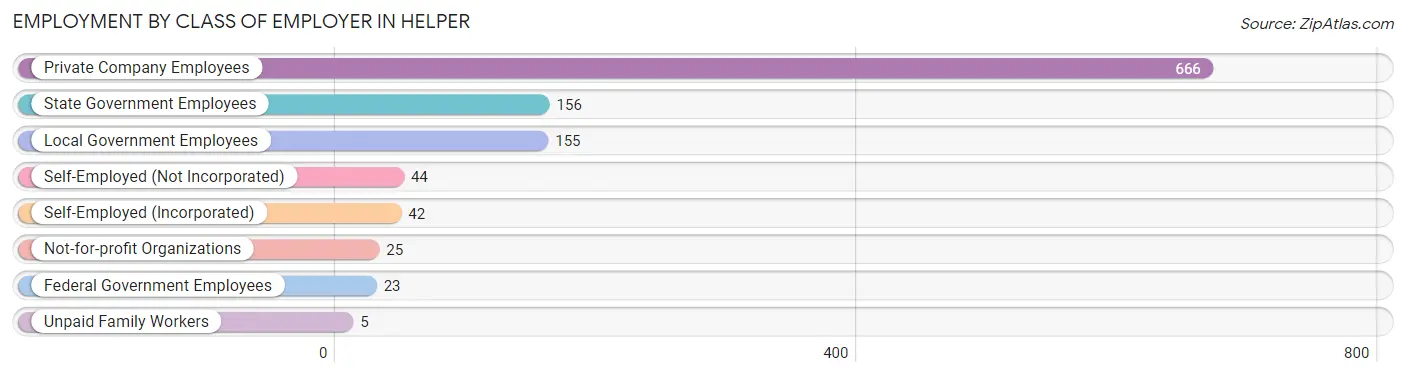
| Employer Class | # Employees | % Employees |
| Private Company Employees | 666 | 59.7% |
| Self-Employed (Incorporated) | 42 | 3.8% |
| Self-Employed (Not Incorporated) | 44 | 3.9% |
| Not-for-profit Organizations | 25 | 2.2% |
| Local Government Employees | 155 | 13.9% |
| State Government Employees | 156 | 14.0% |
| Federal Government Employees | 23 | 2.1% |
| Unpaid Family Workers | 5 | 0.4% |
| Total | 1,116 | 100.0% |
Employment Status by Age in Helper
According to the labor force statistics for Helper, out of the total population over 16 years of age (2,012), 60.1% or 1,209 individuals are in the labor force, with 5.1% or 62 of them unemployed. The age group with the highest labor force participation rate is 25 to 29 years, with 92.6% or 125 individuals in the labor force. Within the labor force, the 25 to 29 years age range has the highest percentage of unemployed individuals, with 29.6% or 37 of them being unemployed.
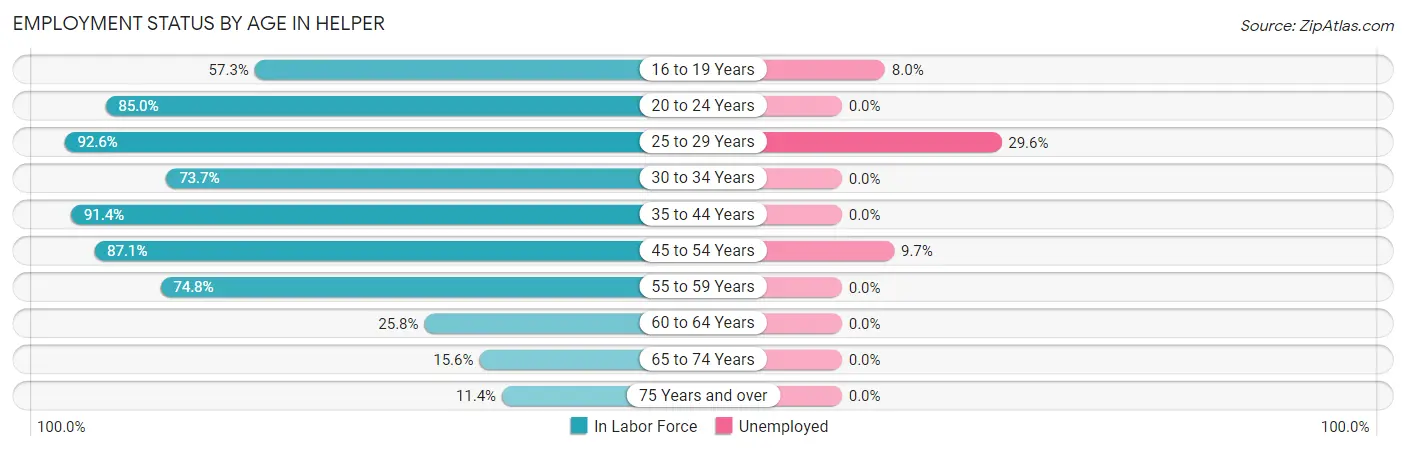
| Age Bracket | In Labor Force | Unemployed |
| 16 to 19 Years | 75 (57.3%) | 6 (8.0%) |
| 20 to 24 Years | 108 (85.0%) | 0 (0.0%) |
| 25 to 29 Years | 125 (92.6%) | 37 (29.6%) |
| 30 to 34 Years | 84 (73.7%) | 0 (0.0%) |
| 35 to 44 Years | 319 (91.4%) | 0 (0.0%) |
| 45 to 54 Years | 196 (87.1%) | 19 (9.7%) |
| 55 to 59 Years | 175 (74.8%) | 0 (0.0%) |
| 60 to 64 Years | 67 (25.8%) | 0 (0.0%) |
| 65 to 74 Years | 38 (15.6%) | 0 (0.0%) |
| 75 Years and over | 22 (11.4%) | 0 (0.0%) |
| Total | 1,209 (60.1%) | 62 (5.1%) |
Employment Status by Educational Attainment in Helper
According to labor force statistics for Helper, 73.3% of individuals (965) out of the total population between 25 and 64 years of age (1,317) are in the labor force, with 5.8% or 56 of them being unemployed. The group with the highest labor force participation rate are those with the educational attainment of college / associate degree, with 81.1% or 415 individuals in the labor force. Within the labor force, individuals with less than high school education have the highest percentage of unemployment, with 11.8% or 6 of them being unemployed.
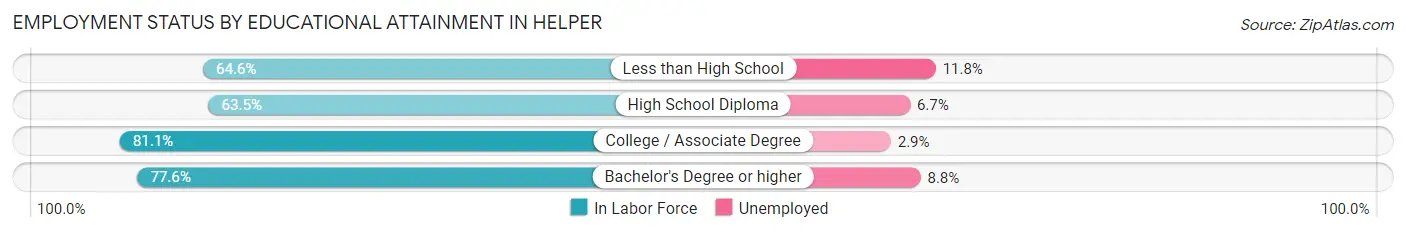
| Educational Attainment | In Labor Force | Unemployed |
| Less than High School | 51 (64.6%) | 9 (11.8%) |
| High School Diploma | 285 (63.5%) | 30 (6.7%) |
| College / Associate Degree | 415 (81.1%) | 15 (2.9%) |
| Bachelor's Degree or higher | 215 (77.6%) | 24 (8.8%) |
| Total | 965 (73.3%) | 76 (5.8%) |
Employment Occupations by Sex in Helper
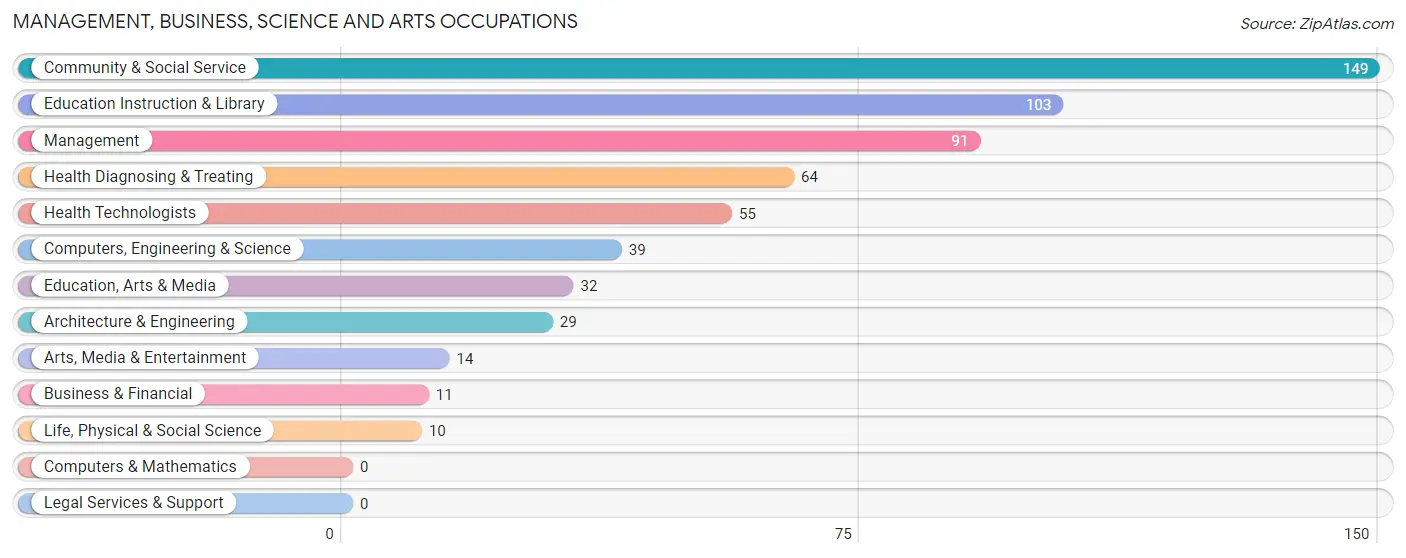
Management, Business, Science and Arts Occupations
The most common Management, Business, Science and Arts occupations in Helper are Community & Social Service (149 | 13.0%), Education Instruction & Library (103 | 9.0%), Management (91 | 7.9%), Health Diagnosing & Treating (64 | 5.6%), and Health Technologists (55 | 4.8%).
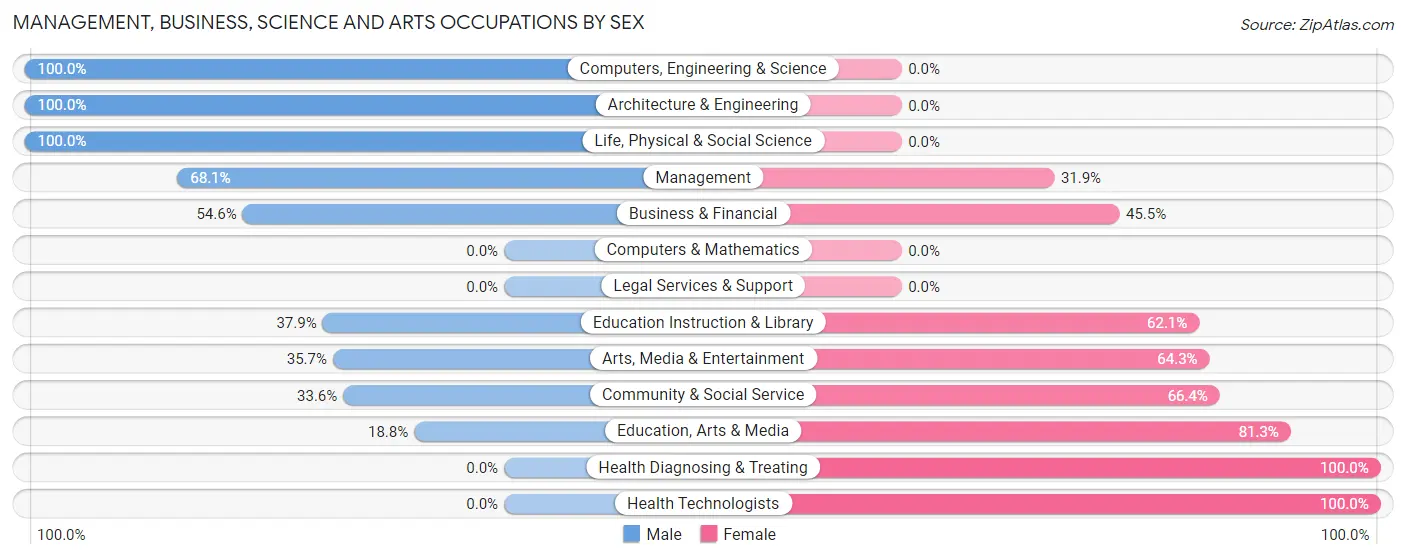
Management, Business, Science and Arts Occupations by Sex
Within the Management, Business, Science and Arts occupations in Helper, the most male-oriented occupations are Computers, Engineering & Science (100.0%), Architecture & Engineering (100.0%), and Life, Physical & Social Science (100.0%), while the most female-oriented occupations are Health Diagnosing & Treating (100.0%), Health Technologists (100.0%), and Education, Arts & Media (81.2%).
| Occupation | Male | Female |
| Management | 62 (68.1%) | 29 (31.9%) |
| Business & Financial | 6 (54.5%) | 5 (45.5%) |
| Computers, Engineering & Science | 39 (100.0%) | 0 (0.0%) |
| Computers & Mathematics | 0 (0.0%) | 0 (0.0%) |
| Architecture & Engineering | 29 (100.0%) | 0 (0.0%) |
| Life, Physical & Social Science | 10 (100.0%) | 0 (0.0%) |
| Community & Social Service | 50 (33.6%) | 99 (66.4%) |
| Education, Arts & Media | 6 (18.8%) | 26 (81.2%) |
| Legal Services & Support | 0 (0.0%) | 0 (0.0%) |
| Education Instruction & Library | 39 (37.9%) | 64 (62.1%) |
| Arts, Media & Entertainment | 5 (35.7%) | 9 (64.3%) |
| Health Diagnosing & Treating | 0 (0.0%) | 64 (100.0%) |
| Health Technologists | 0 (0.0%) | 55 (100.0%) |
| Total (Category) | 157 (44.4%) | 197 (55.6%) |
| Total (Overall) | 587 (51.2%) | 560 (48.8%) |
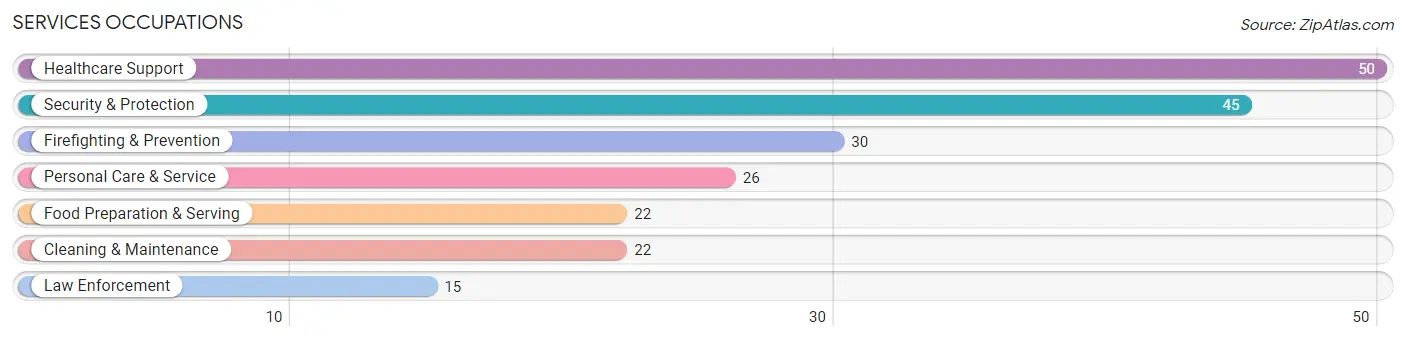
Services Occupations
The most common Services occupations in Helper are Healthcare Support (50 | 4.4%), Security & Protection (45 | 3.9%), Firefighting & Prevention (30 | 2.6%), Personal Care & Service (26 | 2.3%), and Food Preparation & Serving (22 | 1.9%).
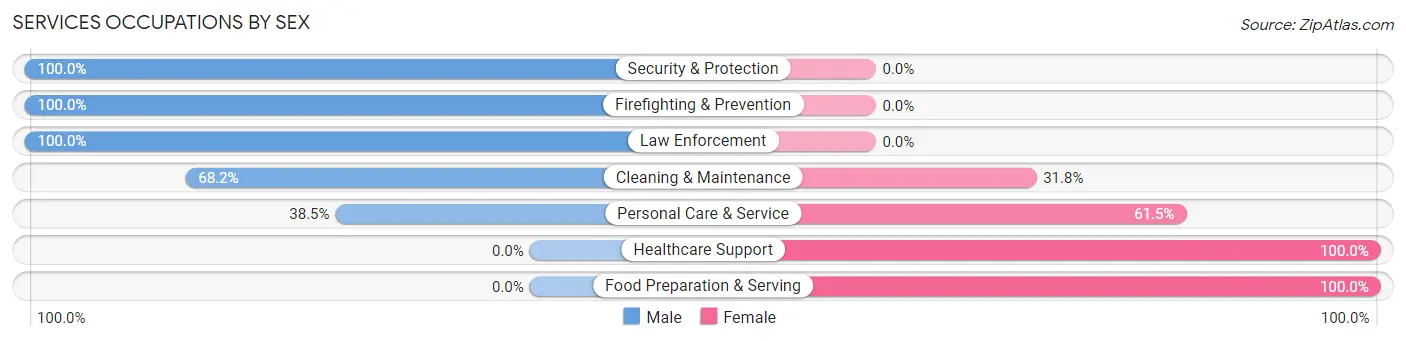
Services Occupations by Sex
Within the Services occupations in Helper, the most male-oriented occupations are Security & Protection (100.0%), Firefighting & Prevention (100.0%), and Law Enforcement (100.0%), while the most female-oriented occupations are Healthcare Support (100.0%), Food Preparation & Serving (100.0%), and Personal Care & Service (61.5%).
| Occupation | Male | Female |
| Healthcare Support | 0 (0.0%) | 50 (100.0%) |
| Security & Protection | 45 (100.0%) | 0 (0.0%) |
| Firefighting & Prevention | 30 (100.0%) | 0 (0.0%) |
| Law Enforcement | 15 (100.0%) | 0 (0.0%) |
| Food Preparation & Serving | 0 (0.0%) | 22 (100.0%) |
| Cleaning & Maintenance | 15 (68.2%) | 7 (31.8%) |
| Personal Care & Service | 10 (38.5%) | 16 (61.5%) |
| Total (Category) | 70 (42.4%) | 95 (57.6%) |
| Total (Overall) | 587 (51.2%) | 560 (48.8%) |
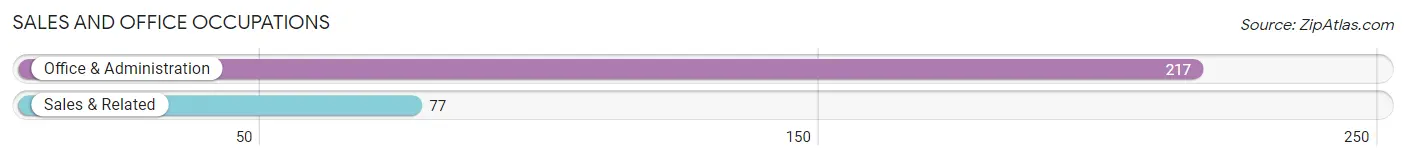
Sales and Office Occupations
The most common Sales and Office occupations in Helper are Office & Administration (217 | 18.9%), and Sales & Related (77 | 6.7%).
Sales and Office Occupations by Sex
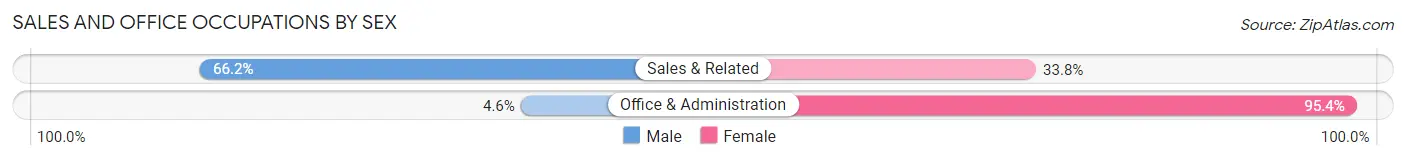
| Occupation | Male | Female |
| Sales & Related | 51 (66.2%) | 26 (33.8%) |
| Office & Administration | 10 (4.6%) | 207 (95.4%) |
| Total (Category) | 61 (20.7%) | 233 (79.2%) |
| Total (Overall) | 587 (51.2%) | 560 (48.8%) |
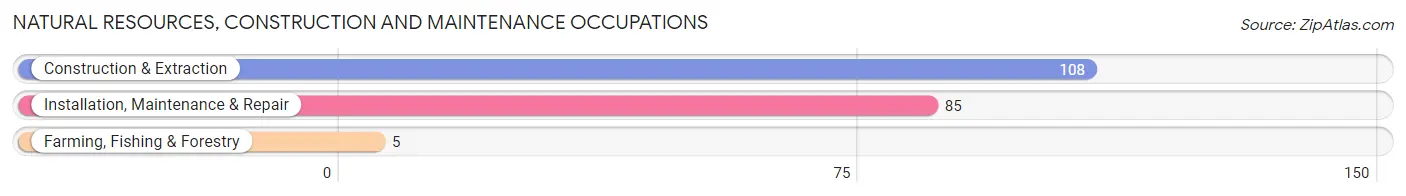
Natural Resources, Construction and Maintenance Occupations
The most common Natural Resources, Construction and Maintenance occupations in Helper are Construction & Extraction (108 | 9.4%), Installation, Maintenance & Repair (85 | 7.4%), and Farming, Fishing & Forestry (5 | 0.4%).
Natural Resources, Construction and Maintenance Occupations by Sex
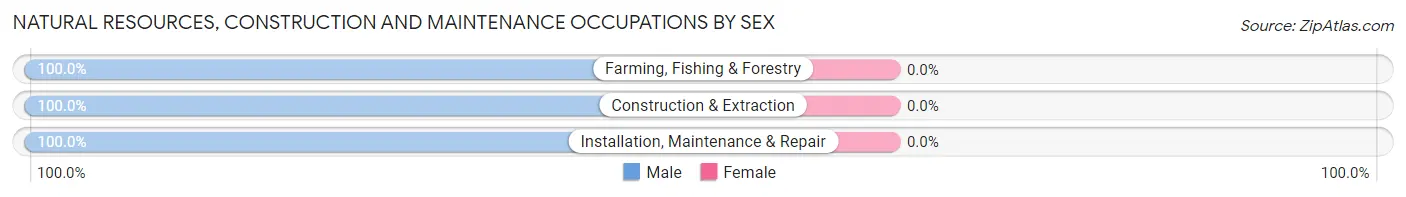
| Occupation | Male | Female |
| Farming, Fishing & Forestry | 5 (100.0%) | 0 (0.0%) |
| Construction & Extraction | 108 (100.0%) | 0 (0.0%) |
| Installation, Maintenance & Repair | 85 (100.0%) | 0 (0.0%) |
| Total (Category) | 198 (100.0%) | 0 (0.0%) |
| Total (Overall) | 587 (51.2%) | 560 (48.8%) |
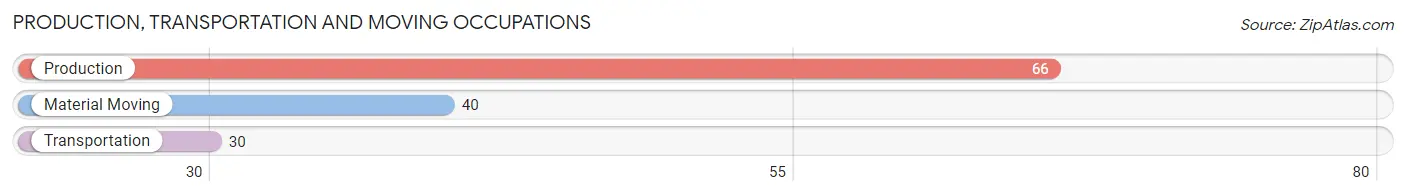
Production, Transportation and Moving Occupations
The most common Production, Transportation and Moving occupations in Helper are Production (66 | 5.8%), Material Moving (40 | 3.5%), and Transportation (30 | 2.6%).
Production, Transportation and Moving Occupations by Sex
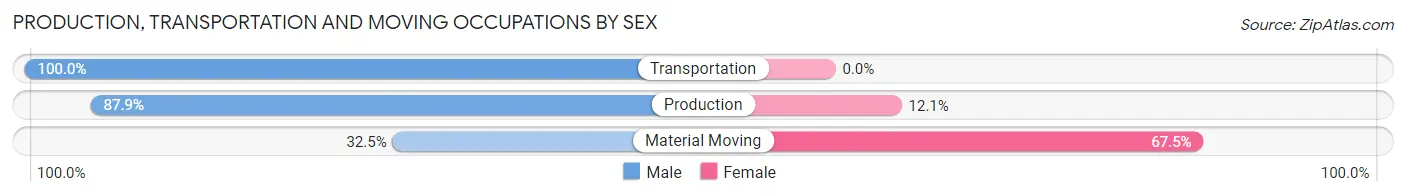
| Occupation | Male | Female |
| Production | 58 (87.9%) | 8 (12.1%) |
| Transportation | 30 (100.0%) | 0 (0.0%) |
| Material Moving | 13 (32.5%) | 27 (67.5%) |
| Total (Category) | 101 (74.3%) | 35 (25.7%) |
| Total (Overall) | 587 (51.2%) | 560 (48.8%) |
Employment Industries by Sex in Helper
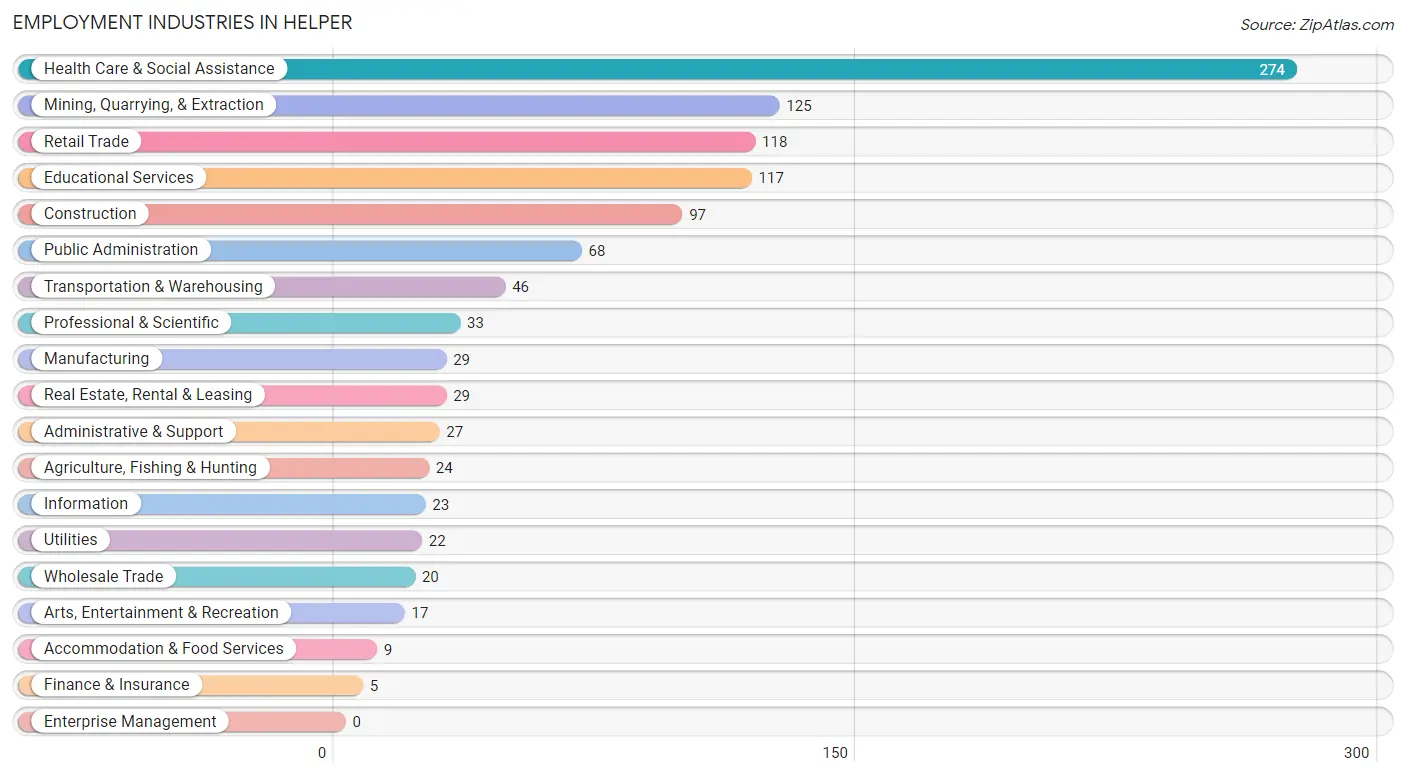
Employment Industries in Helper
The major employment industries in Helper include Health Care & Social Assistance (274 | 23.9%), Mining, Quarrying, & Extraction (125 | 10.9%), Retail Trade (118 | 10.3%), Educational Services (117 | 10.2%), and Construction (97 | 8.5%).
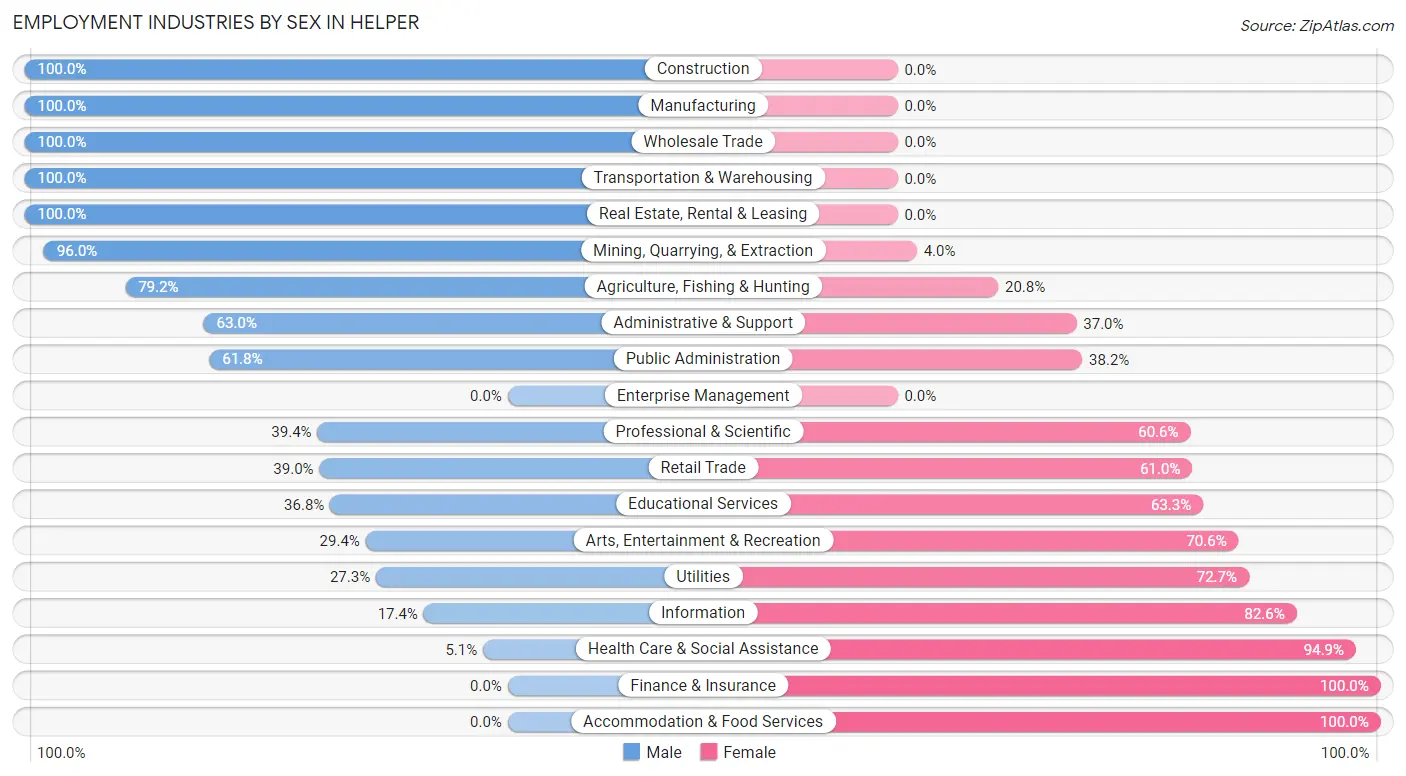
Employment Industries by Sex in Helper
The Helper industries that see more men than women are Construction (100.0%), Manufacturing (100.0%), and Wholesale Trade (100.0%), whereas the industries that tend to have a higher number of women are Finance & Insurance (100.0%), Accommodation & Food Services (100.0%), and Health Care & Social Assistance (94.9%).
| Industry | Male | Female |
| Agriculture, Fishing & Hunting | 19 (79.2%) | 5 (20.8%) |
| Mining, Quarrying, & Extraction | 120 (96.0%) | 5 (4.0%) |
| Construction | 97 (100.0%) | 0 (0.0%) |
| Manufacturing | 29 (100.0%) | 0 (0.0%) |
| Wholesale Trade | 20 (100.0%) | 0 (0.0%) |
| Retail Trade | 46 (39.0%) | 72 (61.0%) |
| Transportation & Warehousing | 46 (100.0%) | 0 (0.0%) |
| Utilities | 6 (27.3%) | 16 (72.7%) |
| Information | 4 (17.4%) | 19 (82.6%) |
| Finance & Insurance | 0 (0.0%) | 5 (100.0%) |
| Real Estate, Rental & Leasing | 29 (100.0%) | 0 (0.0%) |
| Professional & Scientific | 13 (39.4%) | 20 (60.6%) |
| Enterprise Management | 0 (0.0%) | 0 (0.0%) |
| Administrative & Support | 17 (63.0%) | 10 (37.0%) |
| Educational Services | 43 (36.7%) | 74 (63.2%) |
| Health Care & Social Assistance | 14 (5.1%) | 260 (94.9%) |
| Arts, Entertainment & Recreation | 5 (29.4%) | 12 (70.6%) |
| Accommodation & Food Services | 0 (0.0%) | 9 (100.0%) |
| Public Administration | 42 (61.8%) | 26 (38.2%) |
| Total | 587 (51.2%) | 560 (48.8%) |
Education in Helper
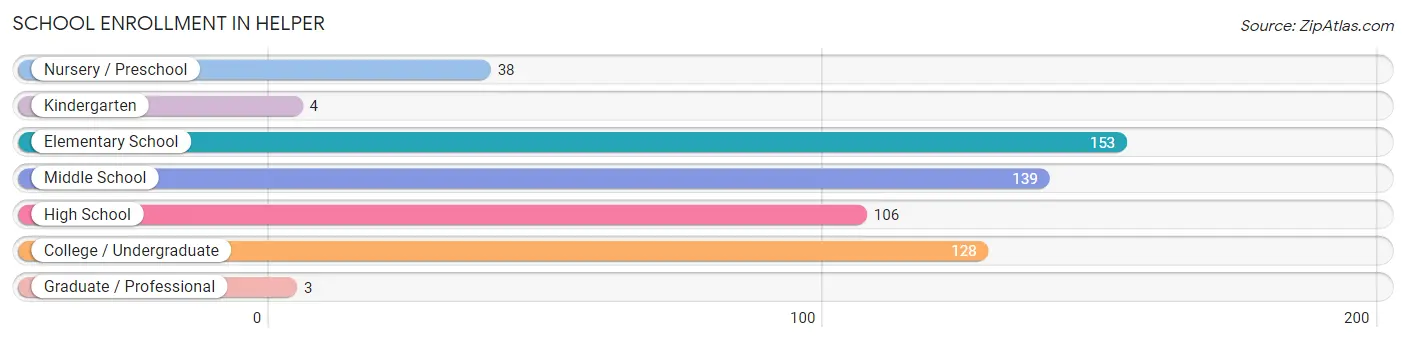
School Enrollment in Helper
The most common levels of schooling among the 571 students in Helper are elementary school (153 | 26.8%), middle school (139 | 24.3%), and college / undergraduate (128 | 22.4%).
| School Level | # Students | % Students |
| Nursery / Preschool | 38 | 6.7% |
| Kindergarten | 4 | 0.7% |
| Elementary School | 153 | 26.8% |
| Middle School | 139 | 24.3% |
| High School | 106 | 18.6% |
| College / Undergraduate | 128 | 22.4% |
| Graduate / Professional | 3 | 0.5% |
| Total | 571 | 100.0% |
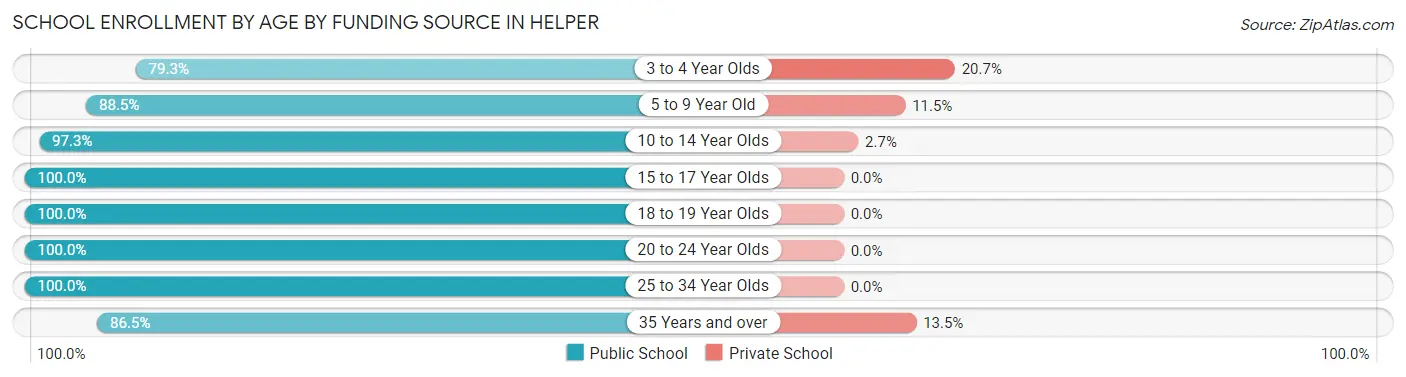
School Enrollment by Age by Funding Source in Helper
Out of a total of 571 students who are enrolled in schools in Helper, 33 (5.8%) attend a private institution, while the remaining 538 (94.2%) are enrolled in public schools. The age group of 3 to 4 year olds has the highest likelihood of being enrolled in private schools, with 6 (20.7% in the age bracket) enrolled. Conversely, the age group of 15 to 17 year olds has the lowest likelihood of being enrolled in a private school, with 95 (100.0% in the age bracket) attending a public institution.
| Age Bracket | Public School | Private School |
| 3 to 4 Year Olds | 23 (79.3%) | 6 (20.7%) |
| 5 to 9 Year Old | 139 (88.5%) | 18 (11.5%) |
| 10 to 14 Year Olds | 144 (97.3%) | 4 (2.7%) |
| 15 to 17 Year Olds | 95 (100.0%) | 0 (0.0%) |
| 18 to 19 Year Olds | 62 (100.0%) | 0 (0.0%) |
| 20 to 24 Year Olds | 23 (100.0%) | 0 (0.0%) |
| 25 to 34 Year Olds | 20 (100.0%) | 0 (0.0%) |
| 35 Years and over | 32 (86.5%) | 5 (13.5%) |
| Total | 538 (94.2%) | 33 (5.8%) |
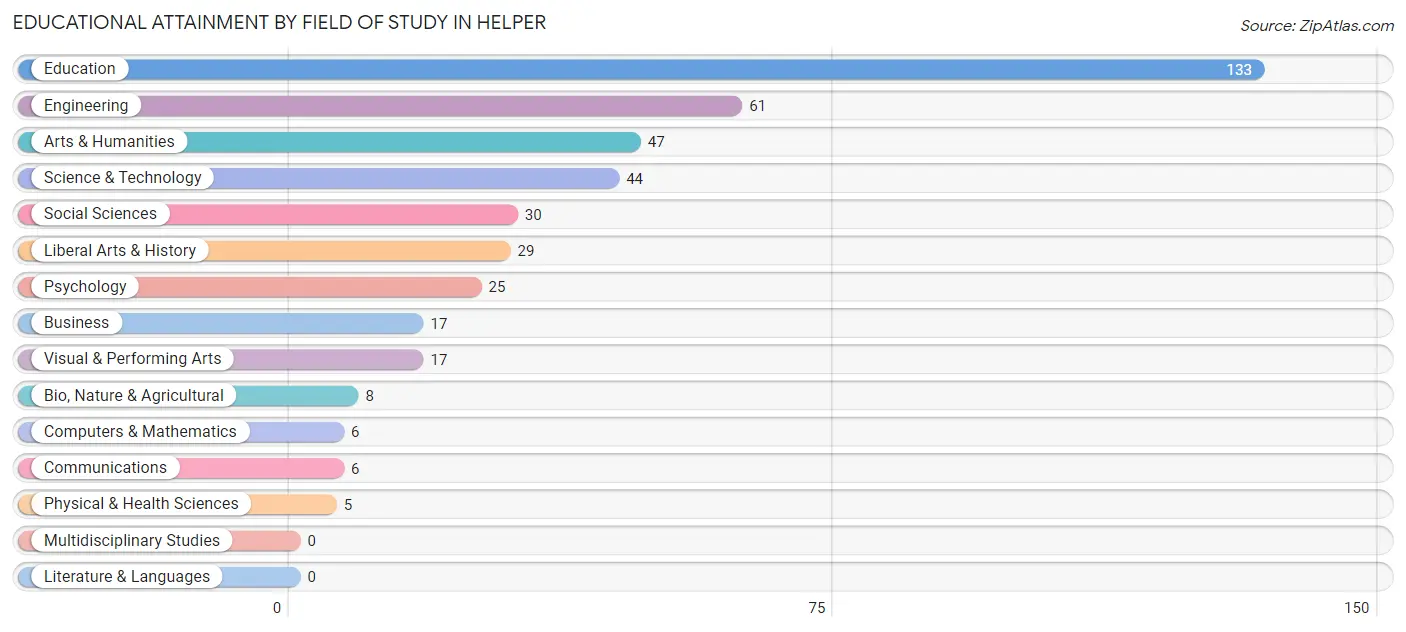
Educational Attainment by Field of Study in Helper
Education (133 | 31.1%), engineering (61 | 14.2%), arts & humanities (47 | 11.0%), science & technology (44 | 10.3%), and social sciences (30 | 7.0%) are the most common fields of study among 428 individuals in Helper who have obtained a bachelor's degree or higher.
| Field of Study | # Graduates | % Graduates |
| Computers & Mathematics | 6 | 1.4% |
| Bio, Nature & Agricultural | 8 | 1.9% |
| Physical & Health Sciences | 5 | 1.2% |
| Psychology | 25 | 5.8% |
| Social Sciences | 30 | 7.0% |
| Engineering | 61 | 14.2% |
| Multidisciplinary Studies | 0 | 0.0% |
| Science & Technology | 44 | 10.3% |
| Business | 17 | 4.0% |
| Education | 133 | 31.1% |
| Literature & Languages | 0 | 0.0% |
| Liberal Arts & History | 29 | 6.8% |
| Visual & Performing Arts | 17 | 4.0% |
| Communications | 6 | 1.4% |
| Arts & Humanities | 47 | 11.0% |
| Total | 428 | 100.0% |
Transportation & Commute in Helper
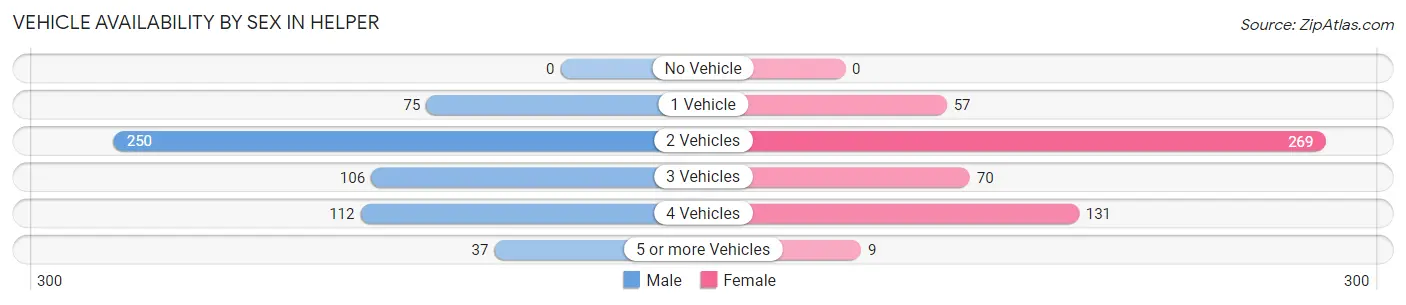
Vehicle Availability by Sex in Helper
The most prevalent vehicle ownership categories in Helper are males with 2 vehicles (250, accounting for 43.1%) and females with 2 vehicles (269, making up 46.6%).
| Vehicles Available | Male | Female |
| No Vehicle | 0 (0.0%) | 0 (0.0%) |
| 1 Vehicle | 75 (12.9%) | 57 (10.6%) |
| 2 Vehicles | 250 (43.1%) | 269 (50.2%) |
| 3 Vehicles | 106 (18.3%) | 70 (13.1%) |
| 4 Vehicles | 112 (19.3%) | 131 (24.4%) |
| 5 or more Vehicles | 37 (6.4%) | 9 (1.7%) |
| Total | 580 (100.0%) | 536 (100.0%) |
Commute Time in Helper
The most frequently occuring commute durations in Helper are 15 to 19 minutes (388 commuters, 37.3%), 10 to 14 minutes (162 commuters, 15.6%), and less than 5 minutes (127 commuters, 12.2%).
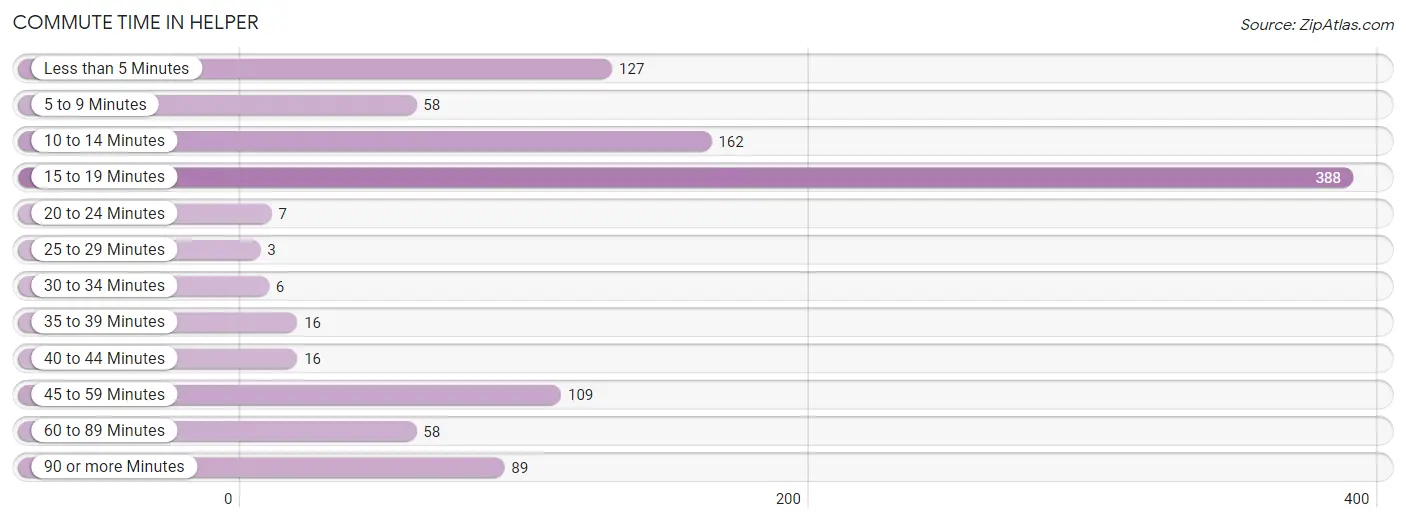
| Commute Time | # Commuters | % Commuters |
| Less than 5 Minutes | 127 | 12.2% |
| 5 to 9 Minutes | 58 | 5.6% |
| 10 to 14 Minutes | 162 | 15.6% |
| 15 to 19 Minutes | 388 | 37.3% |
| 20 to 24 Minutes | 7 | 0.7% |
| 25 to 29 Minutes | 3 | 0.3% |
| 30 to 34 Minutes | 6 | 0.6% |
| 35 to 39 Minutes | 16 | 1.5% |
| 40 to 44 Minutes | 16 | 1.5% |
| 45 to 59 Minutes | 109 | 10.5% |
| 60 to 89 Minutes | 58 | 5.6% |
| 90 or more Minutes | 89 | 8.6% |
Commute Time by Sex in Helper
The most common commute times in Helper are 15 to 19 minutes (123 commuters, 22.2%) for males and 15 to 19 minutes (265 commuters, 54.7%) for females.
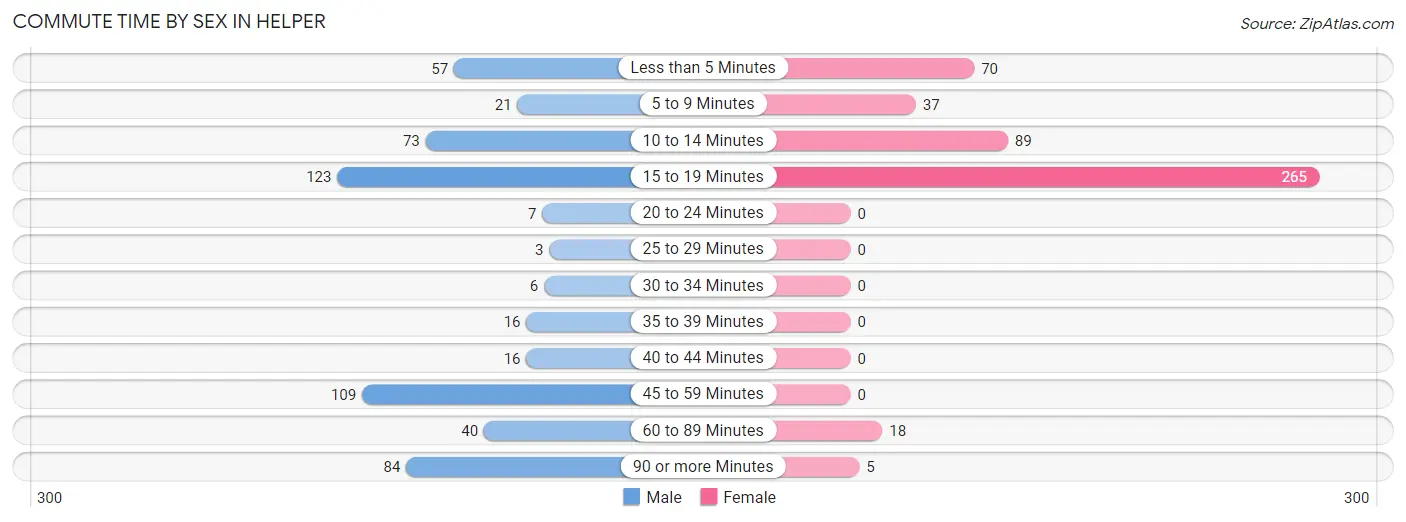
| Commute Time | Male | Female |
| Less than 5 Minutes | 57 (10.3%) | 70 (14.5%) |
| 5 to 9 Minutes | 21 (3.8%) | 37 (7.6%) |
| 10 to 14 Minutes | 73 (13.2%) | 89 (18.4%) |
| 15 to 19 Minutes | 123 (22.2%) | 265 (54.7%) |
| 20 to 24 Minutes | 7 (1.3%) | 0 (0.0%) |
| 25 to 29 Minutes | 3 (0.5%) | 0 (0.0%) |
| 30 to 34 Minutes | 6 (1.1%) | 0 (0.0%) |
| 35 to 39 Minutes | 16 (2.9%) | 0 (0.0%) |
| 40 to 44 Minutes | 16 (2.9%) | 0 (0.0%) |
| 45 to 59 Minutes | 109 (19.6%) | 0 (0.0%) |
| 60 to 89 Minutes | 40 (7.2%) | 18 (3.7%) |
| 90 or more Minutes | 84 (15.1%) | 5 (1.0%) |
Time of Departure to Work by Sex in Helper
The most frequent times of departure to work in Helper are 6:00 AM to 6:29 AM (89, 16.0%) for males and 5:30 AM to 5:59 AM (133, 27.5%) for females.
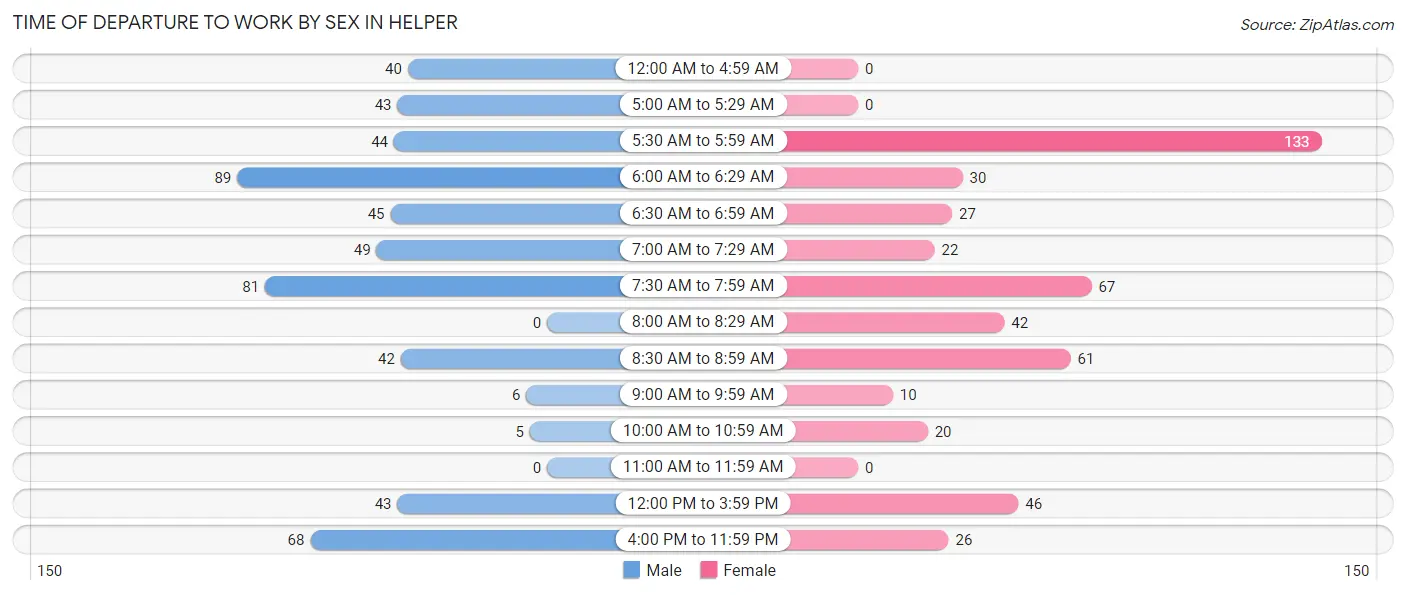
| Time of Departure | Male | Female |
| 12:00 AM to 4:59 AM | 40 (7.2%) | 0 (0.0%) |
| 5:00 AM to 5:29 AM | 43 (7.7%) | 0 (0.0%) |
| 5:30 AM to 5:59 AM | 44 (7.9%) | 133 (27.5%) |
| 6:00 AM to 6:29 AM | 89 (16.0%) | 30 (6.2%) |
| 6:30 AM to 6:59 AM | 45 (8.1%) | 27 (5.6%) |
| 7:00 AM to 7:29 AM | 49 (8.8%) | 22 (4.5%) |
| 7:30 AM to 7:59 AM | 81 (14.6%) | 67 (13.8%) |
| 8:00 AM to 8:29 AM | 0 (0.0%) | 42 (8.7%) |
| 8:30 AM to 8:59 AM | 42 (7.6%) | 61 (12.6%) |
| 9:00 AM to 9:59 AM | 6 (1.1%) | 10 (2.1%) |
| 10:00 AM to 10:59 AM | 5 (0.9%) | 20 (4.1%) |
| 11:00 AM to 11:59 AM | 0 (0.0%) | 0 (0.0%) |
| 12:00 PM to 3:59 PM | 43 (7.7%) | 46 (9.5%) |
| 4:00 PM to 11:59 PM | 68 (12.2%) | 26 (5.4%) |
| Total | 555 (100.0%) | 484 (100.0%) |
Housing Occupancy in Helper
Occupancy by Ownership in Helper
Of the total 1,073 dwellings in Helper, owner-occupied units account for 783 (73.0%), while renter-occupied units make up 290 (27.0%).
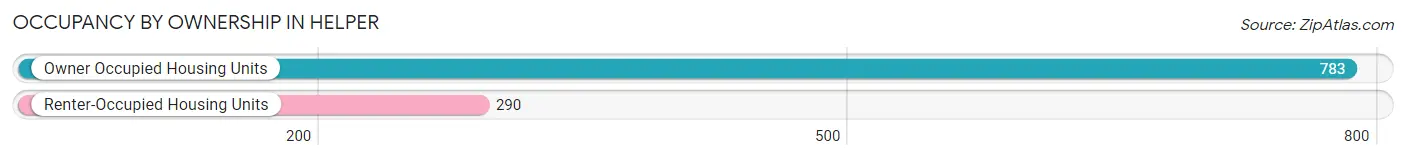
| Occupancy | # Housing Units | % Housing Units |
| Owner Occupied Housing Units | 783 | 73.0% |
| Renter-Occupied Housing Units | 290 | 27.0% |
| Total Occupied Housing Units | 1,073 | 100.0% |
Occupancy by Household Size in Helper
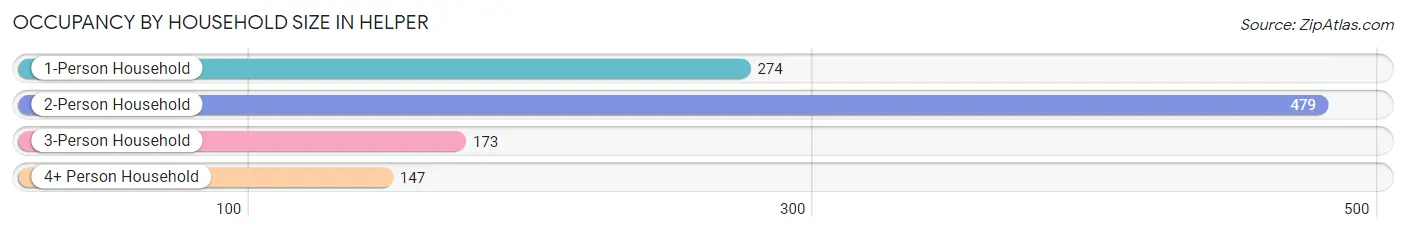
| Household Size | # Housing Units | % Housing Units |
| 1-Person Household | 274 | 25.5% |
| 2-Person Household | 479 | 44.6% |
| 3-Person Household | 173 | 16.1% |
| 4+ Person Household | 147 | 13.7% |
| Total Housing Units | 1,073 | 100.0% |
Occupancy by Ownership by Household Size in Helper
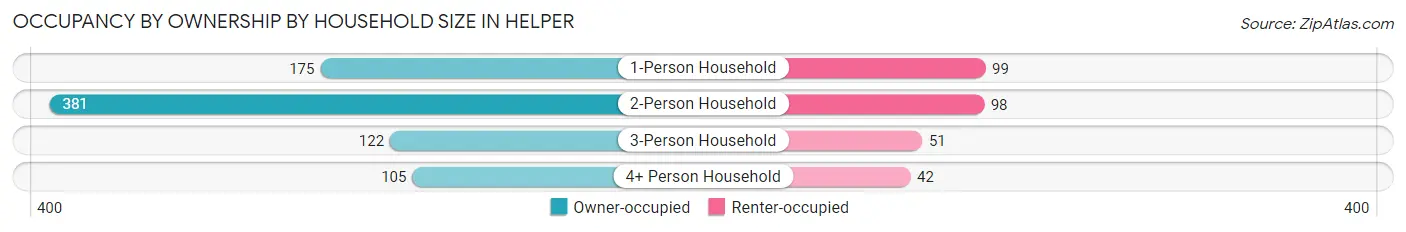
| Household Size | Owner-occupied | Renter-occupied |
| 1-Person Household | 175 (63.9%) | 99 (36.1%) |
| 2-Person Household | 381 (79.5%) | 98 (20.5%) |
| 3-Person Household | 122 (70.5%) | 51 (29.5%) |
| 4+ Person Household | 105 (71.4%) | 42 (28.6%) |
| Total Housing Units | 783 (73.0%) | 290 (27.0%) |
Occupancy by Educational Attainment in Helper
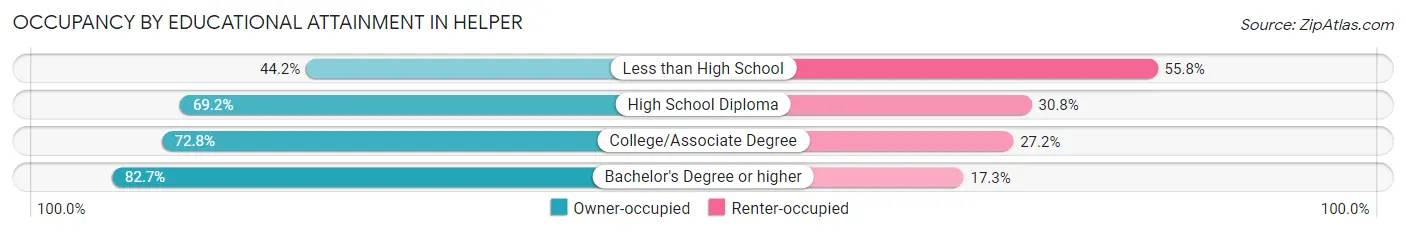
| Household Size | Owner-occupied | Renter-occupied |
| Less than High School | 19 (44.2%) | 24 (55.8%) |
| High School Diploma | 211 (69.2%) | 94 (30.8%) |
| College/Associate Degree | 343 (72.8%) | 128 (27.2%) |
| Bachelor's Degree or higher | 210 (82.7%) | 44 (17.3%) |
Occupancy by Age of Householder in Helper
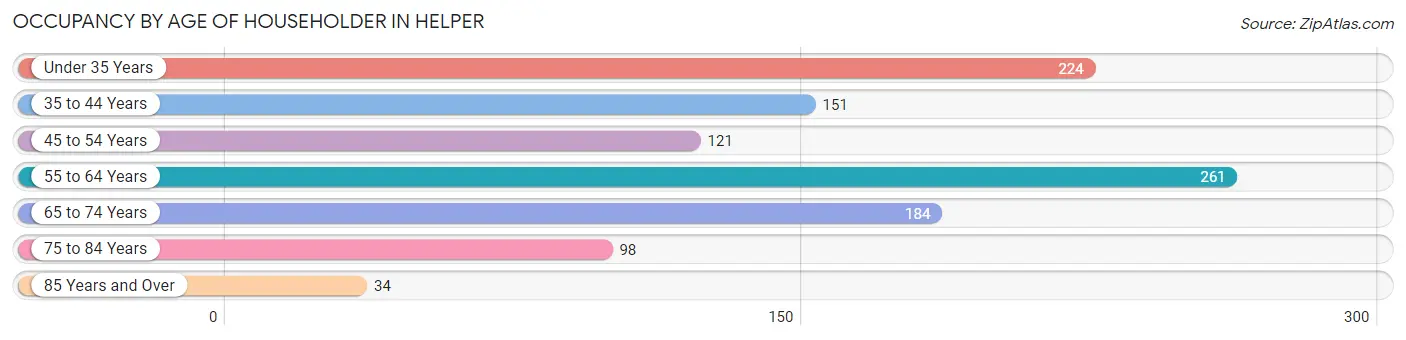
| Age Bracket | # Households | % Households |
| Under 35 Years | 224 | 20.9% |
| 35 to 44 Years | 151 | 14.1% |
| 45 to 54 Years | 121 | 11.3% |
| 55 to 64 Years | 261 | 24.3% |
| 65 to 74 Years | 184 | 17.2% |
| 75 to 84 Years | 98 | 9.1% |
| 85 Years and Over | 34 | 3.2% |
| Total | 1,073 | 100.0% |
Housing Finances in Helper
Median Income by Occupancy in Helper
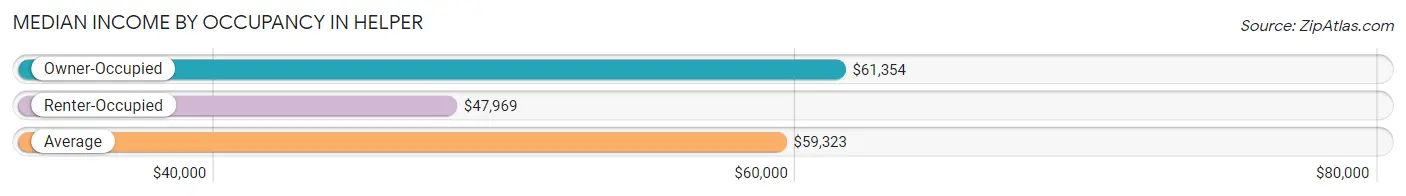
| Occupancy Type | # Households | Median Income |
| Owner-Occupied | 783 (73.0%) | $61,354 |
| Renter-Occupied | 290 (27.0%) | $47,969 |
| Average | 1,073 (100.0%) | $59,323 |
Occupancy by Householder Income Bracket in Helper
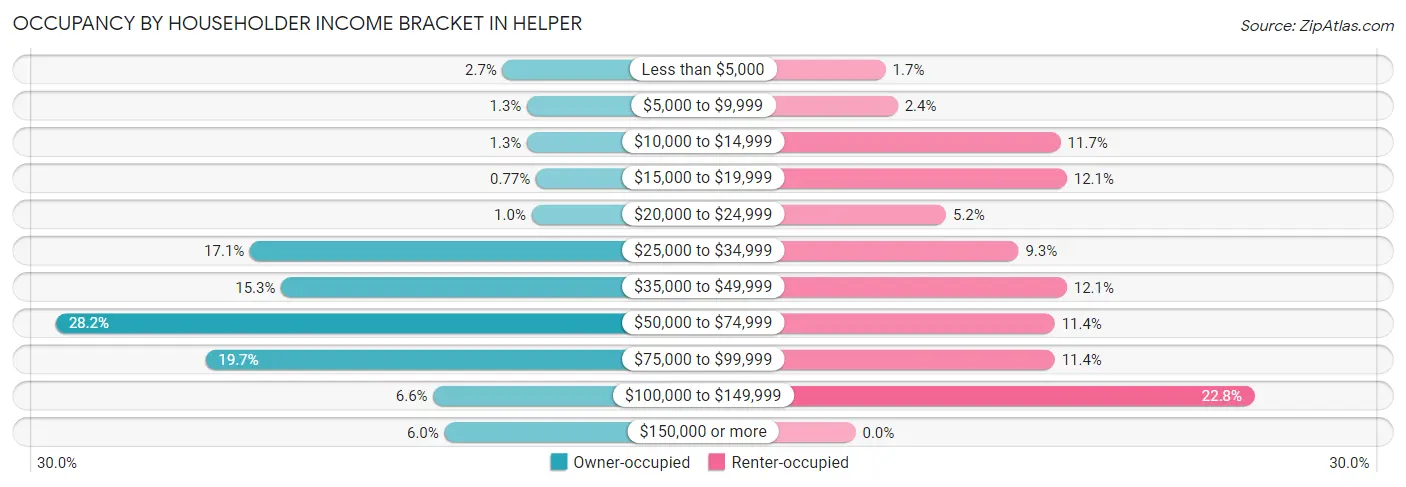
| Income Bracket | Owner-occupied | Renter-occupied |
| Less than $5,000 | 21 (2.7%) | 5 (1.7%) |
| $5,000 to $9,999 | 10 (1.3%) | 7 (2.4%) |
| $10,000 to $14,999 | 10 (1.3%) | 34 (11.7%) |
| $15,000 to $19,999 | 6 (0.8%) | 35 (12.1%) |
| $20,000 to $24,999 | 8 (1.0%) | 15 (5.2%) |
| $25,000 to $34,999 | 134 (17.1%) | 27 (9.3%) |
| $35,000 to $49,999 | 120 (15.3%) | 35 (12.1%) |
| $50,000 to $74,999 | 221 (28.2%) | 33 (11.4%) |
| $75,000 to $99,999 | 154 (19.7%) | 33 (11.4%) |
| $100,000 to $149,999 | 52 (6.6%) | 66 (22.8%) |
| $150,000 or more | 47 (6.0%) | 0 (0.0%) |
| Total | 783 (100.0%) | 290 (100.0%) |
Monthly Housing Cost Tiers in Helper
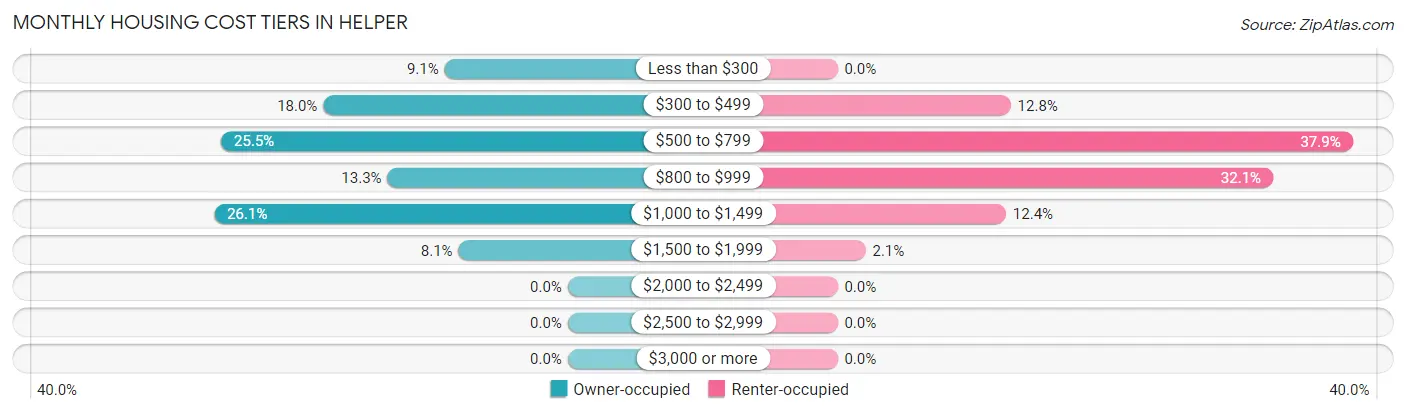
| Monthly Cost | Owner-occupied | Renter-occupied |
| Less than $300 | 71 (9.1%) | 0 (0.0%) |
| $300 to $499 | 141 (18.0%) | 37 (12.8%) |
| $500 to $799 | 200 (25.5%) | 110 (37.9%) |
| $800 to $999 | 104 (13.3%) | 93 (32.1%) |
| $1,000 to $1,499 | 204 (26.1%) | 36 (12.4%) |
| $1,500 to $1,999 | 63 (8.1%) | 6 (2.1%) |
| $2,000 to $2,499 | 0 (0.0%) | 0 (0.0%) |
| $2,500 to $2,999 | 0 (0.0%) | 0 (0.0%) |
| $3,000 or more | 0 (0.0%) | 0 (0.0%) |
| Total | 783 (100.0%) | 290 (100.0%) |
Physical Housing Characteristics in Helper
Housing Structures in Helper
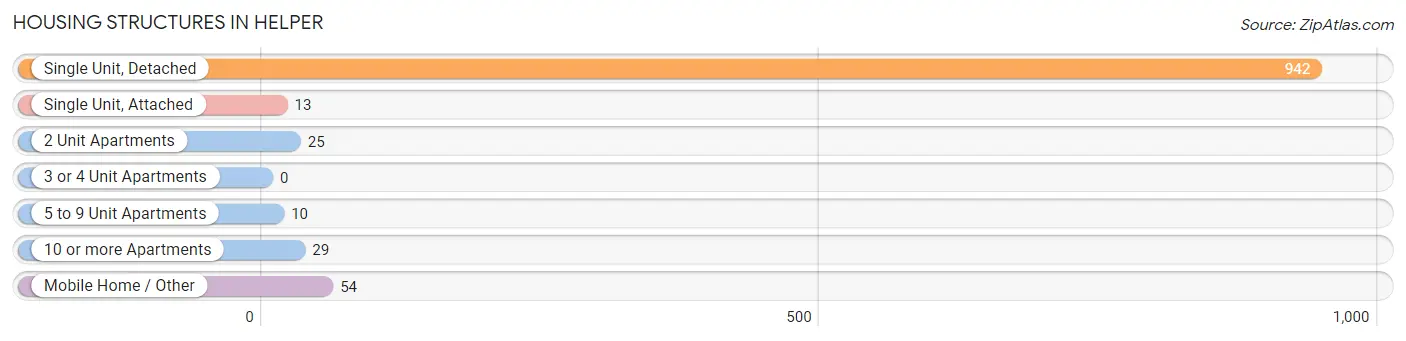
| Structure Type | # Housing Units | % Housing Units |
| Single Unit, Detached | 942 | 87.8% |
| Single Unit, Attached | 13 | 1.2% |
| 2 Unit Apartments | 25 | 2.3% |
| 3 or 4 Unit Apartments | 0 | 0.0% |
| 5 to 9 Unit Apartments | 10 | 0.9% |
| 10 or more Apartments | 29 | 2.7% |
| Mobile Home / Other | 54 | 5.0% |
| Total | 1,073 | 100.0% |
Housing Structures by Occupancy in Helper
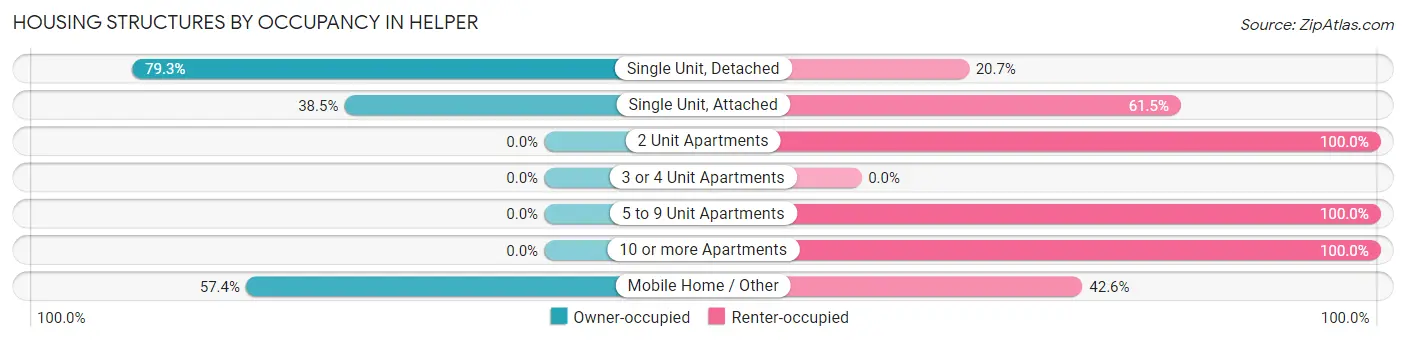
| Structure Type | Owner-occupied | Renter-occupied |
| Single Unit, Detached | 747 (79.3%) | 195 (20.7%) |
| Single Unit, Attached | 5 (38.5%) | 8 (61.5%) |
| 2 Unit Apartments | 0 (0.0%) | 25 (100.0%) |
| 3 or 4 Unit Apartments | 0 (0.0%) | 0 (0.0%) |
| 5 to 9 Unit Apartments | 0 (0.0%) | 10 (100.0%) |
| 10 or more Apartments | 0 (0.0%) | 29 (100.0%) |
| Mobile Home / Other | 31 (57.4%) | 23 (42.6%) |
| Total | 783 (73.0%) | 290 (27.0%) |
Housing Structures by Number of Rooms in Helper
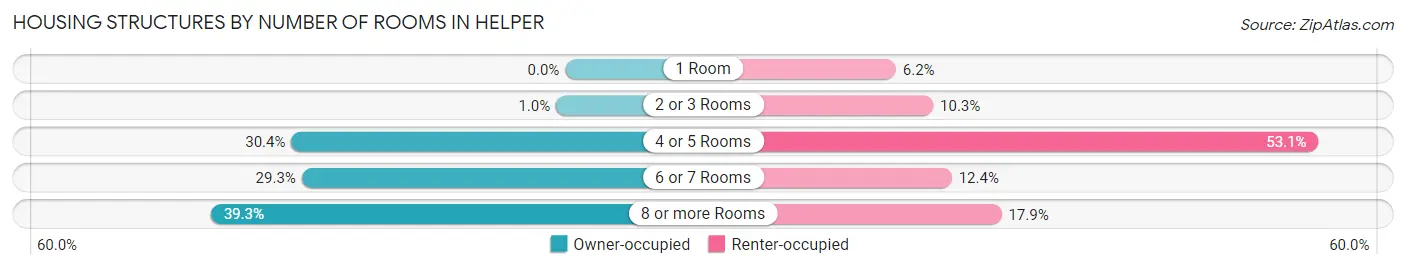
| Number of Rooms | Owner-occupied | Renter-occupied |
| 1 Room | 0 (0.0%) | 18 (6.2%) |
| 2 or 3 Rooms | 8 (1.0%) | 30 (10.3%) |
| 4 or 5 Rooms | 238 (30.4%) | 154 (53.1%) |
| 6 or 7 Rooms | 229 (29.2%) | 36 (12.4%) |
| 8 or more Rooms | 308 (39.3%) | 52 (17.9%) |
| Total | 783 (100.0%) | 290 (100.0%) |
Housing Structure by Heating Type in Helper
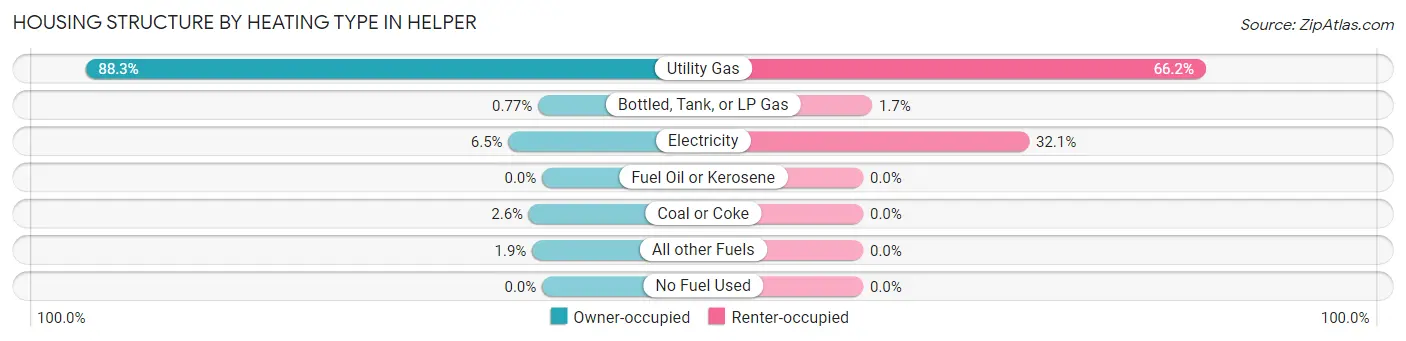
| Heating Type | Owner-occupied | Renter-occupied |
| Utility Gas | 691 (88.2%) | 192 (66.2%) |
| Bottled, Tank, or LP Gas | 6 (0.8%) | 5 (1.7%) |
| Electricity | 51 (6.5%) | 93 (32.1%) |
| Fuel Oil or Kerosene | 0 (0.0%) | 0 (0.0%) |
| Coal or Coke | 20 (2.5%) | 0 (0.0%) |
| All other Fuels | 15 (1.9%) | 0 (0.0%) |
| No Fuel Used | 0 (0.0%) | 0 (0.0%) |
| Total | 783 (100.0%) | 290 (100.0%) |
Household Vehicle Usage in Helper
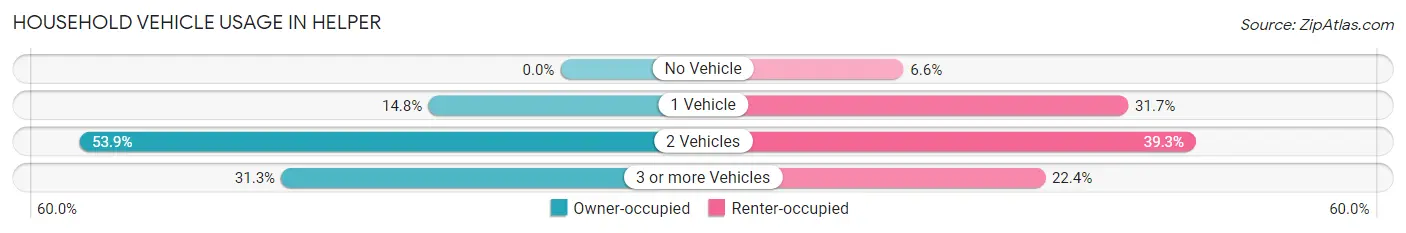
| Vehicles per Household | Owner-occupied | Renter-occupied |
| No Vehicle | 0 (0.0%) | 19 (6.6%) |
| 1 Vehicle | 116 (14.8%) | 92 (31.7%) |
| 2 Vehicles | 422 (53.9%) | 114 (39.3%) |
| 3 or more Vehicles | 245 (31.3%) | 65 (22.4%) |
| Total | 783 (100.0%) | 290 (100.0%) |
Real Estate & Mortgages in Helper
Real Estate and Mortgage Overview in Helper
| Characteristic | Without Mortgage | With Mortgage |
| Housing Units | 297 | 486 |
| Median Property Value | $163,600 | $183,100 |
| Median Household Income | $59,097 | $25 |
| Monthly Housing Costs | $396 | $0 |
| Real Estate Taxes | $1,019 | $0 |
Property Value by Mortgage Status in Helper
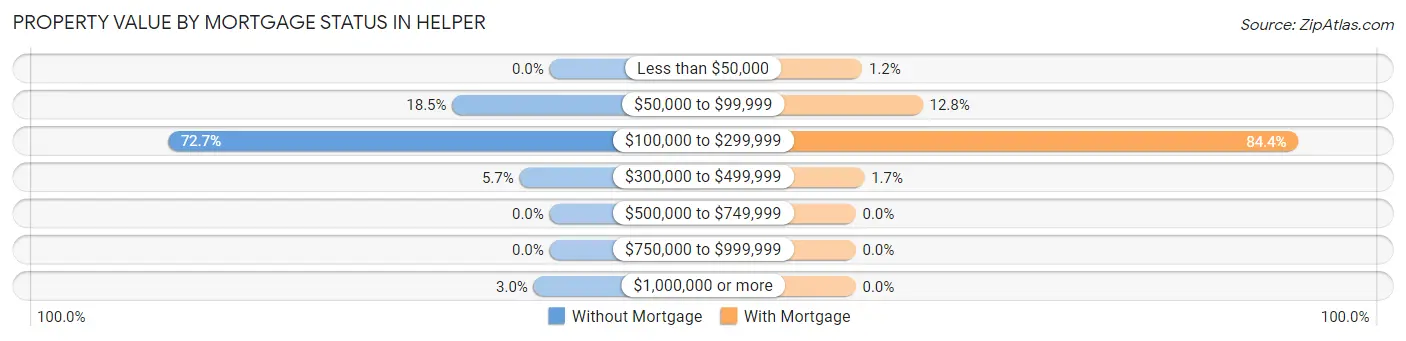
| Property Value | Without Mortgage | With Mortgage |
| Less than $50,000 | 0 (0.0%) | 6 (1.2%) |
| $50,000 to $99,999 | 55 (18.5%) | 62 (12.8%) |
| $100,000 to $299,999 | 216 (72.7%) | 410 (84.4%) |
| $300,000 to $499,999 | 17 (5.7%) | 8 (1.7%) |
| $500,000 to $749,999 | 0 (0.0%) | 0 (0.0%) |
| $750,000 to $999,999 | 0 (0.0%) | 0 (0.0%) |
| $1,000,000 or more | 9 (3.0%) | 0 (0.0%) |
| Total | 297 (100.0%) | 486 (100.0%) |
Household Income by Mortgage Status in Helper
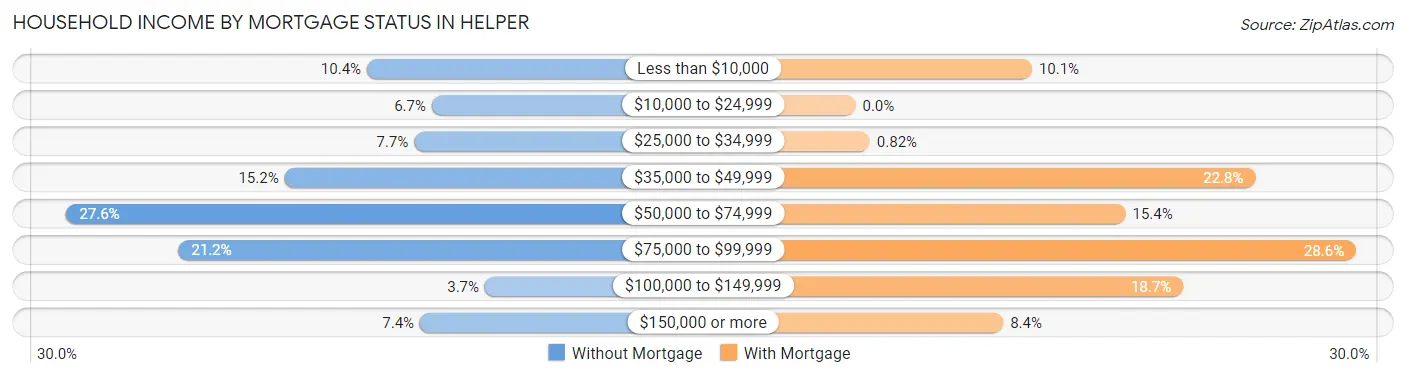
| Household Income | Without Mortgage | With Mortgage |
| Less than $10,000 | 31 (10.4%) | 49 (10.1%) |
| $10,000 to $24,999 | 20 (6.7%) | 0 (0.0%) |
| $25,000 to $34,999 | 23 (7.7%) | 4 (0.8%) |
| $35,000 to $49,999 | 45 (15.1%) | 111 (22.8%) |
| $50,000 to $74,999 | 82 (27.6%) | 75 (15.4%) |
| $75,000 to $99,999 | 63 (21.2%) | 139 (28.6%) |
| $100,000 to $149,999 | 11 (3.7%) | 91 (18.7%) |
| $150,000 or more | 22 (7.4%) | 41 (8.4%) |
| Total | 297 (100.0%) | 486 (100.0%) |
Property Value to Household Income Ratio in Helper
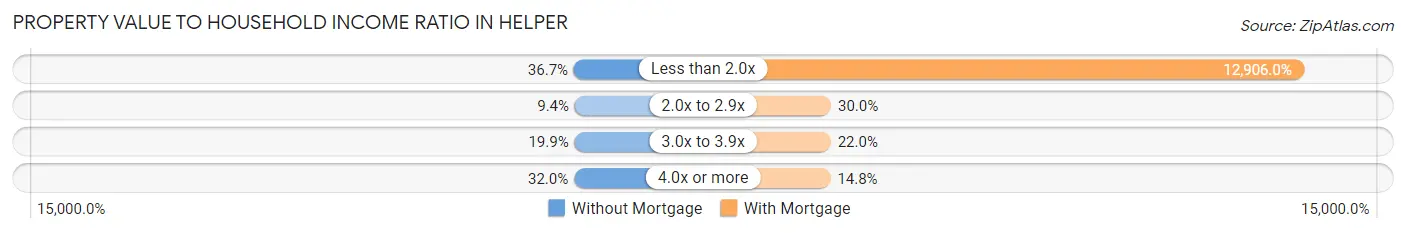
| Value-to-Income Ratio | Without Mortgage | With Mortgage |
| Less than 2.0x | 109 (36.7%) | 62,723 (12,906.0%) |
| 2.0x to 2.9x | 28 (9.4%) | 146 (30.0%) |
| 3.0x to 3.9x | 59 (19.9%) | 107 (22.0%) |
| 4.0x or more | 95 (32.0%) | 72 (14.8%) |
| Total | 297 (100.0%) | 486 (100.0%) |
Real Estate Taxes by Mortgage Status in Helper
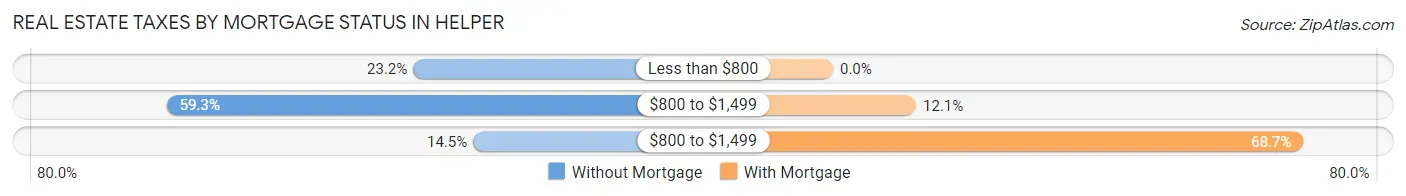
| Property Taxes | Without Mortgage | With Mortgage |
| Less than $800 | 69 (23.2%) | 0 (0.0%) |
| $800 to $1,499 | 176 (59.3%) | 59 (12.1%) |
| $800 to $1,499 | 43 (14.5%) | 334 (68.7%) |
| Total | 297 (100.0%) | 486 (100.0%) |
Health & Disability in Helper
Health Insurance Coverage by Age in Helper
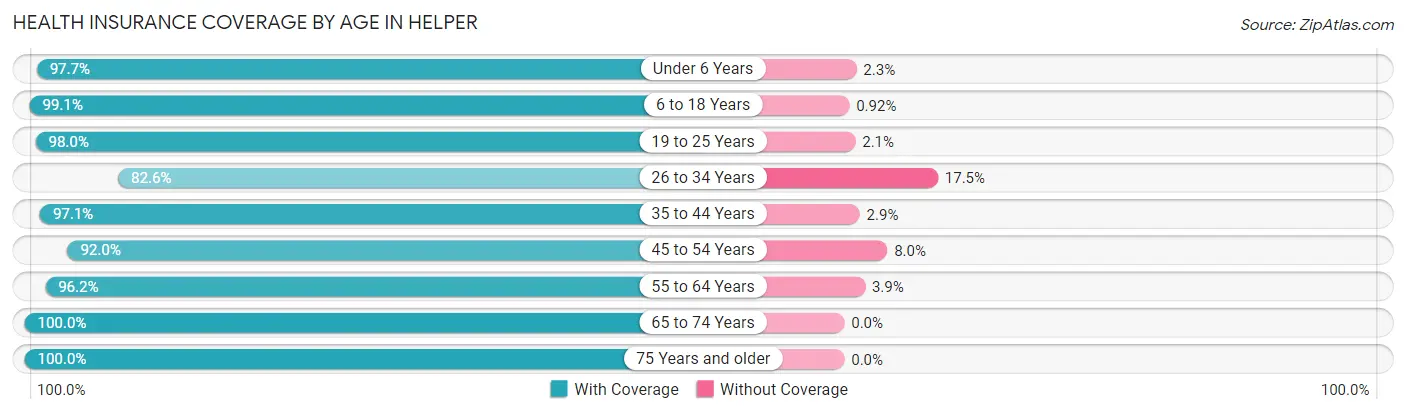
| Age Bracket | With Coverage | Without Coverage |
| Under 6 Years | 130 (97.7%) | 3 (2.3%) |
| 6 to 18 Years | 433 (99.1%) | 4 (0.9%) |
| 19 to 25 Years | 191 (98.0%) | 4 (2.1%) |
| 26 to 34 Years | 175 (82.6%) | 37 (17.4%) |
| 35 to 44 Years | 339 (97.1%) | 10 (2.9%) |
| 45 to 54 Years | 207 (92.0%) | 18 (8.0%) |
| 55 to 64 Years | 475 (96.2%) | 19 (3.8%) |
| 65 to 74 Years | 244 (100.0%) | 0 (0.0%) |
| 75 Years and older | 193 (100.0%) | 0 (0.0%) |
| Total | 2,387 (96.2%) | 95 (3.8%) |
Health Insurance Coverage by Citizenship Status in Helper
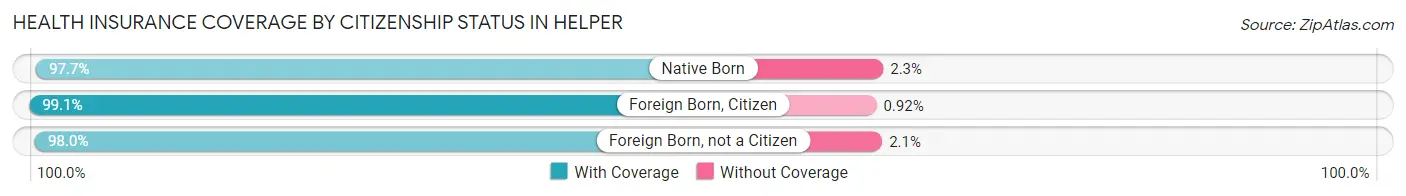
| Citizenship Status | With Coverage | Without Coverage |
| Native Born | 130 (97.7%) | 3 (2.3%) |
| Foreign Born, Citizen | 433 (99.1%) | 4 (0.9%) |
| Foreign Born, not a Citizen | 191 (98.0%) | 4 (2.1%) |
Health Insurance Coverage by Household Income in Helper
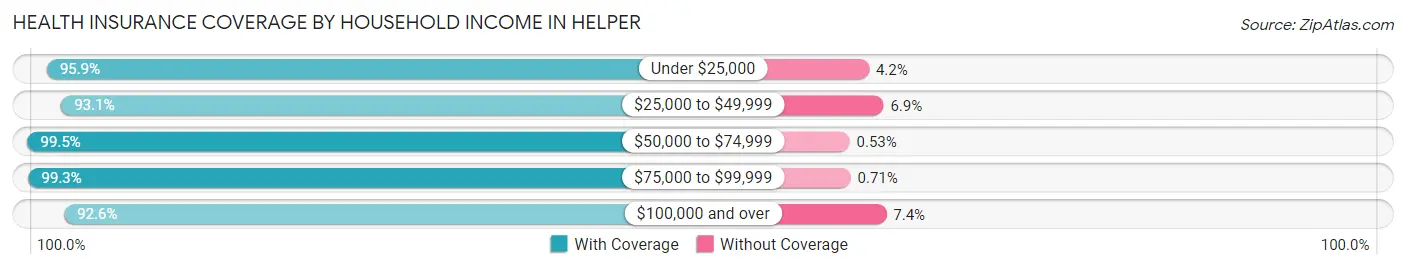
| Household Income | With Coverage | Without Coverage |
| Under $25,000 | 254 (95.9%) | 11 (4.2%) |
| $25,000 to $49,999 | 637 (93.1%) | 47 (6.9%) |
| $50,000 to $74,999 | 558 (99.5%) | 3 (0.5%) |
| $75,000 to $99,999 | 563 (99.3%) | 4 (0.7%) |
| $100,000 and over | 375 (92.6%) | 30 (7.4%) |
Public vs Private Health Insurance Coverage by Age in Helper
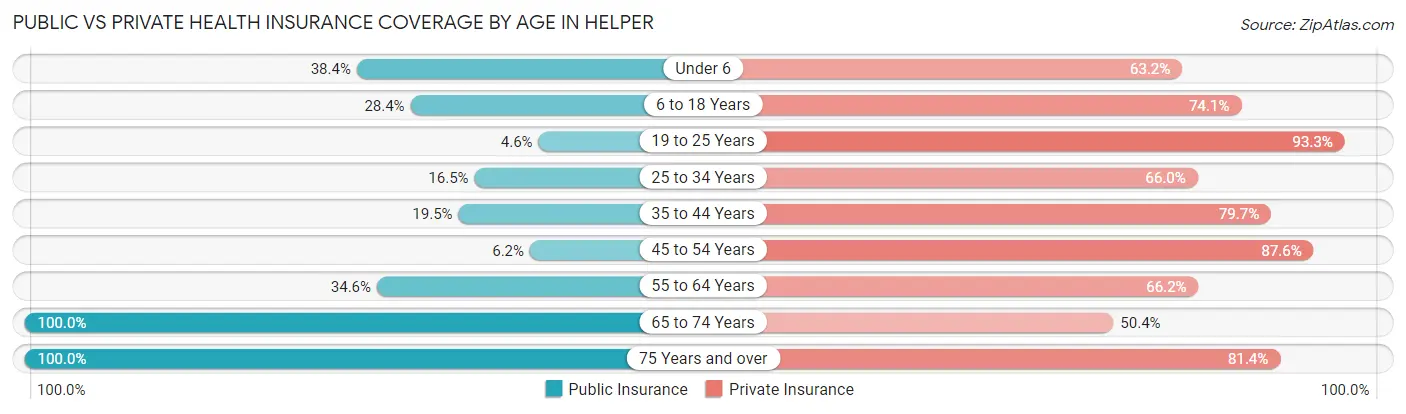
| Age Bracket | Public Insurance | Private Insurance |
| Under 6 | 51 (38.4%) | 84 (63.2%) |
| 6 to 18 Years | 124 (28.4%) | 324 (74.1%) |
| 19 to 25 Years | 9 (4.6%) | 182 (93.3%) |
| 25 to 34 Years | 35 (16.5%) | 140 (66.0%) |
| 35 to 44 Years | 68 (19.5%) | 278 (79.7%) |
| 45 to 54 Years | 14 (6.2%) | 197 (87.6%) |
| 55 to 64 Years | 171 (34.6%) | 327 (66.2%) |
| 65 to 74 Years | 244 (100.0%) | 123 (50.4%) |
| 75 Years and over | 193 (100.0%) | 157 (81.4%) |
| Total | 909 (36.6%) | 1,812 (73.0%) |
Disability Status by Sex by Age in Helper
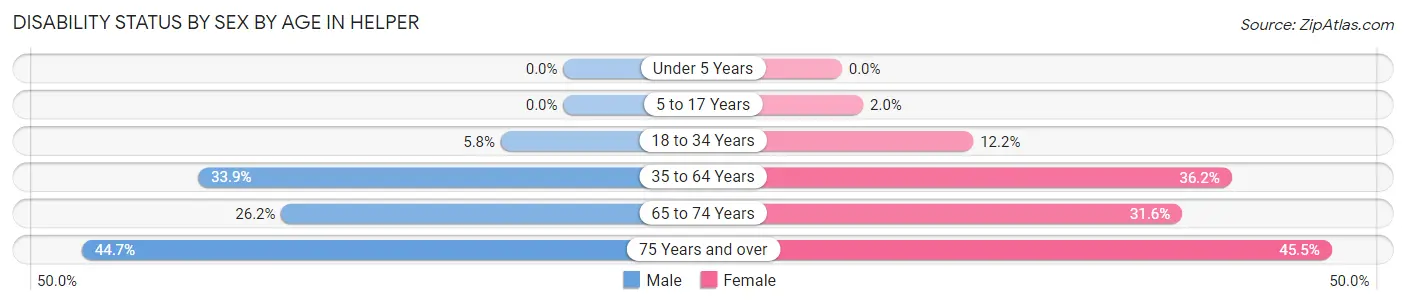
| Age Bracket | Male | Female |
| Under 5 Years | 0 (0.0%) | 0 (0.0%) |
| 5 to 17 Years | 0 (0.0%) | 4 (2.0%) |
| 18 to 34 Years | 12 (5.8%) | 30 (12.2%) |
| 35 to 64 Years | 183 (33.9%) | 191 (36.2%) |
| 65 to 74 Years | 39 (26.2%) | 30 (31.6%) |
| 75 Years and over | 42 (44.7%) | 45 (45.5%) |
Disability Class by Sex by Age in Helper
Disability Class: Hearing Difficulty
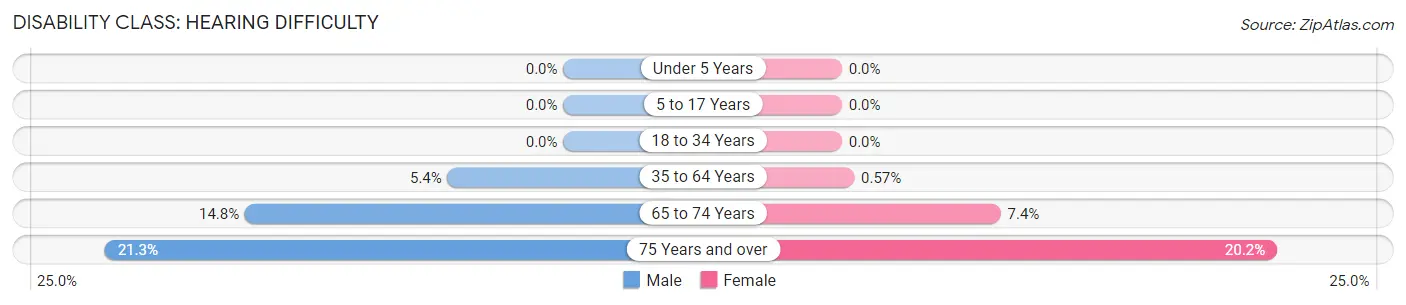
| Age Bracket | Male | Female |
| Under 5 Years | 0 (0.0%) | 0 (0.0%) |
| 5 to 17 Years | 0 (0.0%) | 0 (0.0%) |
| 18 to 34 Years | 0 (0.0%) | 0 (0.0%) |
| 35 to 64 Years | 29 (5.4%) | 3 (0.6%) |
| 65 to 74 Years | 22 (14.8%) | 7 (7.4%) |
| 75 Years and over | 20 (21.3%) | 20 (20.2%) |
Disability Class: Vision Difficulty
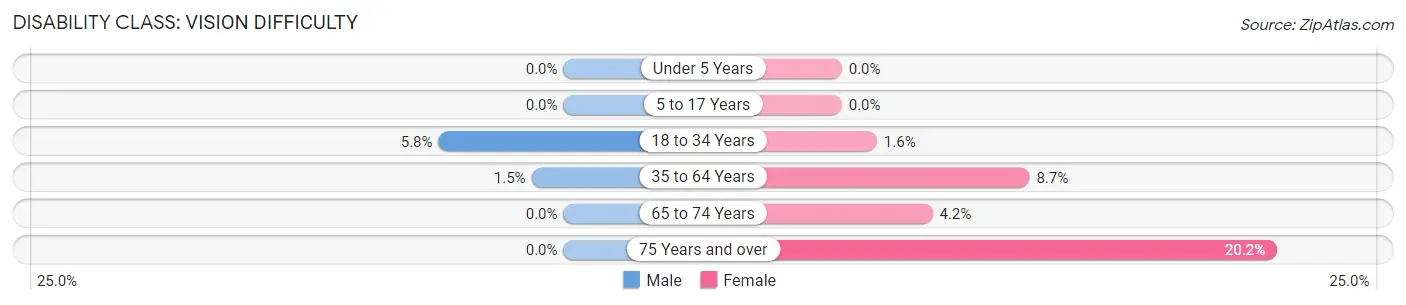
| Age Bracket | Male | Female |
| Under 5 Years | 0 (0.0%) | 0 (0.0%) |
| 5 to 17 Years | 0 (0.0%) | 0 (0.0%) |
| 18 to 34 Years | 12 (5.8%) | 4 (1.6%) |
| 35 to 64 Years | 8 (1.5%) | 46 (8.7%) |
| 65 to 74 Years | 0 (0.0%) | 4 (4.2%) |
| 75 Years and over | 0 (0.0%) | 20 (20.2%) |
Disability Class: Cognitive Difficulty
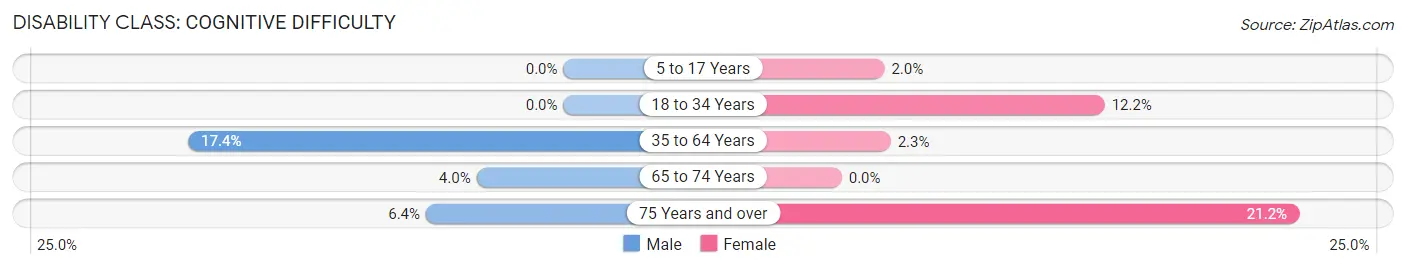
| Age Bracket | Male | Female |
| 5 to 17 Years | 0 (0.0%) | 4 (2.0%) |
| 18 to 34 Years | 0 (0.0%) | 30 (12.2%) |
| 35 to 64 Years | 94 (17.4%) | 12 (2.3%) |
| 65 to 74 Years | 6 (4.0%) | 0 (0.0%) |
| 75 Years and over | 6 (6.4%) | 21 (21.2%) |
Disability Class: Ambulatory Difficulty
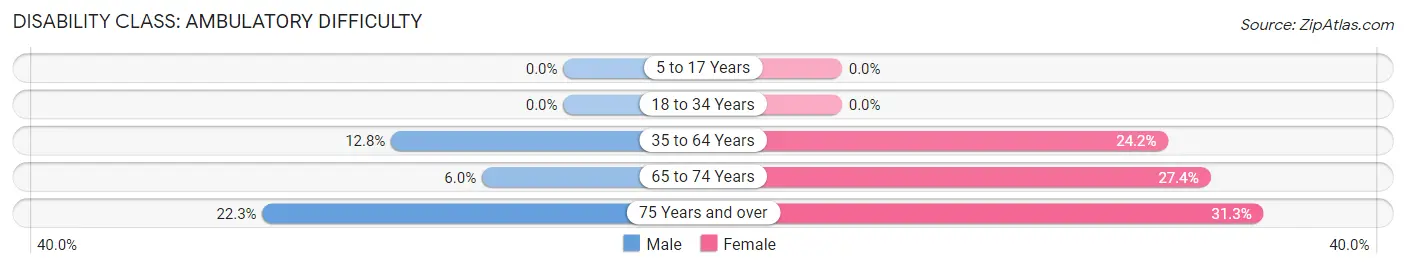
| Age Bracket | Male | Female |
| 5 to 17 Years | 0 (0.0%) | 0 (0.0%) |
| 18 to 34 Years | 0 (0.0%) | 0 (0.0%) |
| 35 to 64 Years | 69 (12.8%) | 128 (24.2%) |
| 65 to 74 Years | 9 (6.0%) | 26 (27.4%) |
| 75 Years and over | 21 (22.3%) | 31 (31.3%) |
Disability Class: Self-Care Difficulty
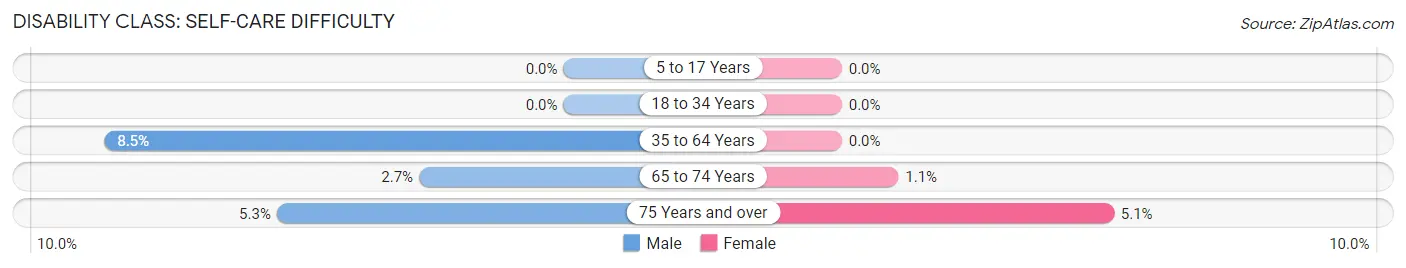
| Age Bracket | Male | Female |
| 5 to 17 Years | 0 (0.0%) | 0 (0.0%) |
| 18 to 34 Years | 0 (0.0%) | 0 (0.0%) |
| 35 to 64 Years | 46 (8.5%) | 0 (0.0%) |
| 65 to 74 Years | 4 (2.7%) | 1 (1.1%) |
| 75 Years and over | 5 (5.3%) | 5 (5.1%) |
Technology Access in Helper
Computing Device Access in Helper
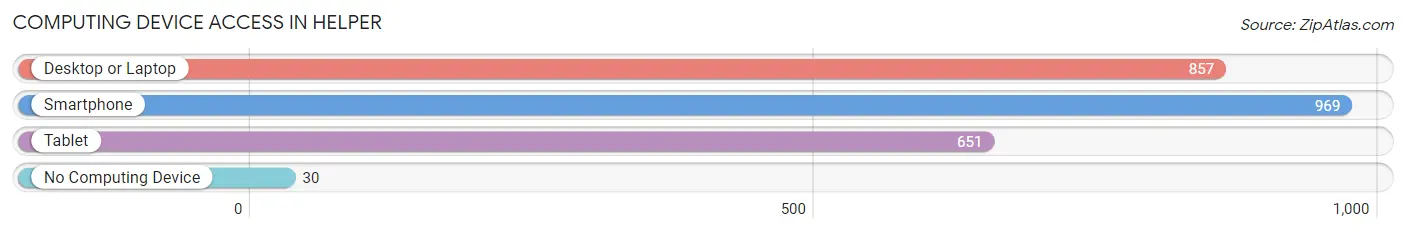
| Device Type | # Households | % Households |
| Desktop or Laptop | 857 | 79.9% |
| Smartphone | 969 | 90.3% |
| Tablet | 651 | 60.7% |
| No Computing Device | 30 | 2.8% |
| Total | 1,073 | 100.0% |
Internet Access in Helper
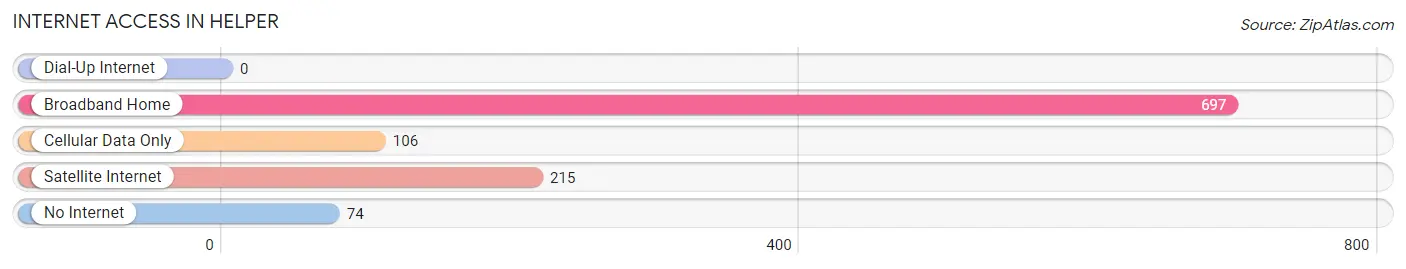
| Internet Type | # Households | % Households |
| Dial-Up Internet | 0 | 0.0% |
| Broadband Home | 697 | 65.0% |
| Cellular Data Only | 106 | 9.9% |
| Satellite Internet | 215 | 20.0% |
| No Internet | 74 | 6.9% |
| Total | 1,073 | 100.0% |
Helper Summary
The state of Utah is located in the western United States and is the 13th largest state in the country. It is bordered by Idaho to the north, Wyoming to the northeast, Colorado to the east, Arizona to the south, and Nevada to the west. Utah is known for its diverse geography, ranging from the Great Salt Lake in the north to the red rock canyons of the south. The state is also home to five national parks, including Zion National Park, Bryce Canyon National Park, and Arches National Park.
Geography
Utah is a land of great diversity and beauty. It is home to the Great Salt Lake, the largest saltwater lake in the western hemisphere, and the Wasatch Mountains, which stretch across the northern part of the state. The Wasatch Range is home to some of the most spectacular scenery in the country, including the Uinta Mountains, which are the highest range in Utah. The state also has numerous canyons, including the Grand Canyon of the Colorado River, which is located in the south.
The climate of Utah is generally dry and semi-arid, with cold winters and hot summers. The average annual temperature is around 50°F (10°C). The state receives an average of 12 inches (30 cm) of precipitation each year, most of which falls in the winter months.
Economy
Utah has a strong and diverse economy. The state is home to a number of major industries, including mining, manufacturing, tourism, and agriculture. Mining is the largest industry in the state, with copper, gold, and silver being the most important minerals. Manufacturing is also an important part of the economy, with the state producing a variety of products, including electronics, chemicals, and food products. Tourism is also a major industry in Utah, with the state being home to five national parks and numerous other attractions.
Agriculture is also an important part of the economy, with the state producing a variety of crops, including wheat, corn, hay, and alfalfa. Livestock production is also important, with cattle, sheep, and hogs being the most important animals.
Demographics
As of 2020, the population of Utah was estimated to be 3.2 million. The state is home to a diverse population, with the largest ethnic groups being White (78.2%), Hispanic or Latino (13.2%), and Native American (2.2%). The state also has a large Mormon population, with nearly two-thirds of the population identifying as members of the Church of Jesus Christ of Latter-day Saints.
The median household income in Utah is $63,845, which is slightly higher than the national average. The state also has a low unemployment rate of 3.2%, which is lower than the national average.
Conclusion
Utah is a state of great diversity and beauty. It is home to a variety of landscapes, from the Great Salt Lake in the north to the red rock canyons of the south. The state also has a strong and diverse economy, with mining, manufacturing, tourism, and agriculture being the most important industries. The population of Utah is diverse, with the largest ethnic groups being White, Hispanic or Latino, and Native American. The state also has a large Mormon population, with nearly two-thirds of the population identifying as members of the Church of Jesus Christ of Latter-day Saints.
Common Questions
What is Per Capita Income in Helper?
Per Capita income in Helper is $28,039.
What is the Median Family Income in Helper?
Median Family Income in Helper is $64,432.
What is the Median Household income in Helper?
Median Household Income in Helper is $59,323.
What is Income or Wage Gap in Helper?
Income or Wage Gap in Helper is 60.6%.
Women in Helper earn 39.4 cents for every dollar earned by a man.
What is Inequality or Gini Index in Helper?
Inequality or Gini Index in Helper is 0.38.
What is the Total Population of Helper?
Total Population of Helper is 2,482.
What is the Total Male Population of Helper?
Total Male Population of Helper is 1,244.
What is the Total Female Population of Helper?
Total Female Population of Helper is 1,238.
What is the Ratio of Males per 100 Females in Helper?
There are 100.48 Males per 100 Females in Helper.
What is the Ratio of Females per 100 Males in Helper?
There are 99.52 Females per 100 Males in Helper.
What is the Median Population Age in Helper?
Median Population Age in Helper is 43.2 Years.
What is the Average Family Size in Helper
Average Family Size in Helper is 2.8 People.
What is the Average Household Size in Helper
Average Household Size in Helper is 2.3 People.
How Large is the Labor Force in Helper?
There are 1,209 People in the Labor Forcein in Helper.
What is the Percentage of People in the Labor Force in Helper?
60.1% of People are in the Labor Force in Helper.
What is the Unemployment Rate in Helper?
Unemployment Rate in Helper is 5.1%.