Spring City, UT Map & Demographics
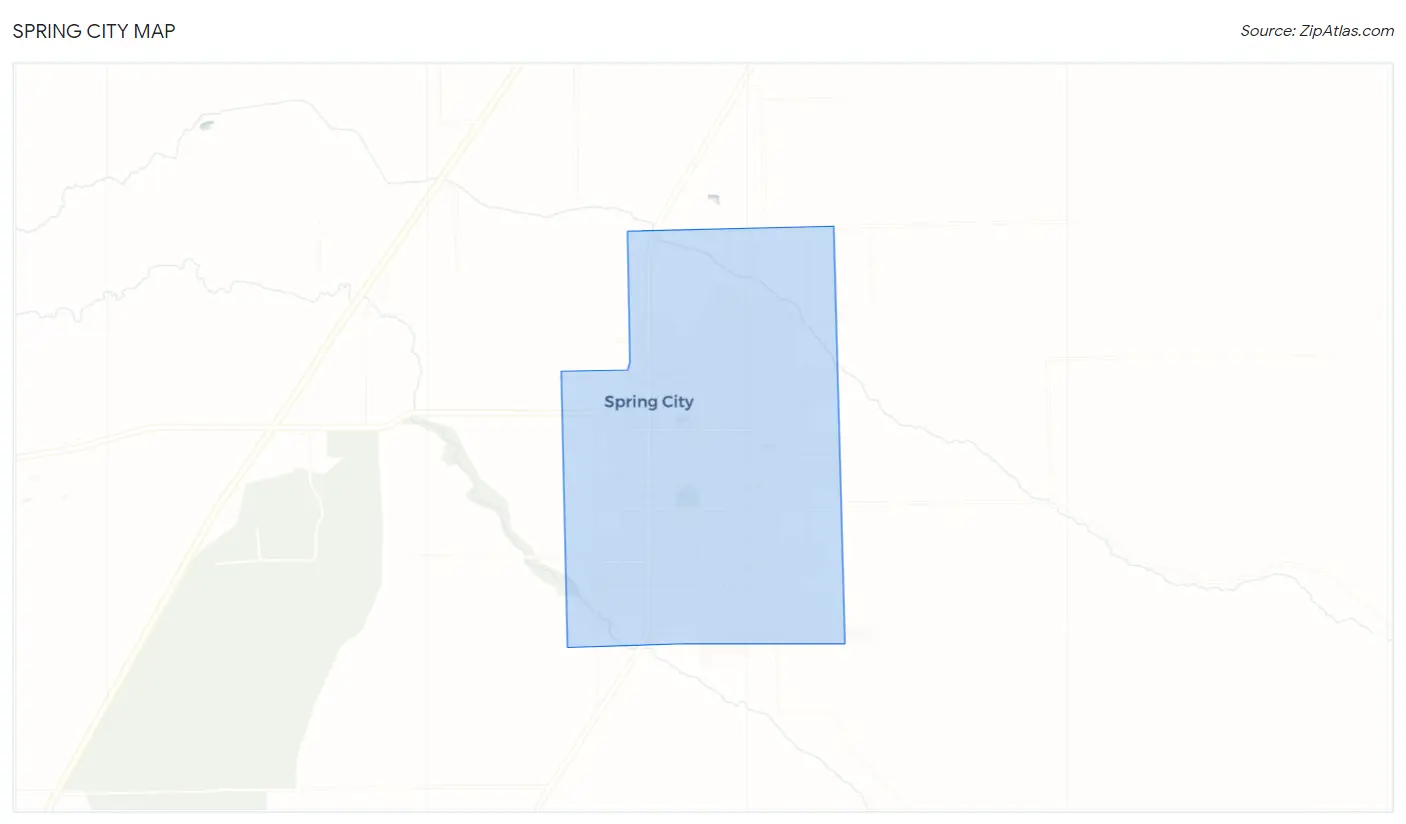
Spring City Map
Spring City Overview
$29,368
PER CAPITA INCOME
$66,724
AVG FAMILY INCOME
$62,679
AVG HOUSEHOLD INCOME
52.2%
WAGE / INCOME GAP [ % ]
47.8¢/ $1
WAGE / INCOME GAP [ $ ]
0.39
INEQUALITY / GINI INDEX
1,108
TOTAL POPULATION
567
MALE POPULATION
541
FEMALE POPULATION
104.81
MALES / 100 FEMALES
95.41
FEMALES / 100 MALES
50.3
MEDIAN AGE
3.1
AVG FAMILY SIZE
2.8
AVG HOUSEHOLD SIZE
467
LABOR FORCE [ PEOPLE ]
52.4%
PERCENT IN LABOR FORCE
12.0%
UNEMPLOYMENT RATE
Spring City Zip Codes
Spring City Area Codes
Income in Spring City
Income Overview in Spring City
Per Capita Income in Spring City is $29,368, while median incomes of families and households are $66,724 and $62,679 respectively.
| Characteristic | Number | Measure |
| Per Capita Income | 1,108 | $29,368 |
| Median Family Income | 320 | $66,724 |
| Mean Family Income | 320 | $88,018 |
| Median Household Income | 403 | $62,679 |
| Mean Household Income | 403 | $76,263 |
| Income Deficit | 320 | $0 |
| Wage / Income Gap (%) | 1,108 | 52.24% |
| Wage / Income Gap ($) | 1,108 | 47.76¢ per $1 |
| Gini / Inequality Index | 1,108 | 0.39 |
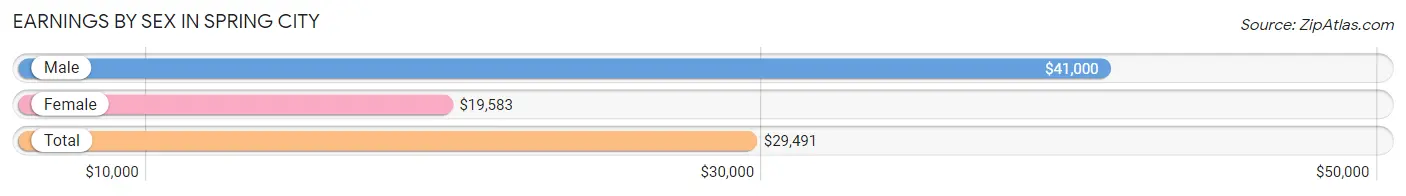
Earnings by Sex in Spring City
Average Earnings in Spring City are $29,491, $41,000 for men and $19,583 for women, a difference of 52.2%.
| Sex | Number | Average Earnings |
| Male | 254 (51.9%) | $41,000 |
| Female | 235 (48.1%) | $19,583 |
| Total | 489 (100.0%) | $29,491 |
Earnings by Sex by Income Bracket in Spring City
The most common earnings brackets in Spring City are $65,000 to $74,999 for men (41 | 16.1%) and $50,000 to $54,999 for women (31 | 13.2%).
| Income | Male | Female |
| $2,499 or less | 12 (4.7%) | 13 (5.5%) |
| $2,500 to $4,999 | 36 (14.2%) | 29 (12.3%) |
| $5,000 to $7,499 | 2 (0.8%) | 11 (4.7%) |
| $7,500 to $9,999 | 5 (2.0%) | 28 (11.9%) |
| $10,000 to $12,499 | 7 (2.8%) | 9 (3.8%) |
| $12,500 to $14,999 | 0 (0.0%) | 9 (3.8%) |
| $15,000 to $17,499 | 2 (0.8%) | 16 (6.8%) |
| $17,500 to $19,999 | 2 (0.8%) | 3 (1.3%) |
| $20,000 to $22,499 | 6 (2.4%) | 5 (2.1%) |
| $22,500 to $24,999 | 16 (6.3%) | 2 (0.9%) |
| $25,000 to $29,999 | 30 (11.8%) | 7 (3.0%) |
| $30,000 to $34,999 | 1 (0.4%) | 10 (4.3%) |
| $35,000 to $39,999 | 6 (2.4%) | 11 (4.7%) |
| $40,000 to $44,999 | 5 (2.0%) | 14 (6.0%) |
| $45,000 to $49,999 | 26 (10.2%) | 9 (3.8%) |
| $50,000 to $54,999 | 7 (2.8%) | 31 (13.2%) |
| $55,000 to $64,999 | 1 (0.4%) | 11 (4.7%) |
| $65,000 to $74,999 | 41 (16.1%) | 8 (3.4%) |
| $75,000 to $99,999 | 30 (11.8%) | 3 (1.3%) |
| $100,000+ | 19 (7.5%) | 6 (2.5%) |
| Total | 254 (100.0%) | 235 (100.0%) |
Earnings by Sex by Educational Attainment in Spring City
Average earnings in Spring City are $45,577 for men and $30,250 for women, a difference of 33.6%. Men with an educational attainment of graduate degree enjoy the highest average annual earnings of $66,087, while those with high school diploma education earn the least with $29,583. Women with an educational attainment of graduate degree earn the most with the average annual earnings of $54,886, while those with less than high school education have the smallest earnings of $8,214.
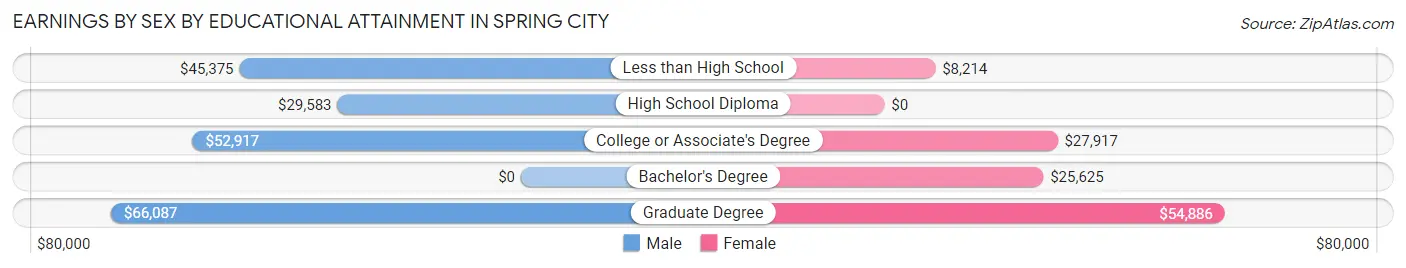
| Educational Attainment | Male Income | Female Income |
| Less than High School | $45,375 | $8,214 |
| High School Diploma | $29,583 | $0 |
| College or Associate's Degree | $52,917 | $27,917 |
| Bachelor's Degree | - | - |
| Graduate Degree | $66,087 | $54,886 |
| Total | $45,577 | $30,250 |
Family Income in Spring City
Family Income Brackets in Spring City
According to the Spring City family income data, there are 89 families falling into the $50,000 to $74,999 income range, which is the most common income bracket and makes up 27.8% of all families.
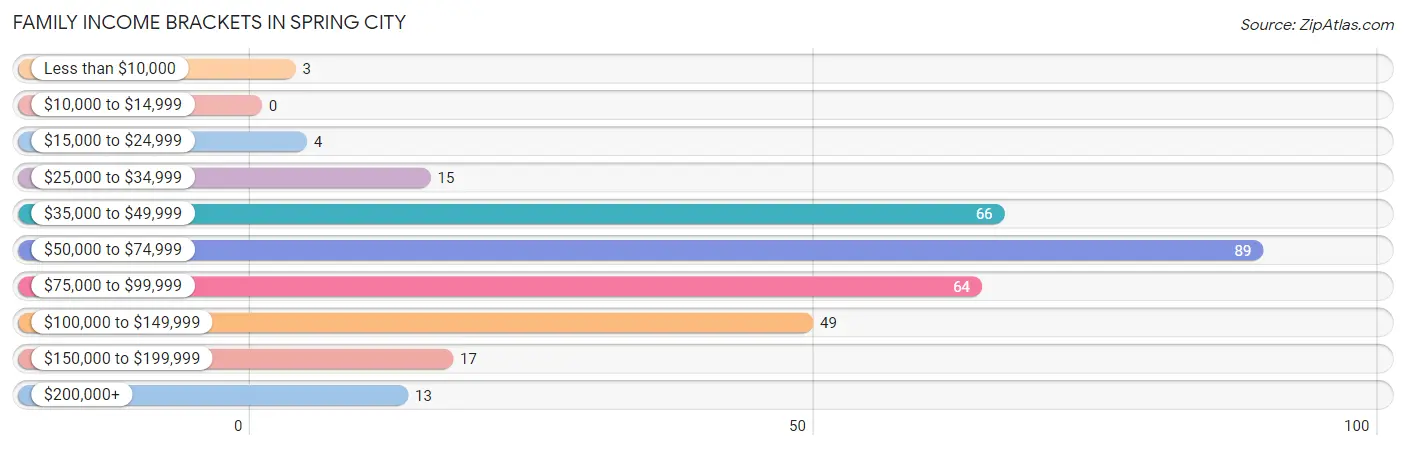
| Income Bracket | # Families | % Families |
| Less than $10,000 | 3 | 0.9% |
| $10,000 to $14,999 | 0 | 0.0% |
| $15,000 to $24,999 | 4 | 1.3% |
| $25,000 to $34,999 | 15 | 4.7% |
| $35,000 to $49,999 | 66 | 20.6% |
| $50,000 to $74,999 | 89 | 27.8% |
| $75,000 to $99,999 | 64 | 20.0% |
| $100,000 to $149,999 | 49 | 15.3% |
| $150,000 to $199,999 | 17 | 5.3% |
| $200,000+ | 13 | 4.1% |
Family Income by Famaliy Size in Spring City
7+ person families (6 | 1.9%) account for the highest median family income in Spring City with $86,667 per family, while 2-person families (173 | 54.1%) have the highest median income of $36,458 per family member.
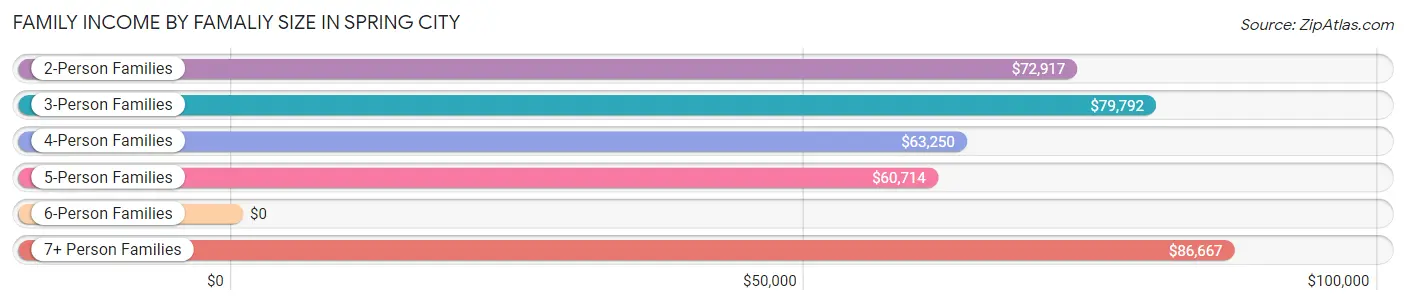
| Income Bracket | # Families | Median Income |
| 2-Person Families | 173 (54.1%) | $72,917 |
| 3-Person Families | 67 (20.9%) | $79,792 |
| 4-Person Families | 23 (7.2%) | $63,250 |
| 5-Person Families | 28 (8.7%) | $60,714 |
| 6-Person Families | 23 (7.2%) | $0 |
| 7+ Person Families | 6 (1.9%) | $86,667 |
| Total | 320 (100.0%) | $66,724 |
Family Income by Number of Earners in Spring City
The median family income in Spring City is $66,724, with families comprising 2 earners (114) having the highest median family income of $90,625, while families with no earners (72) have the lowest median family income of $63,571, accounting for 35.6% and 22.5% of families, respectively.
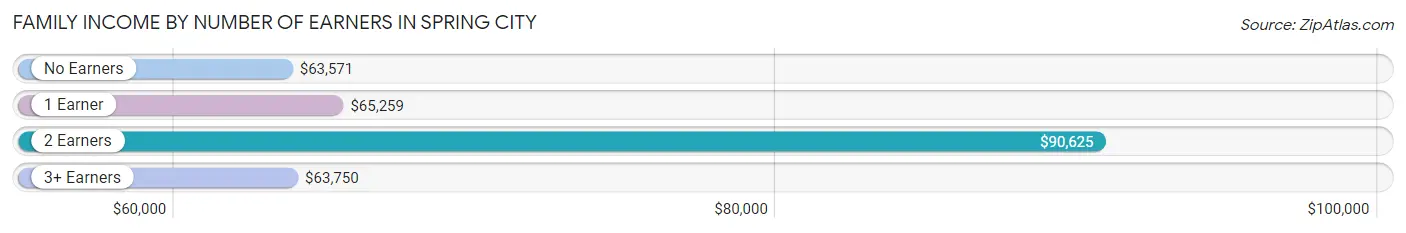
| Number of Earners | # Families | Median Income |
| No Earners | 72 (22.5%) | $63,571 |
| 1 Earner | 110 (34.4%) | $65,259 |
| 2 Earners | 114 (35.6%) | $90,625 |
| 3+ Earners | 24 (7.5%) | $63,750 |
| Total | 320 (100.0%) | $66,724 |
Household Income in Spring City
Household Income Brackets in Spring City
With 94 households falling in the category, the $50,000 to $74,999 income range is the most frequent in Spring City, accounting for 23.3% of all households. In contrast, only 9 households (2.2%) fall into the less than $10,000 income bracket, making it the least populous group.
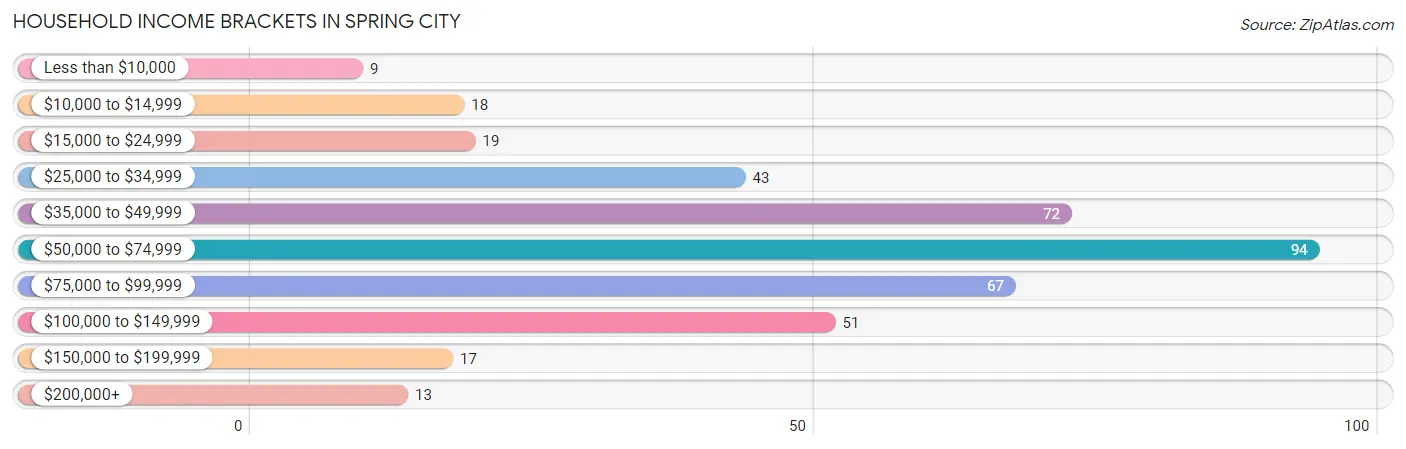
| Income Bracket | # Households | % Households |
| Less than $10,000 | 9 | 2.2% |
| $10,000 to $14,999 | 18 | 4.5% |
| $15,000 to $24,999 | 19 | 4.7% |
| $25,000 to $34,999 | 43 | 10.7% |
| $35,000 to $49,999 | 72 | 17.9% |
| $50,000 to $74,999 | 94 | 23.3% |
| $75,000 to $99,999 | 67 | 16.6% |
| $100,000 to $149,999 | 51 | 12.7% |
| $150,000 to $199,999 | 17 | 4.2% |
| $200,000+ | 13 | 3.2% |
Household Income by Householder Age in Spring City
The median household income in Spring City is $62,679, with the highest median household income of $68,333 found in the 25 to 44 years age bracket for the primary householder. A total of 68 households (16.9%) fall into this category.
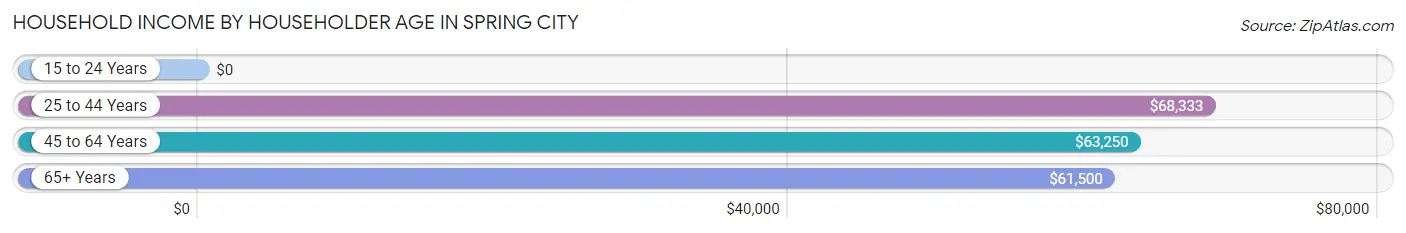
| Income Bracket | # Households | Median Income |
| 15 to 24 Years | 0 (0.0%) | $0 |
| 25 to 44 Years | 68 (16.9%) | $68,333 |
| 45 to 64 Years | 183 (45.4%) | $63,250 |
| 65+ Years | 152 (37.7%) | $61,500 |
| Total | 403 (100.0%) | $62,679 |
Poverty in Spring City
Income Below Poverty by Sex and Age in Spring City
With 4.2% poverty level for males and 5.0% for females among the residents of Spring City, 35 to 44 year old males and 75 year old and over females are the most vulnerable to poverty, with 9 males (20.4%) and 23 females (26.4%) in their respective age groups living below the poverty level.
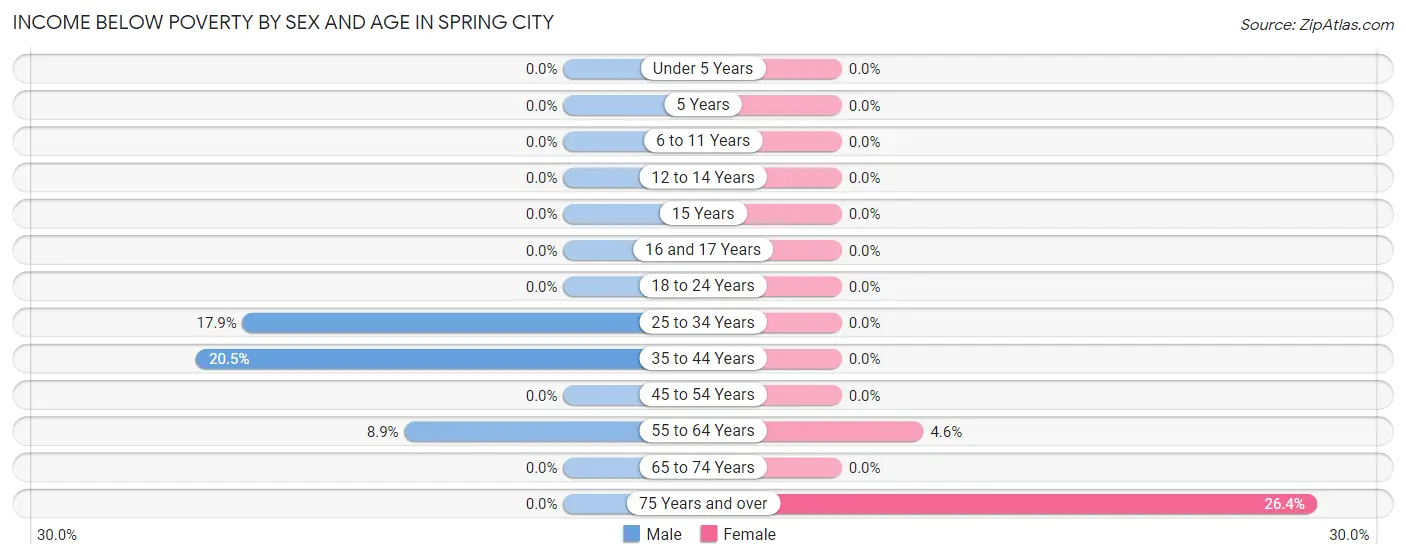
| Age Bracket | Male | Female |
| Under 5 Years | 0 (0.0%) | 0 (0.0%) |
| 5 Years | 0 (0.0%) | 0 (0.0%) |
| 6 to 11 Years | 0 (0.0%) | 0 (0.0%) |
| 12 to 14 Years | 0 (0.0%) | 0 (0.0%) |
| 15 Years | 0 (0.0%) | 0 (0.0%) |
| 16 and 17 Years | 0 (0.0%) | 0 (0.0%) |
| 18 to 24 Years | 0 (0.0%) | 0 (0.0%) |
| 25 to 34 Years | 5 (17.9%) | 0 (0.0%) |
| 35 to 44 Years | 9 (20.4%) | 0 (0.0%) |
| 45 to 54 Years | 0 (0.0%) | 0 (0.0%) |
| 55 to 64 Years | 10 (8.8%) | 4 (4.5%) |
| 65 to 74 Years | 0 (0.0%) | 0 (0.0%) |
| 75 Years and over | 0 (0.0%) | 23 (26.4%) |
| Total | 24 (4.2%) | 27 (5.0%) |
Income Above Poverty by Sex and Age in Spring City
According to the poverty statistics in Spring City, males aged under 5 years and females aged under 5 years are the age groups that are most secure financially, with 100.0% of males and 100.0% of females in these age groups living above the poverty line.
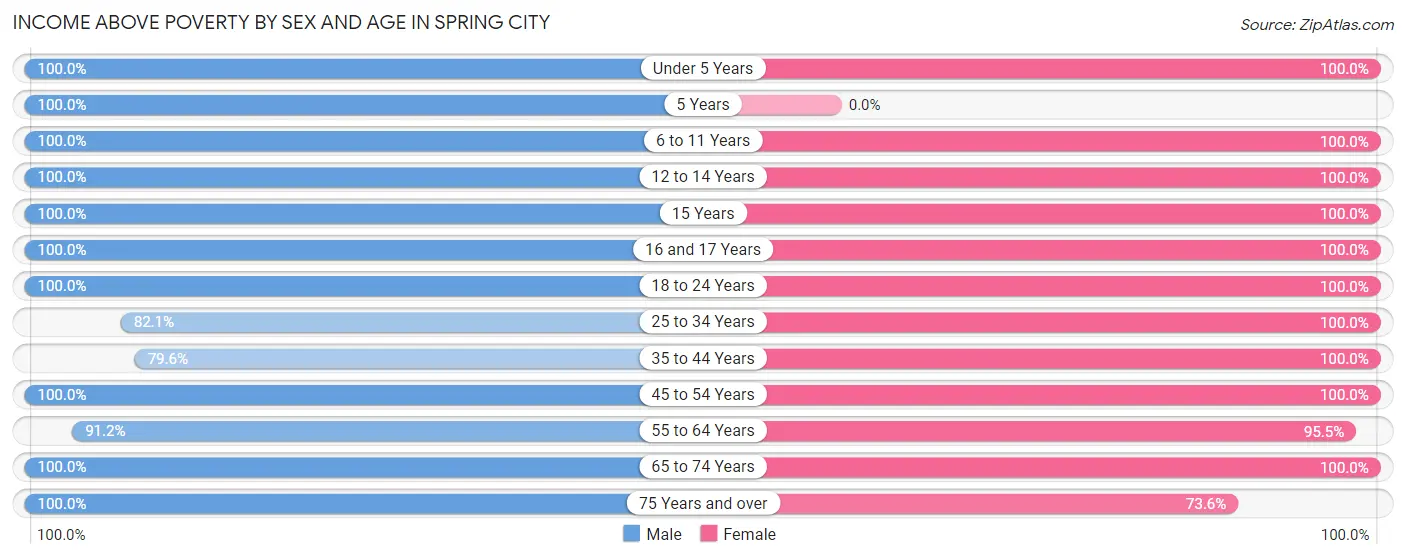
| Age Bracket | Male | Female |
| Under 5 Years | 5 (100.0%) | 41 (100.0%) |
| 5 Years | 30 (100.0%) | 0 (0.0%) |
| 6 to 11 Years | 64 (100.0%) | 17 (100.0%) |
| 12 to 14 Years | 24 (100.0%) | 19 (100.0%) |
| 15 Years | 9 (100.0%) | 8 (100.0%) |
| 16 and 17 Years | 16 (100.0%) | 19 (100.0%) |
| 18 to 24 Years | 55 (100.0%) | 17 (100.0%) |
| 25 to 34 Years | 23 (82.1%) | 43 (100.0%) |
| 35 to 44 Years | 35 (79.5%) | 63 (100.0%) |
| 45 to 54 Years | 42 (100.0%) | 78 (100.0%) |
| 55 to 64 Years | 103 (91.1%) | 84 (95.5%) |
| 65 to 74 Years | 68 (100.0%) | 61 (100.0%) |
| 75 Years and over | 69 (100.0%) | 64 (73.6%) |
| Total | 543 (95.8%) | 514 (95.0%) |
Income Below Poverty Among Married-Couple Families in Spring City
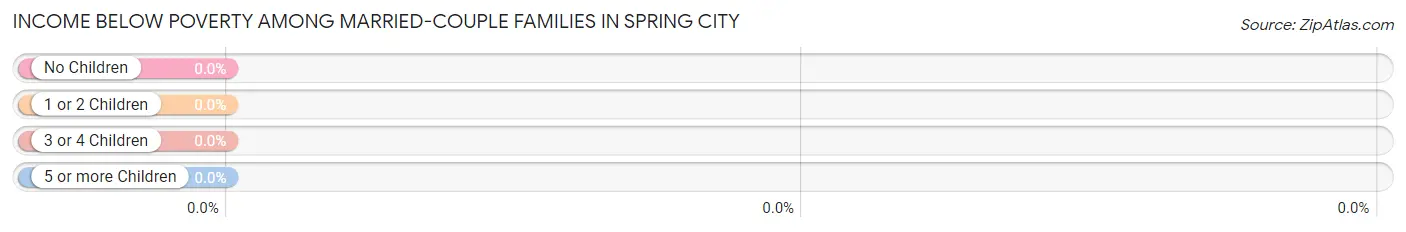
| Children | Above Poverty | Below Poverty |
| No Children | 180 (100.0%) | 0 (0.0%) |
| 1 or 2 Children | 49 (100.0%) | 0 (0.0%) |
| 3 or 4 Children | 39 (100.0%) | 0 (0.0%) |
| 5 or more Children | 1 (100.0%) | 0 (0.0%) |
| Total | 269 (100.0%) | 0 (0.0%) |
Income Below Poverty Among Single-Parent Households in Spring City
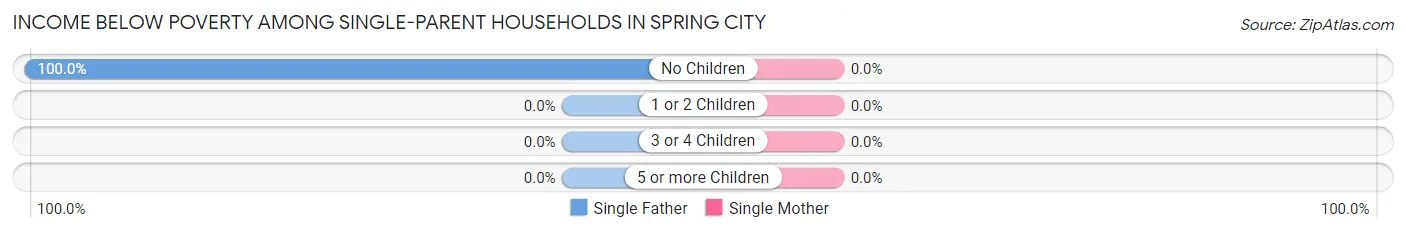
| Children | Single Father | Single Mother |
| No Children | 3 (100.0%) | 0 (0.0%) |
| 1 or 2 Children | 0 (0.0%) | 0 (0.0%) |
| 3 or 4 Children | 0 (0.0%) | 0 (0.0%) |
| 5 or more Children | 0 (0.0%) | 0 (0.0%) |
| Total | 3 (30.0%) | 0 (0.0%) |
Income Below Poverty Among Married-Couple vs Single-Parent Households in Spring City
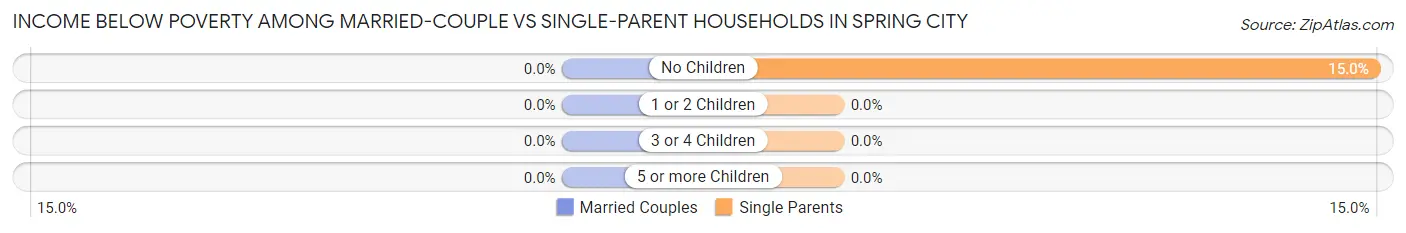
| Children | Married-Couple Families | Single-Parent Households |
| No Children | 0 (0.0%) | 3 (15.0%) |
| 1 or 2 Children | 0 (0.0%) | 0 (0.0%) |
| 3 or 4 Children | 0 (0.0%) | 0 (0.0%) |
| 5 or more Children | 0 (0.0%) | 0 (0.0%) |
| Total | 0 (0.0%) | 3 (5.9%) |
Race in Spring City
The most populous races in Spring City are White / Caucasian (1,030 | 93.0%), Hispanic or Latino (54 | 4.9%), and Some other Race (48 | 4.3%).
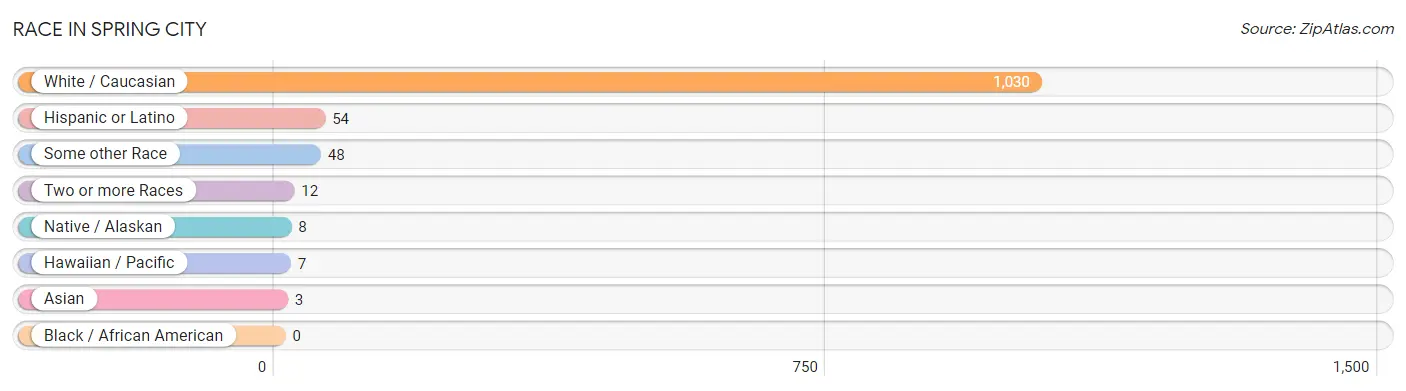
| Race | # Population | % Population |
| Asian | 3 | 0.3% |
| Black / African American | 0 | 0.0% |
| Hawaiian / Pacific | 7 | 0.6% |
| Hispanic or Latino | 54 | 4.9% |
| Native / Alaskan | 8 | 0.7% |
| White / Caucasian | 1,030 | 93.0% |
| Two or more Races | 12 | 1.1% |
| Some other Race | 48 | 4.3% |
| Total | 1,108 | 100.0% |
Ancestry in Spring City
The most populous ancestries reported in Spring City are English (416 | 37.6%), European (198 | 17.9%), Danish (161 | 14.5%), German (66 | 6.0%), and Scottish (64 | 5.8%), together accounting for 81.7% of all Spring City residents.
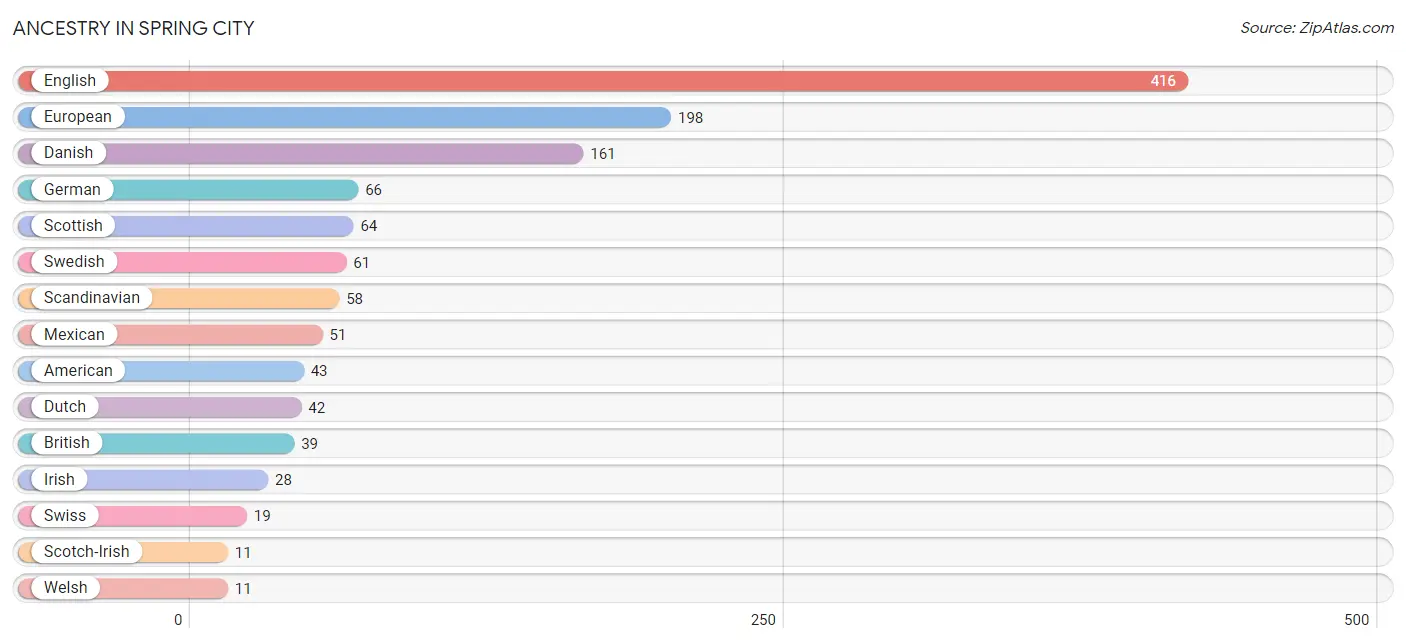
| Ancestry | # Population | % Population |
| African | 3 | 0.3% |
| American | 43 | 3.9% |
| British | 39 | 3.5% |
| Central American Indian | 3 | 0.3% |
| Czech | 6 | 0.5% |
| Danish | 161 | 14.5% |
| Dutch | 42 | 3.8% |
| English | 416 | 37.6% |
| European | 198 | 17.9% |
| German | 66 | 6.0% |
| Greek | 3 | 0.3% |
| Indian (Asian) | 6 | 0.5% |
| Irish | 28 | 2.5% |
| Mexican | 51 | 4.6% |
| Navajo | 8 | 0.7% |
| Northern European | 2 | 0.2% |
| Norwegian | 7 | 0.6% |
| Paiute | 7 | 0.6% |
| Polish | 3 | 0.3% |
| Puerto Rican | 3 | 0.3% |
| Russian | 4 | 0.4% |
| Samoan | 7 | 0.6% |
| Scandinavian | 58 | 5.2% |
| Scotch-Irish | 11 | 1.0% |
| Scottish | 64 | 5.8% |
| Subsaharan African | 3 | 0.3% |
| Swedish | 61 | 5.5% |
| Swiss | 19 | 1.7% |
| Thai | 3 | 0.3% |
| Welsh | 11 | 1.0% | View All 30 Rows |
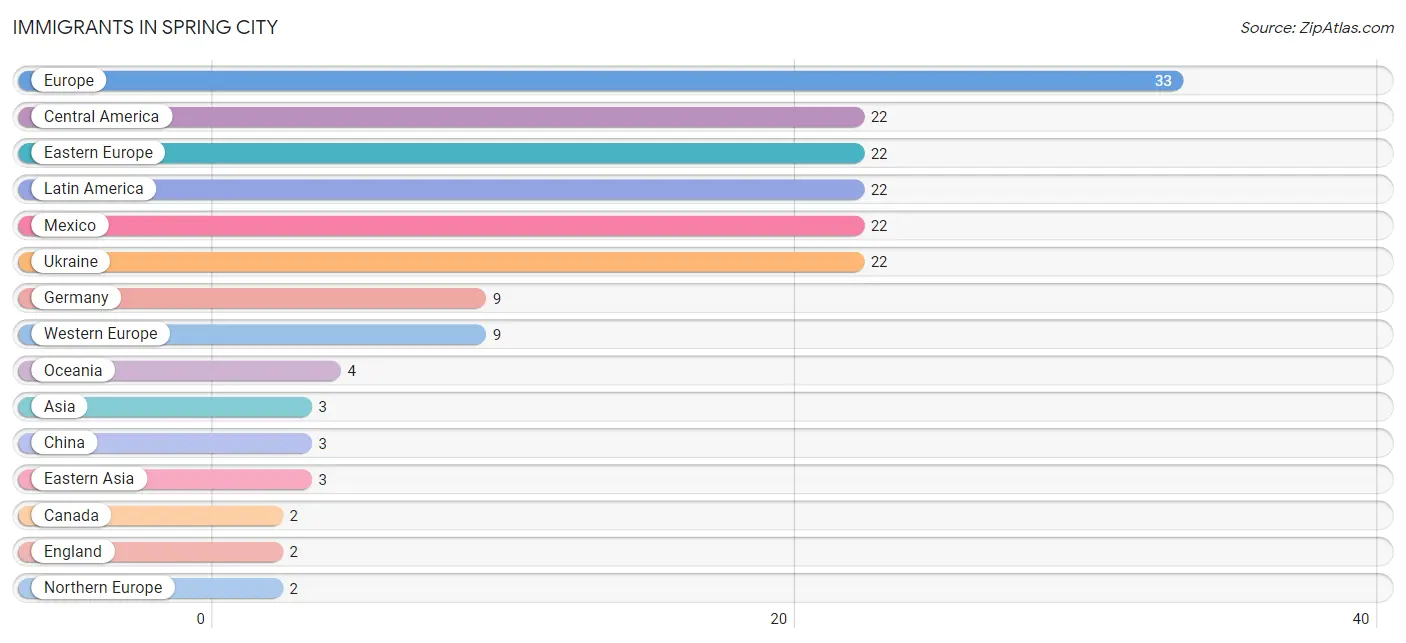
Immigrants in Spring City
The most numerous immigrant groups reported in Spring City came from Europe (33 | 3.0%), Central America (22 | 2.0%), Eastern Europe (22 | 2.0%), Latin America (22 | 2.0%), and Mexico (22 | 2.0%), together accounting for 10.9% of all Spring City residents.
| Immigration Origin | # Population | % Population |
| Asia | 3 | 0.3% |
| Canada | 2 | 0.2% |
| Central America | 22 | 2.0% |
| China | 3 | 0.3% |
| Eastern Asia | 3 | 0.3% |
| Eastern Europe | 22 | 2.0% |
| England | 2 | 0.2% |
| Europe | 33 | 3.0% |
| Germany | 9 | 0.8% |
| Latin America | 22 | 2.0% |
| Mexico | 22 | 2.0% |
| Northern Europe | 2 | 0.2% |
| Oceania | 4 | 0.4% |
| Ukraine | 22 | 2.0% |
| Western Europe | 9 | 0.8% | View All 15 Rows |
Sex and Age in Spring City
Sex and Age in Spring City
The most populous age groups in Spring City are 5 to 9 Years (84 | 14.8%) for men and 60 to 64 Years (60 | 11.1%) for women.
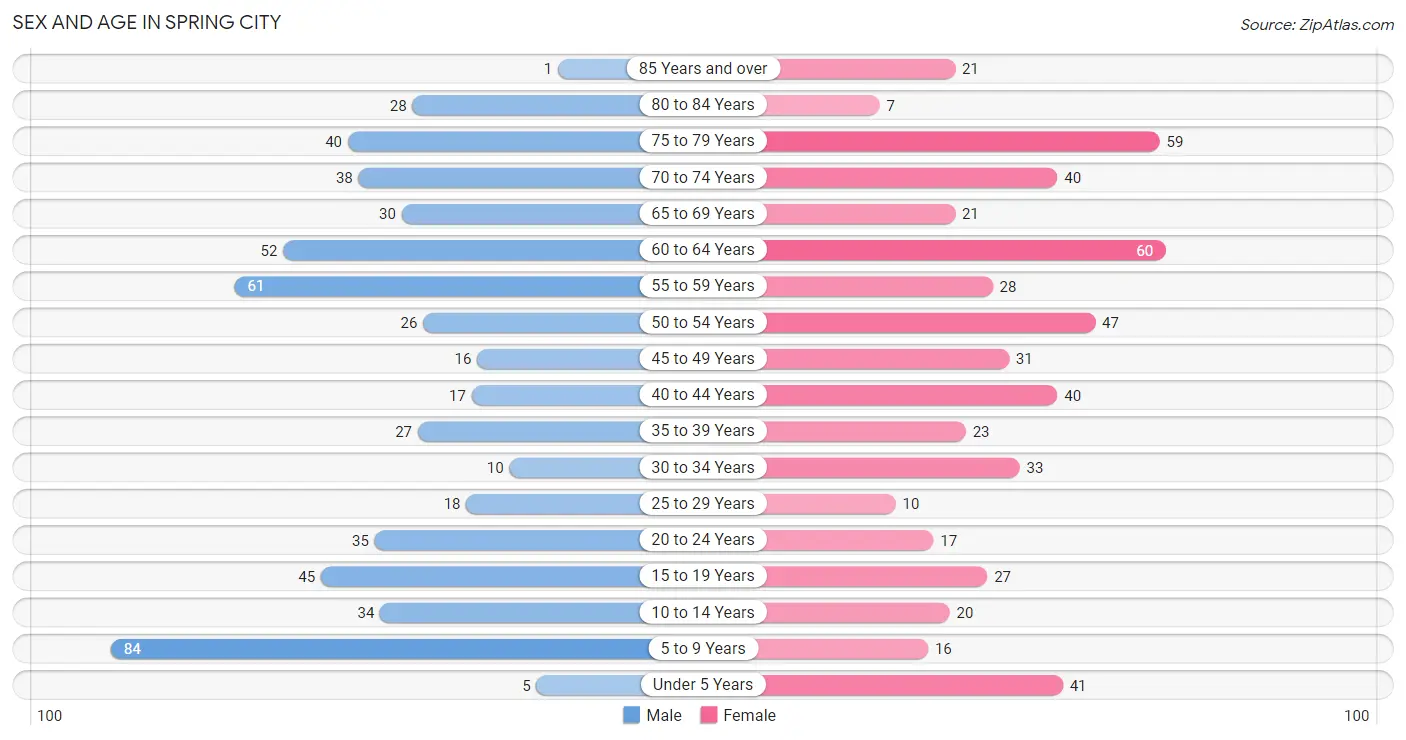
| Age Bracket | Male | Female |
| Under 5 Years | 5 (0.9%) | 41 (7.6%) |
| 5 to 9 Years | 84 (14.8%) | 16 (3.0%) |
| 10 to 14 Years | 34 (6.0%) | 20 (3.7%) |
| 15 to 19 Years | 45 (7.9%) | 27 (5.0%) |
| 20 to 24 Years | 35 (6.2%) | 17 (3.1%) |
| 25 to 29 Years | 18 (3.2%) | 10 (1.8%) |
| 30 to 34 Years | 10 (1.8%) | 33 (6.1%) |
| 35 to 39 Years | 27 (4.8%) | 23 (4.3%) |
| 40 to 44 Years | 17 (3.0%) | 40 (7.4%) |
| 45 to 49 Years | 16 (2.8%) | 31 (5.7%) |
| 50 to 54 Years | 26 (4.6%) | 47 (8.7%) |
| 55 to 59 Years | 61 (10.8%) | 28 (5.2%) |
| 60 to 64 Years | 52 (9.2%) | 60 (11.1%) |
| 65 to 69 Years | 30 (5.3%) | 21 (3.9%) |
| 70 to 74 Years | 38 (6.7%) | 40 (7.4%) |
| 75 to 79 Years | 40 (7.0%) | 59 (10.9%) |
| 80 to 84 Years | 28 (4.9%) | 7 (1.3%) |
| 85 Years and over | 1 (0.2%) | 21 (3.9%) |
| Total | 567 (100.0%) | 541 (100.0%) |
Families and Households in Spring City
Median Family Size in Spring City
The median family size in Spring City is 3.12 persons per family, with single female/mother families (41 | 12.8%) accounting for the largest median family size of 3.49 persons per family. On the other hand, single male/father families (10 | 3.1%) represent the smallest median family size with 2.00 persons per family.
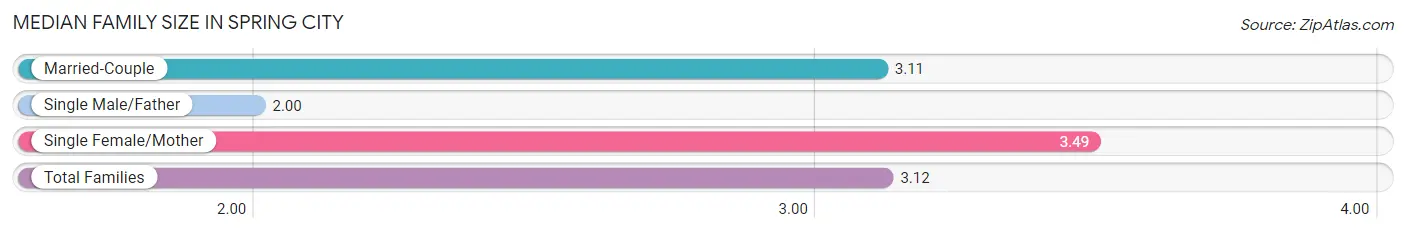
| Family Type | # Families | Family Size |
| Married-Couple | 269 (84.1%) | 3.11 |
| Single Male/Father | 10 (3.1%) | 2.00 |
| Single Female/Mother | 41 (12.8%) | 3.49 |
| Total Families | 320 (100.0%) | 3.12 |
Median Household Size in Spring City
The median household size in Spring City is 2.75 persons per household, with single female/mother households (41 | 10.2%) accounting for the largest median household size of 3.51 persons per household. non-family households (83 | 20.6%) represent the smallest median household size with 1.16 persons per household.
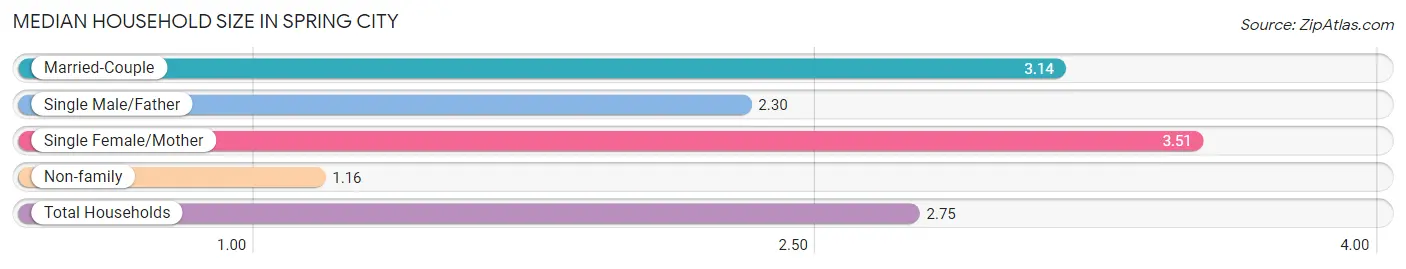
| Household Type | # Households | Household Size |
| Married-Couple | 269 (66.7%) | 3.14 |
| Single Male/Father | 10 (2.5%) | 2.30 |
| Single Female/Mother | 41 (10.2%) | 3.51 |
| Non-family | 83 (20.6%) | 1.16 |
| Total Households | 403 (100.0%) | 2.75 |
Household Size by Marriage Status in Spring City
Out of a total of 403 households in Spring City, 320 (79.4%) are family households, while 83 (20.6%) are nonfamily households. The most numerous type of family households are 2-person households, comprising 163, and the most common type of nonfamily households are 1-person households, comprising 80.
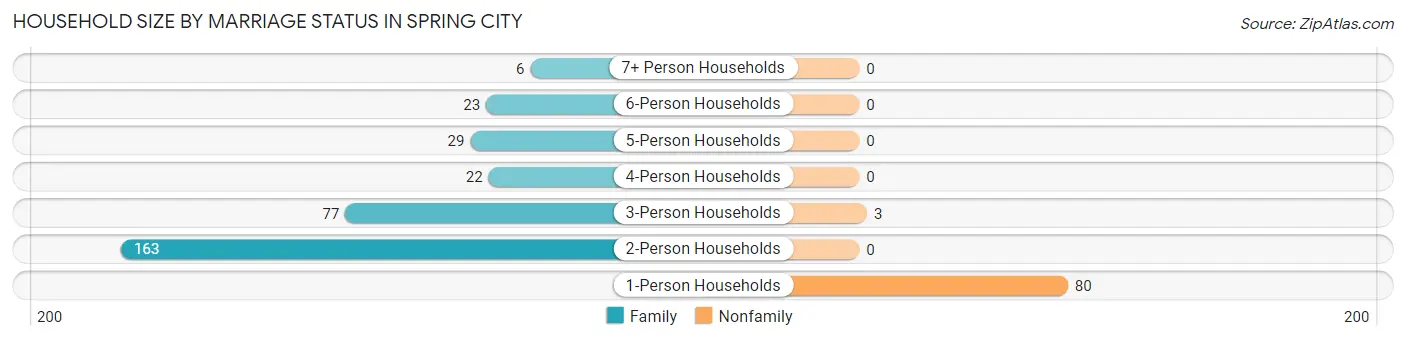
| Household Size | Family Households | Nonfamily Households |
| 1-Person Households | - | 80 (19.9%) |
| 2-Person Households | 163 (40.5%) | 0 (0.0%) |
| 3-Person Households | 77 (19.1%) | 3 (0.7%) |
| 4-Person Households | 22 (5.5%) | 0 (0.0%) |
| 5-Person Households | 29 (7.2%) | 0 (0.0%) |
| 6-Person Households | 23 (5.7%) | 0 (0.0%) |
| 7+ Person Households | 6 (1.5%) | 0 (0.0%) |
| Total | 320 (79.4%) | 83 (20.6%) |
Female Fertility in Spring City
Fertility by Age in Spring City
Average fertility rate in Spring City is 15.0 births per 1,000 women. Women in the age bracket of 35 to 50 years have the highest fertility rate with 26.0 births per 1,000 women. Women in the age bracket of 35 to 50 years acount for 100.0% of all women with births.
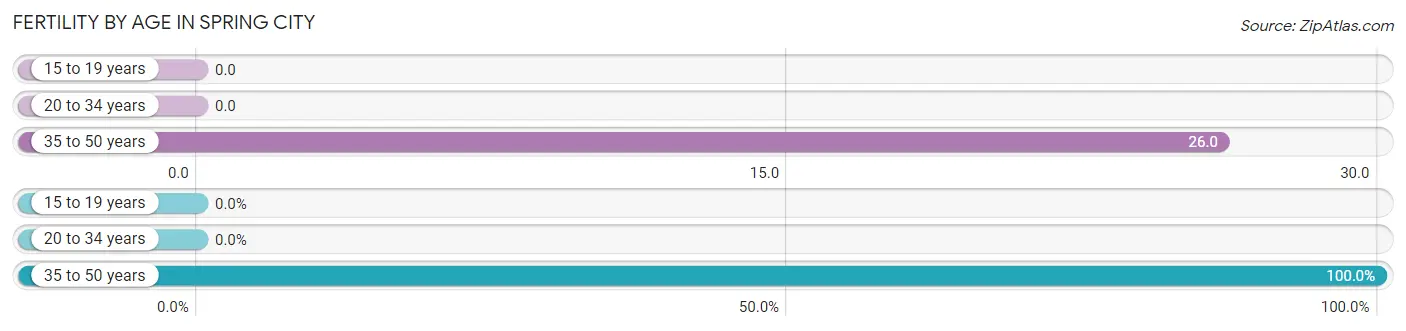
| Age Bracket | Women with Births | Births / 1,000 Women |
| 15 to 19 years | 0 (0.0%) | 0.0 |
| 20 to 34 years | 0 (0.0%) | 0.0 |
| 35 to 50 years | 3 (100.0%) | 26.0 |
| Total | 3 (100.0%) | 15.0 |
Fertility by Age by Marriage Status in Spring City
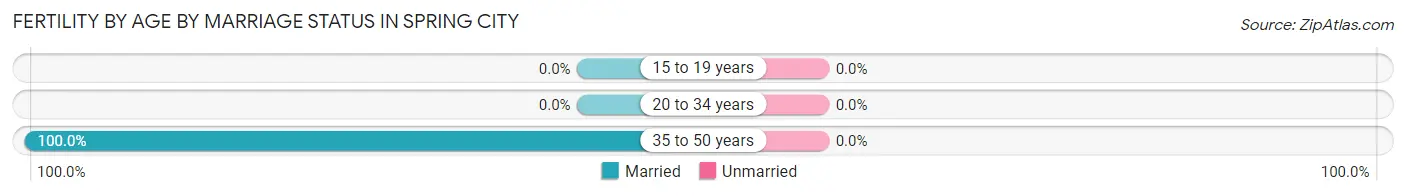
| Age Bracket | Married | Unmarried |
| 15 to 19 years | 0 (0.0%) | 0 (0.0%) |
| 20 to 34 years | 0 (0.0%) | 0 (0.0%) |
| 35 to 50 years | 3 (100.0%) | 0 (0.0%) |
| Total | 3 (100.0%) | 0 (0.0%) |
Fertility by Education in Spring City
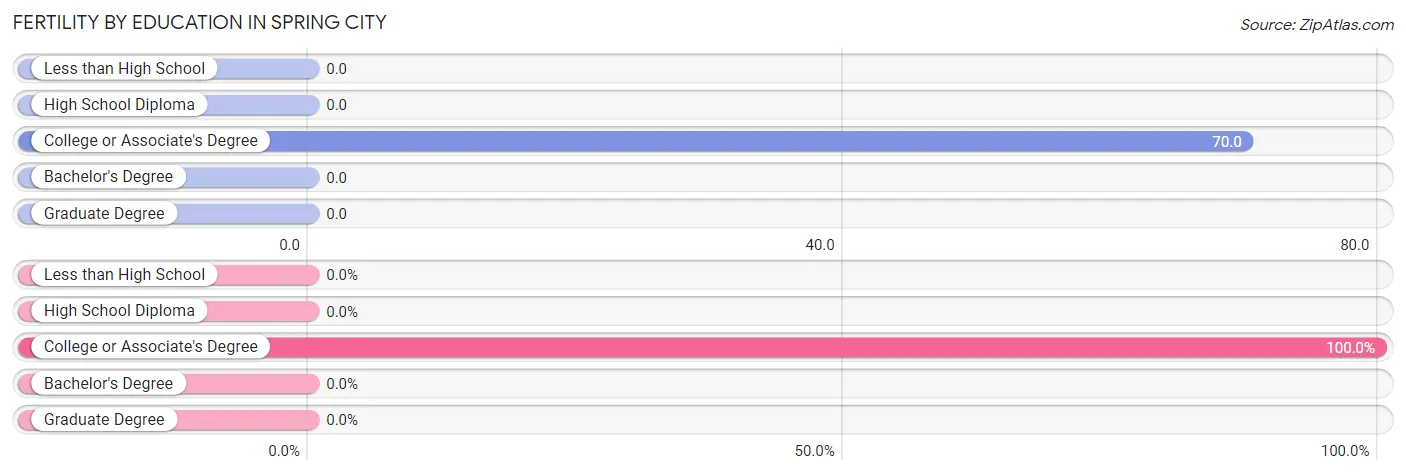
| Educational Attainment | Women with Births | Births / 1,000 Women |
| Less than High School | 0 (0.0%) | 0.0 |
| High School Diploma | 0 (0.0%) | 0.0 |
| College or Associate's Degree | 3 (100.0%) | 70.0 |
| Bachelor's Degree | 0 (0.0%) | 0.0 |
| Graduate Degree | 0 (0.0%) | 0.0 |
| Total | 3 (100.0%) | 15.0 |
Fertility by Education by Marriage Status in Spring City
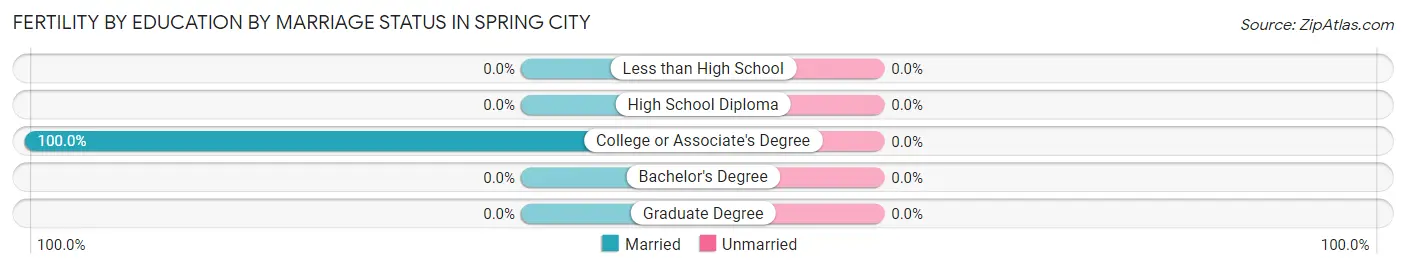
| Educational Attainment | Married | Unmarried |
| Less than High School | 0 (0.0%) | 0 (0.0%) |
| High School Diploma | 0 (0.0%) | 0 (0.0%) |
| College or Associate's Degree | 3 (100.0%) | 0 (0.0%) |
| Bachelor's Degree | 0 (0.0%) | 0 (0.0%) |
| Graduate Degree | 0 (0.0%) | 0 (0.0%) |
| Total | 3 (100.0%) | 0 (0.0%) |
Employment Characteristics in Spring City
Employment by Class of Employer in Spring City
Among the 407 employed individuals in Spring City, private company employees (218 | 53.6%), local government employees (83 | 20.4%), and state government employees (49 | 12.0%) make up the most common classes of employment.
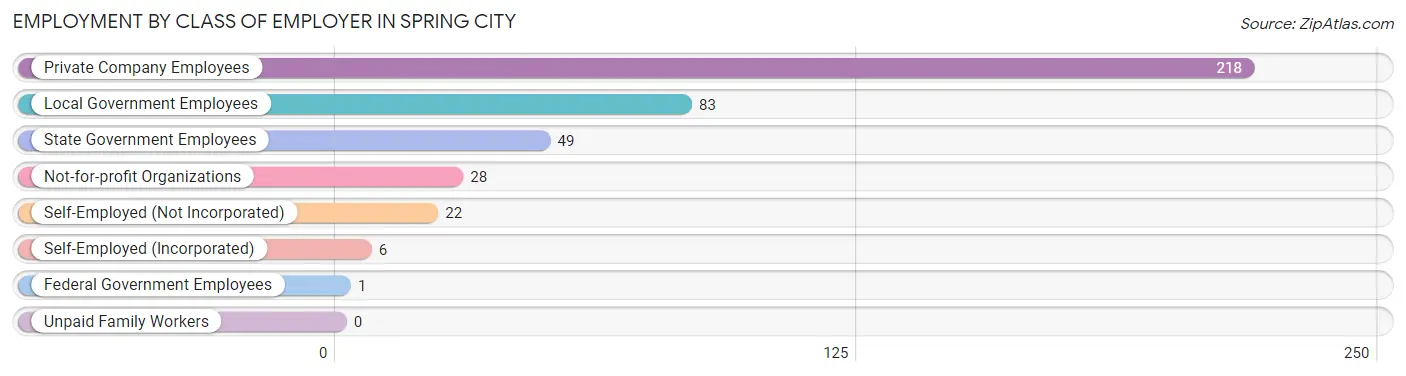
| Employer Class | # Employees | % Employees |
| Private Company Employees | 218 | 53.6% |
| Self-Employed (Incorporated) | 6 | 1.5% |
| Self-Employed (Not Incorporated) | 22 | 5.4% |
| Not-for-profit Organizations | 28 | 6.9% |
| Local Government Employees | 83 | 20.4% |
| State Government Employees | 49 | 12.0% |
| Federal Government Employees | 1 | 0.3% |
| Unpaid Family Workers | 0 | 0.0% |
| Total | 407 | 100.0% |
Employment Status by Age in Spring City
According to the labor force statistics for Spring City, out of the total population over 16 years of age (891), 52.4% or 467 individuals are in the labor force, with 12.0% or 56 of them unemployed. The age group with the highest labor force participation rate is 45 to 54 years, with 87.5% or 105 individuals in the labor force. Within the labor force, the 20 to 24 years age range has the highest percentage of unemployed individuals, with 69.4% or 25 of them being unemployed.
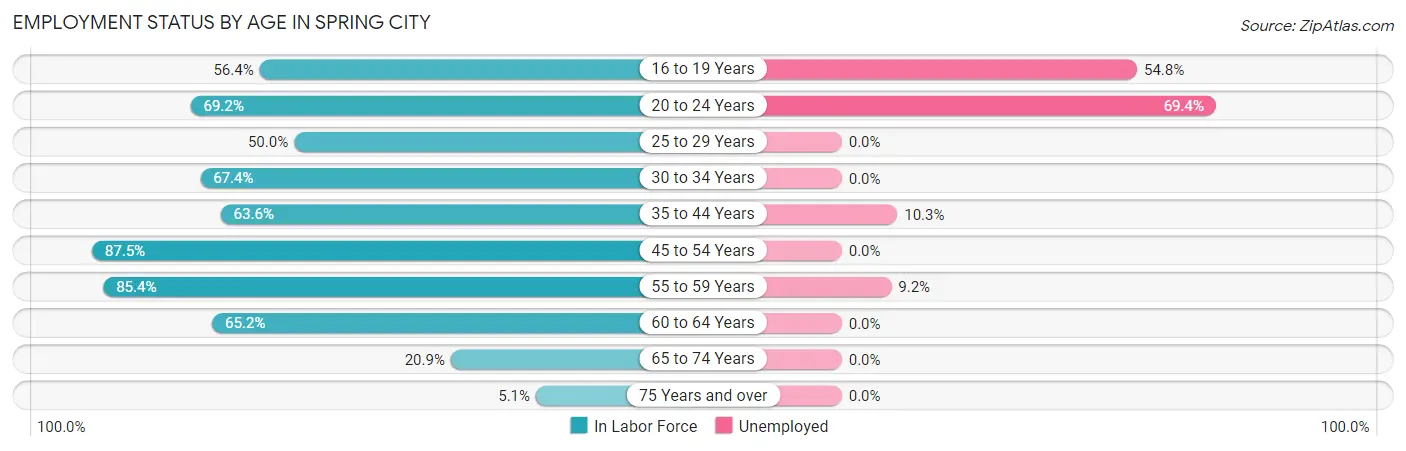
| Age Bracket | In Labor Force | Unemployed |
| 16 to 19 Years | 31 (56.4%) | 17 (54.8%) |
| 20 to 24 Years | 36 (69.2%) | 25 (69.4%) |
| 25 to 29 Years | 14 (50.0%) | 0 (0.0%) |
| 30 to 34 Years | 29 (67.4%) | 0 (0.0%) |
| 35 to 44 Years | 68 (63.6%) | 7 (10.3%) |
| 45 to 54 Years | 105 (87.5%) | 0 (0.0%) |
| 55 to 59 Years | 76 (85.4%) | 7 (9.2%) |
| 60 to 64 Years | 73 (65.2%) | 0 (0.0%) |
| 65 to 74 Years | 27 (20.9%) | 0 (0.0%) |
| 75 Years and over | 8 (5.1%) | 0 (0.0%) |
| Total | 467 (52.4%) | 56 (12.0%) |
Employment Status by Educational Attainment in Spring City
According to labor force statistics for Spring City, 73.1% of individuals (365) out of the total population between 25 and 64 years of age (499) are in the labor force, with 3.8% or 14 of them being unemployed. The group with the highest labor force participation rate are those with the educational attainment of college / associate degree, with 79.4% or 104 individuals in the labor force. Within the labor force, individuals with high school diploma education have the highest percentage of unemployment, with 5.9% or 6 of them being unemployed.
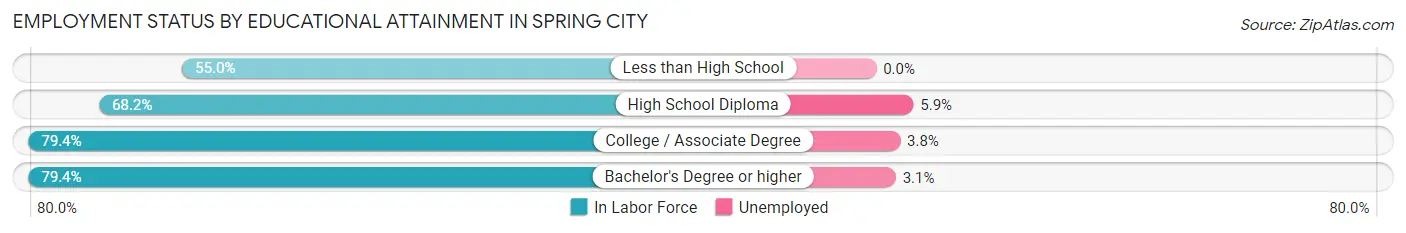
| Educational Attainment | In Labor Force | Unemployed |
| Less than High School | 33 (55.0%) | 0 (0.0%) |
| High School Diploma | 101 (68.2%) | 9 (5.9%) |
| College / Associate Degree | 104 (79.4%) | 5 (3.8%) |
| Bachelor's Degree or higher | 127 (79.4%) | 5 (3.1%) |
| Total | 365 (73.1%) | 19 (3.8%) |
Employment Occupations by Sex in Spring City
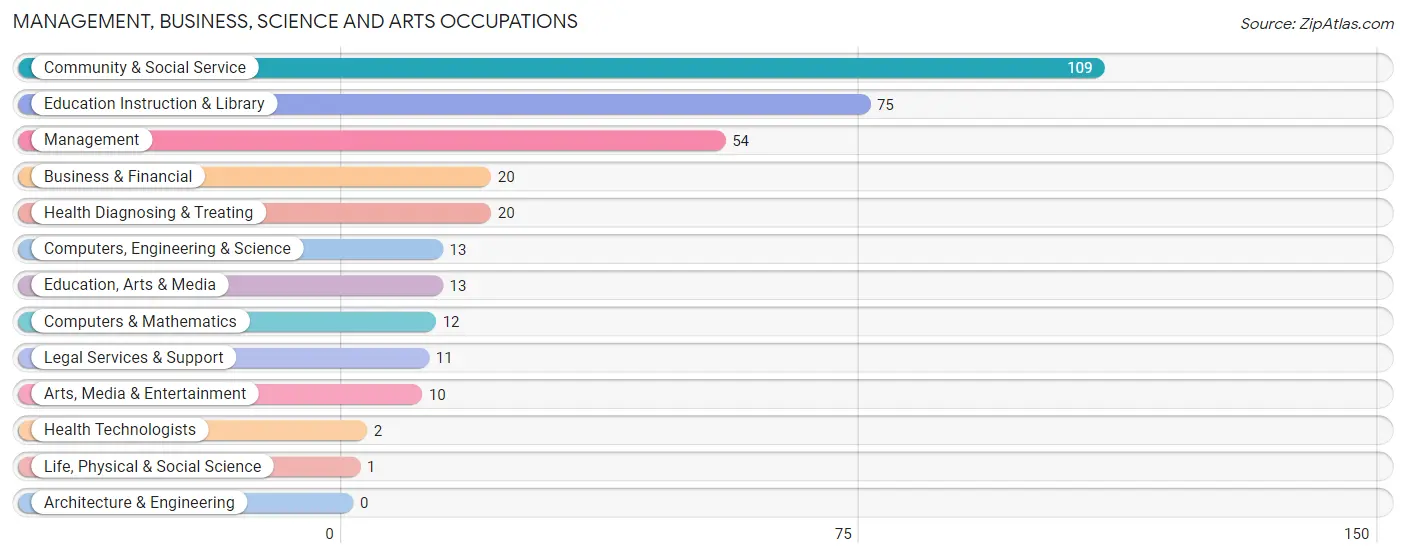
Management, Business, Science and Arts Occupations
The most common Management, Business, Science and Arts occupations in Spring City are Community & Social Service (109 | 26.5%), Education Instruction & Library (75 | 18.2%), Management (54 | 13.1%), Business & Financial (20 | 4.9%), and Health Diagnosing & Treating (20 | 4.9%).
Management, Business, Science and Arts Occupations by Sex
Within the Management, Business, Science and Arts occupations in Spring City, the most male-oriented occupations are Computers, Engineering & Science (100.0%), Computers & Mathematics (100.0%), and Life, Physical & Social Science (100.0%), while the most female-oriented occupations are Health Diagnosing & Treating (100.0%), Health Technologists (100.0%), and Education, Arts & Media (84.6%).
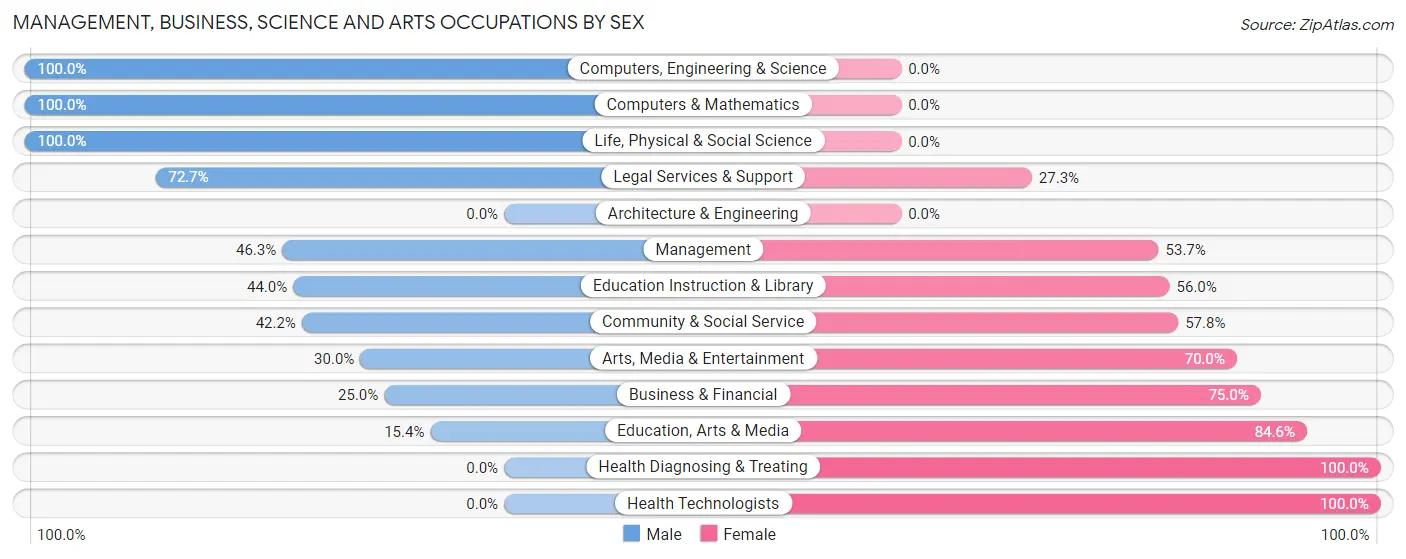
| Occupation | Male | Female |
| Management | 25 (46.3%) | 29 (53.7%) |
| Business & Financial | 5 (25.0%) | 15 (75.0%) |
| Computers, Engineering & Science | 13 (100.0%) | 0 (0.0%) |
| Computers & Mathematics | 12 (100.0%) | 0 (0.0%) |
| Architecture & Engineering | 0 (0.0%) | 0 (0.0%) |
| Life, Physical & Social Science | 1 (100.0%) | 0 (0.0%) |
| Community & Social Service | 46 (42.2%) | 63 (57.8%) |
| Education, Arts & Media | 2 (15.4%) | 11 (84.6%) |
| Legal Services & Support | 8 (72.7%) | 3 (27.3%) |
| Education Instruction & Library | 33 (44.0%) | 42 (56.0%) |
| Arts, Media & Entertainment | 3 (30.0%) | 7 (70.0%) |
| Health Diagnosing & Treating | 0 (0.0%) | 20 (100.0%) |
| Health Technologists | 0 (0.0%) | 2 (100.0%) |
| Total (Category) | 89 (41.2%) | 127 (58.8%) |
| Total (Overall) | 212 (51.6%) | 199 (48.4%) |
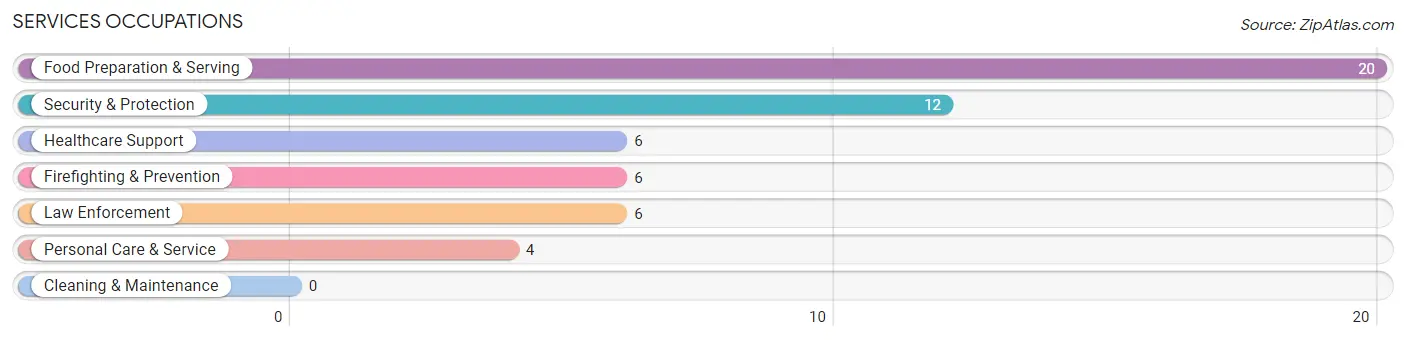
Services Occupations
The most common Services occupations in Spring City are Food Preparation & Serving (20 | 4.9%), Security & Protection (12 | 2.9%), Healthcare Support (6 | 1.5%), Firefighting & Prevention (6 | 1.5%), and Law Enforcement (6 | 1.5%).
Services Occupations by Sex
Within the Services occupations in Spring City, the most male-oriented occupations are Security & Protection (100.0%), Firefighting & Prevention (100.0%), and Law Enforcement (100.0%), while the most female-oriented occupations are Personal Care & Service (100.0%), Food Preparation & Serving (90.0%), and Healthcare Support (50.0%).
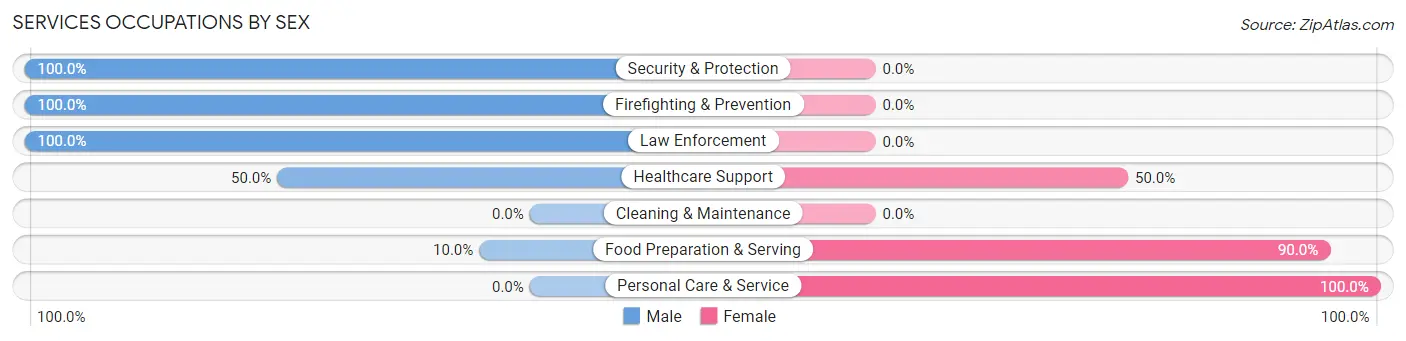
| Occupation | Male | Female |
| Healthcare Support | 3 (50.0%) | 3 (50.0%) |
| Security & Protection | 12 (100.0%) | 0 (0.0%) |
| Firefighting & Prevention | 6 (100.0%) | 0 (0.0%) |
| Law Enforcement | 6 (100.0%) | 0 (0.0%) |
| Food Preparation & Serving | 2 (10.0%) | 18 (90.0%) |
| Cleaning & Maintenance | 0 (0.0%) | 0 (0.0%) |
| Personal Care & Service | 0 (0.0%) | 4 (100.0%) |
| Total (Category) | 17 (40.5%) | 25 (59.5%) |
| Total (Overall) | 212 (51.6%) | 199 (48.4%) |
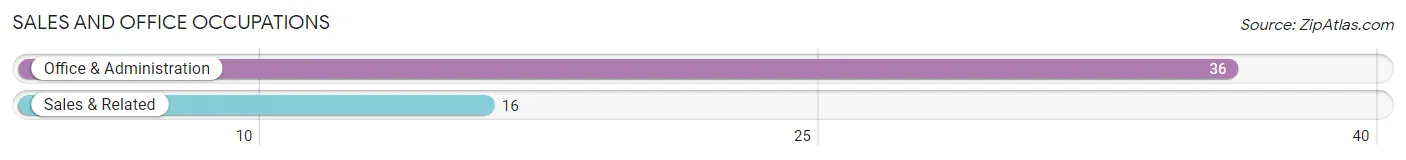
Sales and Office Occupations
The most common Sales and Office occupations in Spring City are Office & Administration (36 | 8.8%), and Sales & Related (16 | 3.9%).
Sales and Office Occupations by Sex
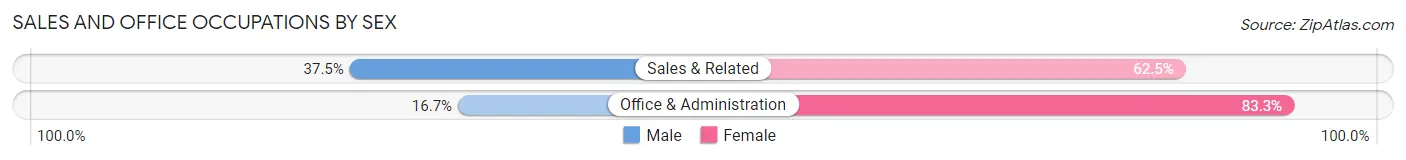
| Occupation | Male | Female |
| Sales & Related | 6 (37.5%) | 10 (62.5%) |
| Office & Administration | 6 (16.7%) | 30 (83.3%) |
| Total (Category) | 12 (23.1%) | 40 (76.9%) |
| Total (Overall) | 212 (51.6%) | 199 (48.4%) |
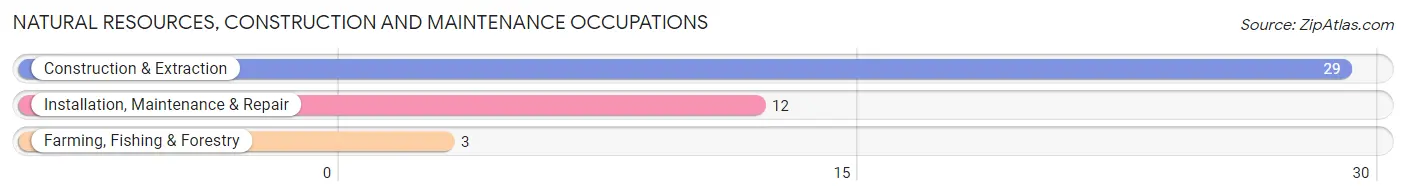
Natural Resources, Construction and Maintenance Occupations
The most common Natural Resources, Construction and Maintenance occupations in Spring City are Construction & Extraction (29 | 7.1%), Installation, Maintenance & Repair (12 | 2.9%), and Farming, Fishing & Forestry (3 | 0.7%).
Natural Resources, Construction and Maintenance Occupations by Sex
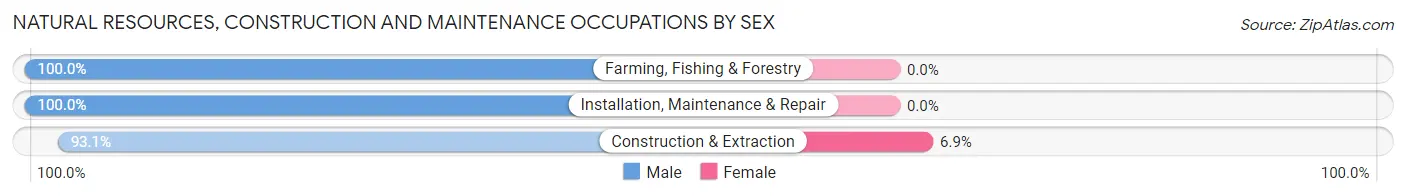
| Occupation | Male | Female |
| Farming, Fishing & Forestry | 3 (100.0%) | 0 (0.0%) |
| Construction & Extraction | 27 (93.1%) | 2 (6.9%) |
| Installation, Maintenance & Repair | 12 (100.0%) | 0 (0.0%) |
| Total (Category) | 42 (95.5%) | 2 (4.5%) |
| Total (Overall) | 212 (51.6%) | 199 (48.4%) |
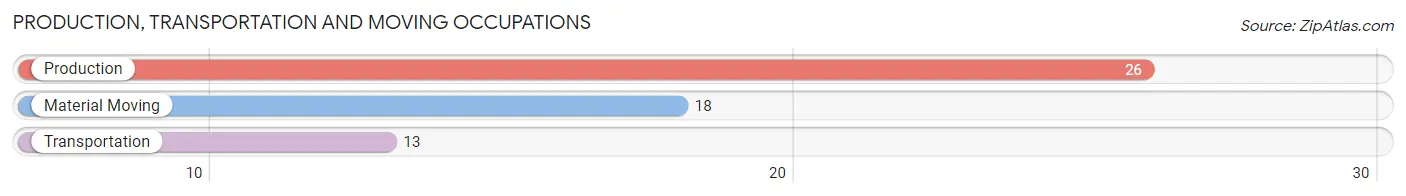
Production, Transportation and Moving Occupations
The most common Production, Transportation and Moving occupations in Spring City are Production (26 | 6.3%), Material Moving (18 | 4.4%), and Transportation (13 | 3.2%).
Production, Transportation and Moving Occupations by Sex
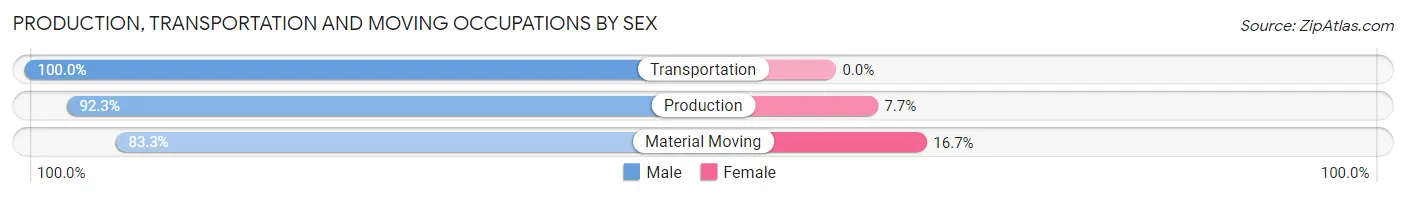
| Occupation | Male | Female |
| Production | 24 (92.3%) | 2 (7.7%) |
| Transportation | 13 (100.0%) | 0 (0.0%) |
| Material Moving | 15 (83.3%) | 3 (16.7%) |
| Total (Category) | 52 (91.2%) | 5 (8.8%) |
| Total (Overall) | 212 (51.6%) | 199 (48.4%) |
Employment Industries by Sex in Spring City
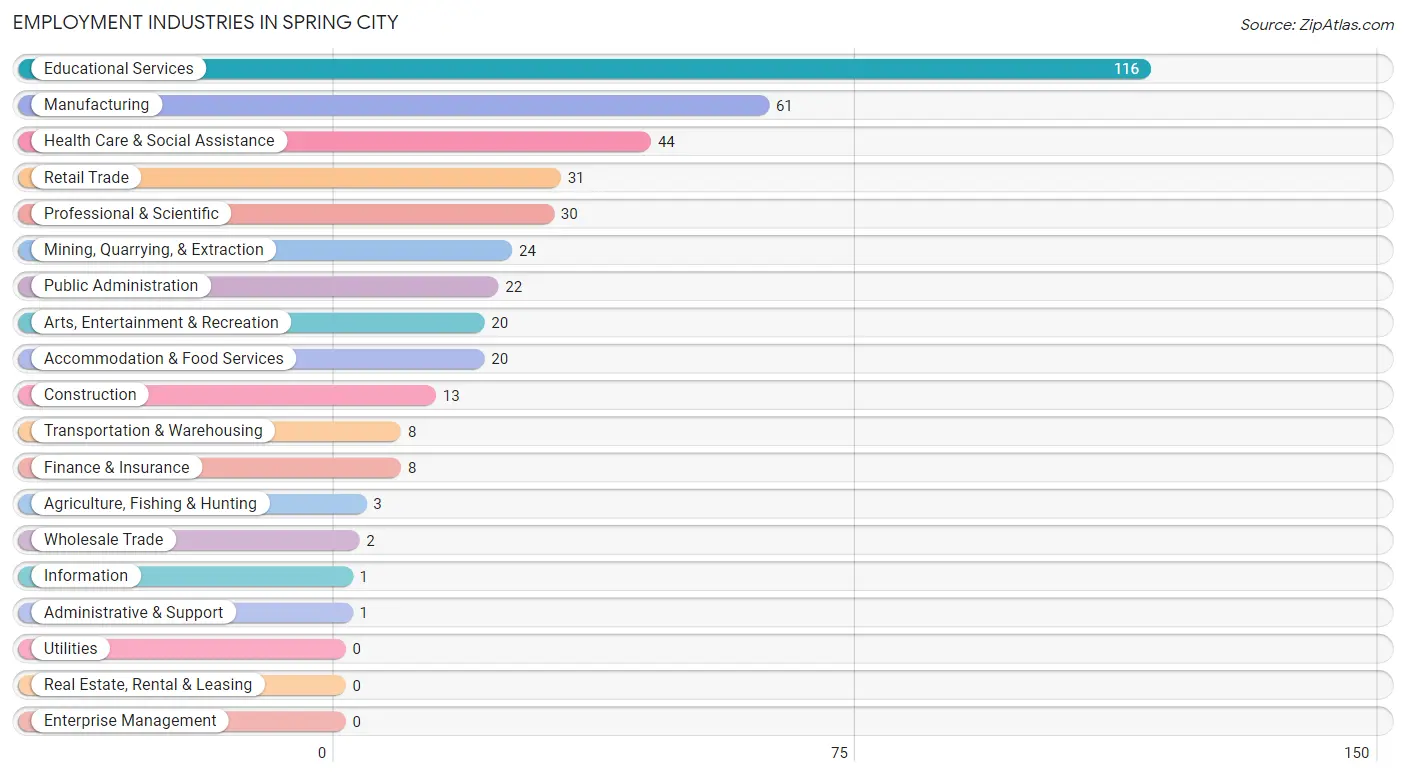
Employment Industries in Spring City
The major employment industries in Spring City include Educational Services (116 | 28.2%), Manufacturing (61 | 14.8%), Health Care & Social Assistance (44 | 10.7%), Retail Trade (31 | 7.5%), and Professional & Scientific (30 | 7.3%).
Employment Industries by Sex in Spring City
The Spring City industries that see more men than women are Agriculture, Fishing & Hunting (100.0%), Mining, Quarrying, & Extraction (100.0%), and Construction (100.0%), whereas the industries that tend to have a higher number of women are Information (100.0%), Finance & Insurance (100.0%), and Administrative & Support (100.0%).
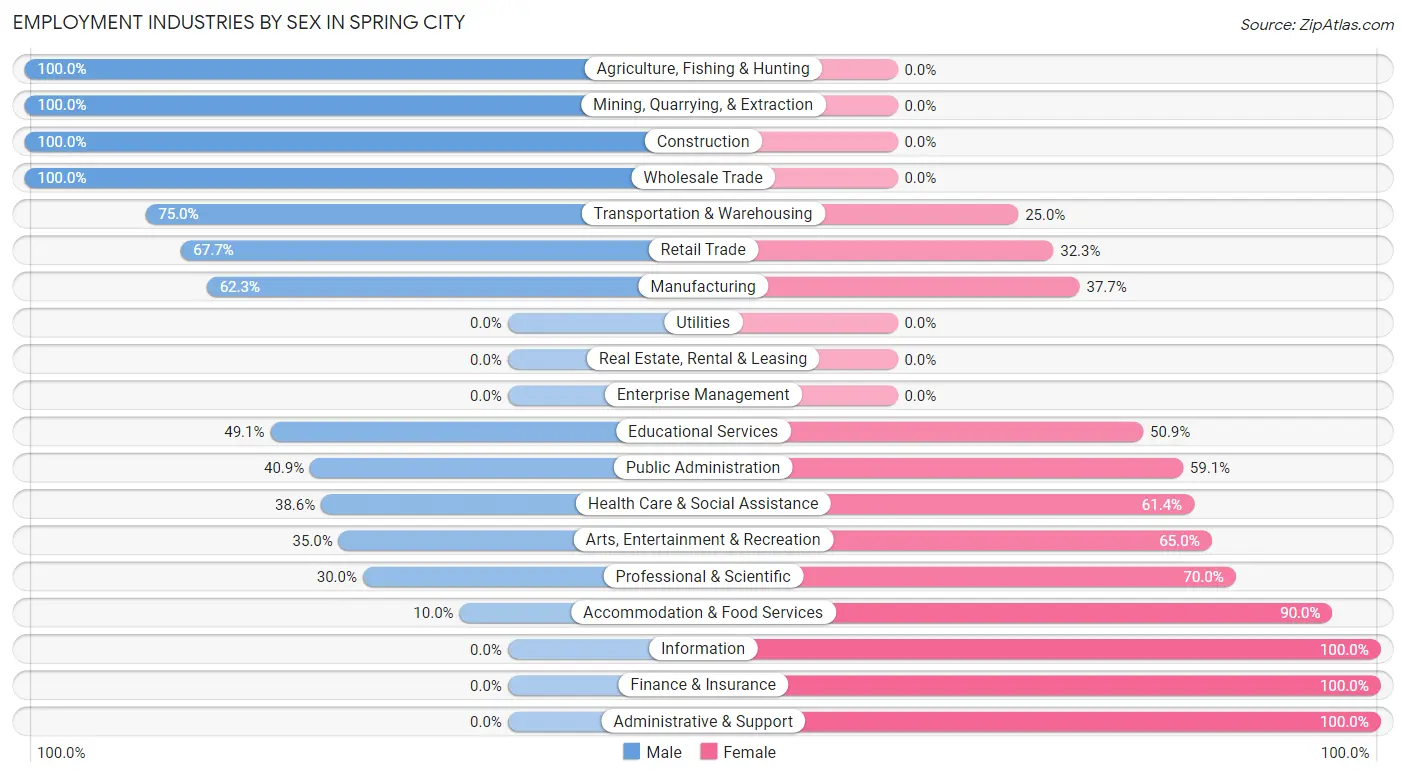
| Industry | Male | Female |
| Agriculture, Fishing & Hunting | 3 (100.0%) | 0 (0.0%) |
| Mining, Quarrying, & Extraction | 24 (100.0%) | 0 (0.0%) |
| Construction | 13 (100.0%) | 0 (0.0%) |
| Manufacturing | 38 (62.3%) | 23 (37.7%) |
| Wholesale Trade | 2 (100.0%) | 0 (0.0%) |
| Retail Trade | 21 (67.7%) | 10 (32.3%) |
| Transportation & Warehousing | 6 (75.0%) | 2 (25.0%) |
| Utilities | 0 (0.0%) | 0 (0.0%) |
| Information | 0 (0.0%) | 1 (100.0%) |
| Finance & Insurance | 0 (0.0%) | 8 (100.0%) |
| Real Estate, Rental & Leasing | 0 (0.0%) | 0 (0.0%) |
| Professional & Scientific | 9 (30.0%) | 21 (70.0%) |
| Enterprise Management | 0 (0.0%) | 0 (0.0%) |
| Administrative & Support | 0 (0.0%) | 1 (100.0%) |
| Educational Services | 57 (49.1%) | 59 (50.9%) |
| Health Care & Social Assistance | 17 (38.6%) | 27 (61.4%) |
| Arts, Entertainment & Recreation | 7 (35.0%) | 13 (65.0%) |
| Accommodation & Food Services | 2 (10.0%) | 18 (90.0%) |
| Public Administration | 9 (40.9%) | 13 (59.1%) |
| Total | 212 (51.6%) | 199 (48.4%) |
Education in Spring City
School Enrollment in Spring City
The most common levels of schooling among the 250 students in Spring City are elementary school (70 | 28.0%), high school (59 | 23.6%), and college / undergraduate (40 | 16.0%).
| School Level | # Students | % Students |
| Nursery / Preschool | 8 | 3.2% |
| Kindergarten | 24 | 9.6% |
| Elementary School | 70 | 28.0% |
| Middle School | 35 | 14.0% |
| High School | 59 | 23.6% |
| College / Undergraduate | 40 | 16.0% |
| Graduate / Professional | 14 | 5.6% |
| Total | 250 | 100.0% |
School Enrollment by Age by Funding Source in Spring City
Out of a total of 250 students who are enrolled in schools in Spring City, 93 (37.2%) attend a private institution, while the remaining 157 (62.8%) are enrolled in public schools. The age group of 3 to 4 year olds has the highest likelihood of being enrolled in private schools, with 2 (100.0% in the age bracket) enrolled. Conversely, the age group of 18 to 19 year olds has the lowest likelihood of being enrolled in a private school, with 20 (100.0% in the age bracket) attending a public institution.
| Age Bracket | Public School | Private School |
| 3 to 4 Year Olds | 0 (0.0%) | 2 (100.0%) |
| 5 to 9 Year Old | 32 (32.0%) | 68 (68.0%) |
| 10 to 14 Year Olds | 47 (92.2%) | 4 (7.8%) |
| 15 to 17 Year Olds | 38 (88.4%) | 5 (11.6%) |
| 18 to 19 Year Olds | 20 (100.0%) | 0 (0.0%) |
| 20 to 24 Year Olds | 3 (18.8%) | 13 (81.2%) |
| 25 to 34 Year Olds | 9 (100.0%) | 0 (0.0%) |
| 35 Years and over | 8 (88.9%) | 1 (11.1%) |
| Total | 157 (62.8%) | 93 (37.2%) |
Educational Attainment by Field of Study in Spring City
Education (70 | 25.5%), business (58 | 21.1%), social sciences (19 | 6.9%), visual & performing arts (19 | 6.9%), and arts & humanities (18 | 6.6%) are the most common fields of study among 275 individuals in Spring City who have obtained a bachelor's degree or higher.
| Field of Study | # Graduates | % Graduates |
| Computers & Mathematics | 12 | 4.4% |
| Bio, Nature & Agricultural | 3 | 1.1% |
| Physical & Health Sciences | 12 | 4.4% |
| Psychology | 6 | 2.2% |
| Social Sciences | 19 | 6.9% |
| Engineering | 14 | 5.1% |
| Multidisciplinary Studies | 0 | 0.0% |
| Science & Technology | 13 | 4.7% |
| Business | 58 | 21.1% |
| Education | 70 | 25.5% |
| Literature & Languages | 14 | 5.1% |
| Liberal Arts & History | 12 | 4.4% |
| Visual & Performing Arts | 19 | 6.9% |
| Communications | 5 | 1.8% |
| Arts & Humanities | 18 | 6.6% |
| Total | 275 | 100.0% |
Transportation & Commute in Spring City
Vehicle Availability by Sex in Spring City
The most prevalent vehicle ownership categories in Spring City are males with 2 vehicles (105, accounting for 49.5%) and females with 2 vehicles (58, making up 53.8%).
| Vehicles Available | Male | Female |
| No Vehicle | 0 (0.0%) | 0 (0.0%) |
| 1 Vehicle | 16 (7.5%) | 18 (9.2%) |
| 2 Vehicles | 105 (49.5%) | 58 (29.7%) |
| 3 Vehicles | 41 (19.3%) | 59 (30.3%) |
| 4 Vehicles | 25 (11.8%) | 25 (12.8%) |
| 5 or more Vehicles | 25 (11.8%) | 35 (17.9%) |
| Total | 212 (100.0%) | 195 (100.0%) |
Commute Time in Spring City
The most frequently occuring commute durations in Spring City are 15 to 19 minutes (79 commuters, 21.5%), 10 to 14 minutes (60 commuters, 16.3%), and 20 to 24 minutes (47 commuters, 12.8%).
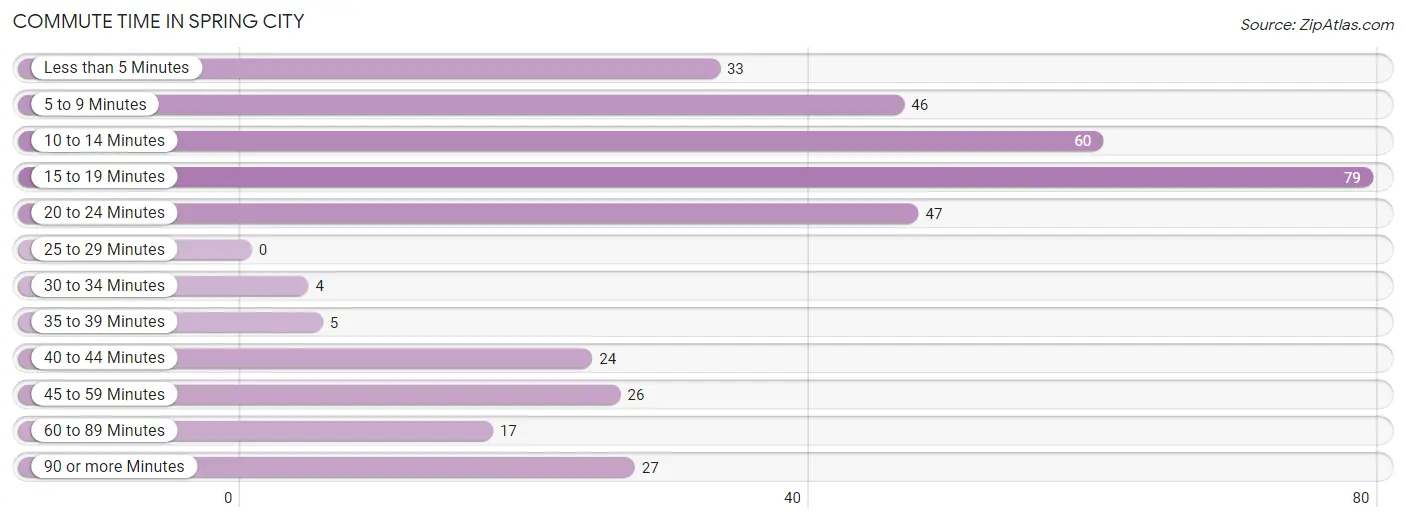
| Commute Time | # Commuters | % Commuters |
| Less than 5 Minutes | 33 | 9.0% |
| 5 to 9 Minutes | 46 | 12.5% |
| 10 to 14 Minutes | 60 | 16.3% |
| 15 to 19 Minutes | 79 | 21.5% |
| 20 to 24 Minutes | 47 | 12.8% |
| 25 to 29 Minutes | 0 | 0.0% |
| 30 to 34 Minutes | 4 | 1.1% |
| 35 to 39 Minutes | 5 | 1.4% |
| 40 to 44 Minutes | 24 | 6.5% |
| 45 to 59 Minutes | 26 | 7.1% |
| 60 to 89 Minutes | 17 | 4.6% |
| 90 or more Minutes | 27 | 7.3% |
Commute Time by Sex in Spring City
The most common commute times in Spring City are 20 to 24 minutes (47 commuters, 24.2%) for males and 10 to 14 minutes (48 commuters, 27.6%) for females.
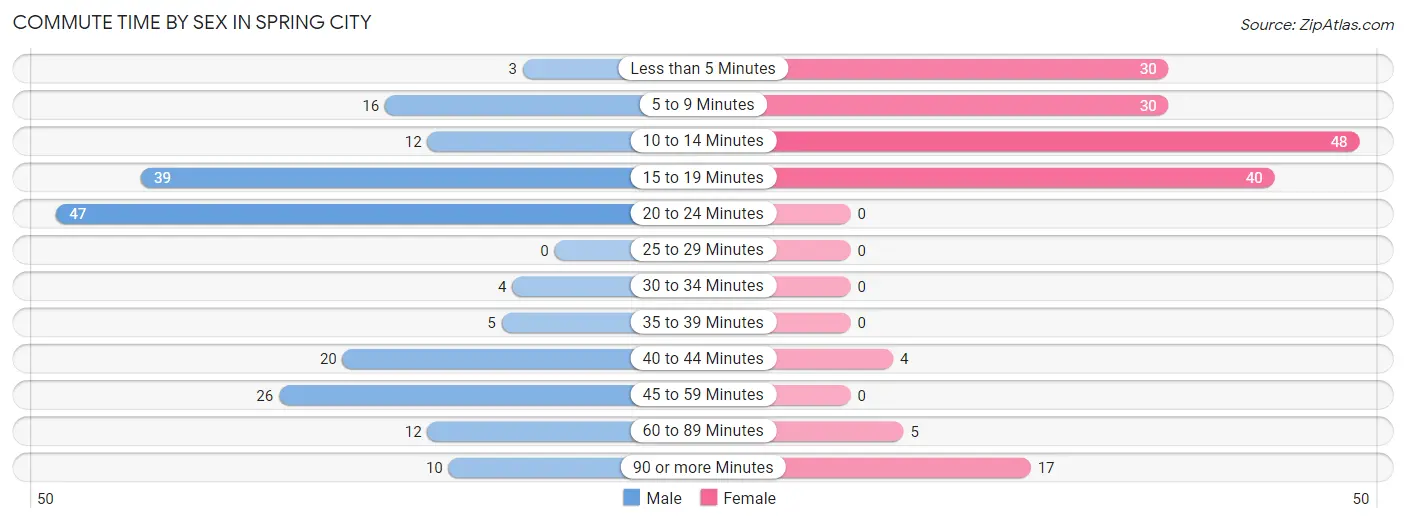
| Commute Time | Male | Female |
| Less than 5 Minutes | 3 (1.5%) | 30 (17.2%) |
| 5 to 9 Minutes | 16 (8.3%) | 30 (17.2%) |
| 10 to 14 Minutes | 12 (6.2%) | 48 (27.6%) |
| 15 to 19 Minutes | 39 (20.1%) | 40 (23.0%) |
| 20 to 24 Minutes | 47 (24.2%) | 0 (0.0%) |
| 25 to 29 Minutes | 0 (0.0%) | 0 (0.0%) |
| 30 to 34 Minutes | 4 (2.1%) | 0 (0.0%) |
| 35 to 39 Minutes | 5 (2.6%) | 0 (0.0%) |
| 40 to 44 Minutes | 20 (10.3%) | 4 (2.3%) |
| 45 to 59 Minutes | 26 (13.4%) | 0 (0.0%) |
| 60 to 89 Minutes | 12 (6.2%) | 5 (2.9%) |
| 90 or more Minutes | 10 (5.1%) | 17 (9.8%) |
Time of Departure to Work by Sex in Spring City
The most frequent times of departure to work in Spring City are 7:30 AM to 7:59 AM (38, 19.6%) for males and 7:30 AM to 7:59 AM (49, 28.2%) for females.
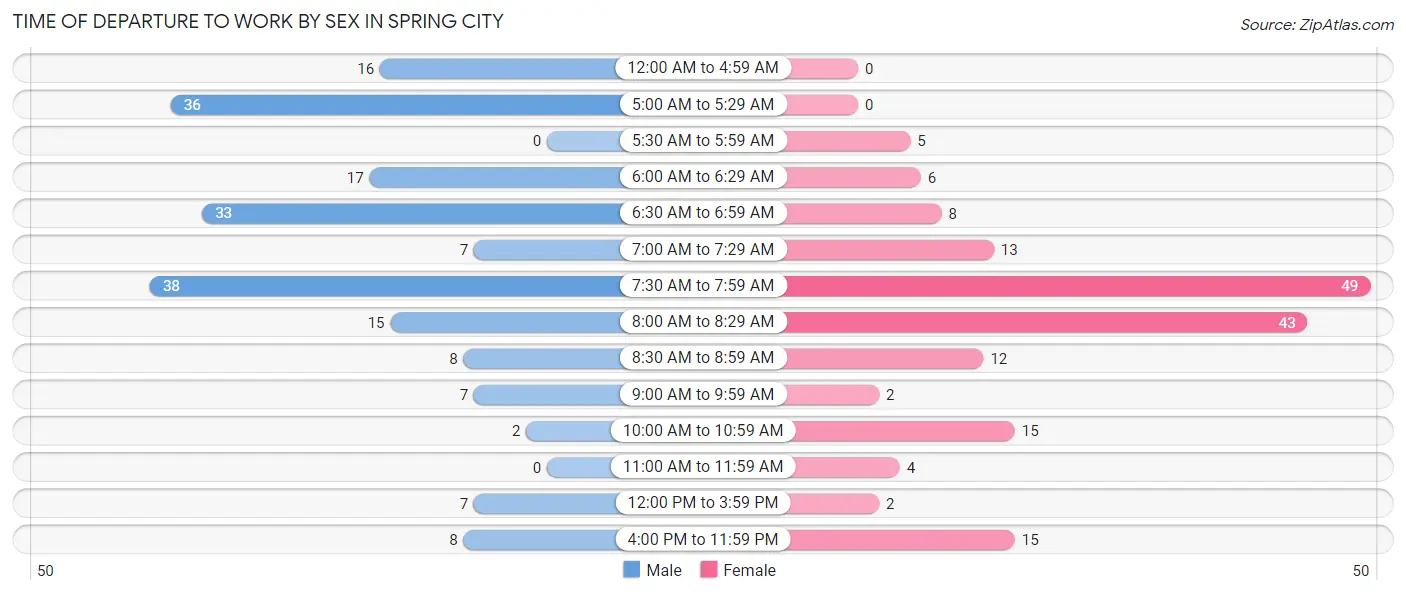
| Time of Departure | Male | Female |
| 12:00 AM to 4:59 AM | 16 (8.3%) | 0 (0.0%) |
| 5:00 AM to 5:29 AM | 36 (18.6%) | 0 (0.0%) |
| 5:30 AM to 5:59 AM | 0 (0.0%) | 5 (2.9%) |
| 6:00 AM to 6:29 AM | 17 (8.8%) | 6 (3.5%) |
| 6:30 AM to 6:59 AM | 33 (17.0%) | 8 (4.6%) |
| 7:00 AM to 7:29 AM | 7 (3.6%) | 13 (7.5%) |
| 7:30 AM to 7:59 AM | 38 (19.6%) | 49 (28.2%) |
| 8:00 AM to 8:29 AM | 15 (7.7%) | 43 (24.7%) |
| 8:30 AM to 8:59 AM | 8 (4.1%) | 12 (6.9%) |
| 9:00 AM to 9:59 AM | 7 (3.6%) | 2 (1.1%) |
| 10:00 AM to 10:59 AM | 2 (1.0%) | 15 (8.6%) |
| 11:00 AM to 11:59 AM | 0 (0.0%) | 4 (2.3%) |
| 12:00 PM to 3:59 PM | 7 (3.6%) | 2 (1.1%) |
| 4:00 PM to 11:59 PM | 8 (4.1%) | 15 (8.6%) |
| Total | 194 (100.0%) | 174 (100.0%) |
Housing Occupancy in Spring City
Occupancy by Ownership in Spring City
Of the total 403 dwellings in Spring City, owner-occupied units account for 362 (89.8%), while renter-occupied units make up 41 (10.2%).
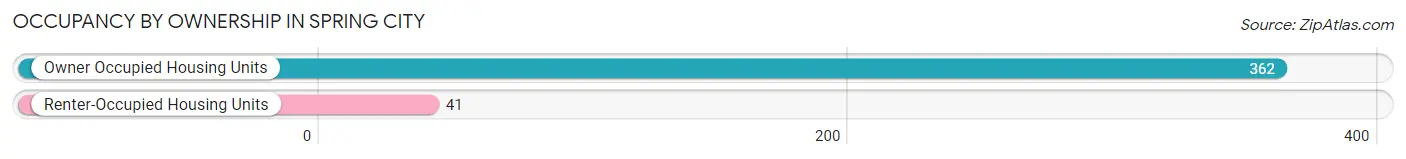
| Occupancy | # Housing Units | % Housing Units |
| Owner Occupied Housing Units | 362 | 89.8% |
| Renter-Occupied Housing Units | 41 | 10.2% |
| Total Occupied Housing Units | 403 | 100.0% |
Occupancy by Household Size in Spring City
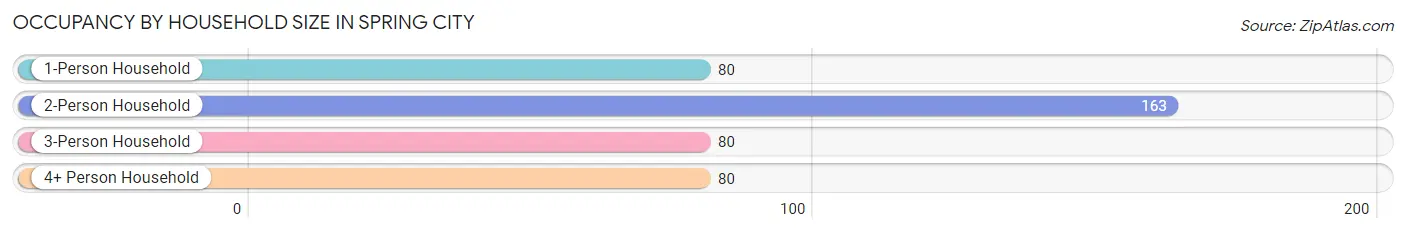
| Household Size | # Housing Units | % Housing Units |
| 1-Person Household | 80 | 19.9% |
| 2-Person Household | 163 | 40.5% |
| 3-Person Household | 80 | 19.9% |
| 4+ Person Household | 80 | 19.9% |
| Total Housing Units | 403 | 100.0% |
Occupancy by Ownership by Household Size in Spring City
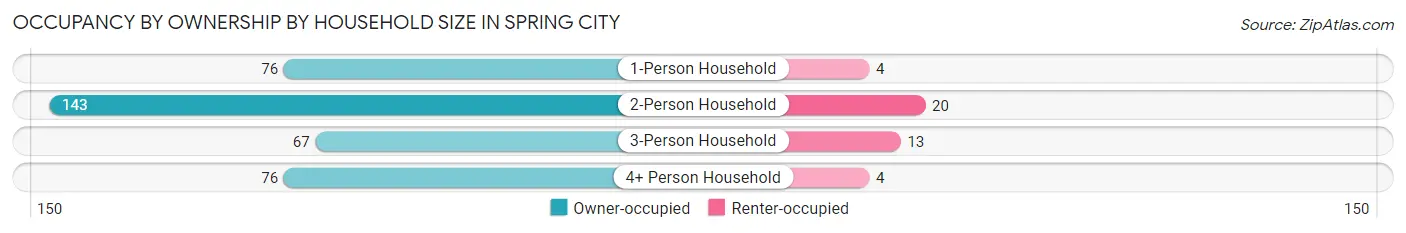
| Household Size | Owner-occupied | Renter-occupied |
| 1-Person Household | 76 (95.0%) | 4 (5.0%) |
| 2-Person Household | 143 (87.7%) | 20 (12.3%) |
| 3-Person Household | 67 (83.8%) | 13 (16.3%) |
| 4+ Person Household | 76 (95.0%) | 4 (5.0%) |
| Total Housing Units | 362 (89.8%) | 41 (10.2%) |
Occupancy by Educational Attainment in Spring City
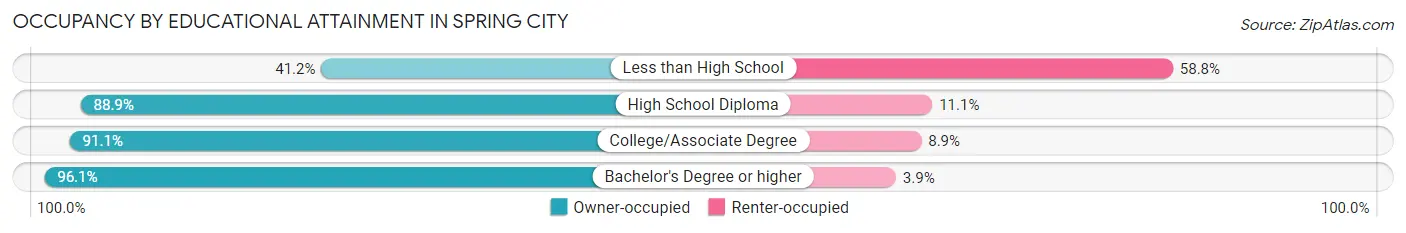
| Household Size | Owner-occupied | Renter-occupied |
| Less than High School | 7 (41.2%) | 10 (58.8%) |
| High School Diploma | 120 (88.9%) | 15 (11.1%) |
| College/Associate Degree | 112 (91.1%) | 11 (8.9%) |
| Bachelor's Degree or higher | 123 (96.1%) | 5 (3.9%) |
Occupancy by Age of Householder in Spring City
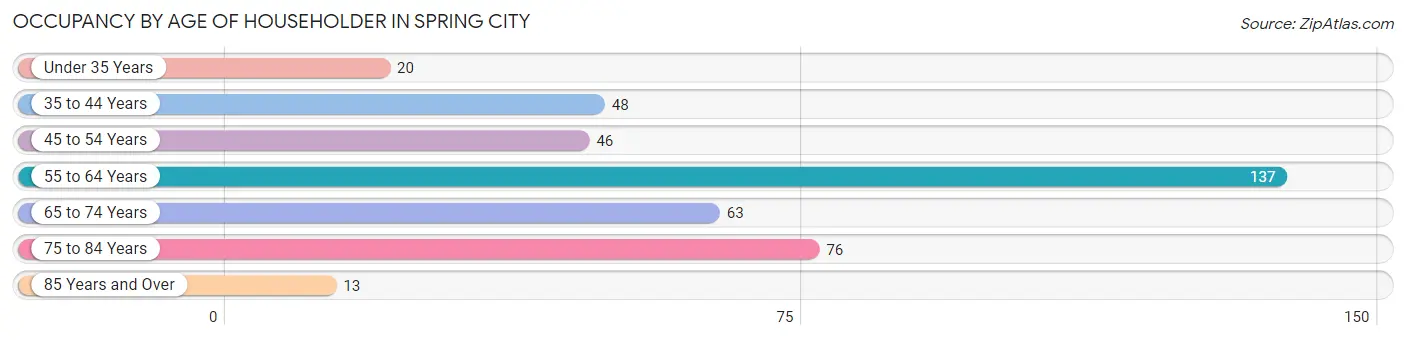
| Age Bracket | # Households | % Households |
| Under 35 Years | 20 | 5.0% |
| 35 to 44 Years | 48 | 11.9% |
| 45 to 54 Years | 46 | 11.4% |
| 55 to 64 Years | 137 | 34.0% |
| 65 to 74 Years | 63 | 15.6% |
| 75 to 84 Years | 76 | 18.9% |
| 85 Years and Over | 13 | 3.2% |
| Total | 403 | 100.0% |
Housing Finances in Spring City
Median Income by Occupancy in Spring City
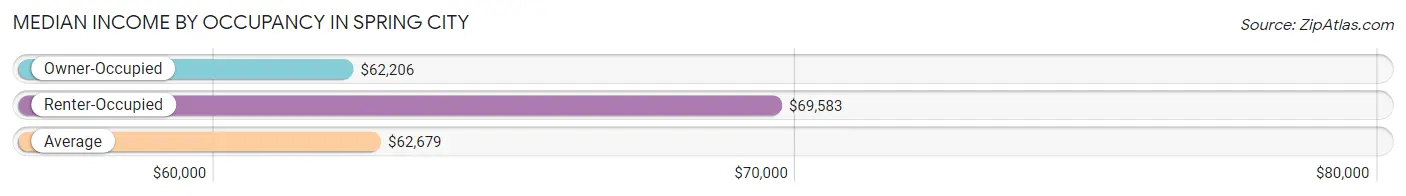
| Occupancy Type | # Households | Median Income |
| Owner-Occupied | 362 (89.8%) | $62,206 |
| Renter-Occupied | 41 (10.2%) | $69,583 |
| Average | 403 (100.0%) | $62,679 |
Occupancy by Householder Income Bracket in Spring City
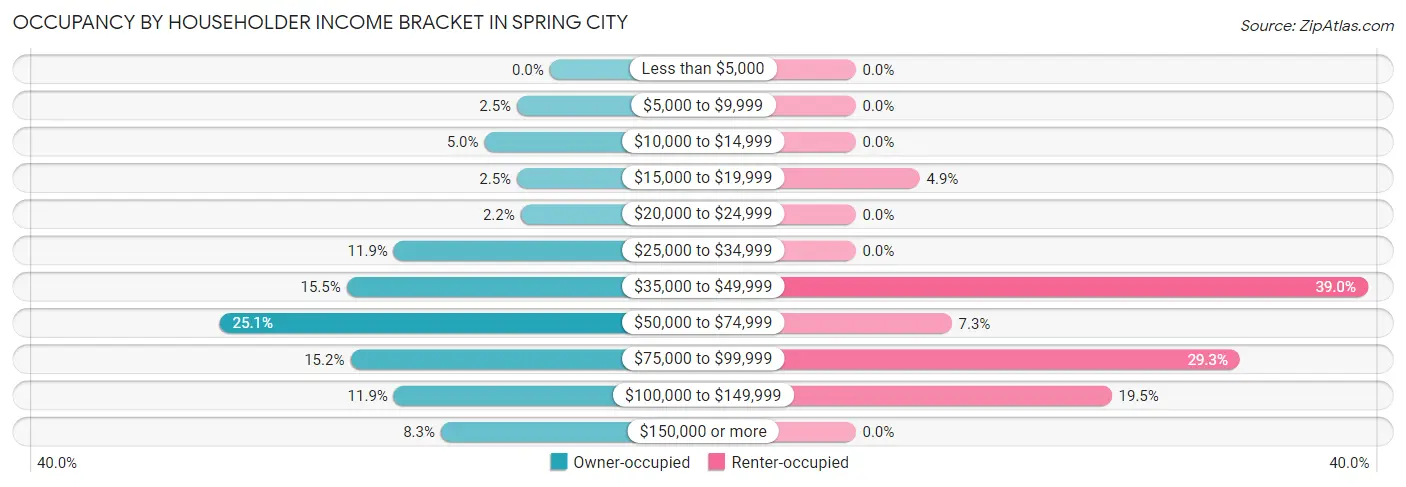
| Income Bracket | Owner-occupied | Renter-occupied |
| Less than $5,000 | 0 (0.0%) | 0 (0.0%) |
| $5,000 to $9,999 | 9 (2.5%) | 0 (0.0%) |
| $10,000 to $14,999 | 18 (5.0%) | 0 (0.0%) |
| $15,000 to $19,999 | 9 (2.5%) | 2 (4.9%) |
| $20,000 to $24,999 | 8 (2.2%) | 0 (0.0%) |
| $25,000 to $34,999 | 43 (11.9%) | 0 (0.0%) |
| $35,000 to $49,999 | 56 (15.5%) | 16 (39.0%) |
| $50,000 to $74,999 | 91 (25.1%) | 3 (7.3%) |
| $75,000 to $99,999 | 55 (15.2%) | 12 (29.3%) |
| $100,000 to $149,999 | 43 (11.9%) | 8 (19.5%) |
| $150,000 or more | 30 (8.3%) | 0 (0.0%) |
| Total | 362 (100.0%) | 41 (100.0%) |
Monthly Housing Cost Tiers in Spring City
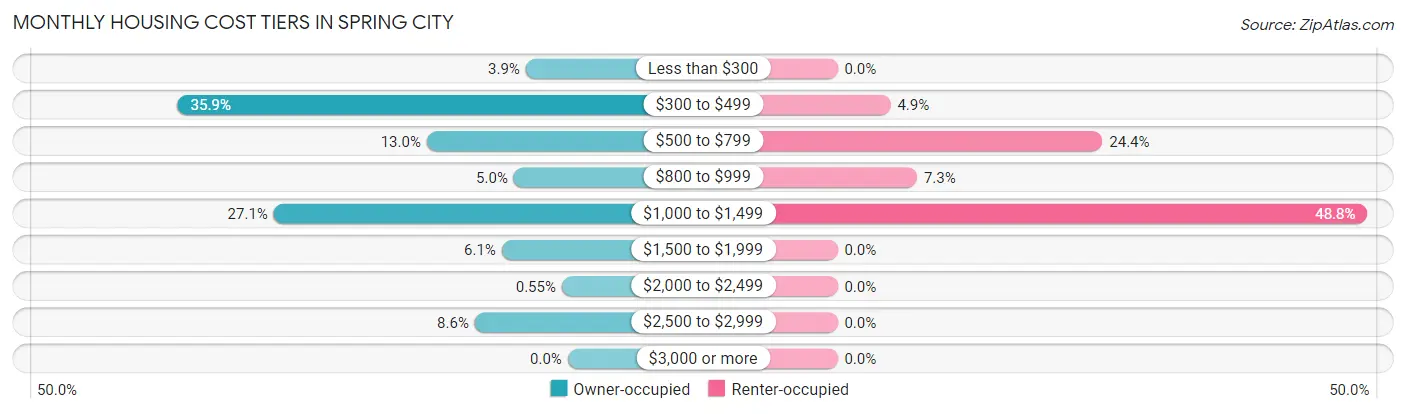
| Monthly Cost | Owner-occupied | Renter-occupied |
| Less than $300 | 14 (3.9%) | 0 (0.0%) |
| $300 to $499 | 130 (35.9%) | 2 (4.9%) |
| $500 to $799 | 47 (13.0%) | 10 (24.4%) |
| $800 to $999 | 18 (5.0%) | 3 (7.3%) |
| $1,000 to $1,499 | 98 (27.1%) | 20 (48.8%) |
| $1,500 to $1,999 | 22 (6.1%) | 0 (0.0%) |
| $2,000 to $2,499 | 2 (0.5%) | 0 (0.0%) |
| $2,500 to $2,999 | 31 (8.6%) | 0 (0.0%) |
| $3,000 or more | 0 (0.0%) | 0 (0.0%) |
| Total | 362 (100.0%) | 41 (100.0%) |
Physical Housing Characteristics in Spring City
Housing Structures in Spring City
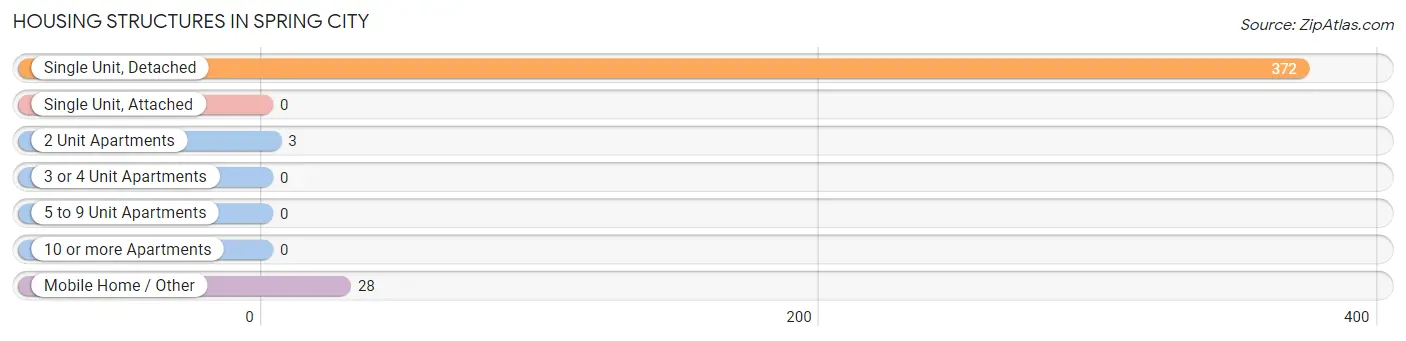
| Structure Type | # Housing Units | % Housing Units |
| Single Unit, Detached | 372 | 92.3% |
| Single Unit, Attached | 0 | 0.0% |
| 2 Unit Apartments | 3 | 0.7% |
| 3 or 4 Unit Apartments | 0 | 0.0% |
| 5 to 9 Unit Apartments | 0 | 0.0% |
| 10 or more Apartments | 0 | 0.0% |
| Mobile Home / Other | 28 | 7.0% |
| Total | 403 | 100.0% |
Housing Structures by Occupancy in Spring City
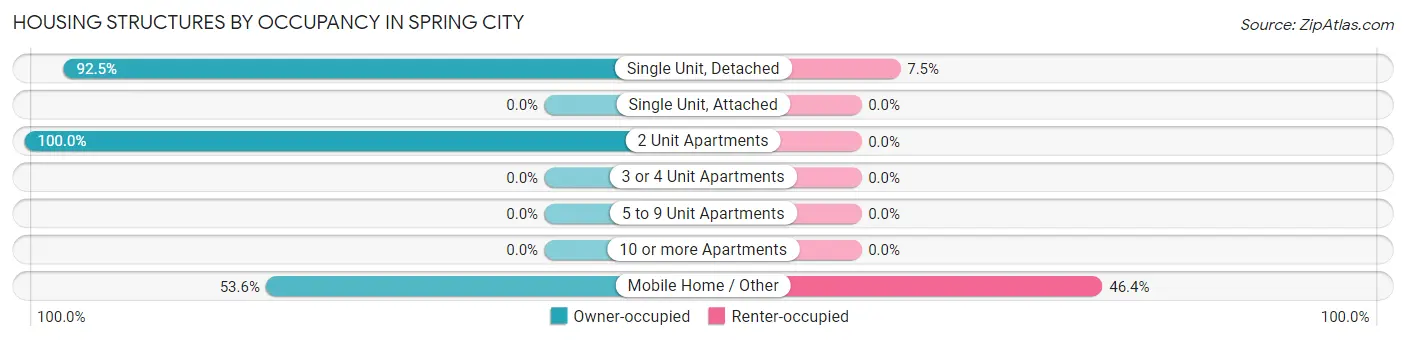
| Structure Type | Owner-occupied | Renter-occupied |
| Single Unit, Detached | 344 (92.5%) | 28 (7.5%) |
| Single Unit, Attached | 0 (0.0%) | 0 (0.0%) |
| 2 Unit Apartments | 3 (100.0%) | 0 (0.0%) |
| 3 or 4 Unit Apartments | 0 (0.0%) | 0 (0.0%) |
| 5 to 9 Unit Apartments | 0 (0.0%) | 0 (0.0%) |
| 10 or more Apartments | 0 (0.0%) | 0 (0.0%) |
| Mobile Home / Other | 15 (53.6%) | 13 (46.4%) |
| Total | 362 (89.8%) | 41 (10.2%) |
Housing Structures by Number of Rooms in Spring City
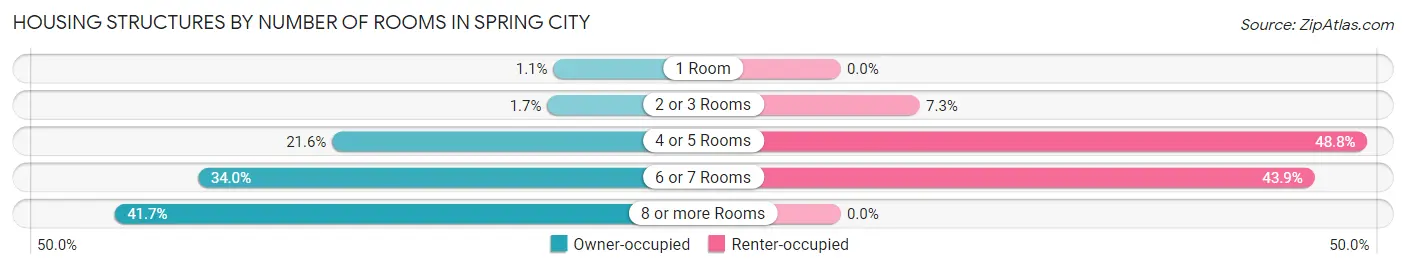
| Number of Rooms | Owner-occupied | Renter-occupied |
| 1 Room | 4 (1.1%) | 0 (0.0%) |
| 2 or 3 Rooms | 6 (1.7%) | 3 (7.3%) |
| 4 or 5 Rooms | 78 (21.5%) | 20 (48.8%) |
| 6 or 7 Rooms | 123 (34.0%) | 18 (43.9%) |
| 8 or more Rooms | 151 (41.7%) | 0 (0.0%) |
| Total | 362 (100.0%) | 41 (100.0%) |
Housing Structure by Heating Type in Spring City
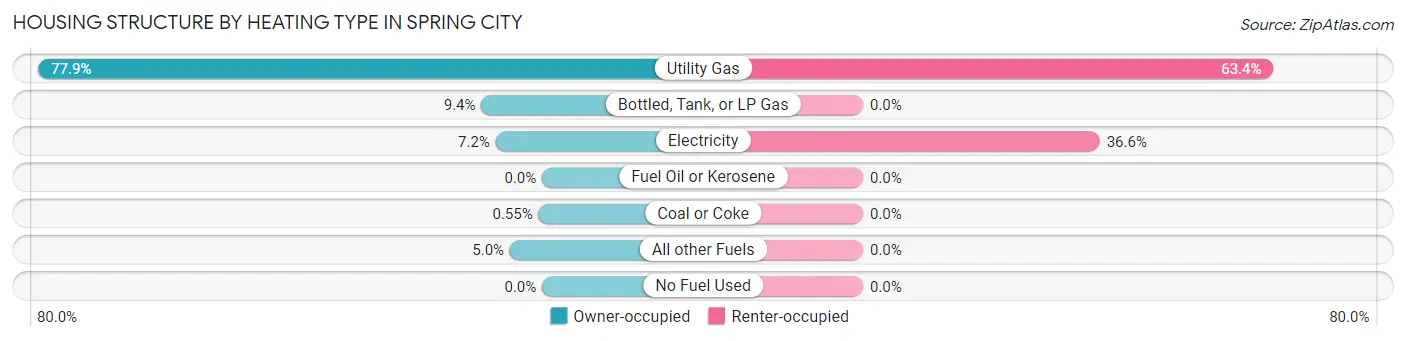
| Heating Type | Owner-occupied | Renter-occupied |
| Utility Gas | 282 (77.9%) | 26 (63.4%) |
| Bottled, Tank, or LP Gas | 34 (9.4%) | 0 (0.0%) |
| Electricity | 26 (7.2%) | 15 (36.6%) |
| Fuel Oil or Kerosene | 0 (0.0%) | 0 (0.0%) |
| Coal or Coke | 2 (0.5%) | 0 (0.0%) |
| All other Fuels | 18 (5.0%) | 0 (0.0%) |
| No Fuel Used | 0 (0.0%) | 0 (0.0%) |
| Total | 362 (100.0%) | 41 (100.0%) |
Household Vehicle Usage in Spring City
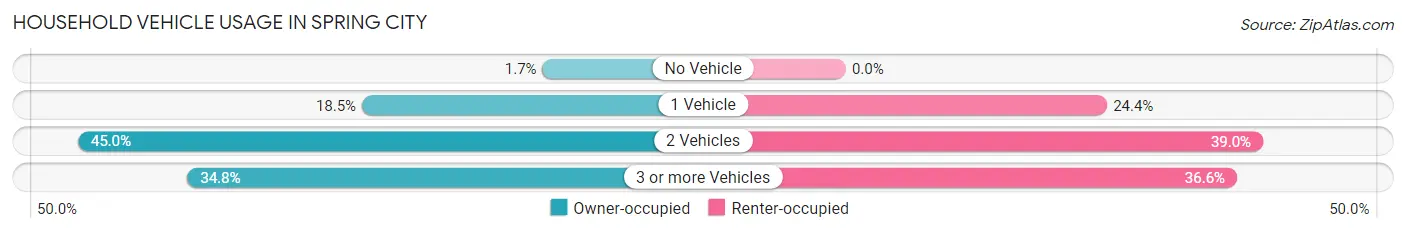
| Vehicles per Household | Owner-occupied | Renter-occupied |
| No Vehicle | 6 (1.7%) | 0 (0.0%) |
| 1 Vehicle | 67 (18.5%) | 10 (24.4%) |
| 2 Vehicles | 163 (45.0%) | 16 (39.0%) |
| 3 or more Vehicles | 126 (34.8%) | 15 (36.6%) |
| Total | 362 (100.0%) | 41 (100.0%) |
Real Estate & Mortgages in Spring City
Real Estate and Mortgage Overview in Spring City
| Characteristic | Without Mortgage | With Mortgage |
| Housing Units | 176 | 186 |
| Median Property Value | $244,400 | $244,200 |
| Median Household Income | $63,214 | $13 |
| Monthly Housing Costs | $411 | $0 |
| Real Estate Taxes | $1,542 | $2 |
Property Value by Mortgage Status in Spring City
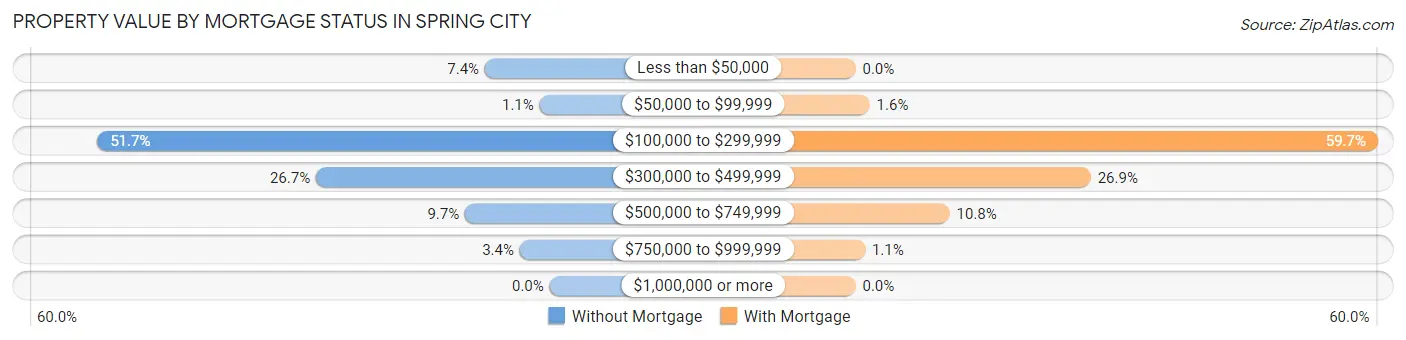
| Property Value | Without Mortgage | With Mortgage |
| Less than $50,000 | 13 (7.4%) | 0 (0.0%) |
| $50,000 to $99,999 | 2 (1.1%) | 3 (1.6%) |
| $100,000 to $299,999 | 91 (51.7%) | 111 (59.7%) |
| $300,000 to $499,999 | 47 (26.7%) | 50 (26.9%) |
| $500,000 to $749,999 | 17 (9.7%) | 20 (10.7%) |
| $750,000 to $999,999 | 6 (3.4%) | 2 (1.1%) |
| $1,000,000 or more | 0 (0.0%) | 0 (0.0%) |
| Total | 176 (100.0%) | 186 (100.0%) |
Household Income by Mortgage Status in Spring City
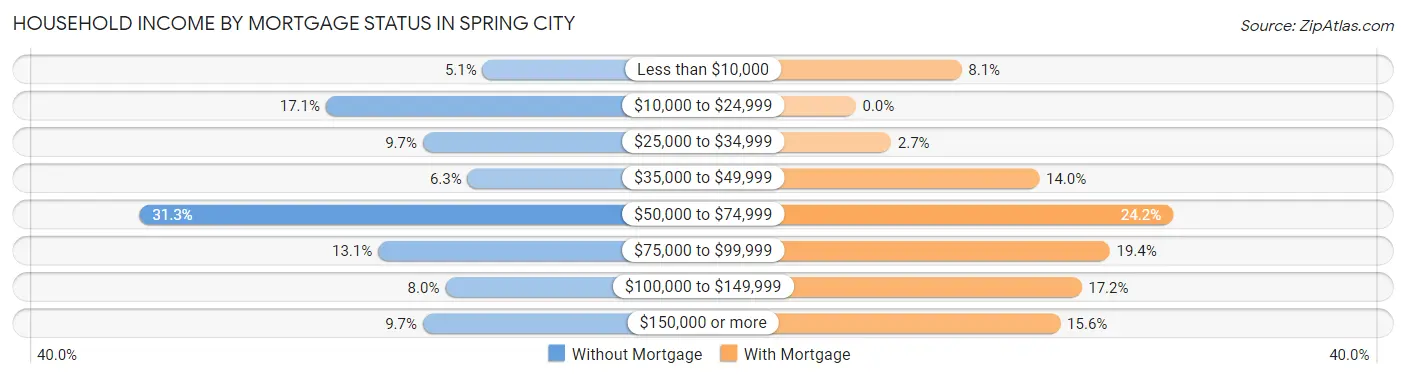
| Household Income | Without Mortgage | With Mortgage |
| Less than $10,000 | 9 (5.1%) | 15 (8.1%) |
| $10,000 to $24,999 | 30 (17.1%) | 0 (0.0%) |
| $25,000 to $34,999 | 17 (9.7%) | 5 (2.7%) |
| $35,000 to $49,999 | 11 (6.2%) | 26 (14.0%) |
| $50,000 to $74,999 | 55 (31.2%) | 45 (24.2%) |
| $75,000 to $99,999 | 23 (13.1%) | 36 (19.4%) |
| $100,000 to $149,999 | 14 (8.0%) | 32 (17.2%) |
| $150,000 or more | 17 (9.7%) | 29 (15.6%) |
| Total | 176 (100.0%) | 186 (100.0%) |
Property Value to Household Income Ratio in Spring City
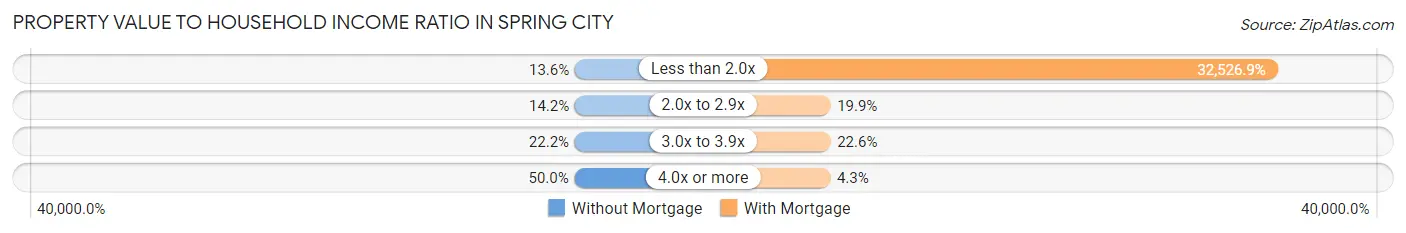
| Value-to-Income Ratio | Without Mortgage | With Mortgage |
| Less than 2.0x | 24 (13.6%) | 60,500 (32,526.9%) |
| 2.0x to 2.9x | 25 (14.2%) | 37 (19.9%) |
| 3.0x to 3.9x | 39 (22.2%) | 42 (22.6%) |
| 4.0x or more | 88 (50.0%) | 8 (4.3%) |
| Total | 176 (100.0%) | 186 (100.0%) |
Real Estate Taxes by Mortgage Status in Spring City
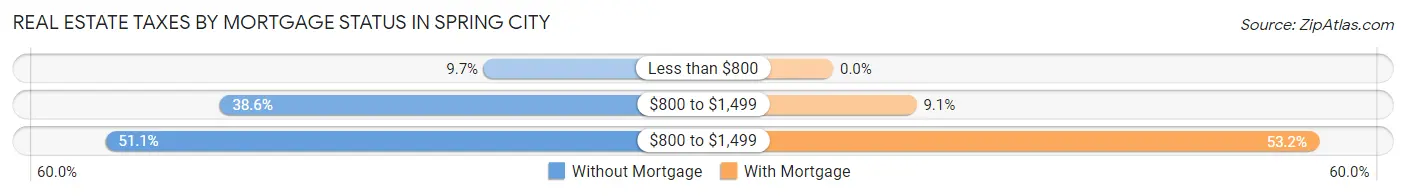
| Property Taxes | Without Mortgage | With Mortgage |
| Less than $800 | 17 (9.7%) | 0 (0.0%) |
| $800 to $1,499 | 68 (38.6%) | 17 (9.1%) |
| $800 to $1,499 | 90 (51.1%) | 99 (53.2%) |
| Total | 176 (100.0%) | 186 (100.0%) |
Health & Disability in Spring City
Health Insurance Coverage by Age in Spring City
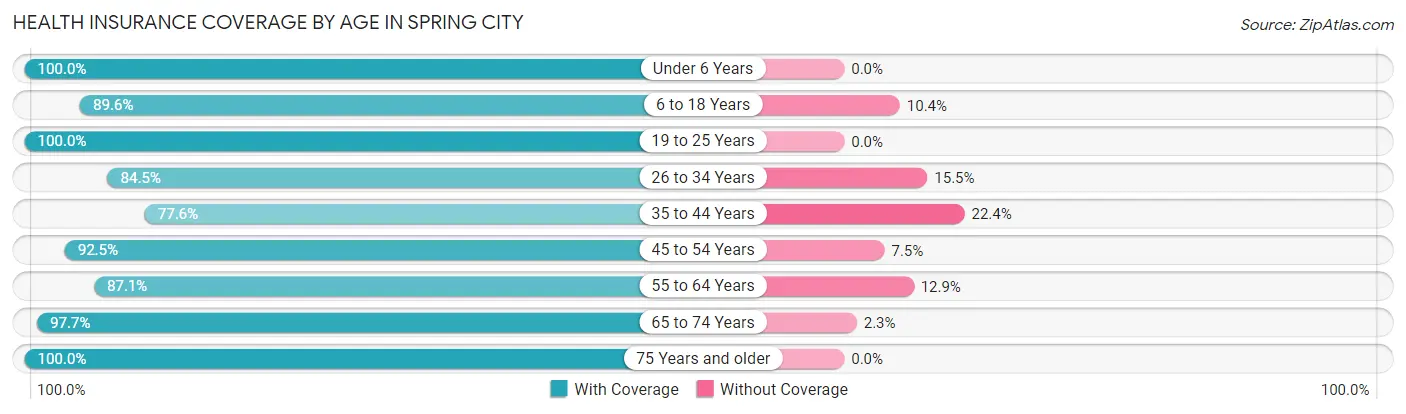
| Age Bracket | With Coverage | Without Coverage |
| Under 6 Years | 76 (100.0%) | 0 (0.0%) |
| 6 to 18 Years | 173 (89.6%) | 20 (10.4%) |
| 19 to 25 Years | 55 (100.0%) | 0 (0.0%) |
| 26 to 34 Years | 60 (84.5%) | 11 (15.5%) |
| 35 to 44 Years | 83 (77.6%) | 24 (22.4%) |
| 45 to 54 Years | 111 (92.5%) | 9 (7.5%) |
| 55 to 64 Years | 175 (87.1%) | 26 (12.9%) |
| 65 to 74 Years | 126 (97.7%) | 3 (2.3%) |
| 75 Years and older | 156 (100.0%) | 0 (0.0%) |
| Total | 1,015 (91.6%) | 93 (8.4%) |
Health Insurance Coverage by Citizenship Status in Spring City
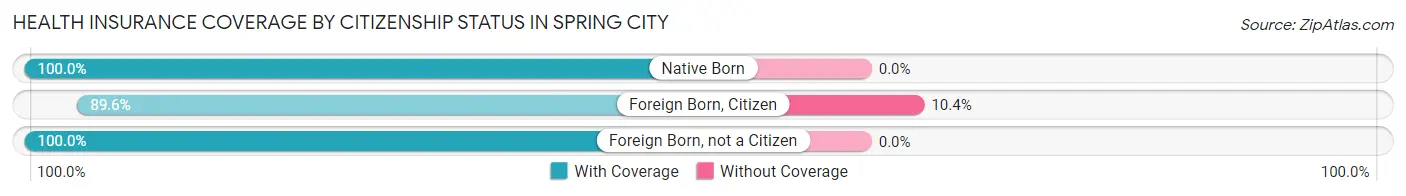
| Citizenship Status | With Coverage | Without Coverage |
| Native Born | 76 (100.0%) | 0 (0.0%) |
| Foreign Born, Citizen | 173 (89.6%) | 20 (10.4%) |
| Foreign Born, not a Citizen | 55 (100.0%) | 0 (0.0%) |
Health Insurance Coverage by Household Income in Spring City
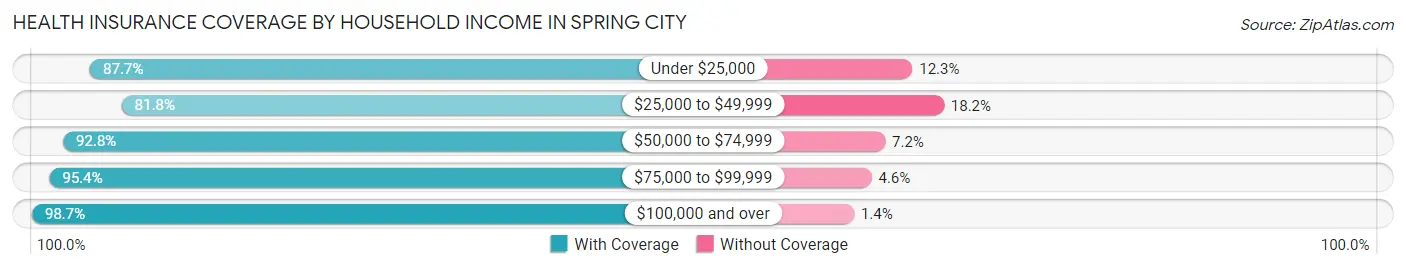
| Household Income | With Coverage | Without Coverage |
| Under $25,000 | 50 (87.7%) | 7 (12.3%) |
| $25,000 to $49,999 | 216 (81.8%) | 48 (18.2%) |
| $50,000 to $74,999 | 323 (92.8%) | 25 (7.2%) |
| $75,000 to $99,999 | 206 (95.4%) | 10 (4.6%) |
| $100,000 and over | 220 (98.7%) | 3 (1.3%) |
Public vs Private Health Insurance Coverage by Age in Spring City
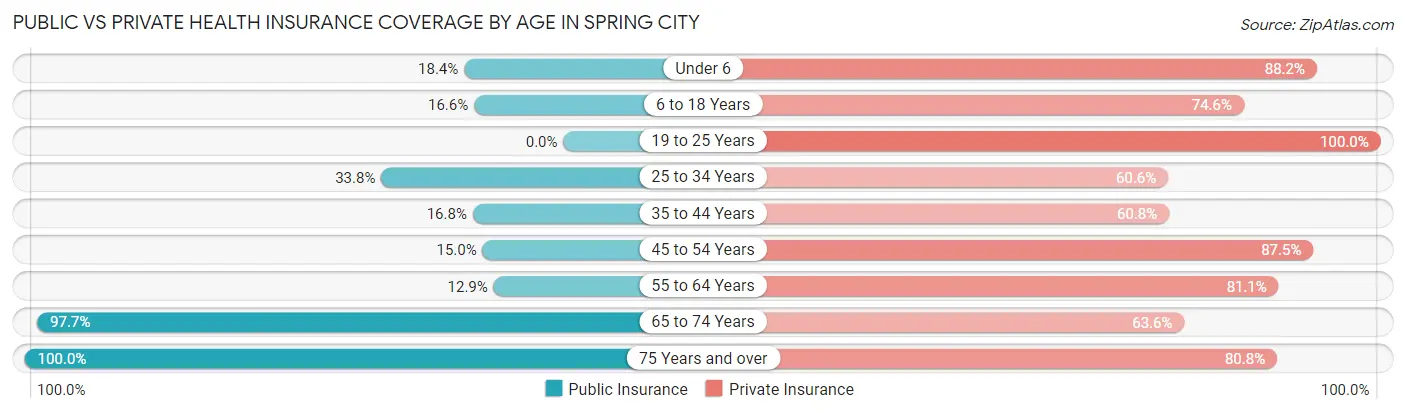
| Age Bracket | Public Insurance | Private Insurance |
| Under 6 | 14 (18.4%) | 67 (88.2%) |
| 6 to 18 Years | 32 (16.6%) | 144 (74.6%) |
| 19 to 25 Years | 0 (0.0%) | 55 (100.0%) |
| 25 to 34 Years | 24 (33.8%) | 43 (60.6%) |
| 35 to 44 Years | 18 (16.8%) | 65 (60.8%) |
| 45 to 54 Years | 18 (15.0%) | 105 (87.5%) |
| 55 to 64 Years | 26 (12.9%) | 163 (81.1%) |
| 65 to 74 Years | 126 (97.7%) | 82 (63.6%) |
| 75 Years and over | 156 (100.0%) | 126 (80.8%) |
| Total | 414 (37.4%) | 850 (76.7%) |
Disability Status by Sex by Age in Spring City
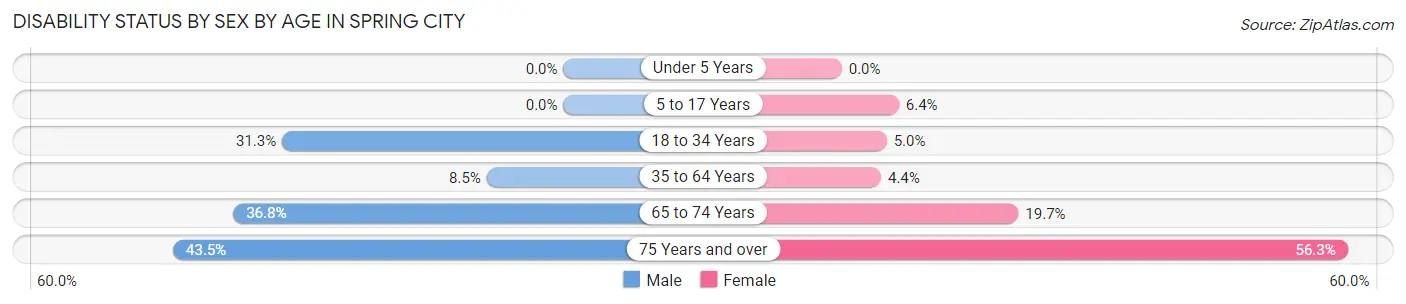
| Age Bracket | Male | Female |
| Under 5 Years | 0 (0.0%) | 0 (0.0%) |
| 5 to 17 Years | 0 (0.0%) | 4 (6.4%) |
| 18 to 34 Years | 26 (31.3%) | 3 (5.0%) |
| 35 to 64 Years | 17 (8.5%) | 10 (4.4%) |
| 65 to 74 Years | 25 (36.8%) | 12 (19.7%) |
| 75 Years and over | 30 (43.5%) | 49 (56.3%) |
Disability Class by Sex by Age in Spring City
Disability Class: Hearing Difficulty
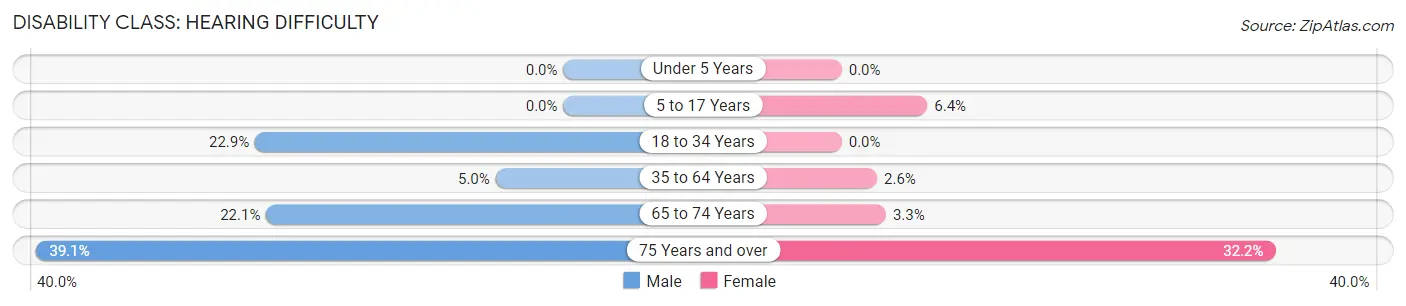
| Age Bracket | Male | Female |
| Under 5 Years | 0 (0.0%) | 0 (0.0%) |
| 5 to 17 Years | 0 (0.0%) | 4 (6.4%) |
| 18 to 34 Years | 19 (22.9%) | 0 (0.0%) |
| 35 to 64 Years | 10 (5.0%) | 6 (2.6%) |
| 65 to 74 Years | 15 (22.1%) | 2 (3.3%) |
| 75 Years and over | 27 (39.1%) | 28 (32.2%) |
Disability Class: Vision Difficulty
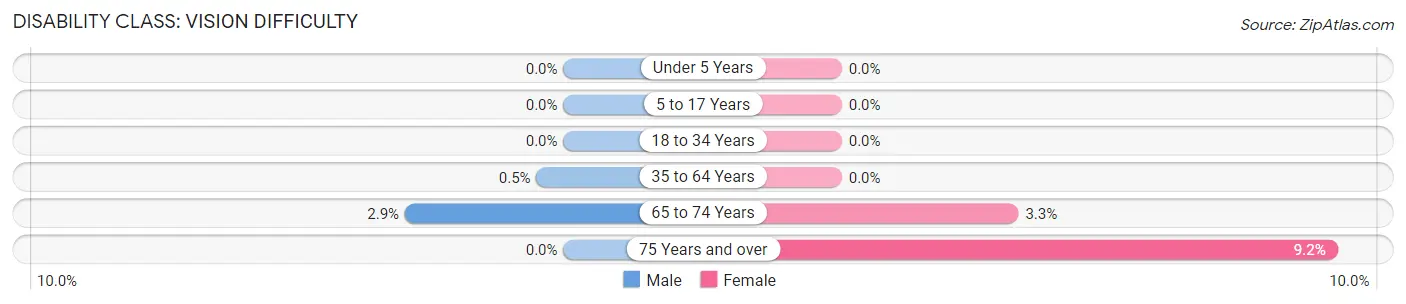
| Age Bracket | Male | Female |
| Under 5 Years | 0 (0.0%) | 0 (0.0%) |
| 5 to 17 Years | 0 (0.0%) | 0 (0.0%) |
| 18 to 34 Years | 0 (0.0%) | 0 (0.0%) |
| 35 to 64 Years | 1 (0.5%) | 0 (0.0%) |
| 65 to 74 Years | 2 (2.9%) | 2 (3.3%) |
| 75 Years and over | 0 (0.0%) | 8 (9.2%) |
Disability Class: Cognitive Difficulty
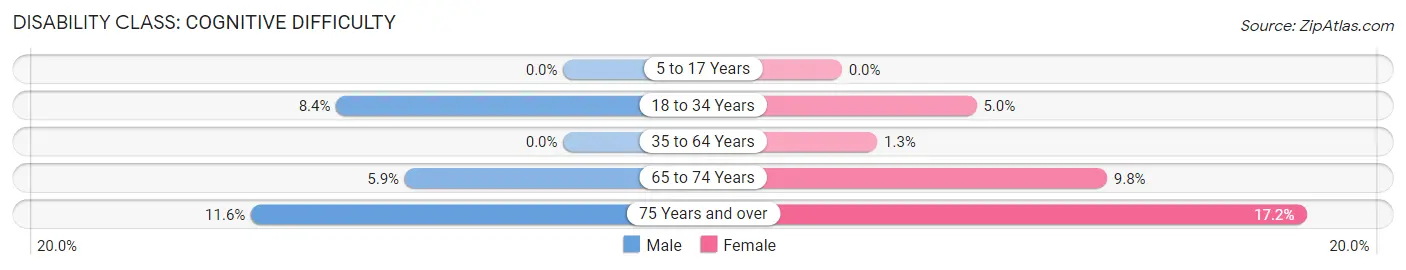
| Age Bracket | Male | Female |
| 5 to 17 Years | 0 (0.0%) | 0 (0.0%) |
| 18 to 34 Years | 7 (8.4%) | 3 (5.0%) |
| 35 to 64 Years | 0 (0.0%) | 3 (1.3%) |
| 65 to 74 Years | 4 (5.9%) | 6 (9.8%) |
| 75 Years and over | 8 (11.6%) | 15 (17.2%) |
Disability Class: Ambulatory Difficulty
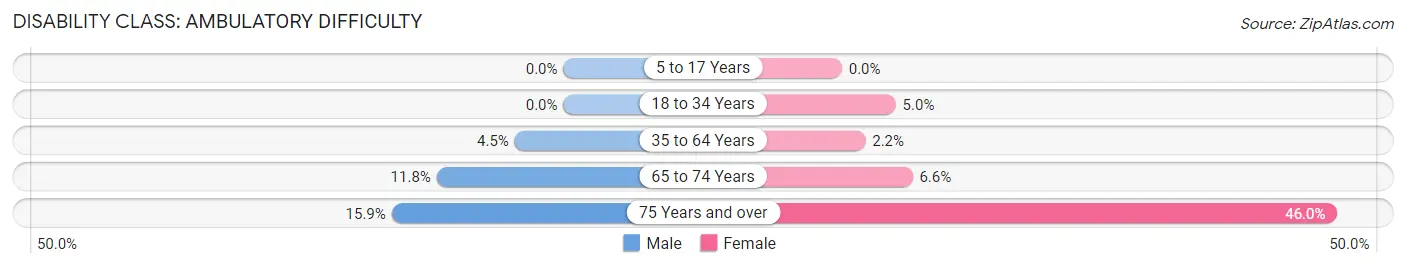
| Age Bracket | Male | Female |
| 5 to 17 Years | 0 (0.0%) | 0 (0.0%) |
| 18 to 34 Years | 0 (0.0%) | 3 (5.0%) |
| 35 to 64 Years | 9 (4.5%) | 5 (2.2%) |
| 65 to 74 Years | 8 (11.8%) | 4 (6.6%) |
| 75 Years and over | 11 (15.9%) | 40 (46.0%) |
Disability Class: Self-Care Difficulty
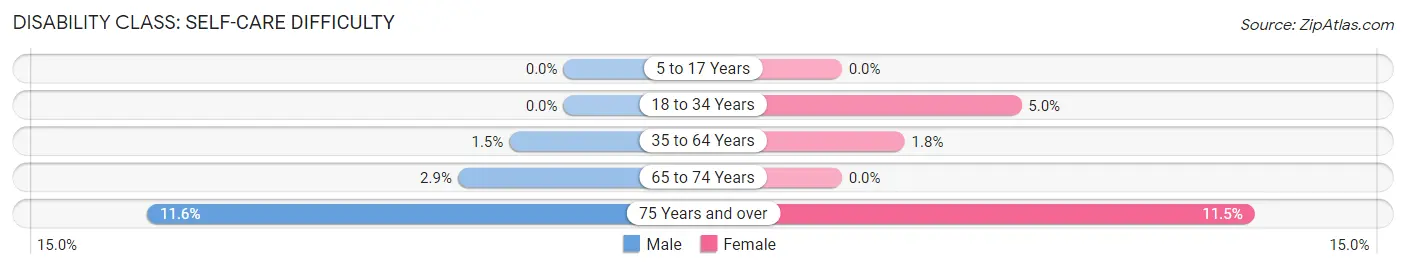
| Age Bracket | Male | Female |
| 5 to 17 Years | 0 (0.0%) | 0 (0.0%) |
| 18 to 34 Years | 0 (0.0%) | 3 (5.0%) |
| 35 to 64 Years | 3 (1.5%) | 4 (1.8%) |
| 65 to 74 Years | 2 (2.9%) | 0 (0.0%) |
| 75 Years and over | 8 (11.6%) | 10 (11.5%) |
Technology Access in Spring City
Computing Device Access in Spring City
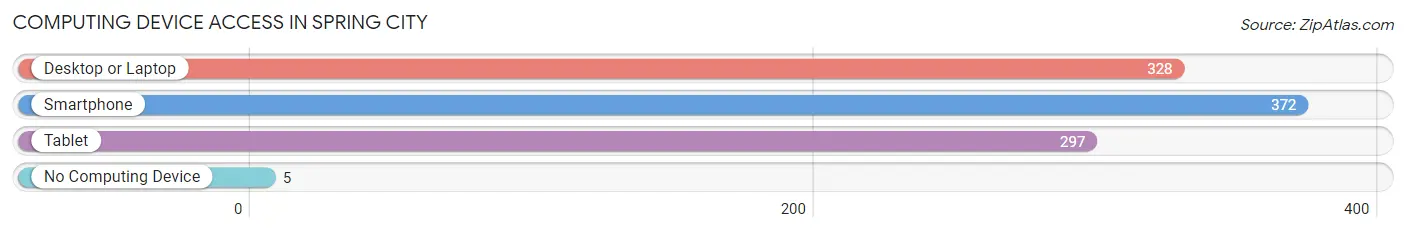
| Device Type | # Households | % Households |
| Desktop or Laptop | 328 | 81.4% |
| Smartphone | 372 | 92.3% |
| Tablet | 297 | 73.7% |
| No Computing Device | 5 | 1.2% |
| Total | 403 | 100.0% |
Internet Access in Spring City
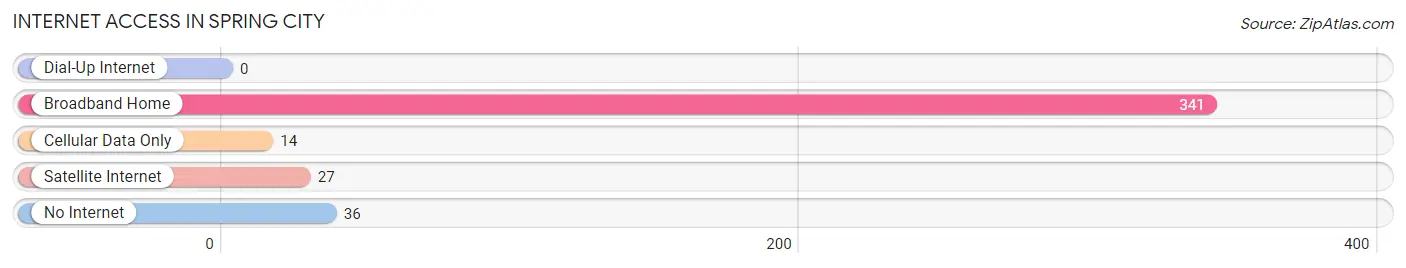
| Internet Type | # Households | % Households |
| Dial-Up Internet | 0 | 0.0% |
| Broadband Home | 341 | 84.6% |
| Cellular Data Only | 14 | 3.5% |
| Satellite Internet | 27 | 6.7% |
| No Internet | 36 | 8.9% |
| Total | 403 | 100.0% |
Spring City Summary
City of Spring City Utah
Spring City, Utah is a small town located in Sanpete County, Utah. It is situated in the foothills of the Wasatch Mountains, about 90 miles south of Salt Lake City. The town was founded in 1852 by Mormon pioneers and is one of the oldest continuously inhabited settlements in the state. The population of Spring City was 1,062 at the 2010 census.
History
The first settlers of Spring City were Mormon pioneers who arrived in 1852. The town was originally called “Springtown” and was later changed to Spring City. The town was founded by a group of settlers led by John R. Murdock, who was a member of the Church of Jesus Christ of Latter-day Saints. The settlers built a fort and a sawmill, and the town quickly grew.
In 1877, the town was incorporated and the first mayor was elected. The town was known for its woolen mills, which produced blankets and clothing for the local population. The town also had a thriving agricultural industry, with many farmers growing wheat, corn, and other crops.
In the early 1900s, the town experienced a period of growth and prosperity. The population increased from 1,000 in 1900 to 1,500 in 1910. The town also had a number of businesses, including a bank, a hotel, a theater, and a newspaper.
Geography
Spring City is located in Sanpete County, Utah. It is situated in the foothills of the Wasatch Mountains, about 90 miles south of Salt Lake City. The town is located at an elevation of 5,400 feet. The town is surrounded by mountains and is located near the Manti-La Sal National Forest.
The climate in Spring City is semi-arid, with hot summers and cold winters. The average annual temperature is 48°F, with an average high of 79°F in the summer and an average low of 17°F in the winter. The average annual precipitation is 12.5 inches.
Economy
The economy of Spring City is largely based on agriculture and tourism. The town is home to several farms, which produce wheat, corn, hay, and other crops. The town also has a number of tourist attractions, including the Manti-La Sal National Forest, the Sanpete Valley Railroad, and the Spring City Historical Museum.
The town also has a number of small businesses, including restaurants, shops, and a grocery store. The town is also home to a number of manufacturing companies, which produce a variety of products, including furniture, clothing, and electronics.
Demographics
As of the 2010 census, the population of Spring City was 1,062. The racial makeup of the town was 95.3% White, 0.7% Native American, 0.3% Asian, 0.2% Pacific Islander, 0.2% from other races, and 3.5% from two or more races. The median household income was $37,500 and the median family income was $45,000. The per capita income was $17,000.
Conclusion
Spring City, Utah is a small town located in Sanpete County, Utah. It was founded in 1852 by Mormon pioneers and is one of the oldest continuously inhabited settlements in the state. The town has a rich history and a thriving economy based on agriculture and tourism. The population of Spring City was 1,062 at the 2010 census. The town has a semi-arid climate and is surrounded by mountains. The town is home to a number of small businesses, farms, and tourist attractions.
Common Questions
What is Per Capita Income in Spring City?
Per Capita income in Spring City is $29,368.
What is the Median Family Income in Spring City?
Median Family Income in Spring City is $66,724.
What is the Median Household income in Spring City?
Median Household Income in Spring City is $62,679.
What is Income or Wage Gap in Spring City?
Income or Wage Gap in Spring City is 52.2%.
Women in Spring City earn 47.8 cents for every dollar earned by a man.
What is Inequality or Gini Index in Spring City?
Inequality or Gini Index in Spring City is 0.39.
What is the Total Population of Spring City?
Total Population of Spring City is 1,108.
What is the Total Male Population of Spring City?
Total Male Population of Spring City is 567.
What is the Total Female Population of Spring City?
Total Female Population of Spring City is 541.
What is the Ratio of Males per 100 Females in Spring City?
There are 104.81 Males per 100 Females in Spring City.
What is the Ratio of Females per 100 Males in Spring City?
There are 95.41 Females per 100 Males in Spring City.
What is the Median Population Age in Spring City?
Median Population Age in Spring City is 50.3 Years.
What is the Average Family Size in Spring City
Average Family Size in Spring City is 3.1 People.
What is the Average Household Size in Spring City
Average Household Size in Spring City is 2.8 People.
How Large is the Labor Force in Spring City?
There are 467 People in the Labor Forcein in Spring City.
What is the Percentage of People in the Labor Force in Spring City?
52.4% of People are in the Labor Force in Spring City.
What is the Unemployment Rate in Spring City?
Unemployment Rate in Spring City is 12.0%.