Zip Codes with the Highest Percentage of Population Employed in Health Diagnosing & Treating in Rowlett, TX
RELATED REPORTS & OPTIONS
Health Diagnosing & Treating
Rowlett
Compare Zip Codes
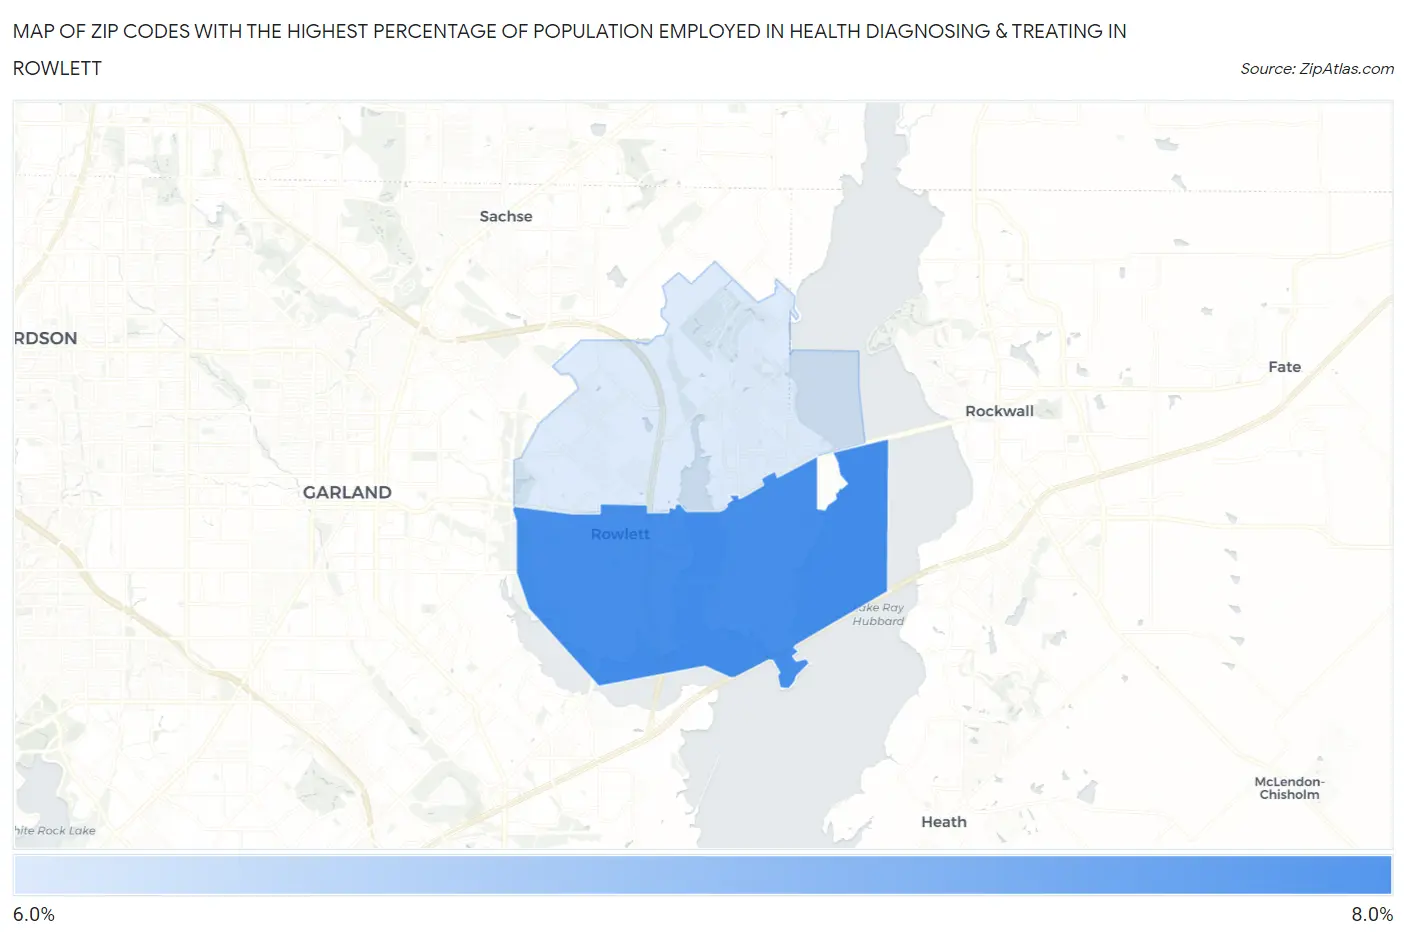
Map of Zip Codes with the Highest Percentage of Population Employed in Health Diagnosing & Treating in Rowlett
6.1%
6.3%
Zip Codes with the Highest Percentage of Population Employed in Health Diagnosing & Treating in Rowlett, TX
| Zip Code | % Employed | vs State | vs National | |
| 1. | 75088 | 6.3% | 5.5%(+0.762)#545 | 6.2%(+0.036)#12,833 |
| 2. | 75089 | 6.1% | 5.5%(+0.608)#578 | 6.2%(-0.118)#13,421 |
1
Common Questions
What are the Top Zip Codes with the Highest Percentage of Population Employed in Health Diagnosing & Treating in Rowlett, TX?
Top Zip Codes with the Highest Percentage of Population Employed in Health Diagnosing & Treating in Rowlett, TX are:
What zip code has the Highest Percentage of Population Employed in Health Diagnosing & Treating in Rowlett, TX?
75088 has the Highest Percentage of Population Employed in Health Diagnosing & Treating in Rowlett, TX with 6.3%.
What is the Percentage of Population Employed in Health Diagnosing & Treating in Rowlett, TX?
Percentage of Population Employed in Health Diagnosing & Treating in Rowlett is 6.0%.
What is the Percentage of Population Employed in Health Diagnosing & Treating in Texas?
Percentage of Population Employed in Health Diagnosing & Treating in Texas is 5.5%.
What is the Percentage of Population Employed in Health Diagnosing & Treating in the United States?
Percentage of Population Employed in Health Diagnosing & Treating in the United States is 6.2%.