Fronton, TX Map & Demographics
Fronton Map
Fronton Overview
$13,380
PER CAPITA INCOME
$32,105
AVG FAMILY INCOME
$49,464
AVG HOUSEHOLD INCOME
47.1%
WAGE / INCOME GAP [ % ]
52.9¢/ $1
WAGE / INCOME GAP [ $ ]
0.22
INEQUALITY / GINI INDEX
264
TOTAL POPULATION
128
MALE POPULATION
136
FEMALE POPULATION
94.12
MALES / 100 FEMALES
106.25
FEMALES / 100 MALES
28.5
MEDIAN AGE
4.2
AVG FAMILY SIZE
4.4
AVG HOUSEHOLD SIZE
149
LABOR FORCE [ PEOPLE ]
79.7%
PERCENT IN LABOR FORCE
19.5%
UNEMPLOYMENT RATE
Income in Fronton
Income Overview in Fronton
Per Capita Income in Fronton is $13,380, while median incomes of families and households are $32,105 and $49,464 respectively.
| Characteristic | Number | Measure |
| Per Capita Income | 264 | $13,380 |
| Median Family Income | 60 | $32,105 |
| Mean Family Income | 60 | $41,558 |
| Median Household Income | 60 | $49,464 |
| Mean Household Income | 60 | $53,655 |
| Income Deficit | 60 | $0 |
| Wage / Income Gap (%) | 264 | 47.12% |
| Wage / Income Gap ($) | 264 | 52.88¢ per $1 |
| Gini / Inequality Index | 264 | 0.22 |
Earnings by Sex in Fronton
Average Earnings in Fronton are $16,375, $25,833 for men and $13,661 for women, a difference of 47.1%.
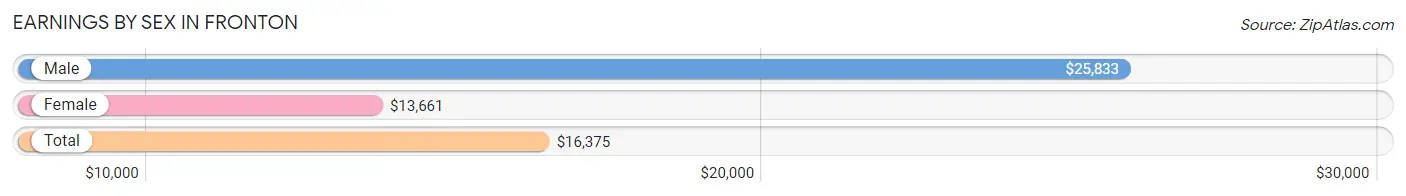
| Sex | Number | Average Earnings |
| Male | 78 (52.3%) | $25,833 |
| Female | 71 (47.6%) | $13,661 |
| Total | 149 (100.0%) | $16,375 |
Earnings by Sex by Income Bracket in Fronton
The most common earnings brackets in Fronton are $7,500 to $9,999 for men (26 | 33.3%) and $2,499 or less for women (29 | 40.8%).
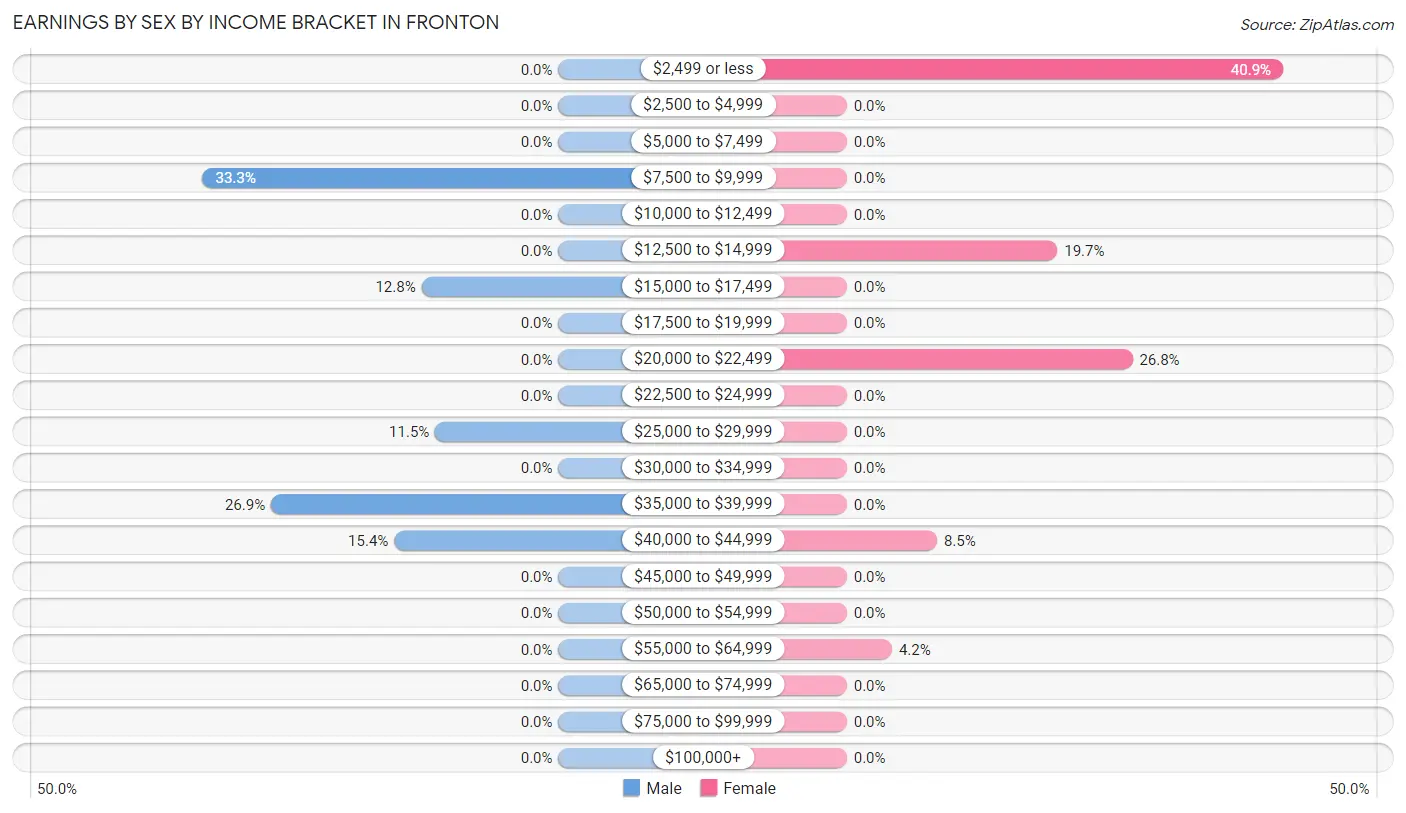
| Income | Male | Female |
| $2,499 or less | 0 (0.0%) | 29 (40.8%) |
| $2,500 to $4,999 | 0 (0.0%) | 0 (0.0%) |
| $5,000 to $7,499 | 0 (0.0%) | 0 (0.0%) |
| $7,500 to $9,999 | 26 (33.3%) | 0 (0.0%) |
| $10,000 to $12,499 | 0 (0.0%) | 0 (0.0%) |
| $12,500 to $14,999 | 0 (0.0%) | 14 (19.7%) |
| $15,000 to $17,499 | 10 (12.8%) | 0 (0.0%) |
| $17,500 to $19,999 | 0 (0.0%) | 0 (0.0%) |
| $20,000 to $22,499 | 0 (0.0%) | 19 (26.8%) |
| $22,500 to $24,999 | 0 (0.0%) | 0 (0.0%) |
| $25,000 to $29,999 | 9 (11.5%) | 0 (0.0%) |
| $30,000 to $34,999 | 0 (0.0%) | 0 (0.0%) |
| $35,000 to $39,999 | 21 (26.9%) | 0 (0.0%) |
| $40,000 to $44,999 | 12 (15.4%) | 6 (8.5%) |
| $45,000 to $49,999 | 0 (0.0%) | 0 (0.0%) |
| $50,000 to $54,999 | 0 (0.0%) | 0 (0.0%) |
| $55,000 to $64,999 | 0 (0.0%) | 3 (4.2%) |
| $65,000 to $74,999 | 0 (0.0%) | 0 (0.0%) |
| $75,000 to $99,999 | 0 (0.0%) | 0 (0.0%) |
| $100,000+ | 0 (0.0%) | 0 (0.0%) |
| Total | 78 (100.0%) | 71 (100.0%) |
Earnings by Sex by Educational Attainment in Fronton
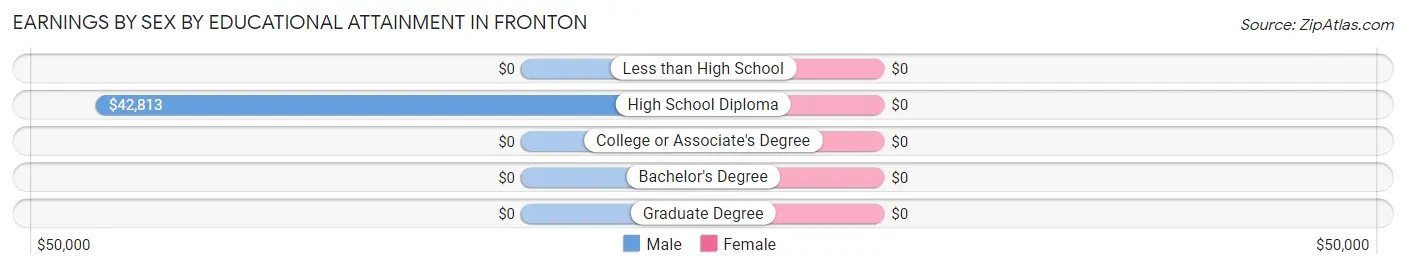
| Educational Attainment | Male Income | Female Income |
| Less than High School | - | - |
| High School Diploma | $42,813 | $0 |
| College or Associate's Degree | - | - |
| Bachelor's Degree | - | - |
| Graduate Degree | - | - |
| Total | $25,833 | $20,526 |
Family Income in Fronton
Family Income Brackets in Fronton
According to the Fronton family income data, there are 19 families falling into the $25,000 to $34,999 income range, which is the most common income bracket and makes up 31.7% of all families.
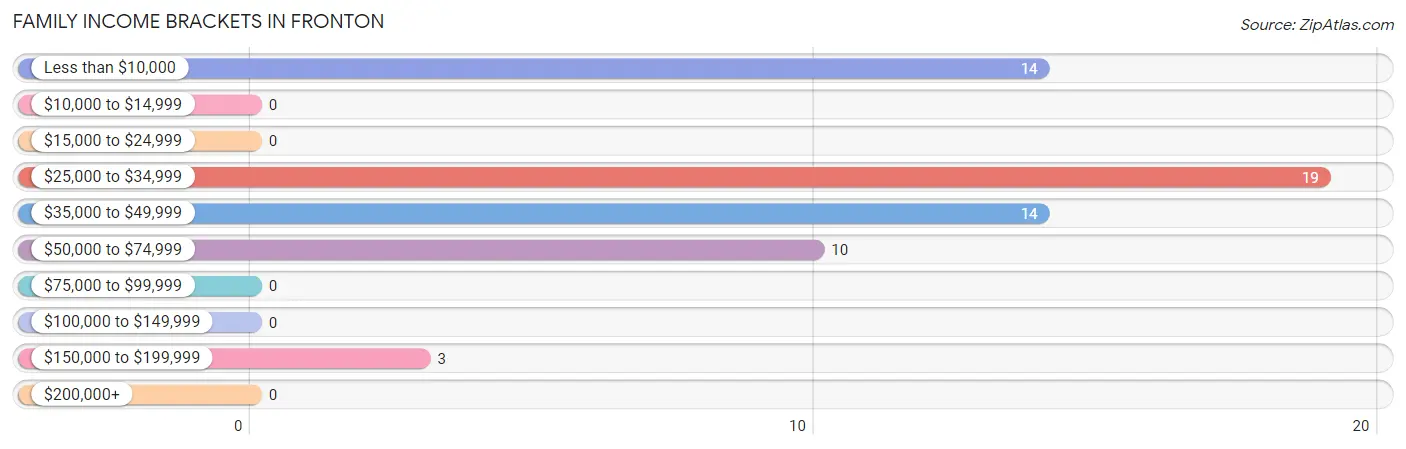
| Income Bracket | # Families | % Families |
| Less than $10,000 | 14 | 23.3% |
| $10,000 to $14,999 | 0 | 0.0% |
| $15,000 to $24,999 | 0 | 0.0% |
| $25,000 to $34,999 | 19 | 31.7% |
| $35,000 to $49,999 | 14 | 23.3% |
| $50,000 to $74,999 | 10 | 16.7% |
| $75,000 to $99,999 | 0 | 0.0% |
| $100,000 to $149,999 | 0 | 0.0% |
| $150,000 to $199,999 | 3 | 5.0% |
| $200,000+ | 0 | 0.0% |
Family Income by Famaliy Size in Fronton
| Income Bracket | # Families | Median Income |
| 2-Person Families | 24 (40.0%) | $0 |
| 3-Person Families | 14 (23.3%) | $0 |
| 4-Person Families | 0 (0.0%) | $0 |
| 5-Person Families | 22 (36.7%) | $0 |
| 6-Person Families | 0 (0.0%) | $0 |
| 7+ Person Families | 0 (0.0%) | $0 |
| Total | 60 (100.0%) | $32,105 |
Family Income by Number of Earners in Fronton
| Number of Earners | # Families | Median Income |
| No Earners | 14 (23.3%) | $0 |
| 1 Earner | 10 (16.7%) | $0 |
| 2 Earners | 14 (23.3%) | $0 |
| 3+ Earners | 22 (36.7%) | $0 |
| Total | 60 (100.0%) | $32,105 |
Household Income in Fronton
Household Income Brackets in Fronton
With 24 households falling in the category, the $50,000 to $74,999 income range is the most frequent in Fronton, accounting for 40.0% of all households.
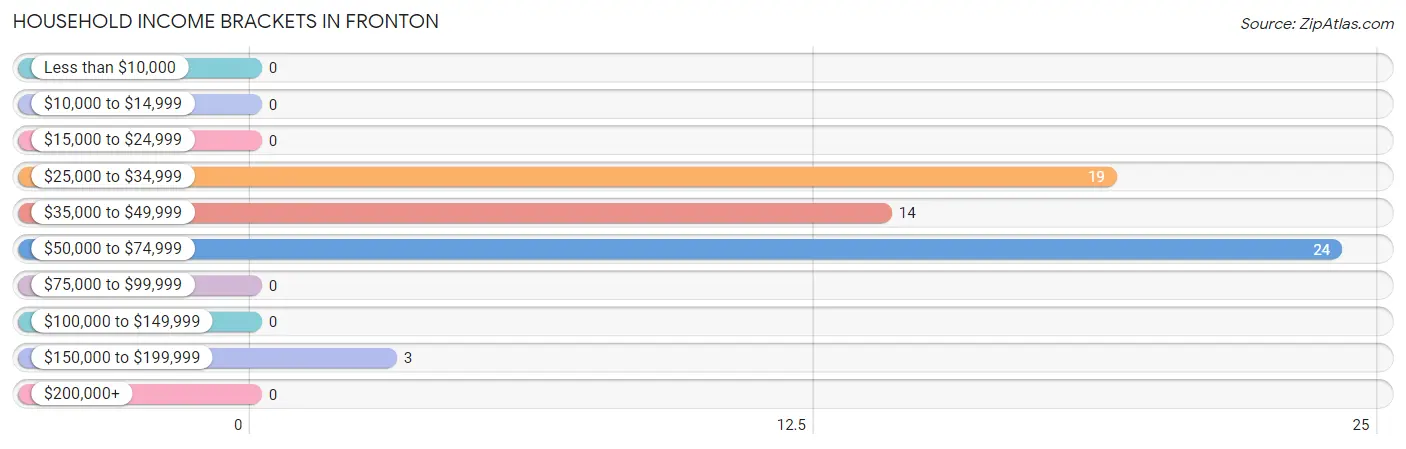
| Income Bracket | # Households | % Households |
| Less than $10,000 | 0 | 0.0% |
| $10,000 to $14,999 | 0 | 0.0% |
| $15,000 to $24,999 | 0 | 0.0% |
| $25,000 to $34,999 | 19 | 31.7% |
| $35,000 to $49,999 | 14 | 23.3% |
| $50,000 to $74,999 | 24 | 40.0% |
| $75,000 to $99,999 | 0 | 0.0% |
| $100,000 to $149,999 | 0 | 0.0% |
| $150,000 to $199,999 | 3 | 5.0% |
| $200,000+ | 0 | 0.0% |
Household Income by Householder Age in Fronton
| Income Bracket | # Households | Median Income |
| 15 to 24 Years | 0 (0.0%) | $0 |
| 25 to 44 Years | 33 (55.0%) | $0 |
| 45 to 64 Years | 17 (28.3%) | $0 |
| 65+ Years | 10 (16.7%) | $0 |
| Total | 60 (100.0%) | $49,464 |
Poverty in Fronton
Income Below Poverty by Sex and Age in Fronton
With 59.4% poverty level for males and 60.3% for females among the residents of Fronton, under 5 year old males and 18 to 24 year old females are the most vulnerable to poverty, with 33 males (100.0%) and 29 females (82.9%) in their respective age groups living below the poverty level.
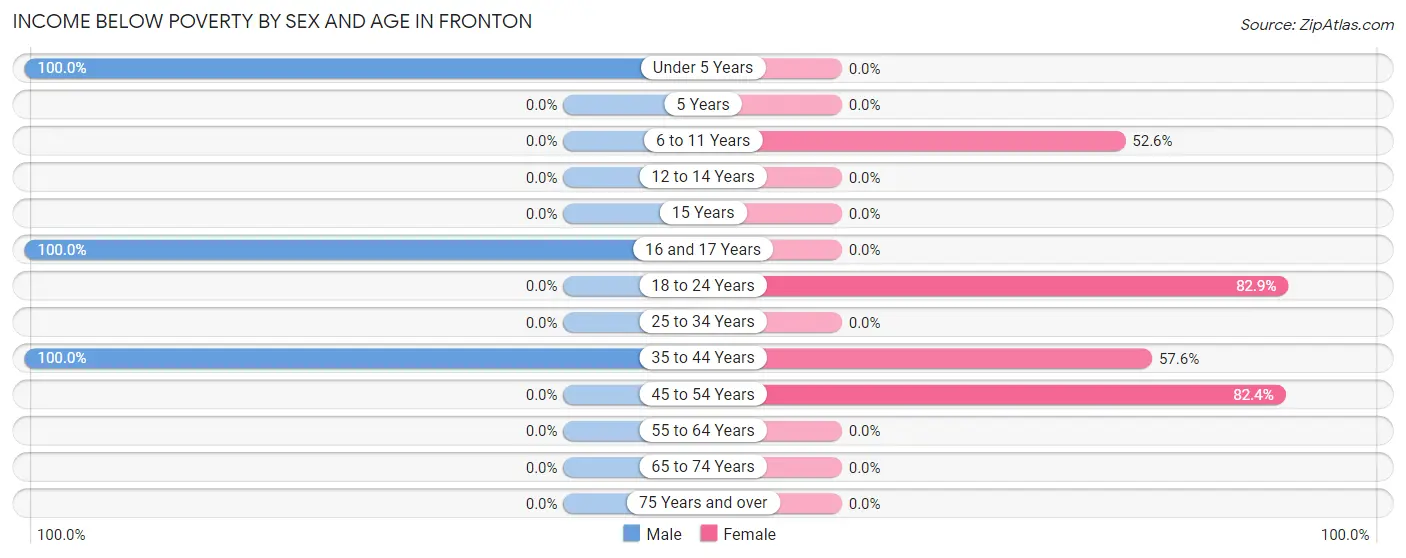
| Age Bracket | Male | Female |
| Under 5 Years | 33 (100.0%) | 0 (0.0%) |
| 5 Years | 0 (0.0%) | 0 (0.0%) |
| 6 to 11 Years | 0 (0.0%) | 20 (52.6%) |
| 12 to 14 Years | 0 (0.0%) | 0 (0.0%) |
| 15 Years | 0 (0.0%) | 0 (0.0%) |
| 16 and 17 Years | 17 (100.0%) | 0 (0.0%) |
| 18 to 24 Years | 0 (0.0%) | 29 (82.9%) |
| 25 to 34 Years | 0 (0.0%) | 0 (0.0%) |
| 35 to 44 Years | 26 (100.0%) | 19 (57.6%) |
| 45 to 54 Years | 0 (0.0%) | 14 (82.4%) |
| 55 to 64 Years | 0 (0.0%) | 0 (0.0%) |
| 65 to 74 Years | 0 (0.0%) | 0 (0.0%) |
| 75 Years and over | 0 (0.0%) | 0 (0.0%) |
| Total | 76 (59.4%) | 82 (60.3%) |
Income Above Poverty by Sex and Age in Fronton
According to the poverty statistics in Fronton, males aged 25 to 34 years and females aged under 5 years are the age groups that are most secure financially, with 100.0% of males and 100.0% of females in these age groups living above the poverty line.
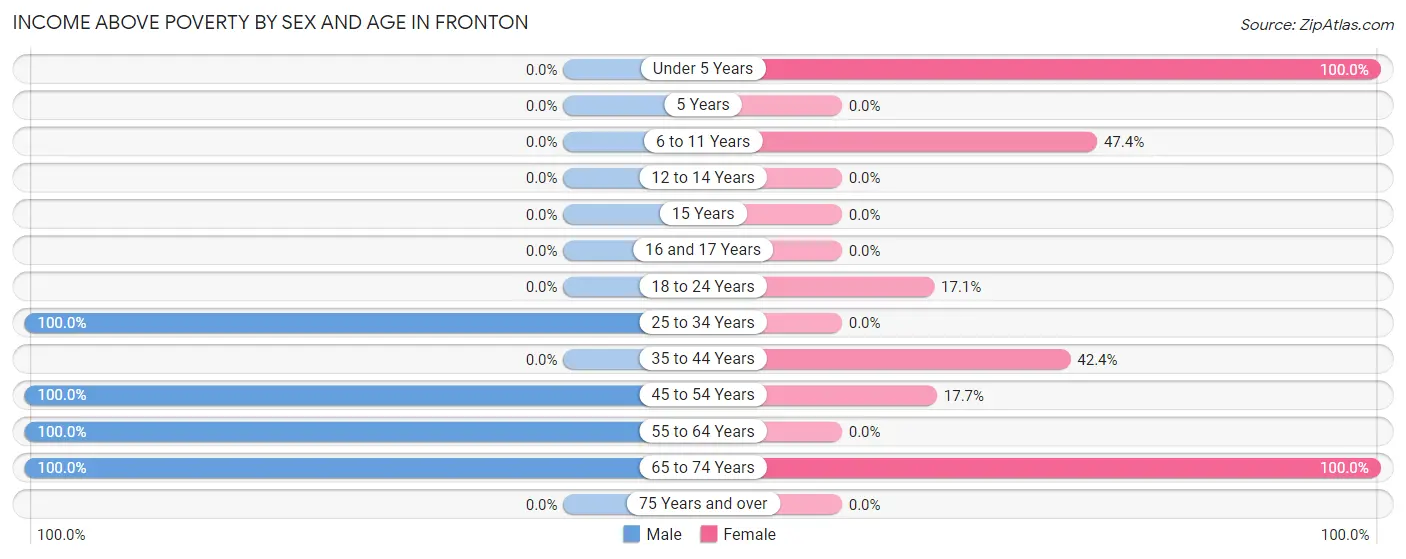
| Age Bracket | Male | Female |
| Under 5 Years | 0 (0.0%) | 6 (100.0%) |
| 5 Years | 0 (0.0%) | 0 (0.0%) |
| 6 to 11 Years | 0 (0.0%) | 18 (47.4%) |
| 12 to 14 Years | 0 (0.0%) | 0 (0.0%) |
| 15 Years | 0 (0.0%) | 0 (0.0%) |
| 16 and 17 Years | 0 (0.0%) | 0 (0.0%) |
| 18 to 24 Years | 0 (0.0%) | 6 (17.1%) |
| 25 to 34 Years | 6 (100.0%) | 0 (0.0%) |
| 35 to 44 Years | 0 (0.0%) | 14 (42.4%) |
| 45 to 54 Years | 24 (100.0%) | 3 (17.6%) |
| 55 to 64 Years | 12 (100.0%) | 0 (0.0%) |
| 65 to 74 Years | 10 (100.0%) | 7 (100.0%) |
| 75 Years and over | 0 (0.0%) | 0 (0.0%) |
| Total | 52 (40.6%) | 54 (39.7%) |
Income Below Poverty Among Married-Couple Families in Fronton
The poverty statistics for married-couple families in Fronton show that 41.3% or 19 of the total 46 families live below the poverty line. Families with 1 or 2 children have the highest poverty rate of 52.8%, comprising of 19 families. On the other hand, families with no children have the lowest poverty rate of 0.0%, which includes 0 families.
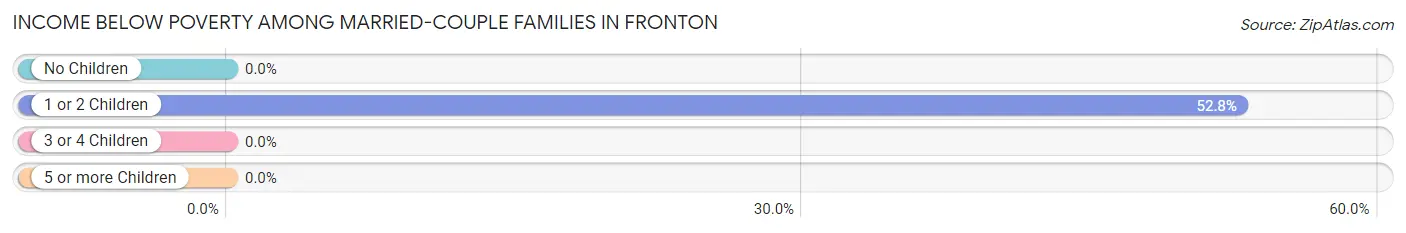
| Children | Above Poverty | Below Poverty |
| No Children | 10 (100.0%) | 0 (0.0%) |
| 1 or 2 Children | 17 (47.2%) | 19 (52.8%) |
| 3 or 4 Children | 0 (0.0%) | 0 (0.0%) |
| 5 or more Children | 0 (0.0%) | 0 (0.0%) |
| Total | 27 (58.7%) | 19 (41.3%) |
Income Below Poverty Among Single-Parent Households in Fronton
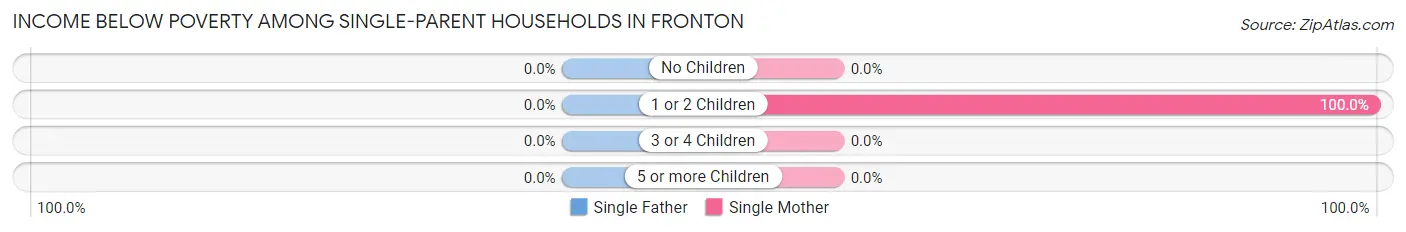
| Children | Single Father | Single Mother |
| No Children | 0 (0.0%) | 0 (0.0%) |
| 1 or 2 Children | 0 (0.0%) | 14 (100.0%) |
| 3 or 4 Children | 0 (0.0%) | 0 (0.0%) |
| 5 or more Children | 0 (0.0%) | 0 (0.0%) |
| Total | 0 (0.0%) | 14 (100.0%) |
Income Below Poverty Among Married-Couple vs Single-Parent Households in Fronton
The poverty data for Fronton shows that 19 of the married-couple family households (41.3%) and 14 of the single-parent households (100.0%) are living below the poverty level. Within the married-couple family households, those with 1 or 2 children have the highest poverty rate, with 19 households (52.8%) falling below the poverty line. Among the single-parent households, those with 1 or 2 children have the highest poverty rate, with 14 household (100.0%) living below poverty.
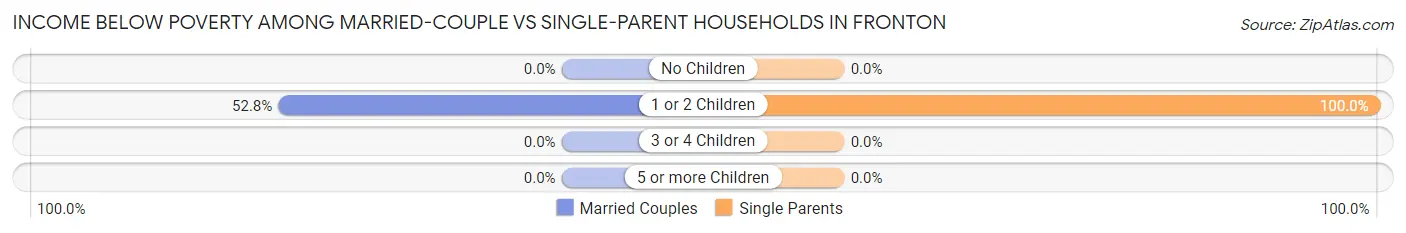
| Children | Married-Couple Families | Single-Parent Households |
| No Children | 0 (0.0%) | 0 (0.0%) |
| 1 or 2 Children | 19 (52.8%) | 14 (100.0%) |
| 3 or 4 Children | 0 (0.0%) | 0 (0.0%) |
| 5 or more Children | 0 (0.0%) | 0 (0.0%) |
| Total | 19 (41.3%) | 14 (100.0%) |
Race in Fronton
The most populous races in Fronton are Hispanic or Latino (264 | 100.0%), White / Caucasian (201 | 76.1%), and Two or more Races (63 | 23.9%).
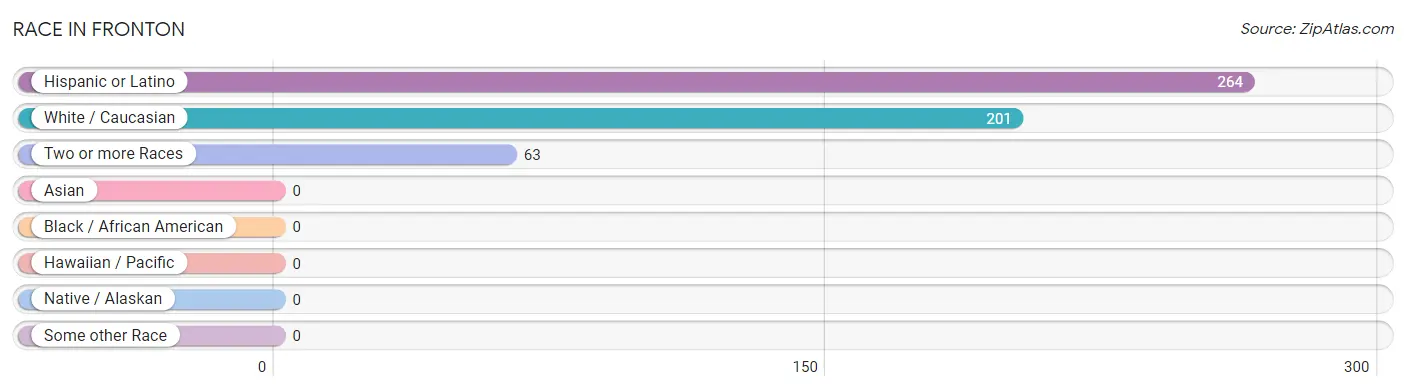
| Race | # Population | % Population |
| Asian | 0 | 0.0% |
| Black / African American | 0 | 0.0% |
| Hawaiian / Pacific | 0 | 0.0% |
| Hispanic or Latino | 264 | 100.0% |
| Native / Alaskan | 0 | 0.0% |
| White / Caucasian | 201 | 76.1% |
| Two or more Races | 63 | 23.9% |
| Some other Race | 0 | 0.0% |
| Total | 264 | 100.0% |
Ancestry in Fronton
The most populous ancestries reported in Fronton are , and Mexican (264 | 100.0%), together accounting for 100.0% of all Fronton residents.

| Ancestry | # Population | % Population |
| Mexican | 264 | 100.0% | View All 1 Rows |
Immigrants in Fronton
The most numerous immigrant groups reported in Fronton came from Central America (72 | 27.3%), Latin America (72 | 27.3%), and Mexico (72 | 27.3%), together accounting for 81.8% of all Fronton residents.
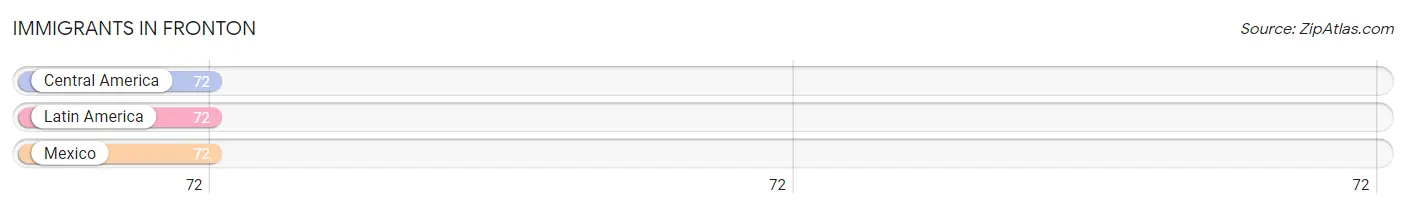
| Immigration Origin | # Population | % Population |
| Central America | 72 | 27.3% |
| Latin America | 72 | 27.3% |
| Mexico | 72 | 27.3% | View All 3 Rows |
Sex and Age in Fronton
Sex and Age in Fronton
The most populous age groups in Fronton are Under 5 Years (33 | 25.8%) for men and 10 to 14 Years (38 | 27.9%) for women.
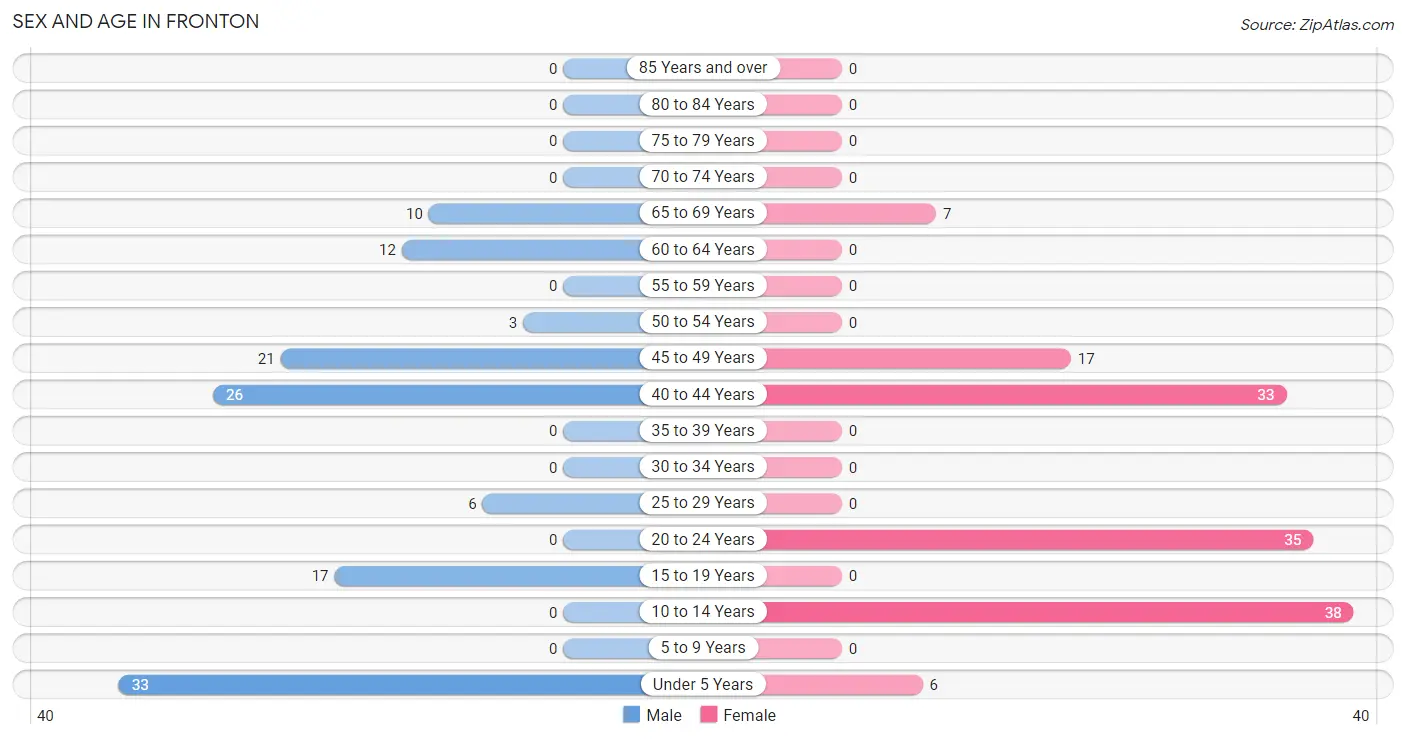
| Age Bracket | Male | Female |
| Under 5 Years | 33 (25.8%) | 6 (4.4%) |
| 5 to 9 Years | 0 (0.0%) | 0 (0.0%) |
| 10 to 14 Years | 0 (0.0%) | 38 (27.9%) |
| 15 to 19 Years | 17 (13.3%) | 0 (0.0%) |
| 20 to 24 Years | 0 (0.0%) | 35 (25.7%) |
| 25 to 29 Years | 6 (4.7%) | 0 (0.0%) |
| 30 to 34 Years | 0 (0.0%) | 0 (0.0%) |
| 35 to 39 Years | 0 (0.0%) | 0 (0.0%) |
| 40 to 44 Years | 26 (20.3%) | 33 (24.3%) |
| 45 to 49 Years | 21 (16.4%) | 17 (12.5%) |
| 50 to 54 Years | 3 (2.3%) | 0 (0.0%) |
| 55 to 59 Years | 0 (0.0%) | 0 (0.0%) |
| 60 to 64 Years | 12 (9.4%) | 0 (0.0%) |
| 65 to 69 Years | 10 (7.8%) | 7 (5.1%) |
| 70 to 74 Years | 0 (0.0%) | 0 (0.0%) |
| 75 to 79 Years | 0 (0.0%) | 0 (0.0%) |
| 80 to 84 Years | 0 (0.0%) | 0 (0.0%) |
| 85 Years and over | 0 (0.0%) | 0 (0.0%) |
| Total | 128 (100.0%) | 136 (100.0%) |
Families and Households in Fronton
Median Family Size in Fronton
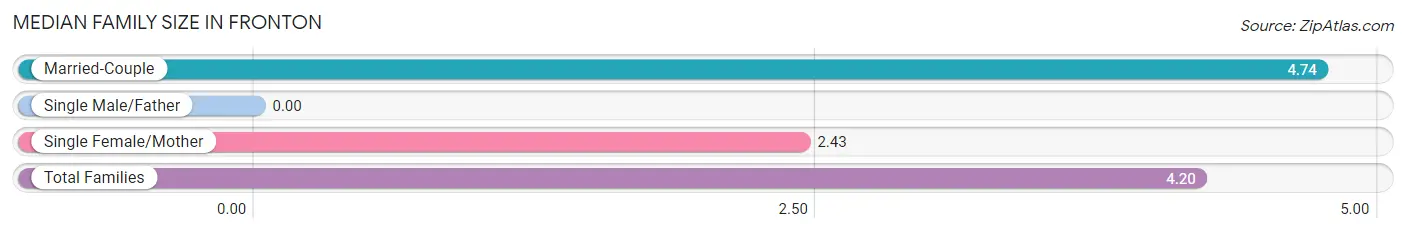
| Family Type | # Families | Family Size |
| Married-Couple | 46 (76.7%) | 4.74 |
| Single Male/Father | 0 (0.0%) | - |
| Single Female/Mother | 14 (23.3%) | 2.43 |
| Total Families | 60 (100.0%) | 4.20 |
Median Household Size in Fronton
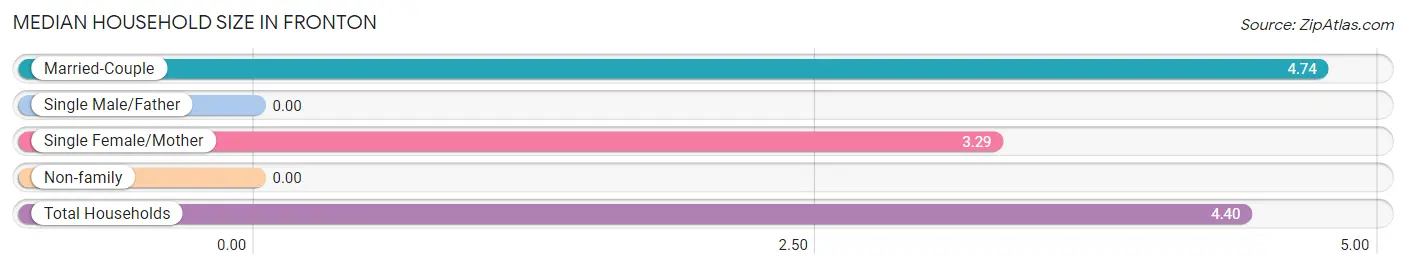
| Household Type | # Households | Household Size |
| Married-Couple | 46 (76.7%) | 4.74 |
| Single Male/Father | 0 (0.0%) | - |
| Single Female/Mother | 14 (23.3%) | 3.29 |
| Non-family | 0 (0.0%) | - |
| Total Households | 60 (100.0%) | 4.40 |
Household Size by Marriage Status in Fronton
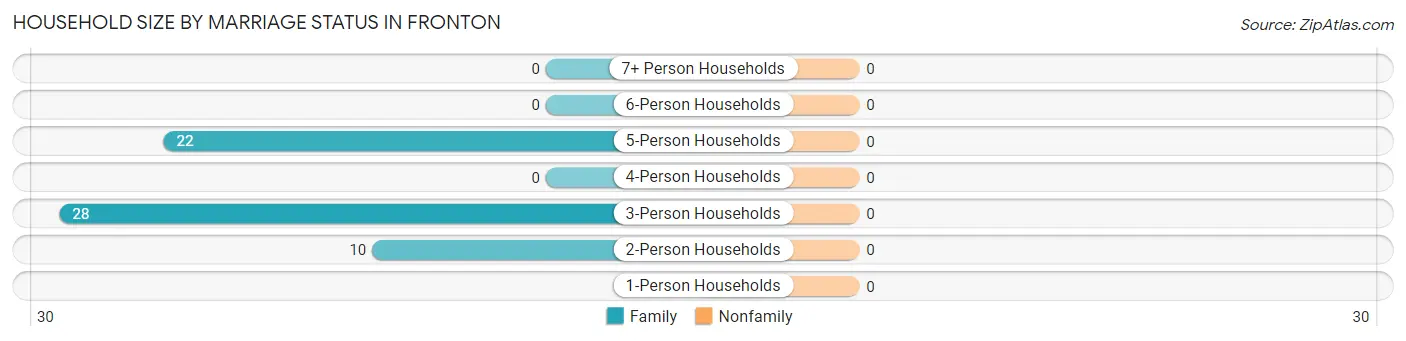
| Household Size | Family Households | Nonfamily Households |
| 1-Person Households | - | 0 (0.0%) |
| 2-Person Households | 10 (16.7%) | 0 (0.0%) |
| 3-Person Households | 28 (46.7%) | 0 (0.0%) |
| 4-Person Households | 0 (0.0%) | 0 (0.0%) |
| 5-Person Households | 22 (36.7%) | 0 (0.0%) |
| 6-Person Households | 0 (0.0%) | 0 (0.0%) |
| 7+ Person Households | 0 (0.0%) | 0 (0.0%) |
| Total | 60 (100.0%) | 0 (0.0%) |
Female Fertility in Fronton
Fertility by Age in Fronton
Average fertility rate in Fronton is 341.0 births per 1,000 women. Women in the age bracket of 20 to 34 years have the highest fertility rate with 829.0 births per 1,000 women. Women in the age bracket of 20 to 34 years acount for 100.0% of all women with births.
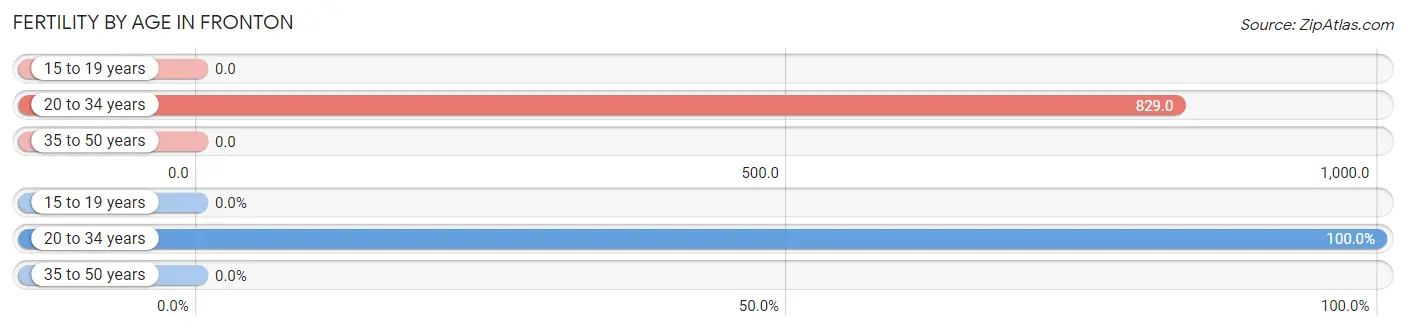
| Age Bracket | Women with Births | Births / 1,000 Women |
| 15 to 19 years | 0 (0.0%) | 0.0 |
| 20 to 34 years | 29 (100.0%) | 829.0 |
| 35 to 50 years | 0 (0.0%) | 0.0 |
| Total | 29 (100.0%) | 341.0 |
Fertility by Age by Marriage Status in Fronton
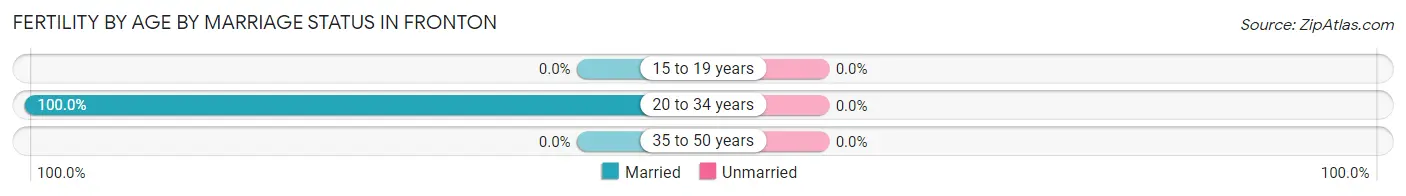
| Age Bracket | Married | Unmarried |
| 15 to 19 years | 0 (0.0%) | 0 (0.0%) |
| 20 to 34 years | 29 (100.0%) | 0 (0.0%) |
| 35 to 50 years | 0 (0.0%) | 0 (0.0%) |
| Total | 29 (100.0%) | 0 (0.0%) |
Fertility by Education in Fronton
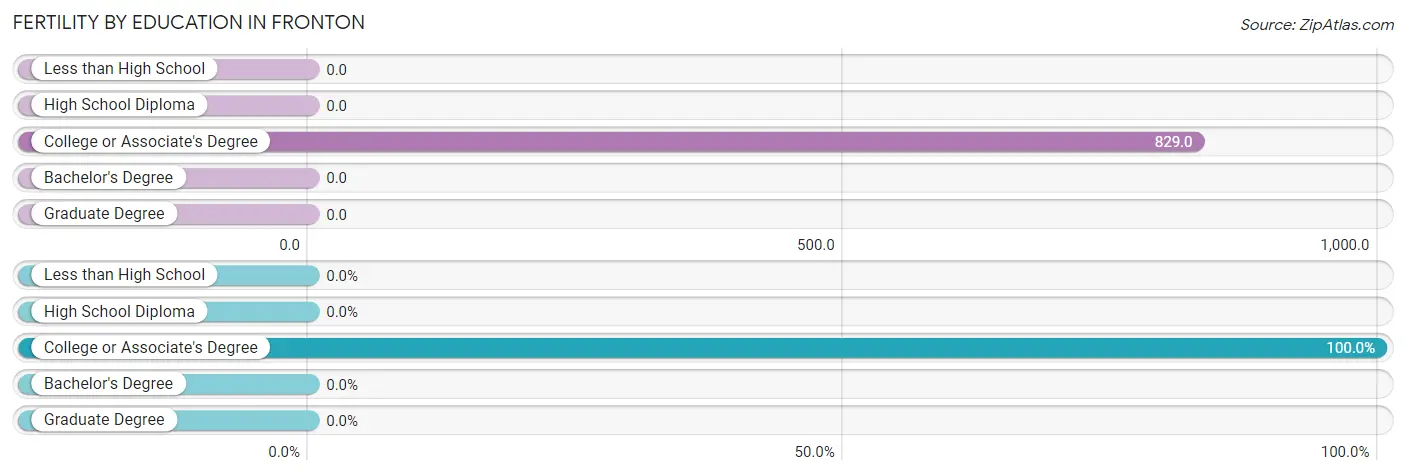
| Educational Attainment | Women with Births | Births / 1,000 Women |
| Less than High School | 0 (0.0%) | 0.0 |
| High School Diploma | 0 (0.0%) | 0.0 |
| College or Associate's Degree | 29 (100.0%) | 829.0 |
| Bachelor's Degree | 0 (0.0%) | 0.0 |
| Graduate Degree | 0 (0.0%) | 0.0 |
| Total | 29 (100.0%) | 341.0 |
Fertility by Education by Marriage Status in Fronton
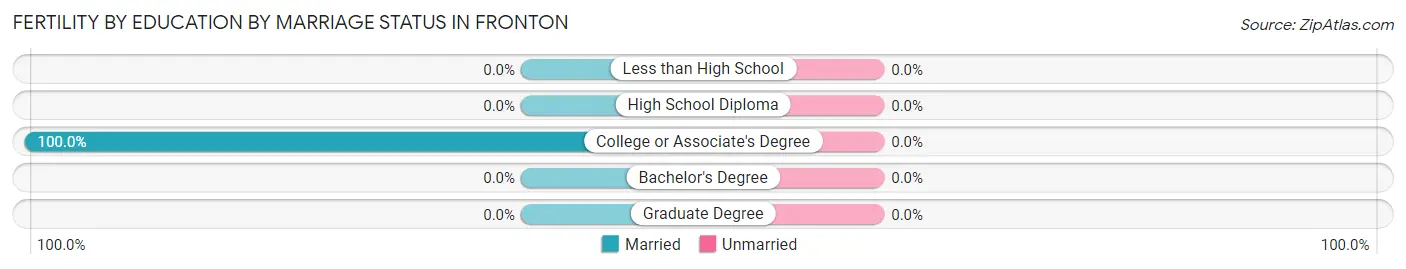
| Educational Attainment | Married | Unmarried |
| Less than High School | 0 (0.0%) | 0 (0.0%) |
| High School Diploma | 0 (0.0%) | 0 (0.0%) |
| College or Associate's Degree | 29 (100.0%) | 0 (0.0%) |
| Bachelor's Degree | 0 (0.0%) | 0 (0.0%) |
| Graduate Degree | 0 (0.0%) | 0 (0.0%) |
| Total | 29 (100.0%) | 0 (0.0%) |
Employment Characteristics in Fronton
Employment by Class of Employer in Fronton
Among the 117 employed individuals in Fronton, private company employees (80 | 68.4%), self-employed (not incorporated) (12 | 10.3%), and not-for-profit organizations (12 | 10.3%) make up the most common classes of employment.
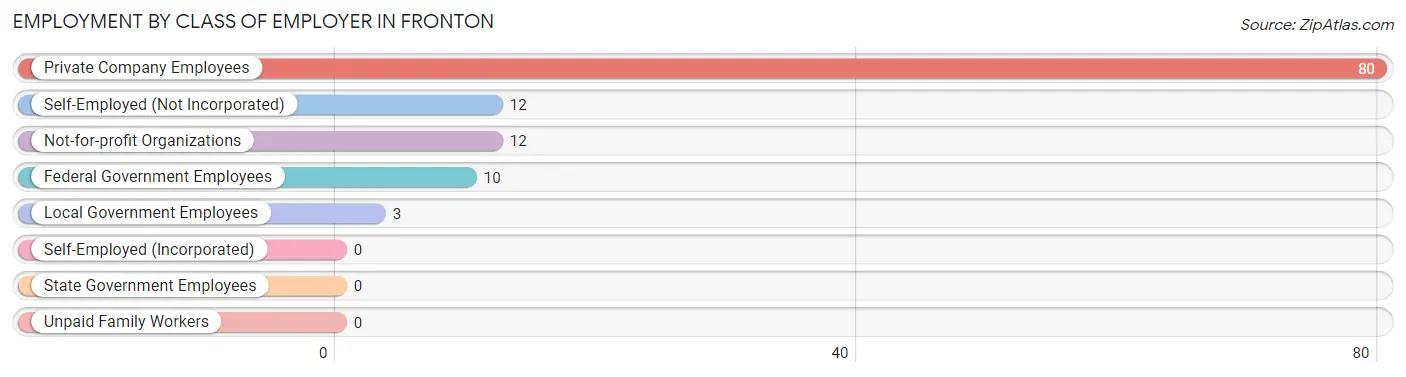
| Employer Class | # Employees | % Employees |
| Private Company Employees | 80 | 68.4% |
| Self-Employed (Incorporated) | 0 | 0.0% |
| Self-Employed (Not Incorporated) | 12 | 10.3% |
| Not-for-profit Organizations | 12 | 10.3% |
| Local Government Employees | 3 | 2.6% |
| State Government Employees | 0 | 0.0% |
| Federal Government Employees | 10 | 8.6% |
| Unpaid Family Workers | 0 | 0.0% |
| Total | 117 | 100.0% |
Employment Status by Age in Fronton
According to the labor force statistics for Fronton, out of the total population over 16 years of age (187), 79.7% or 149 individuals are in the labor force, with 19.5% or 29 of them unemployed. The age group with the highest labor force participation rate is 20 to 24 years, with 100.0% or 35 individuals in the labor force. Within the labor force, the 20 to 24 years age range has the highest percentage of unemployed individuals, with 82.9% or 29 of them being unemployed.
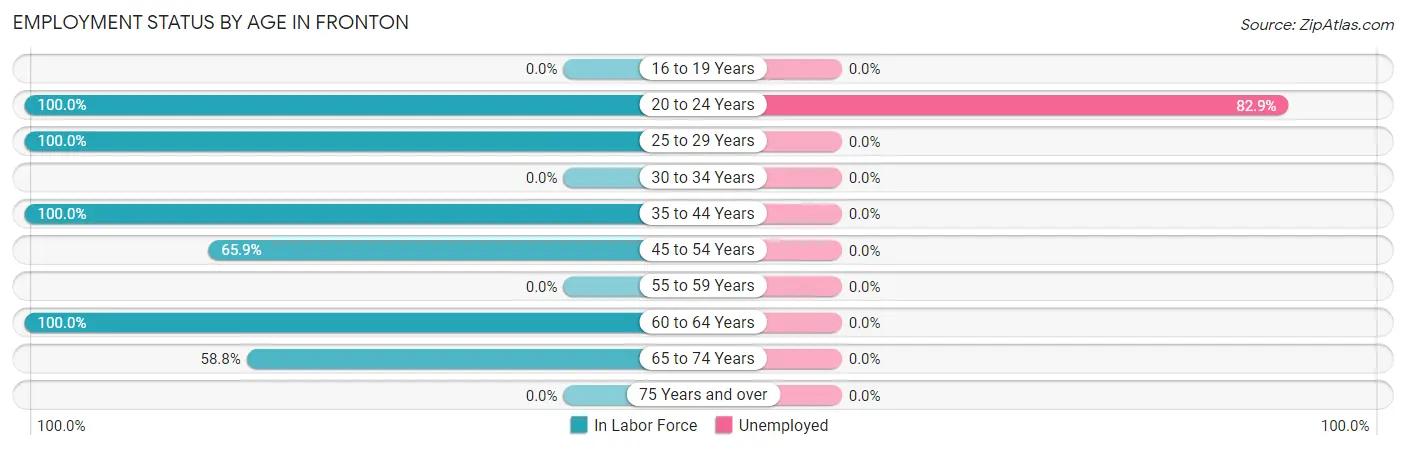
| Age Bracket | In Labor Force | Unemployed |
| 16 to 19 Years | 0 (0.0%) | 0 (0.0%) |
| 20 to 24 Years | 35 (100.0%) | 29 (82.9%) |
| 25 to 29 Years | 6 (100.0%) | 0 (0.0%) |
| 30 to 34 Years | 0 (0.0%) | 0 (0.0%) |
| 35 to 44 Years | 59 (100.0%) | 0 (0.0%) |
| 45 to 54 Years | 27 (65.9%) | 0 (0.0%) |
| 55 to 59 Years | 0 (0.0%) | 0 (0.0%) |
| 60 to 64 Years | 12 (100.0%) | 0 (0.0%) |
| 65 to 74 Years | 10 (58.8%) | 0 (0.0%) |
| 75 Years and over | 0 (0.0%) | 0 (0.0%) |
| Total | 149 (79.7%) | 29 (19.5%) |
Employment Status by Educational Attainment in Fronton
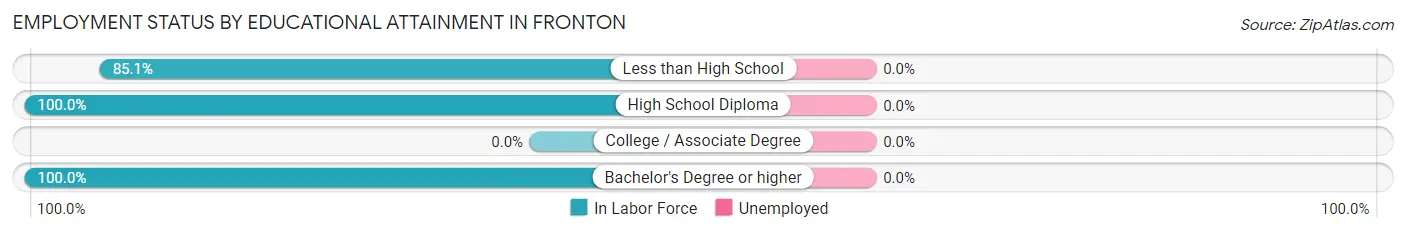
| Educational Attainment | In Labor Force | Unemployed |
| Less than High School | 80 (85.1%) | 0 (0.0%) |
| High School Diploma | 21 (100.0%) | 0 (0.0%) |
| College / Associate Degree | 0 (0.0%) | 0 (0.0%) |
| Bachelor's Degree or higher | 3 (100.0%) | 0 (0.0%) |
| Total | 104 (88.1%) | 0 (0.0%) |
Employment Occupations by Sex in Fronton
Management, Business, Science and Arts Occupations
The most common Management, Business, Science and Arts occupations in Fronton are Health Diagnosing & Treating (16 | 13.3%), Health Technologists (10 | 8.3%), Community & Social Service (3 | 2.5%), and Education Instruction & Library (3 | 2.5%).
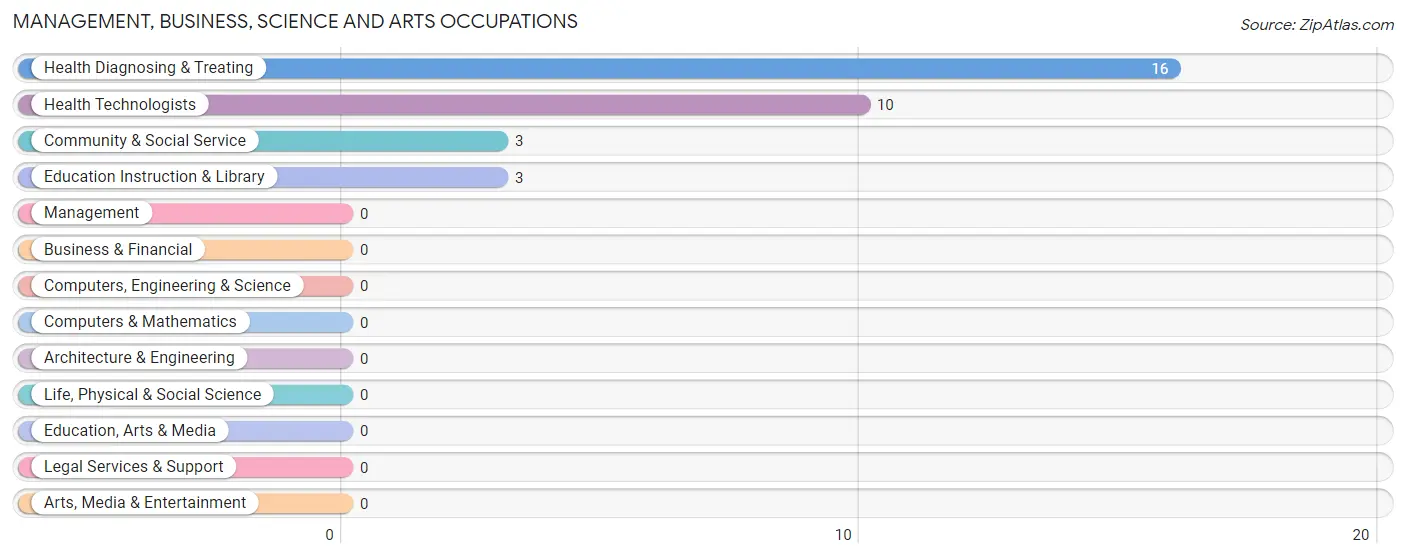
Management, Business, Science and Arts Occupations by Sex
Within the Management, Business, Science and Arts occupations in Fronton, the most male-oriented occupations are Health Technologists (100.0%), and Health Diagnosing & Treating (62.5%), while the most female-oriented occupations are Community & Social Service (100.0%), Education Instruction & Library (100.0%), and Health Diagnosing & Treating (37.5%).
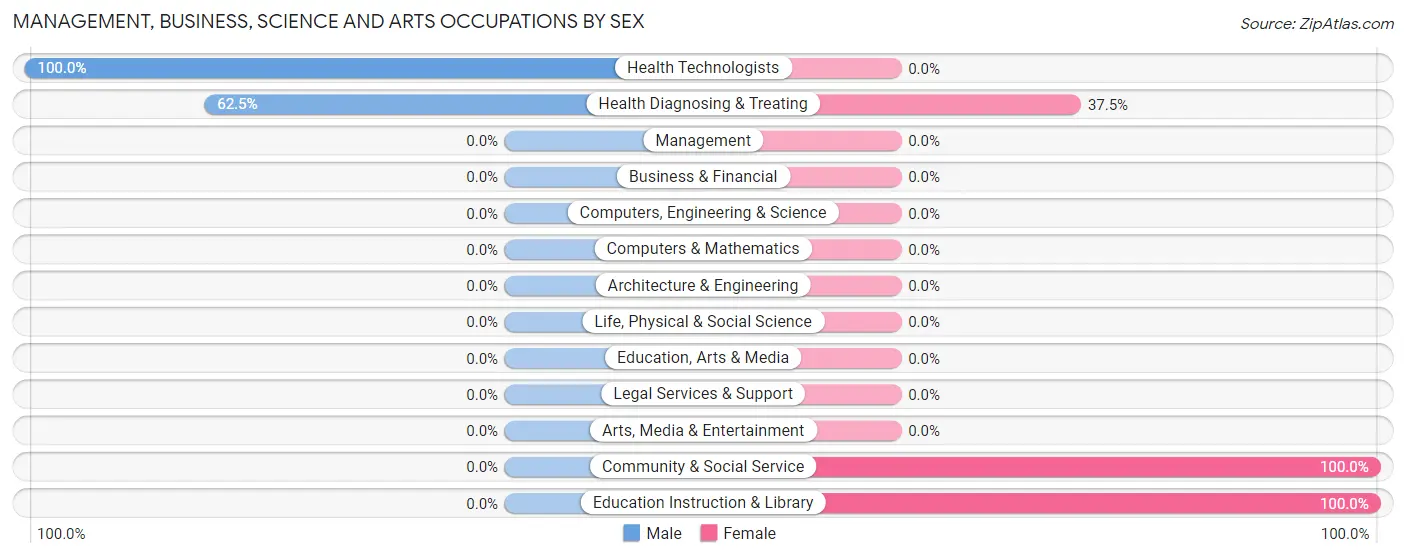
| Occupation | Male | Female |
| Management | 0 (0.0%) | 0 (0.0%) |
| Business & Financial | 0 (0.0%) | 0 (0.0%) |
| Computers, Engineering & Science | 0 (0.0%) | 0 (0.0%) |
| Computers & Mathematics | 0 (0.0%) | 0 (0.0%) |
| Architecture & Engineering | 0 (0.0%) | 0 (0.0%) |
| Life, Physical & Social Science | 0 (0.0%) | 0 (0.0%) |
| Community & Social Service | 0 (0.0%) | 3 (100.0%) |
| Education, Arts & Media | 0 (0.0%) | 0 (0.0%) |
| Legal Services & Support | 0 (0.0%) | 0 (0.0%) |
| Education Instruction & Library | 0 (0.0%) | 3 (100.0%) |
| Arts, Media & Entertainment | 0 (0.0%) | 0 (0.0%) |
| Health Diagnosing & Treating | 10 (62.5%) | 6 (37.5%) |
| Health Technologists | 10 (100.0%) | 0 (0.0%) |
| Total (Category) | 10 (52.6%) | 9 (47.4%) |
| Total (Overall) | 78 (65.0%) | 42 (35.0%) |
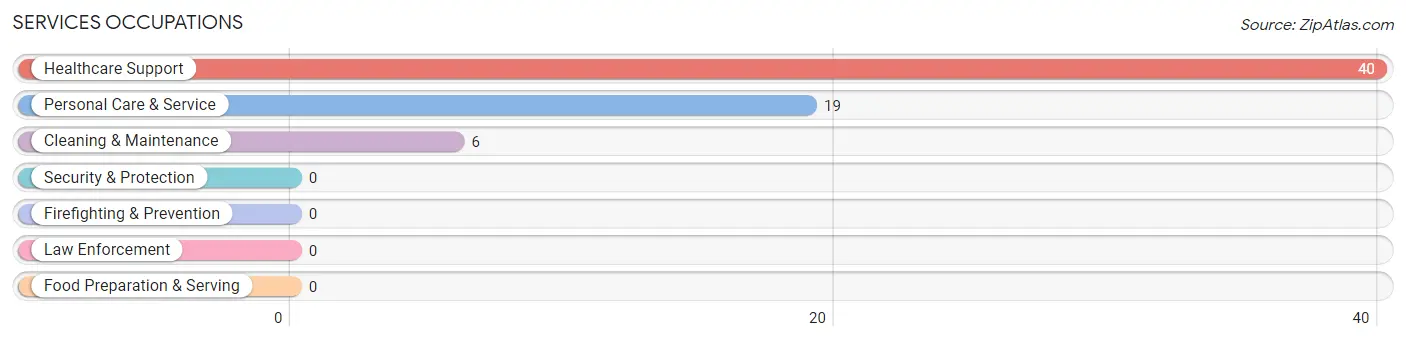
Services Occupations
The most common Services occupations in Fronton are Healthcare Support (40 | 33.3%), Personal Care & Service (19 | 15.8%), and Cleaning & Maintenance (6 | 5.0%).
Services Occupations by Sex
Within the Services occupations in Fronton, the most male-oriented occupations are Cleaning & Maintenance (100.0%), and Healthcare Support (65.0%), while the most female-oriented occupations are Personal Care & Service (100.0%), and Healthcare Support (35.0%).
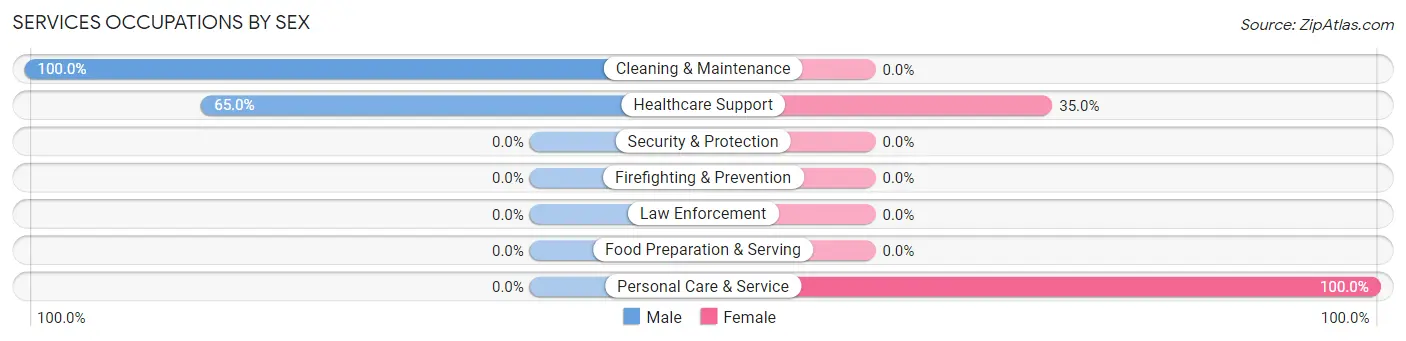
| Occupation | Male | Female |
| Healthcare Support | 26 (65.0%) | 14 (35.0%) |
| Security & Protection | 0 (0.0%) | 0 (0.0%) |
| Firefighting & Prevention | 0 (0.0%) | 0 (0.0%) |
| Law Enforcement | 0 (0.0%) | 0 (0.0%) |
| Food Preparation & Serving | 0 (0.0%) | 0 (0.0%) |
| Cleaning & Maintenance | 6 (100.0%) | 0 (0.0%) |
| Personal Care & Service | 0 (0.0%) | 19 (100.0%) |
| Total (Category) | 32 (49.2%) | 33 (50.8%) |
| Total (Overall) | 78 (65.0%) | 42 (35.0%) |
Sales and Office Occupations
The most common Sales and Office occupations in Fronton are , and Sales & Related (12 | 10.0%).
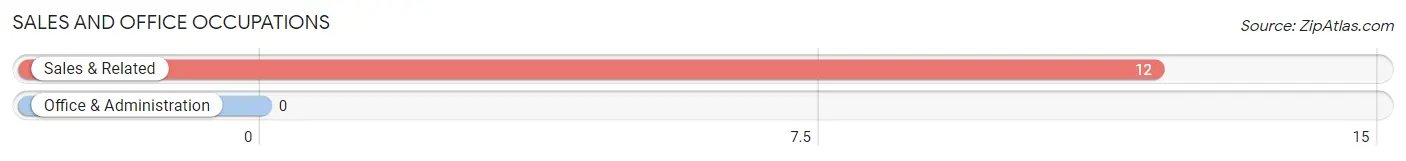
Sales and Office Occupations by Sex

| Occupation | Male | Female |
| Sales & Related | 12 (100.0%) | 0 (0.0%) |
| Office & Administration | 0 (0.0%) | 0 (0.0%) |
| Total (Category) | 12 (100.0%) | 0 (0.0%) |
| Total (Overall) | 78 (65.0%) | 42 (35.0%) |
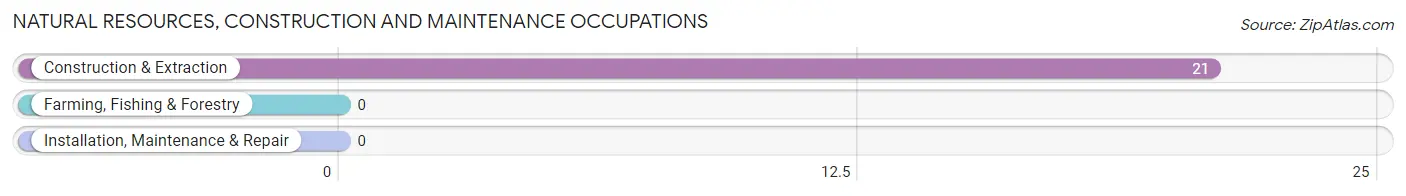
Natural Resources, Construction and Maintenance Occupations
The most common Natural Resources, Construction and Maintenance occupations in Fronton are , and Construction & Extraction (21 | 17.5%).
Natural Resources, Construction and Maintenance Occupations by Sex
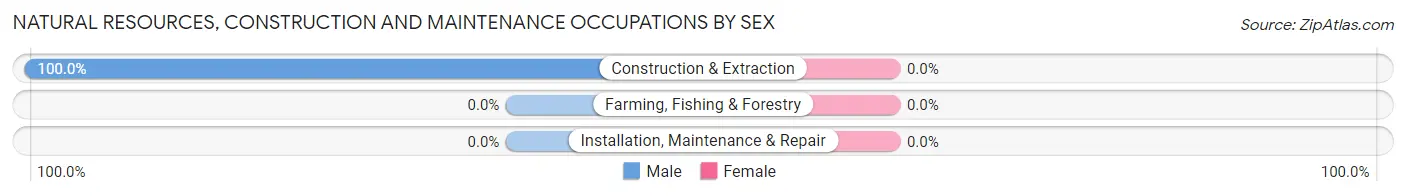
| Occupation | Male | Female |
| Farming, Fishing & Forestry | 0 (0.0%) | 0 (0.0%) |
| Construction & Extraction | 21 (100.0%) | 0 (0.0%) |
| Installation, Maintenance & Repair | 0 (0.0%) | 0 (0.0%) |
| Total (Category) | 21 (100.0%) | 0 (0.0%) |
| Total (Overall) | 78 (65.0%) | 42 (35.0%) |
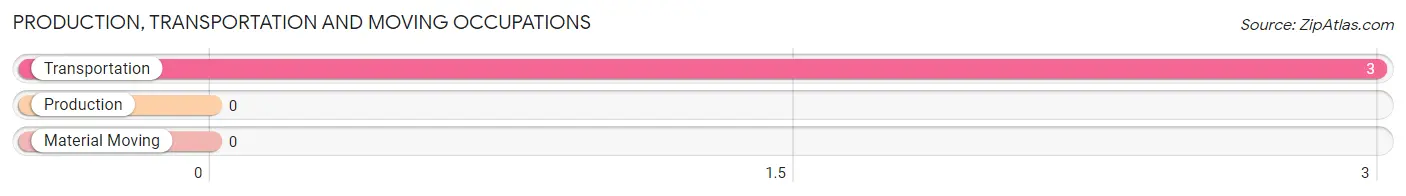
Production, Transportation and Moving Occupations
The most common Production, Transportation and Moving occupations in Fronton are , and Transportation (3 | 2.5%).
Production, Transportation and Moving Occupations by Sex
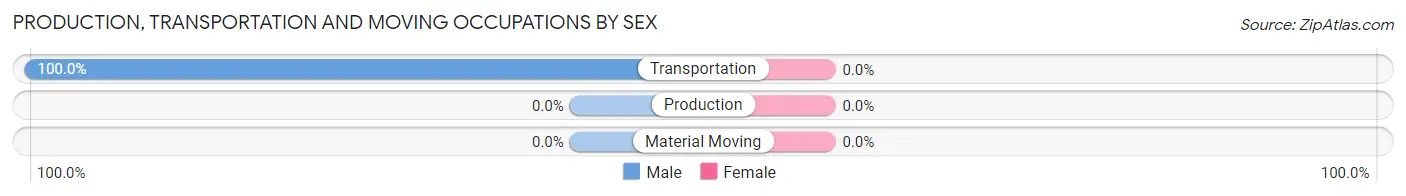
| Occupation | Male | Female |
| Production | 0 (0.0%) | 0 (0.0%) |
| Transportation | 3 (100.0%) | 0 (0.0%) |
| Material Moving | 0 (0.0%) | 0 (0.0%) |
| Total (Category) | 3 (100.0%) | 0 (0.0%) |
| Total (Overall) | 78 (65.0%) | 42 (35.0%) |
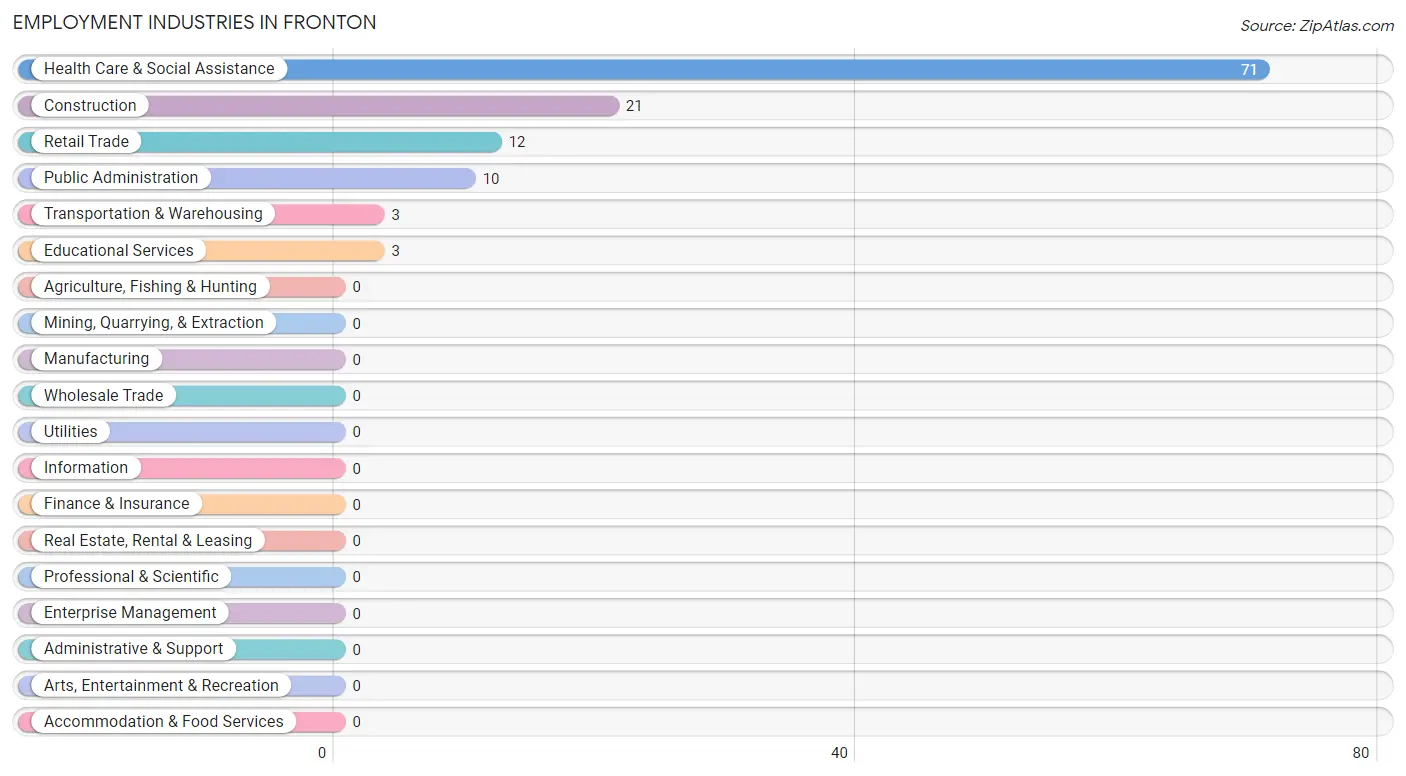
Employment Industries by Sex in Fronton
Employment Industries in Fronton
The major employment industries in Fronton include Health Care & Social Assistance (71 | 59.2%), Construction (21 | 17.5%), Retail Trade (12 | 10.0%), Public Administration (10 | 8.3%), and Transportation & Warehousing (3 | 2.5%).
Employment Industries by Sex in Fronton
The Fronton industries that see more men than women are Construction (100.0%), Retail Trade (100.0%), and Transportation & Warehousing (100.0%), whereas the industries that tend to have a higher number of women are Educational Services (100.0%), and Health Care & Social Assistance (54.9%).
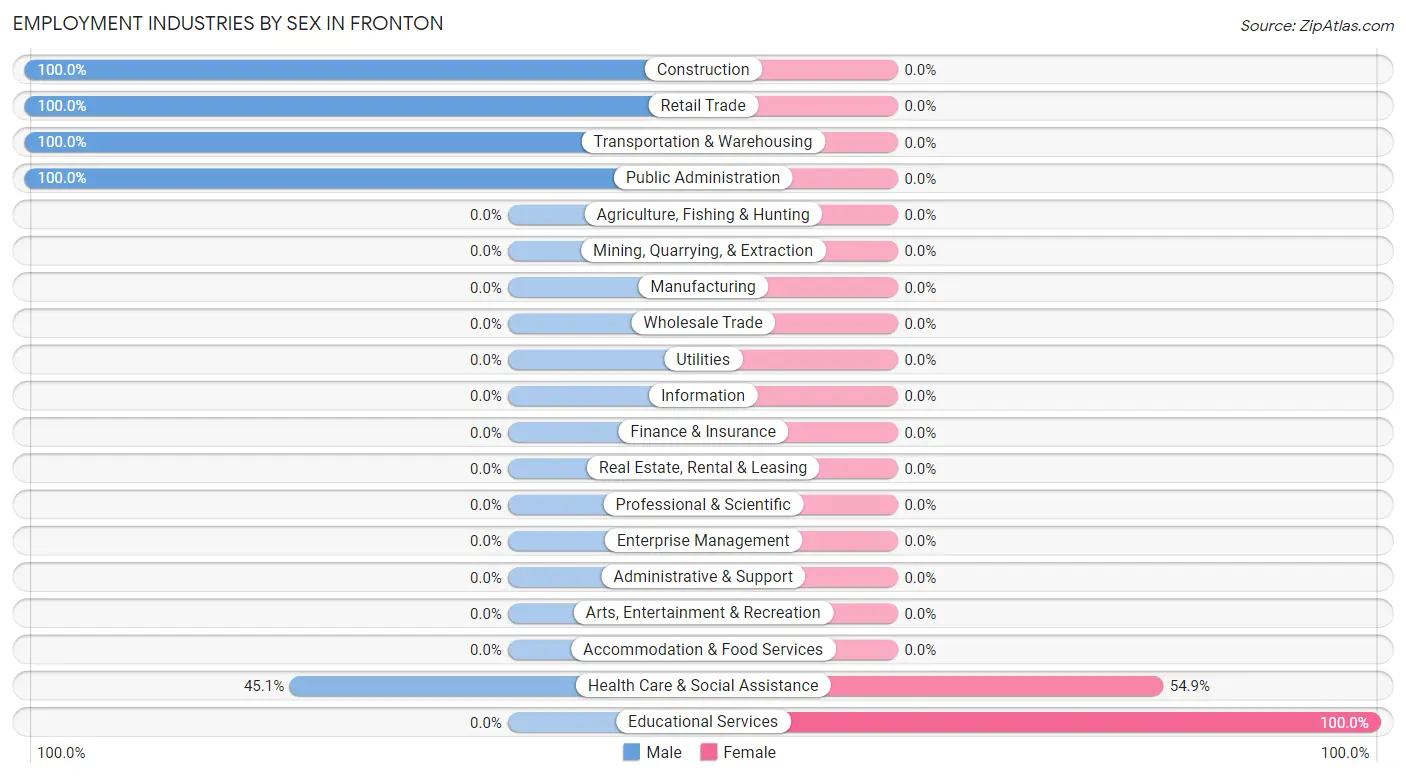
| Industry | Male | Female |
| Agriculture, Fishing & Hunting | 0 (0.0%) | 0 (0.0%) |
| Mining, Quarrying, & Extraction | 0 (0.0%) | 0 (0.0%) |
| Construction | 21 (100.0%) | 0 (0.0%) |
| Manufacturing | 0 (0.0%) | 0 (0.0%) |
| Wholesale Trade | 0 (0.0%) | 0 (0.0%) |
| Retail Trade | 12 (100.0%) | 0 (0.0%) |
| Transportation & Warehousing | 3 (100.0%) | 0 (0.0%) |
| Utilities | 0 (0.0%) | 0 (0.0%) |
| Information | 0 (0.0%) | 0 (0.0%) |
| Finance & Insurance | 0 (0.0%) | 0 (0.0%) |
| Real Estate, Rental & Leasing | 0 (0.0%) | 0 (0.0%) |
| Professional & Scientific | 0 (0.0%) | 0 (0.0%) |
| Enterprise Management | 0 (0.0%) | 0 (0.0%) |
| Administrative & Support | 0 (0.0%) | 0 (0.0%) |
| Educational Services | 0 (0.0%) | 3 (100.0%) |
| Health Care & Social Assistance | 32 (45.1%) | 39 (54.9%) |
| Arts, Entertainment & Recreation | 0 (0.0%) | 0 (0.0%) |
| Accommodation & Food Services | 0 (0.0%) | 0 (0.0%) |
| Public Administration | 10 (100.0%) | 0 (0.0%) |
| Total | 78 (65.0%) | 42 (35.0%) |
Education in Fronton
School Enrollment in Fronton
The most common levels of schooling among the 84 students in Fronton are college / undergraduate (29 | 34.5%), elementary school (20 | 23.8%), and middle school (18 | 21.4%).
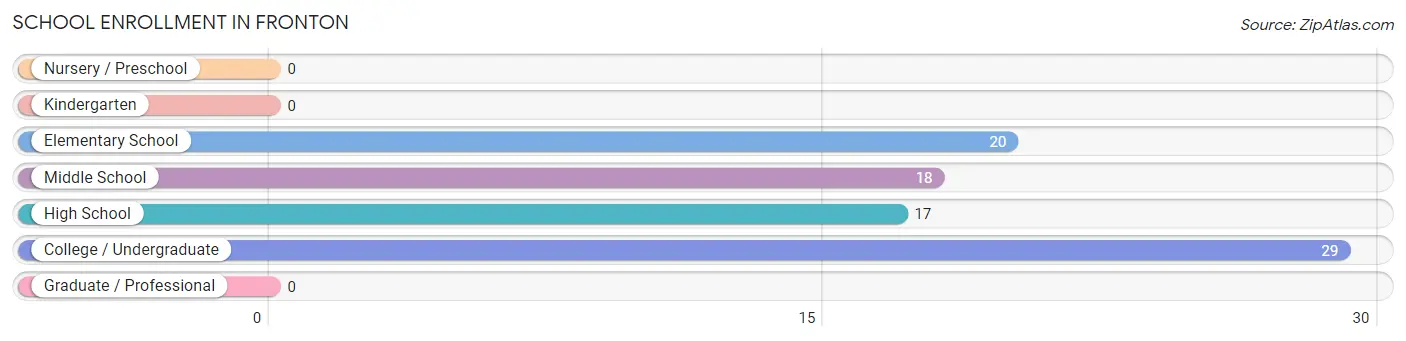
| School Level | # Students | % Students |
| Nursery / Preschool | 0 | 0.0% |
| Kindergarten | 0 | 0.0% |
| Elementary School | 20 | 23.8% |
| Middle School | 18 | 21.4% |
| High School | 17 | 20.2% |
| College / Undergraduate | 29 | 34.5% |
| Graduate / Professional | 0 | 0.0% |
| Total | 84 | 100.0% |
School Enrollment by Age by Funding Source in Fronton
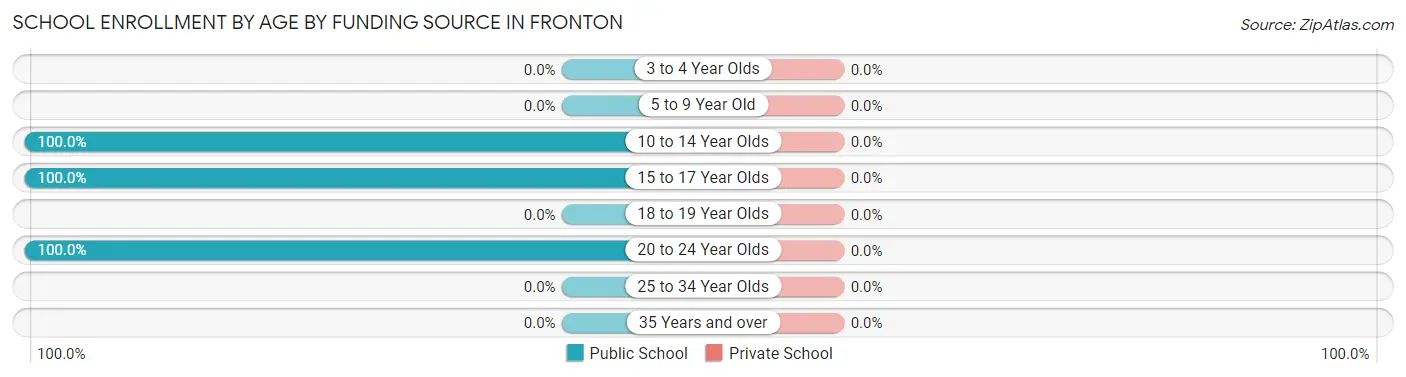
| Age Bracket | Public School | Private School |
| 3 to 4 Year Olds | 0 (0.0%) | 0 (0.0%) |
| 5 to 9 Year Old | 0 (0.0%) | 0 (0.0%) |
| 10 to 14 Year Olds | 38 (100.0%) | 0 (0.0%) |
| 15 to 17 Year Olds | 17 (100.0%) | 0 (0.0%) |
| 18 to 19 Year Olds | 0 (0.0%) | 0 (0.0%) |
| 20 to 24 Year Olds | 29 (100.0%) | 0 (0.0%) |
| 25 to 34 Year Olds | 0 (0.0%) | 0 (0.0%) |
| 35 Years and over | 0 (0.0%) | 0 (0.0%) |
| Total | 84 (100.0%) | 0 (0.0%) |
Educational Attainment by Field of Study in Fronton
Science & technology (10 | 50.0%), education (7 | 35.0%), and multidisciplinary studies (3 | 15.0%) are the most common fields of study among 20 individuals in Fronton who have obtained a bachelor's degree or higher.
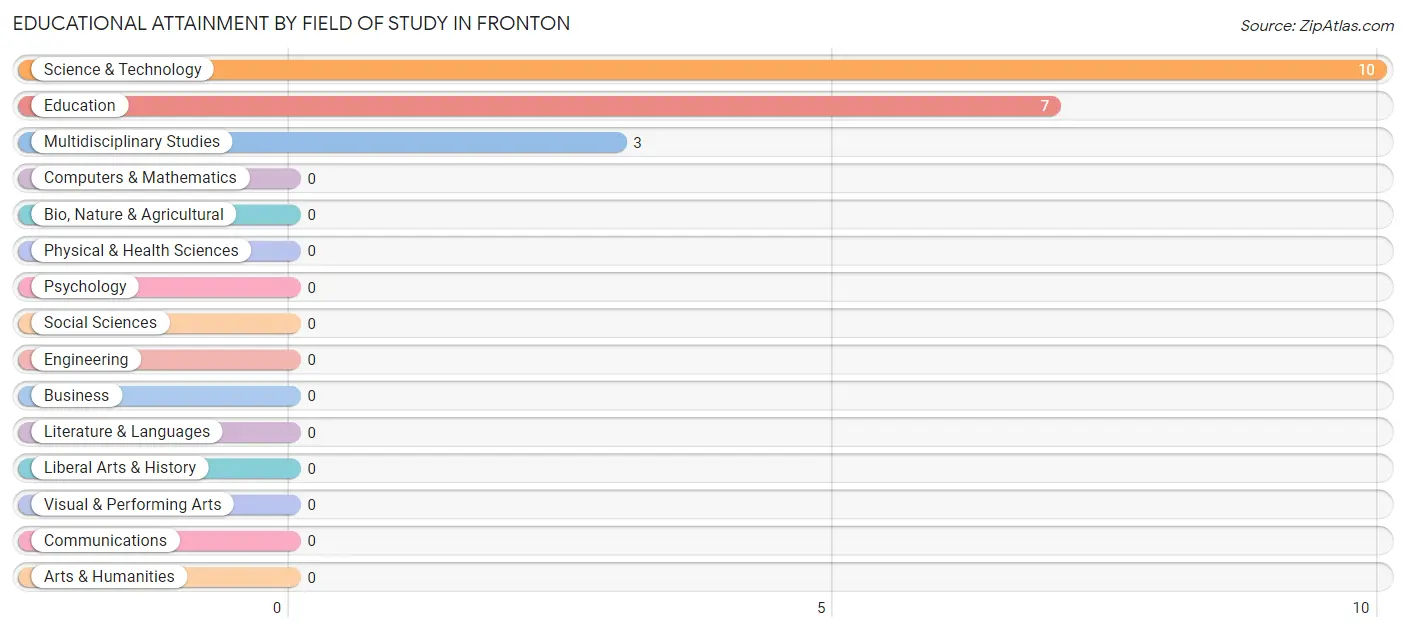
| Field of Study | # Graduates | % Graduates |
| Computers & Mathematics | 0 | 0.0% |
| Bio, Nature & Agricultural | 0 | 0.0% |
| Physical & Health Sciences | 0 | 0.0% |
| Psychology | 0 | 0.0% |
| Social Sciences | 0 | 0.0% |
| Engineering | 0 | 0.0% |
| Multidisciplinary Studies | 3 | 15.0% |
| Science & Technology | 10 | 50.0% |
| Business | 0 | 0.0% |
| Education | 7 | 35.0% |
| Literature & Languages | 0 | 0.0% |
| Liberal Arts & History | 0 | 0.0% |
| Visual & Performing Arts | 0 | 0.0% |
| Communications | 0 | 0.0% |
| Arts & Humanities | 0 | 0.0% |
| Total | 20 | 100.0% |
Transportation & Commute in Fronton
Vehicle Availability by Sex in Fronton
The most prevalent vehicle ownership categories in Fronton are males with 2 vehicles (33, accounting for 42.3%) and females with 2 vehicles (14, making up 84.6%).
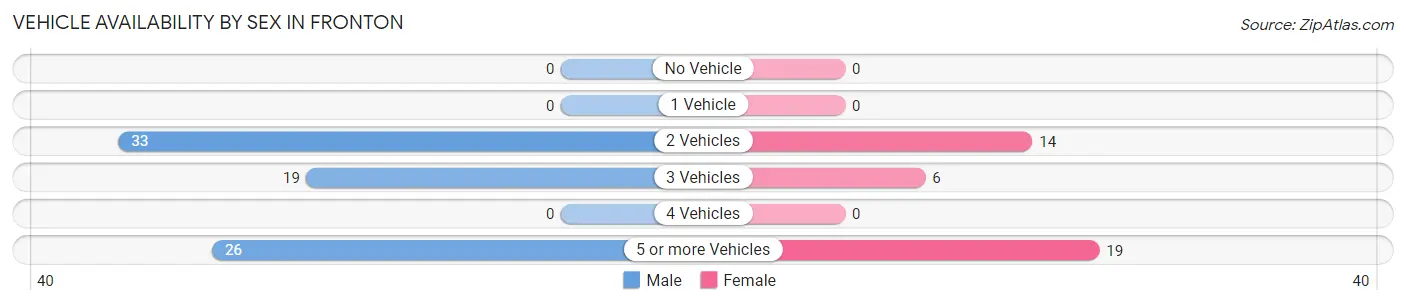
| Vehicles Available | Male | Female |
| No Vehicle | 0 (0.0%) | 0 (0.0%) |
| 1 Vehicle | 0 (0.0%) | 0 (0.0%) |
| 2 Vehicles | 33 (42.3%) | 14 (35.9%) |
| 3 Vehicles | 19 (24.4%) | 6 (15.4%) |
| 4 Vehicles | 0 (0.0%) | 0 (0.0%) |
| 5 or more Vehicles | 26 (33.3%) | 19 (48.7%) |
| Total | 78 (100.0%) | 39 (100.0%) |
Commute Time in Fronton
The most frequently occuring commute durations in Fronton are 10 to 14 minutes (66 commuters, 62.9%), 15 to 19 minutes (14 commuters, 13.3%), and 25 to 29 minutes (10 commuters, 9.5%).
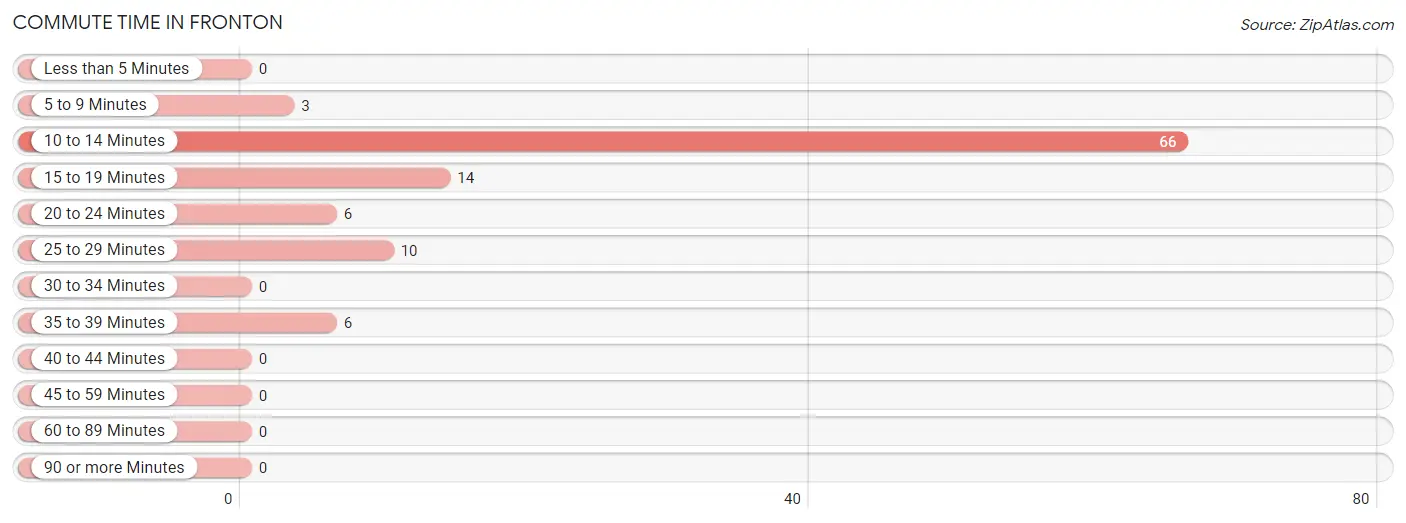
| Commute Time | # Commuters | % Commuters |
| Less than 5 Minutes | 0 | 0.0% |
| 5 to 9 Minutes | 3 | 2.9% |
| 10 to 14 Minutes | 66 | 62.9% |
| 15 to 19 Minutes | 14 | 13.3% |
| 20 to 24 Minutes | 6 | 5.7% |
| 25 to 29 Minutes | 10 | 9.5% |
| 30 to 34 Minutes | 0 | 0.0% |
| 35 to 39 Minutes | 6 | 5.7% |
| 40 to 44 Minutes | 0 | 0.0% |
| 45 to 59 Minutes | 0 | 0.0% |
| 60 to 89 Minutes | 0 | 0.0% |
| 90 or more Minutes | 0 | 0.0% |
Commute Time by Sex in Fronton
The most common commute times in Fronton are 10 to 14 minutes (47 commuters, 71.2%) for males and 10 to 14 minutes (19 commuters, 48.7%) for females.
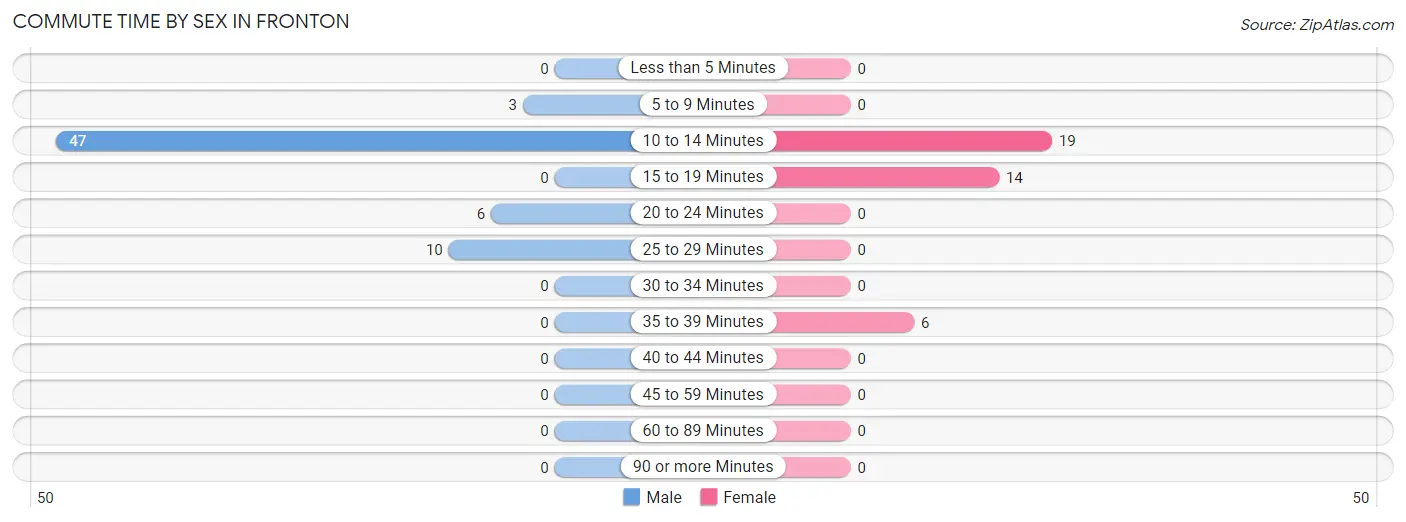
| Commute Time | Male | Female |
| Less than 5 Minutes | 0 (0.0%) | 0 (0.0%) |
| 5 to 9 Minutes | 3 (4.5%) | 0 (0.0%) |
| 10 to 14 Minutes | 47 (71.2%) | 19 (48.7%) |
| 15 to 19 Minutes | 0 (0.0%) | 14 (35.9%) |
| 20 to 24 Minutes | 6 (9.1%) | 0 (0.0%) |
| 25 to 29 Minutes | 10 (15.1%) | 0 (0.0%) |
| 30 to 34 Minutes | 0 (0.0%) | 0 (0.0%) |
| 35 to 39 Minutes | 0 (0.0%) | 6 (15.4%) |
| 40 to 44 Minutes | 0 (0.0%) | 0 (0.0%) |
| 45 to 59 Minutes | 0 (0.0%) | 0 (0.0%) |
| 60 to 89 Minutes | 0 (0.0%) | 0 (0.0%) |
| 90 or more Minutes | 0 (0.0%) | 0 (0.0%) |
Time of Departure to Work by Sex in Fronton
The most frequent times of departure to work in Fronton are 12:00 PM to 3:59 PM (32, 48.5%) for males and 8:00 AM to 8:29 AM (19, 48.7%) for females.
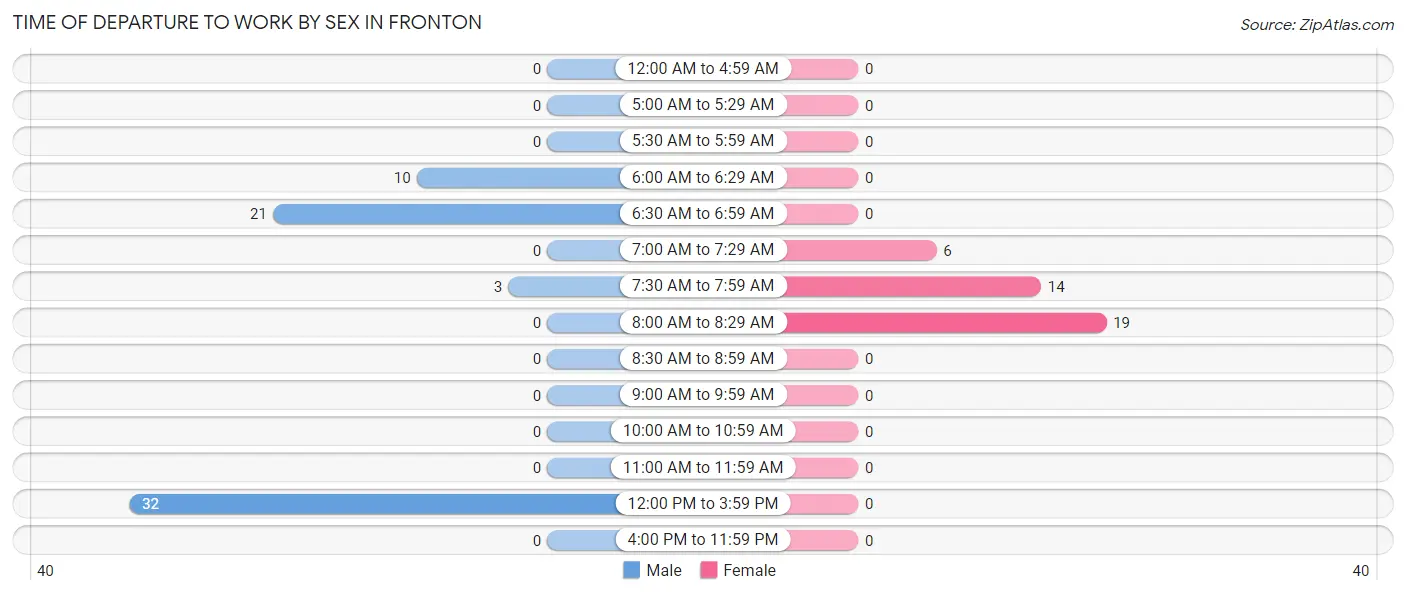
| Time of Departure | Male | Female |
| 12:00 AM to 4:59 AM | 0 (0.0%) | 0 (0.0%) |
| 5:00 AM to 5:29 AM | 0 (0.0%) | 0 (0.0%) |
| 5:30 AM to 5:59 AM | 0 (0.0%) | 0 (0.0%) |
| 6:00 AM to 6:29 AM | 10 (15.1%) | 0 (0.0%) |
| 6:30 AM to 6:59 AM | 21 (31.8%) | 0 (0.0%) |
| 7:00 AM to 7:29 AM | 0 (0.0%) | 6 (15.4%) |
| 7:30 AM to 7:59 AM | 3 (4.5%) | 14 (35.9%) |
| 8:00 AM to 8:29 AM | 0 (0.0%) | 19 (48.7%) |
| 8:30 AM to 8:59 AM | 0 (0.0%) | 0 (0.0%) |
| 9:00 AM to 9:59 AM | 0 (0.0%) | 0 (0.0%) |
| 10:00 AM to 10:59 AM | 0 (0.0%) | 0 (0.0%) |
| 11:00 AM to 11:59 AM | 0 (0.0%) | 0 (0.0%) |
| 12:00 PM to 3:59 PM | 32 (48.5%) | 0 (0.0%) |
| 4:00 PM to 11:59 PM | 0 (0.0%) | 0 (0.0%) |
| Total | 66 (100.0%) | 39 (100.0%) |
Housing Occupancy in Fronton
Occupancy by Ownership in Fronton
Of the total 60 dwellings in Fronton, owner-occupied units account for 60 (100.0%), while renter-occupied units make up 0 (0.0%).
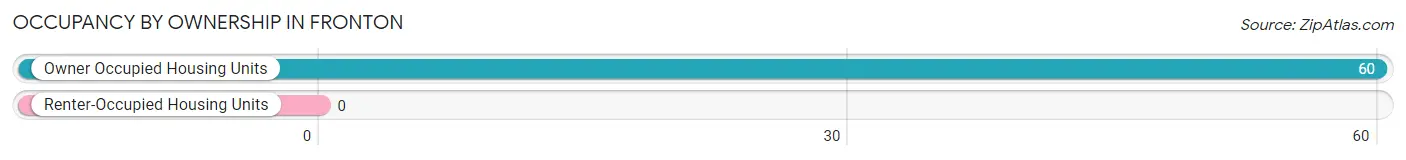
| Occupancy | # Housing Units | % Housing Units |
| Owner Occupied Housing Units | 60 | 100.0% |
| Renter-Occupied Housing Units | 0 | 0.0% |
| Total Occupied Housing Units | 60 | 100.0% |
Occupancy by Household Size in Fronton
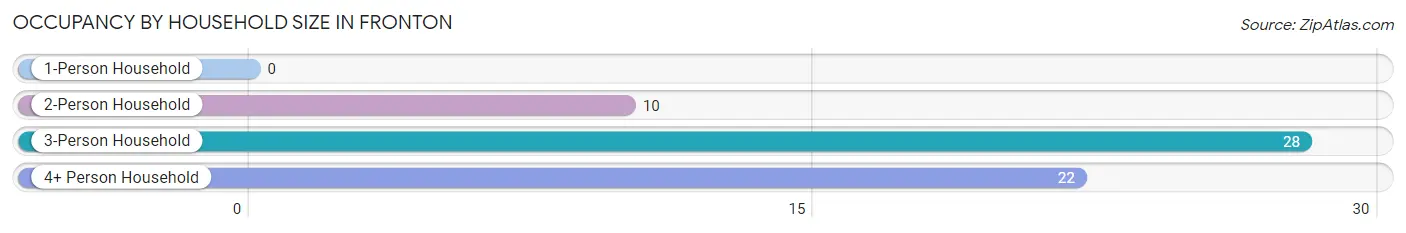
| Household Size | # Housing Units | % Housing Units |
| 1-Person Household | 0 | 0.0% |
| 2-Person Household | 10 | 16.7% |
| 3-Person Household | 28 | 46.7% |
| 4+ Person Household | 22 | 36.7% |
| Total Housing Units | 60 | 100.0% |
Occupancy by Ownership by Household Size in Fronton
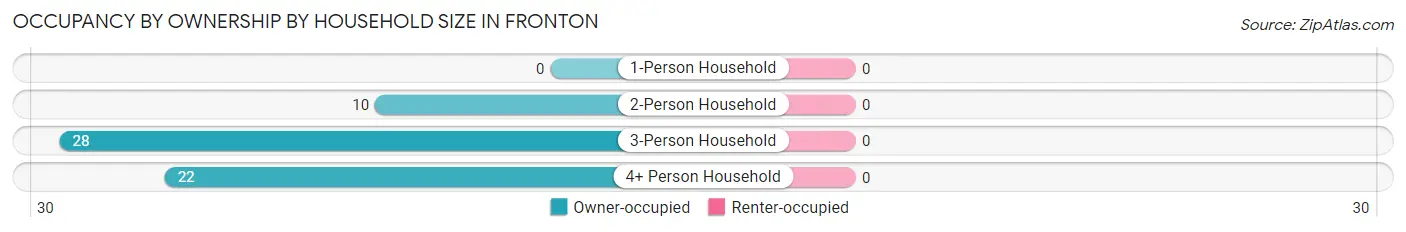
| Household Size | Owner-occupied | Renter-occupied |
| 1-Person Household | 0 (0.0%) | 0 (0.0%) |
| 2-Person Household | 10 (100.0%) | 0 (0.0%) |
| 3-Person Household | 28 (100.0%) | 0 (0.0%) |
| 4+ Person Household | 22 (100.0%) | 0 (0.0%) |
| Total Housing Units | 60 (100.0%) | 0 (0.0%) |
Occupancy by Educational Attainment in Fronton
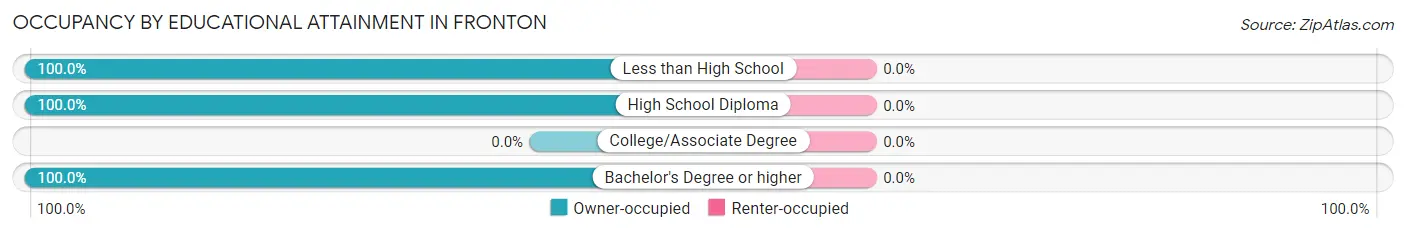
| Household Size | Owner-occupied | Renter-occupied |
| Less than High School | 47 (100.0%) | 0 (0.0%) |
| High School Diploma | 3 (100.0%) | 0 (0.0%) |
| College/Associate Degree | 0 (0.0%) | 0 (0.0%) |
| Bachelor's Degree or higher | 10 (100.0%) | 0 (0.0%) |
Occupancy by Age of Householder in Fronton
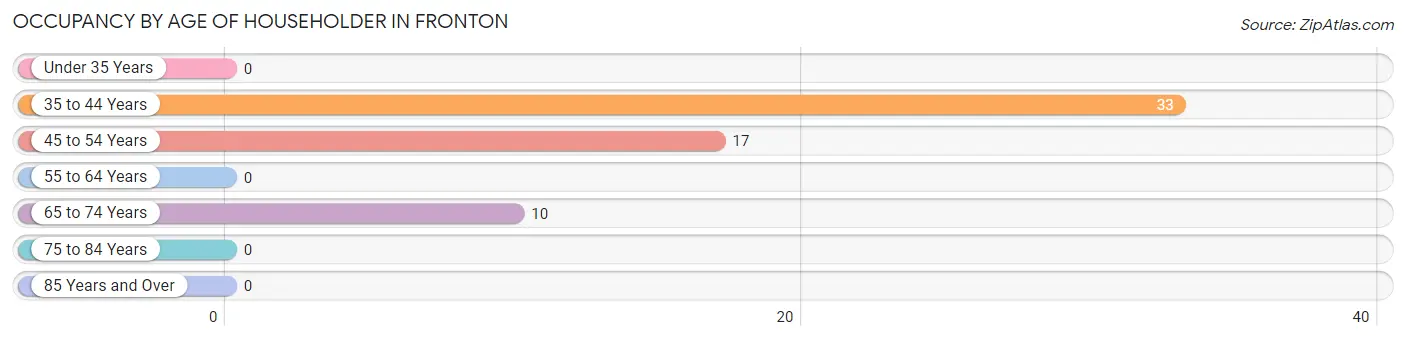
| Age Bracket | # Households | % Households |
| Under 35 Years | 0 | 0.0% |
| 35 to 44 Years | 33 | 55.0% |
| 45 to 54 Years | 17 | 28.3% |
| 55 to 64 Years | 0 | 0.0% |
| 65 to 74 Years | 10 | 16.7% |
| 75 to 84 Years | 0 | 0.0% |
| 85 Years and Over | 0 | 0.0% |
| Total | 60 | 100.0% |
Housing Finances in Fronton
Median Income by Occupancy in Fronton
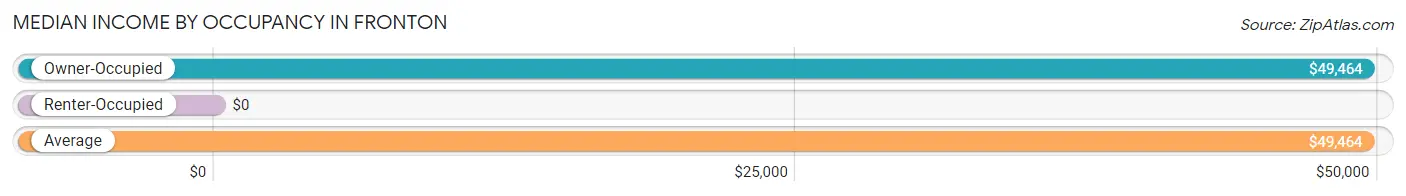
| Occupancy Type | # Households | Median Income |
| Owner-Occupied | 60 (100.0%) | $49,464 |
| Renter-Occupied | 0 (0.0%) | $0 |
| Average | 60 (100.0%) | $49,464 |
Occupancy by Householder Income Bracket in Fronton
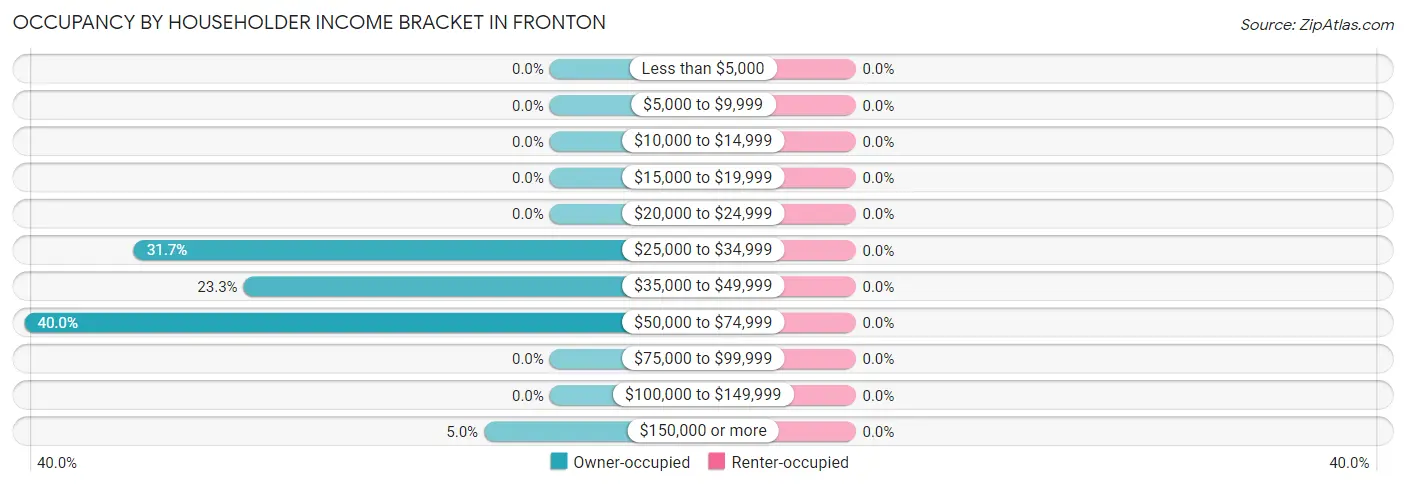
| Income Bracket | Owner-occupied | Renter-occupied |
| Less than $5,000 | 0 (0.0%) | 0 (0.0%) |
| $5,000 to $9,999 | 0 (0.0%) | 0 (0.0%) |
| $10,000 to $14,999 | 0 (0.0%) | 0 (0.0%) |
| $15,000 to $19,999 | 0 (0.0%) | 0 (0.0%) |
| $20,000 to $24,999 | 0 (0.0%) | 0 (0.0%) |
| $25,000 to $34,999 | 19 (31.7%) | 0 (0.0%) |
| $35,000 to $49,999 | 14 (23.3%) | 0 (0.0%) |
| $50,000 to $74,999 | 24 (40.0%) | 0 (0.0%) |
| $75,000 to $99,999 | 0 (0.0%) | 0 (0.0%) |
| $100,000 to $149,999 | 0 (0.0%) | 0 (0.0%) |
| $150,000 or more | 3 (5.0%) | 0 (0.0%) |
| Total | 60 (100.0%) | 0 (0.0%) |
Monthly Housing Cost Tiers in Fronton
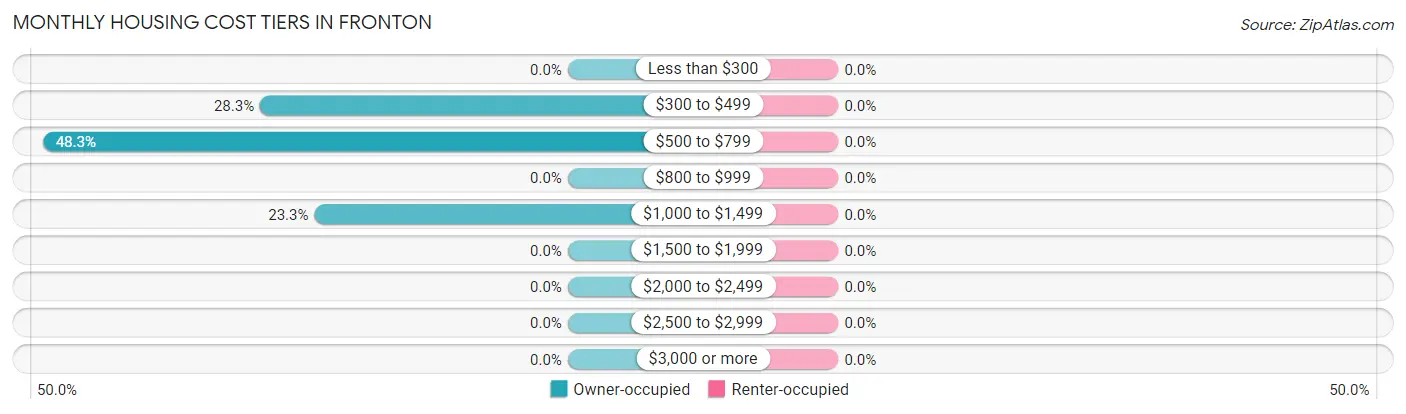
| Monthly Cost | Owner-occupied | Renter-occupied |
| Less than $300 | 0 (0.0%) | 0 (0.0%) |
| $300 to $499 | 17 (28.3%) | 0 (0.0%) |
| $500 to $799 | 29 (48.3%) | 0 (0.0%) |
| $800 to $999 | 0 (0.0%) | 0 (0.0%) |
| $1,000 to $1,499 | 14 (23.3%) | 0 (0.0%) |
| $1,500 to $1,999 | 0 (0.0%) | 0 (0.0%) |
| $2,000 to $2,499 | 0 (0.0%) | 0 (0.0%) |
| $2,500 to $2,999 | 0 (0.0%) | 0 (0.0%) |
| $3,000 or more | 0 (0.0%) | 0 (0.0%) |
| Total | 60 (100.0%) | 0 (0.0%) |
Physical Housing Characteristics in Fronton
Housing Structures in Fronton
| Structure Type | # Housing Units | % Housing Units |
| Single Unit, Detached | 27 | 45.0% |
| Single Unit, Attached | 19 | 31.7% |
| 2 Unit Apartments | 0 | 0.0% |
| 3 or 4 Unit Apartments | 0 | 0.0% |
| 5 to 9 Unit Apartments | 0 | 0.0% |
| 10 or more Apartments | 0 | 0.0% |
| Mobile Home / Other | 14 | 23.3% |
| Total | 60 | 100.0% |
Housing Structures by Occupancy in Fronton
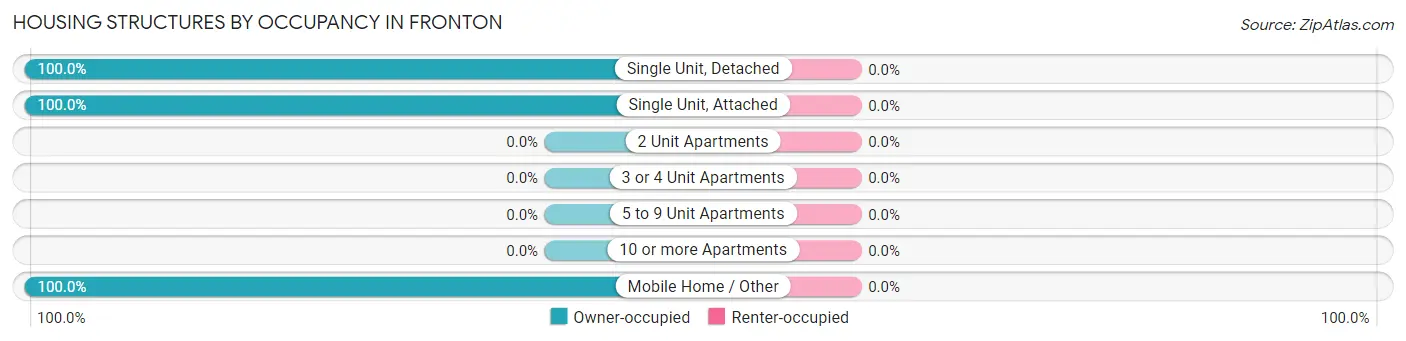
| Structure Type | Owner-occupied | Renter-occupied |
| Single Unit, Detached | 27 (100.0%) | 0 (0.0%) |
| Single Unit, Attached | 19 (100.0%) | 0 (0.0%) |
| 2 Unit Apartments | 0 (0.0%) | 0 (0.0%) |
| 3 or 4 Unit Apartments | 0 (0.0%) | 0 (0.0%) |
| 5 to 9 Unit Apartments | 0 (0.0%) | 0 (0.0%) |
| 10 or more Apartments | 0 (0.0%) | 0 (0.0%) |
| Mobile Home / Other | 14 (100.0%) | 0 (0.0%) |
| Total | 60 (100.0%) | 0 (0.0%) |
Housing Structures by Number of Rooms in Fronton
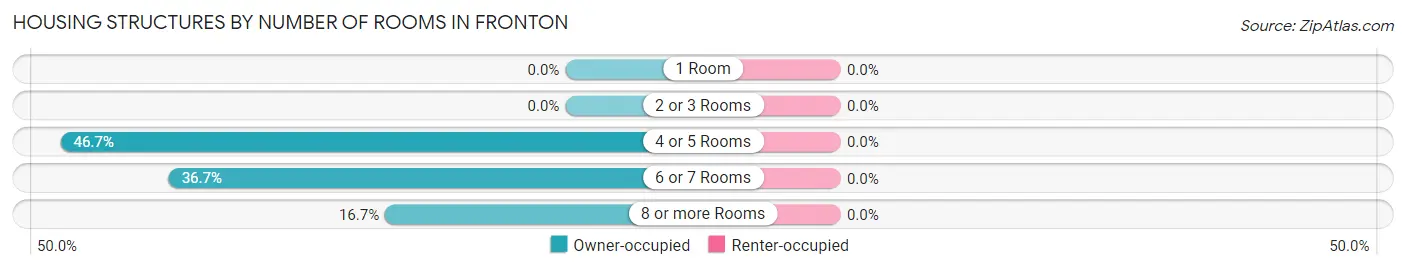
| Number of Rooms | Owner-occupied | Renter-occupied |
| 1 Room | 0 (0.0%) | 0 (0.0%) |
| 2 or 3 Rooms | 0 (0.0%) | 0 (0.0%) |
| 4 or 5 Rooms | 28 (46.7%) | 0 (0.0%) |
| 6 or 7 Rooms | 22 (36.7%) | 0 (0.0%) |
| 8 or more Rooms | 10 (16.7%) | 0 (0.0%) |
| Total | 60 (100.0%) | 0 (0.0%) |
Housing Structure by Heating Type in Fronton
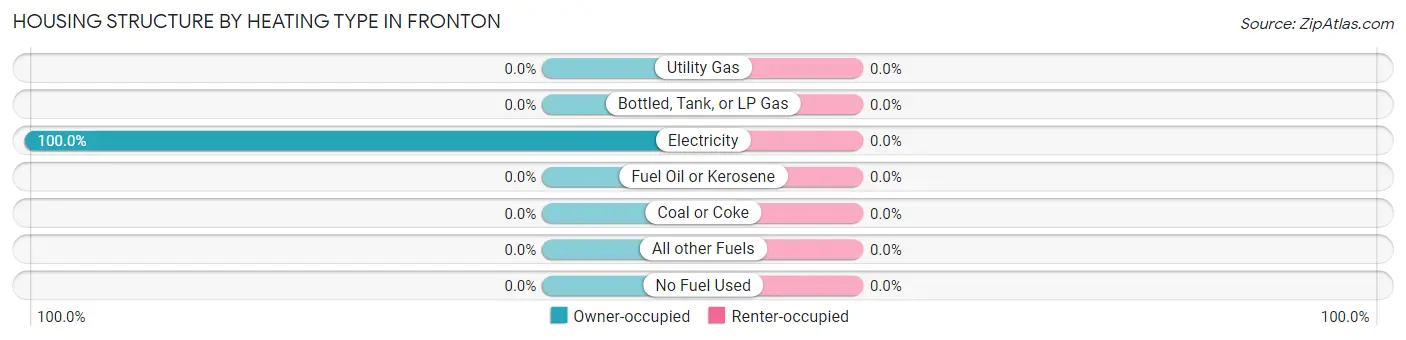
| Heating Type | Owner-occupied | Renter-occupied |
| Utility Gas | 0 (0.0%) | 0 (0.0%) |
| Bottled, Tank, or LP Gas | 0 (0.0%) | 0 (0.0%) |
| Electricity | 60 (100.0%) | 0 (0.0%) |
| Fuel Oil or Kerosene | 0 (0.0%) | 0 (0.0%) |
| Coal or Coke | 0 (0.0%) | 0 (0.0%) |
| All other Fuels | 0 (0.0%) | 0 (0.0%) |
| No Fuel Used | 0 (0.0%) | 0 (0.0%) |
| Total | 60 (100.0%) | 0 (0.0%) |
Household Vehicle Usage in Fronton
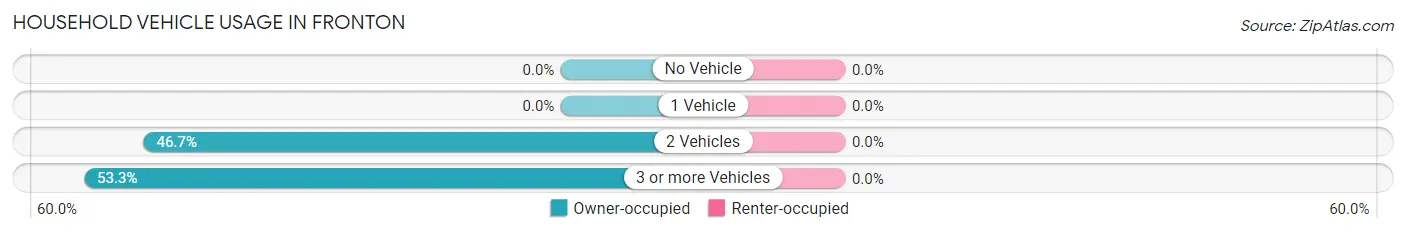
| Vehicles per Household | Owner-occupied | Renter-occupied |
| No Vehicle | 0 (0.0%) | 0 (0.0%) |
| 1 Vehicle | 0 (0.0%) | 0 (0.0%) |
| 2 Vehicles | 28 (46.7%) | 0 (0.0%) |
| 3 or more Vehicles | 32 (53.3%) | 0 (0.0%) |
| Total | 60 (100.0%) | 0 (0.0%) |
Real Estate & Mortgages in Fronton
Real Estate and Mortgage Overview in Fronton
| Characteristic | Without Mortgage | With Mortgage |
| Housing Units | 46 | 14 |
| Median Property Value | $190,000 | $0 |
| Median Household Income | $48,214 | $0 |
| Monthly Housing Costs | $560 | $0 |
| Real Estate Taxes | $1,103 | $0 |
Property Value by Mortgage Status in Fronton
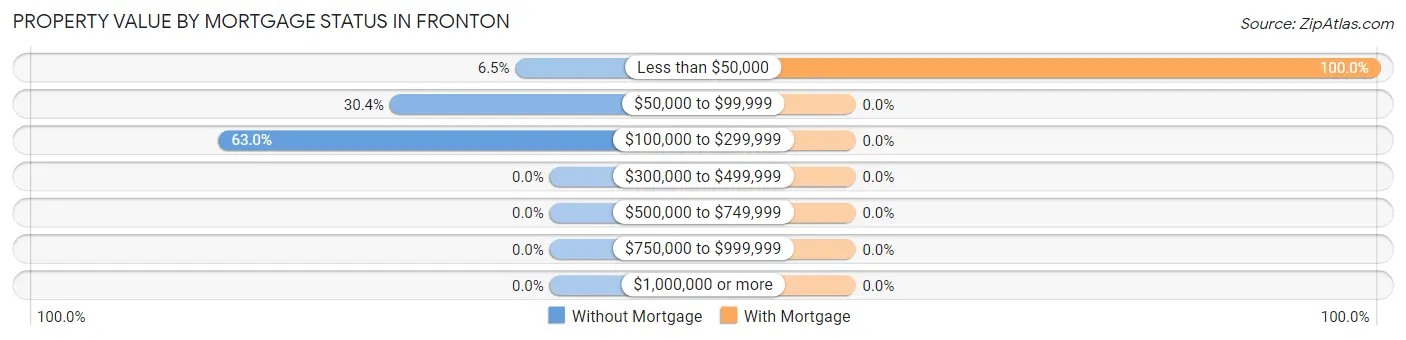
| Property Value | Without Mortgage | With Mortgage |
| Less than $50,000 | 3 (6.5%) | 14 (100.0%) |
| $50,000 to $99,999 | 14 (30.4%) | 0 (0.0%) |
| $100,000 to $299,999 | 29 (63.0%) | 0 (0.0%) |
| $300,000 to $499,999 | 0 (0.0%) | 0 (0.0%) |
| $500,000 to $749,999 | 0 (0.0%) | 0 (0.0%) |
| $750,000 to $999,999 | 0 (0.0%) | 0 (0.0%) |
| $1,000,000 or more | 0 (0.0%) | 0 (0.0%) |
| Total | 46 (100.0%) | 14 (100.0%) |
Household Income by Mortgage Status in Fronton
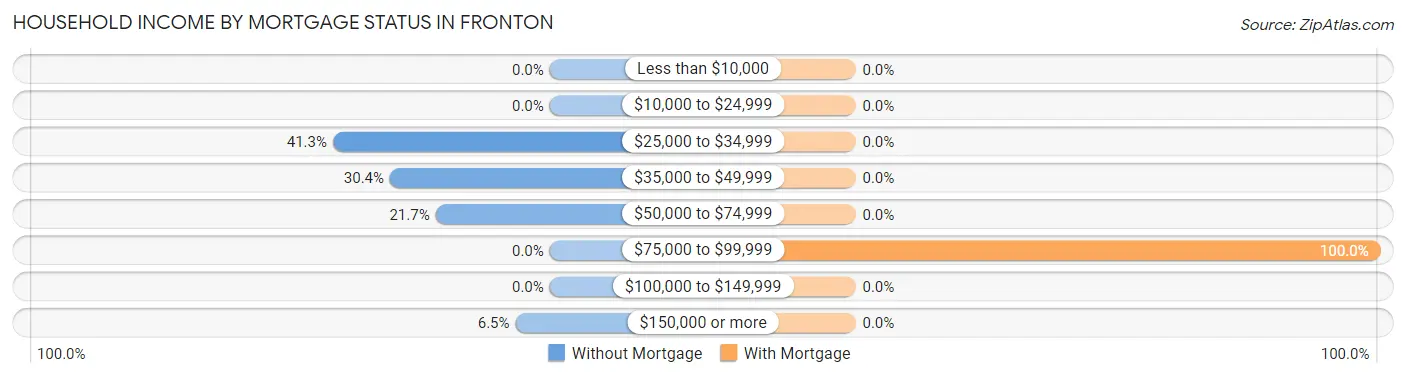
| Household Income | Without Mortgage | With Mortgage |
| Less than $10,000 | 0 (0.0%) | 0 (0.0%) |
| $10,000 to $24,999 | 0 (0.0%) | 0 (0.0%) |
| $25,000 to $34,999 | 19 (41.3%) | 0 (0.0%) |
| $35,000 to $49,999 | 14 (30.4%) | 0 (0.0%) |
| $50,000 to $74,999 | 10 (21.7%) | 0 (0.0%) |
| $75,000 to $99,999 | 0 (0.0%) | 14 (100.0%) |
| $100,000 to $149,999 | 0 (0.0%) | 0 (0.0%) |
| $150,000 or more | 3 (6.5%) | 0 (0.0%) |
| Total | 46 (100.0%) | 14 (100.0%) |
Property Value to Household Income Ratio in Fronton
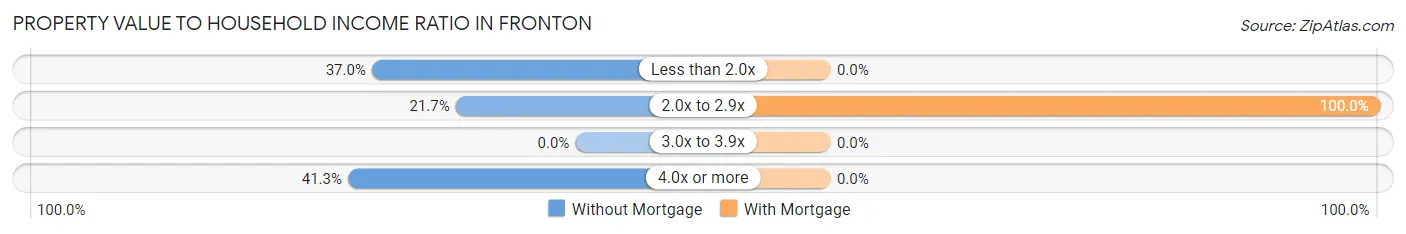
| Value-to-Income Ratio | Without Mortgage | With Mortgage |
| Less than 2.0x | 17 (37.0%) | 0 (0.0%) |
| 2.0x to 2.9x | 10 (21.7%) | 14 (100.0%) |
| 3.0x to 3.9x | 0 (0.0%) | 0 (0.0%) |
| 4.0x or more | 19 (41.3%) | 0 (0.0%) |
| Total | 46 (100.0%) | 14 (100.0%) |
Real Estate Taxes by Mortgage Status in Fronton
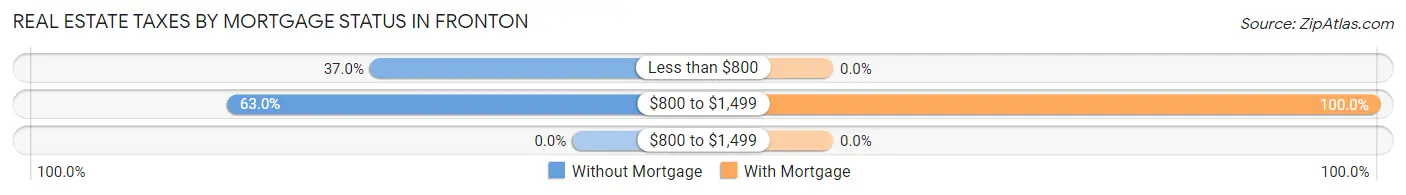
| Property Taxes | Without Mortgage | With Mortgage |
| Less than $800 | 17 (37.0%) | 0 (0.0%) |
| $800 to $1,499 | 29 (63.0%) | 14 (100.0%) |
| $800 to $1,499 | 0 (0.0%) | 0 (0.0%) |
| Total | 46 (100.0%) | 14 (100.0%) |
Health & Disability in Fronton
Health Insurance Coverage by Age in Fronton
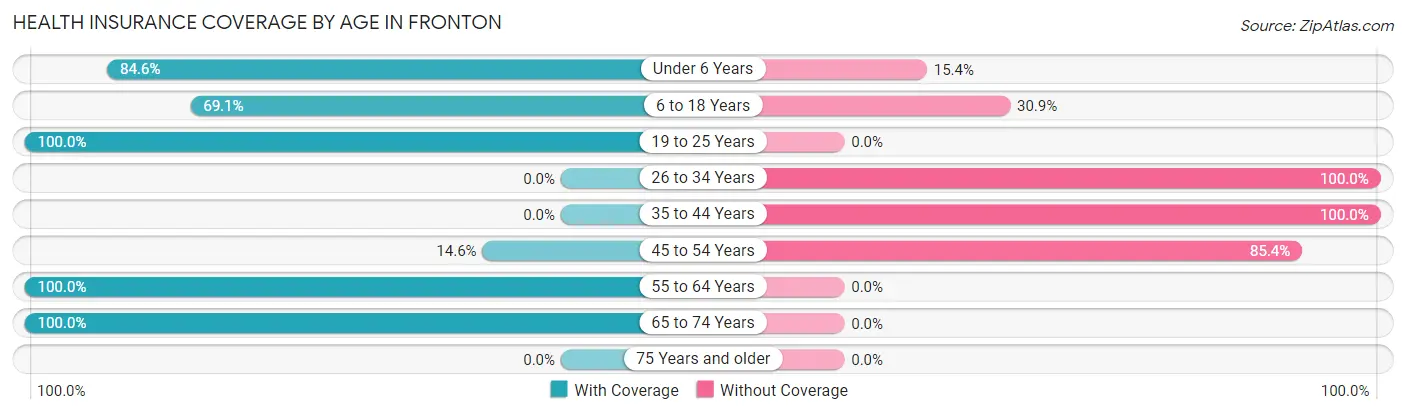
| Age Bracket | With Coverage | Without Coverage |
| Under 6 Years | 33 (84.6%) | 6 (15.4%) |
| 6 to 18 Years | 38 (69.1%) | 17 (30.9%) |
| 19 to 25 Years | 35 (100.0%) | 0 (0.0%) |
| 26 to 34 Years | 0 (0.0%) | 6 (100.0%) |
| 35 to 44 Years | 0 (0.0%) | 59 (100.0%) |
| 45 to 54 Years | 6 (14.6%) | 35 (85.4%) |
| 55 to 64 Years | 12 (100.0%) | 0 (0.0%) |
| 65 to 74 Years | 17 (100.0%) | 0 (0.0%) |
| 75 Years and older | 0 (0.0%) | 0 (0.0%) |
| Total | 141 (53.4%) | 123 (46.6%) |
Health Insurance Coverage by Citizenship Status in Fronton
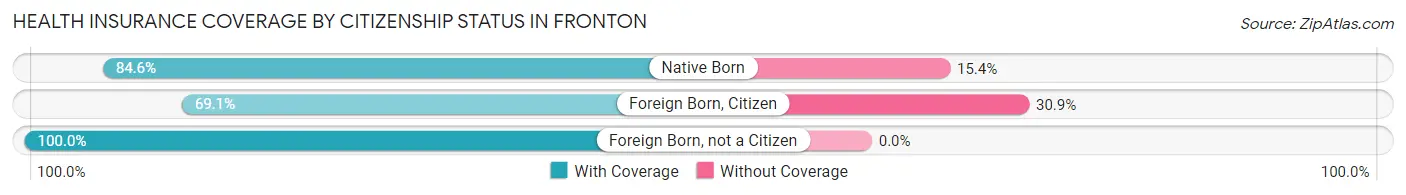
| Citizenship Status | With Coverage | Without Coverage |
| Native Born | 33 (84.6%) | 6 (15.4%) |
| Foreign Born, Citizen | 38 (69.1%) | 17 (30.9%) |
| Foreign Born, not a Citizen | 35 (100.0%) | 0 (0.0%) |
Health Insurance Coverage by Household Income in Fronton
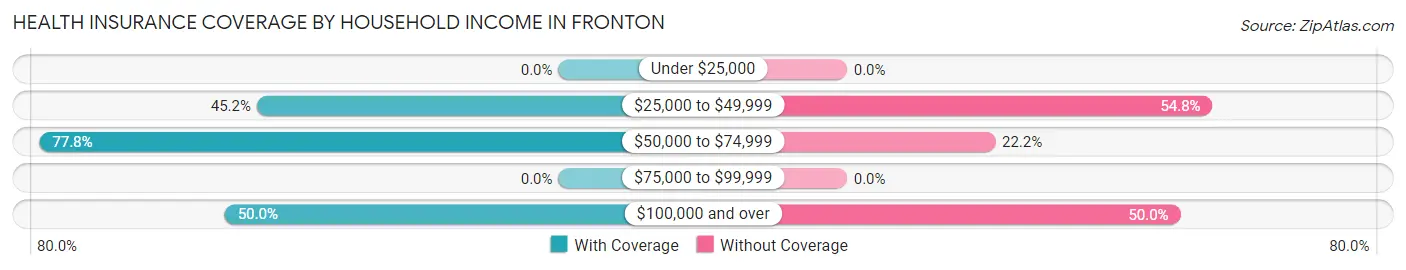
| Household Income | With Coverage | Without Coverage |
| Under $25,000 | 0 (0.0%) | 0 (0.0%) |
| $25,000 to $49,999 | 80 (45.2%) | 97 (54.8%) |
| $50,000 to $74,999 | 49 (77.8%) | 14 (22.2%) |
| $75,000 to $99,999 | 0 (0.0%) | 0 (0.0%) |
| $100,000 and over | 12 (50.0%) | 12 (50.0%) |
Public vs Private Health Insurance Coverage by Age in Fronton
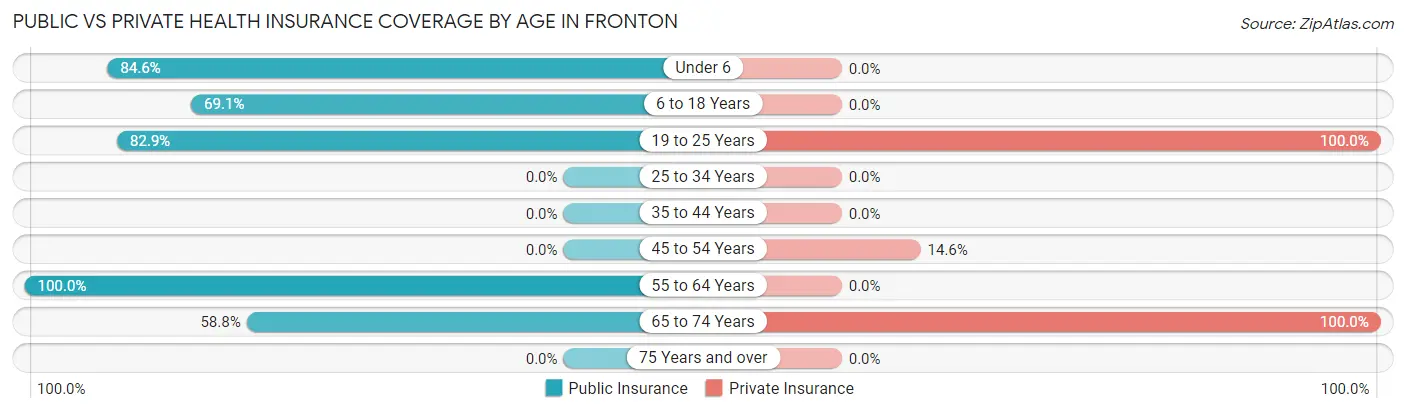
| Age Bracket | Public Insurance | Private Insurance |
| Under 6 | 33 (84.6%) | 0 (0.0%) |
| 6 to 18 Years | 38 (69.1%) | 0 (0.0%) |
| 19 to 25 Years | 29 (82.9%) | 35 (100.0%) |
| 25 to 34 Years | 0 (0.0%) | 0 (0.0%) |
| 35 to 44 Years | 0 (0.0%) | 0 (0.0%) |
| 45 to 54 Years | 0 (0.0%) | 6 (14.6%) |
| 55 to 64 Years | 12 (100.0%) | 0 (0.0%) |
| 65 to 74 Years | 10 (58.8%) | 17 (100.0%) |
| 75 Years and over | 0 (0.0%) | 0 (0.0%) |
| Total | 122 (46.2%) | 58 (22.0%) |
Disability Status by Sex by Age in Fronton
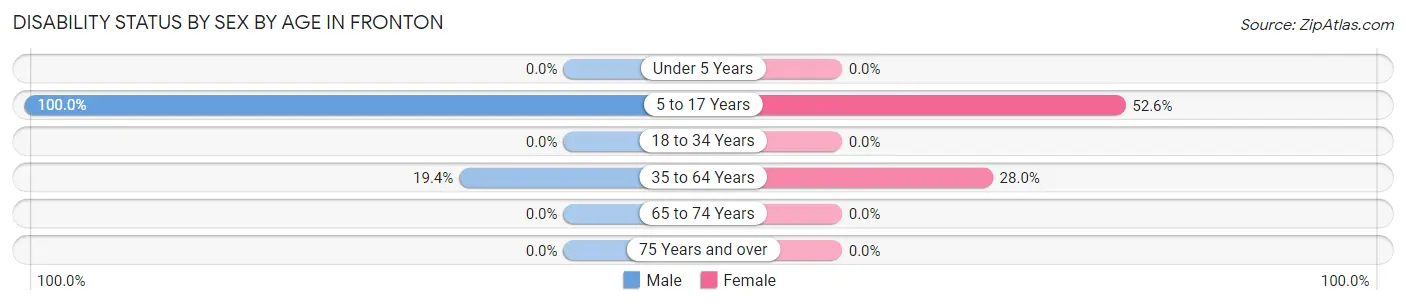
| Age Bracket | Male | Female |
| Under 5 Years | 0 (0.0%) | 0 (0.0%) |
| 5 to 17 Years | 17 (100.0%) | 20 (52.6%) |
| 18 to 34 Years | 0 (0.0%) | 0 (0.0%) |
| 35 to 64 Years | 12 (19.4%) | 14 (28.0%) |
| 65 to 74 Years | 0 (0.0%) | 0 (0.0%) |
| 75 Years and over | 0 (0.0%) | 0 (0.0%) |
Disability Class by Sex by Age in Fronton
Disability Class: Hearing Difficulty
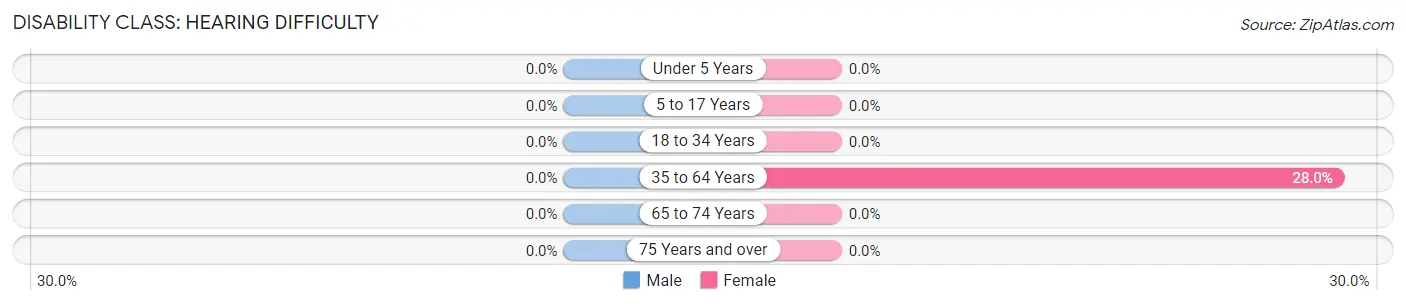
| Age Bracket | Male | Female |
| Under 5 Years | 0 (0.0%) | 0 (0.0%) |
| 5 to 17 Years | 0 (0.0%) | 0 (0.0%) |
| 18 to 34 Years | 0 (0.0%) | 0 (0.0%) |
| 35 to 64 Years | 0 (0.0%) | 14 (28.0%) |
| 65 to 74 Years | 0 (0.0%) | 0 (0.0%) |
| 75 Years and over | 0 (0.0%) | 0 (0.0%) |
Disability Class: Vision Difficulty
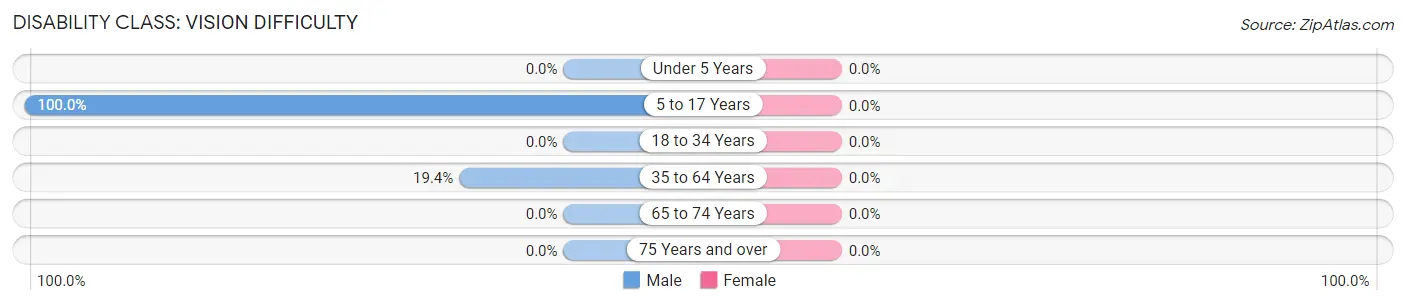
| Age Bracket | Male | Female |
| Under 5 Years | 0 (0.0%) | 0 (0.0%) |
| 5 to 17 Years | 17 (100.0%) | 0 (0.0%) |
| 18 to 34 Years | 0 (0.0%) | 0 (0.0%) |
| 35 to 64 Years | 12 (19.4%) | 0 (0.0%) |
| 65 to 74 Years | 0 (0.0%) | 0 (0.0%) |
| 75 Years and over | 0 (0.0%) | 0 (0.0%) |
Disability Class: Cognitive Difficulty
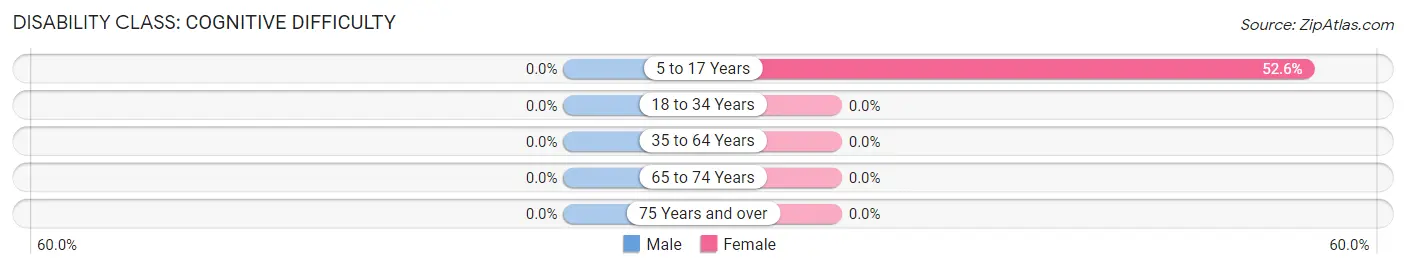
| Age Bracket | Male | Female |
| 5 to 17 Years | 0 (0.0%) | 20 (52.6%) |
| 18 to 34 Years | 0 (0.0%) | 0 (0.0%) |
| 35 to 64 Years | 0 (0.0%) | 0 (0.0%) |
| 65 to 74 Years | 0 (0.0%) | 0 (0.0%) |
| 75 Years and over | 0 (0.0%) | 0 (0.0%) |
Disability Class: Ambulatory Difficulty
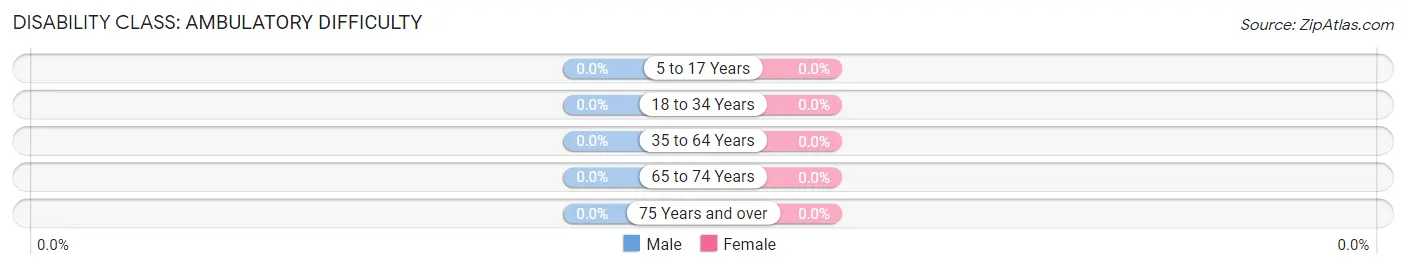
| Age Bracket | Male | Female |
| 5 to 17 Years | 0 (0.0%) | 0 (0.0%) |
| 18 to 34 Years | 0 (0.0%) | 0 (0.0%) |
| 35 to 64 Years | 0 (0.0%) | 0 (0.0%) |
| 65 to 74 Years | 0 (0.0%) | 0 (0.0%) |
| 75 Years and over | 0 (0.0%) | 0 (0.0%) |
Disability Class: Self-Care Difficulty
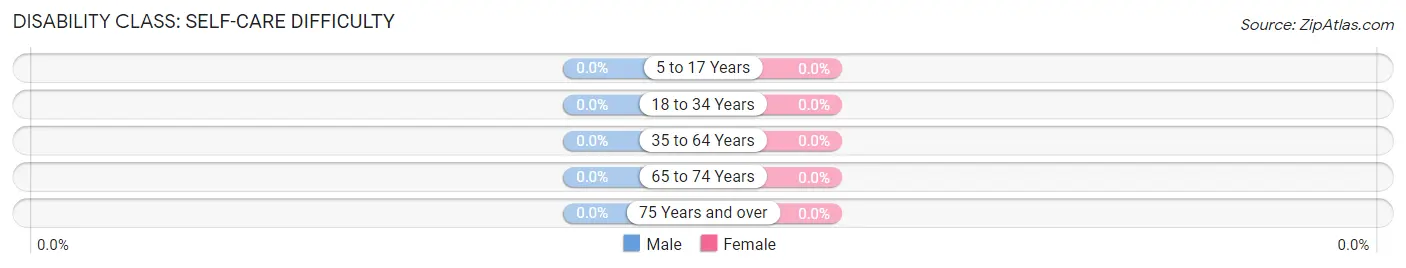
| Age Bracket | Male | Female |
| 5 to 17 Years | 0 (0.0%) | 0 (0.0%) |
| 18 to 34 Years | 0 (0.0%) | 0 (0.0%) |
| 35 to 64 Years | 0 (0.0%) | 0 (0.0%) |
| 65 to 74 Years | 0 (0.0%) | 0 (0.0%) |
| 75 Years and over | 0 (0.0%) | 0 (0.0%) |
Technology Access in Fronton
Computing Device Access in Fronton
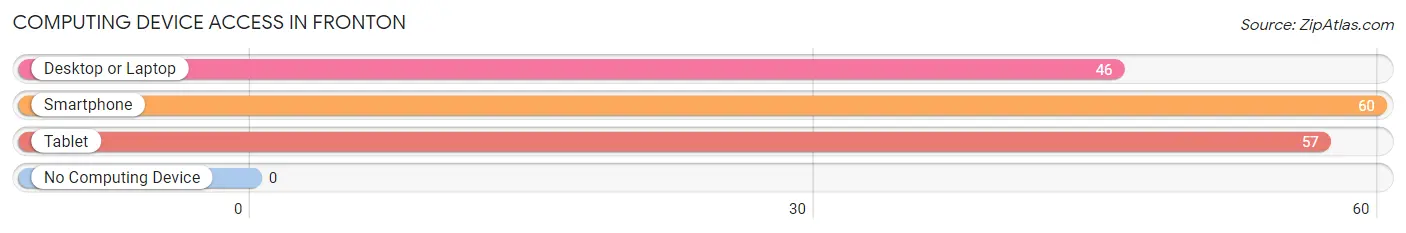
| Device Type | # Households | % Households |
| Desktop or Laptop | 46 | 76.7% |
| Smartphone | 60 | 100.0% |
| Tablet | 57 | 95.0% |
| No Computing Device | 0 | 0.0% |
| Total | 60 | 100.0% |
Internet Access in Fronton
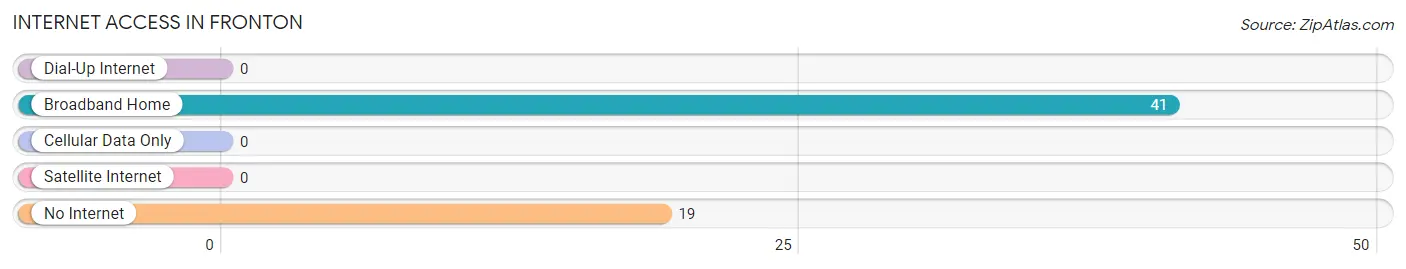
| Internet Type | # Households | % Households |
| Dial-Up Internet | 0 | 0.0% |
| Broadband Home | 41 | 68.3% |
| Cellular Data Only | 0 | 0.0% |
| Satellite Internet | 0 | 0.0% |
| No Internet | 19 | 31.7% |
| Total | 60 | 100.0% |
Fronton Summary
Fronton is a small unincorporated community located in the state of Texas, in the United States. It is situated in the southeastern part of the state, in the county of Nueces. The population of Fronton was estimated to be around 200 people in the year 2000.
History
Fronton was first settled in the late 1800s by a group of settlers from Mexico. The settlers were attracted to the area due to its fertile soil and abundant water sources. The settlers named the area Fronton after the nearby town of Fronton, Mexico. The settlers established a small farming community and began to cultivate the land.
In the early 1900s, the town of Fronton began to grow and develop. The town was incorporated in 1910 and the first post office was established in 1911. The town was home to a variety of businesses, including a general store, a blacksmith shop, a livery stable, and a cotton gin.
In the 1920s, Fronton began to experience a period of growth and prosperity. The town was home to a variety of businesses, including a bank, a hotel, a movie theater, and a variety of other businesses. The town also had a school and a library.
In the 1940s, Fronton experienced a period of decline. The town’s population began to decline and many of the businesses closed. The town’s economy was further weakened by the Great Depression.
In the 1950s, Fronton began to experience a period of revitalization. The town was home to a variety of businesses, including a grocery store, a hardware store, and a variety of other businesses. The town also had a school and a library.
In the 1960s, Fronton experienced a period of growth and development. The town was home to a variety of businesses, including a bank, a hotel, a movie theater, and a variety of other businesses. The town also had a school and a library.
In the 1970s, Fronton experienced a period of decline. The town’s population began to decline and many of the businesses closed. The town’s economy was further weakened by the oil crisis of the 1970s.
In the 1980s, Fronton began to experience a period of revitalization. The town was home to a variety of businesses, including a grocery store, a hardware store, and a variety of other businesses. The town also had a school and a library.
In the 1990s, Fronton experienced a period of growth and development. The town was home to a variety of businesses, including a bank, a hotel, a movie theater, and a variety of other businesses. The town also had a school and a library.
Geography
Fronton is located in the southeastern part of the state of Texas, in the county of Nueces. The town is situated on the banks of the Nueces River. The town is surrounded by a variety of natural features, including rolling hills, wooded areas, and open fields.
Economy
Fronton’s economy is largely based on agriculture. The town is home to a variety of farms, which produce a variety of crops, including cotton, corn, and sorghum. The town is also home to a variety of businesses, including a grocery store, a hardware store, and a variety of other businesses.
Demographics
As of the year 2000, the population of Fronton was estimated to be around 200 people. The town is predominantly Hispanic, with a majority of the population being of Mexican descent. The town is also home to a small number of African Americans and Native Americans. The median household income in Fronton is around $25,000.
Common Questions
What is Per Capita Income in Fronton?
Per Capita income in Fronton is $13,380.
What is the Median Family Income in Fronton?
Median Family Income in Fronton is $32,105.
What is the Median Household income in Fronton?
Median Household Income in Fronton is $49,464.
What is Income or Wage Gap in Fronton?
Income or Wage Gap in Fronton is 47.1%.
Women in Fronton earn 52.9 cents for every dollar earned by a man.
What is Inequality or Gini Index in Fronton?
Inequality or Gini Index in Fronton is 0.22.
What is the Total Population of Fronton?
Total Population of Fronton is 264.
What is the Total Male Population of Fronton?
Total Male Population of Fronton is 128.
What is the Total Female Population of Fronton?
Total Female Population of Fronton is 136.
What is the Ratio of Males per 100 Females in Fronton?
There are 94.12 Males per 100 Females in Fronton.
What is the Ratio of Females per 100 Males in Fronton?
There are 106.25 Females per 100 Males in Fronton.
What is the Median Population Age in Fronton?
Median Population Age in Fronton is 28.5 Years.
What is the Average Family Size in Fronton
Average Family Size in Fronton is 4.2 People.
What is the Average Household Size in Fronton
Average Household Size in Fronton is 4.4 People.
How Large is the Labor Force in Fronton?
There are 149 People in the Labor Forcein in Fronton.
What is the Percentage of People in the Labor Force in Fronton?
79.7% of People are in the Labor Force in Fronton.
What is the Unemployment Rate in Fronton?
Unemployment Rate in Fronton is 19.5%.