Port O Connor, TX Map & Demographics
Port O Connor Map
Port O Connor Overview
$34,412
PER CAPITA INCOME
$94,792
AVG FAMILY INCOME
$91,150
AVG HOUSEHOLD INCOME
0.25
INEQUALITY / GINI INDEX
791
TOTAL POPULATION
390
MALE POPULATION
401
FEMALE POPULATION
97.26
MALES / 100 FEMALES
102.82
FEMALES / 100 MALES
64.6
MEDIAN AGE
2.4
AVG FAMILY SIZE
2.2
AVG HOUSEHOLD SIZE
223
LABOR FORCE [ PEOPLE ]
28.6%
PERCENT IN LABOR FORCE
0.4%
UNEMPLOYMENT RATE
Port O Connor Zip Codes
Port O Connor Area Codes
Income in Port O Connor
Income Overview in Port O Connor
Per Capita Income in Port O Connor is $34,412, while median incomes of families and households are $94,792 and $91,150 respectively.
| Characteristic | Number | Measure |
| Per Capita Income | 791 | $34,412 |
| Median Family Income | 305 | $94,792 |
| Mean Family Income | 305 | $78,613 |
| Median Household Income | 365 | $91,150 |
| Mean Household Income | 365 | $76,179 |
| Income Deficit | 305 | $0 |
| Wage / Income Gap (%) | 791 | 0.00% |
| Wage / Income Gap ($) | 791 | 100.00¢ per $1 |
| Gini / Inequality Index | 791 | 0.25 |
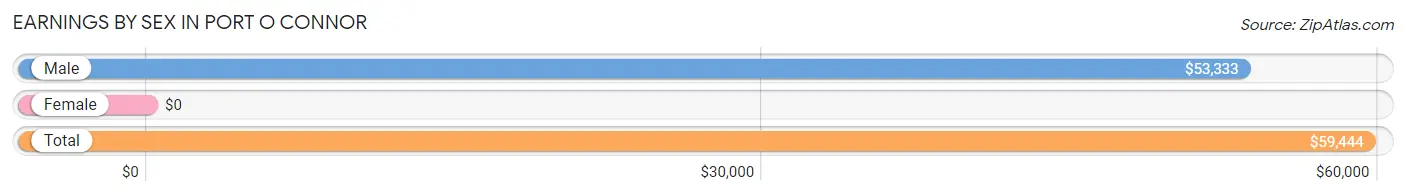
Earnings by Sex in Port O Connor
| Sex | Number | Average Earnings |
| Male | 226 (80.7%) | $53,333 |
| Female | 54 (19.3%) | $0 |
| Total | 280 (100.0%) | $59,444 |
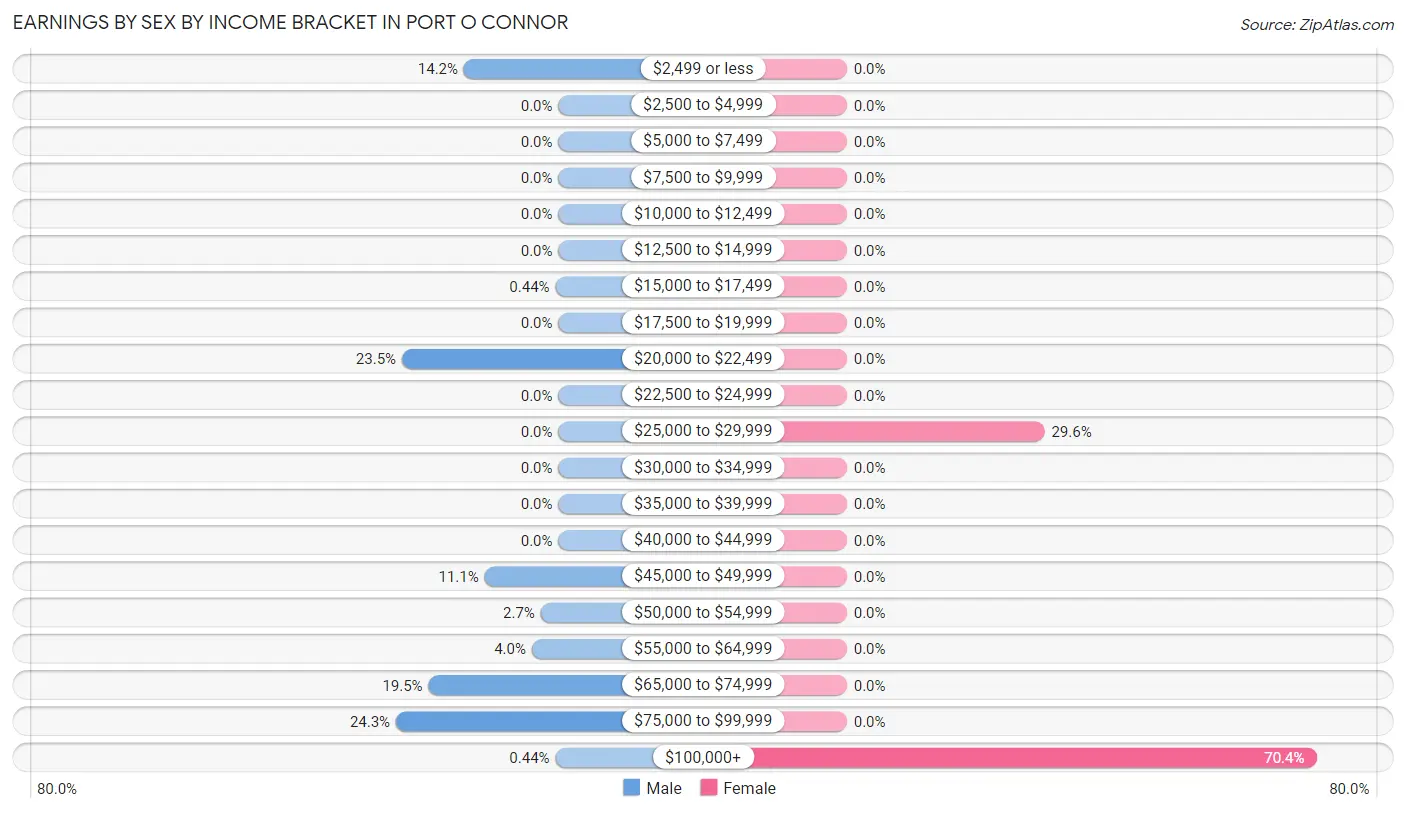
Earnings by Sex by Income Bracket in Port O Connor
The most common earnings brackets in Port O Connor are $75,000 to $99,999 for men (55 | 24.3%) and $100,000+ for women (38 | 70.4%).
| Income | Male | Female |
| $2,499 or less | 32 (14.2%) | 0 (0.0%) |
| $2,500 to $4,999 | 0 (0.0%) | 0 (0.0%) |
| $5,000 to $7,499 | 0 (0.0%) | 0 (0.0%) |
| $7,500 to $9,999 | 0 (0.0%) | 0 (0.0%) |
| $10,000 to $12,499 | 0 (0.0%) | 0 (0.0%) |
| $12,500 to $14,999 | 0 (0.0%) | 0 (0.0%) |
| $15,000 to $17,499 | 1 (0.4%) | 0 (0.0%) |
| $17,500 to $19,999 | 0 (0.0%) | 0 (0.0%) |
| $20,000 to $22,499 | 53 (23.4%) | 0 (0.0%) |
| $22,500 to $24,999 | 0 (0.0%) | 0 (0.0%) |
| $25,000 to $29,999 | 0 (0.0%) | 16 (29.6%) |
| $30,000 to $34,999 | 0 (0.0%) | 0 (0.0%) |
| $35,000 to $39,999 | 0 (0.0%) | 0 (0.0%) |
| $40,000 to $44,999 | 0 (0.0%) | 0 (0.0%) |
| $45,000 to $49,999 | 25 (11.1%) | 0 (0.0%) |
| $50,000 to $54,999 | 6 (2.6%) | 0 (0.0%) |
| $55,000 to $64,999 | 9 (4.0%) | 0 (0.0%) |
| $65,000 to $74,999 | 44 (19.5%) | 0 (0.0%) |
| $75,000 to $99,999 | 55 (24.3%) | 0 (0.0%) |
| $100,000+ | 1 (0.4%) | 38 (70.4%) |
| Total | 226 (100.0%) | 54 (100.0%) |
Earnings by Sex by Educational Attainment in Port O Connor
| Educational Attainment | Male Income | Female Income |
| Less than High School | - | - |
| High School Diploma | - | - |
| College or Associate's Degree | - | - |
| Bachelor's Degree | - | - |
| Graduate Degree | - | - |
| Total | $53,333 | $0 |
Family Income in Port O Connor
Family Income Brackets in Port O Connor
According to the Port O Connor family income data, there are 98 families falling into the $75,000 to $99,999 income range, which is the most common income bracket and makes up 32.1% of all families.
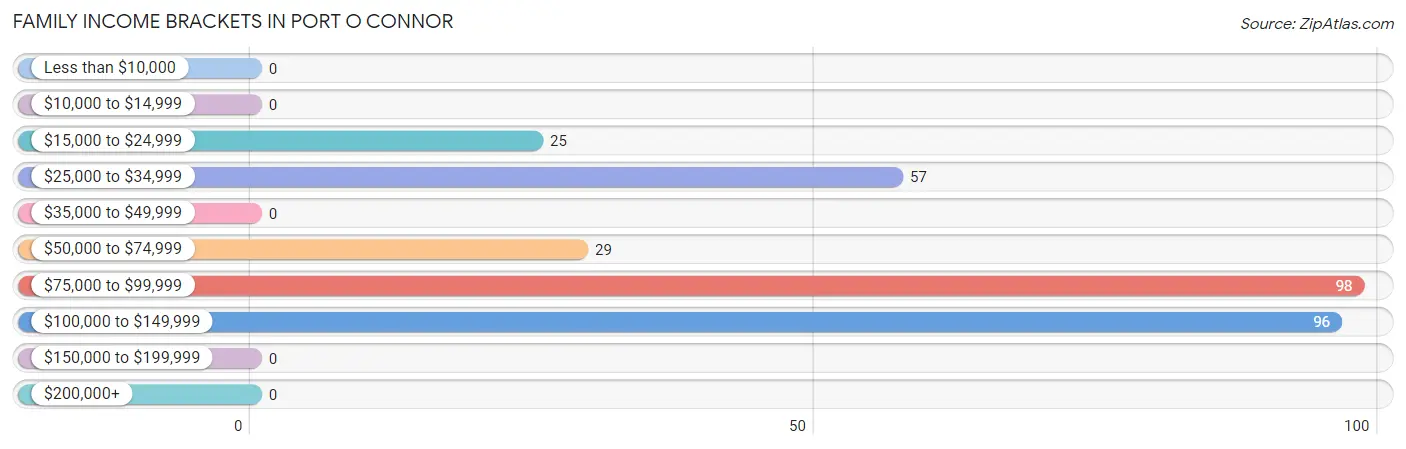
| Income Bracket | # Families | % Families |
| Less than $10,000 | 0 | 0.0% |
| $10,000 to $14,999 | 0 | 0.0% |
| $15,000 to $24,999 | 25 | 8.2% |
| $25,000 to $34,999 | 57 | 18.7% |
| $35,000 to $49,999 | 0 | 0.0% |
| $50,000 to $74,999 | 29 | 9.5% |
| $75,000 to $99,999 | 98 | 32.1% |
| $100,000 to $149,999 | 96 | 31.5% |
| $150,000 to $199,999 | 0 | 0.0% |
| $200,000+ | 0 | 0.0% |
Family Income by Famaliy Size in Port O Connor
2-person families (205 | 67.2%) account for the highest median family income in Port O Connor with $94,097 per family, while 2-person families (205 | 67.2%) have the highest median income of $47,048 per family member.
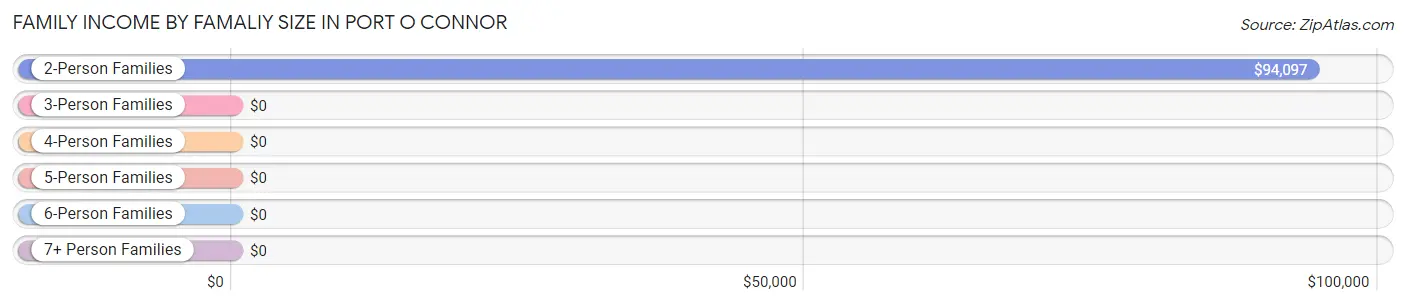
| Income Bracket | # Families | Median Income |
| 2-Person Families | 205 (67.2%) | $94,097 |
| 3-Person Families | 45 (14.7%) | $0 |
| 4-Person Families | 55 (18.0%) | $0 |
| 5-Person Families | 0 (0.0%) | $0 |
| 6-Person Families | 0 (0.0%) | $0 |
| 7+ Person Families | 0 (0.0%) | $0 |
| Total | 305 (100.0%) | $94,792 |
Family Income by Number of Earners in Port O Connor
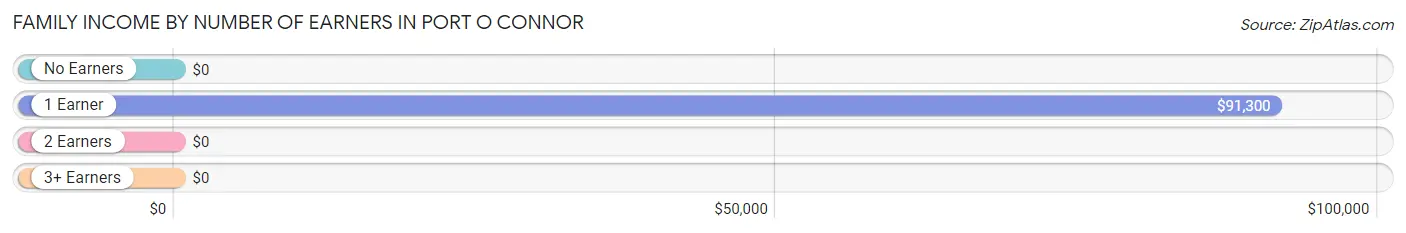
| Number of Earners | # Families | Median Income |
| No Earners | 133 (43.6%) | $0 |
| 1 Earner | 134 (43.9%) | $91,300 |
| 2 Earners | 38 (12.5%) | $0 |
| 3+ Earners | 0 (0.0%) | $0 |
| Total | 305 (100.0%) | $94,792 |
Household Income in Port O Connor
Household Income Brackets in Port O Connor
With 142 households falling in the category, the $75,000 to $99,999 income range is the most frequent in Port O Connor, accounting for 38.9% of all households.
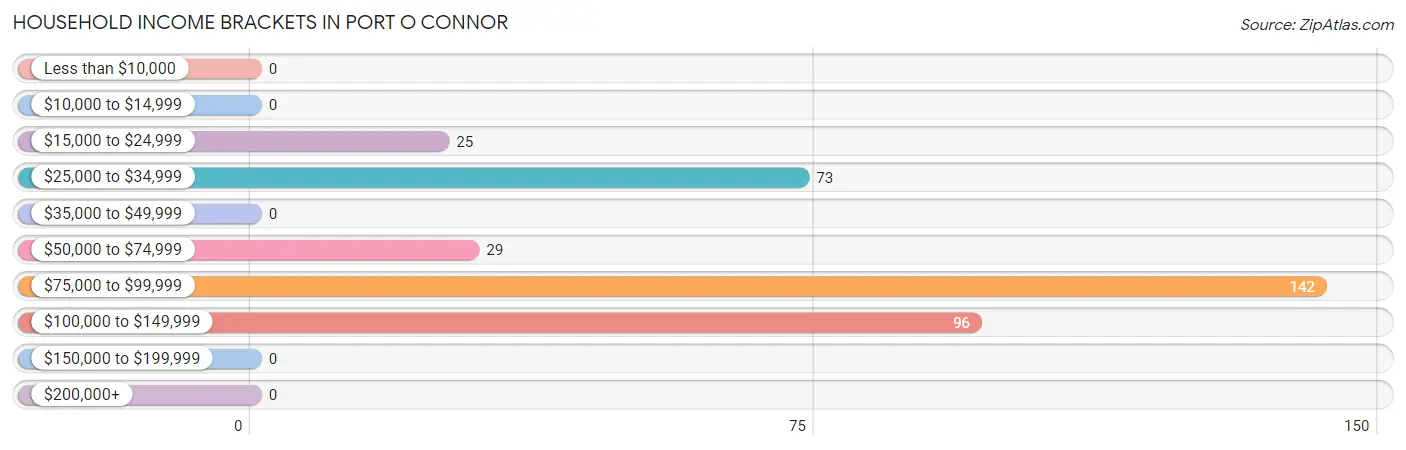
| Income Bracket | # Households | % Households |
| Less than $10,000 | 0 | 0.0% |
| $10,000 to $14,999 | 0 | 0.0% |
| $15,000 to $24,999 | 25 | 6.8% |
| $25,000 to $34,999 | 73 | 20.0% |
| $35,000 to $49,999 | 0 | 0.0% |
| $50,000 to $74,999 | 29 | 7.9% |
| $75,000 to $99,999 | 142 | 38.9% |
| $100,000 to $149,999 | 96 | 26.3% |
| $150,000 to $199,999 | 0 | 0.0% |
| $200,000+ | 0 | 0.0% |
Household Income by Householder Age in Port O Connor
The median household income in Port O Connor is $91,150, with the highest median household income of $97,432 found in the 45 to 64 years age bracket for the primary householder. A total of 195 households (53.4%) fall into this category.
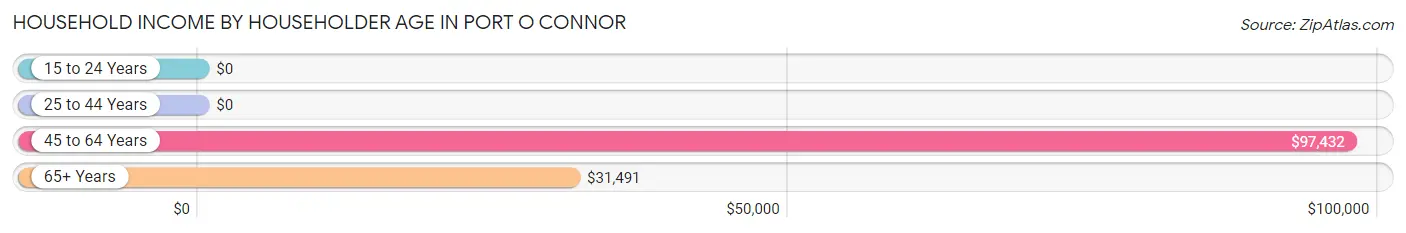
| Income Bracket | # Households | Median Income |
| 15 to 24 Years | 0 (0.0%) | $0 |
| 25 to 44 Years | 20 (5.5%) | $0 |
| 45 to 64 Years | 195 (53.4%) | $97,432 |
| 65+ Years | 150 (41.1%) | $31,491 |
| Total | 365 (100.0%) | $91,150 |
Poverty in Port O Connor
Income Below Poverty by Sex and Age in Port O Connor
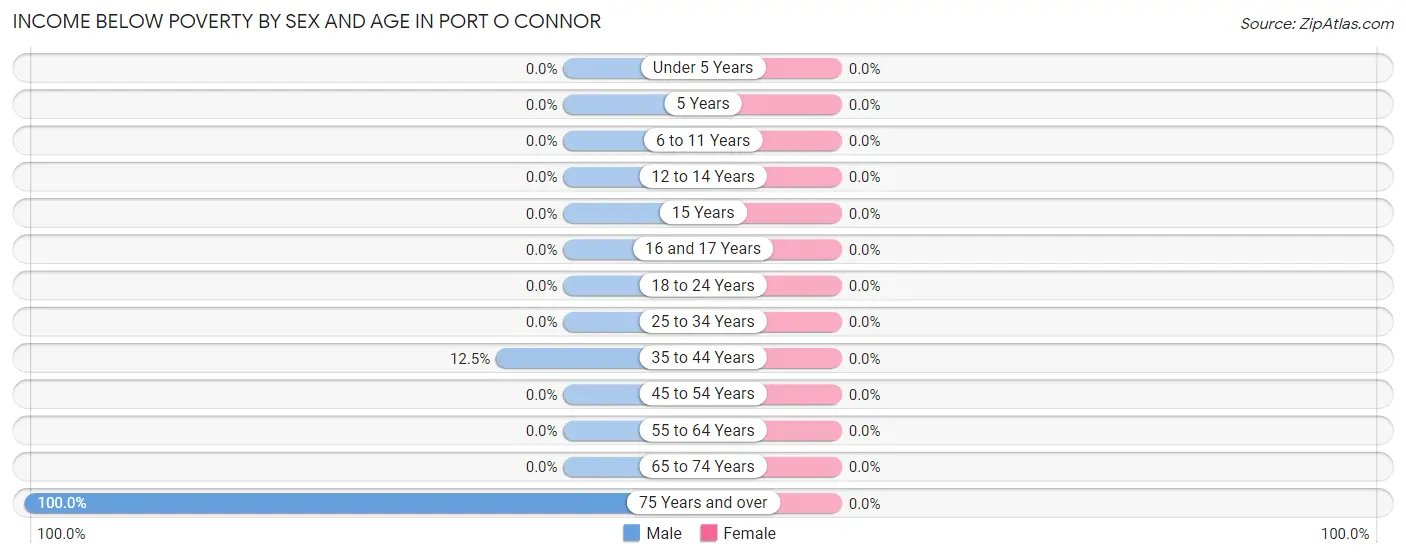
| Age Bracket | Male | Female |
| Under 5 Years | 0 (0.0%) | 0 (0.0%) |
| 5 Years | 0 (0.0%) | 0 (0.0%) |
| 6 to 11 Years | 0 (0.0%) | 0 (0.0%) |
| 12 to 14 Years | 0 (0.0%) | 0 (0.0%) |
| 15 Years | 0 (0.0%) | 0 (0.0%) |
| 16 and 17 Years | 0 (0.0%) | 0 (0.0%) |
| 18 to 24 Years | 0 (0.0%) | 0 (0.0%) |
| 25 to 34 Years | 0 (0.0%) | 0 (0.0%) |
| 35 to 44 Years | 1 (12.5%) | 0 (0.0%) |
| 45 to 54 Years | 0 (0.0%) | 0 (0.0%) |
| 55 to 64 Years | 0 (0.0%) | 0 (0.0%) |
| 65 to 74 Years | 0 (0.0%) | 0 (0.0%) |
| 75 Years and over | 1 (100.0%) | 0 (0.0%) |
| Total | 2 (0.5%) | 0 (0.0%) |
Income Above Poverty by Sex and Age in Port O Connor
According to the poverty statistics in Port O Connor, males aged 16 and 17 years and females aged under 5 years are the age groups that are most secure financially, with 100.0% of males and 100.0% of females in these age groups living above the poverty line.
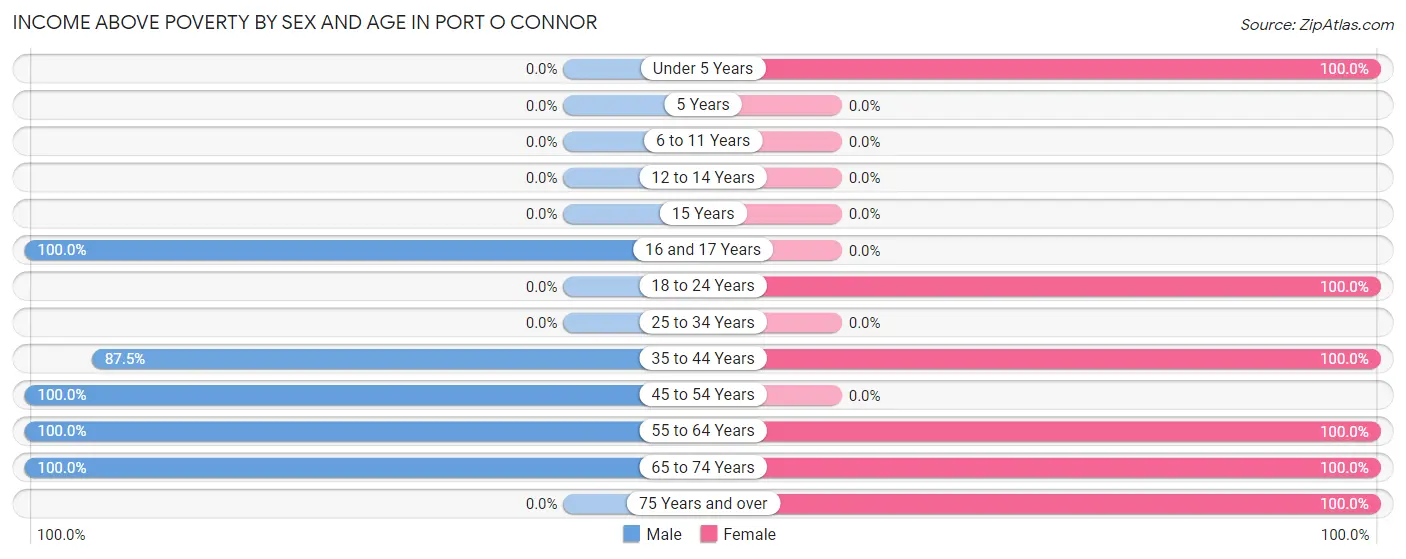
| Age Bracket | Male | Female |
| Under 5 Years | 0 (0.0%) | 12 (100.0%) |
| 5 Years | 0 (0.0%) | 0 (0.0%) |
| 6 to 11 Years | 0 (0.0%) | 0 (0.0%) |
| 12 to 14 Years | 0 (0.0%) | 0 (0.0%) |
| 15 Years | 0 (0.0%) | 0 (0.0%) |
| 16 and 17 Years | 81 (100.0%) | 0 (0.0%) |
| 18 to 24 Years | 0 (0.0%) | 30 (100.0%) |
| 25 to 34 Years | 0 (0.0%) | 0 (0.0%) |
| 35 to 44 Years | 7 (87.5%) | 20 (100.0%) |
| 45 to 54 Years | 44 (100.0%) | 0 (0.0%) |
| 55 to 64 Years | 114 (100.0%) | 108 (100.0%) |
| 65 to 74 Years | 142 (100.0%) | 178 (100.0%) |
| 75 Years and over | 0 (0.0%) | 53 (100.0%) |
| Total | 388 (99.5%) | 401 (100.0%) |
Income Below Poverty Among Married-Couple Families in Port O Connor
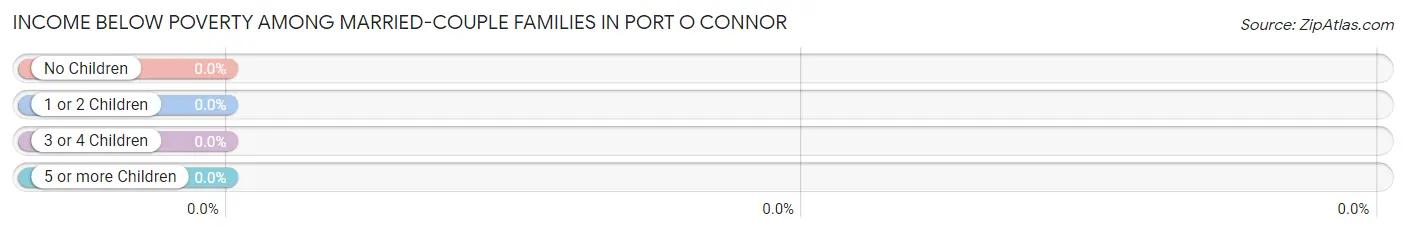
| Children | Above Poverty | Below Poverty |
| No Children | 173 (100.0%) | 0 (0.0%) |
| 1 or 2 Children | 75 (100.0%) | 0 (0.0%) |
| 3 or 4 Children | 0 (0.0%) | 0 (0.0%) |
| 5 or more Children | 0 (0.0%) | 0 (0.0%) |
| Total | 248 (100.0%) | 0 (0.0%) |
Income Below Poverty Among Single-Parent Households in Port O Connor
| Children | Single Father | Single Mother |
| No Children | 0 (0.0%) | 0 (0.0%) |
| 1 or 2 Children | 0 (0.0%) | 0 (0.0%) |
| 3 or 4 Children | 0 (0.0%) | 0 (0.0%) |
| 5 or more Children | 0 (0.0%) | 0 (0.0%) |
| Total | 0 (0.0%) | 0 (0.0%) |
Income Below Poverty Among Married-Couple vs Single-Parent Households in Port O Connor
| Children | Married-Couple Families | Single-Parent Households |
| No Children | 0 (0.0%) | 0 (0.0%) |
| 1 or 2 Children | 0 (0.0%) | 0 (0.0%) |
| 3 or 4 Children | 0 (0.0%) | 0 (0.0%) |
| 5 or more Children | 0 (0.0%) | 0 (0.0%) |
| Total | 0 (0.0%) | 0 (0.0%) |
Race in Port O Connor
The most populous races in Port O Connor are White / Caucasian (772 | 97.6%), Hispanic or Latino (21 | 2.6%), and Two or more Races (18 | 2.3%).
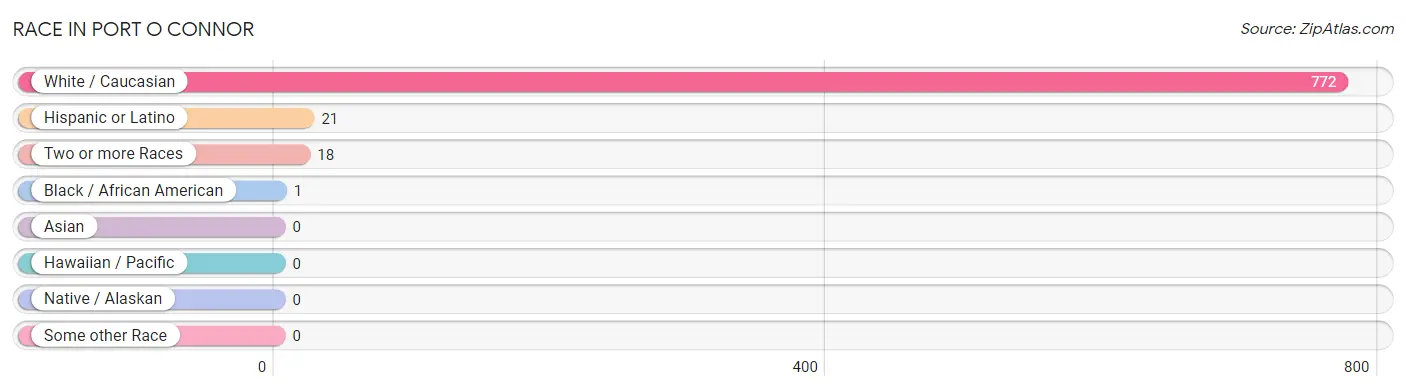
| Race | # Population | % Population |
| Asian | 0 | 0.0% |
| Black / African American | 1 | 0.1% |
| Hawaiian / Pacific | 0 | 0.0% |
| Hispanic or Latino | 21 | 2.6% |
| Native / Alaskan | 0 | 0.0% |
| White / Caucasian | 772 | 97.6% |
| Two or more Races | 18 | 2.3% |
| Some other Race | 0 | 0.0% |
| Total | 791 | 100.0% |
Ancestry in Port O Connor
The most populous ancestries reported in Port O Connor are German (393 | 49.7%), English (172 | 21.7%), Czech (139 | 17.6%), American (91 | 11.5%), and Irish (79 | 10.0%), together accounting for 110.5% of all Port O Connor residents.
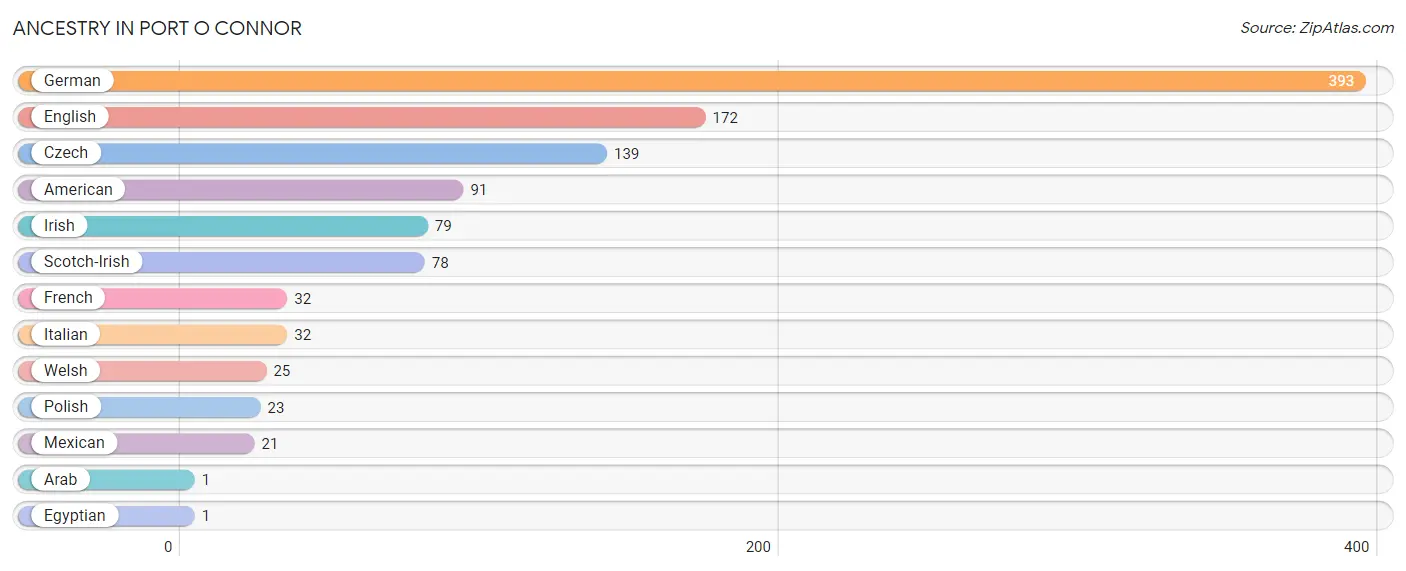
| Ancestry | # Population | % Population |
| American | 91 | 11.5% |
| Arab | 1 | 0.1% |
| Czech | 139 | 17.6% |
| Egyptian | 1 | 0.1% |
| English | 172 | 21.7% |
| French | 32 | 4.1% |
| German | 393 | 49.7% |
| Irish | 79 | 10.0% |
| Italian | 32 | 4.1% |
| Mexican | 21 | 2.6% |
| Polish | 23 | 2.9% |
| Scotch-Irish | 78 | 9.9% |
| Welsh | 25 | 3.2% | View All 13 Rows |
Immigrants in Port O Connor
The most numerous immigrant groups reported in Port O Connor came from Central America (21 | 2.6%), Latin America (21 | 2.6%), Mexico (21 | 2.6%), Africa (1 | 0.1%), and Egypt (1 | 0.1%), together accounting for 8.2% of all Port O Connor residents.
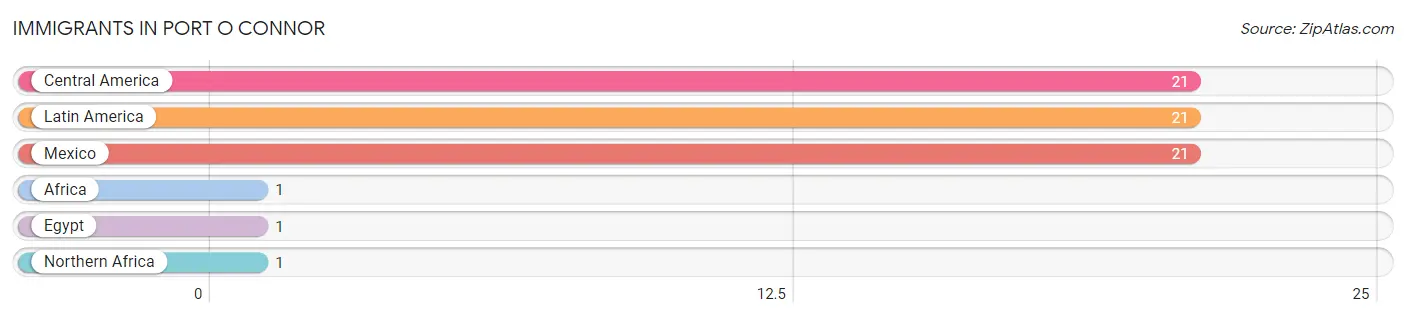
| Immigration Origin | # Population | % Population |
| Africa | 1 | 0.1% |
| Central America | 21 | 2.6% |
| Egypt | 1 | 0.1% |
| Latin America | 21 | 2.6% |
| Mexico | 21 | 2.6% |
| Northern Africa | 1 | 0.1% | View All 6 Rows |
Sex and Age in Port O Connor
Sex and Age in Port O Connor
The most populous age groups in Port O Connor are 65 to 69 Years (117 | 30.0%) for men and 65 to 69 Years (121 | 30.2%) for women.
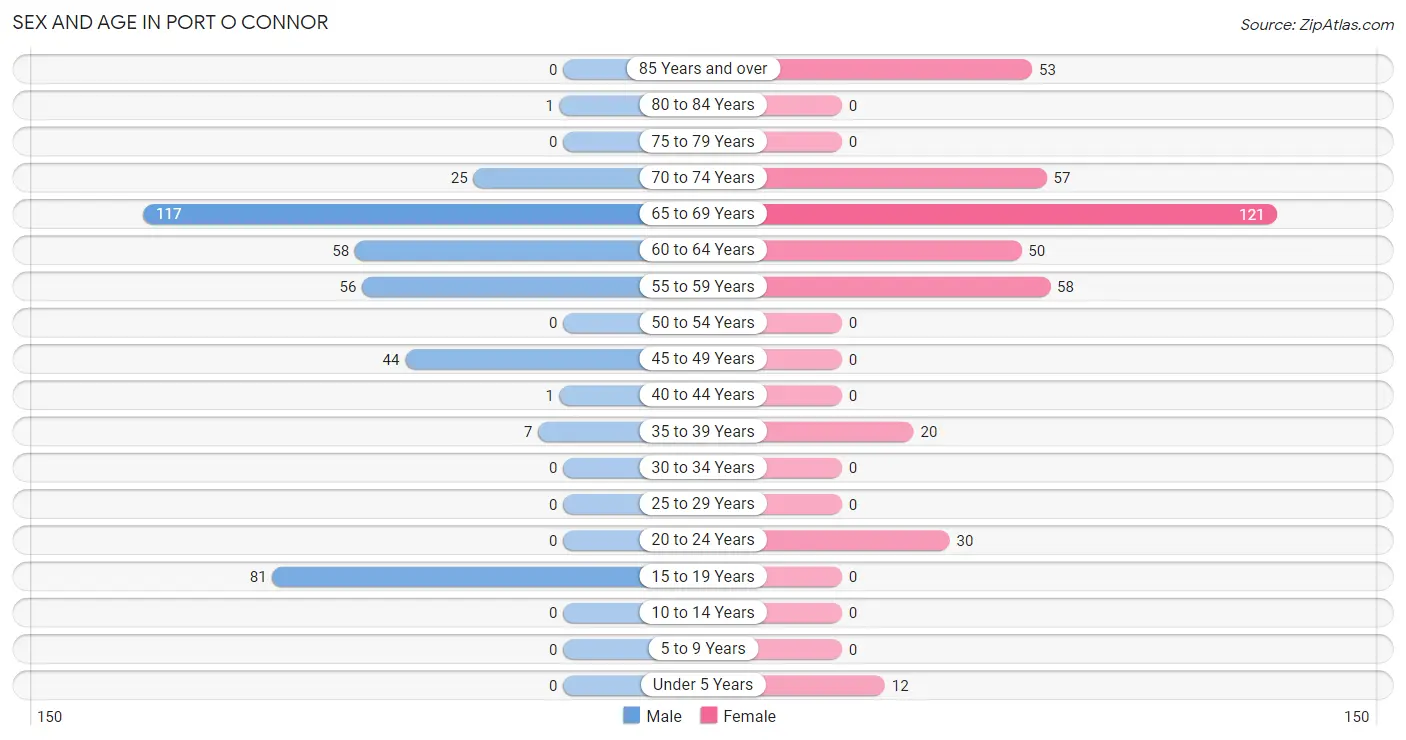
| Age Bracket | Male | Female |
| Under 5 Years | 0 (0.0%) | 12 (3.0%) |
| 5 to 9 Years | 0 (0.0%) | 0 (0.0%) |
| 10 to 14 Years | 0 (0.0%) | 0 (0.0%) |
| 15 to 19 Years | 81 (20.8%) | 0 (0.0%) |
| 20 to 24 Years | 0 (0.0%) | 30 (7.5%) |
| 25 to 29 Years | 0 (0.0%) | 0 (0.0%) |
| 30 to 34 Years | 0 (0.0%) | 0 (0.0%) |
| 35 to 39 Years | 7 (1.8%) | 20 (5.0%) |
| 40 to 44 Years | 1 (0.3%) | 0 (0.0%) |
| 45 to 49 Years | 44 (11.3%) | 0 (0.0%) |
| 50 to 54 Years | 0 (0.0%) | 0 (0.0%) |
| 55 to 59 Years | 56 (14.4%) | 58 (14.5%) |
| 60 to 64 Years | 58 (14.9%) | 50 (12.5%) |
| 65 to 69 Years | 117 (30.0%) | 121 (30.2%) |
| 70 to 74 Years | 25 (6.4%) | 57 (14.2%) |
| 75 to 79 Years | 0 (0.0%) | 0 (0.0%) |
| 80 to 84 Years | 1 (0.3%) | 0 (0.0%) |
| 85 Years and over | 0 (0.0%) | 53 (13.2%) |
| Total | 390 (100.0%) | 401 (100.0%) |
Families and Households in Port O Connor
Median Family Size in Port O Connor
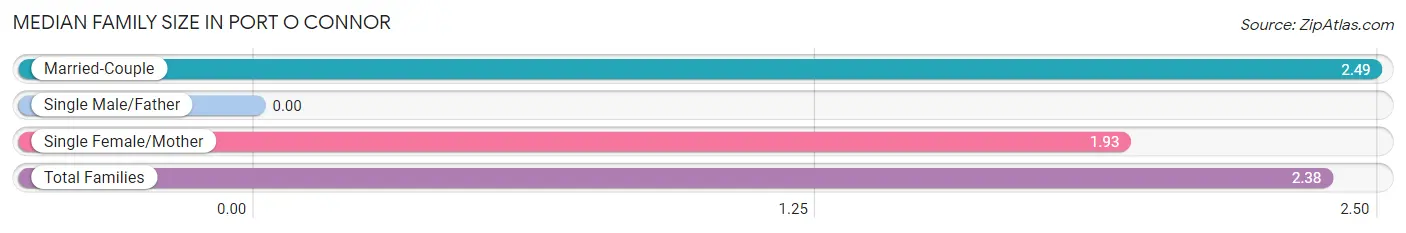
| Family Type | # Families | Family Size |
| Married-Couple | 248 (81.3%) | 2.49 |
| Single Male/Father | 0 (0.0%) | - |
| Single Female/Mother | 57 (18.7%) | 1.93 |
| Total Families | 305 (100.0%) | 2.38 |
Median Household Size in Port O Connor
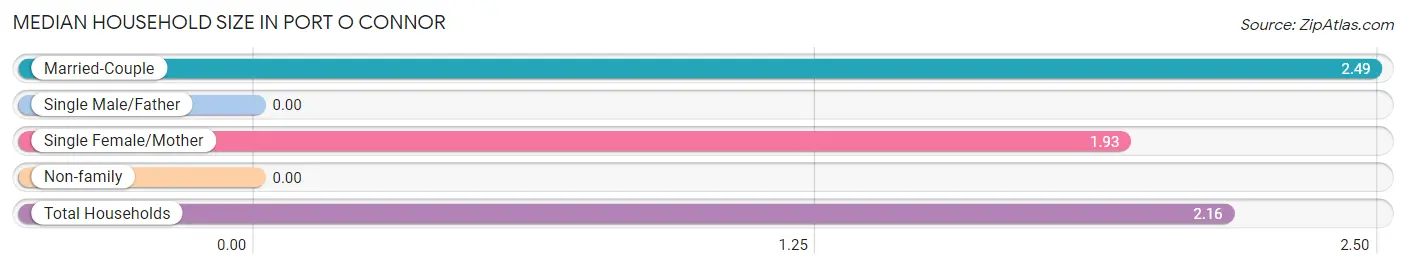
| Household Type | # Households | Household Size |
| Married-Couple | 248 (67.9%) | 2.49 |
| Single Male/Father | 0 (0.0%) | - |
| Single Female/Mother | 57 (15.6%) | 1.93 |
| Non-family | 60 (16.4%) | - |
| Total Households | 365 (100.0%) | 2.16 |
Household Size by Marriage Status in Port O Connor
Out of a total of 365 households in Port O Connor, 305 (83.6%) are family households, while 60 (16.4%) are nonfamily households. The most numerous type of family households are 2-person households, comprising 205, and the most common type of nonfamily households are 1-person households, comprising 60.
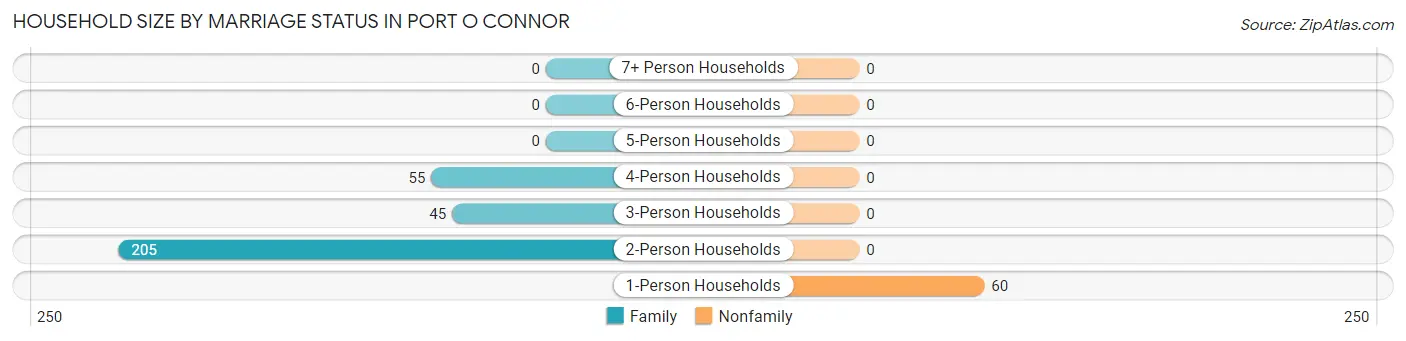
| Household Size | Family Households | Nonfamily Households |
| 1-Person Households | - | 60 (16.4%) |
| 2-Person Households | 205 (56.2%) | 0 (0.0%) |
| 3-Person Households | 45 (12.3%) | 0 (0.0%) |
| 4-Person Households | 55 (15.1%) | 0 (0.0%) |
| 5-Person Households | 0 (0.0%) | 0 (0.0%) |
| 6-Person Households | 0 (0.0%) | 0 (0.0%) |
| 7+ Person Households | 0 (0.0%) | 0 (0.0%) |
| Total | 305 (83.6%) | 60 (16.4%) |
Female Fertility in Port O Connor
Fertility by Age in Port O Connor
| Age Bracket | Women with Births | Births / 1,000 Women |
| 15 to 19 years | 0 (0.0%) | 0.0 |
| 20 to 34 years | 0 (0.0%) | 0.0 |
| 35 to 50 years | 0 (0.0%) | 0.0 |
| Total | 0 (0.0%) | 0.0 |
Fertility by Age by Marriage Status in Port O Connor
| Age Bracket | Married | Unmarried |
| 15 to 19 years | 0 (0.0%) | 0 (0.0%) |
| 20 to 34 years | 0 (0.0%) | 0 (0.0%) |
| 35 to 50 years | 0 (0.0%) | 0 (0.0%) |
| Total | 0 (0.0%) | 0 (0.0%) |
Fertility by Education in Port O Connor
| Educational Attainment | Women with Births | Births / 1,000 Women |
| Less than High School | 0 (0.0%) | 0.0 |
| High School Diploma | 0 (0.0%) | 0.0 |
| College or Associate's Degree | 0 (0.0%) | 0.0 |
| Bachelor's Degree | 0 (0.0%) | 0.0 |
| Graduate Degree | 0 (0.0%) | 0.0 |
| Total | 0 (0.0%) | 0.0 |
Fertility by Education by Marriage Status in Port O Connor
| Educational Attainment | Married | Unmarried |
| Less than High School | 0 (0.0%) | 0 (0.0%) |
| High School Diploma | 0 (0.0%) | 0 (0.0%) |
| College or Associate's Degree | 0 (0.0%) | 0 (0.0%) |
| Bachelor's Degree | 0 (0.0%) | 0 (0.0%) |
| Graduate Degree | 0 (0.0%) | 0 (0.0%) |
| Total | 0 (0.0%) | 0 (0.0%) |
Employment Characteristics in Port O Connor
Employment by Class of Employer in Port O Connor
Among the 222 employed individuals in Port O Connor, private company employees (115 | 51.8%), self-employed (not incorporated) (62 | 27.9%), and self-employed (incorporated) (44 | 19.8%) make up the most common classes of employment.
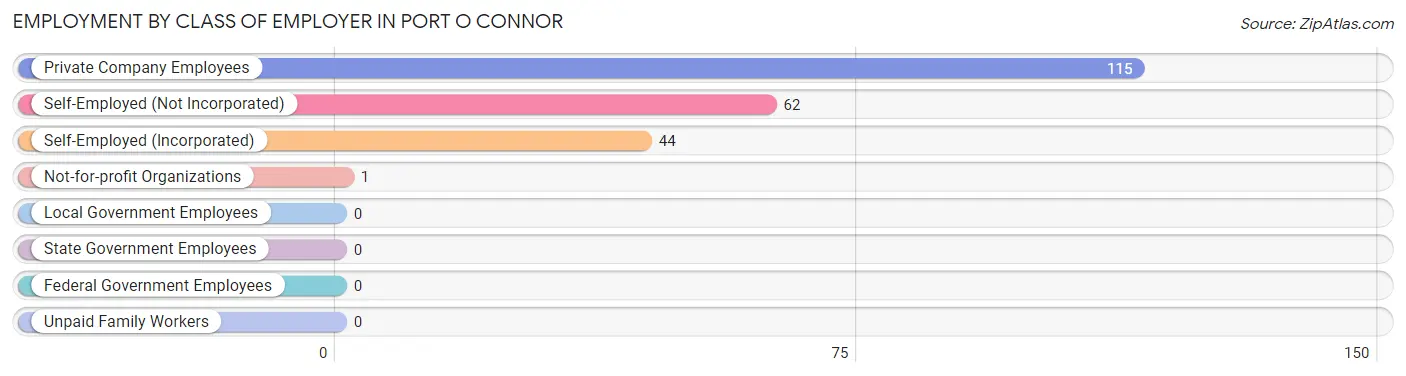
| Employer Class | # Employees | % Employees |
| Private Company Employees | 115 | 51.8% |
| Self-Employed (Incorporated) | 44 | 19.8% |
| Self-Employed (Not Incorporated) | 62 | 27.9% |
| Not-for-profit Organizations | 1 | 0.4% |
| Local Government Employees | 0 | 0.0% |
| State Government Employees | 0 | 0.0% |
| Federal Government Employees | 0 | 0.0% |
| Unpaid Family Workers | 0 | 0.0% |
| Total | 222 | 100.0% |
Employment Status by Age in Port O Connor
According to the labor force statistics for Port O Connor, out of the total population over 16 years of age (779), 28.6% or 223 individuals are in the labor force, with 0.4% or 1 of them unemployed. The age group with the highest labor force participation rate is 45 to 54 years, with 100.0% or 44 individuals in the labor force. Within the labor force, the 55 to 59 years age range has the highest percentage of unemployed individuals, with 1.8% or 1 of them being unemployed.
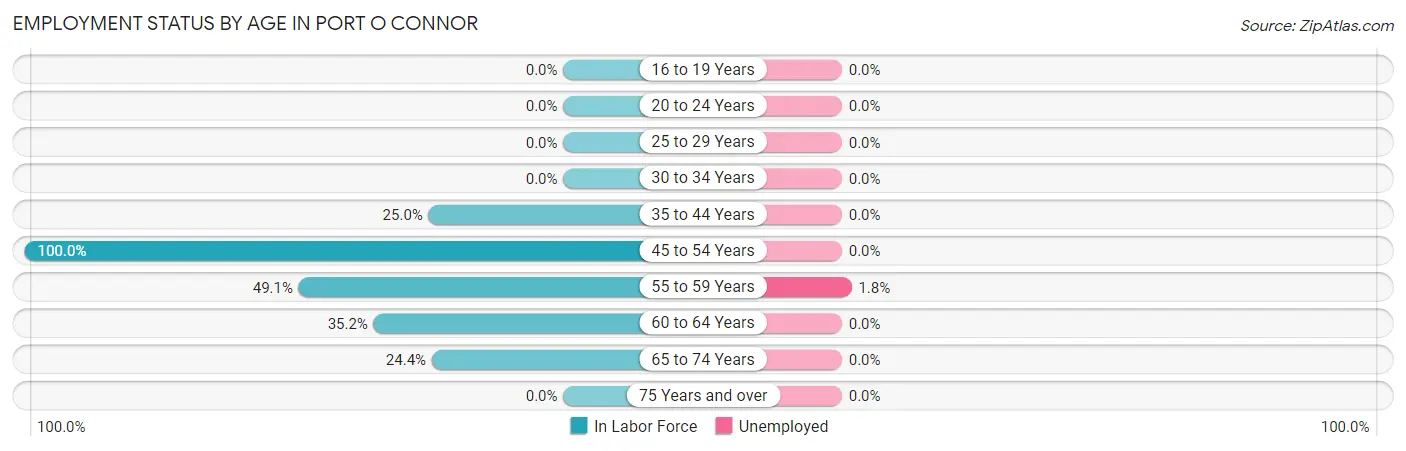
| Age Bracket | In Labor Force | Unemployed |
| 16 to 19 Years | 0 (0.0%) | 0 (0.0%) |
| 20 to 24 Years | 0 (0.0%) | 0 (0.0%) |
| 25 to 29 Years | 0 (0.0%) | 0 (0.0%) |
| 30 to 34 Years | 0 (0.0%) | 0 (0.0%) |
| 35 to 44 Years | 7 (25.0%) | 0 (0.0%) |
| 45 to 54 Years | 44 (100.0%) | 0 (0.0%) |
| 55 to 59 Years | 56 (49.1%) | 1 (1.8%) |
| 60 to 64 Years | 38 (35.2%) | 0 (0.0%) |
| 65 to 74 Years | 78 (24.4%) | 0 (0.0%) |
| 75 Years and over | 0 (0.0%) | 0 (0.0%) |
| Total | 223 (28.6%) | 1 (0.4%) |
Employment Status by Educational Attainment in Port O Connor
According to labor force statistics for Port O Connor, 49.3% of individuals (145) out of the total population between 25 and 64 years of age (294) are in the labor force, with 0.7% or 1 of them being unemployed. The group with the highest labor force participation rate are those with the educational attainment of high school diploma, with 51.6% or 63 individuals in the labor force. Within the labor force, individuals with high school diploma education have the highest percentage of unemployment, with 1.6% or 1 of them being unemployed.
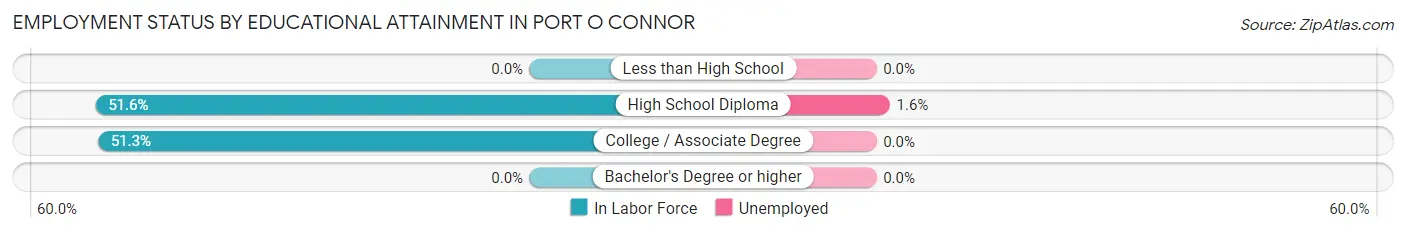
| Educational Attainment | In Labor Force | Unemployed |
| Less than High School | 0 (0.0%) | 0 (0.0%) |
| High School Diploma | 63 (51.6%) | 2 (1.6%) |
| College / Associate Degree | 82 (51.3%) | 0 (0.0%) |
| Bachelor's Degree or higher | 0 (0.0%) | 0 (0.0%) |
| Total | 145 (49.3%) | 2 (0.7%) |
Employment Occupations by Sex in Port O Connor
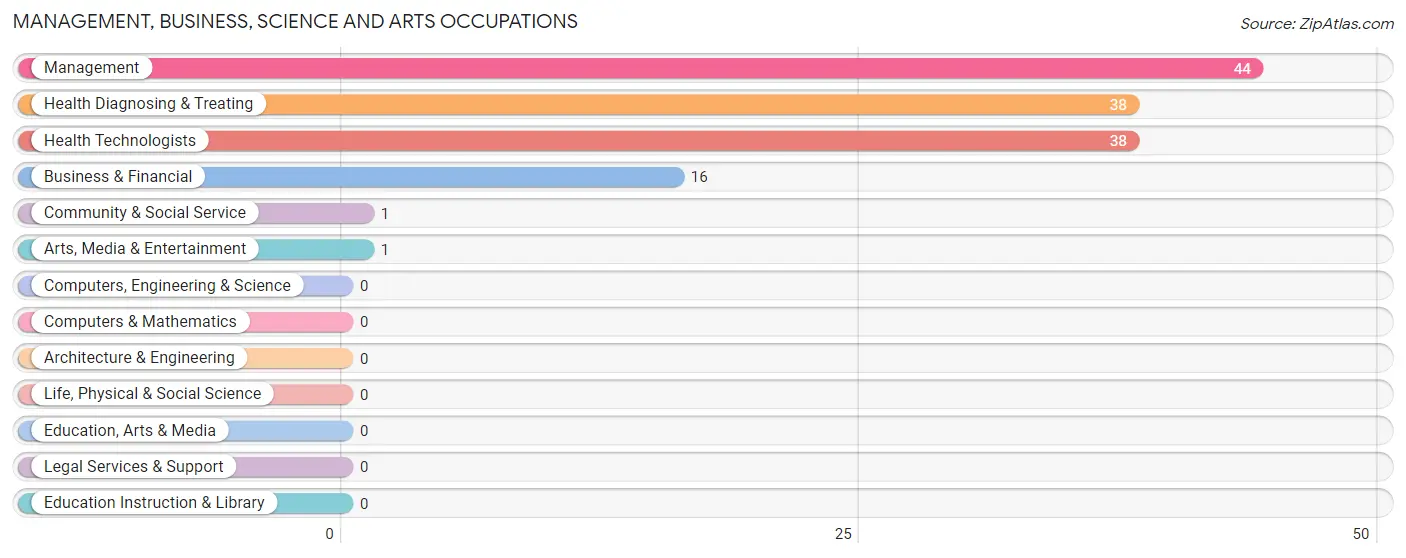
Management, Business, Science and Arts Occupations
The most common Management, Business, Science and Arts occupations in Port O Connor are Management (44 | 19.8%), Health Diagnosing & Treating (38 | 17.1%), Health Technologists (38 | 17.1%), Business & Financial (16 | 7.2%), and Community & Social Service (1 | 0.4%).
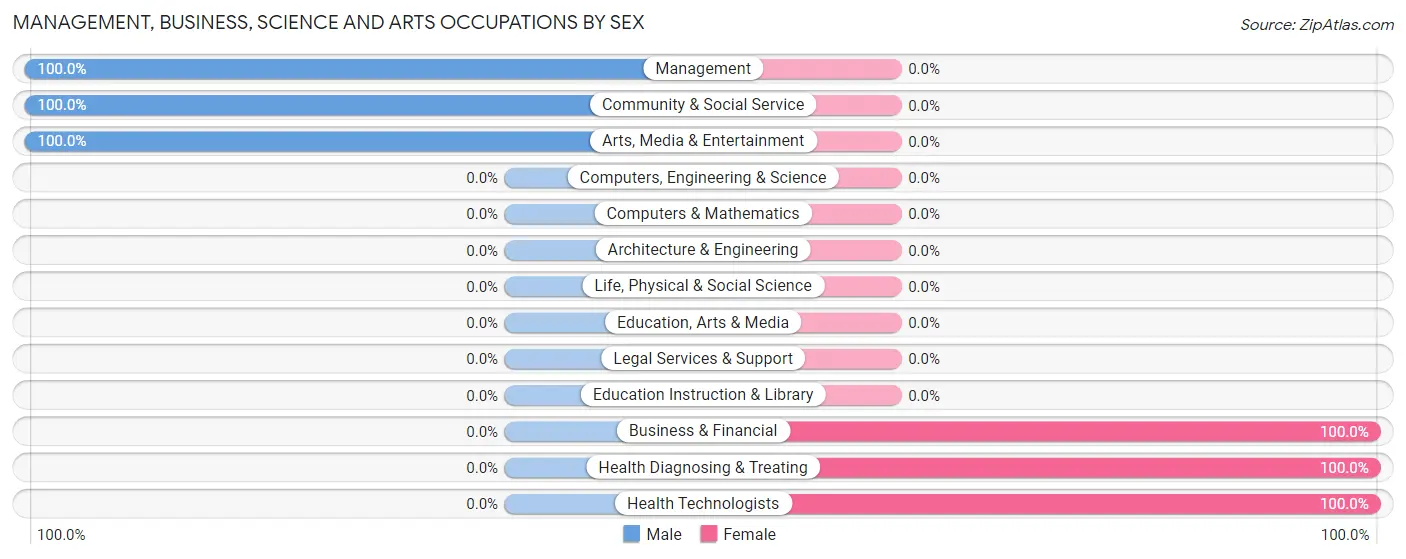
Management, Business, Science and Arts Occupations by Sex
Within the Management, Business, Science and Arts occupations in Port O Connor, the most male-oriented occupations are Management (100.0%), Community & Social Service (100.0%), and Arts, Media & Entertainment (100.0%), while the most female-oriented occupations are Business & Financial (100.0%), Health Diagnosing & Treating (100.0%), and Health Technologists (100.0%).
| Occupation | Male | Female |
| Management | 44 (100.0%) | 0 (0.0%) |
| Business & Financial | 0 (0.0%) | 16 (100.0%) |
| Computers, Engineering & Science | 0 (0.0%) | 0 (0.0%) |
| Computers & Mathematics | 0 (0.0%) | 0 (0.0%) |
| Architecture & Engineering | 0 (0.0%) | 0 (0.0%) |
| Life, Physical & Social Science | 0 (0.0%) | 0 (0.0%) |
| Community & Social Service | 1 (100.0%) | 0 (0.0%) |
| Education, Arts & Media | 0 (0.0%) | 0 (0.0%) |
| Legal Services & Support | 0 (0.0%) | 0 (0.0%) |
| Education Instruction & Library | 0 (0.0%) | 0 (0.0%) |
| Arts, Media & Entertainment | 1 (100.0%) | 0 (0.0%) |
| Health Diagnosing & Treating | 0 (0.0%) | 38 (100.0%) |
| Health Technologists | 0 (0.0%) | 38 (100.0%) |
| Total (Category) | 45 (45.5%) | 54 (54.5%) |
| Total (Overall) | 168 (75.7%) | 54 (24.3%) |
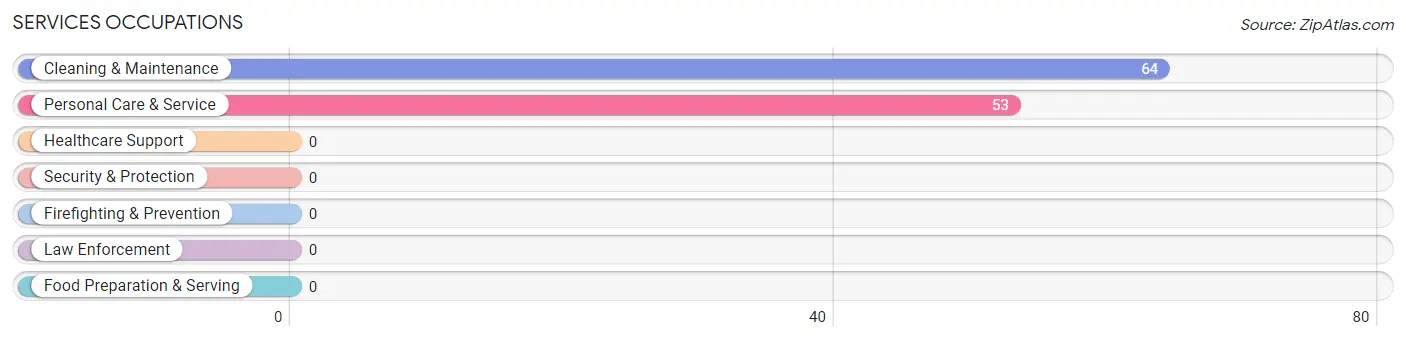
Services Occupations
The most common Services occupations in Port O Connor are Cleaning & Maintenance (64 | 28.8%), and Personal Care & Service (53 | 23.9%).
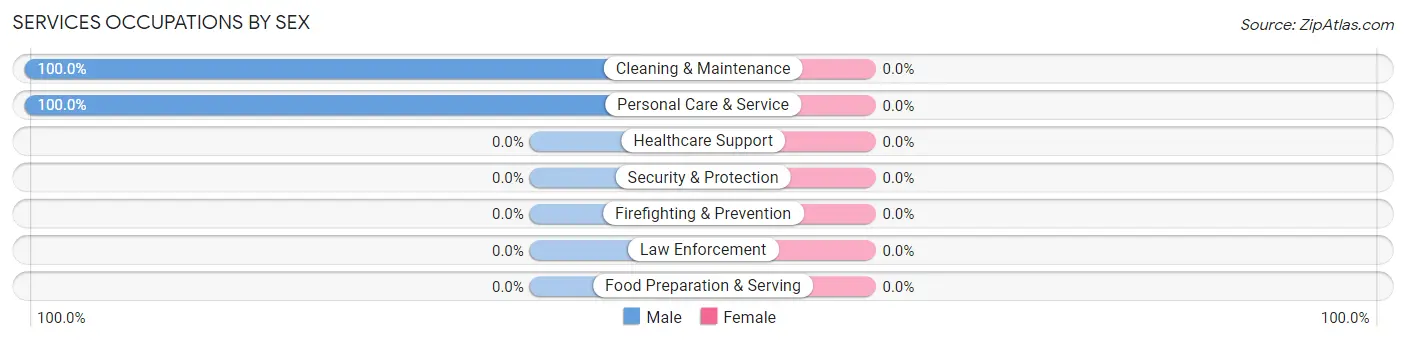
Services Occupations by Sex
| Occupation | Male | Female |
| Healthcare Support | 0 (0.0%) | 0 (0.0%) |
| Security & Protection | 0 (0.0%) | 0 (0.0%) |
| Firefighting & Prevention | 0 (0.0%) | 0 (0.0%) |
| Law Enforcement | 0 (0.0%) | 0 (0.0%) |
| Food Preparation & Serving | 0 (0.0%) | 0 (0.0%) |
| Cleaning & Maintenance | 64 (100.0%) | 0 (0.0%) |
| Personal Care & Service | 53 (100.0%) | 0 (0.0%) |
| Total (Category) | 117 (100.0%) | 0 (0.0%) |
| Total (Overall) | 168 (75.7%) | 54 (24.3%) |
Sales and Office Occupations

Sales and Office Occupations by Sex

| Occupation | Male | Female |
| Sales & Related | 0 (0.0%) | 0 (0.0%) |
| Office & Administration | 0 (0.0%) | 0 (0.0%) |
| Total (Category) | 0 (0.0%) | 0 (0.0%) |
| Total (Overall) | 168 (75.7%) | 54 (24.3%) |
Natural Resources, Construction and Maintenance Occupations
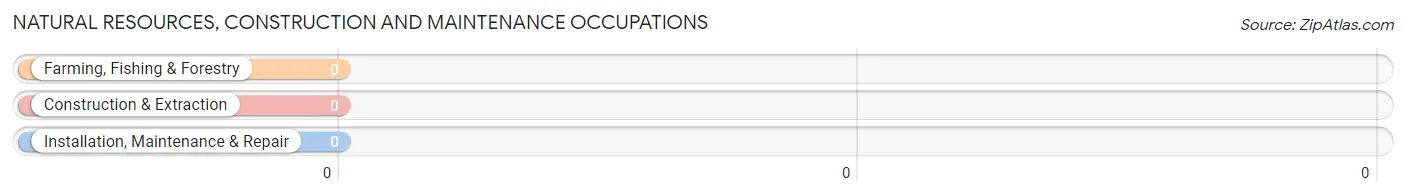
Natural Resources, Construction and Maintenance Occupations by Sex

| Occupation | Male | Female |
| Farming, Fishing & Forestry | 0 (0.0%) | 0 (0.0%) |
| Construction & Extraction | 0 (0.0%) | 0 (0.0%) |
| Installation, Maintenance & Repair | 0 (0.0%) | 0 (0.0%) |
| Total (Category) | 0 (0.0%) | 0 (0.0%) |
| Total (Overall) | 168 (75.7%) | 54 (24.3%) |
Production, Transportation and Moving Occupations
The most common Production, Transportation and Moving occupations in Port O Connor are , and Material Moving (6 | 2.7%).
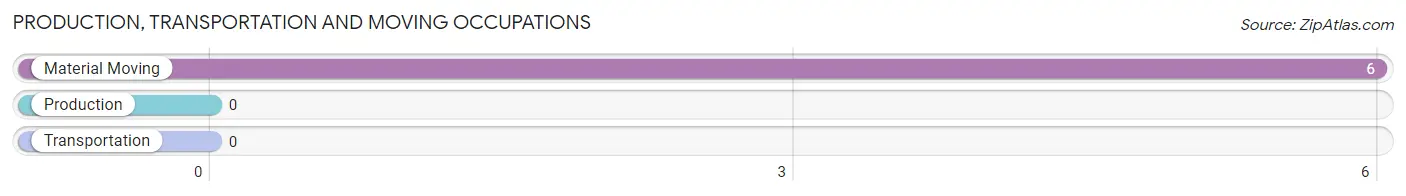
Production, Transportation and Moving Occupations by Sex
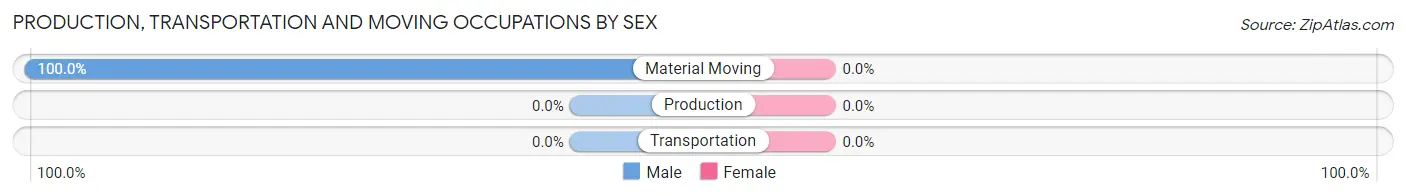
| Occupation | Male | Female |
| Production | 0 (0.0%) | 0 (0.0%) |
| Transportation | 0 (0.0%) | 0 (0.0%) |
| Material Moving | 6 (100.0%) | 0 (0.0%) |
| Total (Category) | 6 (100.0%) | 0 (0.0%) |
| Total (Overall) | 168 (75.7%) | 54 (24.3%) |
Employment Industries by Sex in Port O Connor
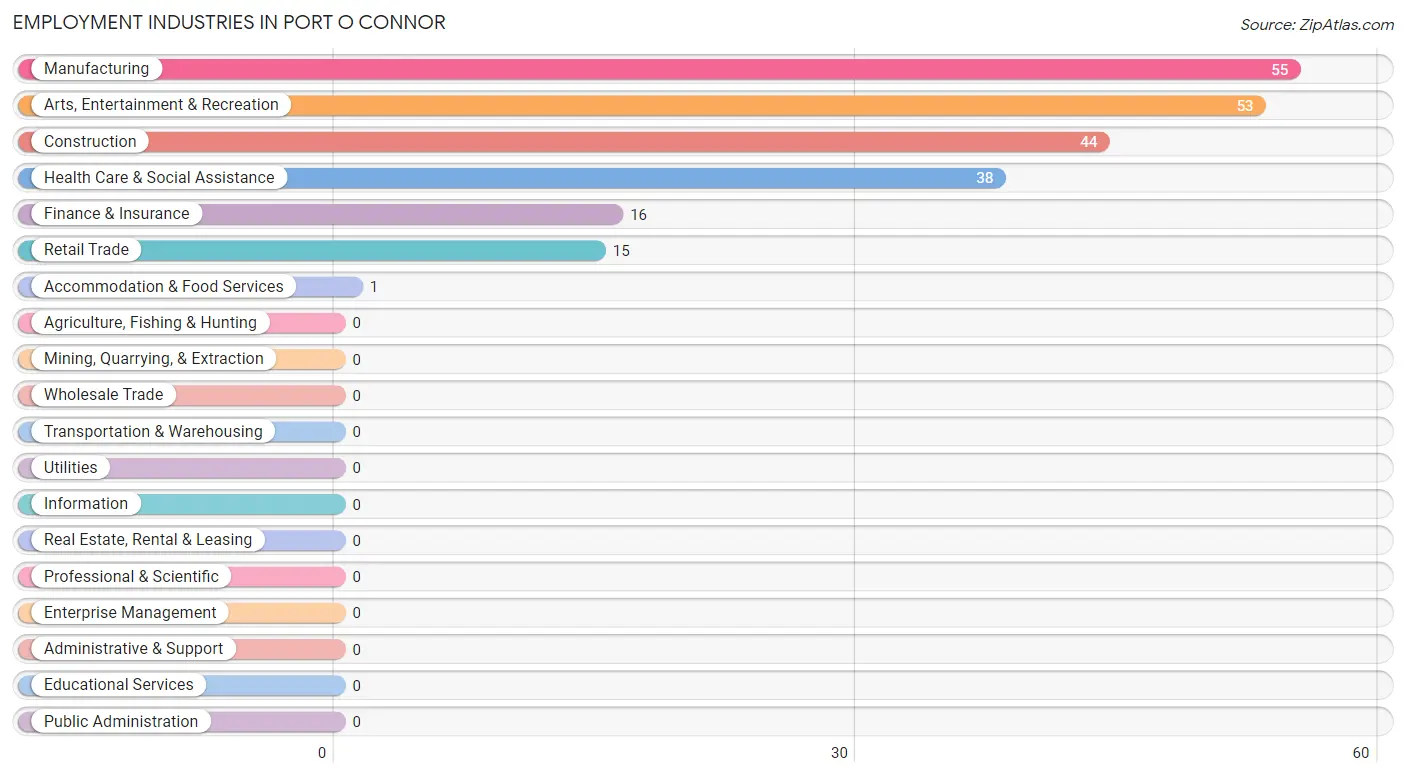
Employment Industries in Port O Connor
The major employment industries in Port O Connor include Manufacturing (55 | 24.8%), Arts, Entertainment & Recreation (53 | 23.9%), Construction (44 | 19.8%), Health Care & Social Assistance (38 | 17.1%), and Finance & Insurance (16 | 7.2%).
Employment Industries by Sex in Port O Connor
The Port O Connor industries that see more men than women are Construction (100.0%), Manufacturing (100.0%), and Retail Trade (100.0%), whereas the industries that tend to have a higher number of women are Finance & Insurance (100.0%), and Health Care & Social Assistance (100.0%).
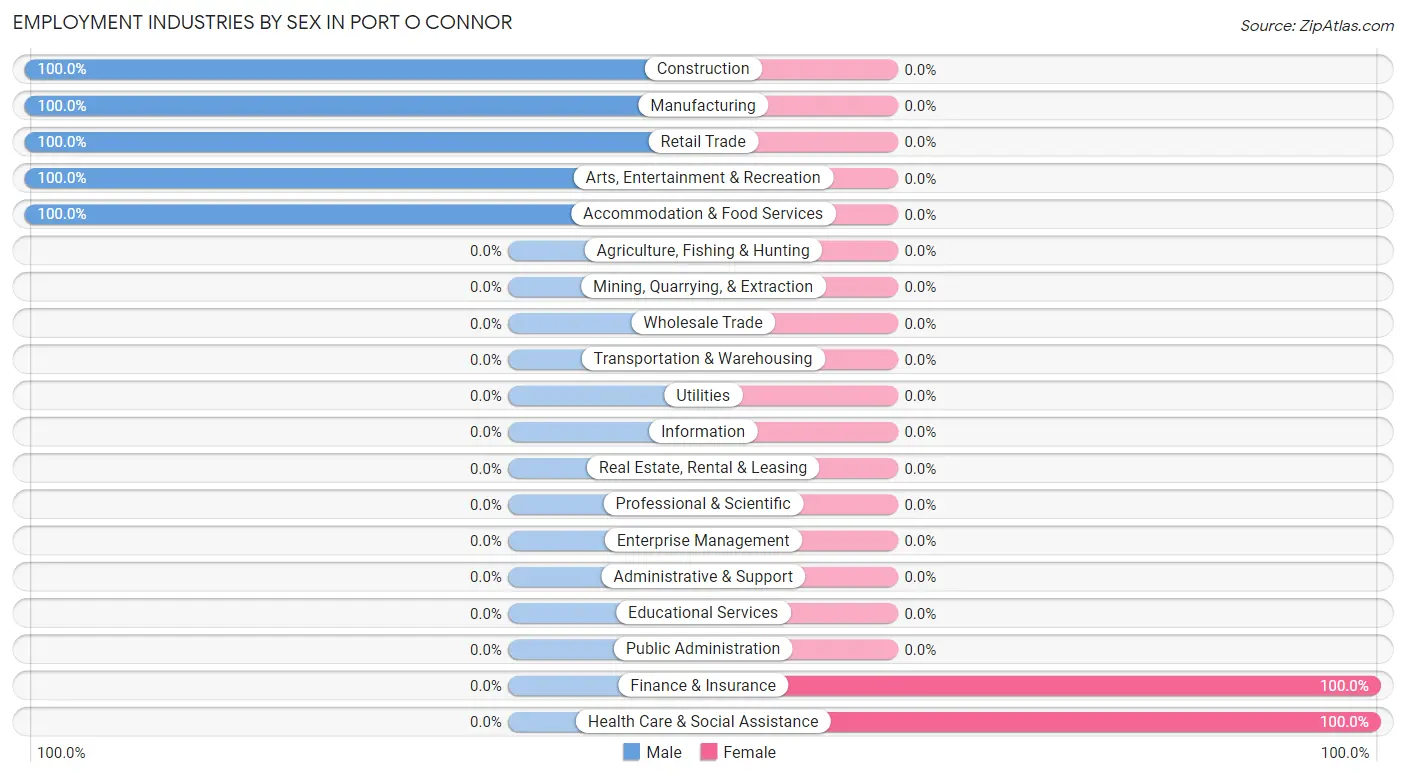
| Industry | Male | Female |
| Agriculture, Fishing & Hunting | 0 (0.0%) | 0 (0.0%) |
| Mining, Quarrying, & Extraction | 0 (0.0%) | 0 (0.0%) |
| Construction | 44 (100.0%) | 0 (0.0%) |
| Manufacturing | 55 (100.0%) | 0 (0.0%) |
| Wholesale Trade | 0 (0.0%) | 0 (0.0%) |
| Retail Trade | 15 (100.0%) | 0 (0.0%) |
| Transportation & Warehousing | 0 (0.0%) | 0 (0.0%) |
| Utilities | 0 (0.0%) | 0 (0.0%) |
| Information | 0 (0.0%) | 0 (0.0%) |
| Finance & Insurance | 0 (0.0%) | 16 (100.0%) |
| Real Estate, Rental & Leasing | 0 (0.0%) | 0 (0.0%) |
| Professional & Scientific | 0 (0.0%) | 0 (0.0%) |
| Enterprise Management | 0 (0.0%) | 0 (0.0%) |
| Administrative & Support | 0 (0.0%) | 0 (0.0%) |
| Educational Services | 0 (0.0%) | 0 (0.0%) |
| Health Care & Social Assistance | 0 (0.0%) | 38 (100.0%) |
| Arts, Entertainment & Recreation | 53 (100.0%) | 0 (0.0%) |
| Accommodation & Food Services | 1 (100.0%) | 0 (0.0%) |
| Public Administration | 0 (0.0%) | 0 (0.0%) |
| Total | 168 (75.7%) | 54 (24.3%) |
Education in Port O Connor
School Enrollment in Port O Connor
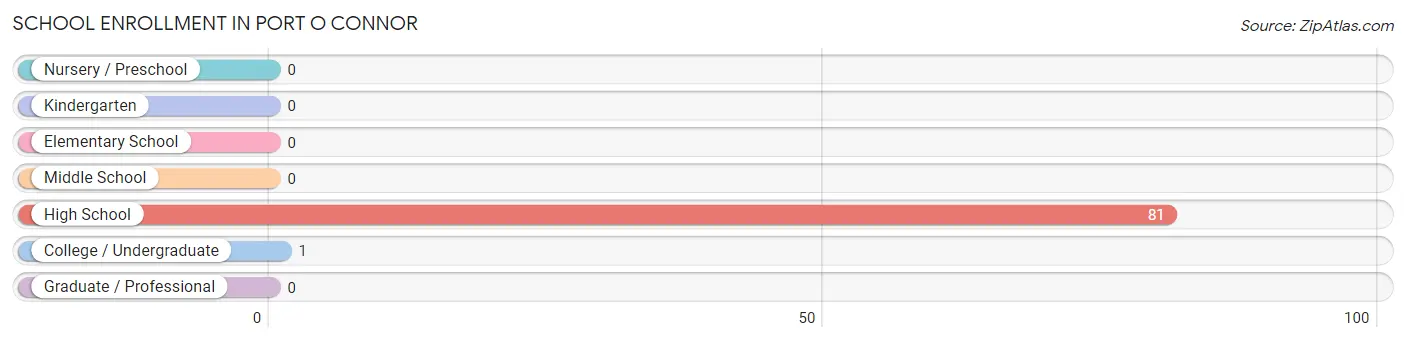
The most common levels of schooling among the 82 students in Port O Connor are high school (81 | 98.8%), and college / undergraduate (1 | 1.2%).
| School Level | # Students | % Students |
| Nursery / Preschool | 0 | 0.0% |
| Kindergarten | 0 | 0.0% |
| Elementary School | 0 | 0.0% |
| Middle School | 0 | 0.0% |
| High School | 81 | 98.8% |
| College / Undergraduate | 1 | 1.2% |
| Graduate / Professional | 0 | 0.0% |
| Total | 82 | 100.0% |
School Enrollment by Age by Funding Source in Port O Connor
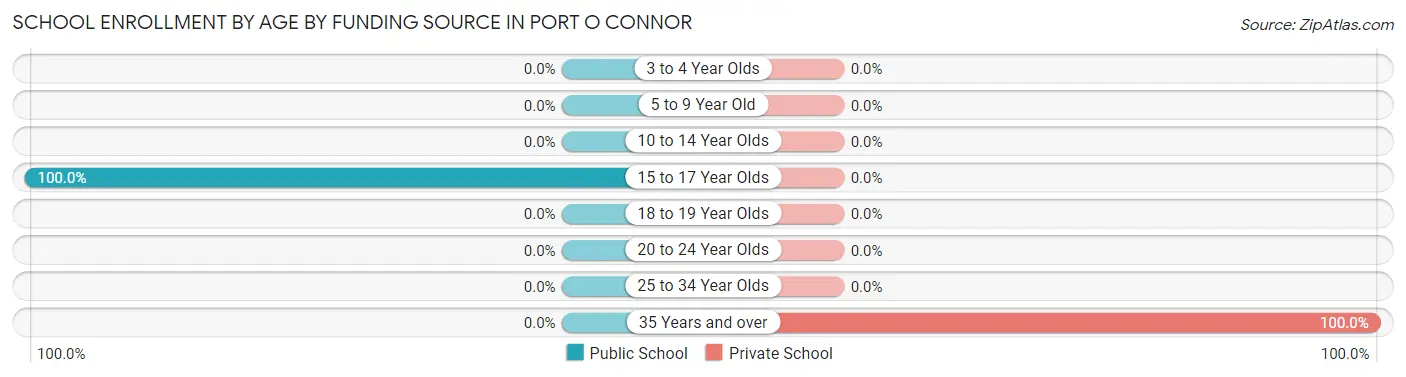
Out of a total of 82 students who are enrolled in schools in Port O Connor, 1 (1.2%) attend a private institution, while the remaining 81 (98.8%) are enrolled in public schools. The age group of 35 years and over has the highest likelihood of being enrolled in private schools, with 1 (100.0% in the age bracket) enrolled. Conversely, the age group of 15 to 17 year olds has the lowest likelihood of being enrolled in a private school, with 81 (100.0% in the age bracket) attending a public institution.
| Age Bracket | Public School | Private School |
| 3 to 4 Year Olds | 0 (0.0%) | 0 (0.0%) |
| 5 to 9 Year Old | 0 (0.0%) | 0 (0.0%) |
| 10 to 14 Year Olds | 0 (0.0%) | 0 (0.0%) |
| 15 to 17 Year Olds | 81 (100.0%) | 0 (0.0%) |
| 18 to 19 Year Olds | 0 (0.0%) | 0 (0.0%) |
| 20 to 24 Year Olds | 0 (0.0%) | 0 (0.0%) |
| 25 to 34 Year Olds | 0 (0.0%) | 0 (0.0%) |
| 35 Years and over | 0 (0.0%) | 1 (100.0%) |
| Total | 81 (98.8%) | 1 (1.2%) |
Educational Attainment by Field of Study in Port O Connor
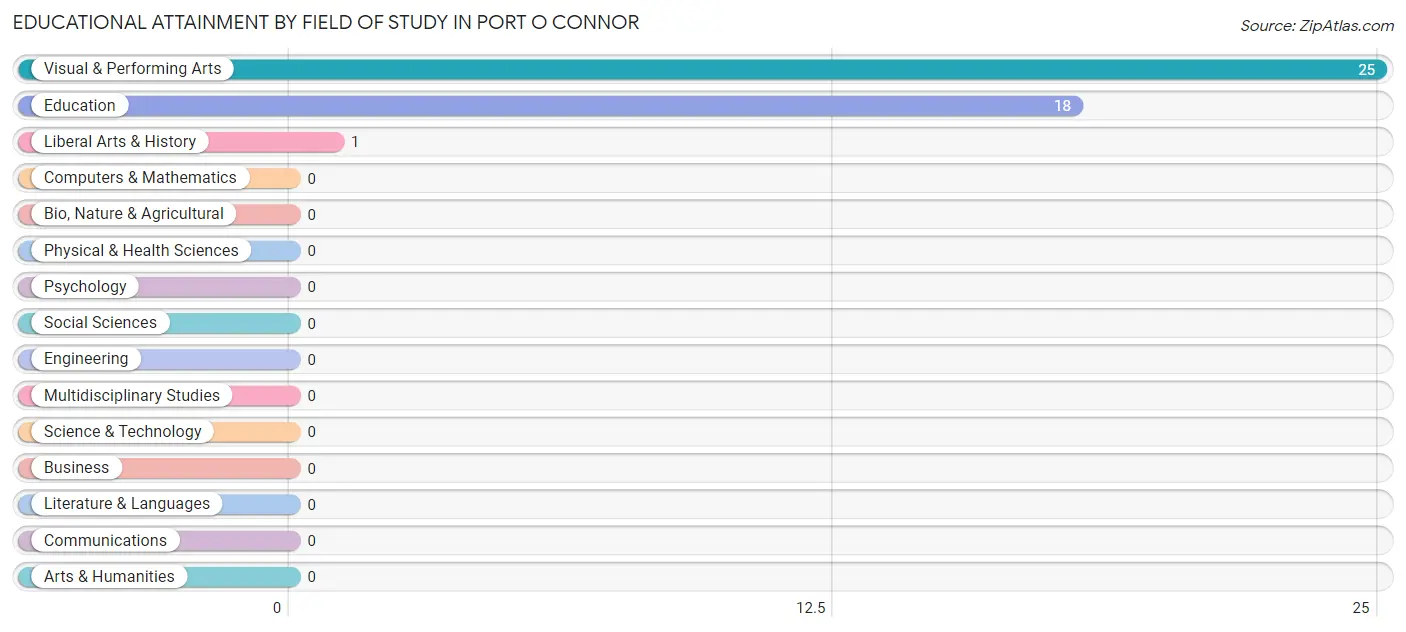
Visual & performing arts (25 | 56.8%), education (18 | 40.9%), and liberal arts & history (1 | 2.3%) are the most common fields of study among 44 individuals in Port O Connor who have obtained a bachelor's degree or higher.
| Field of Study | # Graduates | % Graduates |
| Computers & Mathematics | 0 | 0.0% |
| Bio, Nature & Agricultural | 0 | 0.0% |
| Physical & Health Sciences | 0 | 0.0% |
| Psychology | 0 | 0.0% |
| Social Sciences | 0 | 0.0% |
| Engineering | 0 | 0.0% |
| Multidisciplinary Studies | 0 | 0.0% |
| Science & Technology | 0 | 0.0% |
| Business | 0 | 0.0% |
| Education | 18 | 40.9% |
| Literature & Languages | 0 | 0.0% |
| Liberal Arts & History | 1 | 2.3% |
| Visual & Performing Arts | 25 | 56.8% |
| Communications | 0 | 0.0% |
| Arts & Humanities | 0 | 0.0% |
| Total | 44 | 100.0% |
Transportation & Commute in Port O Connor
Vehicle Availability by Sex in Port O Connor
The most prevalent vehicle ownership categories in Port O Connor are males with 3 vehicles (108, accounting for 64.7%) and females with 3 vehicles (38, making up 200.0%).
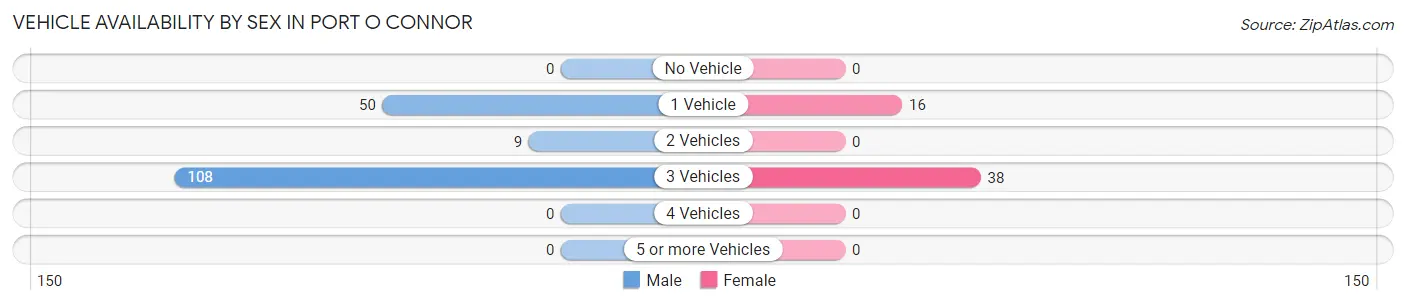
| Vehicles Available | Male | Female |
| No Vehicle | 0 (0.0%) | 0 (0.0%) |
| 1 Vehicle | 50 (29.9%) | 16 (29.6%) |
| 2 Vehicles | 9 (5.4%) | 0 (0.0%) |
| 3 Vehicles | 108 (64.7%) | 38 (70.4%) |
| 4 Vehicles | 0 (0.0%) | 0 (0.0%) |
| 5 or more Vehicles | 0 (0.0%) | 0 (0.0%) |
| Total | 167 (100.0%) | 54 (100.0%) |
Commute Time in Port O Connor
The most frequently occuring commute durations in Port O Connor are 5 to 9 minutes (117 commuters, 52.9%), 35 to 39 minutes (44 commuters, 19.9%), and 60 to 89 minutes (38 commuters, 17.2%).
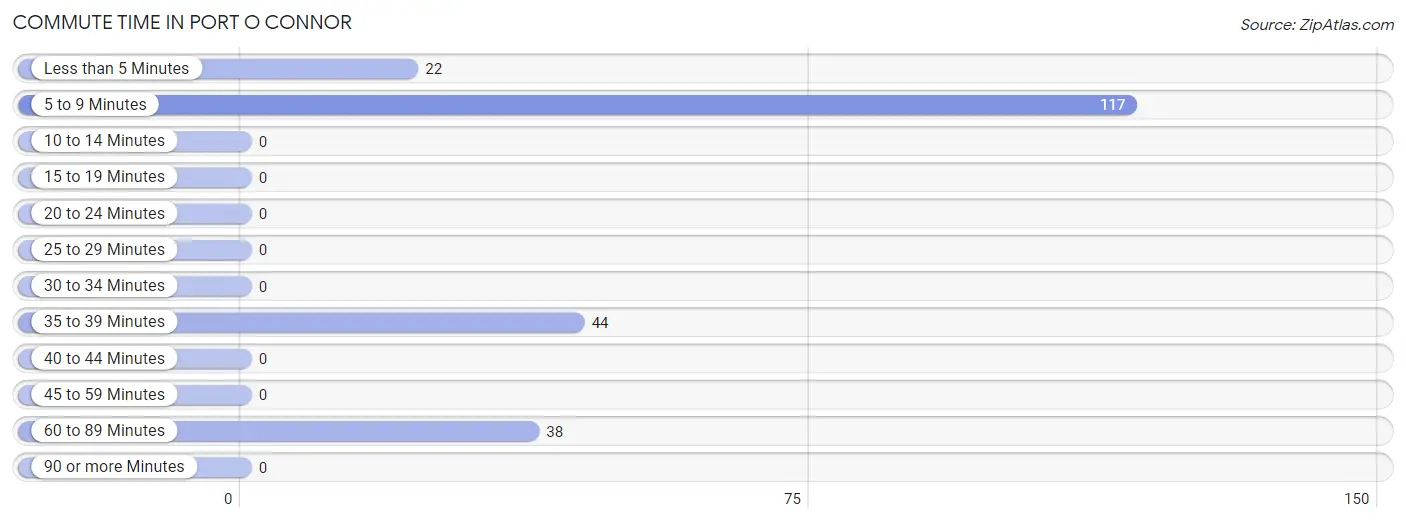
| Commute Time | # Commuters | % Commuters |
| Less than 5 Minutes | 22 | 10.0% |
| 5 to 9 Minutes | 117 | 52.9% |
| 10 to 14 Minutes | 0 | 0.0% |
| 15 to 19 Minutes | 0 | 0.0% |
| 20 to 24 Minutes | 0 | 0.0% |
| 25 to 29 Minutes | 0 | 0.0% |
| 30 to 34 Minutes | 0 | 0.0% |
| 35 to 39 Minutes | 44 | 19.9% |
| 40 to 44 Minutes | 0 | 0.0% |
| 45 to 59 Minutes | 0 | 0.0% |
| 60 to 89 Minutes | 38 | 17.2% |
| 90 or more Minutes | 0 | 0.0% |
Commute Time by Sex in Port O Connor
The most common commute times in Port O Connor are 5 to 9 minutes (117 commuters, 70.1%) for males and 60 to 89 minutes (38 commuters, 70.4%) for females.
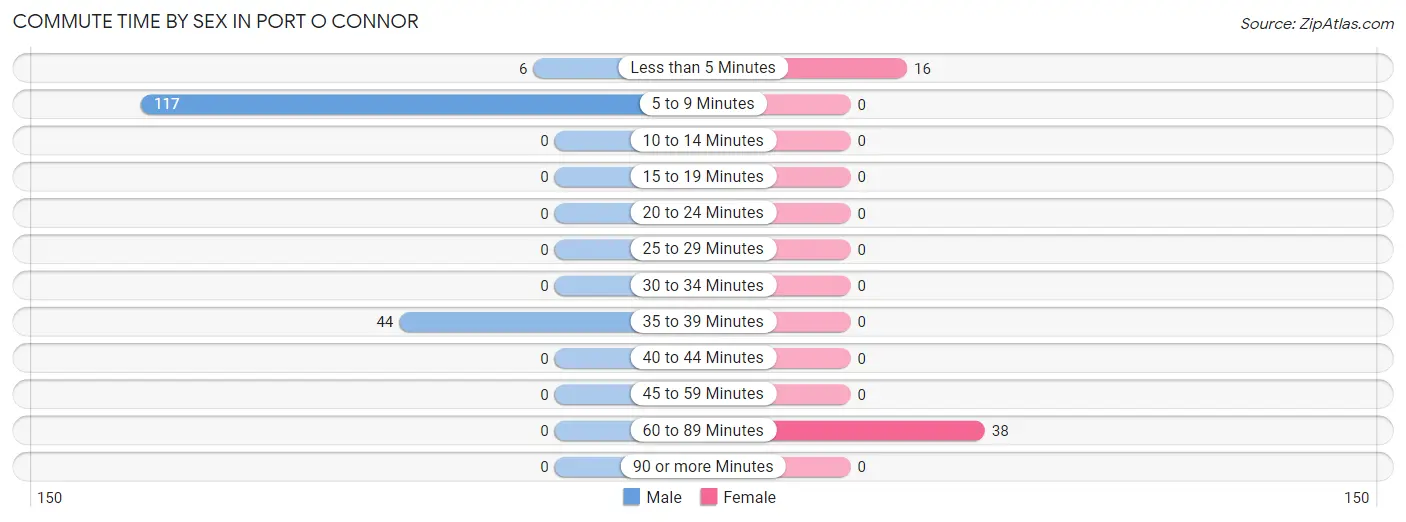
| Commute Time | Male | Female |
| Less than 5 Minutes | 6 (3.6%) | 16 (29.6%) |
| 5 to 9 Minutes | 117 (70.1%) | 0 (0.0%) |
| 10 to 14 Minutes | 0 (0.0%) | 0 (0.0%) |
| 15 to 19 Minutes | 0 (0.0%) | 0 (0.0%) |
| 20 to 24 Minutes | 0 (0.0%) | 0 (0.0%) |
| 25 to 29 Minutes | 0 (0.0%) | 0 (0.0%) |
| 30 to 34 Minutes | 0 (0.0%) | 0 (0.0%) |
| 35 to 39 Minutes | 44 (26.4%) | 0 (0.0%) |
| 40 to 44 Minutes | 0 (0.0%) | 0 (0.0%) |
| 45 to 59 Minutes | 0 (0.0%) | 0 (0.0%) |
| 60 to 89 Minutes | 0 (0.0%) | 38 (70.4%) |
| 90 or more Minutes | 0 (0.0%) | 0 (0.0%) |
Time of Departure to Work by Sex in Port O Connor
The most frequent times of departure to work in Port O Connor are 7:00 AM to 7:29 AM (117, 70.1%) for males and 4:00 PM to 11:59 PM (38, 70.4%) for females.
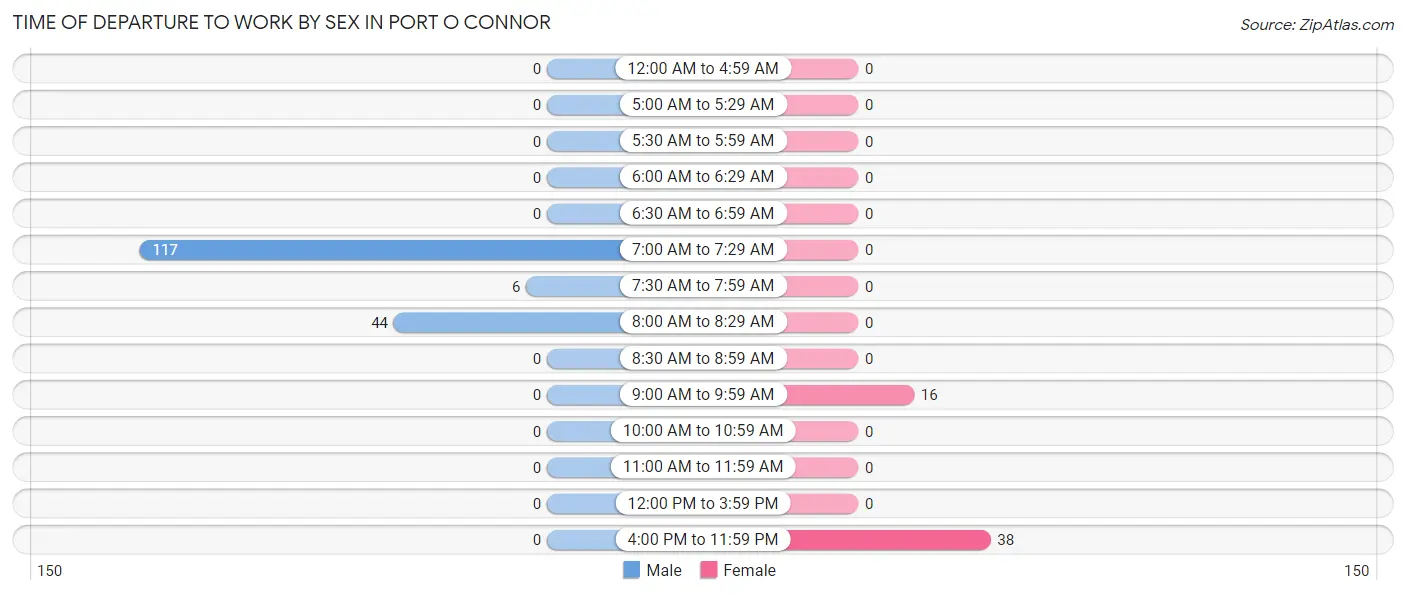
| Time of Departure | Male | Female |
| 12:00 AM to 4:59 AM | 0 (0.0%) | 0 (0.0%) |
| 5:00 AM to 5:29 AM | 0 (0.0%) | 0 (0.0%) |
| 5:30 AM to 5:59 AM | 0 (0.0%) | 0 (0.0%) |
| 6:00 AM to 6:29 AM | 0 (0.0%) | 0 (0.0%) |
| 6:30 AM to 6:59 AM | 0 (0.0%) | 0 (0.0%) |
| 7:00 AM to 7:29 AM | 117 (70.1%) | 0 (0.0%) |
| 7:30 AM to 7:59 AM | 6 (3.6%) | 0 (0.0%) |
| 8:00 AM to 8:29 AM | 44 (26.4%) | 0 (0.0%) |
| 8:30 AM to 8:59 AM | 0 (0.0%) | 0 (0.0%) |
| 9:00 AM to 9:59 AM | 0 (0.0%) | 16 (29.6%) |
| 10:00 AM to 10:59 AM | 0 (0.0%) | 0 (0.0%) |
| 11:00 AM to 11:59 AM | 0 (0.0%) | 0 (0.0%) |
| 12:00 PM to 3:59 PM | 0 (0.0%) | 0 (0.0%) |
| 4:00 PM to 11:59 PM | 0 (0.0%) | 38 (70.4%) |
| Total | 167 (100.0%) | 54 (100.0%) |
Housing Occupancy in Port O Connor
Occupancy by Ownership in Port O Connor
Of the total 365 dwellings in Port O Connor, owner-occupied units account for 345 (94.5%), while renter-occupied units make up 20 (5.5%).
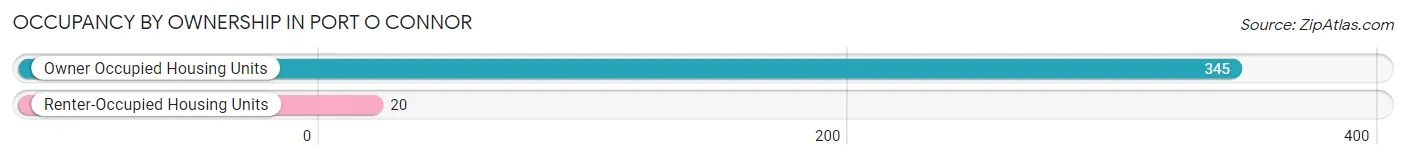
| Occupancy | # Housing Units | % Housing Units |
| Owner Occupied Housing Units | 345 | 94.5% |
| Renter-Occupied Housing Units | 20 | 5.5% |
| Total Occupied Housing Units | 365 | 100.0% |
Occupancy by Household Size in Port O Connor
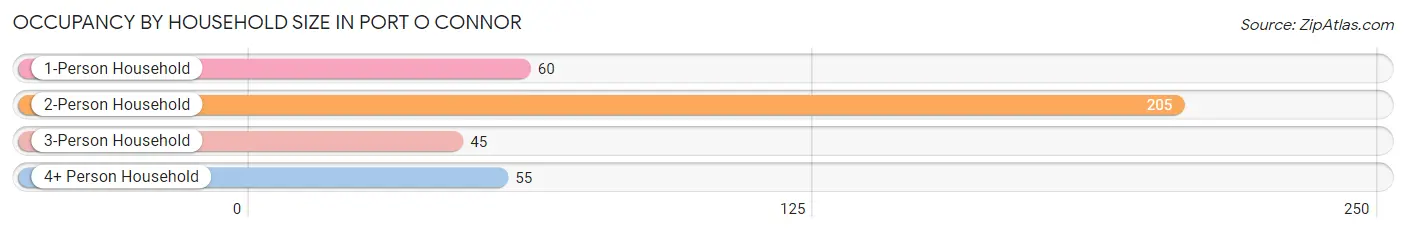
| Household Size | # Housing Units | % Housing Units |
| 1-Person Household | 60 | 16.4% |
| 2-Person Household | 205 | 56.2% |
| 3-Person Household | 45 | 12.3% |
| 4+ Person Household | 55 | 15.1% |
| Total Housing Units | 365 | 100.0% |
Occupancy by Ownership by Household Size in Port O Connor
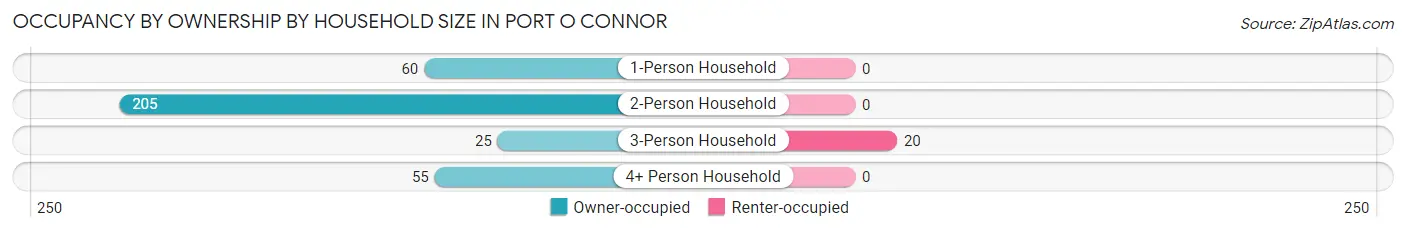
| Household Size | Owner-occupied | Renter-occupied |
| 1-Person Household | 60 (100.0%) | 0 (0.0%) |
| 2-Person Household | 205 (100.0%) | 0 (0.0%) |
| 3-Person Household | 25 (55.6%) | 20 (44.4%) |
| 4+ Person Household | 55 (100.0%) | 0 (0.0%) |
| Total Housing Units | 345 (94.5%) | 20 (5.5%) |
Occupancy by Educational Attainment in Port O Connor
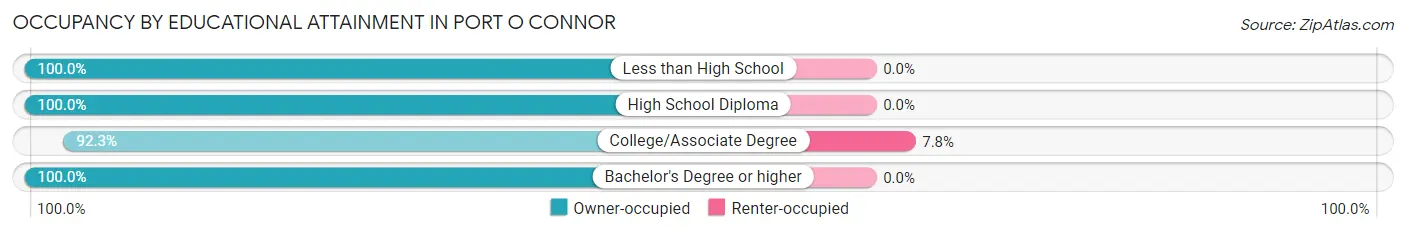
| Household Size | Owner-occupied | Renter-occupied |
| Less than High School | 9 (100.0%) | 0 (0.0%) |
| High School Diploma | 55 (100.0%) | 0 (0.0%) |
| College/Associate Degree | 238 (92.2%) | 20 (7.7%) |
| Bachelor's Degree or higher | 43 (100.0%) | 0 (0.0%) |
Occupancy by Age of Householder in Port O Connor
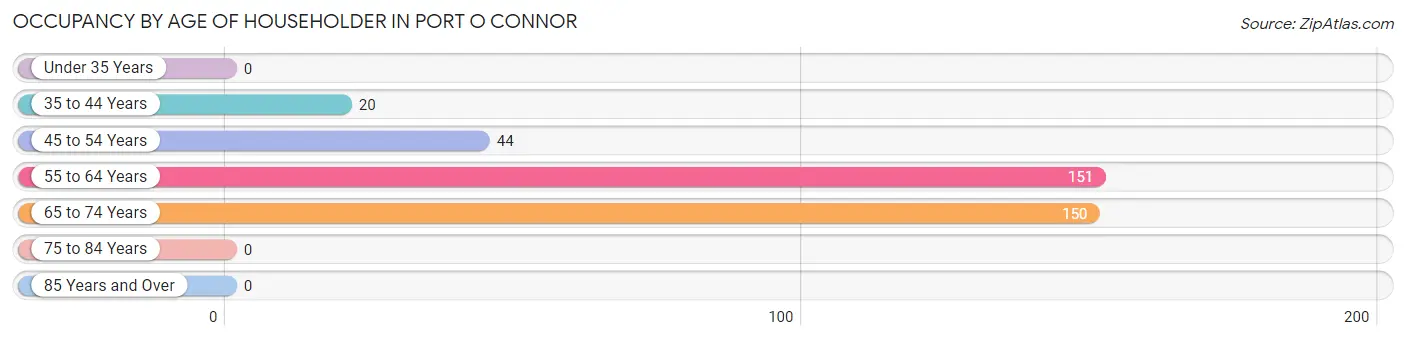
| Age Bracket | # Households | % Households |
| Under 35 Years | 0 | 0.0% |
| 35 to 44 Years | 20 | 5.5% |
| 45 to 54 Years | 44 | 12.0% |
| 55 to 64 Years | 151 | 41.4% |
| 65 to 74 Years | 150 | 41.1% |
| 75 to 84 Years | 0 | 0.0% |
| 85 Years and Over | 0 | 0.0% |
| Total | 365 | 100.0% |
Housing Finances in Port O Connor
Median Income by Occupancy in Port O Connor
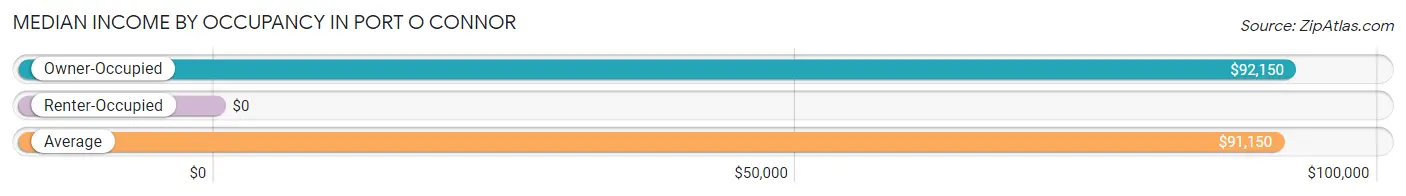
| Occupancy Type | # Households | Median Income |
| Owner-Occupied | 345 (94.5%) | $92,150 |
| Renter-Occupied | 20 (5.5%) | $0 |
| Average | 365 (100.0%) | $91,150 |
Occupancy by Householder Income Bracket in Port O Connor
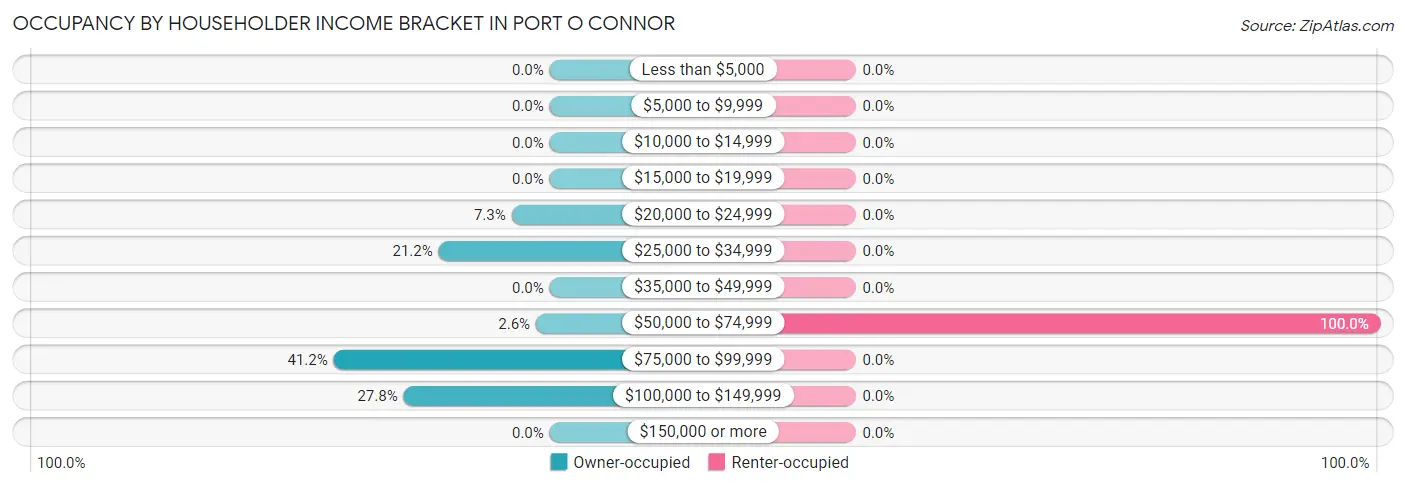
| Income Bracket | Owner-occupied | Renter-occupied |
| Less than $5,000 | 0 (0.0%) | 0 (0.0%) |
| $5,000 to $9,999 | 0 (0.0%) | 0 (0.0%) |
| $10,000 to $14,999 | 0 (0.0%) | 0 (0.0%) |
| $15,000 to $19,999 | 0 (0.0%) | 0 (0.0%) |
| $20,000 to $24,999 | 25 (7.2%) | 0 (0.0%) |
| $25,000 to $34,999 | 73 (21.2%) | 0 (0.0%) |
| $35,000 to $49,999 | 0 (0.0%) | 0 (0.0%) |
| $50,000 to $74,999 | 9 (2.6%) | 20 (100.0%) |
| $75,000 to $99,999 | 142 (41.2%) | 0 (0.0%) |
| $100,000 to $149,999 | 96 (27.8%) | 0 (0.0%) |
| $150,000 or more | 0 (0.0%) | 0 (0.0%) |
| Total | 345 (100.0%) | 20 (100.0%) |
Monthly Housing Cost Tiers in Port O Connor
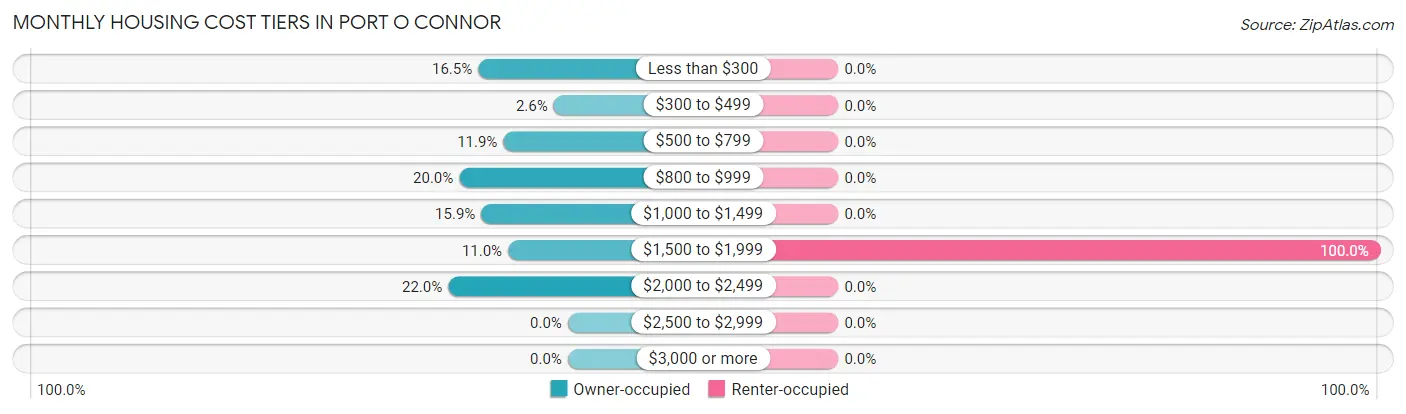
| Monthly Cost | Owner-occupied | Renter-occupied |
| Less than $300 | 57 (16.5%) | 0 (0.0%) |
| $300 to $499 | 9 (2.6%) | 0 (0.0%) |
| $500 to $799 | 41 (11.9%) | 0 (0.0%) |
| $800 to $999 | 69 (20.0%) | 0 (0.0%) |
| $1,000 to $1,499 | 55 (15.9%) | 0 (0.0%) |
| $1,500 to $1,999 | 38 (11.0%) | 20 (100.0%) |
| $2,000 to $2,499 | 76 (22.0%) | 0 (0.0%) |
| $2,500 to $2,999 | 0 (0.0%) | 0 (0.0%) |
| $3,000 or more | 0 (0.0%) | 0 (0.0%) |
| Total | 345 (100.0%) | 20 (100.0%) |
Physical Housing Characteristics in Port O Connor
Housing Structures in Port O Connor
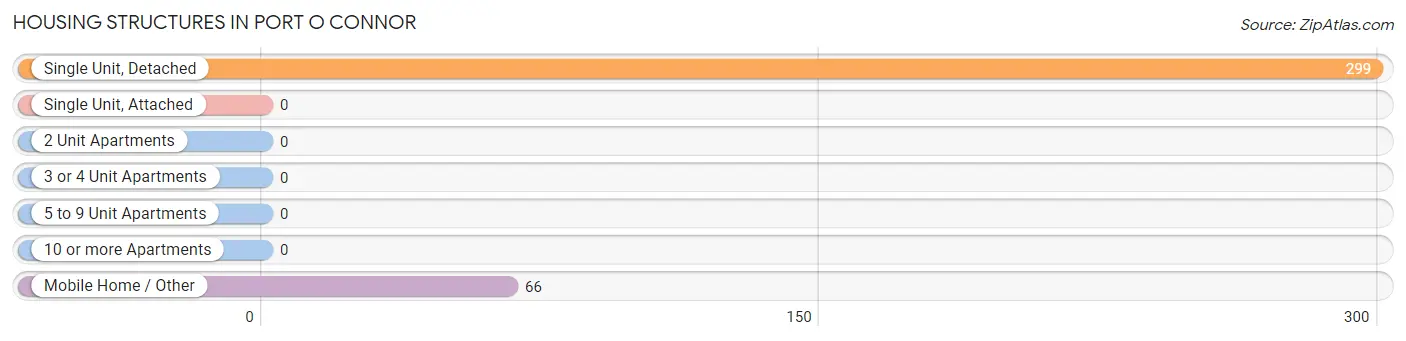
| Structure Type | # Housing Units | % Housing Units |
| Single Unit, Detached | 299 | 81.9% |
| Single Unit, Attached | 0 | 0.0% |
| 2 Unit Apartments | 0 | 0.0% |
| 3 or 4 Unit Apartments | 0 | 0.0% |
| 5 to 9 Unit Apartments | 0 | 0.0% |
| 10 or more Apartments | 0 | 0.0% |
| Mobile Home / Other | 66 | 18.1% |
| Total | 365 | 100.0% |
Housing Structures by Occupancy in Port O Connor
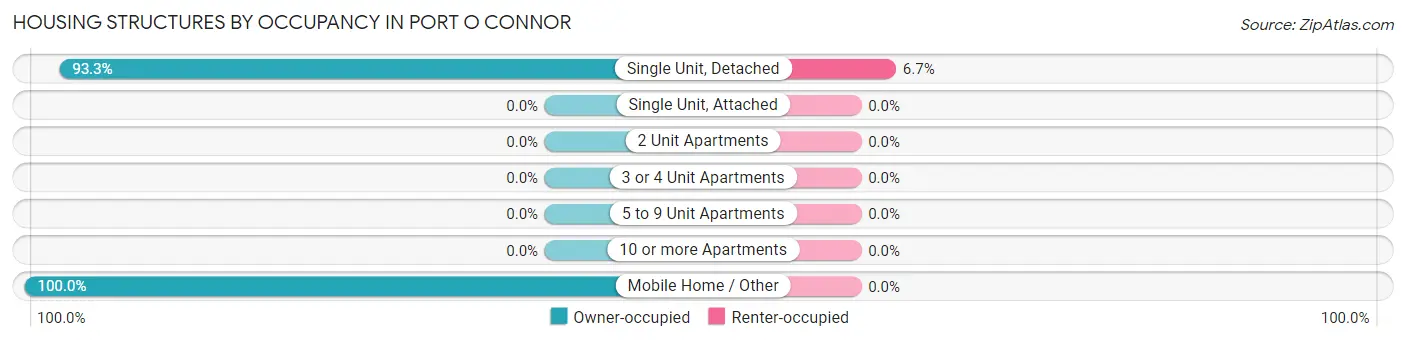
| Structure Type | Owner-occupied | Renter-occupied |
| Single Unit, Detached | 279 (93.3%) | 20 (6.7%) |
| Single Unit, Attached | 0 (0.0%) | 0 (0.0%) |
| 2 Unit Apartments | 0 (0.0%) | 0 (0.0%) |
| 3 or 4 Unit Apartments | 0 (0.0%) | 0 (0.0%) |
| 5 to 9 Unit Apartments | 0 (0.0%) | 0 (0.0%) |
| 10 or more Apartments | 0 (0.0%) | 0 (0.0%) |
| Mobile Home / Other | 66 (100.0%) | 0 (0.0%) |
| Total | 345 (94.5%) | 20 (5.5%) |
Housing Structures by Number of Rooms in Port O Connor
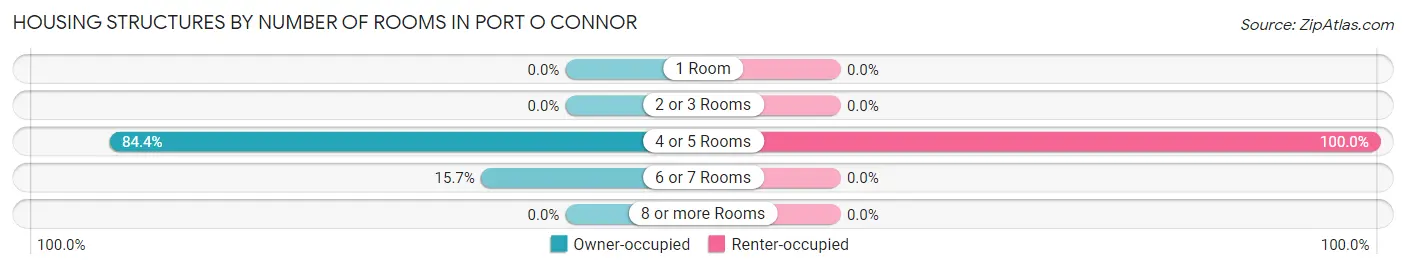
| Number of Rooms | Owner-occupied | Renter-occupied |
| 1 Room | 0 (0.0%) | 0 (0.0%) |
| 2 or 3 Rooms | 0 (0.0%) | 0 (0.0%) |
| 4 or 5 Rooms | 291 (84.4%) | 20 (100.0%) |
| 6 or 7 Rooms | 54 (15.7%) | 0 (0.0%) |
| 8 or more Rooms | 0 (0.0%) | 0 (0.0%) |
| Total | 345 (100.0%) | 20 (100.0%) |
Housing Structure by Heating Type in Port O Connor
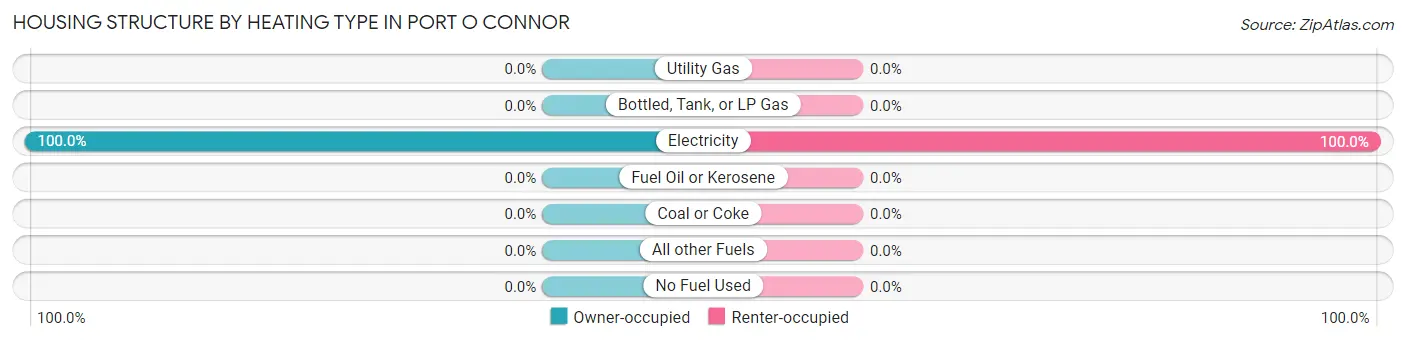
| Heating Type | Owner-occupied | Renter-occupied |
| Utility Gas | 0 (0.0%) | 0 (0.0%) |
| Bottled, Tank, or LP Gas | 0 (0.0%) | 0 (0.0%) |
| Electricity | 345 (100.0%) | 20 (100.0%) |
| Fuel Oil or Kerosene | 0 (0.0%) | 0 (0.0%) |
| Coal or Coke | 0 (0.0%) | 0 (0.0%) |
| All other Fuels | 0 (0.0%) | 0 (0.0%) |
| No Fuel Used | 0 (0.0%) | 0 (0.0%) |
| Total | 345 (100.0%) | 20 (100.0%) |
Household Vehicle Usage in Port O Connor
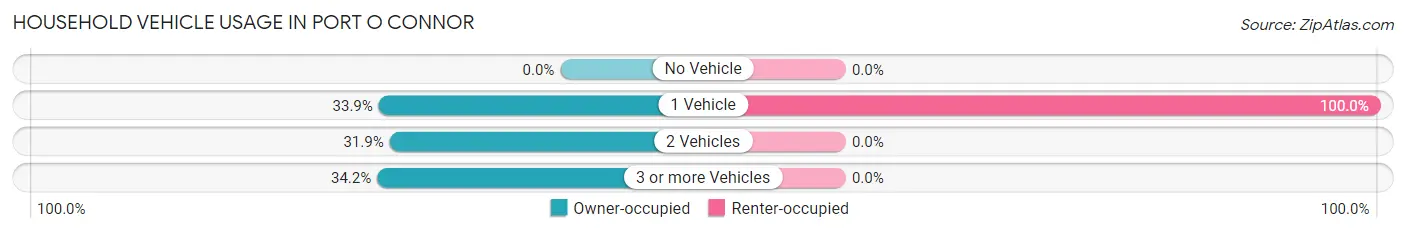
| Vehicles per Household | Owner-occupied | Renter-occupied |
| No Vehicle | 0 (0.0%) | 0 (0.0%) |
| 1 Vehicle | 117 (33.9%) | 20 (100.0%) |
| 2 Vehicles | 110 (31.9%) | 0 (0.0%) |
| 3 or more Vehicles | 118 (34.2%) | 0 (0.0%) |
| Total | 345 (100.0%) | 20 (100.0%) |
Real Estate & Mortgages in Port O Connor
Real Estate and Mortgage Overview in Port O Connor
| Characteristic | Without Mortgage | With Mortgage |
| Housing Units | 187 | 158 |
| Median Property Value | $346,000 | $230,200 |
| Median Household Income | - | - |
| Monthly Housing Costs | $646 | $0 |
| Real Estate Taxes | - | - |
Property Value by Mortgage Status in Port O Connor
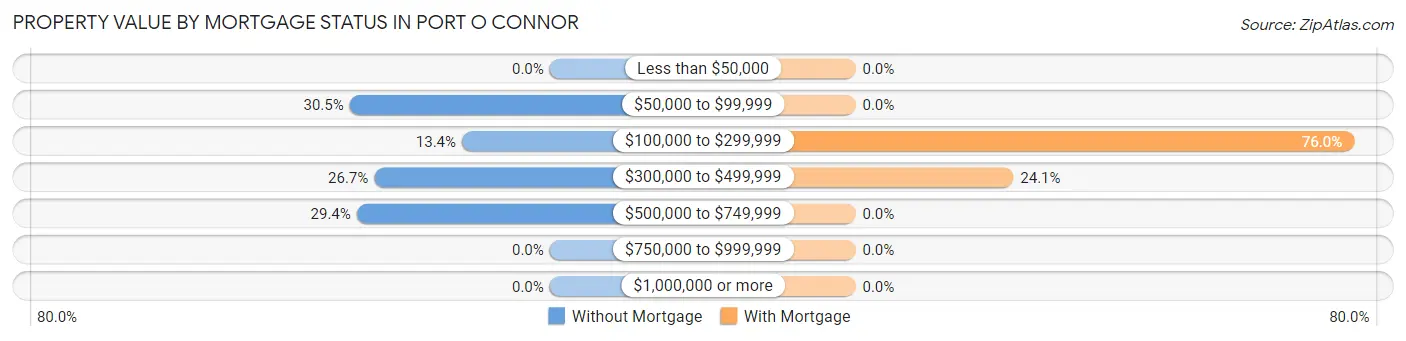
| Property Value | Without Mortgage | With Mortgage |
| Less than $50,000 | 0 (0.0%) | 0 (0.0%) |
| $50,000 to $99,999 | 57 (30.5%) | 0 (0.0%) |
| $100,000 to $299,999 | 25 (13.4%) | 120 (75.9%) |
| $300,000 to $499,999 | 50 (26.7%) | 38 (24.0%) |
| $500,000 to $749,999 | 55 (29.4%) | 0 (0.0%) |
| $750,000 to $999,999 | 0 (0.0%) | 0 (0.0%) |
| $1,000,000 or more | 0 (0.0%) | 0 (0.0%) |
| Total | 187 (100.0%) | 158 (100.0%) |
Household Income by Mortgage Status in Port O Connor
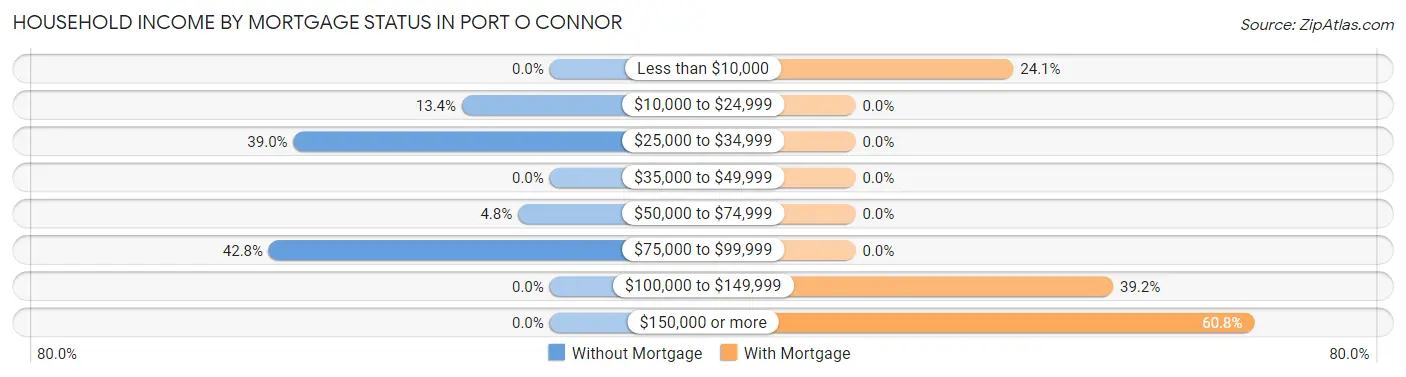
| Household Income | Without Mortgage | With Mortgage |
| Less than $10,000 | 0 (0.0%) | 38 (24.0%) |
| $10,000 to $24,999 | 25 (13.4%) | 0 (0.0%) |
| $25,000 to $34,999 | 73 (39.0%) | 0 (0.0%) |
| $35,000 to $49,999 | 0 (0.0%) | 0 (0.0%) |
| $50,000 to $74,999 | 9 (4.8%) | 0 (0.0%) |
| $75,000 to $99,999 | 80 (42.8%) | 0 (0.0%) |
| $100,000 to $149,999 | 0 (0.0%) | 62 (39.2%) |
| $150,000 or more | 0 (0.0%) | 96 (60.8%) |
| Total | 187 (100.0%) | 158 (100.0%) |
Property Value to Household Income Ratio in Port O Connor
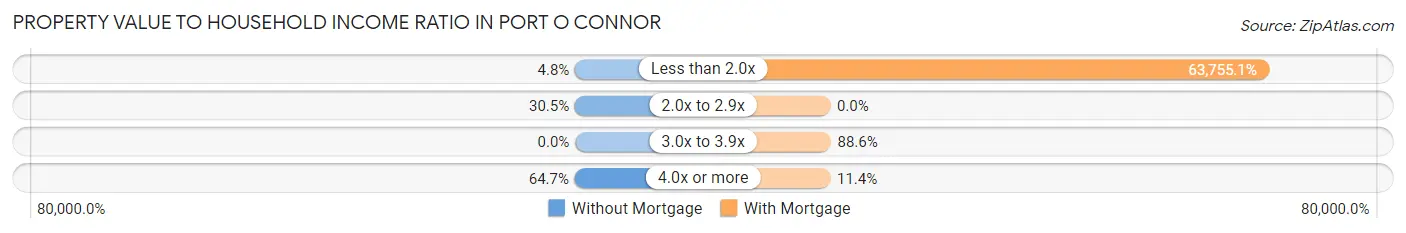
| Value-to-Income Ratio | Without Mortgage | With Mortgage |
| Less than 2.0x | 9 (4.8%) | 100,733 (63,755.1%) |
| 2.0x to 2.9x | 57 (30.5%) | 0 (0.0%) |
| 3.0x to 3.9x | 0 (0.0%) | 140 (88.6%) |
| 4.0x or more | 121 (64.7%) | 18 (11.4%) |
| Total | 187 (100.0%) | 158 (100.0%) |
Real Estate Taxes by Mortgage Status in Port O Connor
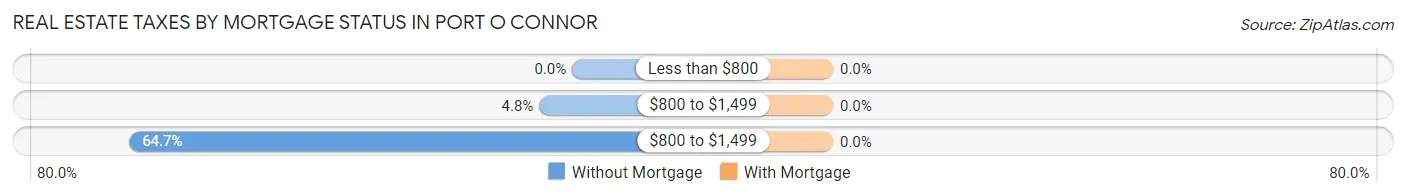
| Property Taxes | Without Mortgage | With Mortgage |
| Less than $800 | 0 (0.0%) | 0 (0.0%) |
| $800 to $1,499 | 9 (4.8%) | 0 (0.0%) |
| $800 to $1,499 | 121 (64.7%) | 0 (0.0%) |
| Total | 187 (100.0%) | 158 (100.0%) |
Health & Disability in Port O Connor
Health Insurance Coverage by Age in Port O Connor
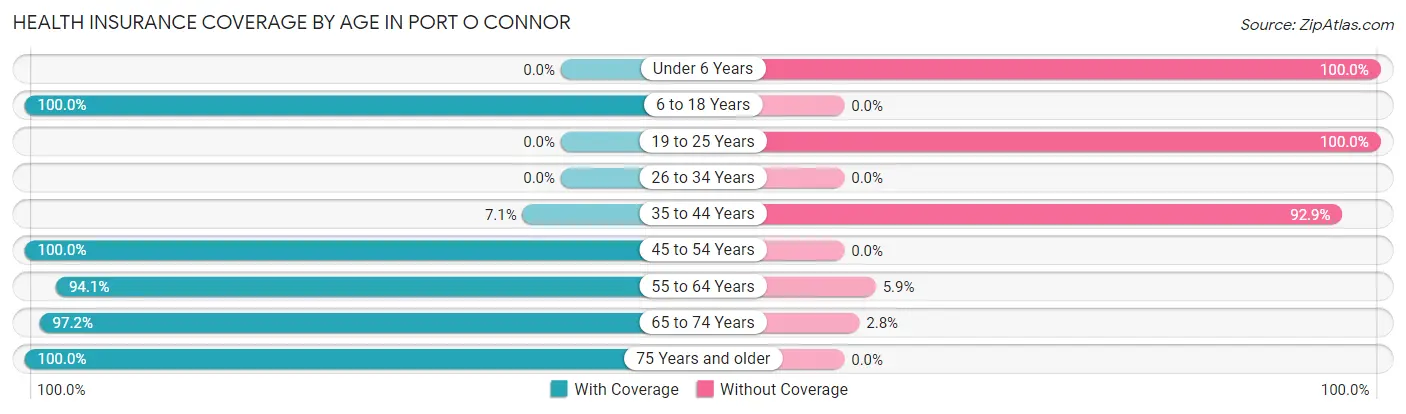
| Age Bracket | With Coverage | Without Coverage |
| Under 6 Years | 0 (0.0%) | 12 (100.0%) |
| 6 to 18 Years | 81 (100.0%) | 0 (0.0%) |
| 19 to 25 Years | 0 (0.0%) | 30 (100.0%) |
| 26 to 34 Years | 0 (0.0%) | 0 (0.0%) |
| 35 to 44 Years | 2 (7.1%) | 26 (92.9%) |
| 45 to 54 Years | 44 (100.0%) | 0 (0.0%) |
| 55 to 64 Years | 209 (94.1%) | 13 (5.9%) |
| 65 to 74 Years | 311 (97.2%) | 9 (2.8%) |
| 75 Years and older | 54 (100.0%) | 0 (0.0%) |
| Total | 701 (88.6%) | 90 (11.4%) |
Health Insurance Coverage by Citizenship Status in Port O Connor
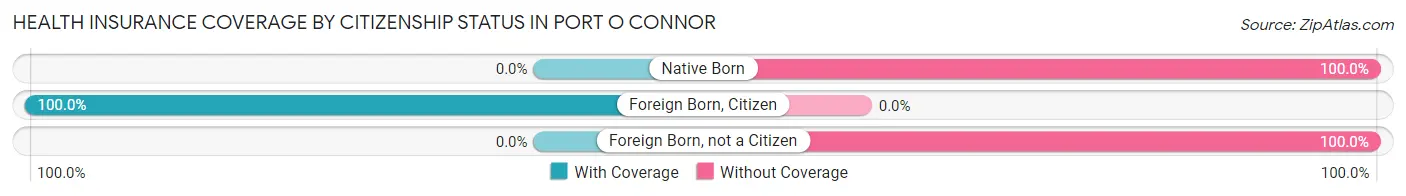
| Citizenship Status | With Coverage | Without Coverage |
| Native Born | 0 (0.0%) | 12 (100.0%) |
| Foreign Born, Citizen | 81 (100.0%) | 0 (0.0%) |
| Foreign Born, not a Citizen | 0 (0.0%) | 30 (100.0%) |
Health Insurance Coverage by Household Income in Port O Connor
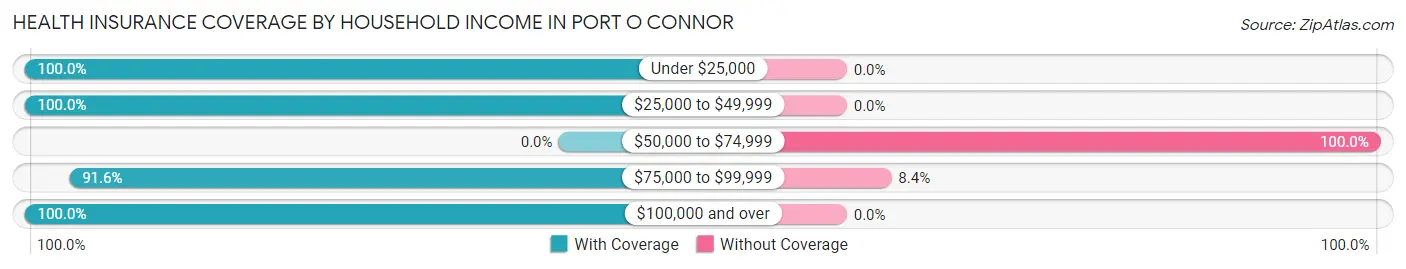
| Household Income | With Coverage | Without Coverage |
| Under $25,000 | 57 (100.0%) | 0 (0.0%) |
| $25,000 to $49,999 | 126 (100.0%) | 0 (0.0%) |
| $50,000 to $74,999 | 0 (0.0%) | 59 (100.0%) |
| $75,000 to $99,999 | 329 (91.6%) | 30 (8.4%) |
| $100,000 and over | 186 (100.0%) | 0 (0.0%) |
Public vs Private Health Insurance Coverage by Age in Port O Connor
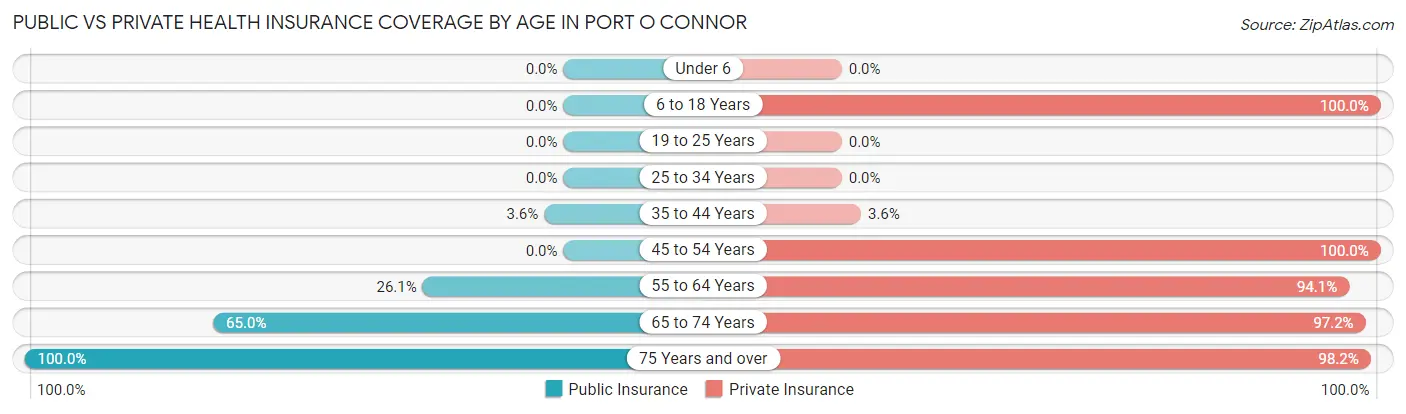
| Age Bracket | Public Insurance | Private Insurance |
| Under 6 | 0 (0.0%) | 0 (0.0%) |
| 6 to 18 Years | 0 (0.0%) | 81 (100.0%) |
| 19 to 25 Years | 0 (0.0%) | 0 (0.0%) |
| 25 to 34 Years | 0 (0.0%) | 0 (0.0%) |
| 35 to 44 Years | 1 (3.6%) | 1 (3.6%) |
| 45 to 54 Years | 0 (0.0%) | 44 (100.0%) |
| 55 to 64 Years | 58 (26.1%) | 209 (94.1%) |
| 65 to 74 Years | 208 (65.0%) | 311 (97.2%) |
| 75 Years and over | 54 (100.0%) | 53 (98.2%) |
| Total | 321 (40.6%) | 699 (88.4%) |
Disability Status by Sex by Age in Port O Connor
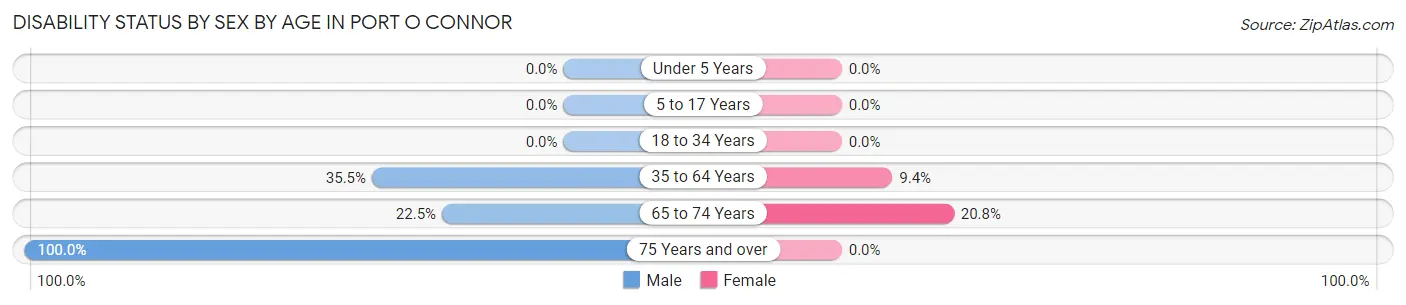
| Age Bracket | Male | Female |
| Under 5 Years | 0 (0.0%) | 0 (0.0%) |
| 5 to 17 Years | 0 (0.0%) | 0 (0.0%) |
| 18 to 34 Years | 0 (0.0%) | 0 (0.0%) |
| 35 to 64 Years | 59 (35.5%) | 12 (9.4%) |
| 65 to 74 Years | 32 (22.5%) | 37 (20.8%) |
| 75 Years and over | 1 (100.0%) | 0 (0.0%) |
Disability Class by Sex by Age in Port O Connor
Disability Class: Hearing Difficulty
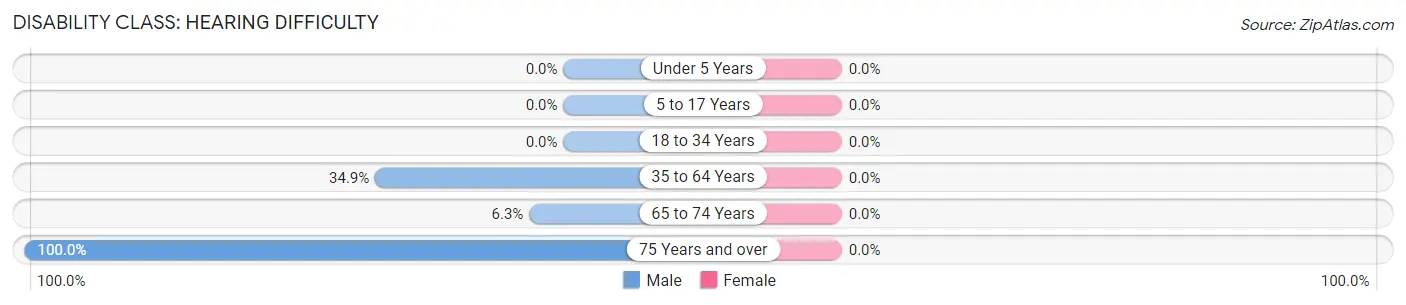
| Age Bracket | Male | Female |
| Under 5 Years | 0 (0.0%) | 0 (0.0%) |
| 5 to 17 Years | 0 (0.0%) | 0 (0.0%) |
| 18 to 34 Years | 0 (0.0%) | 0 (0.0%) |
| 35 to 64 Years | 58 (34.9%) | 0 (0.0%) |
| 65 to 74 Years | 9 (6.3%) | 0 (0.0%) |
| 75 Years and over | 1 (100.0%) | 0 (0.0%) |
Disability Class: Vision Difficulty
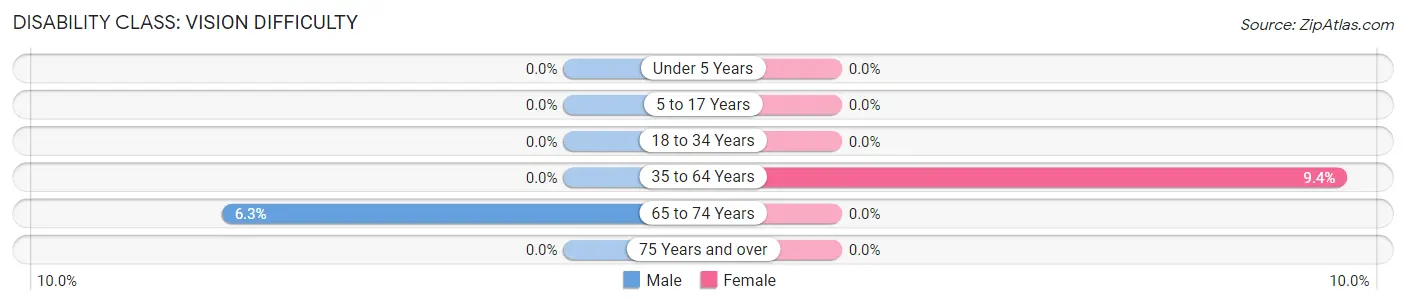
| Age Bracket | Male | Female |
| Under 5 Years | 0 (0.0%) | 0 (0.0%) |
| 5 to 17 Years | 0 (0.0%) | 0 (0.0%) |
| 18 to 34 Years | 0 (0.0%) | 0 (0.0%) |
| 35 to 64 Years | 0 (0.0%) | 12 (9.4%) |
| 65 to 74 Years | 9 (6.3%) | 0 (0.0%) |
| 75 Years and over | 0 (0.0%) | 0 (0.0%) |
Disability Class: Cognitive Difficulty
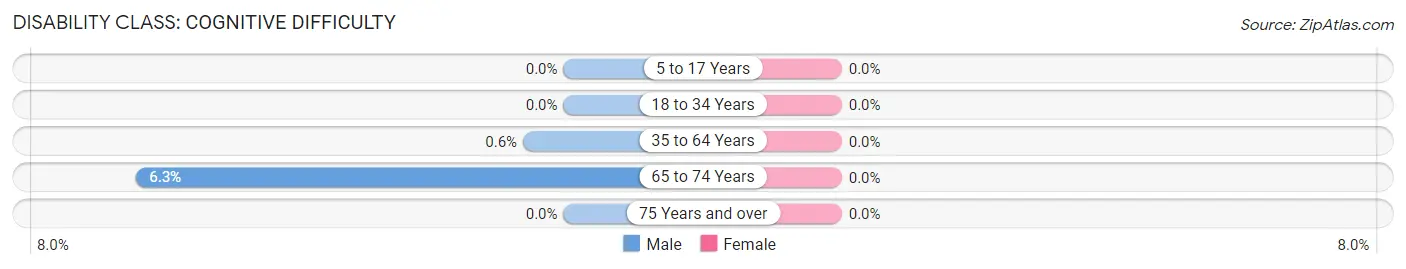
| Age Bracket | Male | Female |
| 5 to 17 Years | 0 (0.0%) | 0 (0.0%) |
| 18 to 34 Years | 0 (0.0%) | 0 (0.0%) |
| 35 to 64 Years | 1 (0.6%) | 0 (0.0%) |
| 65 to 74 Years | 9 (6.3%) | 0 (0.0%) |
| 75 Years and over | 0 (0.0%) | 0 (0.0%) |
Disability Class: Ambulatory Difficulty
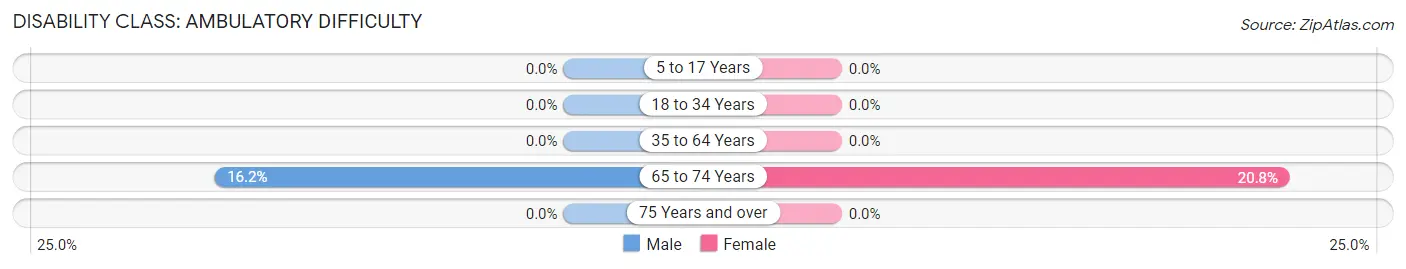
| Age Bracket | Male | Female |
| 5 to 17 Years | 0 (0.0%) | 0 (0.0%) |
| 18 to 34 Years | 0 (0.0%) | 0 (0.0%) |
| 35 to 64 Years | 0 (0.0%) | 0 (0.0%) |
| 65 to 74 Years | 23 (16.2%) | 37 (20.8%) |
| 75 Years and over | 0 (0.0%) | 0 (0.0%) |
Disability Class: Self-Care Difficulty
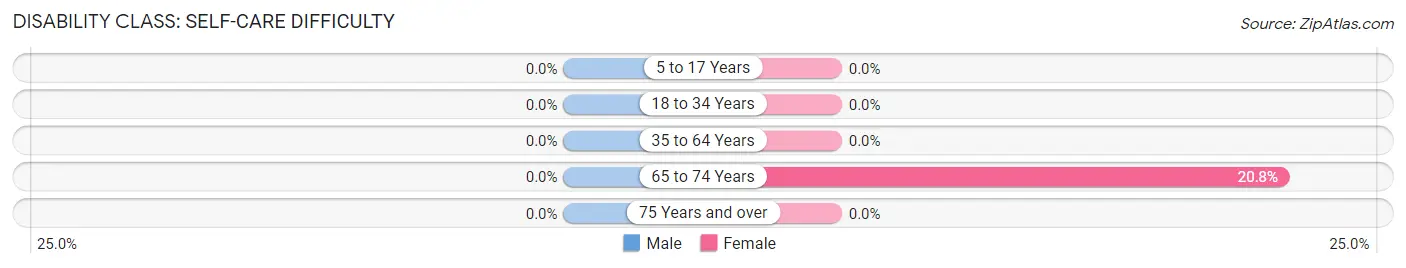
| Age Bracket | Male | Female |
| 5 to 17 Years | 0 (0.0%) | 0 (0.0%) |
| 18 to 34 Years | 0 (0.0%) | 0 (0.0%) |
| 35 to 64 Years | 0 (0.0%) | 0 (0.0%) |
| 65 to 74 Years | 0 (0.0%) | 37 (20.8%) |
| 75 Years and over | 0 (0.0%) | 0 (0.0%) |
Technology Access in Port O Connor
Computing Device Access in Port O Connor
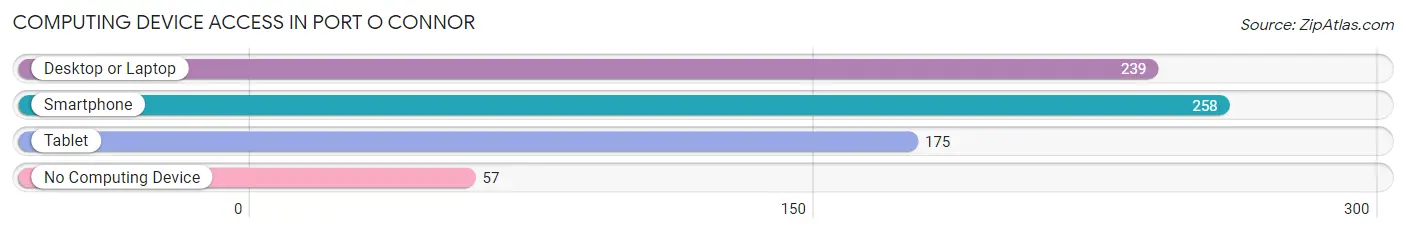
| Device Type | # Households | % Households |
| Desktop or Laptop | 239 | 65.5% |
| Smartphone | 258 | 70.7% |
| Tablet | 175 | 47.9% |
| No Computing Device | 57 | 15.6% |
| Total | 365 | 100.0% |
Internet Access in Port O Connor
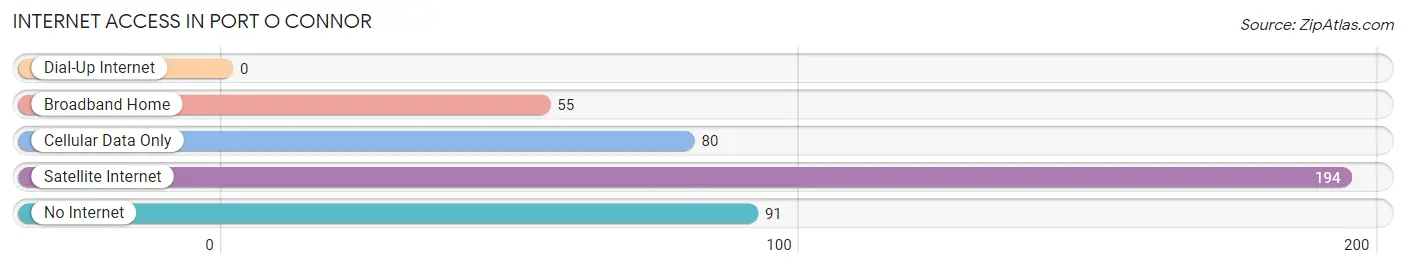
| Internet Type | # Households | % Households |
| Dial-Up Internet | 0 | 0.0% |
| Broadband Home | 55 | 15.1% |
| Cellular Data Only | 80 | 21.9% |
| Satellite Internet | 194 | 53.1% |
| No Internet | 91 | 24.9% |
| Total | 365 | 100.0% |
Port O Connor Summary
Port O’Connor is a small coastal town located in Calhoun County, Texas. It is situated on the western shore of Matagorda Bay, approximately 90 miles northeast of Corpus Christi. The town is known for its fishing, hunting, and bird watching opportunities, as well as its laid-back atmosphere.
History
Port O’Connor was founded in 1854 by a group of settlers from the nearby town of Indianola. The town was originally named “Port Comfort”, but was later changed to “Port O’Connor” in honor of a local settler, John O’Connor. The town quickly grew in size and importance, becoming a major port for the shipment of cotton and other goods.
In the late 19th century, the town was a popular destination for wealthy Texans, who built large homes and vacationed in the area. The town was also home to a number of businesses, including a hotel, a bank, and a newspaper.
In the early 20th century, the town’s economy began to decline as the shipping industry shifted away from the area. The town’s population also began to decline, and by the 1950s, the town had become a small fishing village.
Geography
Port O’Connor is located on the western shore of Matagorda Bay, approximately 90 miles northeast of Corpus Christi. The town is situated on a peninsula, surrounded by the bay on three sides. The town is bordered by the Gulf of Mexico to the south and the Intracoastal Waterway to the north.
The town is located in a humid subtropical climate zone, with hot, humid summers and mild winters. The average annual temperature is 73°F (23°C), and the average annual precipitation is 44 inches (112 cm).
Economy
The economy of Port O’Connor is largely based on fishing and tourism. The town is home to a number of fishing charters, as well as a number of restaurants and hotels catering to tourists. The town is also home to a number of small businesses, including a grocery store, a hardware store, and a bait shop.
Demographics
As of the 2010 census, the population of Port O’Connor was 1,743. The town is predominantly white (94.3%), with a small Hispanic population (4.2%). The median household income is $45,000, and the median home value is $150,000.
Conclusion
Port O’Connor is a small coastal town located in Calhoun County, Texas. It is known for its fishing, hunting, and bird watching opportunities, as well as its laid-back atmosphere. The town’s economy is largely based on fishing and tourism, and the population is predominantly white. Port O’Connor is a popular destination for those looking for a peaceful getaway.
Common Questions
What is Per Capita Income in Port O Connor?
Per Capita income in Port O Connor is $34,412.
What is the Median Family Income in Port O Connor?
Median Family Income in Port O Connor is $94,792.
What is the Median Household income in Port O Connor?
Median Household Income in Port O Connor is $91,150.
What is Inequality or Gini Index in Port O Connor?
Inequality or Gini Index in Port O Connor is 0.25.
What is the Total Population of Port O Connor?
Total Population of Port O Connor is 791.
What is the Total Male Population of Port O Connor?
Total Male Population of Port O Connor is 390.
What is the Total Female Population of Port O Connor?
Total Female Population of Port O Connor is 401.
What is the Ratio of Males per 100 Females in Port O Connor?
There are 97.26 Males per 100 Females in Port O Connor.
What is the Ratio of Females per 100 Males in Port O Connor?
There are 102.82 Females per 100 Males in Port O Connor.
What is the Median Population Age in Port O Connor?
Median Population Age in Port O Connor is 64.6 Years.
What is the Average Family Size in Port O Connor
Average Family Size in Port O Connor is 2.4 People.
What is the Average Household Size in Port O Connor
Average Household Size in Port O Connor is 2.2 People.
How Large is the Labor Force in Port O Connor?
There are 223 People in the Labor Forcein in Port O Connor.
What is the Percentage of People in the Labor Force in Port O Connor?
28.6% of People are in the Labor Force in Port O Connor.
What is the Unemployment Rate in Port O Connor?
Unemployment Rate in Port O Connor is 0.4%.