Zip Codes with the Highest Percentage of Population Employed in Health Diagnosing & Treating in Denison, TX
RELATED REPORTS & OPTIONS
Health Diagnosing & Treating
Denison
Compare Zip Codes
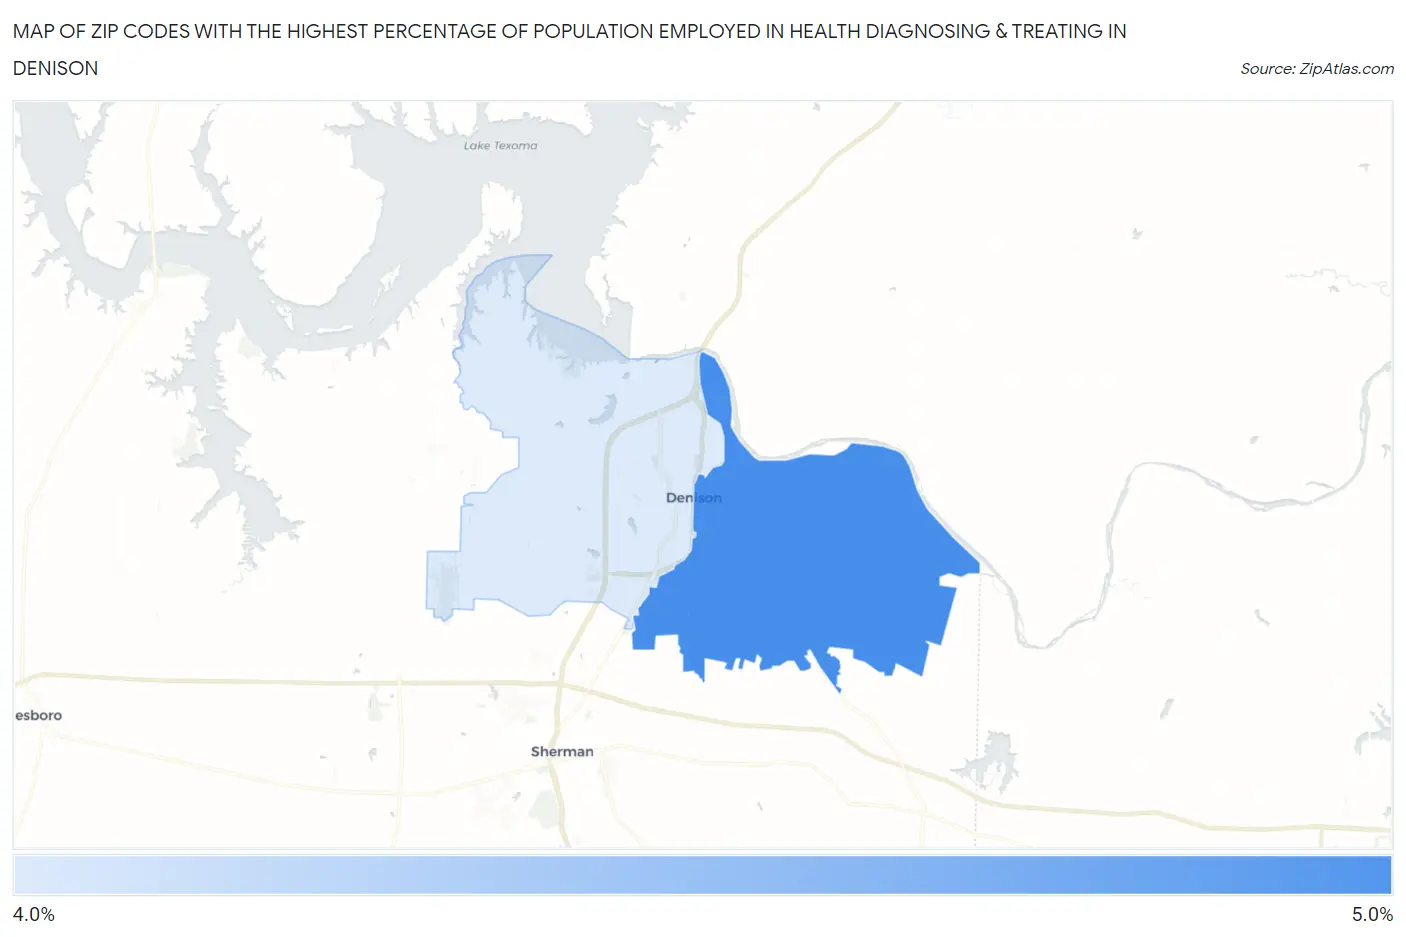
Map of Zip Codes with the Highest Percentage of Population Employed in Health Diagnosing & Treating in Denison
4.2%
4.9%
Zip Codes with the Highest Percentage of Population Employed in Health Diagnosing & Treating in Denison, TX
| Zip Code | % Employed | vs State | vs National | |
| 1. | 75021 | 4.9% | 5.5%(-0.644)#855 | 6.2%(-1.37)#18,197 |
| 2. | 75020 | 4.2% | 5.5%(-1.34)#1,016 | 6.2%(-2.06)#20,764 |
1
Common Questions
What are the Top Zip Codes with the Highest Percentage of Population Employed in Health Diagnosing & Treating in Denison, TX?
Top Zip Codes with the Highest Percentage of Population Employed in Health Diagnosing & Treating in Denison, TX are:
What zip code has the Highest Percentage of Population Employed in Health Diagnosing & Treating in Denison, TX?
75021 has the Highest Percentage of Population Employed in Health Diagnosing & Treating in Denison, TX with 4.9%.
What is the Percentage of Population Employed in Health Diagnosing & Treating in Denison, TX?
Percentage of Population Employed in Health Diagnosing & Treating in Denison is 3.8%.
What is the Percentage of Population Employed in Health Diagnosing & Treating in Texas?
Percentage of Population Employed in Health Diagnosing & Treating in Texas is 5.5%.
What is the Percentage of Population Employed in Health Diagnosing & Treating in the United States?
Percentage of Population Employed in Health Diagnosing & Treating in the United States is 6.2%.