Zip Codes with the Highest Percentage of Population Employed in Health Diagnosing & Treating in Sherman, TX
RELATED REPORTS & OPTIONS
Health Diagnosing & Treating
Sherman
Compare Zip Codes
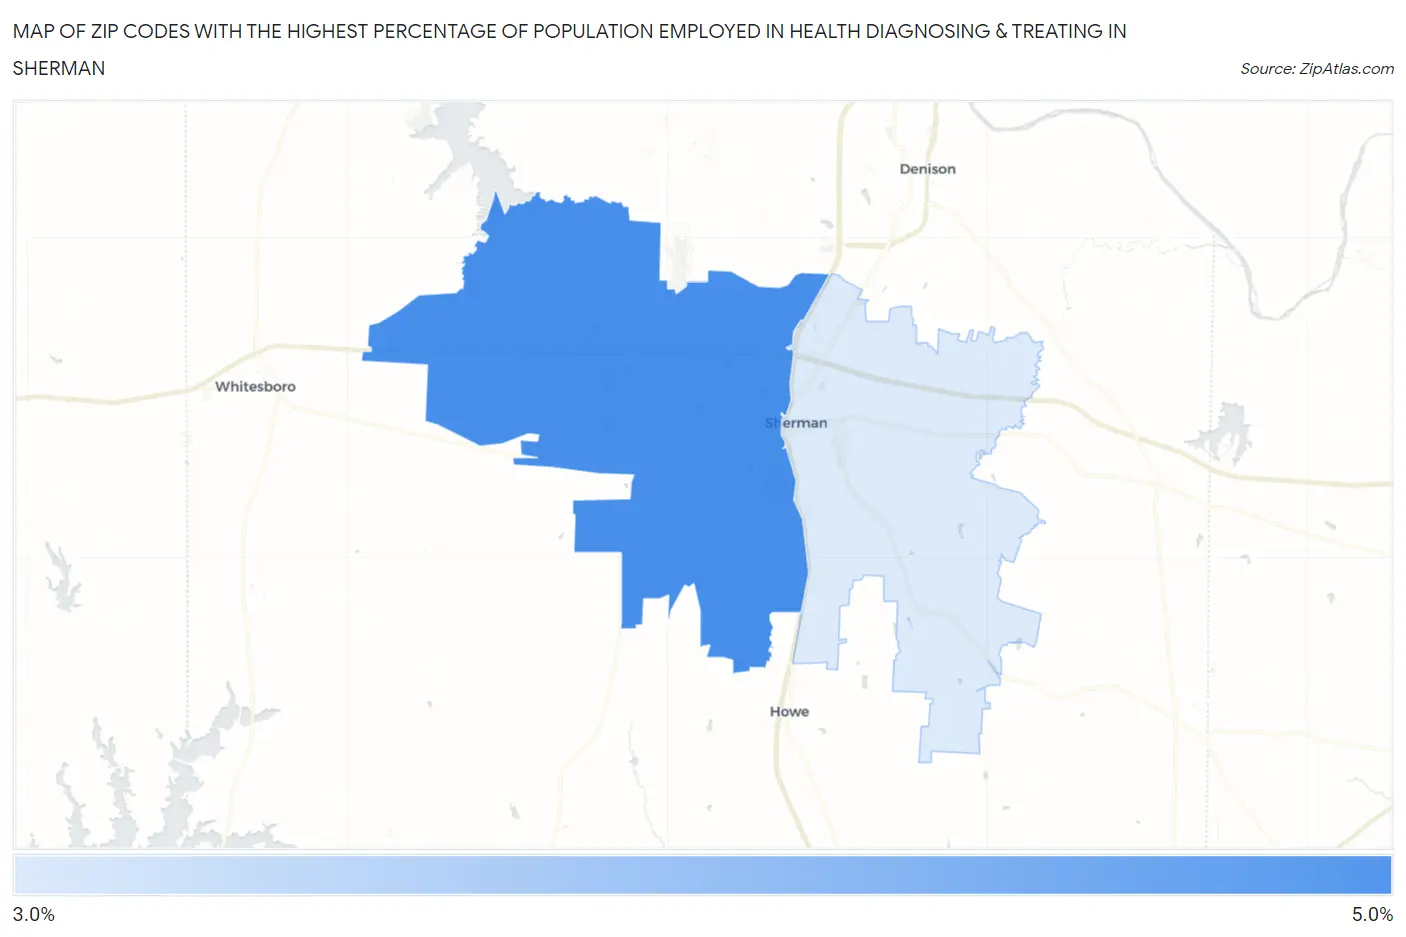
Map of Zip Codes with the Highest Percentage of Population Employed in Health Diagnosing & Treating in Sherman
4.0%
4.8%
Zip Codes with the Highest Percentage of Population Employed in Health Diagnosing & Treating in Sherman, TX
| Zip Code | % Employed | vs State | vs National | |
| 1. | 75092 | 4.8% | 5.5%(-0.673)#858 | 6.2%(-1.40)#18,313 |
| 2. | 75090 | 4.0% | 5.5%(-1.53)#1,069 | 6.2%(-2.26)#21,411 |
1
Common Questions
What are the Top Zip Codes with the Highest Percentage of Population Employed in Health Diagnosing & Treating in Sherman, TX?
Top Zip Codes with the Highest Percentage of Population Employed in Health Diagnosing & Treating in Sherman, TX are:
What zip code has the Highest Percentage of Population Employed in Health Diagnosing & Treating in Sherman, TX?
75092 has the Highest Percentage of Population Employed in Health Diagnosing & Treating in Sherman, TX with 4.8%.
What is the Percentage of Population Employed in Health Diagnosing & Treating in Sherman, TX?
Percentage of Population Employed in Health Diagnosing & Treating in Sherman is 4.5%.
What is the Percentage of Population Employed in Health Diagnosing & Treating in Texas?
Percentage of Population Employed in Health Diagnosing & Treating in Texas is 5.5%.
What is the Percentage of Population Employed in Health Diagnosing & Treating in the United States?
Percentage of Population Employed in Health Diagnosing & Treating in the United States is 6.2%.