Zip Codes with the Highest Percentage of Population Employed in Health Diagnosing & Treating in Waco, TX
RELATED REPORTS & OPTIONS
Health Diagnosing & Treating
Waco
Compare Zip Codes
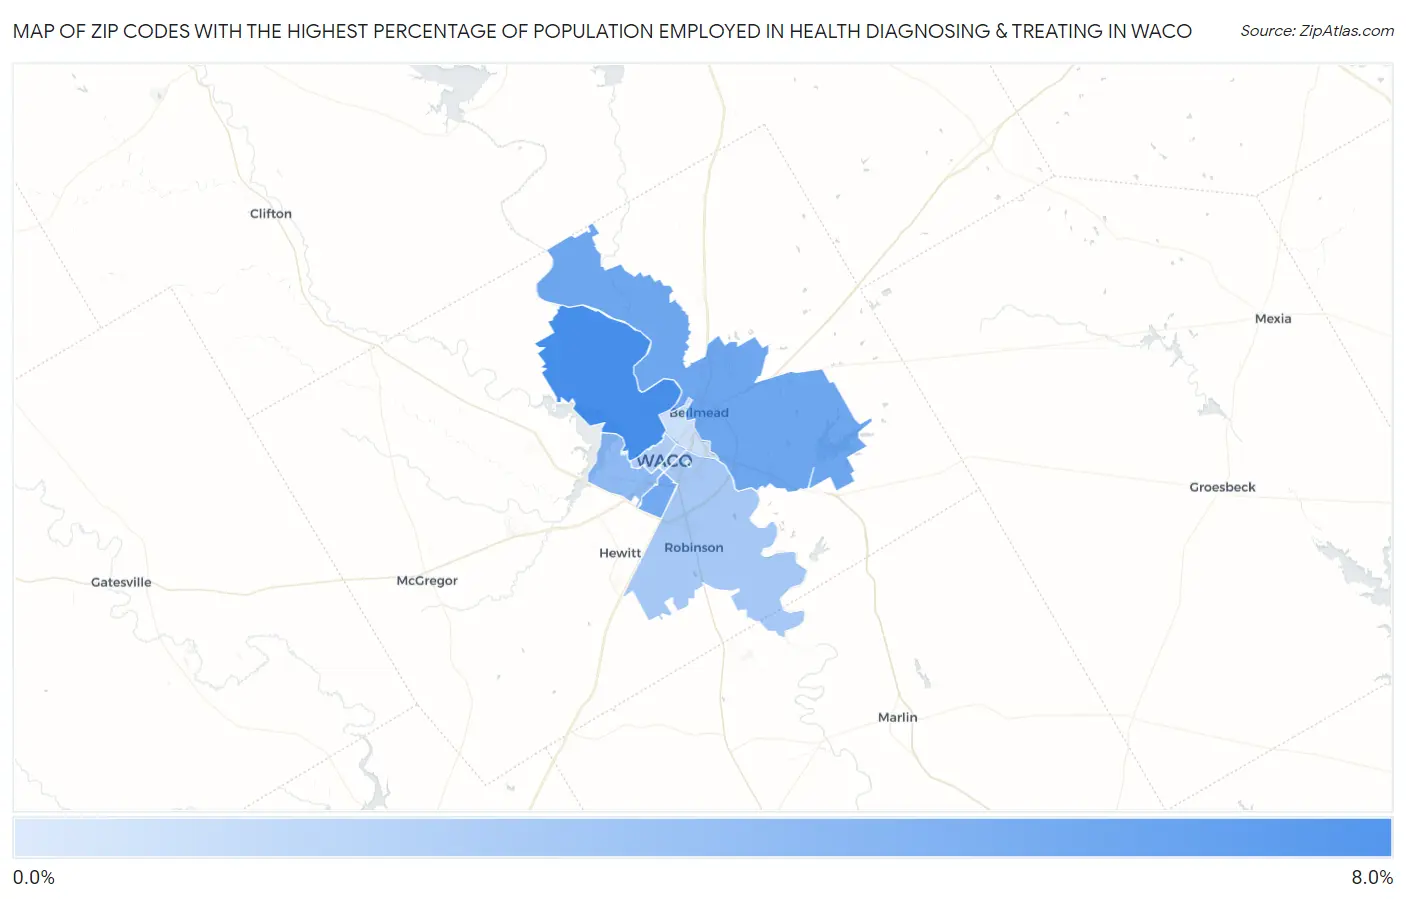
Map of Zip Codes with the Highest Percentage of Population Employed in Health Diagnosing & Treating in Waco
1.3%
7.0%
Zip Codes with the Highest Percentage of Population Employed in Health Diagnosing & Treating in Waco, TX
| Zip Code | % Employed | vs State | vs National | |
| 1. | 76708 | 7.0% | 5.5%(+1.44)#446 | 6.2%(+0.710)#10,498 |
| 2. | 76705 | 5.4% | 5.5%(-0.086)#728 | 6.2%(-0.812)#16,041 |
| 3. | 76711 | 5.3% | 5.5%(-0.208)#758 | 6.2%(-0.934)#16,516 |
| 4. | 76710 | 4.2% | 5.5%(-1.29)#1,002 | 6.2%(-2.02)#20,611 |
| 5. | 76706 | 3.4% | 5.5%(-2.16)#1,209 | 6.2%(-2.88)#23,293 |
| 6. | 76707 | 3.1% | 5.5%(-2.44)#1,285 | 6.2%(-3.16)#24,116 |
| 7. | 76701 | 2.6% | 5.5%(-2.92)#1,363 | 6.2%(-3.65)#25,287 |
| 8. | 76704 | 2.0% | 5.5%(-3.57)#1,477 | 6.2%(-4.29)#26,539 |
| 9. | 76798 | 1.3% | 5.5%(-4.20)#1,562 | 6.2%(-4.92)#27,425 |
1
Common Questions
What are the Top 5 Zip Codes with the Highest Percentage of Population Employed in Health Diagnosing & Treating in Waco, TX?
Top 5 Zip Codes with the Highest Percentage of Population Employed in Health Diagnosing & Treating in Waco, TX are:
What zip code has the Highest Percentage of Population Employed in Health Diagnosing & Treating in Waco, TX?
76708 has the Highest Percentage of Population Employed in Health Diagnosing & Treating in Waco, TX with 7.0%.
What is the Percentage of Population Employed in Health Diagnosing & Treating in Waco, TX?
Percentage of Population Employed in Health Diagnosing & Treating in Waco is 5.2%.
What is the Percentage of Population Employed in Health Diagnosing & Treating in Texas?
Percentage of Population Employed in Health Diagnosing & Treating in Texas is 5.5%.
What is the Percentage of Population Employed in Health Diagnosing & Treating in the United States?
Percentage of Population Employed in Health Diagnosing & Treating in the United States is 6.2%.