Pawnee, TX Map & Demographics
Pawnee Map

Pawnee Overview
$20,312
PER CAPITA INCOME
$46,875
AVG FAMILY INCOME
$46,406
AVG HOUSEHOLD INCOME
0.24
INEQUALITY / GINI INDEX
97
TOTAL POPULATION
41
MALE POPULATION
56
FEMALE POPULATION
73.21
MALES / 100 FEMALES
136.59
FEMALES / 100 MALES
37.3
MEDIAN AGE
2.9
AVG FAMILY SIZE
2.8
AVG HOUSEHOLD SIZE
43
LABOR FORCE [ PEOPLE ]
62.3%
PERCENT IN LABOR FORCE
4.7%
UNEMPLOYMENT RATE
Pawnee Zip Codes
Pawnee Area Codes
Income in Pawnee
Income Overview in Pawnee
Per Capita Income in Pawnee is $20,312, while median incomes of families and households are $46,875 and $46,406 respectively.
| Characteristic | Number | Measure |
| Per Capita Income | 97 | $20,312 |
| Median Family Income | 32 | $46,875 |
| Mean Family Income | 32 | $56,450 |
| Median Household Income | 35 | $46,406 |
| Mean Household Income | 35 | $54,917 |
| Income Deficit | 32 | $0 |
| Wage / Income Gap (%) | 97 | 0.00% |
| Wage / Income Gap ($) | 97 | 100.00¢ per $1 |
| Gini / Inequality Index | 97 | 0.24 |
Earnings by Sex in Pawnee
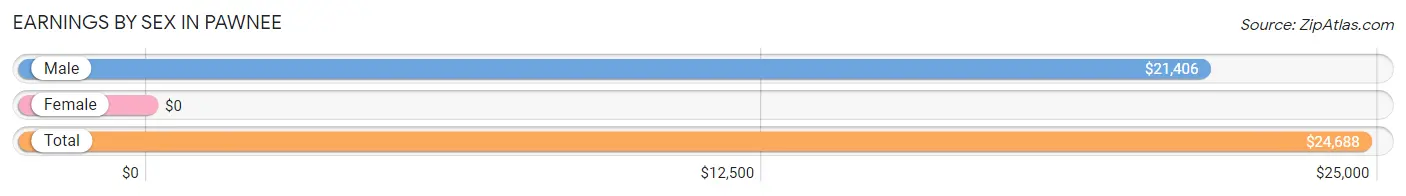
| Sex | Number | Average Earnings |
| Male | 27 (65.8%) | $21,406 |
| Female | 14 (34.2%) | $0 |
| Total | 41 (100.0%) | $24,688 |
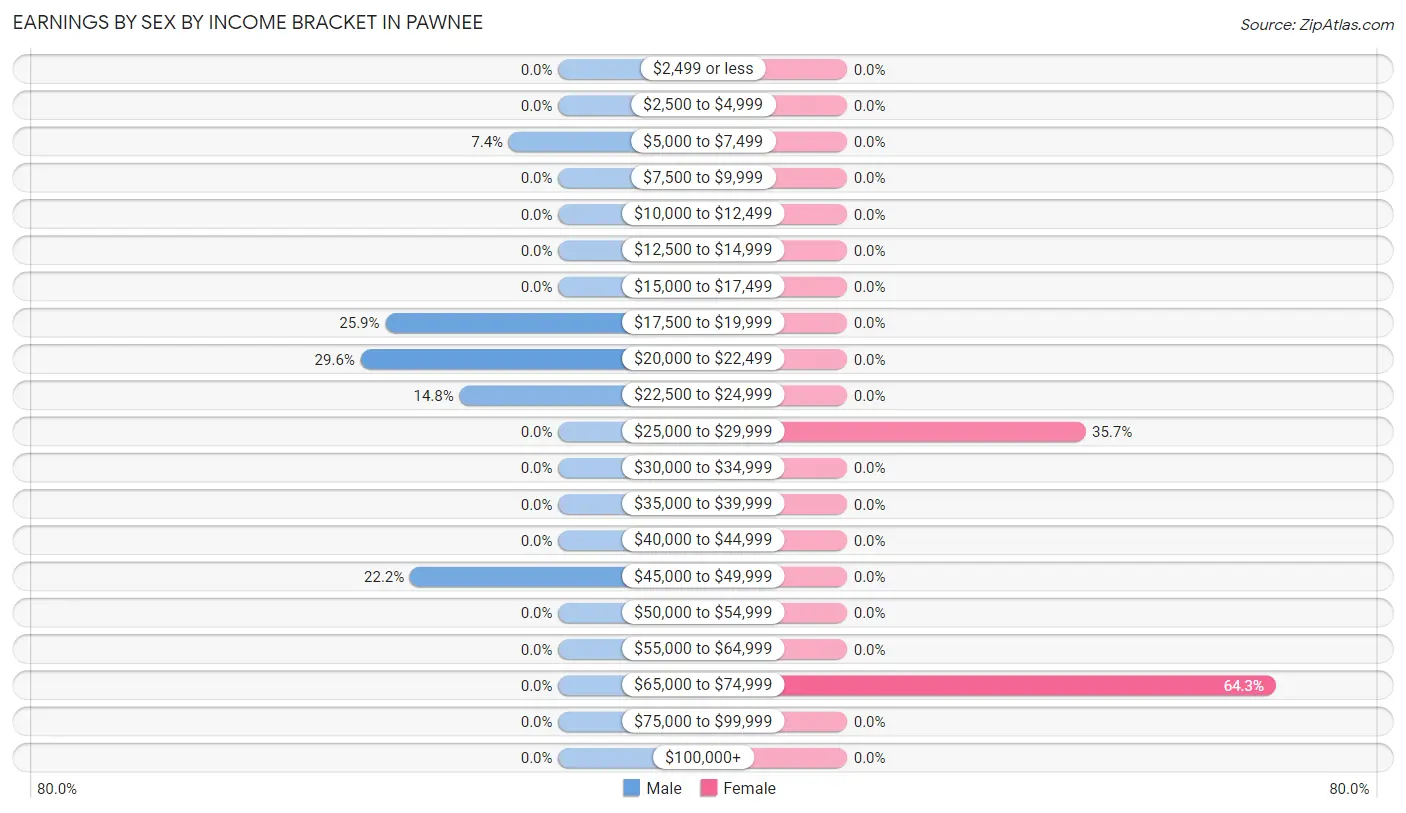
Earnings by Sex by Income Bracket in Pawnee
The most common earnings brackets in Pawnee are $20,000 to $22,499 for men (8 | 29.6%) and $65,000 to $74,999 for women (9 | 64.3%).
| Income | Male | Female |
| $2,499 or less | 0 (0.0%) | 0 (0.0%) |
| $2,500 to $4,999 | 0 (0.0%) | 0 (0.0%) |
| $5,000 to $7,499 | 2 (7.4%) | 0 (0.0%) |
| $7,500 to $9,999 | 0 (0.0%) | 0 (0.0%) |
| $10,000 to $12,499 | 0 (0.0%) | 0 (0.0%) |
| $12,500 to $14,999 | 0 (0.0%) | 0 (0.0%) |
| $15,000 to $17,499 | 0 (0.0%) | 0 (0.0%) |
| $17,500 to $19,999 | 7 (25.9%) | 0 (0.0%) |
| $20,000 to $22,499 | 8 (29.6%) | 0 (0.0%) |
| $22,500 to $24,999 | 4 (14.8%) | 0 (0.0%) |
| $25,000 to $29,999 | 0 (0.0%) | 5 (35.7%) |
| $30,000 to $34,999 | 0 (0.0%) | 0 (0.0%) |
| $35,000 to $39,999 | 0 (0.0%) | 0 (0.0%) |
| $40,000 to $44,999 | 0 (0.0%) | 0 (0.0%) |
| $45,000 to $49,999 | 6 (22.2%) | 0 (0.0%) |
| $50,000 to $54,999 | 0 (0.0%) | 0 (0.0%) |
| $55,000 to $64,999 | 0 (0.0%) | 0 (0.0%) |
| $65,000 to $74,999 | 0 (0.0%) | 9 (64.3%) |
| $75,000 to $99,999 | 0 (0.0%) | 0 (0.0%) |
| $100,000+ | 0 (0.0%) | 0 (0.0%) |
| Total | 27 (100.0%) | 14 (100.0%) |
Earnings by Sex by Educational Attainment in Pawnee
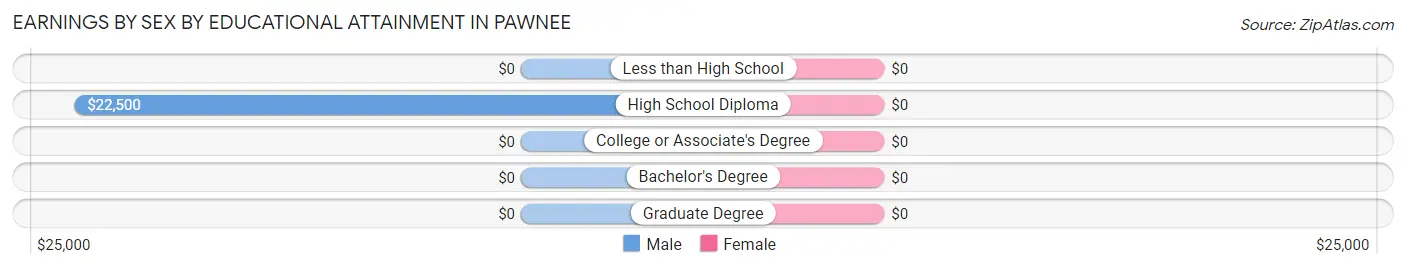
| Educational Attainment | Male Income | Female Income |
| Less than High School | - | - |
| High School Diploma | $22,500 | $0 |
| College or Associate's Degree | - | - |
| Bachelor's Degree | - | - |
| Graduate Degree | - | - |
| Total | $21,406 | $0 |
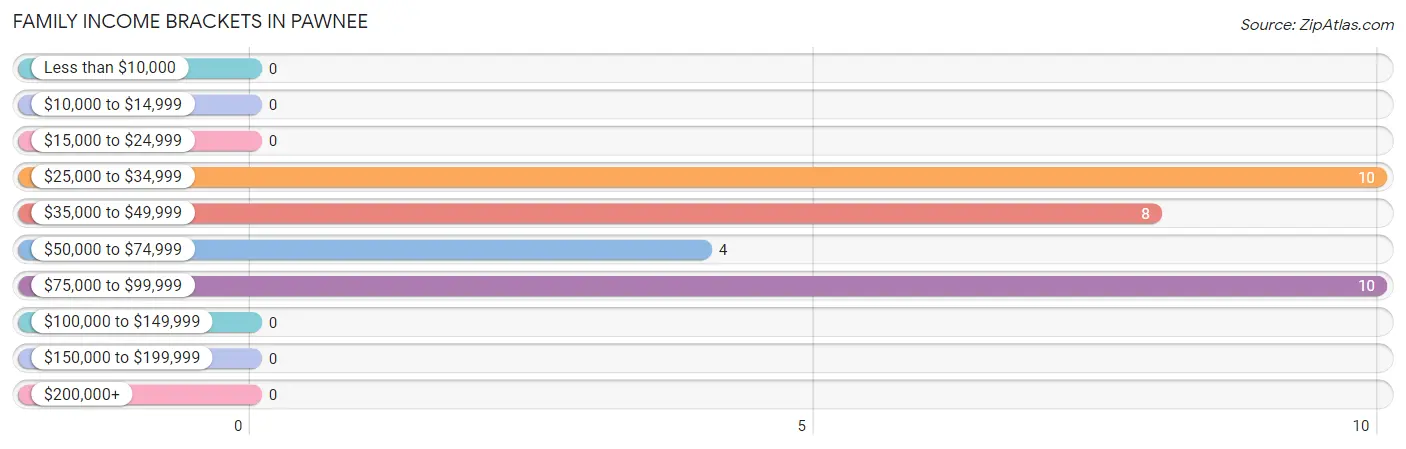
Family Income in Pawnee
Family Income Brackets in Pawnee
According to the Pawnee family income data, there are 10 families falling into the $25,000 to $34,999 income range, which is the most common income bracket and makes up 31.2% of all families.
| Income Bracket | # Families | % Families |
| Less than $10,000 | 0 | 0.0% |
| $10,000 to $14,999 | 0 | 0.0% |
| $15,000 to $24,999 | 0 | 0.0% |
| $25,000 to $34,999 | 10 | 31.3% |
| $35,000 to $49,999 | 8 | 25.0% |
| $50,000 to $74,999 | 4 | 12.5% |
| $75,000 to $99,999 | 10 | 31.3% |
| $100,000 to $149,999 | 0 | 0.0% |
| $150,000 to $199,999 | 0 | 0.0% |
| $200,000+ | 0 | 0.0% |
Family Income by Famaliy Size in Pawnee
| Income Bracket | # Families | Median Income |
| 2-Person Families | 20 (62.5%) | $0 |
| 3-Person Families | 4 (12.5%) | $0 |
| 4-Person Families | 0 (0.0%) | $0 |
| 5-Person Families | 8 (25.0%) | $0 |
| 6-Person Families | 0 (0.0%) | $0 |
| 7+ Person Families | 0 (0.0%) | $0 |
| Total | 32 (100.0%) | $46,875 |
Family Income by Number of Earners in Pawnee
| Number of Earners | # Families | Median Income |
| No Earners | 4 (12.5%) | $0 |
| 1 Earner | 17 (53.1%) | $0 |
| 2 Earners | 7 (21.9%) | $0 |
| 3+ Earners | 4 (12.5%) | $0 |
| Total | 32 (100.0%) | $46,875 |
Household Income in Pawnee
Household Income Brackets in Pawnee
With 11 households falling in the category, the $25,000 to $34,999 income range is the most frequent in Pawnee, accounting for 31.4% of all households.
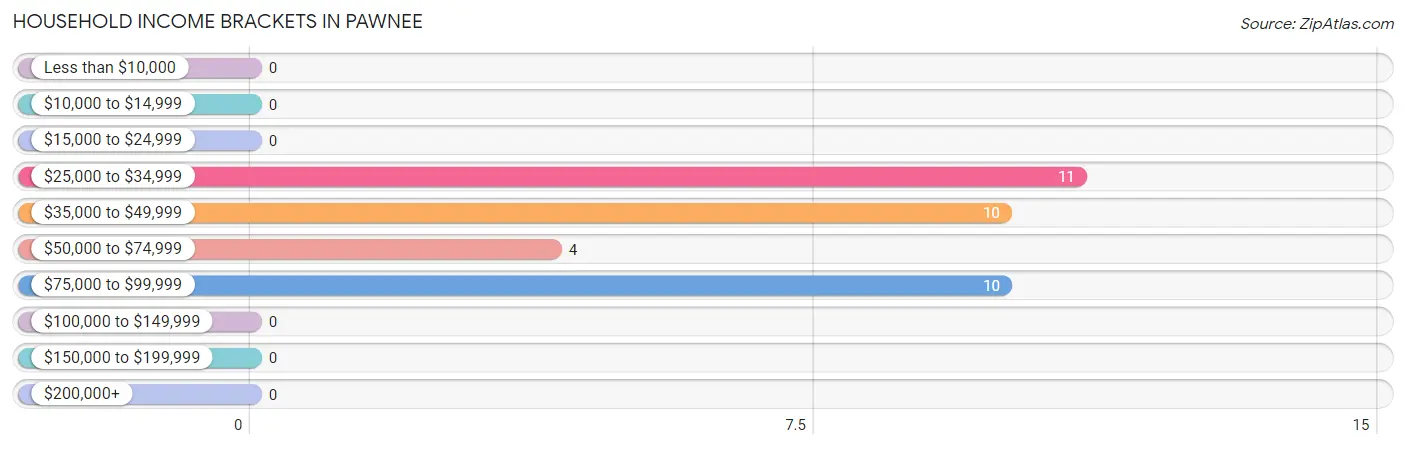
| Income Bracket | # Households | % Households |
| Less than $10,000 | 0 | 0.0% |
| $10,000 to $14,999 | 0 | 0.0% |
| $15,000 to $24,999 | 0 | 0.0% |
| $25,000 to $34,999 | 11 | 31.4% |
| $35,000 to $49,999 | 10 | 28.6% |
| $50,000 to $74,999 | 4 | 11.4% |
| $75,000 to $99,999 | 10 | 28.6% |
| $100,000 to $149,999 | 0 | 0.0% |
| $150,000 to $199,999 | 0 | 0.0% |
| $200,000+ | 0 | 0.0% |
Household Income by Householder Age in Pawnee
The median household income in Pawnee is $46,406, with the highest median household income of $85,417 found in the 65+ years age bracket for the primary householder. A total of 5 households (14.3%) fall into this category.
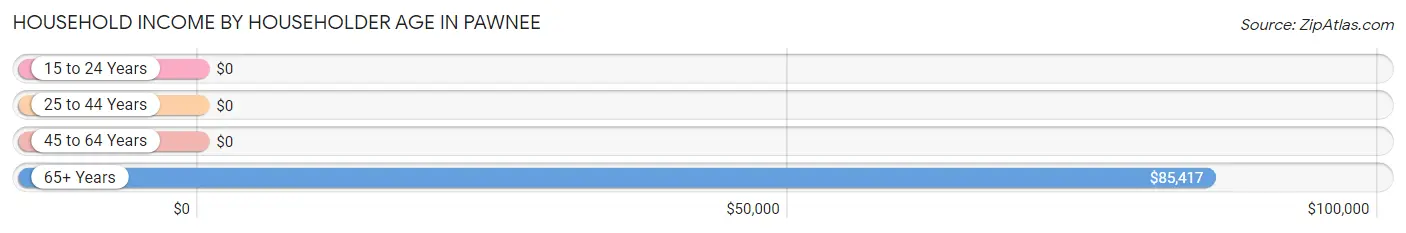
| Income Bracket | # Households | Median Income |
| 15 to 24 Years | 0 (0.0%) | $0 |
| 25 to 44 Years | 8 (22.9%) | $0 |
| 45 to 64 Years | 22 (62.9%) | $0 |
| 65+ Years | 5 (14.3%) | $85,417 |
| Total | 35 (100.0%) | $46,406 |
Poverty in Pawnee
Income Below Poverty by Sex and Age in Pawnee
| Age Bracket | Male | Female |
| Under 5 Years | 0 (0.0%) | 0 (0.0%) |
| 5 Years | 0 (0.0%) | 0 (0.0%) |
| 6 to 11 Years | 0 (0.0%) | 0 (0.0%) |
| 12 to 14 Years | 0 (0.0%) | 0 (0.0%) |
| 15 Years | 0 (0.0%) | 0 (0.0%) |
| 16 and 17 Years | 0 (0.0%) | 0 (0.0%) |
| 18 to 24 Years | 0 (0.0%) | 0 (0.0%) |
| 25 to 34 Years | 0 (0.0%) | 0 (0.0%) |
| 35 to 44 Years | 0 (0.0%) | 0 (0.0%) |
| 45 to 54 Years | 0 (0.0%) | 0 (0.0%) |
| 55 to 64 Years | 0 (0.0%) | 0 (0.0%) |
| 65 to 74 Years | 0 (0.0%) | 0 (0.0%) |
| 75 Years and over | 0 (0.0%) | 0 (0.0%) |
| Total | 0 (0.0%) | 0 (0.0%) |
Income Above Poverty by Sex and Age in Pawnee
According to the poverty statistics in Pawnee, males aged 6 to 11 years and females aged under 5 years are the age groups that are most secure financially, with 100.0% of males and 100.0% of females in these age groups living above the poverty line.
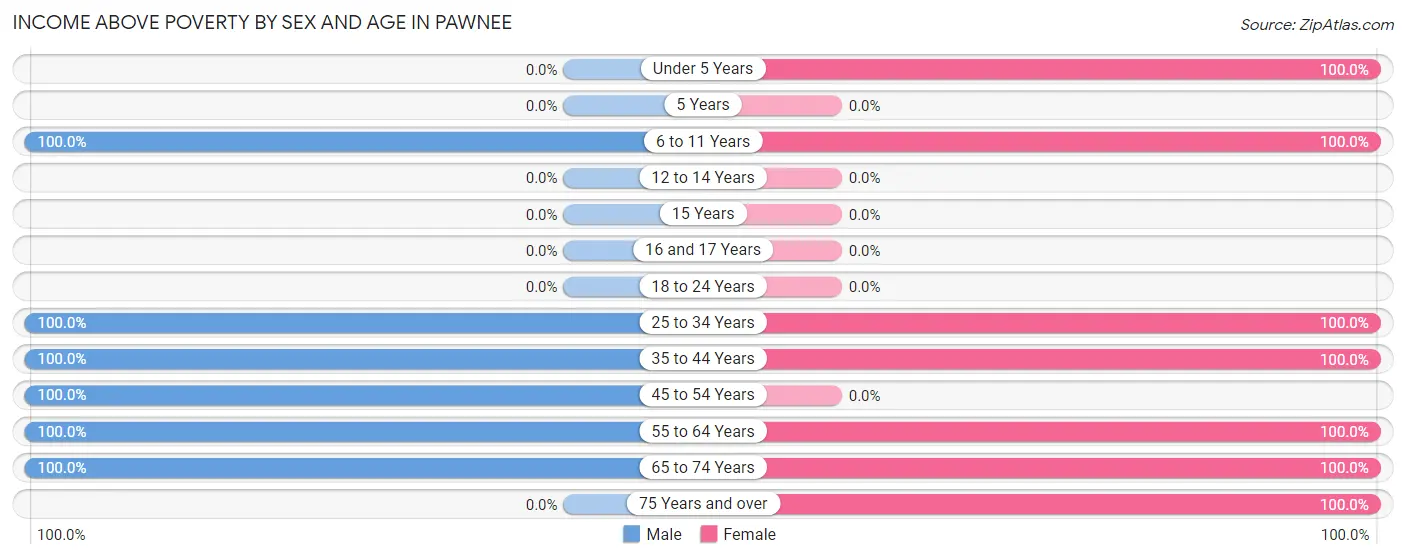
| Age Bracket | Male | Female |
| Under 5 Years | 0 (0.0%) | 9 (100.0%) |
| 5 Years | 0 (0.0%) | 0 (0.0%) |
| 6 to 11 Years | 10 (100.0%) | 9 (100.0%) |
| 12 to 14 Years | 0 (0.0%) | 0 (0.0%) |
| 15 Years | 0 (0.0%) | 0 (0.0%) |
| 16 and 17 Years | 0 (0.0%) | 0 (0.0%) |
| 18 to 24 Years | 0 (0.0%) | 0 (0.0%) |
| 25 to 34 Years | 2 (100.0%) | 8 (100.0%) |
| 35 to 44 Years | 6 (100.0%) | 9 (100.0%) |
| 45 to 54 Years | 7 (100.0%) | 0 (0.0%) |
| 55 to 64 Years | 4 (100.0%) | 16 (100.0%) |
| 65 to 74 Years | 12 (100.0%) | 4 (100.0%) |
| 75 Years and over | 0 (0.0%) | 1 (100.0%) |
| Total | 41 (100.0%) | 56 (100.0%) |
Income Below Poverty Among Married-Couple Families in Pawnee
| Children | Above Poverty | Below Poverty |
| No Children | 24 (100.0%) | 0 (0.0%) |
| 1 or 2 Children | 0 (0.0%) | 0 (0.0%) |
| 3 or 4 Children | 8 (100.0%) | 0 (0.0%) |
| 5 or more Children | 0 (0.0%) | 0 (0.0%) |
| Total | 32 (100.0%) | 0 (0.0%) |
Income Below Poverty Among Single-Parent Households in Pawnee
| Children | Single Father | Single Mother |
| No Children | 0 (0.0%) | 0 (0.0%) |
| 1 or 2 Children | 0 (0.0%) | 0 (0.0%) |
| 3 or 4 Children | 0 (0.0%) | 0 (0.0%) |
| 5 or more Children | 0 (0.0%) | 0 (0.0%) |
| Total | 0 (0.0%) | 0 (0.0%) |
Income Below Poverty Among Married-Couple vs Single-Parent Households in Pawnee
| Children | Married-Couple Families | Single-Parent Households |
| No Children | 0 (0.0%) | 0 (0.0%) |
| 1 or 2 Children | 0 (0.0%) | 0 (0.0%) |
| 3 or 4 Children | 0 (0.0%) | 0 (0.0%) |
| 5 or more Children | 0 (0.0%) | 0 (0.0%) |
| Total | 0 (0.0%) | 0 (0.0%) |
Race in Pawnee
The most populous races in Pawnee are Hispanic or Latino (88 | 90.7%), White / Caucasian (78 | 80.4%), and Some other Race (12 | 12.4%).
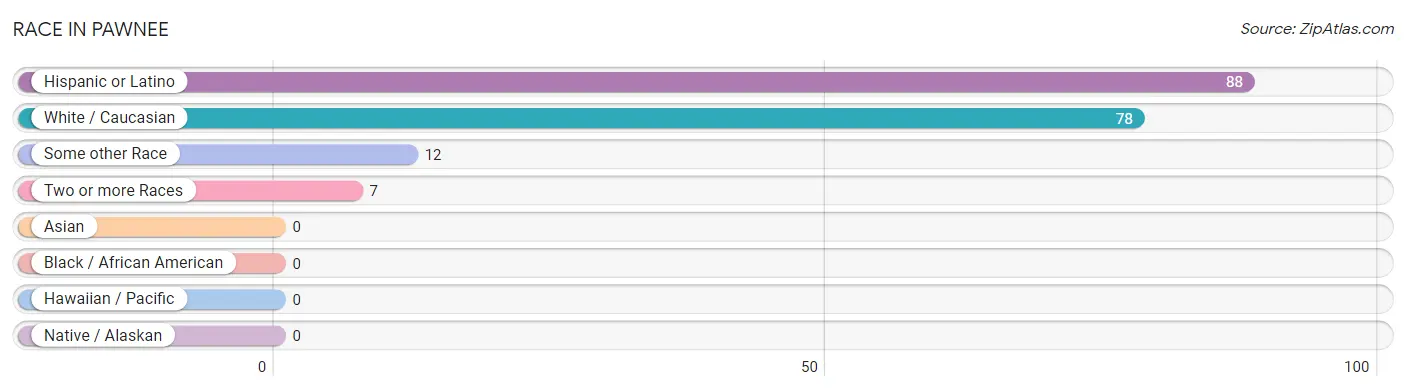
| Race | # Population | % Population |
| Asian | 0 | 0.0% |
| Black / African American | 0 | 0.0% |
| Hawaiian / Pacific | 0 | 0.0% |
| Hispanic or Latino | 88 | 90.7% |
| Native / Alaskan | 0 | 0.0% |
| White / Caucasian | 78 | 80.4% |
| Two or more Races | 7 | 7.2% |
| Some other Race | 12 | 12.4% |
| Total | 97 | 100.0% |
Ancestry in Pawnee
The most populous ancestries reported in Pawnee are Mexican (85 | 87.6%), American (23 | 23.7%), and Czech (9 | 9.3%), together accounting for 120.6% of all Pawnee residents.
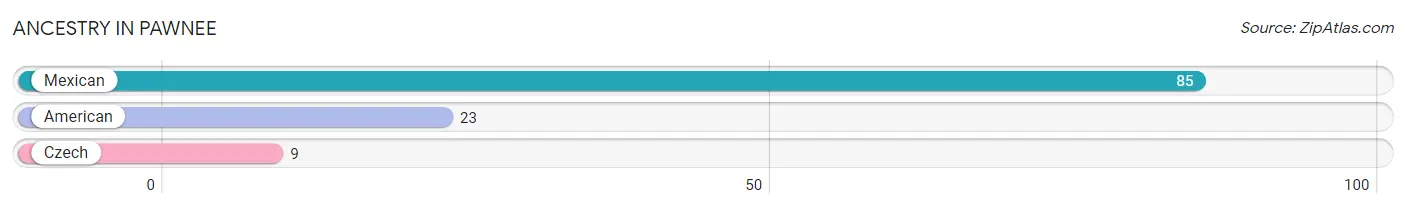
| Ancestry | # Population | % Population |
| American | 23 | 23.7% |
| Czech | 9 | 9.3% |
| Mexican | 85 | 87.6% | View All 3 Rows |
Immigrants in Pawnee

| Immigration Origin | # Population | % Population | View All 0 Rows |
Sex and Age in Pawnee
Sex and Age in Pawnee
The most populous age groups in Pawnee are 70 to 74 Years (12 | 29.3%) for men and Under 5 Years (9 | 16.1%) for women.
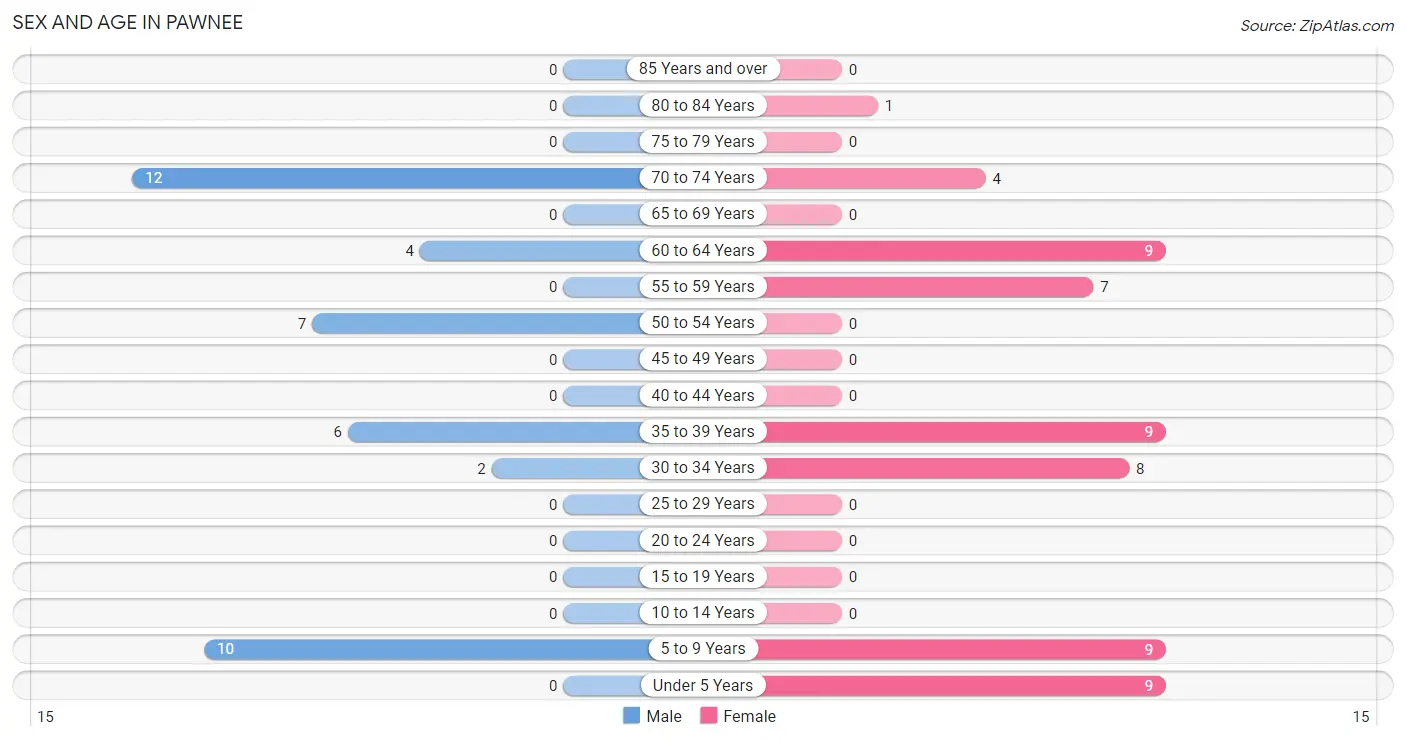
| Age Bracket | Male | Female |
| Under 5 Years | 0 (0.0%) | 9 (16.1%) |
| 5 to 9 Years | 10 (24.4%) | 9 (16.1%) |
| 10 to 14 Years | 0 (0.0%) | 0 (0.0%) |
| 15 to 19 Years | 0 (0.0%) | 0 (0.0%) |
| 20 to 24 Years | 0 (0.0%) | 0 (0.0%) |
| 25 to 29 Years | 0 (0.0%) | 0 (0.0%) |
| 30 to 34 Years | 2 (4.9%) | 8 (14.3%) |
| 35 to 39 Years | 6 (14.6%) | 9 (16.1%) |
| 40 to 44 Years | 0 (0.0%) | 0 (0.0%) |
| 45 to 49 Years | 0 (0.0%) | 0 (0.0%) |
| 50 to 54 Years | 7 (17.1%) | 0 (0.0%) |
| 55 to 59 Years | 0 (0.0%) | 7 (12.5%) |
| 60 to 64 Years | 4 (9.8%) | 9 (16.1%) |
| 65 to 69 Years | 0 (0.0%) | 0 (0.0%) |
| 70 to 74 Years | 12 (29.3%) | 4 (7.1%) |
| 75 to 79 Years | 0 (0.0%) | 0 (0.0%) |
| 80 to 84 Years | 0 (0.0%) | 1 (1.8%) |
| 85 Years and over | 0 (0.0%) | 0 (0.0%) |
| Total | 41 (100.0%) | 56 (100.0%) |
Families and Households in Pawnee
Median Family Size in Pawnee
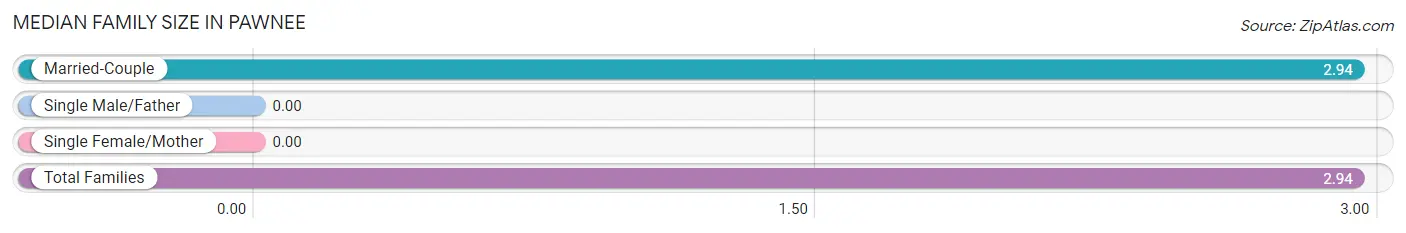
| Family Type | # Families | Family Size |
| Married-Couple | 32 (100.0%) | 2.94 |
| Single Male/Father | 0 (0.0%) | - |
| Single Female/Mother | 0 (0.0%) | - |
| Total Families | 32 (100.0%) | 2.94 |
Median Household Size in Pawnee
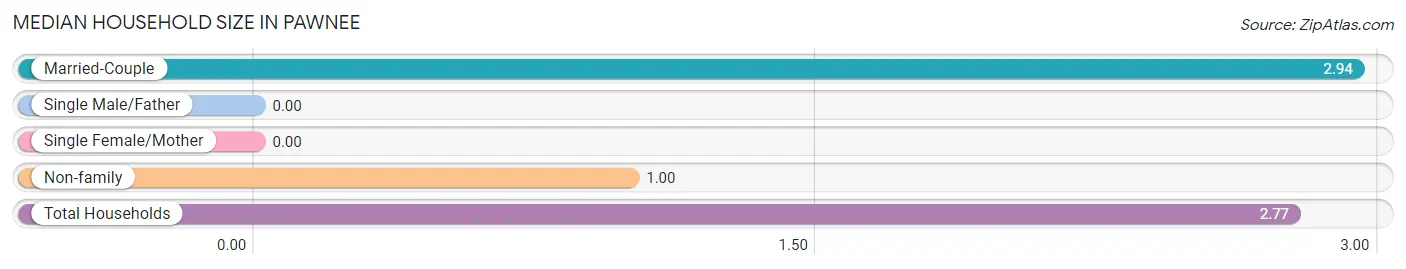
| Household Type | # Households | Household Size |
| Married-Couple | 32 (91.4%) | 2.94 |
| Single Male/Father | 0 (0.0%) | - |
| Single Female/Mother | 0 (0.0%) | - |
| Non-family | 3 (8.6%) | 1.00 |
| Total Households | 35 (100.0%) | 2.77 |
Household Size by Marriage Status in Pawnee
Out of a total of 35 households in Pawnee, 32 (91.4%) are family households, while 3 (8.6%) are nonfamily households. The most numerous type of family households are 2-person households, comprising 20, and the most common type of nonfamily households are 1-person households, comprising 3.
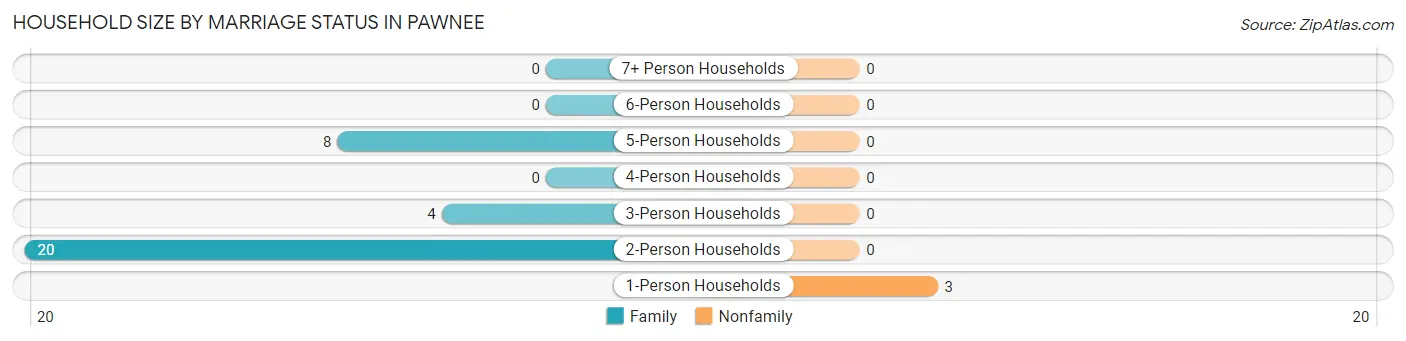
| Household Size | Family Households | Nonfamily Households |
| 1-Person Households | - | 3 (8.6%) |
| 2-Person Households | 20 (57.1%) | 0 (0.0%) |
| 3-Person Households | 4 (11.4%) | 0 (0.0%) |
| 4-Person Households | 0 (0.0%) | 0 (0.0%) |
| 5-Person Households | 8 (22.9%) | 0 (0.0%) |
| 6-Person Households | 0 (0.0%) | 0 (0.0%) |
| 7+ Person Households | 0 (0.0%) | 0 (0.0%) |
| Total | 32 (91.4%) | 3 (8.6%) |
Female Fertility in Pawnee
Fertility by Age in Pawnee
Average fertility rate in Pawnee is 471.0 births per 1,000 women. Women in the age bracket of 20 to 34 years have the highest fertility rate with 1,000.0 births per 1,000 women. Women in the age bracket of 20 to 34 years acount for 100.0% of all women with births.
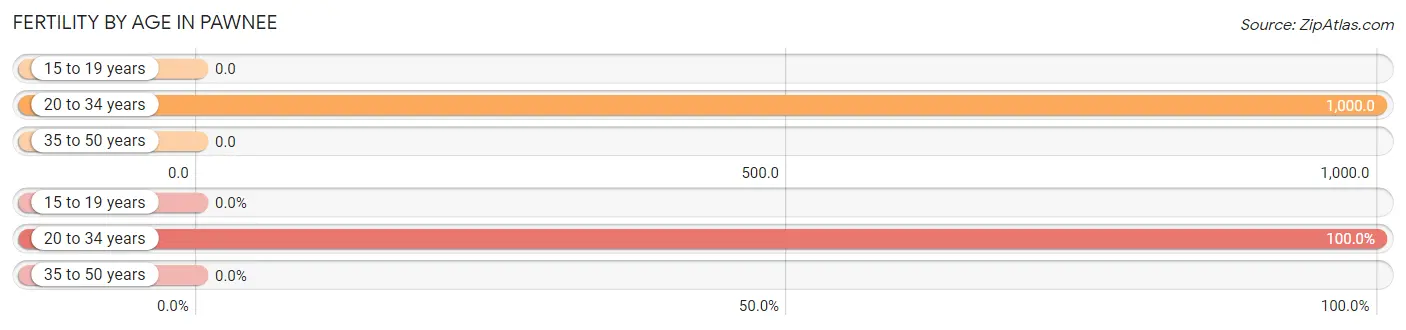
| Age Bracket | Women with Births | Births / 1,000 Women |
| 15 to 19 years | 0 (0.0%) | 0.0 |
| 20 to 34 years | 8 (100.0%) | 1,000.0 |
| 35 to 50 years | 0 (0.0%) | 0.0 |
| Total | 8 (100.0%) | 471.0 |
Fertility by Age by Marriage Status in Pawnee
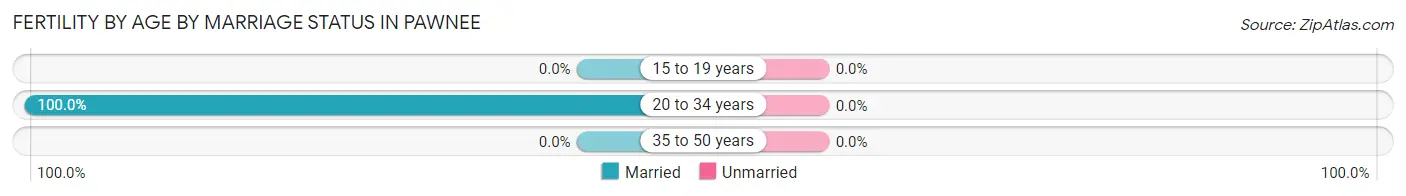
| Age Bracket | Married | Unmarried |
| 15 to 19 years | 0 (0.0%) | 0 (0.0%) |
| 20 to 34 years | 8 (100.0%) | 0 (0.0%) |
| 35 to 50 years | 0 (0.0%) | 0 (0.0%) |
| Total | 8 (100.0%) | 0 (0.0%) |
Fertility by Education in Pawnee
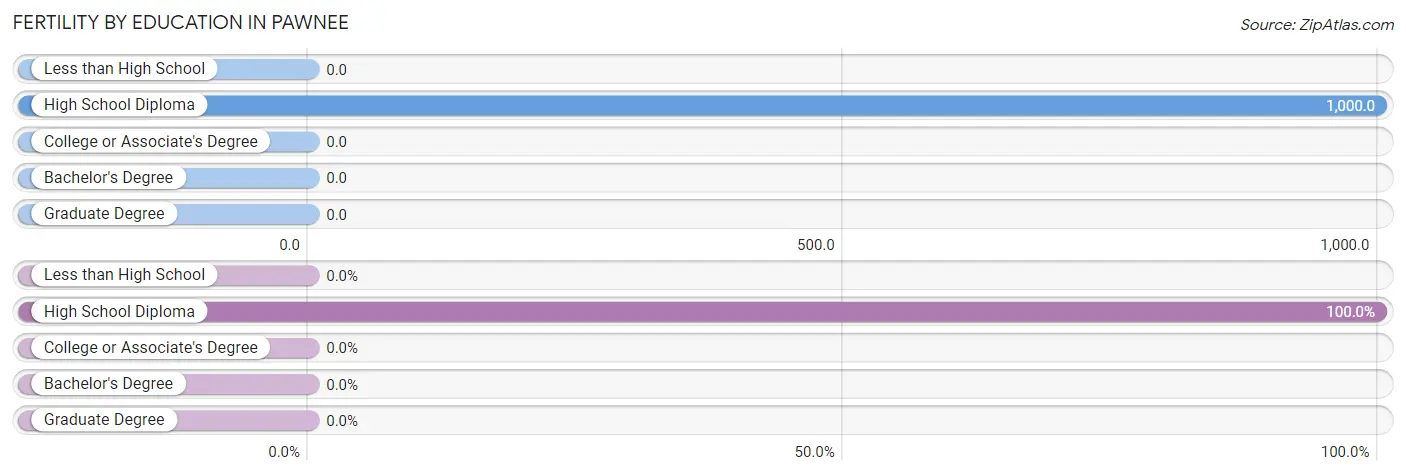
| Educational Attainment | Women with Births | Births / 1,000 Women |
| Less than High School | 0 (0.0%) | 0.0 |
| High School Diploma | 8 (100.0%) | 1,000.0 |
| College or Associate's Degree | 0 (0.0%) | 0.0 |
| Bachelor's Degree | 0 (0.0%) | 0.0 |
| Graduate Degree | 0 (0.0%) | 0.0 |
| Total | 8 (100.0%) | 471.0 |
Fertility by Education by Marriage Status in Pawnee
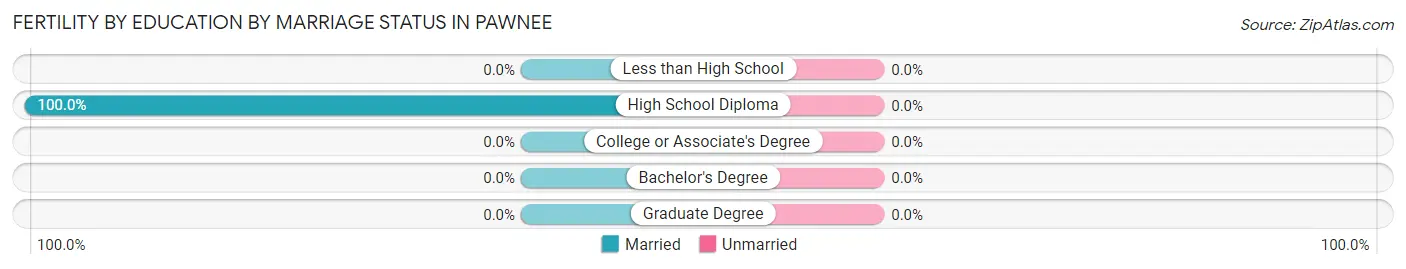
| Educational Attainment | Married | Unmarried |
| Less than High School | 0 (0.0%) | 0 (0.0%) |
| High School Diploma | 8 (100.0%) | 0 (0.0%) |
| College or Associate's Degree | 0 (0.0%) | 0 (0.0%) |
| Bachelor's Degree | 0 (0.0%) | 0 (0.0%) |
| Graduate Degree | 0 (0.0%) | 0 (0.0%) |
| Total | 8 (100.0%) | 0 (0.0%) |
Employment Characteristics in Pawnee
Employment by Class of Employer in Pawnee
Among the 41 employed individuals in Pawnee, private company employees (27 | 65.8%), self-employed (not incorporated) (9 | 22.0%), and state government employees (5 | 12.2%) make up the most common classes of employment.
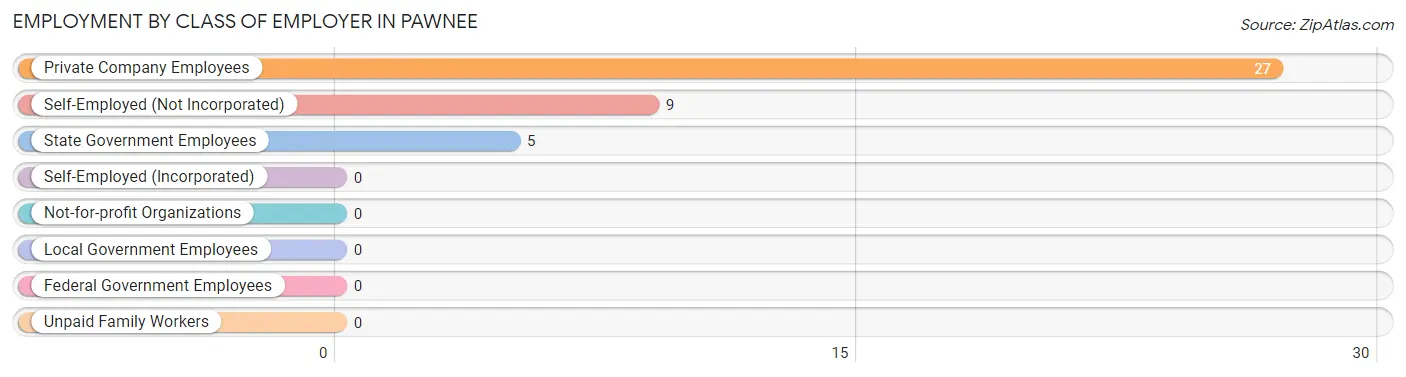
| Employer Class | # Employees | % Employees |
| Private Company Employees | 27 | 65.8% |
| Self-Employed (Incorporated) | 0 | 0.0% |
| Self-Employed (Not Incorporated) | 9 | 22.0% |
| Not-for-profit Organizations | 0 | 0.0% |
| Local Government Employees | 0 | 0.0% |
| State Government Employees | 5 | 12.2% |
| Federal Government Employees | 0 | 0.0% |
| Unpaid Family Workers | 0 | 0.0% |
| Total | 41 | 100.0% |
Employment Status by Age in Pawnee
According to the labor force statistics for Pawnee, out of the total population over 16 years of age (69), 62.3% or 43 individuals are in the labor force, with 4.7% or 2 of them unemployed. The age group with the highest labor force participation rate is 35 to 44 years, with 100.0% or 15 individuals in the labor force. Within the labor force, the 55 to 59 years age range has the highest percentage of unemployed individuals, with 28.6% or 2 of them being unemployed.
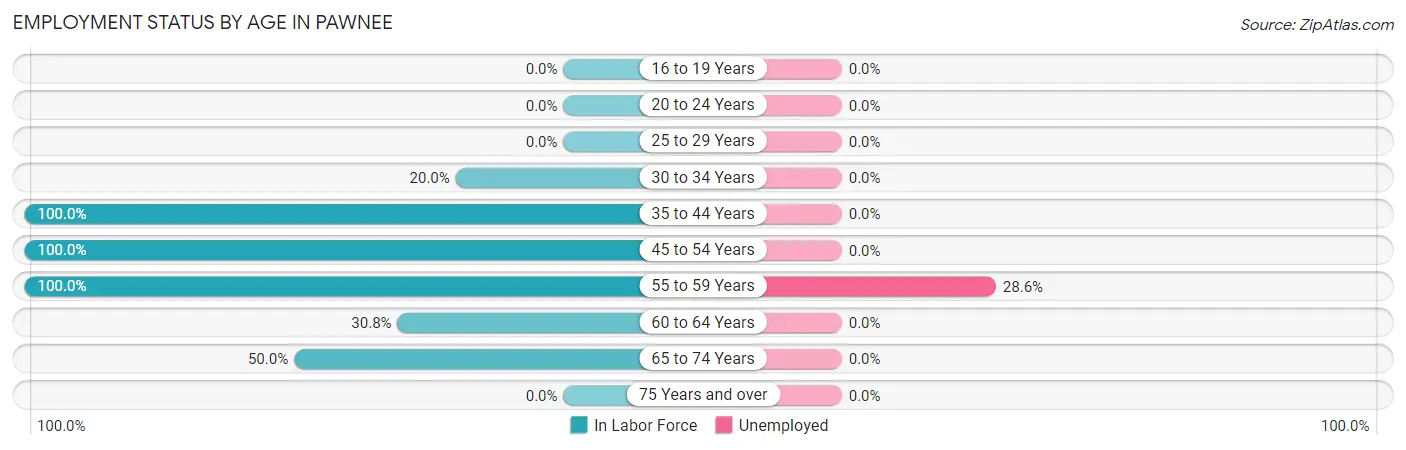
| Age Bracket | In Labor Force | Unemployed |
| 16 to 19 Years | 0 (0.0%) | 0 (0.0%) |
| 20 to 24 Years | 0 (0.0%) | 0 (0.0%) |
| 25 to 29 Years | 0 (0.0%) | 0 (0.0%) |
| 30 to 34 Years | 2 (20.0%) | 0 (0.0%) |
| 35 to 44 Years | 15 (100.0%) | 0 (0.0%) |
| 45 to 54 Years | 7 (100.0%) | 0 (0.0%) |
| 55 to 59 Years | 7 (100.0%) | 2 (28.6%) |
| 60 to 64 Years | 4 (30.8%) | 0 (0.0%) |
| 65 to 74 Years | 8 (50.0%) | 0 (0.0%) |
| 75 Years and over | 0 (0.0%) | 0 (0.0%) |
| Total | 43 (62.3%) | 2 (4.7%) |
Employment Status by Educational Attainment in Pawnee
According to labor force statistics for Pawnee, 67.3% of individuals (35) out of the total population between 25 and 64 years of age (52) are in the labor force, with 5.7% or 2 of them being unemployed. The group with the highest labor force participation rate are those with the educational attainment of college / associate degree, with 100.0% or 18 individuals in the labor force. Within the labor force, individuals with college / associate degree education have the highest percentage of unemployment, with 11.1% or 2 of them being unemployed.
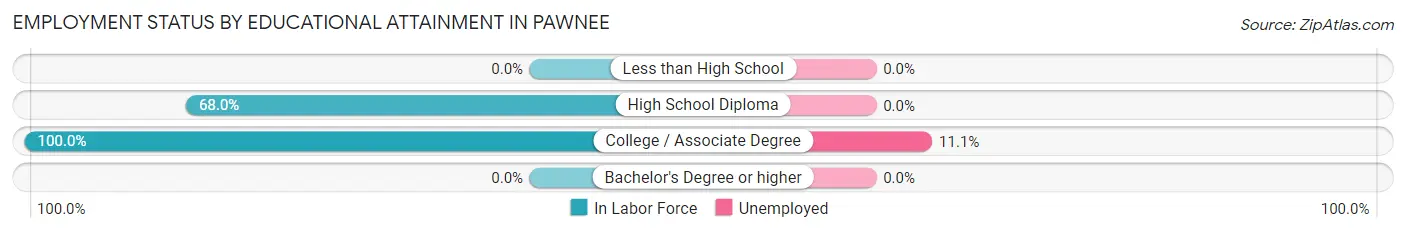
| Educational Attainment | In Labor Force | Unemployed |
| Less than High School | 0 (0.0%) | 0 (0.0%) |
| High School Diploma | 17 (68.0%) | 0 (0.0%) |
| College / Associate Degree | 18 (100.0%) | 2 (11.1%) |
| Bachelor's Degree or higher | 0 (0.0%) | 0 (0.0%) |
| Total | 35 (67.3%) | 3 (5.7%) |
Employment Occupations by Sex in Pawnee
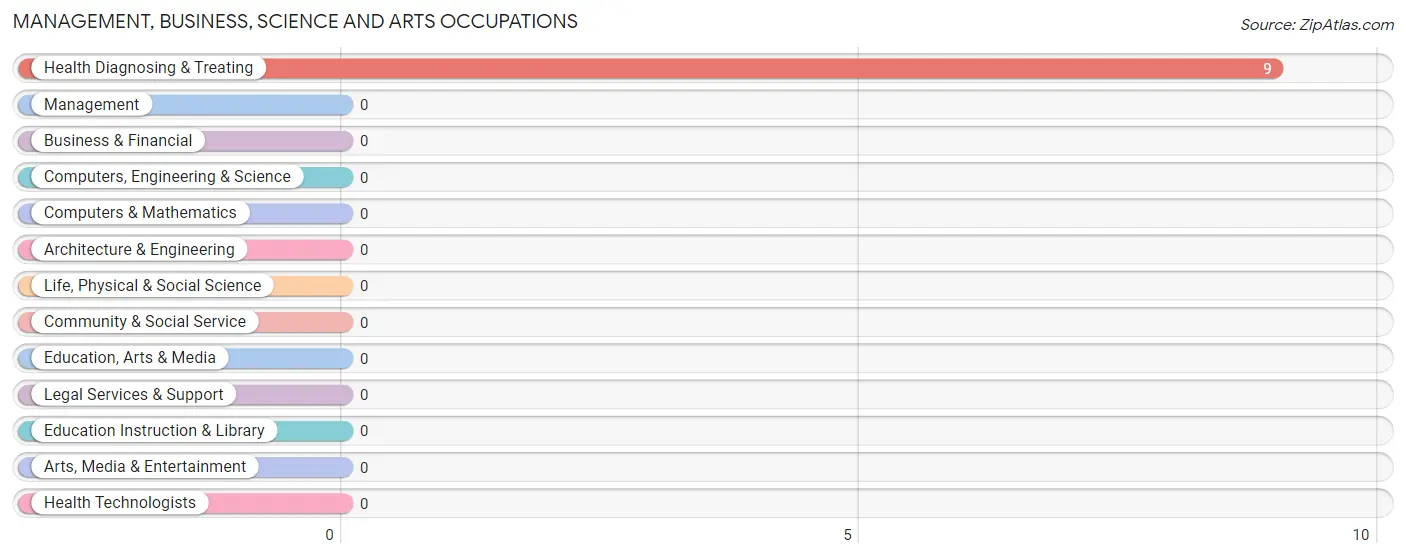
Management, Business, Science and Arts Occupations
The most common Management, Business, Science and Arts occupations in Pawnee are , and Health Diagnosing & Treating (9 | 22.0%).
Management, Business, Science and Arts Occupations by Sex
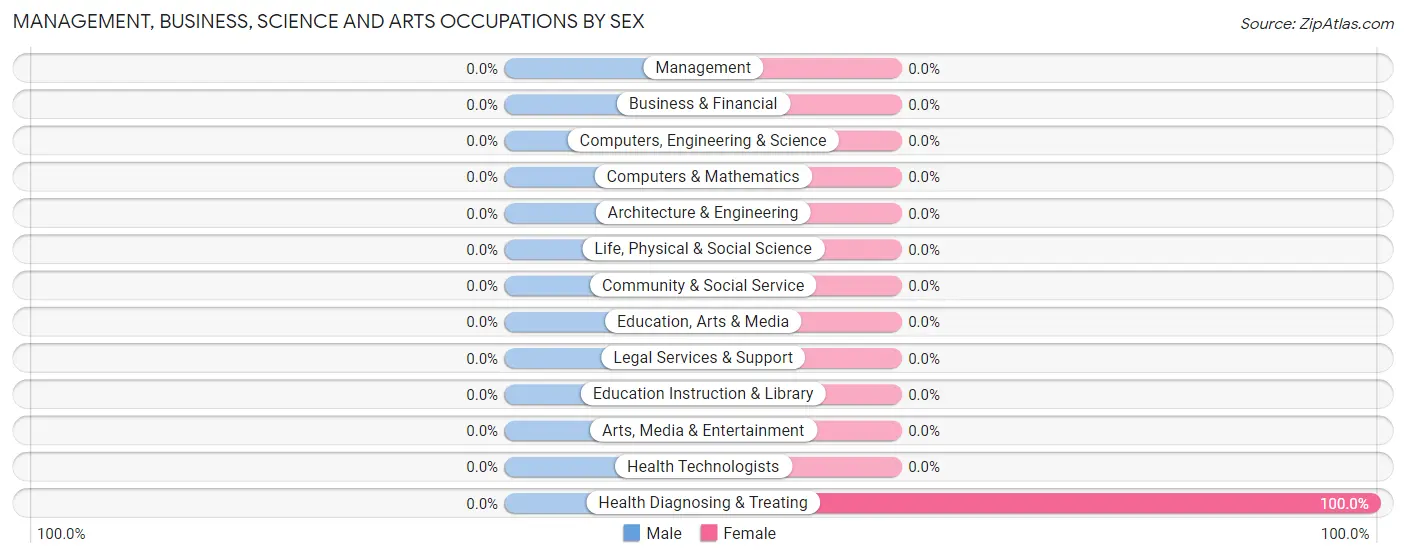
| Occupation | Male | Female |
| Management | 0 (0.0%) | 0 (0.0%) |
| Business & Financial | 0 (0.0%) | 0 (0.0%) |
| Computers, Engineering & Science | 0 (0.0%) | 0 (0.0%) |
| Computers & Mathematics | 0 (0.0%) | 0 (0.0%) |
| Architecture & Engineering | 0 (0.0%) | 0 (0.0%) |
| Life, Physical & Social Science | 0 (0.0%) | 0 (0.0%) |
| Community & Social Service | 0 (0.0%) | 0 (0.0%) |
| Education, Arts & Media | 0 (0.0%) | 0 (0.0%) |
| Legal Services & Support | 0 (0.0%) | 0 (0.0%) |
| Education Instruction & Library | 0 (0.0%) | 0 (0.0%) |
| Arts, Media & Entertainment | 0 (0.0%) | 0 (0.0%) |
| Health Diagnosing & Treating | 0 (0.0%) | 9 (100.0%) |
| Health Technologists | 0 (0.0%) | 0 (0.0%) |
| Total (Category) | 0 (0.0%) | 9 (100.0%) |
| Total (Overall) | 27 (65.8%) | 14 (34.2%) |
Services Occupations
Services Occupations by Sex
| Occupation | Male | Female |
| Healthcare Support | 0 (0.0%) | 0 (0.0%) |
| Security & Protection | 0 (0.0%) | 0 (0.0%) |
| Firefighting & Prevention | 0 (0.0%) | 0 (0.0%) |
| Law Enforcement | 0 (0.0%) | 0 (0.0%) |
| Food Preparation & Serving | 0 (0.0%) | 0 (0.0%) |
| Cleaning & Maintenance | 0 (0.0%) | 0 (0.0%) |
| Personal Care & Service | 0 (0.0%) | 0 (0.0%) |
| Total (Category) | 0 (0.0%) | 0 (0.0%) |
| Total (Overall) | 27 (65.8%) | 14 (34.2%) |
Sales and Office Occupations
The most common Sales and Office occupations in Pawnee are , and Office & Administration (5 | 12.2%).
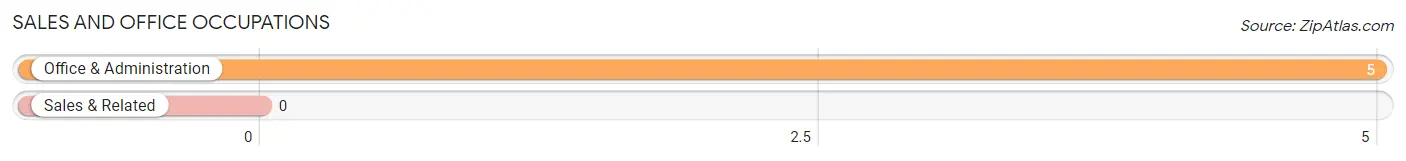
Sales and Office Occupations by Sex
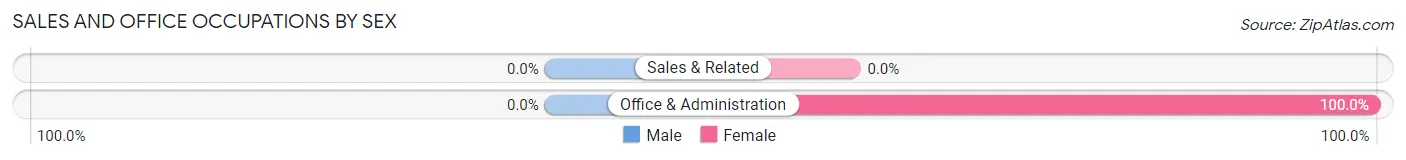
| Occupation | Male | Female |
| Sales & Related | 0 (0.0%) | 0 (0.0%) |
| Office & Administration | 0 (0.0%) | 5 (100.0%) |
| Total (Category) | 0 (0.0%) | 5 (100.0%) |
| Total (Overall) | 27 (65.8%) | 14 (34.2%) |
Natural Resources, Construction and Maintenance Occupations
The most common Natural Resources, Construction and Maintenance occupations in Pawnee are Construction & Extraction (8 | 19.5%), and Farming, Fishing & Forestry (4 | 9.8%).
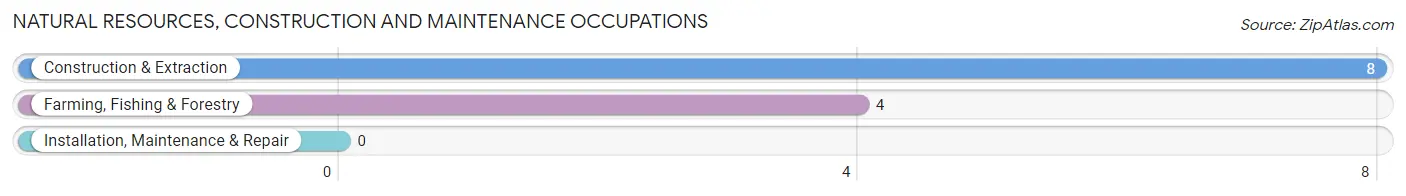
Natural Resources, Construction and Maintenance Occupations by Sex
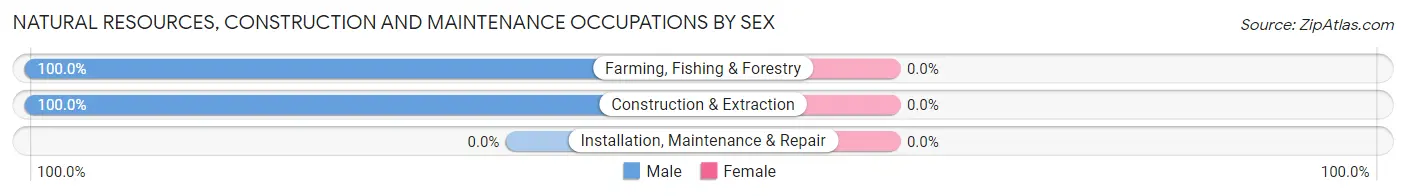
| Occupation | Male | Female |
| Farming, Fishing & Forestry | 4 (100.0%) | 0 (0.0%) |
| Construction & Extraction | 8 (100.0%) | 0 (0.0%) |
| Installation, Maintenance & Repair | 0 (0.0%) | 0 (0.0%) |
| Total (Category) | 12 (100.0%) | 0 (0.0%) |
| Total (Overall) | 27 (65.8%) | 14 (34.2%) |
Production, Transportation and Moving Occupations
The most common Production, Transportation and Moving occupations in Pawnee are Transportation (8 | 19.5%), and Production (7 | 17.1%).
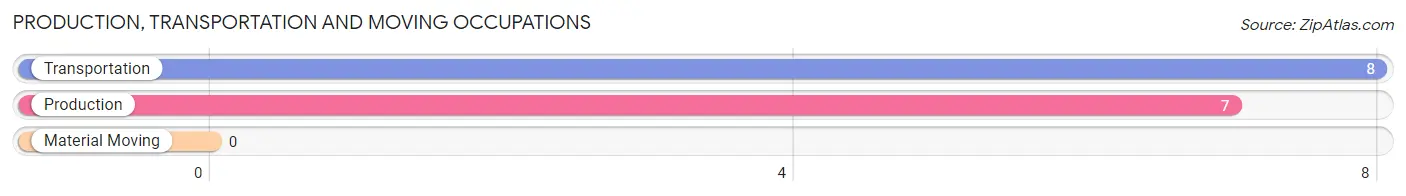
Production, Transportation and Moving Occupations by Sex
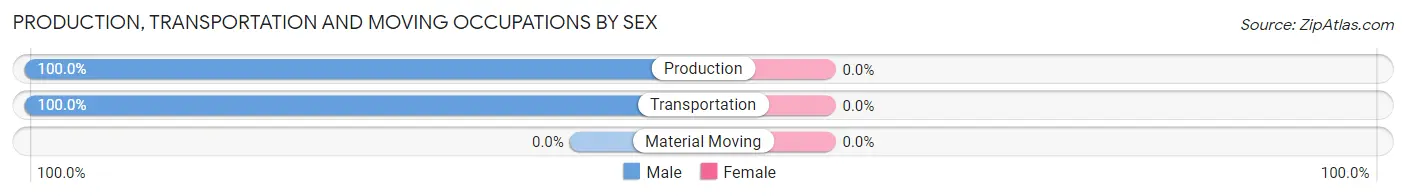
| Occupation | Male | Female |
| Production | 7 (100.0%) | 0 (0.0%) |
| Transportation | 8 (100.0%) | 0 (0.0%) |
| Material Moving | 0 (0.0%) | 0 (0.0%) |
| Total (Category) | 15 (100.0%) | 0 (0.0%) |
| Total (Overall) | 27 (65.8%) | 14 (34.2%) |
Employment Industries by Sex in Pawnee
Employment Industries in Pawnee
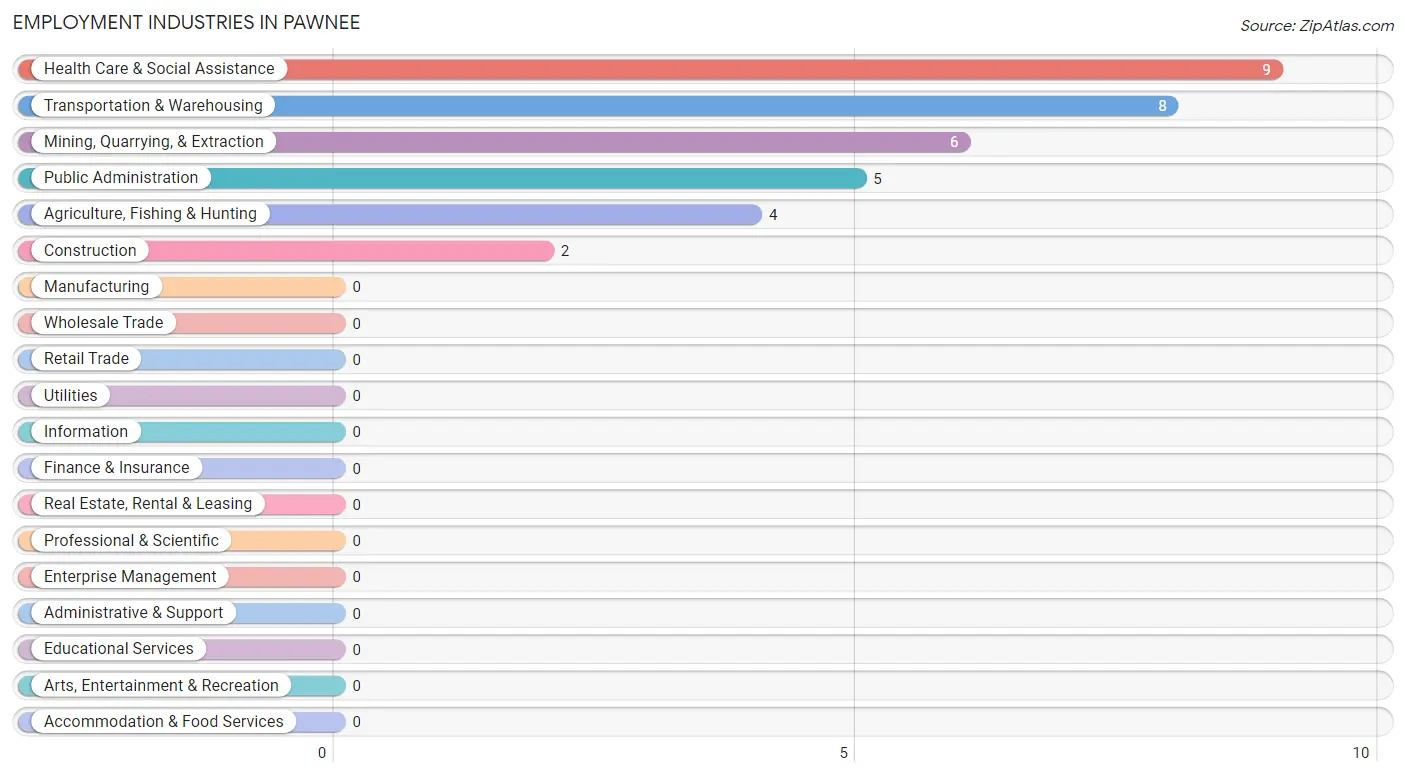
The major employment industries in Pawnee include Health Care & Social Assistance (9 | 22.0%), Transportation & Warehousing (8 | 19.5%), Mining, Quarrying, & Extraction (6 | 14.6%), Public Administration (5 | 12.2%), and Agriculture, Fishing & Hunting (4 | 9.8%).
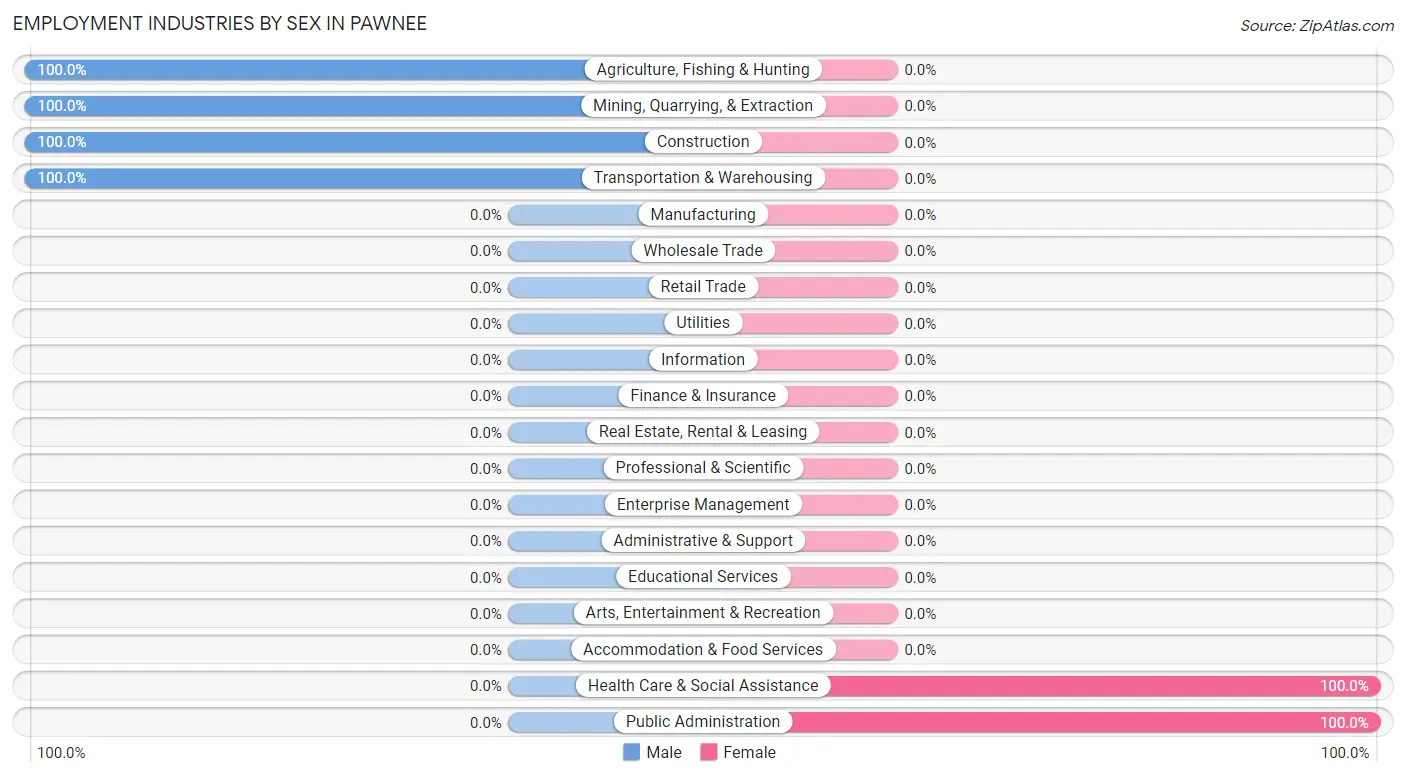
Employment Industries by Sex in Pawnee
The Pawnee industries that see more men than women are Agriculture, Fishing & Hunting (100.0%), Mining, Quarrying, & Extraction (100.0%), and Construction (100.0%), whereas the industries that tend to have a higher number of women are Health Care & Social Assistance (100.0%), and Public Administration (100.0%).
| Industry | Male | Female |
| Agriculture, Fishing & Hunting | 4 (100.0%) | 0 (0.0%) |
| Mining, Quarrying, & Extraction | 6 (100.0%) | 0 (0.0%) |
| Construction | 2 (100.0%) | 0 (0.0%) |
| Manufacturing | 0 (0.0%) | 0 (0.0%) |
| Wholesale Trade | 0 (0.0%) | 0 (0.0%) |
| Retail Trade | 0 (0.0%) | 0 (0.0%) |
| Transportation & Warehousing | 8 (100.0%) | 0 (0.0%) |
| Utilities | 0 (0.0%) | 0 (0.0%) |
| Information | 0 (0.0%) | 0 (0.0%) |
| Finance & Insurance | 0 (0.0%) | 0 (0.0%) |
| Real Estate, Rental & Leasing | 0 (0.0%) | 0 (0.0%) |
| Professional & Scientific | 0 (0.0%) | 0 (0.0%) |
| Enterprise Management | 0 (0.0%) | 0 (0.0%) |
| Administrative & Support | 0 (0.0%) | 0 (0.0%) |
| Educational Services | 0 (0.0%) | 0 (0.0%) |
| Health Care & Social Assistance | 0 (0.0%) | 9 (100.0%) |
| Arts, Entertainment & Recreation | 0 (0.0%) | 0 (0.0%) |
| Accommodation & Food Services | 0 (0.0%) | 0 (0.0%) |
| Public Administration | 0 (0.0%) | 5 (100.0%) |
| Total | 27 (65.8%) | 14 (34.2%) |
Education in Pawnee
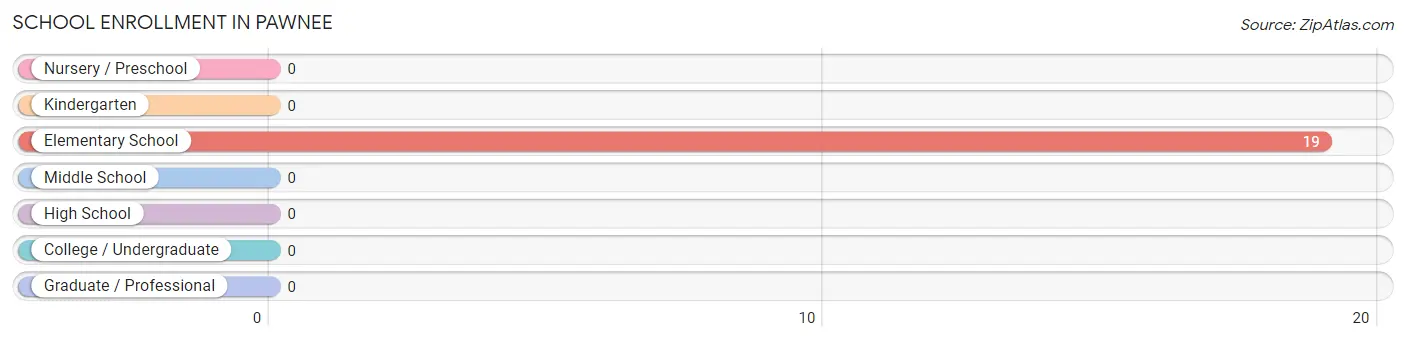
School Enrollment in Pawnee
| School Level | # Students | % Students |
| Nursery / Preschool | 0 | 0.0% |
| Kindergarten | 0 | 0.0% |
| Elementary School | 19 | 100.0% |
| Middle School | 0 | 0.0% |
| High School | 0 | 0.0% |
| College / Undergraduate | 0 | 0.0% |
| Graduate / Professional | 0 | 0.0% |
| Total | 19 | 100.0% |
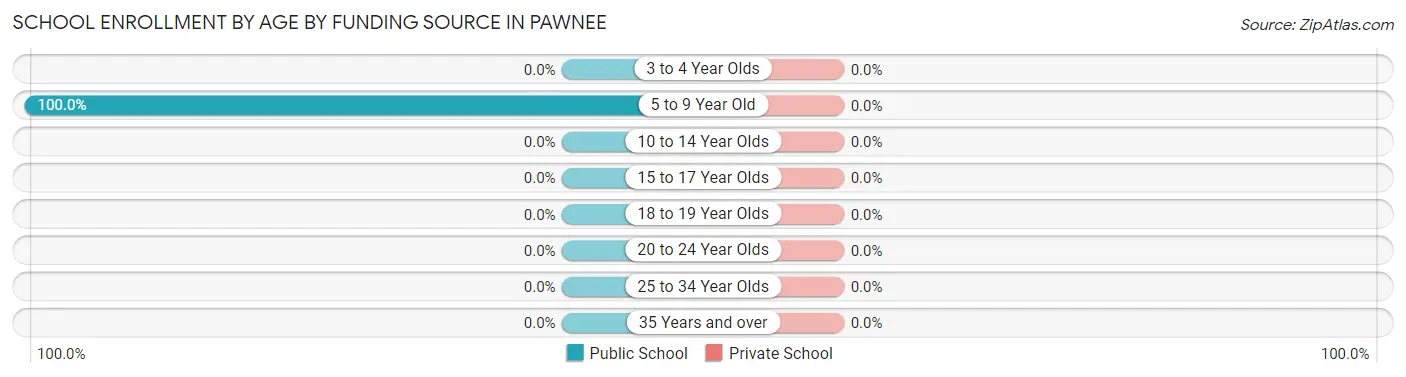
School Enrollment by Age by Funding Source in Pawnee
| Age Bracket | Public School | Private School |
| 3 to 4 Year Olds | 0 (0.0%) | 0 (0.0%) |
| 5 to 9 Year Old | 19 (100.0%) | 0 (0.0%) |
| 10 to 14 Year Olds | 0 (0.0%) | 0 (0.0%) |
| 15 to 17 Year Olds | 0 (0.0%) | 0 (0.0%) |
| 18 to 19 Year Olds | 0 (0.0%) | 0 (0.0%) |
| 20 to 24 Year Olds | 0 (0.0%) | 0 (0.0%) |
| 25 to 34 Year Olds | 0 (0.0%) | 0 (0.0%) |
| 35 Years and over | 0 (0.0%) | 0 (0.0%) |
| Total | 19 (100.0%) | 0 (0.0%) |
Educational Attainment by Field of Study in Pawnee
| Field of Study | # Graduates | % Graduates |
| Computers & Mathematics | 0 | 0.0% |
| Bio, Nature & Agricultural | 0 | 0.0% |
| Physical & Health Sciences | 0 | 0.0% |
| Psychology | 0 | 0.0% |
| Social Sciences | 0 | 0.0% |
| Engineering | 0 | 0.0% |
| Multidisciplinary Studies | 0 | 0.0% |
| Science & Technology | 0 | 0.0% |
| Business | 0 | 0.0% |
| Education | 0 | 0.0% |
| Literature & Languages | 0 | 0.0% |
| Liberal Arts & History | 0 | 0.0% |
| Visual & Performing Arts | 0 | 0.0% |
| Communications | 0 | 0.0% |
| Arts & Humanities | 0 | 0.0% |
| Total | 0 | 0.0% |
Transportation & Commute in Pawnee
Vehicle Availability by Sex in Pawnee
The most prevalent vehicle ownership categories in Pawnee are males with 2 vehicles (27, accounting for 100.0%) and females with 2 vehicles (14, making up 192.9%).
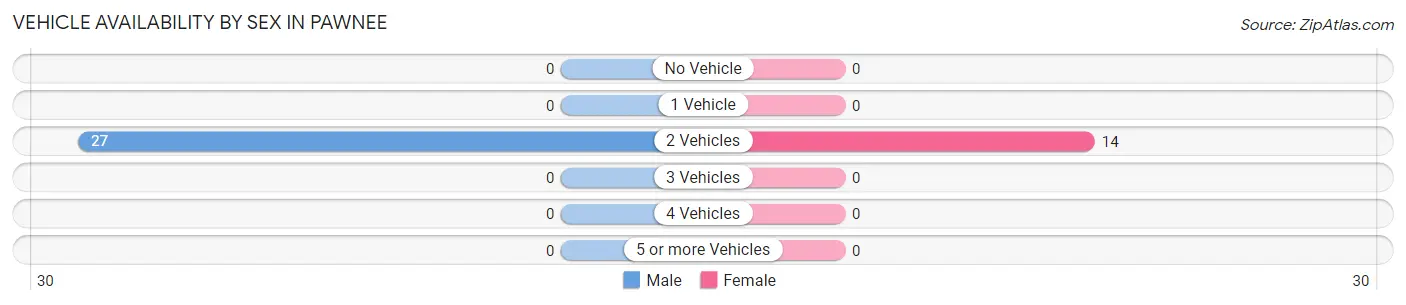
| Vehicles Available | Male | Female |
| No Vehicle | 0 (0.0%) | 0 (0.0%) |
| 1 Vehicle | 0 (0.0%) | 0 (0.0%) |
| 2 Vehicles | 27 (100.0%) | 14 (100.0%) |
| 3 Vehicles | 0 (0.0%) | 0 (0.0%) |
| 4 Vehicles | 0 (0.0%) | 0 (0.0%) |
| 5 or more Vehicles | 0 (0.0%) | 0 (0.0%) |
| Total | 27 (100.0%) | 14 (100.0%) |
Commute Time in Pawnee
The most frequently occuring commute durations in Pawnee are 30 to 34 minutes (17 commuters, 50.0%), 10 to 14 minutes (6 commuters, 17.6%), and 40 to 44 minutes (5 commuters, 14.7%).
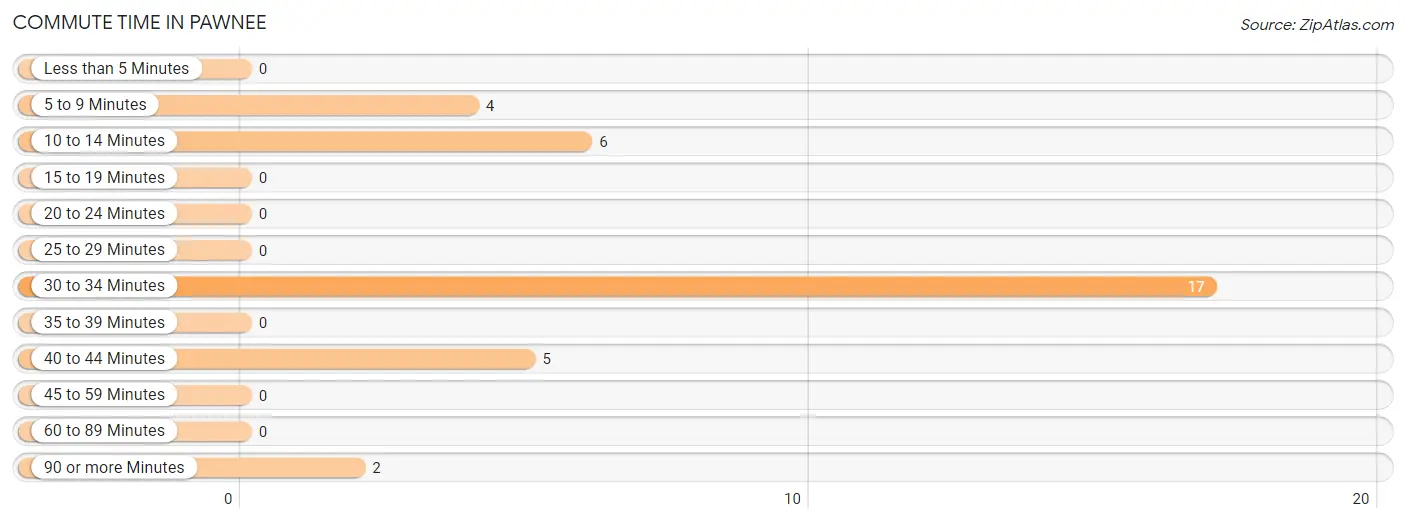
| Commute Time | # Commuters | % Commuters |
| Less than 5 Minutes | 0 | 0.0% |
| 5 to 9 Minutes | 4 | 11.8% |
| 10 to 14 Minutes | 6 | 17.6% |
| 15 to 19 Minutes | 0 | 0.0% |
| 20 to 24 Minutes | 0 | 0.0% |
| 25 to 29 Minutes | 0 | 0.0% |
| 30 to 34 Minutes | 17 | 50.0% |
| 35 to 39 Minutes | 0 | 0.0% |
| 40 to 44 Minutes | 5 | 14.7% |
| 45 to 59 Minutes | 0 | 0.0% |
| 60 to 89 Minutes | 0 | 0.0% |
| 90 or more Minutes | 2 | 5.9% |
Commute Time by Sex in Pawnee
The most common commute times in Pawnee are 30 to 34 minutes (8 commuters, 40.0%) for males and 30 to 34 minutes (9 commuters, 64.3%) for females.
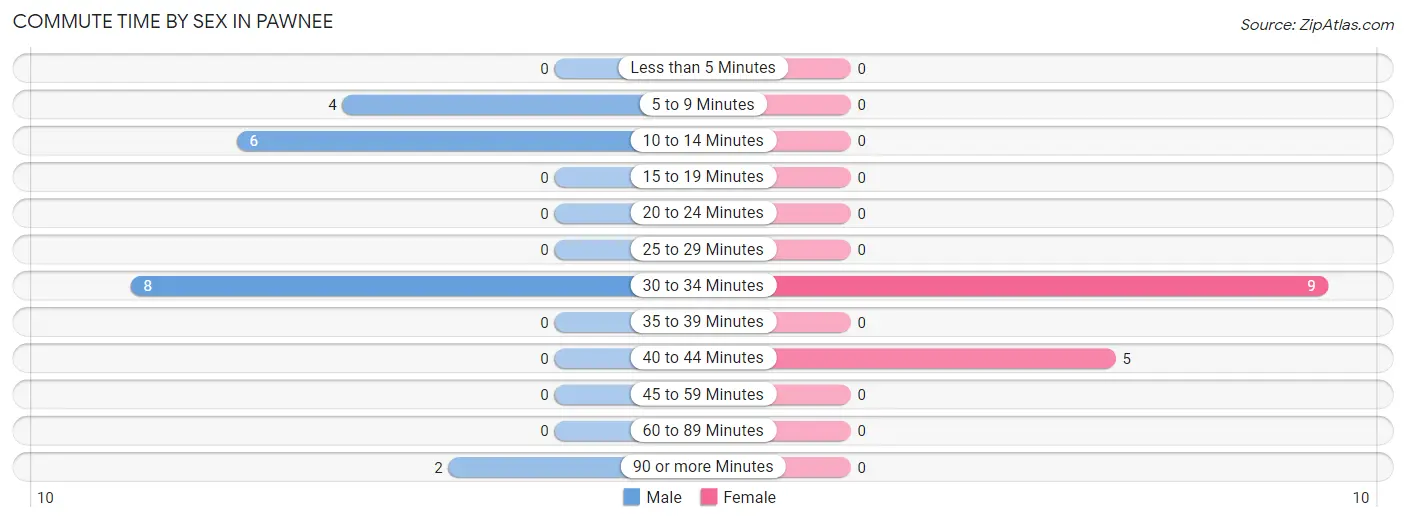
| Commute Time | Male | Female |
| Less than 5 Minutes | 0 (0.0%) | 0 (0.0%) |
| 5 to 9 Minutes | 4 (20.0%) | 0 (0.0%) |
| 10 to 14 Minutes | 6 (30.0%) | 0 (0.0%) |
| 15 to 19 Minutes | 0 (0.0%) | 0 (0.0%) |
| 20 to 24 Minutes | 0 (0.0%) | 0 (0.0%) |
| 25 to 29 Minutes | 0 (0.0%) | 0 (0.0%) |
| 30 to 34 Minutes | 8 (40.0%) | 9 (64.3%) |
| 35 to 39 Minutes | 0 (0.0%) | 0 (0.0%) |
| 40 to 44 Minutes | 0 (0.0%) | 5 (35.7%) |
| 45 to 59 Minutes | 0 (0.0%) | 0 (0.0%) |
| 60 to 89 Minutes | 0 (0.0%) | 0 (0.0%) |
| 90 or more Minutes | 2 (10.0%) | 0 (0.0%) |
Time of Departure to Work by Sex in Pawnee
The most frequent times of departure to work in Pawnee are 4:00 PM to 11:59 PM (8, 40.0%) for males and 8:00 AM to 8:29 AM (9, 64.3%) for females.
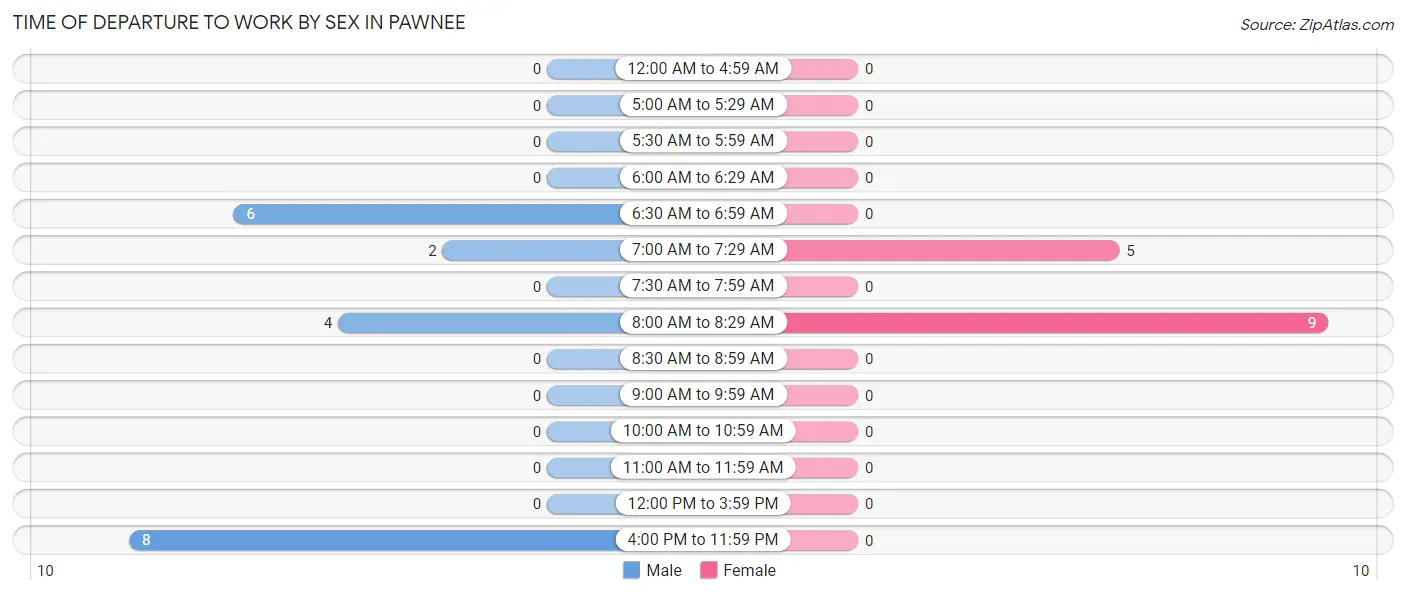
| Time of Departure | Male | Female |
| 12:00 AM to 4:59 AM | 0 (0.0%) | 0 (0.0%) |
| 5:00 AM to 5:29 AM | 0 (0.0%) | 0 (0.0%) |
| 5:30 AM to 5:59 AM | 0 (0.0%) | 0 (0.0%) |
| 6:00 AM to 6:29 AM | 0 (0.0%) | 0 (0.0%) |
| 6:30 AM to 6:59 AM | 6 (30.0%) | 0 (0.0%) |
| 7:00 AM to 7:29 AM | 2 (10.0%) | 5 (35.7%) |
| 7:30 AM to 7:59 AM | 0 (0.0%) | 0 (0.0%) |
| 8:00 AM to 8:29 AM | 4 (20.0%) | 9 (64.3%) |
| 8:30 AM to 8:59 AM | 0 (0.0%) | 0 (0.0%) |
| 9:00 AM to 9:59 AM | 0 (0.0%) | 0 (0.0%) |
| 10:00 AM to 10:59 AM | 0 (0.0%) | 0 (0.0%) |
| 11:00 AM to 11:59 AM | 0 (0.0%) | 0 (0.0%) |
| 12:00 PM to 3:59 PM | 0 (0.0%) | 0 (0.0%) |
| 4:00 PM to 11:59 PM | 8 (40.0%) | 0 (0.0%) |
| Total | 20 (100.0%) | 14 (100.0%) |
Housing Occupancy in Pawnee
Occupancy by Ownership in Pawnee
Of the total 35 dwellings in Pawnee, owner-occupied units account for 27 (77.1%), while renter-occupied units make up 8 (22.9%).
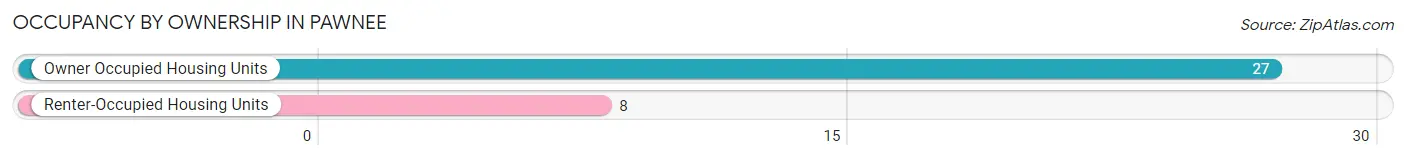
| Occupancy | # Housing Units | % Housing Units |
| Owner Occupied Housing Units | 27 | 77.1% |
| Renter-Occupied Housing Units | 8 | 22.9% |
| Total Occupied Housing Units | 35 | 100.0% |
Occupancy by Household Size in Pawnee
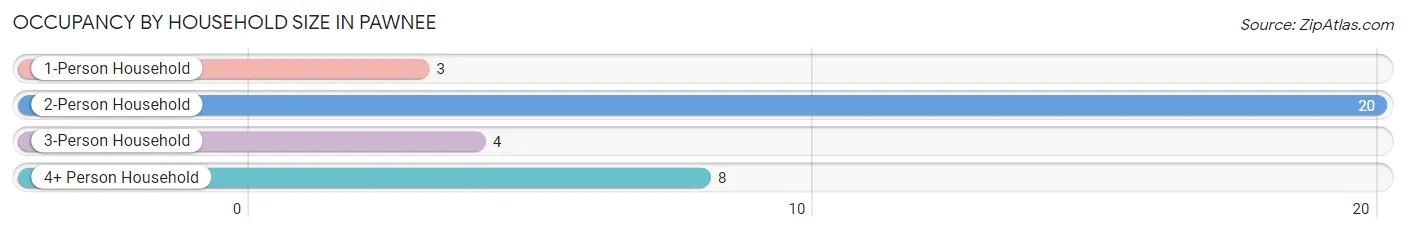
| Household Size | # Housing Units | % Housing Units |
| 1-Person Household | 3 | 8.6% |
| 2-Person Household | 20 | 57.1% |
| 3-Person Household | 4 | 11.4% |
| 4+ Person Household | 8 | 22.9% |
| Total Housing Units | 35 | 100.0% |
Occupancy by Ownership by Household Size in Pawnee
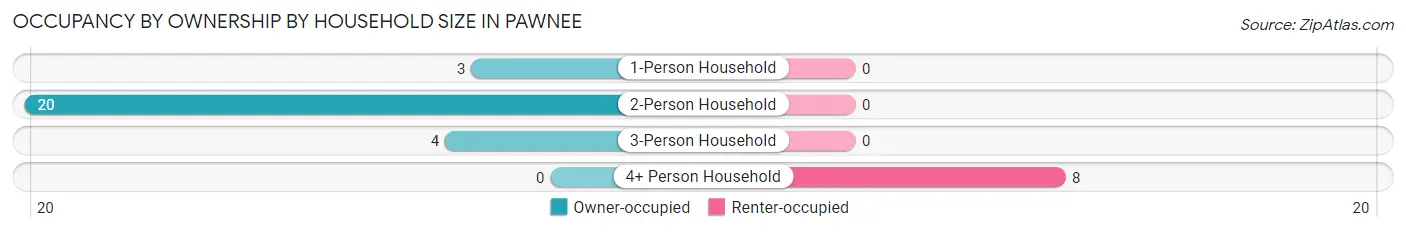
| Household Size | Owner-occupied | Renter-occupied |
| 1-Person Household | 3 (100.0%) | 0 (0.0%) |
| 2-Person Household | 20 (100.0%) | 0 (0.0%) |
| 3-Person Household | 4 (100.0%) | 0 (0.0%) |
| 4+ Person Household | 0 (0.0%) | 8 (100.0%) |
| Total Housing Units | 27 (77.1%) | 8 (22.9%) |
Occupancy by Educational Attainment in Pawnee
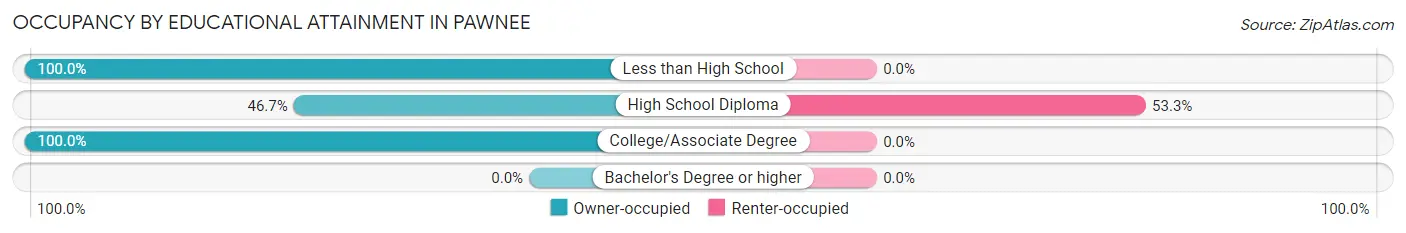
| Household Size | Owner-occupied | Renter-occupied |
| Less than High School | 11 (100.0%) | 0 (0.0%) |
| High School Diploma | 7 (46.7%) | 8 (53.3%) |
| College/Associate Degree | 9 (100.0%) | 0 (0.0%) |
| Bachelor's Degree or higher | 0 (0.0%) | 0 (0.0%) |
Occupancy by Age of Householder in Pawnee
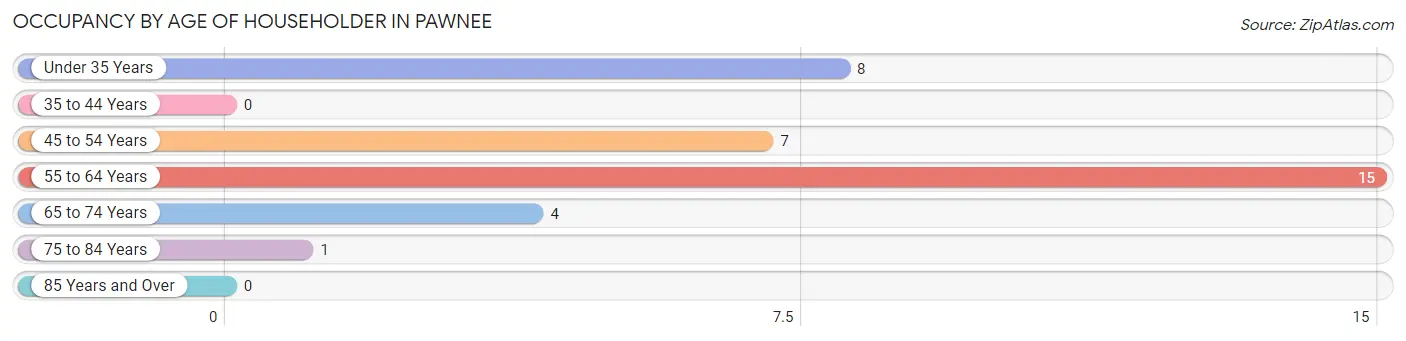
| Age Bracket | # Households | % Households |
| Under 35 Years | 8 | 22.9% |
| 35 to 44 Years | 0 | 0.0% |
| 45 to 54 Years | 7 | 20.0% |
| 55 to 64 Years | 15 | 42.9% |
| 65 to 74 Years | 4 | 11.4% |
| 75 to 84 Years | 1 | 2.9% |
| 85 Years and Over | 0 | 0.0% |
| Total | 35 | 100.0% |
Housing Finances in Pawnee
Median Income by Occupancy in Pawnee
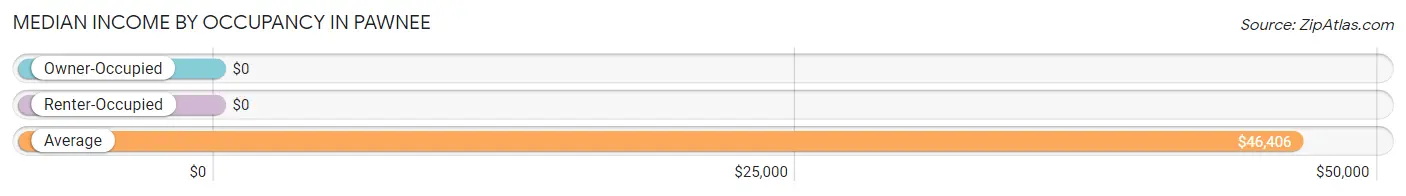
| Occupancy Type | # Households | Median Income |
| Owner-Occupied | 27 (77.1%) | $0 |
| Renter-Occupied | 8 (22.9%) | $0 |
| Average | 35 (100.0%) | $46,406 |
Occupancy by Householder Income Bracket in Pawnee
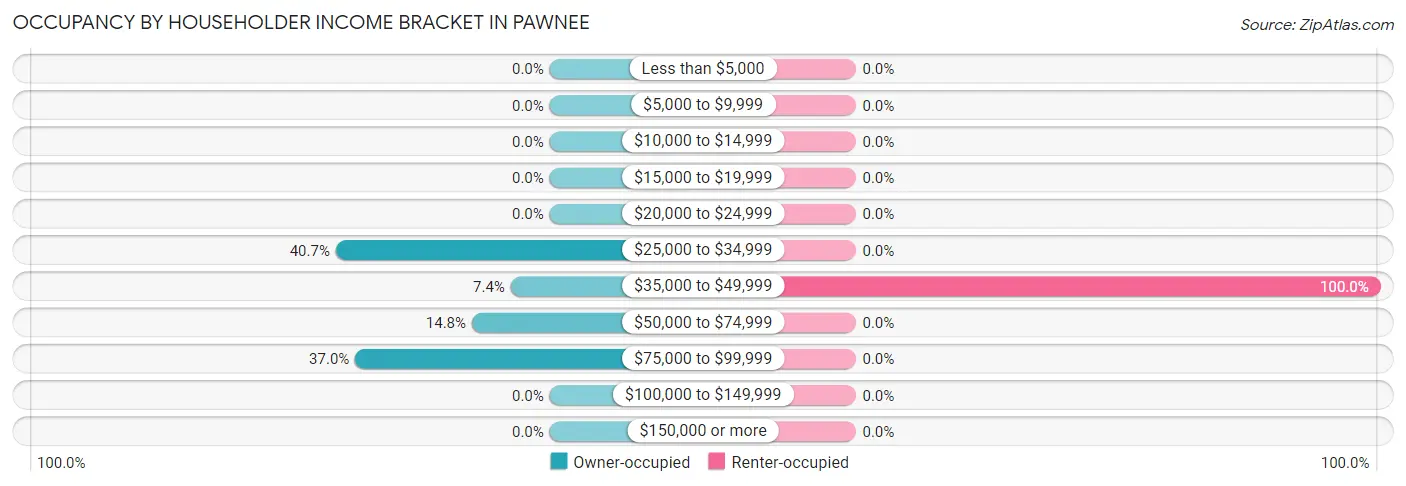
| Income Bracket | Owner-occupied | Renter-occupied |
| Less than $5,000 | 0 (0.0%) | 0 (0.0%) |
| $5,000 to $9,999 | 0 (0.0%) | 0 (0.0%) |
| $10,000 to $14,999 | 0 (0.0%) | 0 (0.0%) |
| $15,000 to $19,999 | 0 (0.0%) | 0 (0.0%) |
| $20,000 to $24,999 | 0 (0.0%) | 0 (0.0%) |
| $25,000 to $34,999 | 11 (40.7%) | 0 (0.0%) |
| $35,000 to $49,999 | 2 (7.4%) | 8 (100.0%) |
| $50,000 to $74,999 | 4 (14.8%) | 0 (0.0%) |
| $75,000 to $99,999 | 10 (37.0%) | 0 (0.0%) |
| $100,000 to $149,999 | 0 (0.0%) | 0 (0.0%) |
| $150,000 or more | 0 (0.0%) | 0 (0.0%) |
| Total | 27 (100.0%) | 8 (100.0%) |
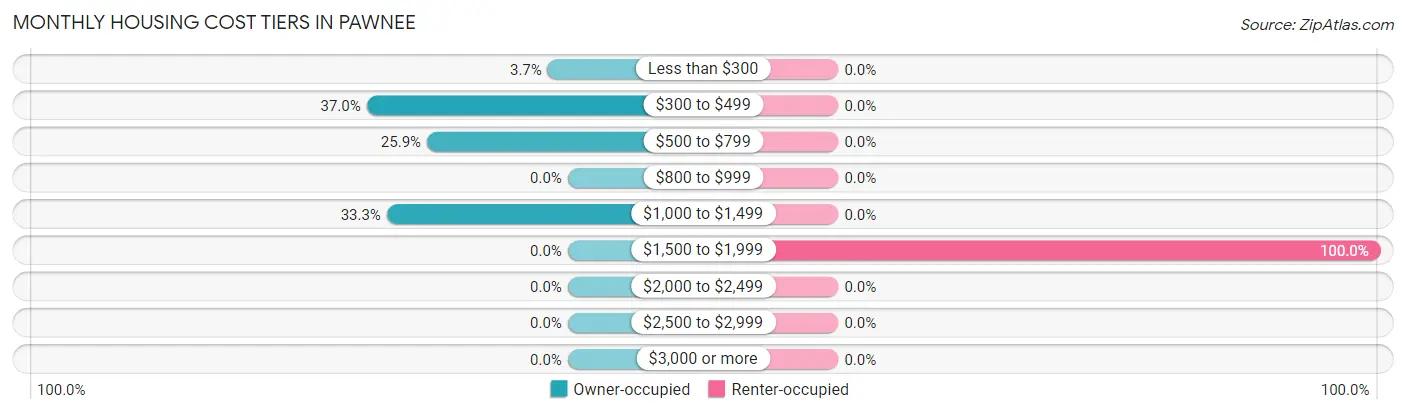
Monthly Housing Cost Tiers in Pawnee
| Monthly Cost | Owner-occupied | Renter-occupied |
| Less than $300 | 1 (3.7%) | 0 (0.0%) |
| $300 to $499 | 10 (37.0%) | 0 (0.0%) |
| $500 to $799 | 7 (25.9%) | 0 (0.0%) |
| $800 to $999 | 0 (0.0%) | 0 (0.0%) |
| $1,000 to $1,499 | 9 (33.3%) | 0 (0.0%) |
| $1,500 to $1,999 | 0 (0.0%) | 8 (100.0%) |
| $2,000 to $2,499 | 0 (0.0%) | 0 (0.0%) |
| $2,500 to $2,999 | 0 (0.0%) | 0 (0.0%) |
| $3,000 or more | 0 (0.0%) | 0 (0.0%) |
| Total | 27 (100.0%) | 8 (100.0%) |
Physical Housing Characteristics in Pawnee
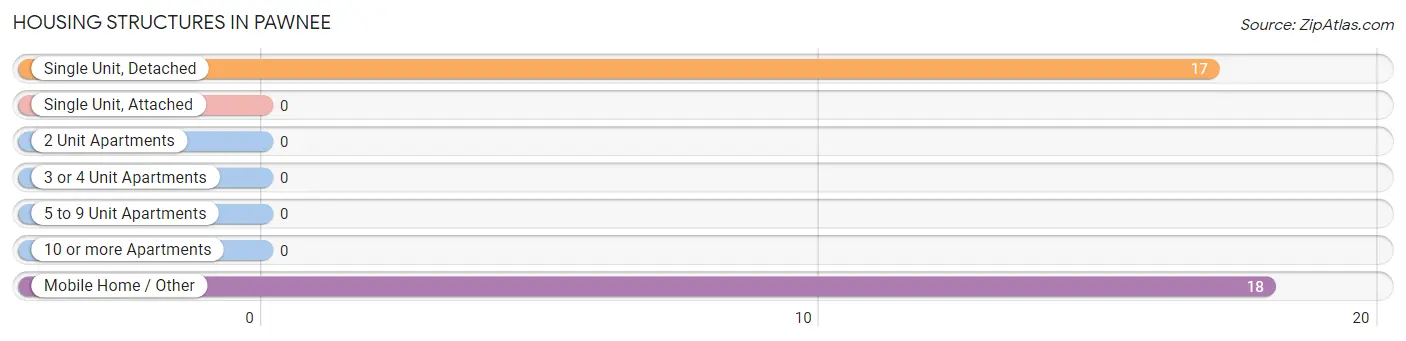
Housing Structures in Pawnee
| Structure Type | # Housing Units | % Housing Units |
| Single Unit, Detached | 17 | 48.6% |
| Single Unit, Attached | 0 | 0.0% |
| 2 Unit Apartments | 0 | 0.0% |
| 3 or 4 Unit Apartments | 0 | 0.0% |
| 5 to 9 Unit Apartments | 0 | 0.0% |
| 10 or more Apartments | 0 | 0.0% |
| Mobile Home / Other | 18 | 51.4% |
| Total | 35 | 100.0% |
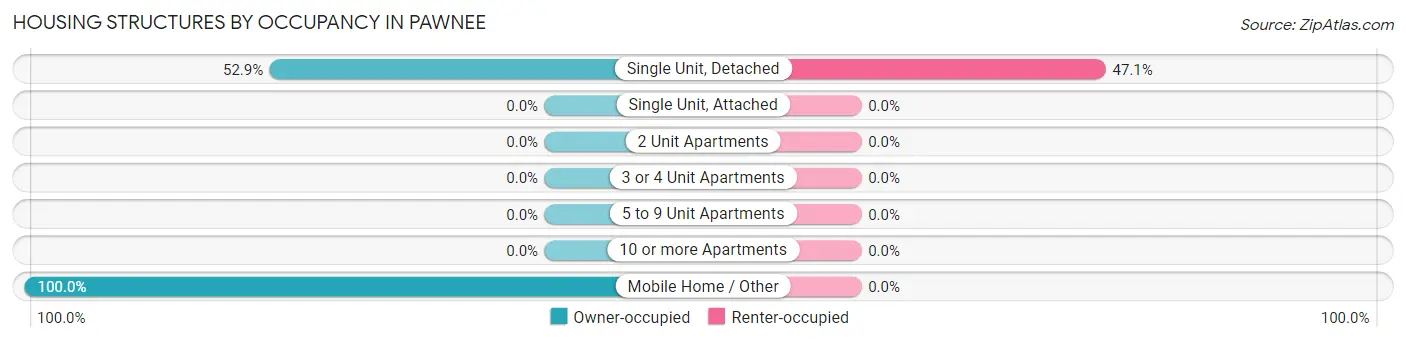
Housing Structures by Occupancy in Pawnee
| Structure Type | Owner-occupied | Renter-occupied |
| Single Unit, Detached | 9 (52.9%) | 8 (47.1%) |
| Single Unit, Attached | 0 (0.0%) | 0 (0.0%) |
| 2 Unit Apartments | 0 (0.0%) | 0 (0.0%) |
| 3 or 4 Unit Apartments | 0 (0.0%) | 0 (0.0%) |
| 5 to 9 Unit Apartments | 0 (0.0%) | 0 (0.0%) |
| 10 or more Apartments | 0 (0.0%) | 0 (0.0%) |
| Mobile Home / Other | 18 (100.0%) | 0 (0.0%) |
| Total | 27 (77.1%) | 8 (22.9%) |
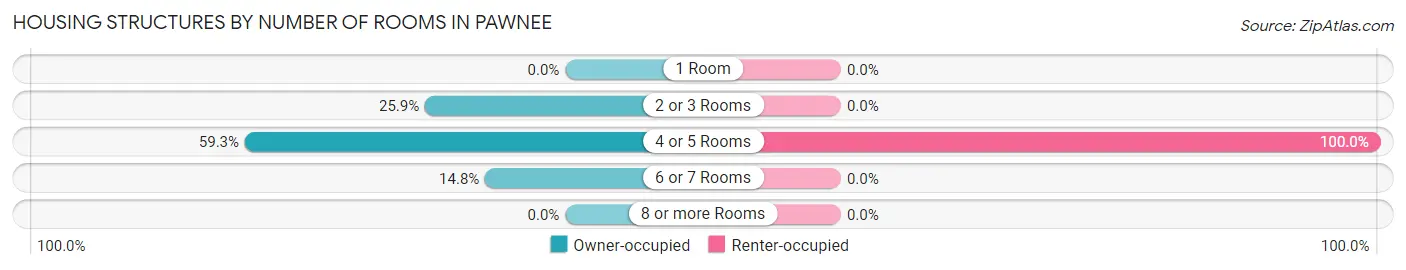
Housing Structures by Number of Rooms in Pawnee
| Number of Rooms | Owner-occupied | Renter-occupied |
| 1 Room | 0 (0.0%) | 0 (0.0%) |
| 2 or 3 Rooms | 7 (25.9%) | 0 (0.0%) |
| 4 or 5 Rooms | 16 (59.3%) | 8 (100.0%) |
| 6 or 7 Rooms | 4 (14.8%) | 0 (0.0%) |
| 8 or more Rooms | 0 (0.0%) | 0 (0.0%) |
| Total | 27 (100.0%) | 8 (100.0%) |
Housing Structure by Heating Type in Pawnee
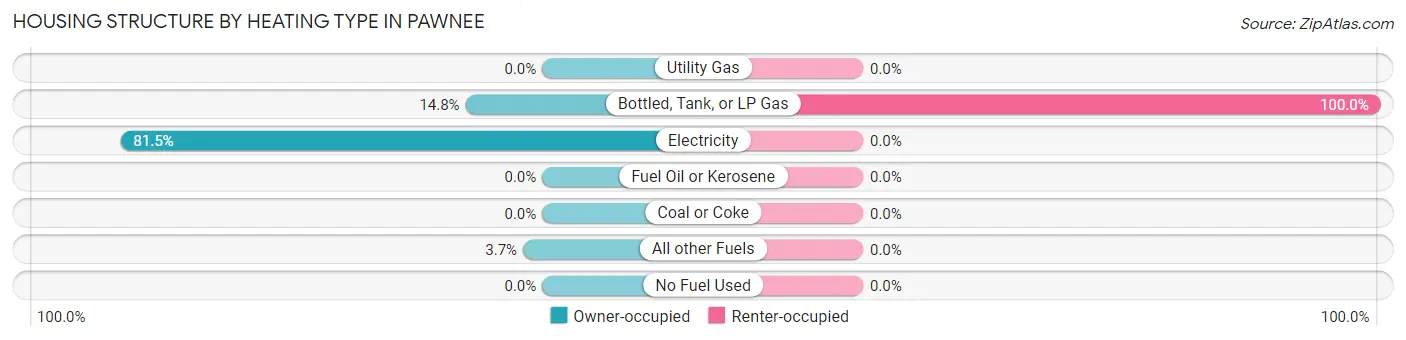
| Heating Type | Owner-occupied | Renter-occupied |
| Utility Gas | 0 (0.0%) | 0 (0.0%) |
| Bottled, Tank, or LP Gas | 4 (14.8%) | 8 (100.0%) |
| Electricity | 22 (81.5%) | 0 (0.0%) |
| Fuel Oil or Kerosene | 0 (0.0%) | 0 (0.0%) |
| Coal or Coke | 0 (0.0%) | 0 (0.0%) |
| All other Fuels | 1 (3.7%) | 0 (0.0%) |
| No Fuel Used | 0 (0.0%) | 0 (0.0%) |
| Total | 27 (100.0%) | 8 (100.0%) |
Household Vehicle Usage in Pawnee
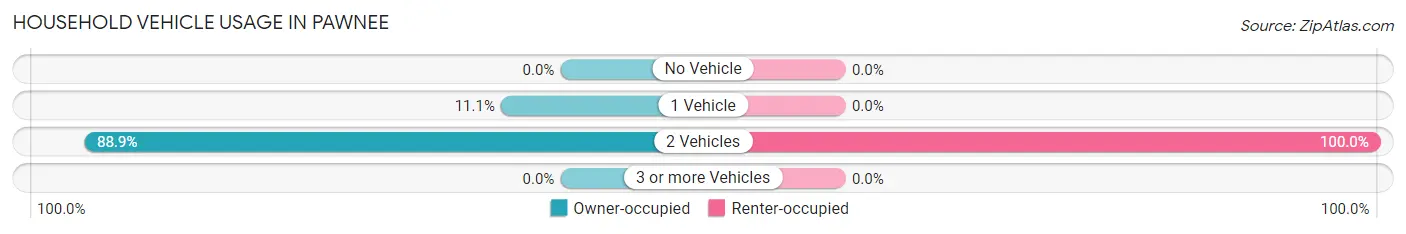
| Vehicles per Household | Owner-occupied | Renter-occupied |
| No Vehicle | 0 (0.0%) | 0 (0.0%) |
| 1 Vehicle | 3 (11.1%) | 0 (0.0%) |
| 2 Vehicles | 24 (88.9%) | 8 (100.0%) |
| 3 or more Vehicles | 0 (0.0%) | 0 (0.0%) |
| Total | 27 (100.0%) | 8 (100.0%) |
Real Estate & Mortgages in Pawnee
Real Estate and Mortgage Overview in Pawnee
| Characteristic | Without Mortgage | With Mortgage |
| Housing Units | 11 | 16 |
| Median Property Value | - | - |
| Median Household Income | $53,438 | $0 |
| Monthly Housing Costs | $421 | $0 |
| Real Estate Taxes | $1,250 | $0 |
Property Value by Mortgage Status in Pawnee
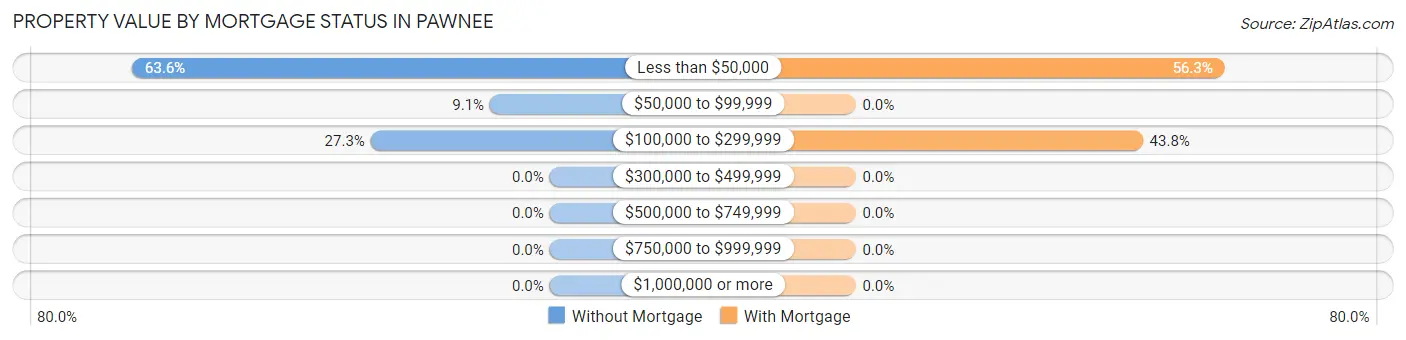
| Property Value | Without Mortgage | With Mortgage |
| Less than $50,000 | 7 (63.6%) | 9 (56.2%) |
| $50,000 to $99,999 | 1 (9.1%) | 0 (0.0%) |
| $100,000 to $299,999 | 3 (27.3%) | 7 (43.8%) |
| $300,000 to $499,999 | 0 (0.0%) | 0 (0.0%) |
| $500,000 to $749,999 | 0 (0.0%) | 0 (0.0%) |
| $750,000 to $999,999 | 0 (0.0%) | 0 (0.0%) |
| $1,000,000 or more | 0 (0.0%) | 0 (0.0%) |
| Total | 11 (100.0%) | 16 (100.0%) |
Household Income by Mortgage Status in Pawnee
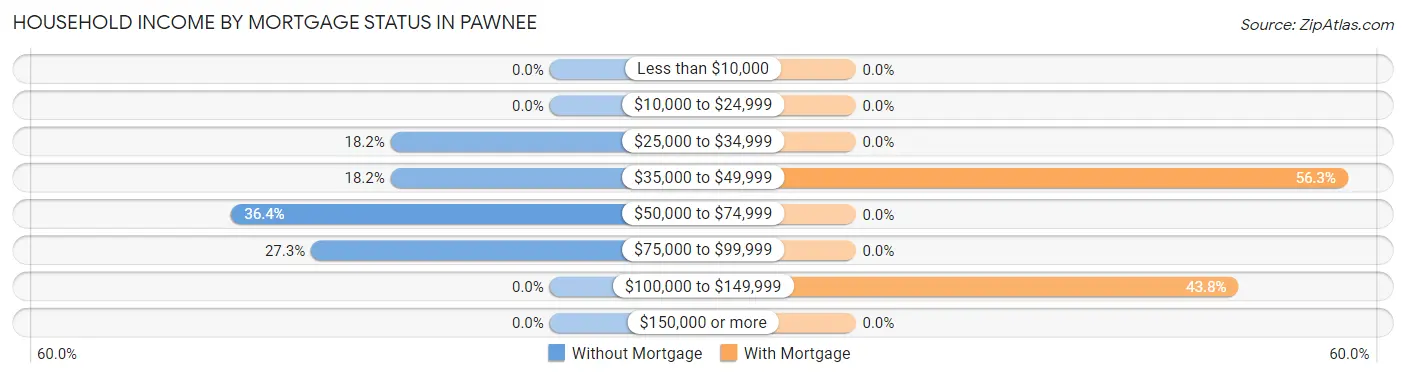
| Household Income | Without Mortgage | With Mortgage |
| Less than $10,000 | 0 (0.0%) | 0 (0.0%) |
| $10,000 to $24,999 | 0 (0.0%) | 0 (0.0%) |
| $25,000 to $34,999 | 2 (18.2%) | 0 (0.0%) |
| $35,000 to $49,999 | 2 (18.2%) | 9 (56.2%) |
| $50,000 to $74,999 | 4 (36.4%) | 0 (0.0%) |
| $75,000 to $99,999 | 3 (27.3%) | 0 (0.0%) |
| $100,000 to $149,999 | 0 (0.0%) | 7 (43.8%) |
| $150,000 or more | 0 (0.0%) | 0 (0.0%) |
| Total | 11 (100.0%) | 16 (100.0%) |
Property Value to Household Income Ratio in Pawnee
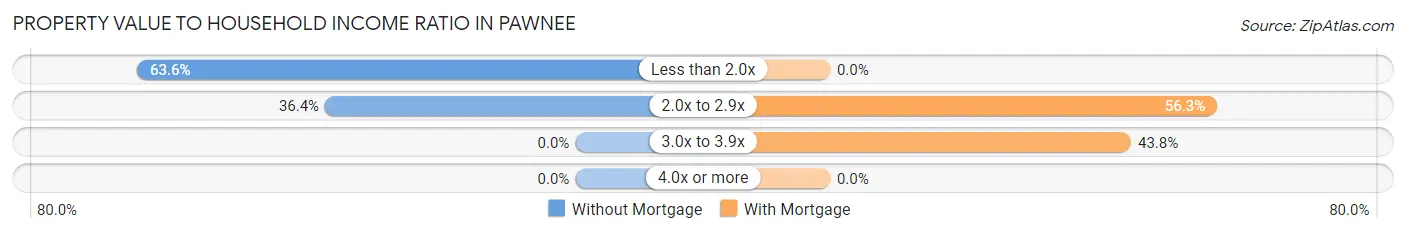
| Value-to-Income Ratio | Without Mortgage | With Mortgage |
| Less than 2.0x | 7 (63.6%) | 0 (0.0%) |
| 2.0x to 2.9x | 4 (36.4%) | 9 (56.2%) |
| 3.0x to 3.9x | 0 (0.0%) | 7 (43.8%) |
| 4.0x or more | 0 (0.0%) | 0 (0.0%) |
| Total | 11 (100.0%) | 16 (100.0%) |
Real Estate Taxes by Mortgage Status in Pawnee
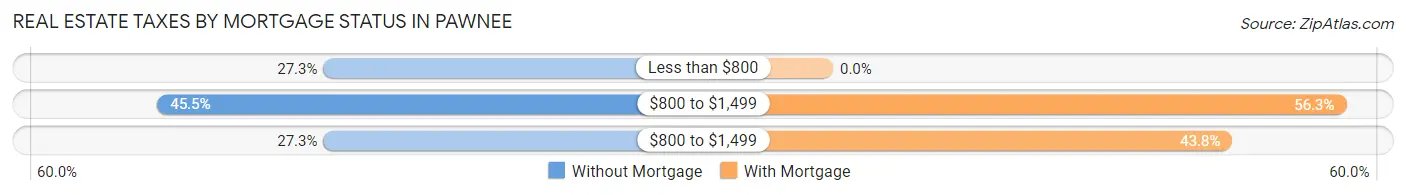
| Property Taxes | Without Mortgage | With Mortgage |
| Less than $800 | 3 (27.3%) | 0 (0.0%) |
| $800 to $1,499 | 5 (45.5%) | 9 (56.2%) |
| $800 to $1,499 | 3 (27.3%) | 7 (43.8%) |
| Total | 11 (100.0%) | 16 (100.0%) |
Health & Disability in Pawnee
Health Insurance Coverage by Age in Pawnee
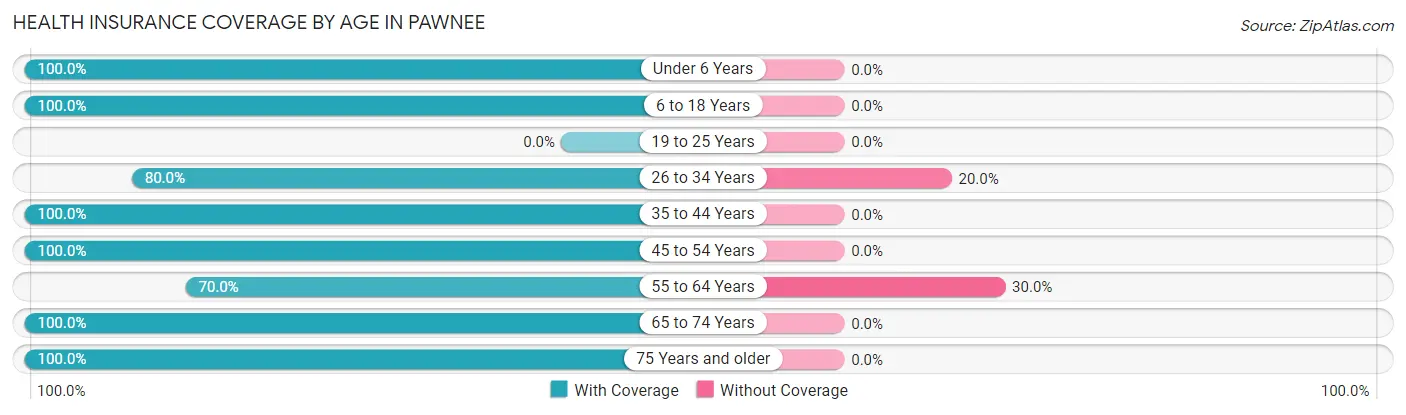
| Age Bracket | With Coverage | Without Coverage |
| Under 6 Years | 9 (100.0%) | 0 (0.0%) |
| 6 to 18 Years | 19 (100.0%) | 0 (0.0%) |
| 19 to 25 Years | 0 (0.0%) | 0 (0.0%) |
| 26 to 34 Years | 8 (80.0%) | 2 (20.0%) |
| 35 to 44 Years | 15 (100.0%) | 0 (0.0%) |
| 45 to 54 Years | 7 (100.0%) | 0 (0.0%) |
| 55 to 64 Years | 14 (70.0%) | 6 (30.0%) |
| 65 to 74 Years | 16 (100.0%) | 0 (0.0%) |
| 75 Years and older | 1 (100.0%) | 0 (0.0%) |
| Total | 89 (91.7%) | 8 (8.3%) |
Health Insurance Coverage by Citizenship Status in Pawnee
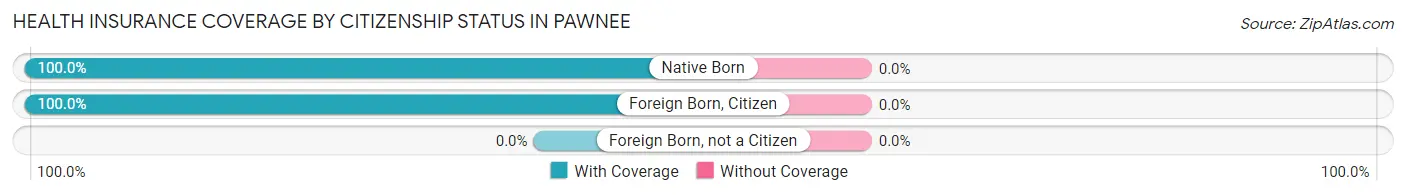
| Citizenship Status | With Coverage | Without Coverage |
| Native Born | 9 (100.0%) | 0 (0.0%) |
| Foreign Born, Citizen | 19 (100.0%) | 0 (0.0%) |
| Foreign Born, not a Citizen | 0 (0.0%) | 0 (0.0%) |
Health Insurance Coverage by Household Income in Pawnee
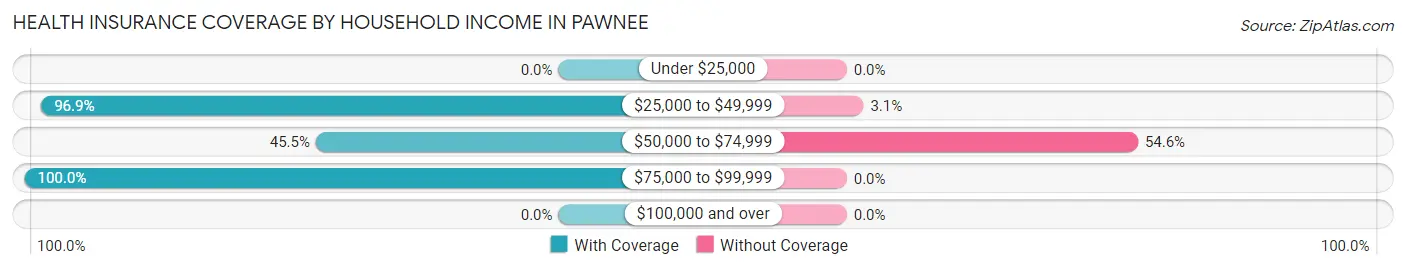
| Household Income | With Coverage | Without Coverage |
| Under $25,000 | 0 (0.0%) | 0 (0.0%) |
| $25,000 to $49,999 | 62 (96.9%) | 2 (3.1%) |
| $50,000 to $74,999 | 5 (45.5%) | 6 (54.5%) |
| $75,000 to $99,999 | 22 (100.0%) | 0 (0.0%) |
| $100,000 and over | 0 (0.0%) | 0 (0.0%) |
Public vs Private Health Insurance Coverage by Age in Pawnee
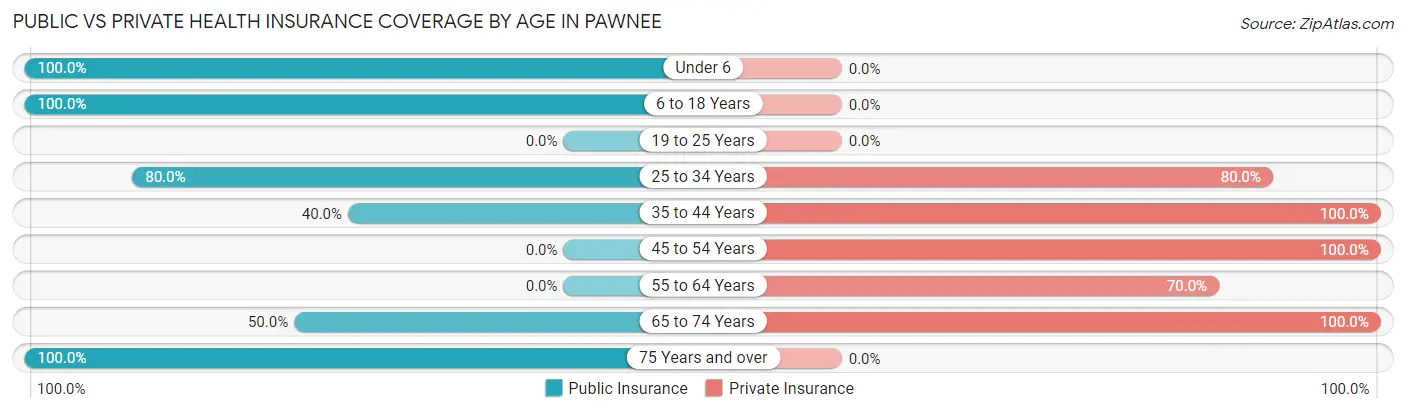
| Age Bracket | Public Insurance | Private Insurance |
| Under 6 | 9 (100.0%) | 0 (0.0%) |
| 6 to 18 Years | 19 (100.0%) | 0 (0.0%) |
| 19 to 25 Years | 0 (0.0%) | 0 (0.0%) |
| 25 to 34 Years | 8 (80.0%) | 8 (80.0%) |
| 35 to 44 Years | 6 (40.0%) | 15 (100.0%) |
| 45 to 54 Years | 0 (0.0%) | 7 (100.0%) |
| 55 to 64 Years | 0 (0.0%) | 14 (70.0%) |
| 65 to 74 Years | 8 (50.0%) | 16 (100.0%) |
| 75 Years and over | 1 (100.0%) | 0 (0.0%) |
| Total | 51 (52.6%) | 60 (61.9%) |
Disability Status by Sex by Age in Pawnee
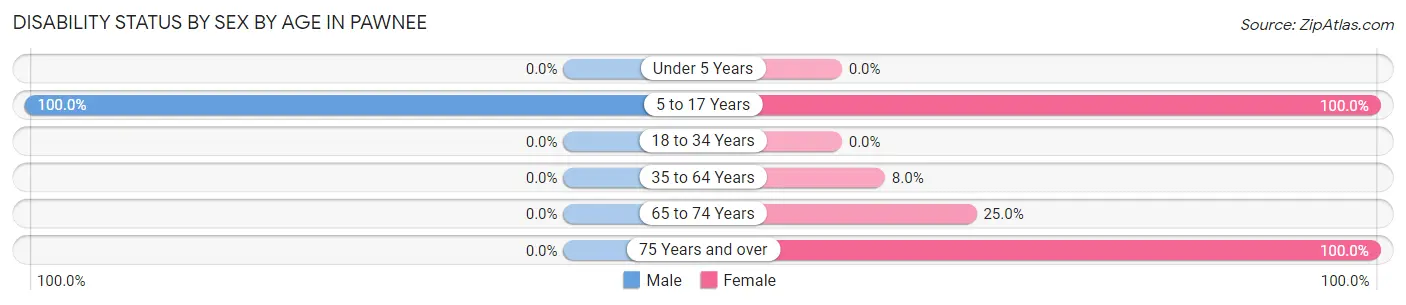
| Age Bracket | Male | Female |
| Under 5 Years | 0 (0.0%) | 0 (0.0%) |
| 5 to 17 Years | 10 (100.0%) | 9 (100.0%) |
| 18 to 34 Years | 0 (0.0%) | 0 (0.0%) |
| 35 to 64 Years | 0 (0.0%) | 2 (8.0%) |
| 65 to 74 Years | 0 (0.0%) | 1 (25.0%) |
| 75 Years and over | 0 (0.0%) | 1 (100.0%) |
Disability Class by Sex by Age in Pawnee
Disability Class: Hearing Difficulty
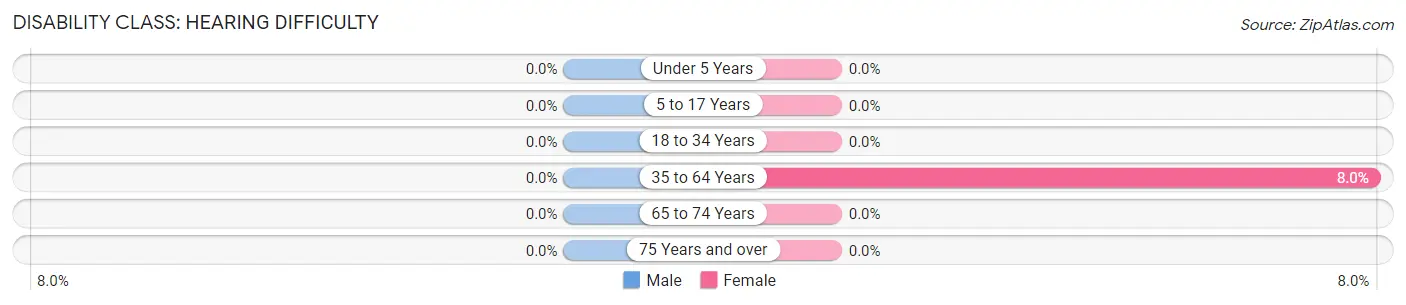
| Age Bracket | Male | Female |
| Under 5 Years | 0 (0.0%) | 0 (0.0%) |
| 5 to 17 Years | 0 (0.0%) | 0 (0.0%) |
| 18 to 34 Years | 0 (0.0%) | 0 (0.0%) |
| 35 to 64 Years | 0 (0.0%) | 2 (8.0%) |
| 65 to 74 Years | 0 (0.0%) | 0 (0.0%) |
| 75 Years and over | 0 (0.0%) | 0 (0.0%) |
Disability Class: Vision Difficulty
| Age Bracket | Male | Female |
| Under 5 Years | 0 (0.0%) | 0 (0.0%) |
| 5 to 17 Years | 0 (0.0%) | 0 (0.0%) |
| 18 to 34 Years | 0 (0.0%) | 0 (0.0%) |
| 35 to 64 Years | 0 (0.0%) | 0 (0.0%) |
| 65 to 74 Years | 0 (0.0%) | 0 (0.0%) |
| 75 Years and over | 0 (0.0%) | 0 (0.0%) |
Disability Class: Cognitive Difficulty
| Age Bracket | Male | Female |
| 5 to 17 Years | 0 (0.0%) | 0 (0.0%) |
| 18 to 34 Years | 0 (0.0%) | 0 (0.0%) |
| 35 to 64 Years | 0 (0.0%) | 2 (8.0%) |
| 65 to 74 Years | 0 (0.0%) | 0 (0.0%) |
| 75 Years and over | 0 (0.0%) | 0 (0.0%) |
Disability Class: Ambulatory Difficulty
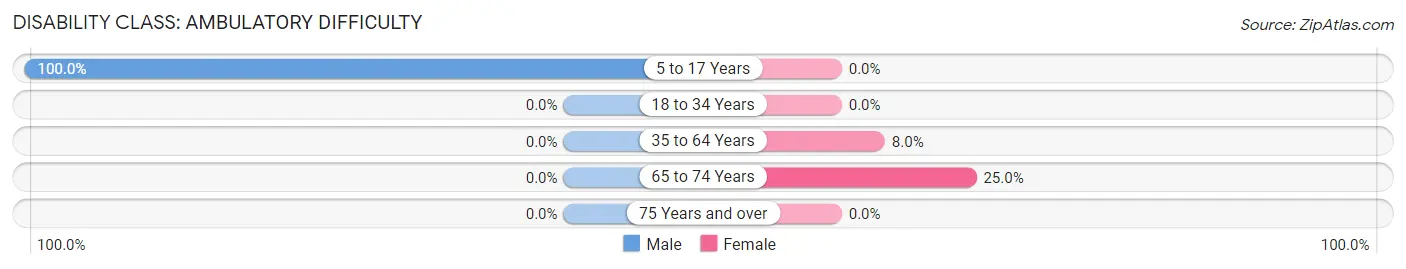
| Age Bracket | Male | Female |
| 5 to 17 Years | 10 (100.0%) | 0 (0.0%) |
| 18 to 34 Years | 0 (0.0%) | 0 (0.0%) |
| 35 to 64 Years | 0 (0.0%) | 2 (8.0%) |
| 65 to 74 Years | 0 (0.0%) | 1 (25.0%) |
| 75 Years and over | 0 (0.0%) | 0 (0.0%) |
Disability Class: Self-Care Difficulty
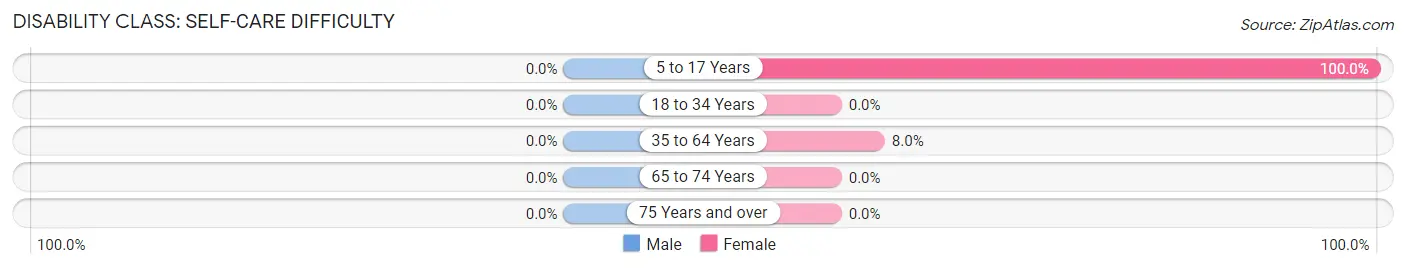
| Age Bracket | Male | Female |
| 5 to 17 Years | 0 (0.0%) | 9 (100.0%) |
| 18 to 34 Years | 0 (0.0%) | 0 (0.0%) |
| 35 to 64 Years | 0 (0.0%) | 2 (8.0%) |
| 65 to 74 Years | 0 (0.0%) | 0 (0.0%) |
| 75 Years and over | 0 (0.0%) | 0 (0.0%) |
Technology Access in Pawnee
Computing Device Access in Pawnee
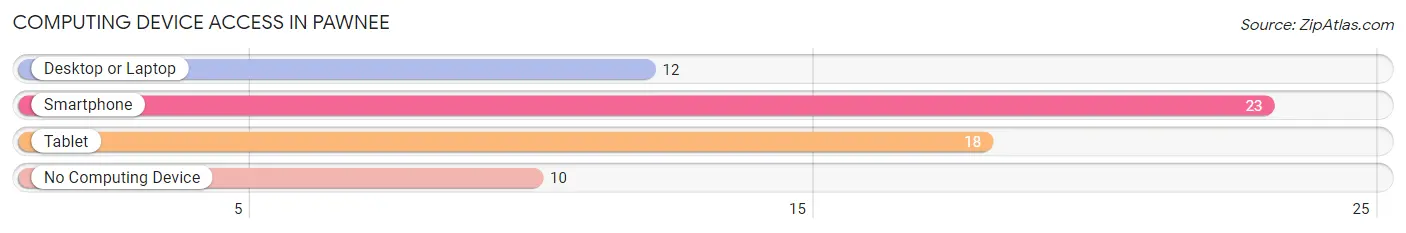
| Device Type | # Households | % Households |
| Desktop or Laptop | 12 | 34.3% |
| Smartphone | 23 | 65.7% |
| Tablet | 18 | 51.4% |
| No Computing Device | 10 | 28.6% |
| Total | 35 | 100.0% |
Internet Access in Pawnee
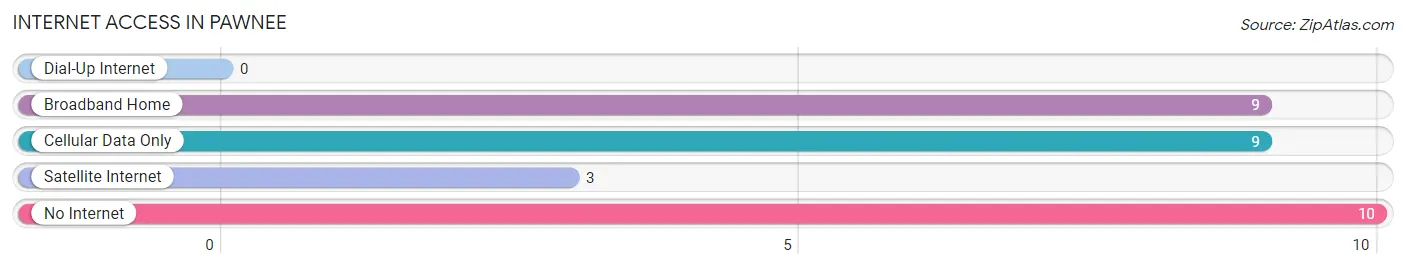
| Internet Type | # Households | % Households |
| Dial-Up Internet | 0 | 0.0% |
| Broadband Home | 9 | 25.7% |
| Cellular Data Only | 9 | 25.7% |
| Satellite Internet | 3 | 8.6% |
| No Internet | 10 | 28.6% |
| Total | 35 | 100.0% |
Pawnee Summary
Pawnee, Texas is a small town located in the Texas Panhandle, approximately 25 miles east of Amarillo. It is the county seat of Gray County and has a population of just over 1,000 people. The town was founded in 1887 and was named after the Pawnee Indians, who were the original inhabitants of the area.
Geography
Pawnee is located in the Texas Panhandle, in the northwest corner of the state. It is situated in the High Plains region of the state, which is characterized by flat terrain and sparse vegetation. The town is located at an elevation of 3,400 feet and is surrounded by rolling hills and mesas. The climate is semi-arid, with hot summers and cold winters. The average annual precipitation is 17.5 inches.
Economy
The economy of Pawnee is largely based on agriculture. The town is home to several large farms and ranches, which produce a variety of crops, including wheat, corn, sorghum, and hay. The town also has a small manufacturing sector, which produces a variety of products, including furniture, clothing, and food products.
Demographics
As of the 2010 census, the population of Pawnee was 1,072. The racial makeup of the town was 94.3% White, 0.3% African American, 0.7% Native American, 0.2% Asian, 0.1% Pacific Islander, 2.7% from other races, and 1.7% from two or more races. Hispanic or Latino of any race were 5.3% of the population.
The median income for a household in Pawnee was $31,250, and the median income for a family was $37,500. The per capita income for the town was $17,845. About 15.2% of families and 17.7% of the population were below the poverty line, including 22.2% of those under age 18 and 11.3% of those age 65 or over.
Education
Pawnee is served by the Pawnee Independent School District, which consists of one elementary school, one middle school, and one high school. The town is also home to a branch of Amarillo College, which offers a variety of courses and programs.
Conclusion
Pawnee, Texas is a small town located in the Texas Panhandle, approximately 25 miles east of Amarillo. It is the county seat of Gray County and has a population of just over 1,000 people. The town was founded in 1887 and was named after the Pawnee Indians, who were the original inhabitants of the area. The economy of Pawnee is largely based on agriculture, and the town is served by the Pawnee Independent School District. The town also has a small manufacturing sector, and is home to a branch of Amarillo College.
Common Questions
What is Per Capita Income in Pawnee?
Per Capita income in Pawnee is $20,312.
What is the Median Family Income in Pawnee?
Median Family Income in Pawnee is $46,875.
What is the Median Household income in Pawnee?
Median Household Income in Pawnee is $46,406.
What is Inequality or Gini Index in Pawnee?
Inequality or Gini Index in Pawnee is 0.24.
What is the Total Population of Pawnee?
Total Population of Pawnee is 97.
What is the Total Male Population of Pawnee?
Total Male Population of Pawnee is 41.
What is the Total Female Population of Pawnee?
Total Female Population of Pawnee is 56.
What is the Ratio of Males per 100 Females in Pawnee?
There are 73.21 Males per 100 Females in Pawnee.
What is the Ratio of Females per 100 Males in Pawnee?
There are 136.59 Females per 100 Males in Pawnee.
What is the Median Population Age in Pawnee?
Median Population Age in Pawnee is 37.3 Years.
What is the Average Family Size in Pawnee
Average Family Size in Pawnee is 2.9 People.
What is the Average Household Size in Pawnee
Average Household Size in Pawnee is 2.8 People.
How Large is the Labor Force in Pawnee?
There are 43 People in the Labor Forcein in Pawnee.
What is the Percentage of People in the Labor Force in Pawnee?
62.3% of People are in the Labor Force in Pawnee.
What is the Unemployment Rate in Pawnee?
Unemployment Rate in Pawnee is 4.7%.