Bloomburg, TX Map & Demographics
Bloomburg Map
Bloomburg Overview
$23,206
PER CAPITA INCOME
$90,240
AVG FAMILY INCOME
$82,500
AVG HOUSEHOLD INCOME
73.4%
WAGE / INCOME GAP [ % ]
26.6¢/ $1
WAGE / INCOME GAP [ $ ]
0.30
INEQUALITY / GINI INDEX
288
TOTAL POPULATION
143
MALE POPULATION
145
FEMALE POPULATION
98.62
MALES / 100 FEMALES
101.40
FEMALES / 100 MALES
42.7
MEDIAN AGE
2.9
AVG FAMILY SIZE
2.4
AVG HOUSEHOLD SIZE
136
LABOR FORCE [ PEOPLE ]
61.3%
PERCENT IN LABOR FORCE
Bloomburg Zip Codes
Bloomburg Area Codes
Income in Bloomburg
Income Overview in Bloomburg
Per Capita Income in Bloomburg is $23,206, while median incomes of families and households are $90,240 and $82,500 respectively.
| Characteristic | Number | Measure |
| Per Capita Income | 288 | $23,206 |
| Median Family Income | 89 | $90,240 |
| Mean Family Income | 89 | $77,200 |
| Median Household Income | 122 | $82,500 |
| Mean Household Income | 122 | $67,809 |
| Income Deficit | 89 | $0 |
| Wage / Income Gap (%) | 288 | 73.40% |
| Wage / Income Gap ($) | 288 | 26.60¢ per $1 |
| Gini / Inequality Index | 288 | 0.30 |
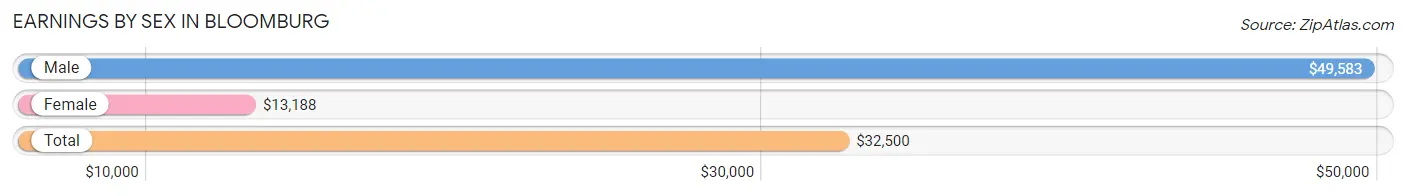
Earnings by Sex in Bloomburg
Average Earnings in Bloomburg are $32,500, $49,583 for men and $13,188 for women, a difference of 73.4%.
| Sex | Number | Average Earnings |
| Male | 47 (34.6%) | $49,583 |
| Female | 89 (65.4%) | $13,188 |
| Total | 136 (100.0%) | $32,500 |
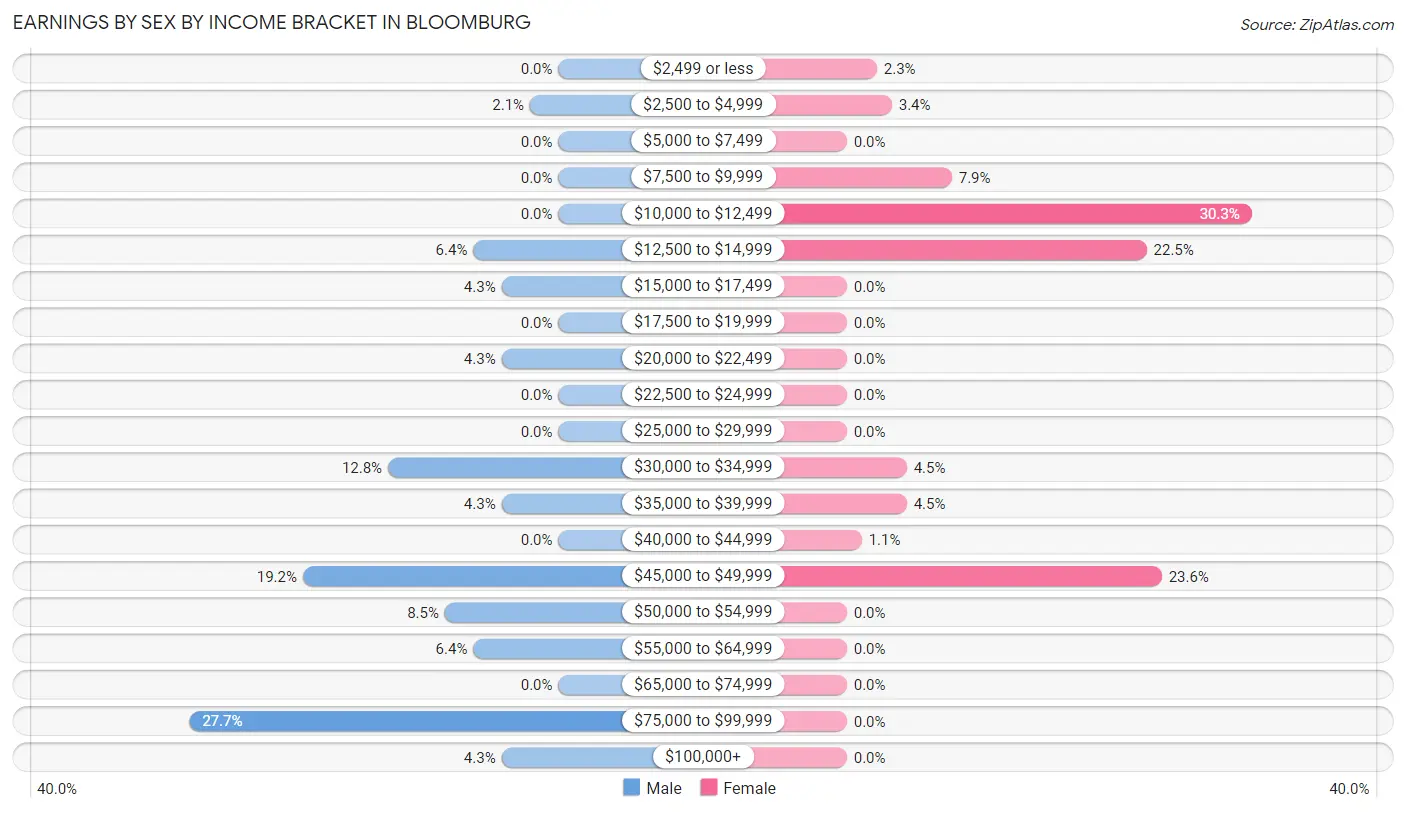
Earnings by Sex by Income Bracket in Bloomburg
The most common earnings brackets in Bloomburg are $75,000 to $99,999 for men (13 | 27.7%) and $10,000 to $12,499 for women (27 | 30.3%).
| Income | Male | Female |
| $2,499 or less | 0 (0.0%) | 2 (2.2%) |
| $2,500 to $4,999 | 1 (2.1%) | 3 (3.4%) |
| $5,000 to $7,499 | 0 (0.0%) | 0 (0.0%) |
| $7,500 to $9,999 | 0 (0.0%) | 7 (7.9%) |
| $10,000 to $12,499 | 0 (0.0%) | 27 (30.3%) |
| $12,500 to $14,999 | 3 (6.4%) | 20 (22.5%) |
| $15,000 to $17,499 | 2 (4.3%) | 0 (0.0%) |
| $17,500 to $19,999 | 0 (0.0%) | 0 (0.0%) |
| $20,000 to $22,499 | 2 (4.3%) | 0 (0.0%) |
| $22,500 to $24,999 | 0 (0.0%) | 0 (0.0%) |
| $25,000 to $29,999 | 0 (0.0%) | 0 (0.0%) |
| $30,000 to $34,999 | 6 (12.8%) | 4 (4.5%) |
| $35,000 to $39,999 | 2 (4.3%) | 4 (4.5%) |
| $40,000 to $44,999 | 0 (0.0%) | 1 (1.1%) |
| $45,000 to $49,999 | 9 (19.2%) | 21 (23.6%) |
| $50,000 to $54,999 | 4 (8.5%) | 0 (0.0%) |
| $55,000 to $64,999 | 3 (6.4%) | 0 (0.0%) |
| $65,000 to $74,999 | 0 (0.0%) | 0 (0.0%) |
| $75,000 to $99,999 | 13 (27.7%) | 0 (0.0%) |
| $100,000+ | 2 (4.3%) | 0 (0.0%) |
| Total | 47 (100.0%) | 89 (100.0%) |
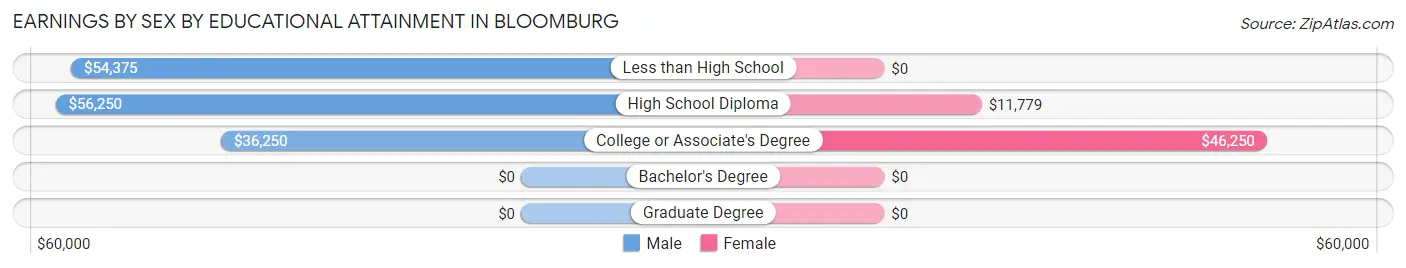
Earnings by Sex by Educational Attainment in Bloomburg
Average earnings in Bloomburg are $49,583 for men and $13,188 for women, a difference of 73.4%. Men with an educational attainment of high school diploma enjoy the highest average annual earnings of $56,250, while those with college or associate's degree education earn the least with $36,250. Women with an educational attainment of college or associate's degree earn the most with the average annual earnings of $46,250, while those with high school diploma education have the smallest earnings of $11,779.
| Educational Attainment | Male Income | Female Income |
| Less than High School | $54,375 | $0 |
| High School Diploma | $56,250 | $11,779 |
| College or Associate's Degree | $36,250 | $46,250 |
| Bachelor's Degree | - | - |
| Graduate Degree | - | - |
| Total | $49,583 | $13,188 |
Family Income in Bloomburg
Family Income Brackets in Bloomburg
According to the Bloomburg family income data, there are 35 families falling into the $75,000 to $99,999 income range, which is the most common income bracket and makes up 39.3% of all families.
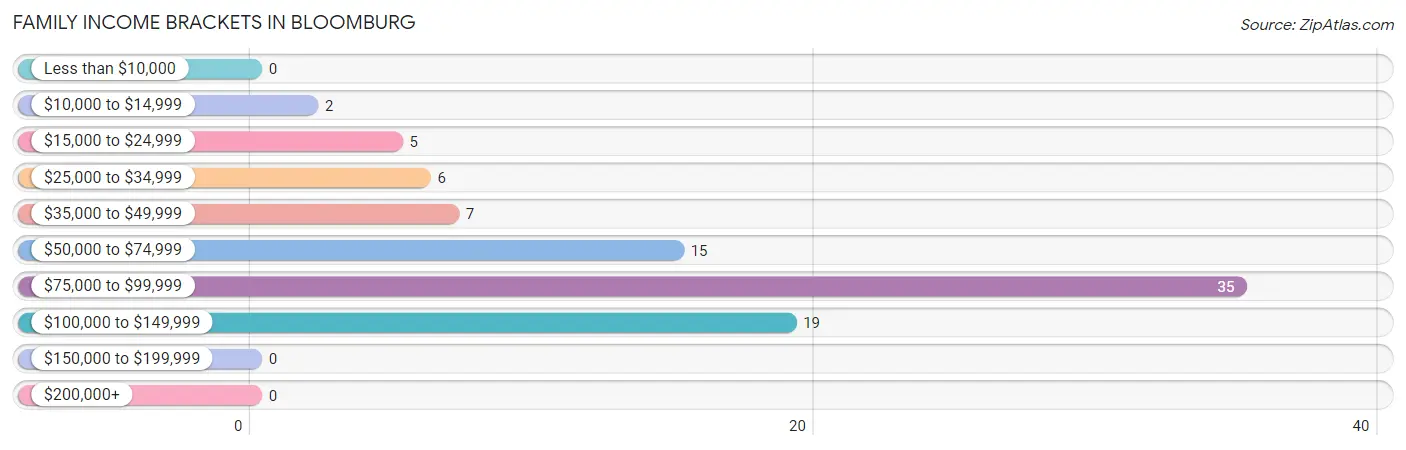
| Income Bracket | # Families | % Families |
| Less than $10,000 | 0 | 0.0% |
| $10,000 to $14,999 | 2 | 2.2% |
| $15,000 to $24,999 | 5 | 5.6% |
| $25,000 to $34,999 | 6 | 6.7% |
| $35,000 to $49,999 | 7 | 7.9% |
| $50,000 to $74,999 | 15 | 16.9% |
| $75,000 to $99,999 | 35 | 39.3% |
| $100,000 to $149,999 | 19 | 21.3% |
| $150,000 to $199,999 | 0 | 0.0% |
| $200,000+ | 0 | 0.0% |
Family Income by Famaliy Size in Bloomburg
3-person families (19 | 21.3%) account for the highest median family income in Bloomburg with $105,804 per family, while 3-person families (19 | 21.3%) have the highest median income of $35,268 per family member.
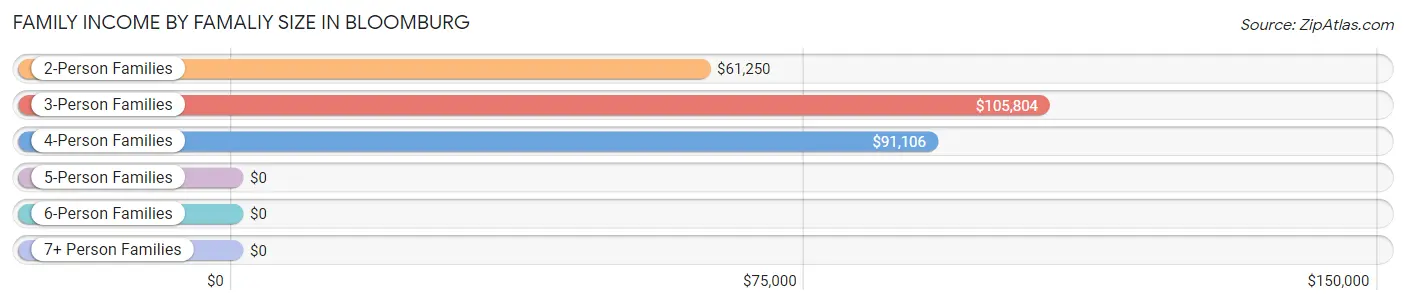
| Income Bracket | # Families | Median Income |
| 2-Person Families | 32 (36.0%) | $61,250 |
| 3-Person Families | 19 (21.3%) | $105,804 |
| 4-Person Families | 35 (39.3%) | $91,106 |
| 5-Person Families | 3 (3.4%) | $0 |
| 6-Person Families | 0 (0.0%) | $0 |
| 7+ Person Families | 0 (0.0%) | $0 |
| Total | 89 (100.0%) | $90,240 |
Family Income by Number of Earners in Bloomburg
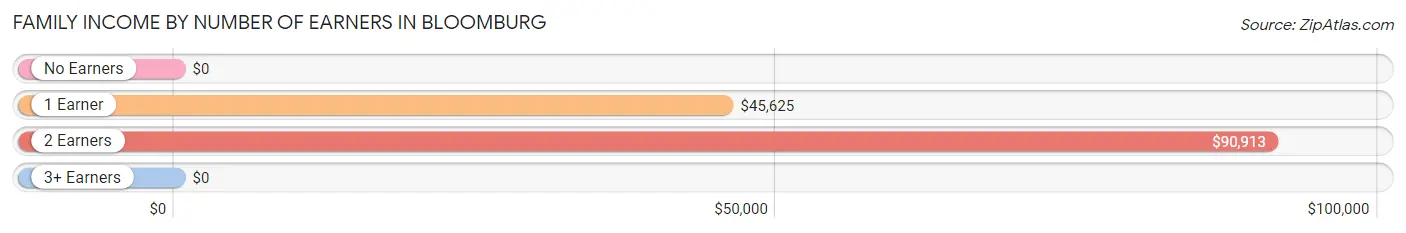
| Number of Earners | # Families | Median Income |
| No Earners | 15 (16.9%) | $0 |
| 1 Earner | 17 (19.1%) | $45,625 |
| 2 Earners | 43 (48.3%) | $90,913 |
| 3+ Earners | 14 (15.7%) | $0 |
| Total | 89 (100.0%) | $90,240 |
Household Income in Bloomburg
Household Income Brackets in Bloomburg
With 40 households falling in the category, the $75,000 to $99,999 income range is the most frequent in Bloomburg, accounting for 32.8% of all households.
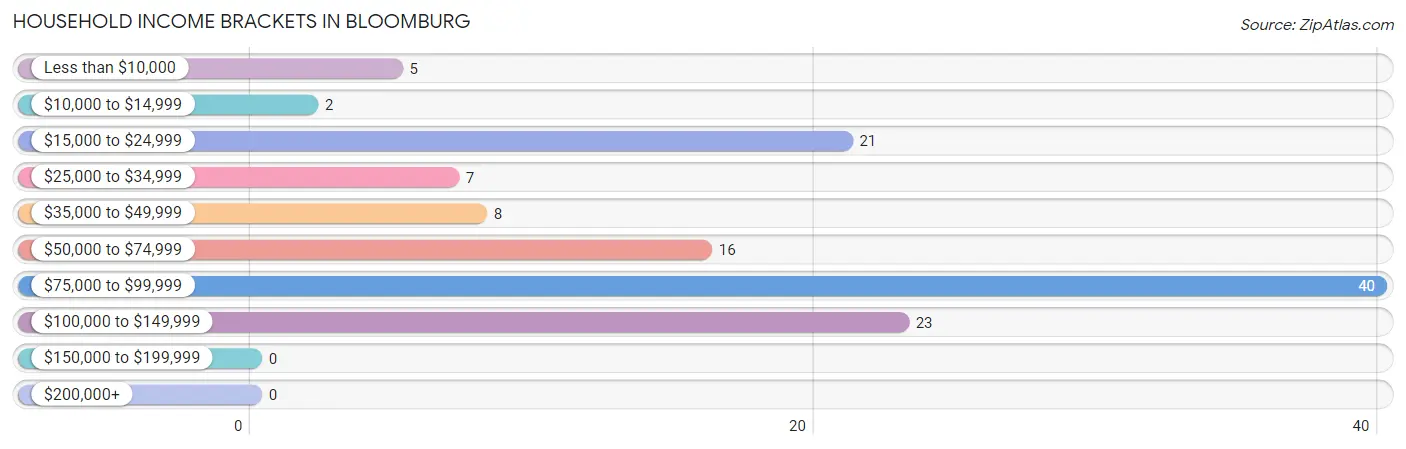
| Income Bracket | # Households | % Households |
| Less than $10,000 | 5 | 4.1% |
| $10,000 to $14,999 | 2 | 1.6% |
| $15,000 to $24,999 | 21 | 17.2% |
| $25,000 to $34,999 | 7 | 5.7% |
| $35,000 to $49,999 | 8 | 6.6% |
| $50,000 to $74,999 | 16 | 13.1% |
| $75,000 to $99,999 | 40 | 32.8% |
| $100,000 to $149,999 | 23 | 18.9% |
| $150,000 to $199,999 | 0 | 0.0% |
| $200,000+ | 0 | 0.0% |
Household Income by Householder Age in Bloomburg
The median household income in Bloomburg is $82,500, with the highest median household income of $93,750 found in the 45 to 64 years age bracket for the primary householder. A total of 36 households (29.5%) fall into this category.
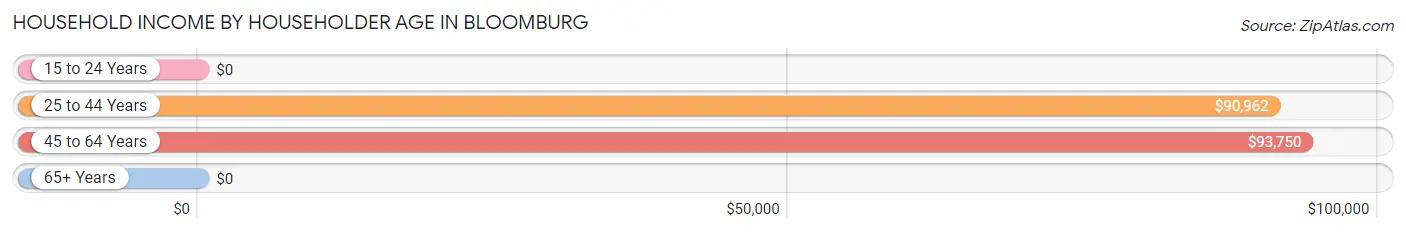
| Income Bracket | # Households | Median Income |
| 15 to 24 Years | 0 (0.0%) | $0 |
| 25 to 44 Years | 38 (31.1%) | $90,962 |
| 45 to 64 Years | 36 (29.5%) | $93,750 |
| 65+ Years | 48 (39.3%) | $0 |
| Total | 122 (100.0%) | $82,500 |
Poverty in Bloomburg
Income Below Poverty by Sex and Age in Bloomburg
With 6.3% poverty level for males and 9.0% for females among the residents of Bloomburg, 12 to 14 year old males and 75 year old and over females are the most vulnerable to poverty, with 2 males (100.0%) and 7 females (36.8%) in their respective age groups living below the poverty level.
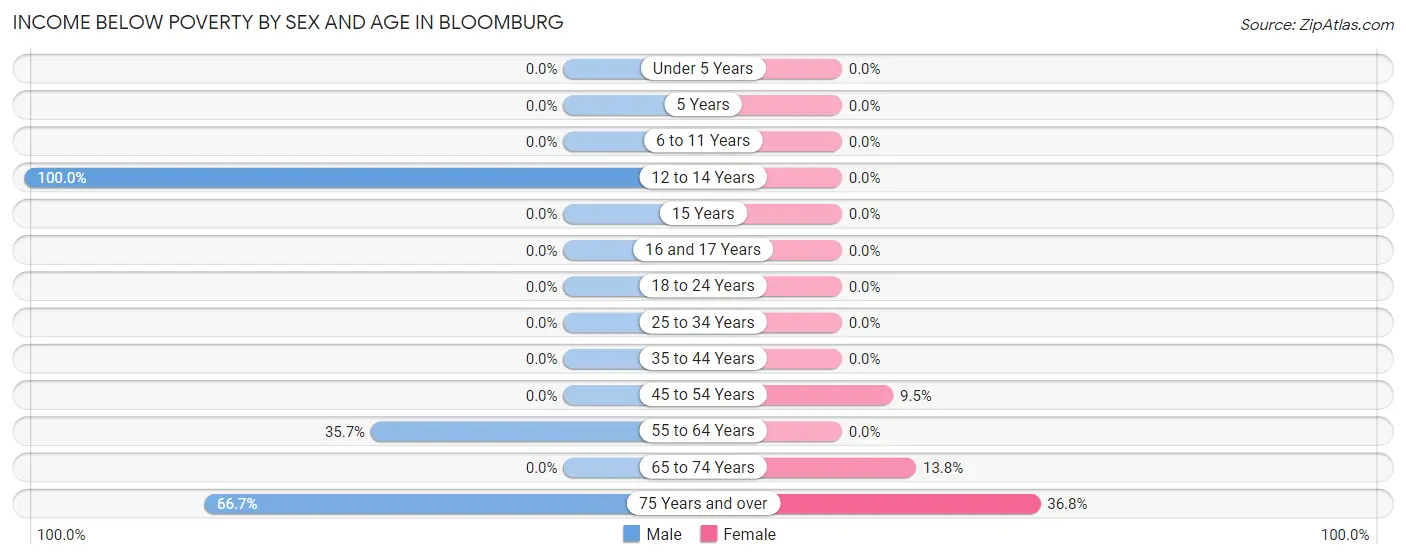
| Age Bracket | Male | Female |
| Under 5 Years | 0 (0.0%) | 0 (0.0%) |
| 5 Years | 0 (0.0%) | 0 (0.0%) |
| 6 to 11 Years | 0 (0.0%) | 0 (0.0%) |
| 12 to 14 Years | 2 (100.0%) | 0 (0.0%) |
| 15 Years | 0 (0.0%) | 0 (0.0%) |
| 16 and 17 Years | 0 (0.0%) | 0 (0.0%) |
| 18 to 24 Years | 0 (0.0%) | 0 (0.0%) |
| 25 to 34 Years | 0 (0.0%) | 0 (0.0%) |
| 35 to 44 Years | 0 (0.0%) | 0 (0.0%) |
| 45 to 54 Years | 0 (0.0%) | 2 (9.5%) |
| 55 to 64 Years | 5 (35.7%) | 0 (0.0%) |
| 65 to 74 Years | 0 (0.0%) | 4 (13.8%) |
| 75 Years and over | 2 (66.7%) | 7 (36.8%) |
| Total | 9 (6.3%) | 13 (9.0%) |
Income Above Poverty by Sex and Age in Bloomburg
According to the poverty statistics in Bloomburg, males aged under 5 years and females aged under 5 years are the age groups that are most secure financially, with 100.0% of males and 100.0% of females in these age groups living above the poverty line.
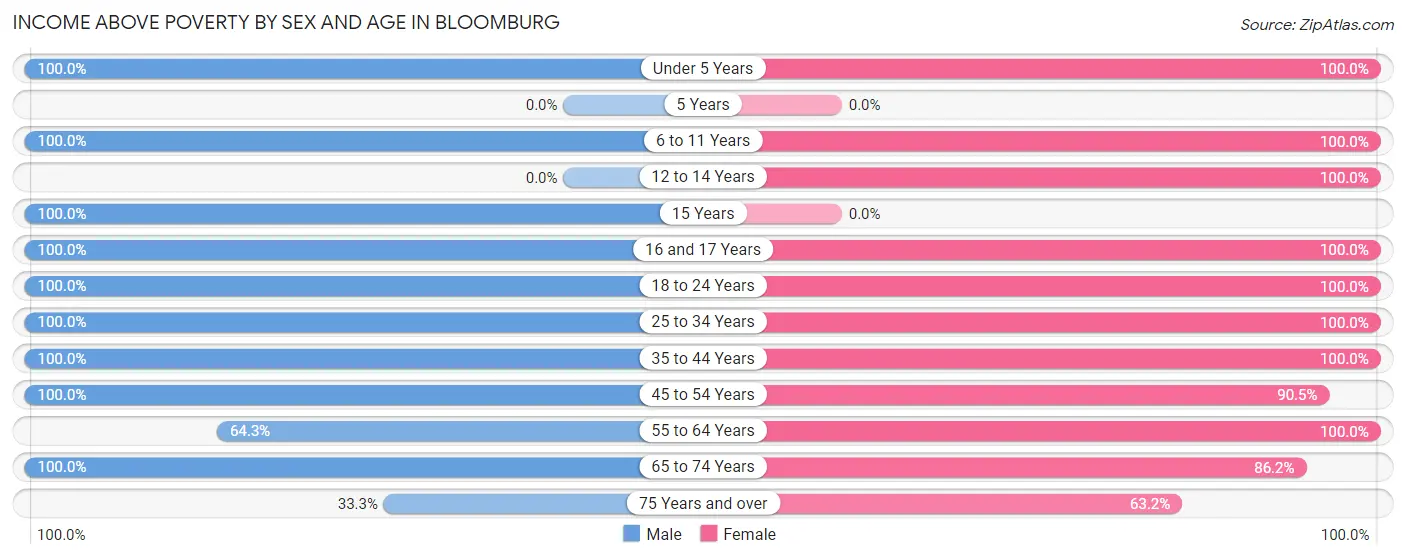
| Age Bracket | Male | Female |
| Under 5 Years | 42 (100.0%) | 2 (100.0%) |
| 5 Years | 0 (0.0%) | 0 (0.0%) |
| 6 to 11 Years | 4 (100.0%) | 1 (100.0%) |
| 12 to 14 Years | 0 (0.0%) | 6 (100.0%) |
| 15 Years | 9 (100.0%) | 0 (0.0%) |
| 16 and 17 Years | 6 (100.0%) | 1 (100.0%) |
| 18 to 24 Years | 3 (100.0%) | 1 (100.0%) |
| 25 to 34 Years | 6 (100.0%) | 24 (100.0%) |
| 35 to 44 Years | 10 (100.0%) | 31 (100.0%) |
| 45 to 54 Years | 13 (100.0%) | 19 (90.5%) |
| 55 to 64 Years | 9 (64.3%) | 10 (100.0%) |
| 65 to 74 Years | 31 (100.0%) | 25 (86.2%) |
| 75 Years and over | 1 (33.3%) | 12 (63.2%) |
| Total | 134 (93.7%) | 132 (91.0%) |
Income Below Poverty Among Married-Couple Families in Bloomburg
The poverty statistics for married-couple families in Bloomburg show that 2.6% or 2 of the total 78 families live below the poverty line. Families with no children have the highest poverty rate of 4.6%, comprising of 2 families. On the other hand, families with 1 or 2 children have the lowest poverty rate of 0.0%, which includes 0 families.
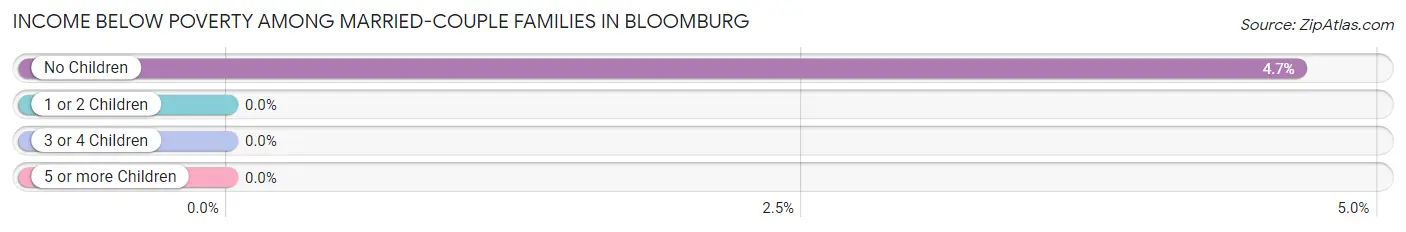
| Children | Above Poverty | Below Poverty |
| No Children | 41 (95.4%) | 2 (4.6%) |
| 1 or 2 Children | 32 (100.0%) | 0 (0.0%) |
| 3 or 4 Children | 3 (100.0%) | 0 (0.0%) |
| 5 or more Children | 0 (0.0%) | 0 (0.0%) |
| Total | 76 (97.4%) | 2 (2.6%) |
Income Below Poverty Among Single-Parent Households in Bloomburg
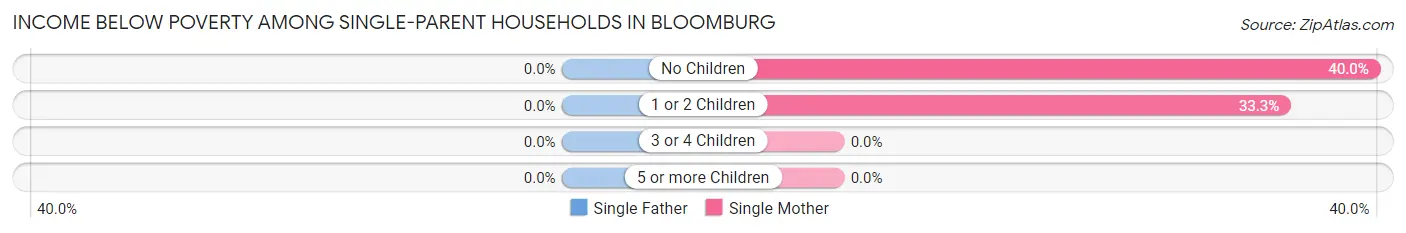
| Children | Single Father | Single Mother |
| No Children | 0 (0.0%) | 2 (40.0%) |
| 1 or 2 Children | 0 (0.0%) | 2 (33.3%) |
| 3 or 4 Children | 0 (0.0%) | 0 (0.0%) |
| 5 or more Children | 0 (0.0%) | 0 (0.0%) |
| Total | 0 (0.0%) | 4 (36.4%) |
Income Below Poverty Among Married-Couple vs Single-Parent Households in Bloomburg
The poverty data for Bloomburg shows that 2 of the married-couple family households (2.6%) and 4 of the single-parent households (36.4%) are living below the poverty level. Within the married-couple family households, those with no children have the highest poverty rate, with 2 households (4.6%) falling below the poverty line. Among the single-parent households, those with no children have the highest poverty rate, with 2 household (40.0%) living below poverty.
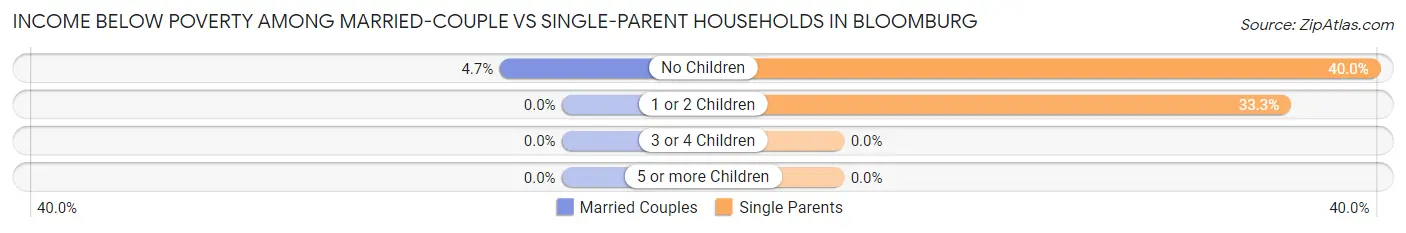
| Children | Married-Couple Families | Single-Parent Households |
| No Children | 2 (4.6%) | 2 (40.0%) |
| 1 or 2 Children | 0 (0.0%) | 2 (33.3%) |
| 3 or 4 Children | 0 (0.0%) | 0 (0.0%) |
| 5 or more Children | 0 (0.0%) | 0 (0.0%) |
| Total | 2 (2.6%) | 4 (36.4%) |
Race in Bloomburg
The most populous races in Bloomburg are White / Caucasian (257 | 89.2%), Black / African American (24 | 8.3%), and Two or more Races (7 | 2.4%).
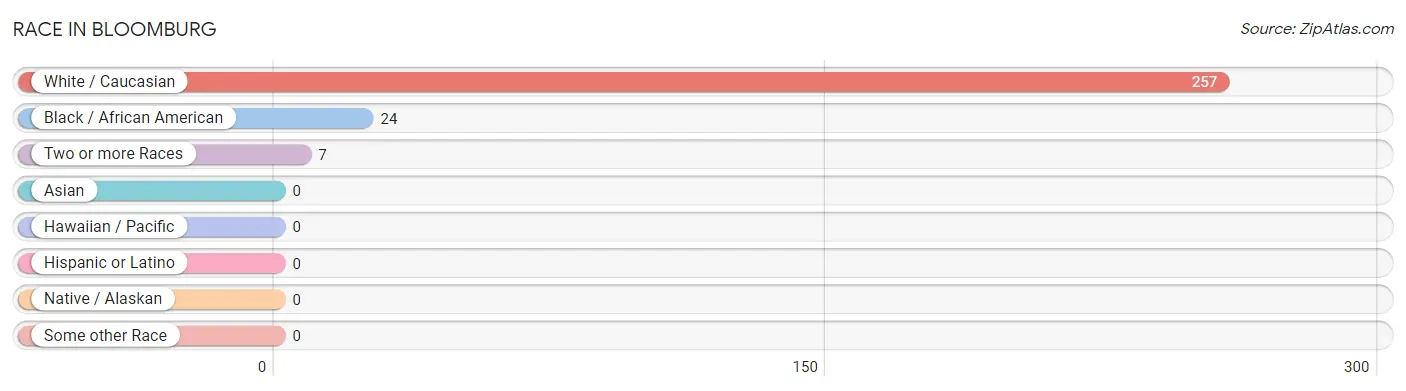
| Race | # Population | % Population |
| Asian | 0 | 0.0% |
| Black / African American | 24 | 8.3% |
| Hawaiian / Pacific | 0 | 0.0% |
| Hispanic or Latino | 0 | 0.0% |
| Native / Alaskan | 0 | 0.0% |
| White / Caucasian | 257 | 89.2% |
| Two or more Races | 7 | 2.4% |
| Some other Race | 0 | 0.0% |
| Total | 288 | 100.0% |
Ancestry in Bloomburg
The most populous ancestries reported in Bloomburg are American (132 | 45.8%), Irish (28 | 9.7%), English (12 | 4.2%), Italian (5 | 1.7%), and Scotch-Irish (1 | 0.4%), together accounting for 61.8% of all Bloomburg residents.
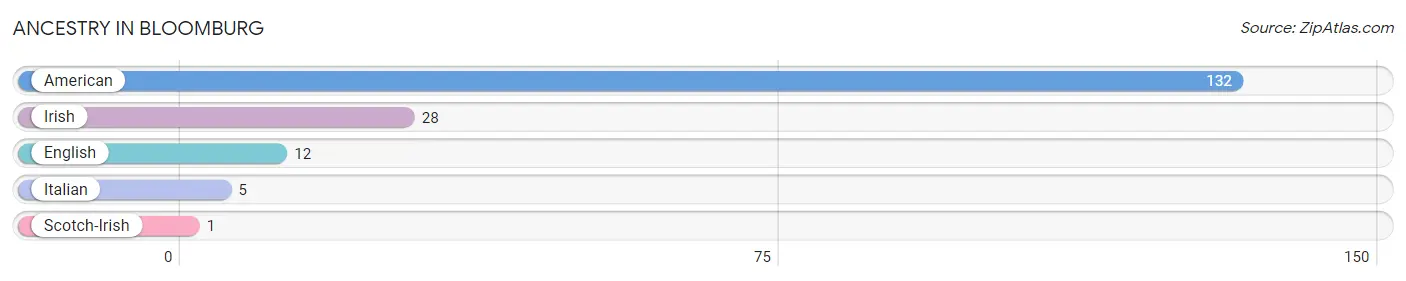
| Ancestry | # Population | % Population |
| American | 132 | 45.8% |
| English | 12 | 4.2% |
| Irish | 28 | 9.7% |
| Italian | 5 | 1.7% |
| Scotch-Irish | 1 | 0.4% | View All 5 Rows |
Immigrants in Bloomburg

| Immigration Origin | # Population | % Population | View All 0 Rows |
Sex and Age in Bloomburg
Sex and Age in Bloomburg
The most populous age groups in Bloomburg are Under 5 Years (42 | 29.4%) for men and 35 to 39 Years (28 | 19.3%) for women.
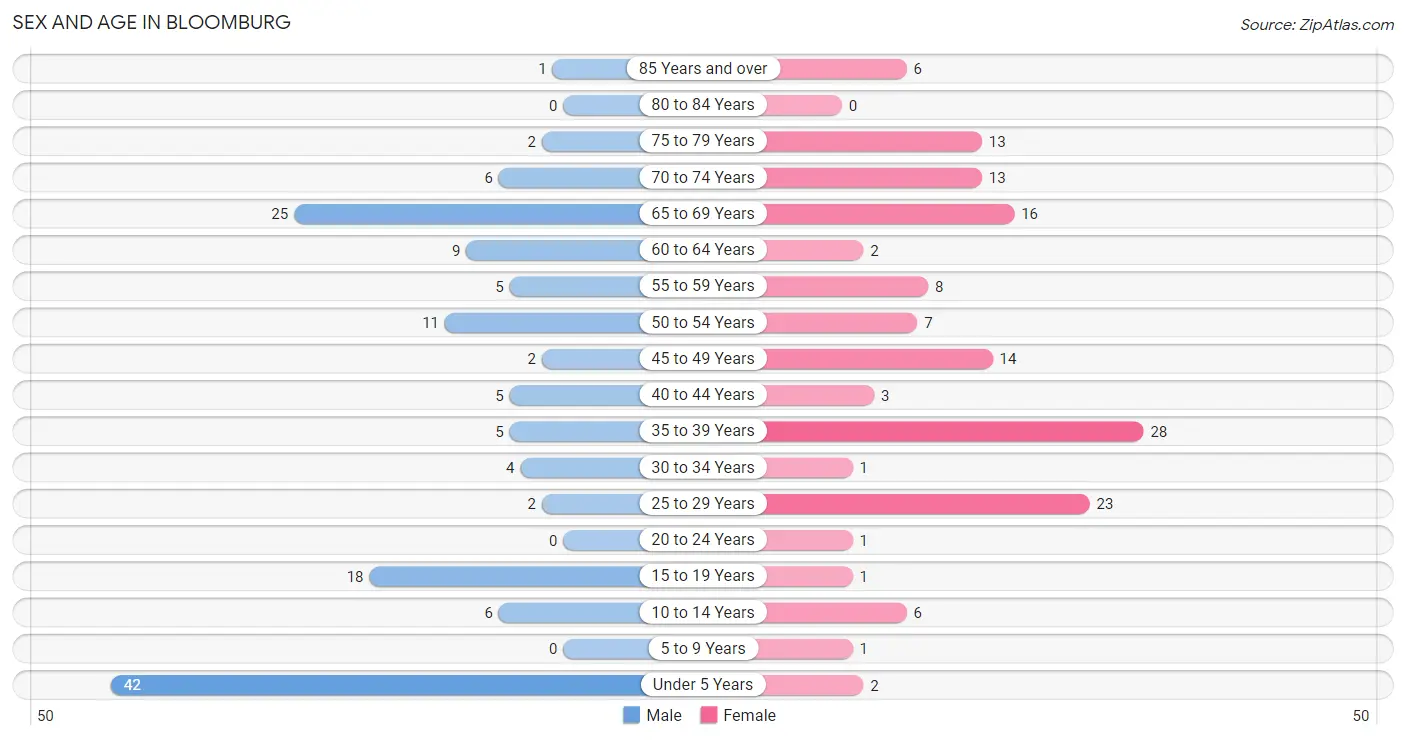
| Age Bracket | Male | Female |
| Under 5 Years | 42 (29.4%) | 2 (1.4%) |
| 5 to 9 Years | 0 (0.0%) | 1 (0.7%) |
| 10 to 14 Years | 6 (4.2%) | 6 (4.1%) |
| 15 to 19 Years | 18 (12.6%) | 1 (0.7%) |
| 20 to 24 Years | 0 (0.0%) | 1 (0.7%) |
| 25 to 29 Years | 2 (1.4%) | 23 (15.9%) |
| 30 to 34 Years | 4 (2.8%) | 1 (0.7%) |
| 35 to 39 Years | 5 (3.5%) | 28 (19.3%) |
| 40 to 44 Years | 5 (3.5%) | 3 (2.1%) |
| 45 to 49 Years | 2 (1.4%) | 14 (9.7%) |
| 50 to 54 Years | 11 (7.7%) | 7 (4.8%) |
| 55 to 59 Years | 5 (3.5%) | 8 (5.5%) |
| 60 to 64 Years | 9 (6.3%) | 2 (1.4%) |
| 65 to 69 Years | 25 (17.5%) | 16 (11.0%) |
| 70 to 74 Years | 6 (4.2%) | 13 (9.0%) |
| 75 to 79 Years | 2 (1.4%) | 13 (9.0%) |
| 80 to 84 Years | 0 (0.0%) | 0 (0.0%) |
| 85 Years and over | 1 (0.7%) | 6 (4.1%) |
| Total | 143 (100.0%) | 145 (100.0%) |
Families and Households in Bloomburg
Median Family Size in Bloomburg
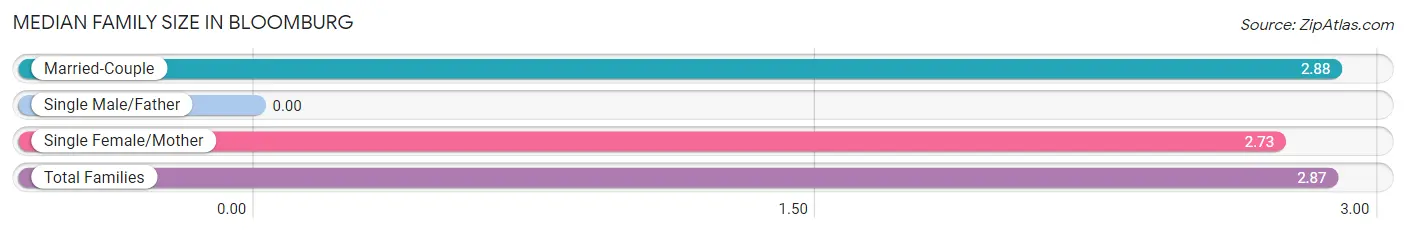
| Family Type | # Families | Family Size |
| Married-Couple | 78 (87.6%) | 2.88 |
| Single Male/Father | 0 (0.0%) | - |
| Single Female/Mother | 11 (12.4%) | 2.73 |
| Total Families | 89 (100.0%) | 2.87 |
Median Household Size in Bloomburg
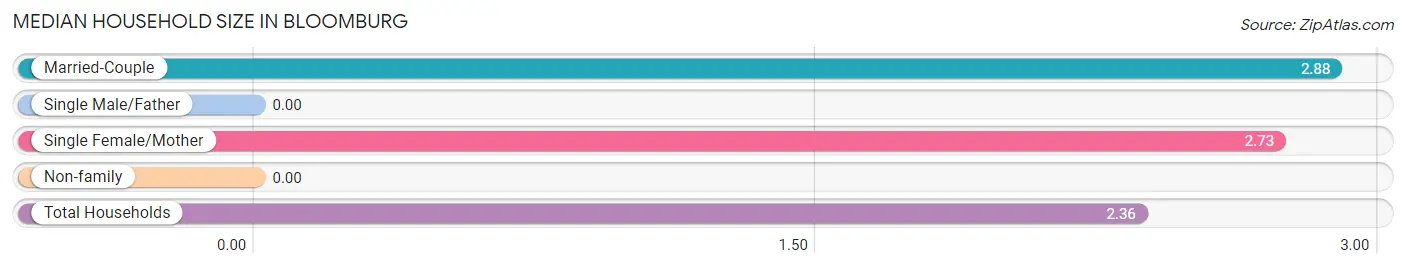
| Household Type | # Households | Household Size |
| Married-Couple | 78 (63.9%) | 2.88 |
| Single Male/Father | 0 (0.0%) | - |
| Single Female/Mother | 11 (9.0%) | 2.73 |
| Non-family | 33 (27.1%) | - |
| Total Households | 122 (100.0%) | 2.36 |
Household Size by Marriage Status in Bloomburg
Out of a total of 122 households in Bloomburg, 89 (73.0%) are family households, while 33 (27.1%) are nonfamily households. The most numerous type of family households are 4-person households, comprising 35, and the most common type of nonfamily households are 1-person households, comprising 33.
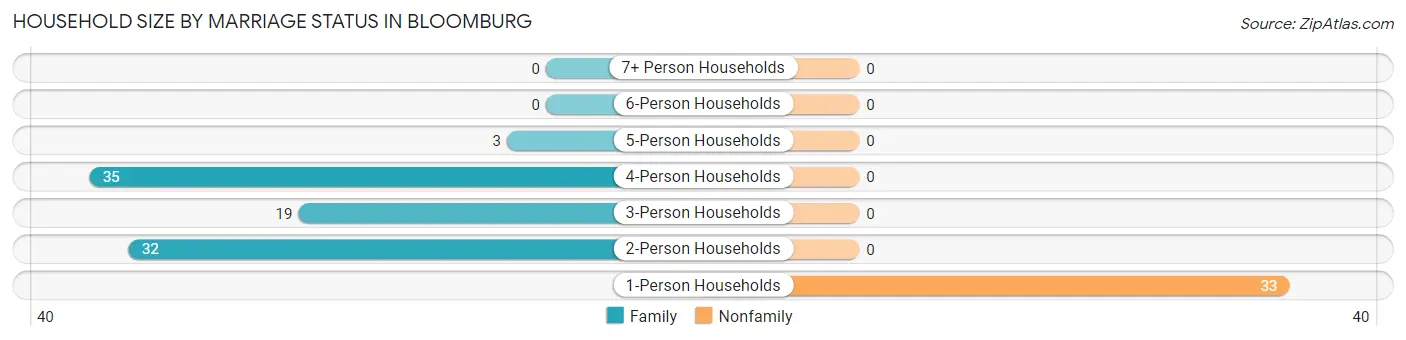
| Household Size | Family Households | Nonfamily Households |
| 1-Person Households | - | 33 (27.1%) |
| 2-Person Households | 32 (26.2%) | 0 (0.0%) |
| 3-Person Households | 19 (15.6%) | 0 (0.0%) |
| 4-Person Households | 35 (28.7%) | 0 (0.0%) |
| 5-Person Households | 3 (2.5%) | 0 (0.0%) |
| 6-Person Households | 0 (0.0%) | 0 (0.0%) |
| 7+ Person Households | 0 (0.0%) | 0 (0.0%) |
| Total | 89 (73.0%) | 33 (27.1%) |
Female Fertility in Bloomburg
Fertility by Age in Bloomburg
Average fertility rate in Bloomburg is 370.0 births per 1,000 women. Women in the age bracket of 35 to 50 years have the highest fertility rate with 553.0 births per 1,000 women. Women in the age bracket of 35 to 50 years acount for 96.3% of all women with births.
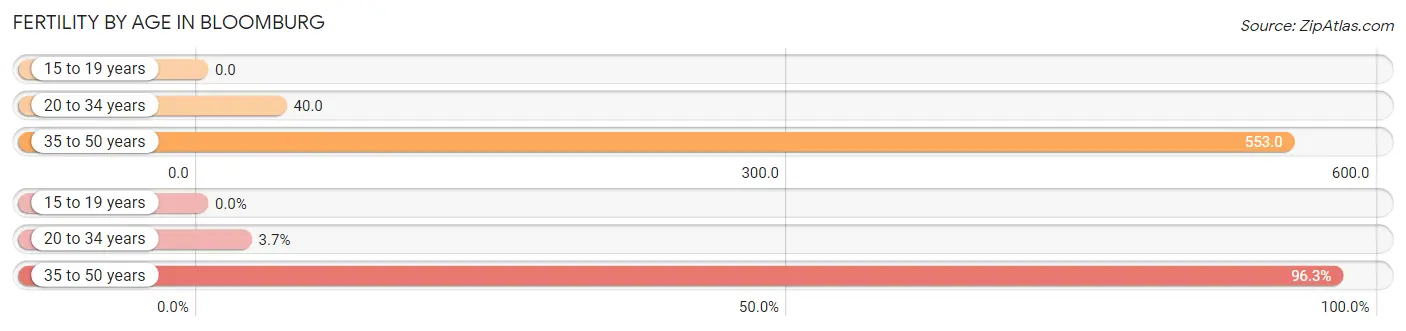
| Age Bracket | Women with Births | Births / 1,000 Women |
| 15 to 19 years | 0 (0.0%) | 0.0 |
| 20 to 34 years | 1 (3.7%) | 40.0 |
| 35 to 50 years | 26 (96.3%) | 553.0 |
| Total | 27 (100.0%) | 370.0 |
Fertility by Age by Marriage Status in Bloomburg
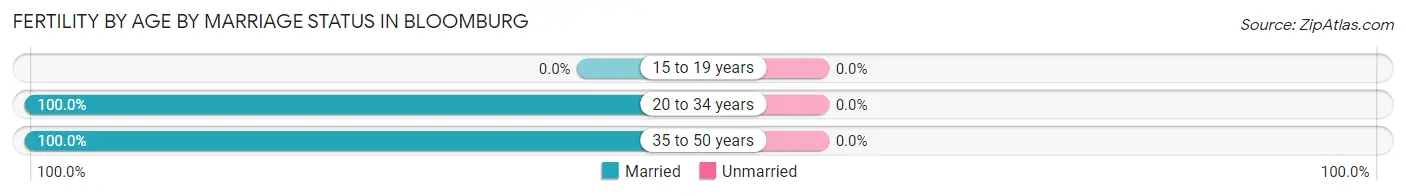
| Age Bracket | Married | Unmarried |
| 15 to 19 years | 0 (0.0%) | 0 (0.0%) |
| 20 to 34 years | 1 (100.0%) | 0 (0.0%) |
| 35 to 50 years | 26 (100.0%) | 0 (0.0%) |
| Total | 27 (100.0%) | 0 (0.0%) |
Fertility by Education in Bloomburg
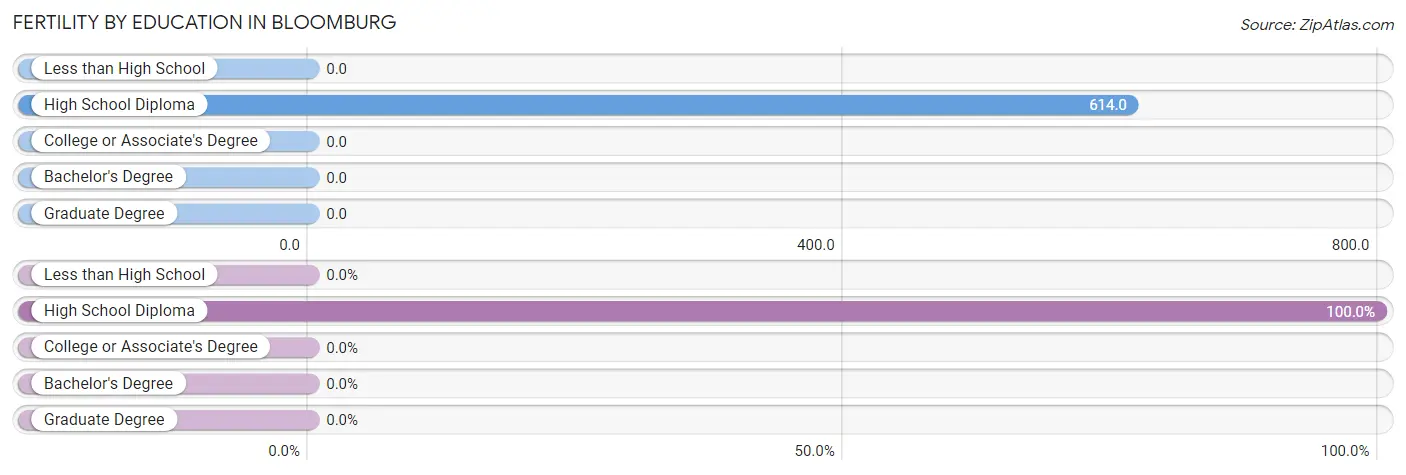
| Educational Attainment | Women with Births | Births / 1,000 Women |
| Less than High School | 0 (0.0%) | 0.0 |
| High School Diploma | 27 (100.0%) | 614.0 |
| College or Associate's Degree | 0 (0.0%) | 0.0 |
| Bachelor's Degree | 0 (0.0%) | 0.0 |
| Graduate Degree | 0 (0.0%) | 0.0 |
| Total | 27 (100.0%) | 370.0 |
Fertility by Education by Marriage Status in Bloomburg
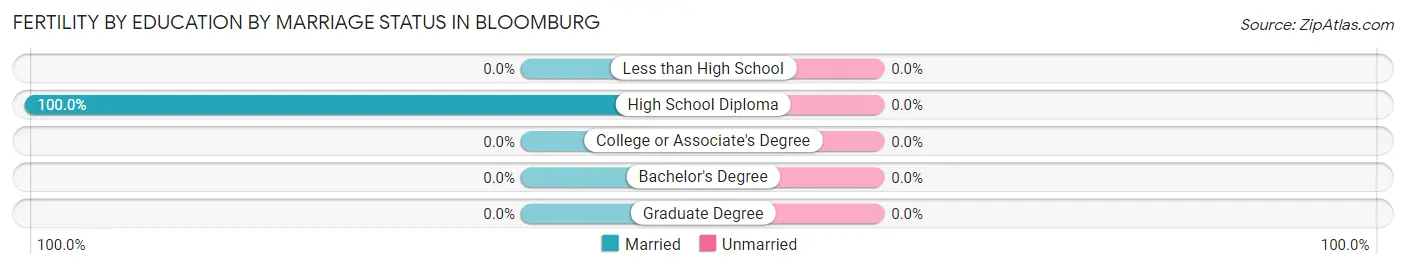
| Educational Attainment | Married | Unmarried |
| Less than High School | 0 (0.0%) | 0 (0.0%) |
| High School Diploma | 27 (100.0%) | 0 (0.0%) |
| College or Associate's Degree | 0 (0.0%) | 0 (0.0%) |
| Bachelor's Degree | 0 (0.0%) | 0 (0.0%) |
| Graduate Degree | 0 (0.0%) | 0 (0.0%) |
| Total | 27 (100.0%) | 0 (0.0%) |
Employment Characteristics in Bloomburg
Employment by Class of Employer in Bloomburg
Among the 136 employed individuals in Bloomburg, private company employees (102 | 75.0%), local government employees (11 | 8.1%), and state government employees (6 | 4.4%) make up the most common classes of employment.
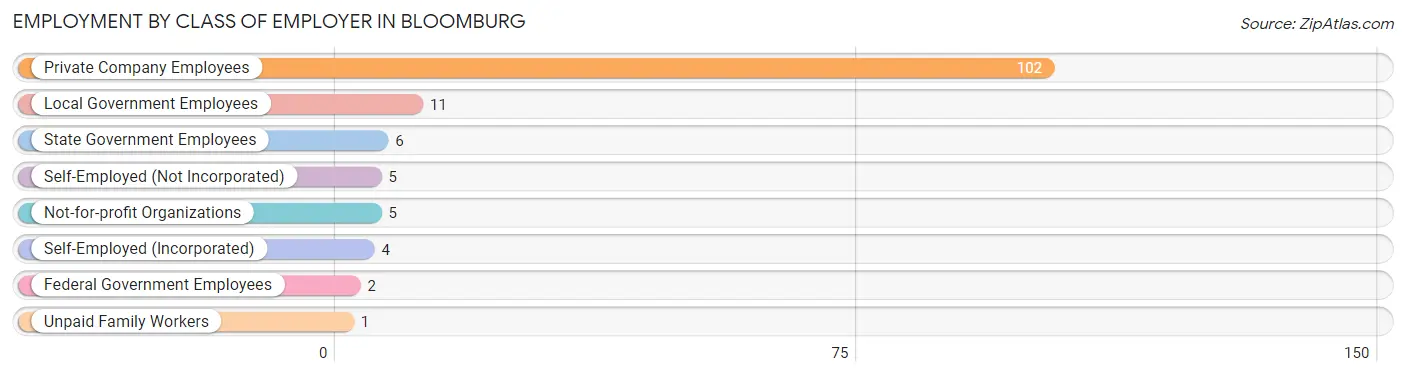
| Employer Class | # Employees | % Employees |
| Private Company Employees | 102 | 75.0% |
| Self-Employed (Incorporated) | 4 | 2.9% |
| Self-Employed (Not Incorporated) | 5 | 3.7% |
| Not-for-profit Organizations | 5 | 3.7% |
| Local Government Employees | 11 | 8.1% |
| State Government Employees | 6 | 4.4% |
| Federal Government Employees | 2 | 1.5% |
| Unpaid Family Workers | 1 | 0.7% |
| Total | 136 | 100.0% |
Employment Status by Age in Bloomburg
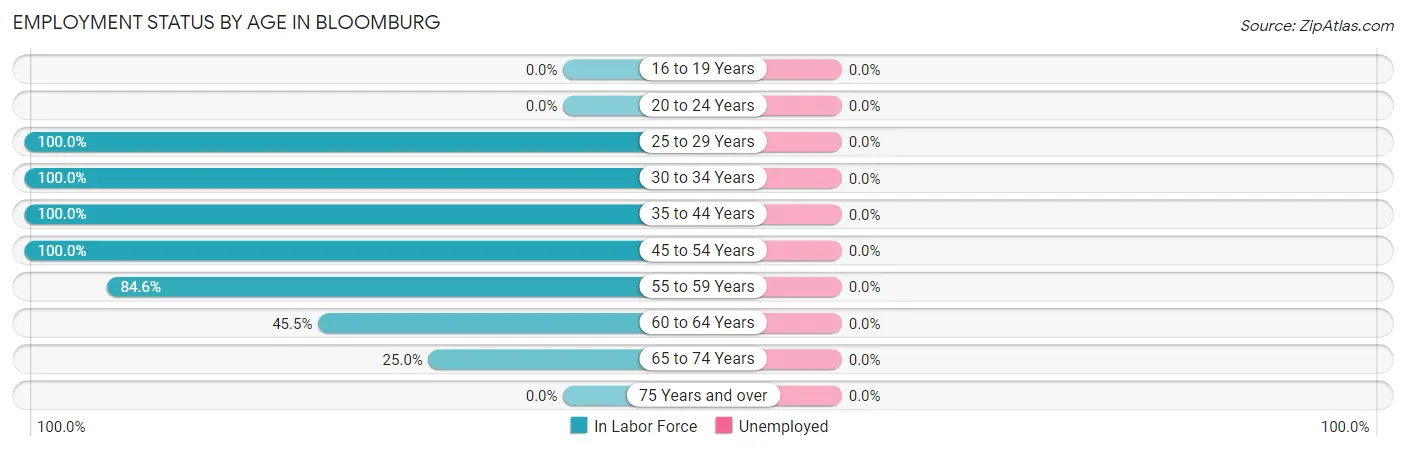
| Age Bracket | In Labor Force | Unemployed |
| 16 to 19 Years | 0 (0.0%) | 0 (0.0%) |
| 20 to 24 Years | 0 (0.0%) | 0 (0.0%) |
| 25 to 29 Years | 25 (100.0%) | 0 (0.0%) |
| 30 to 34 Years | 5 (100.0%) | 0 (0.0%) |
| 35 to 44 Years | 41 (100.0%) | 0 (0.0%) |
| 45 to 54 Years | 34 (100.0%) | 0 (0.0%) |
| 55 to 59 Years | 11 (84.6%) | 0 (0.0%) |
| 60 to 64 Years | 5 (45.5%) | 0 (0.0%) |
| 65 to 74 Years | 15 (25.0%) | 0 (0.0%) |
| 75 Years and over | 0 (0.0%) | 0 (0.0%) |
| Total | 136 (61.3%) | 0 (0.0%) |
Employment Status by Educational Attainment in Bloomburg
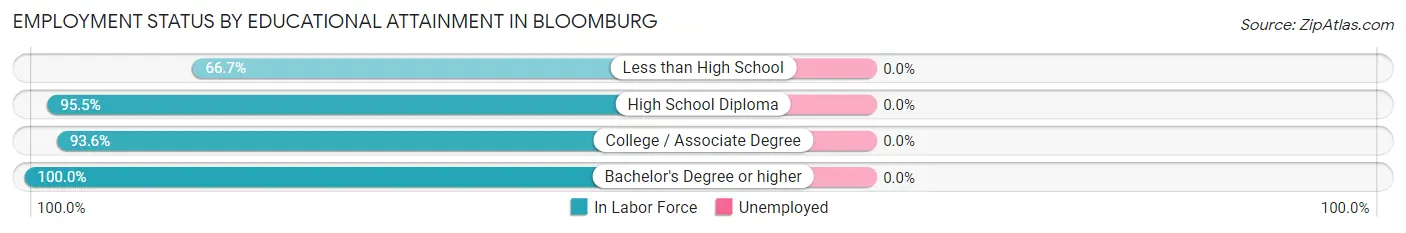
| Educational Attainment | In Labor Force | Unemployed |
| Less than High School | 4 (66.7%) | 0 (0.0%) |
| High School Diploma | 63 (95.5%) | 0 (0.0%) |
| College / Associate Degree | 44 (93.6%) | 0 (0.0%) |
| Bachelor's Degree or higher | 10 (100.0%) | 0 (0.0%) |
| Total | 121 (93.8%) | 0 (0.0%) |
Employment Occupations by Sex in Bloomburg
Management, Business, Science and Arts Occupations
The most common Management, Business, Science and Arts occupations in Bloomburg are Health Diagnosing & Treating (26 | 19.1%), Management (7 | 5.1%), Community & Social Service (7 | 5.1%), Education Instruction & Library (6 | 4.4%), and Legal Services & Support (1 | 0.7%).
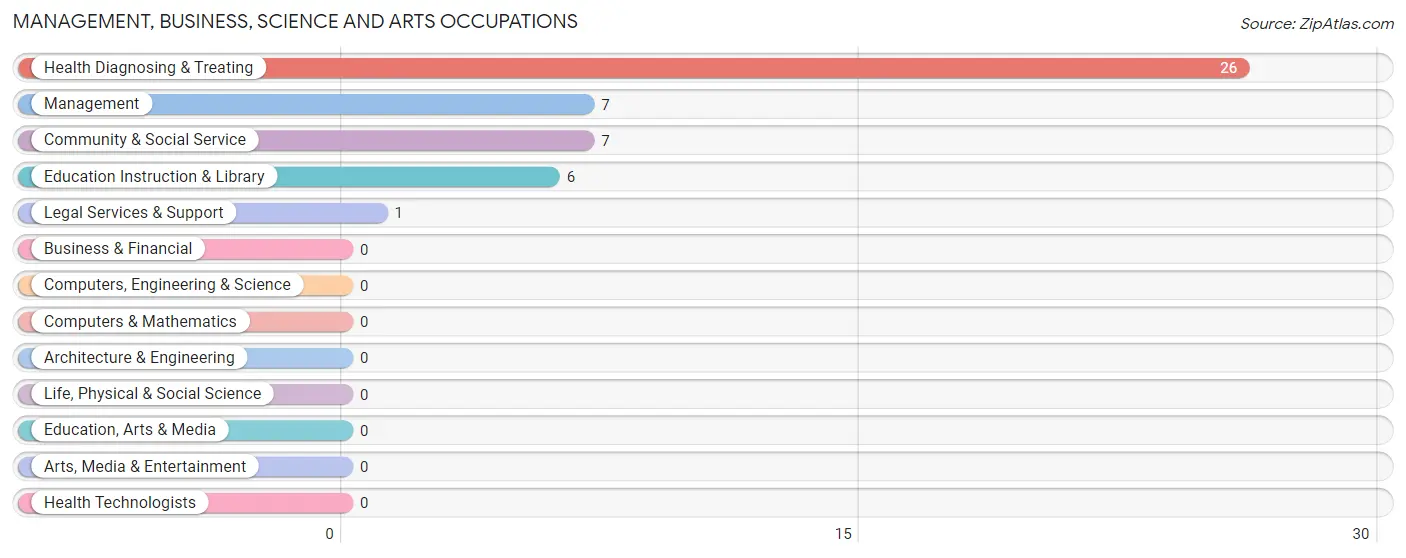
Management, Business, Science and Arts Occupations by Sex
Within the Management, Business, Science and Arts occupations in Bloomburg, the most male-oriented occupations are Management (85.7%), Education Instruction & Library (50.0%), and Community & Social Service (42.9%), while the most female-oriented occupations are Legal Services & Support (100.0%), Health Diagnosing & Treating (100.0%), and Community & Social Service (57.1%).
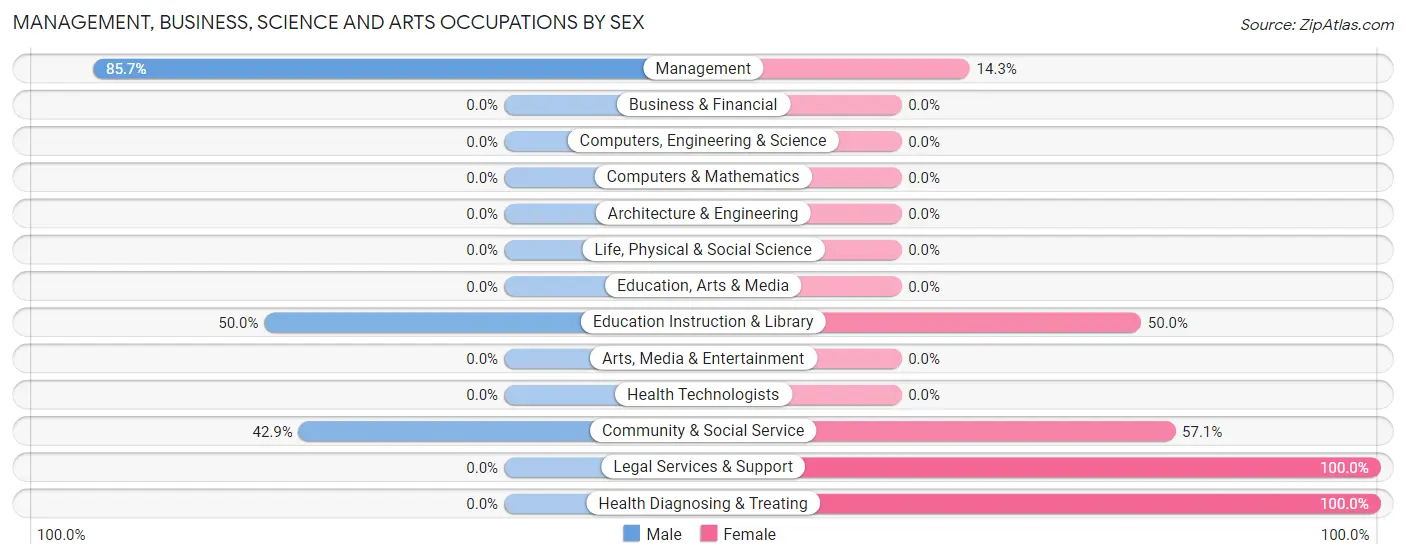
| Occupation | Male | Female |
| Management | 6 (85.7%) | 1 (14.3%) |
| Business & Financial | 0 (0.0%) | 0 (0.0%) |
| Computers, Engineering & Science | 0 (0.0%) | 0 (0.0%) |
| Computers & Mathematics | 0 (0.0%) | 0 (0.0%) |
| Architecture & Engineering | 0 (0.0%) | 0 (0.0%) |
| Life, Physical & Social Science | 0 (0.0%) | 0 (0.0%) |
| Community & Social Service | 3 (42.9%) | 4 (57.1%) |
| Education, Arts & Media | 0 (0.0%) | 0 (0.0%) |
| Legal Services & Support | 0 (0.0%) | 1 (100.0%) |
| Education Instruction & Library | 3 (50.0%) | 3 (50.0%) |
| Arts, Media & Entertainment | 0 (0.0%) | 0 (0.0%) |
| Health Diagnosing & Treating | 0 (0.0%) | 26 (100.0%) |
| Health Technologists | 0 (0.0%) | 0 (0.0%) |
| Total (Category) | 9 (22.5%) | 31 (77.5%) |
| Total (Overall) | 47 (34.6%) | 89 (65.4%) |
Services Occupations
The most common Services occupations in Bloomburg are Healthcare Support (16 | 11.8%), Security & Protection (8 | 5.9%), Firefighting & Prevention (6 | 4.4%), Law Enforcement (2 | 1.5%), and Cleaning & Maintenance (2 | 1.5%).
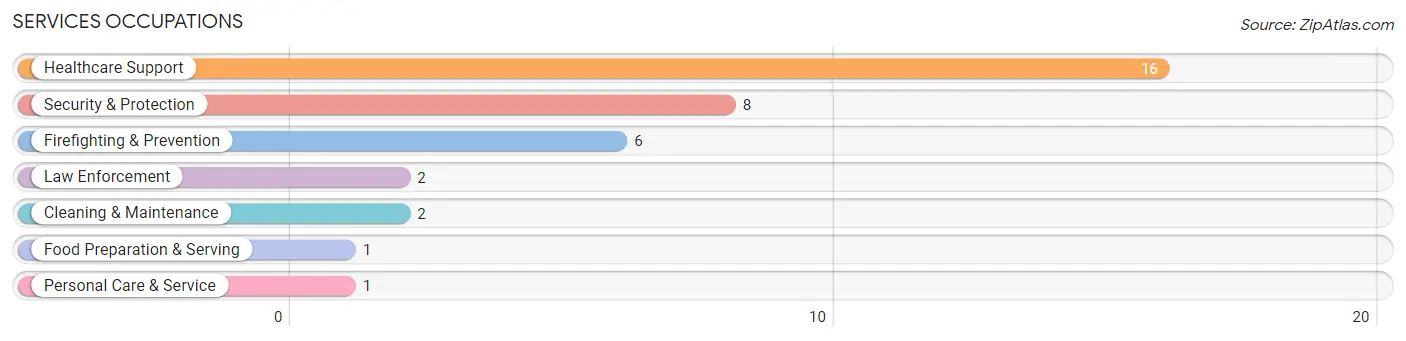
Services Occupations by Sex
Within the Services occupations in Bloomburg, the most male-oriented occupations are Law Enforcement (100.0%), Food Preparation & Serving (100.0%), and Security & Protection (75.0%), while the most female-oriented occupations are Healthcare Support (100.0%), Cleaning & Maintenance (100.0%), and Personal Care & Service (100.0%).
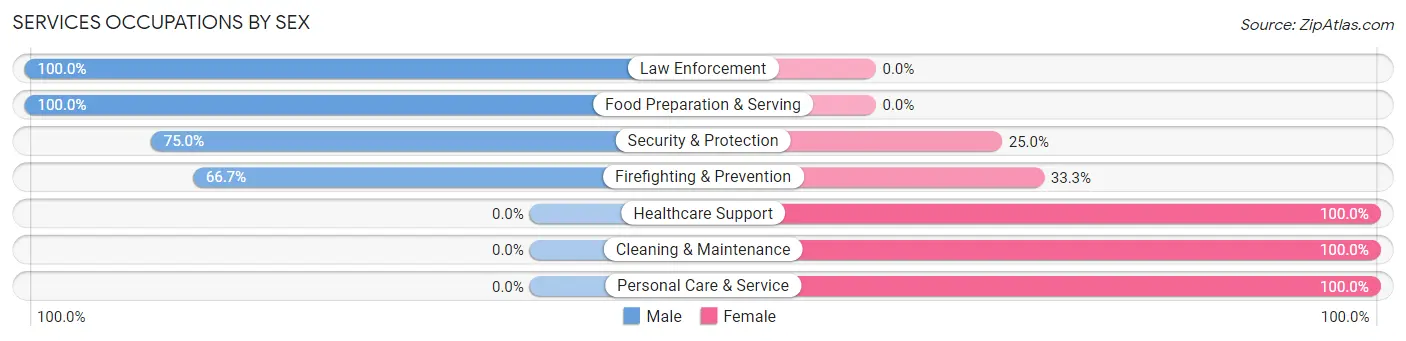
| Occupation | Male | Female |
| Healthcare Support | 0 (0.0%) | 16 (100.0%) |
| Security & Protection | 6 (75.0%) | 2 (25.0%) |
| Firefighting & Prevention | 4 (66.7%) | 2 (33.3%) |
| Law Enforcement | 2 (100.0%) | 0 (0.0%) |
| Food Preparation & Serving | 1 (100.0%) | 0 (0.0%) |
| Cleaning & Maintenance | 0 (0.0%) | 2 (100.0%) |
| Personal Care & Service | 0 (0.0%) | 1 (100.0%) |
| Total (Category) | 7 (25.0%) | 21 (75.0%) |
| Total (Overall) | 47 (34.6%) | 89 (65.4%) |
Sales and Office Occupations
The most common Sales and Office occupations in Bloomburg are Office & Administration (12 | 8.8%), and Sales & Related (4 | 2.9%).
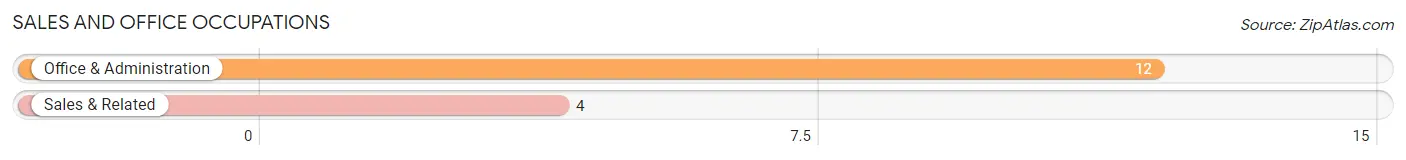
Sales and Office Occupations by Sex
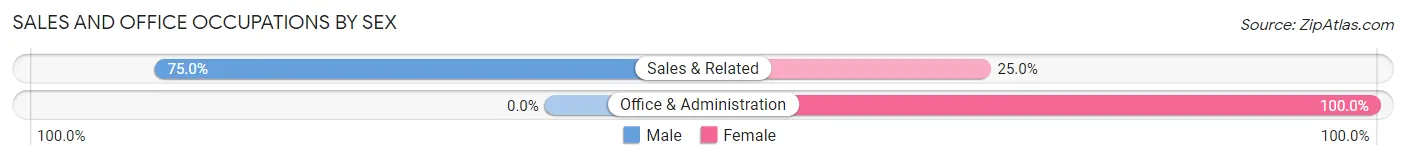
| Occupation | Male | Female |
| Sales & Related | 3 (75.0%) | 1 (25.0%) |
| Office & Administration | 0 (0.0%) | 12 (100.0%) |
| Total (Category) | 3 (18.8%) | 13 (81.2%) |
| Total (Overall) | 47 (34.6%) | 89 (65.4%) |
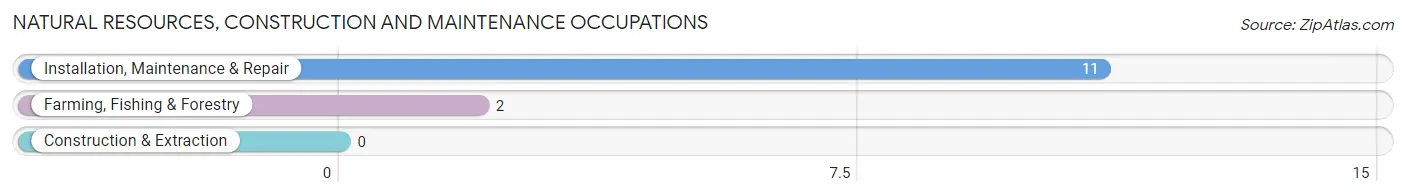
Natural Resources, Construction and Maintenance Occupations
The most common Natural Resources, Construction and Maintenance occupations in Bloomburg are Installation, Maintenance & Repair (11 | 8.1%), and Farming, Fishing & Forestry (2 | 1.5%).
Natural Resources, Construction and Maintenance Occupations by Sex
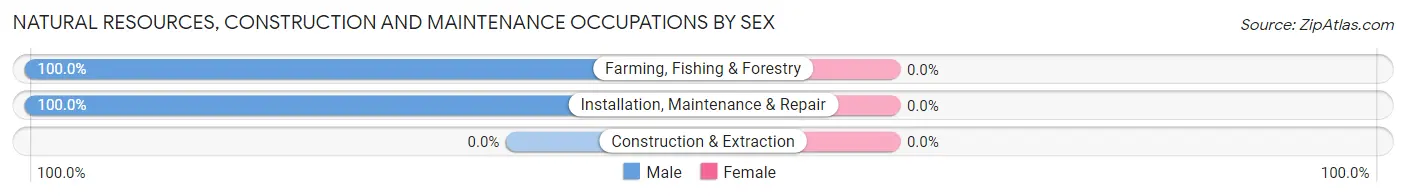
| Occupation | Male | Female |
| Farming, Fishing & Forestry | 2 (100.0%) | 0 (0.0%) |
| Construction & Extraction | 0 (0.0%) | 0 (0.0%) |
| Installation, Maintenance & Repair | 11 (100.0%) | 0 (0.0%) |
| Total (Category) | 13 (100.0%) | 0 (0.0%) |
| Total (Overall) | 47 (34.6%) | 89 (65.4%) |
Production, Transportation and Moving Occupations
The most common Production, Transportation and Moving occupations in Bloomburg are Transportation (33 | 24.3%), Production (5 | 3.7%), and Material Moving (1 | 0.7%).
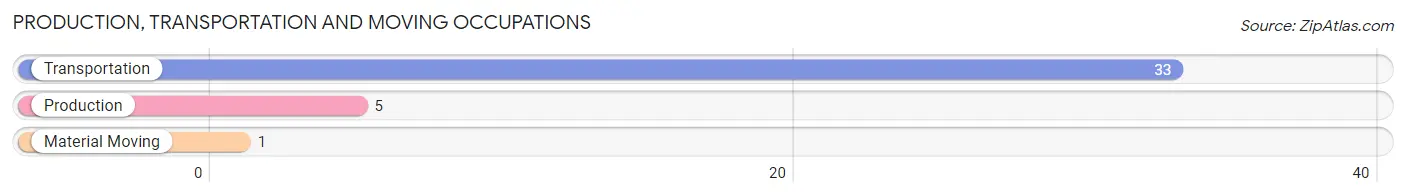
Production, Transportation and Moving Occupations by Sex
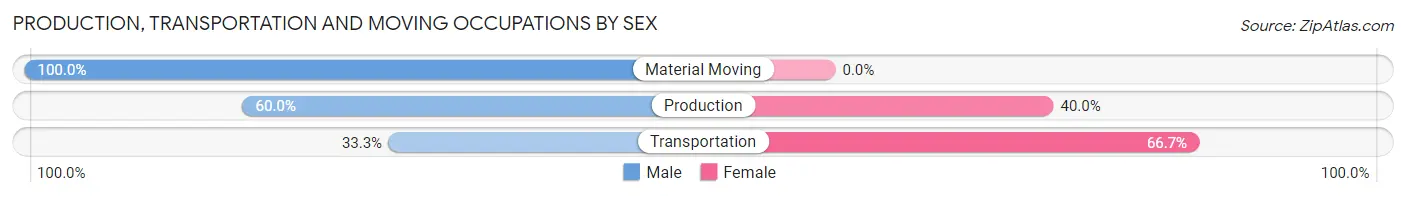
| Occupation | Male | Female |
| Production | 3 (60.0%) | 2 (40.0%) |
| Transportation | 11 (33.3%) | 22 (66.7%) |
| Material Moving | 1 (100.0%) | 0 (0.0%) |
| Total (Category) | 15 (38.5%) | 24 (61.5%) |
| Total (Overall) | 47 (34.6%) | 89 (65.4%) |
Employment Industries by Sex in Bloomburg
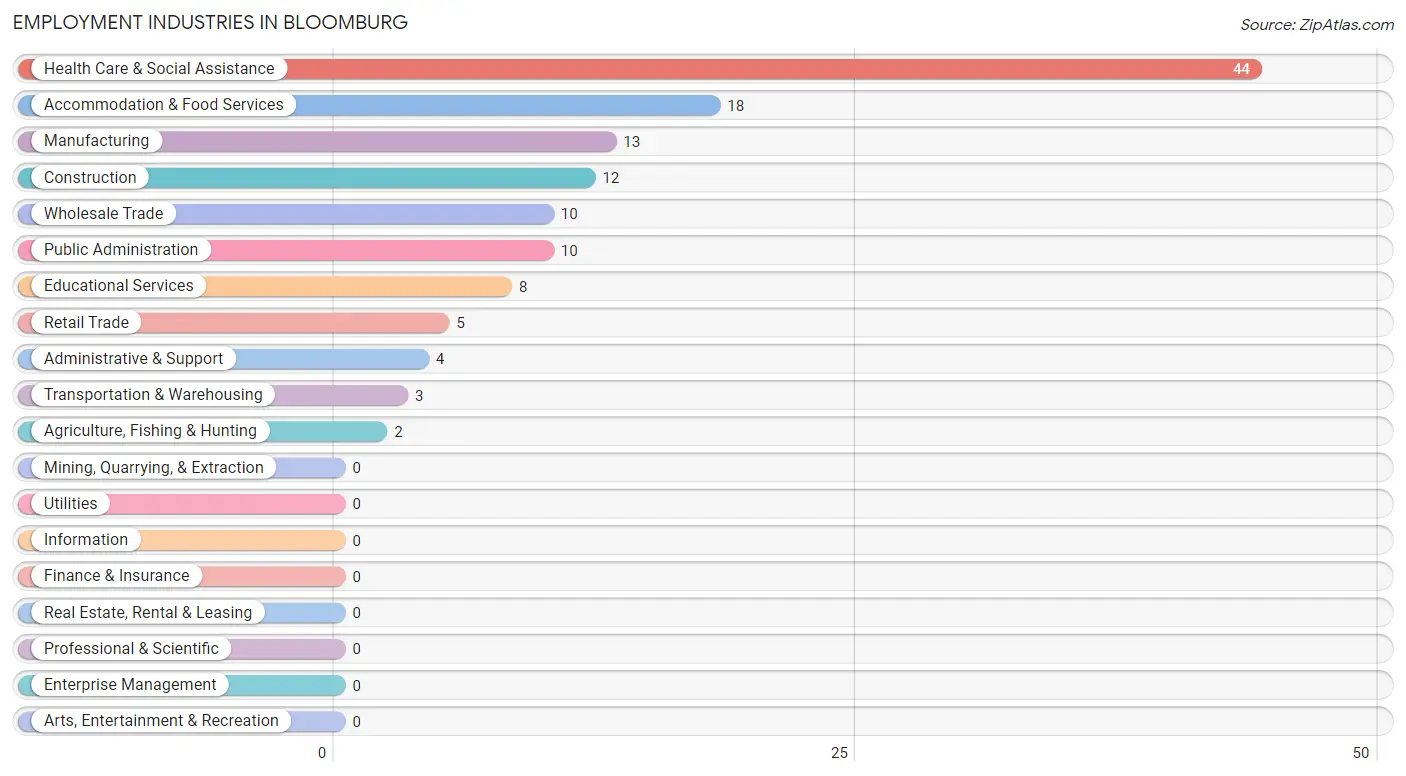
Employment Industries in Bloomburg
The major employment industries in Bloomburg include Health Care & Social Assistance (44 | 32.4%), Accommodation & Food Services (18 | 13.2%), Manufacturing (13 | 9.6%), Construction (12 | 8.8%), and Wholesale Trade (10 | 7.3%).
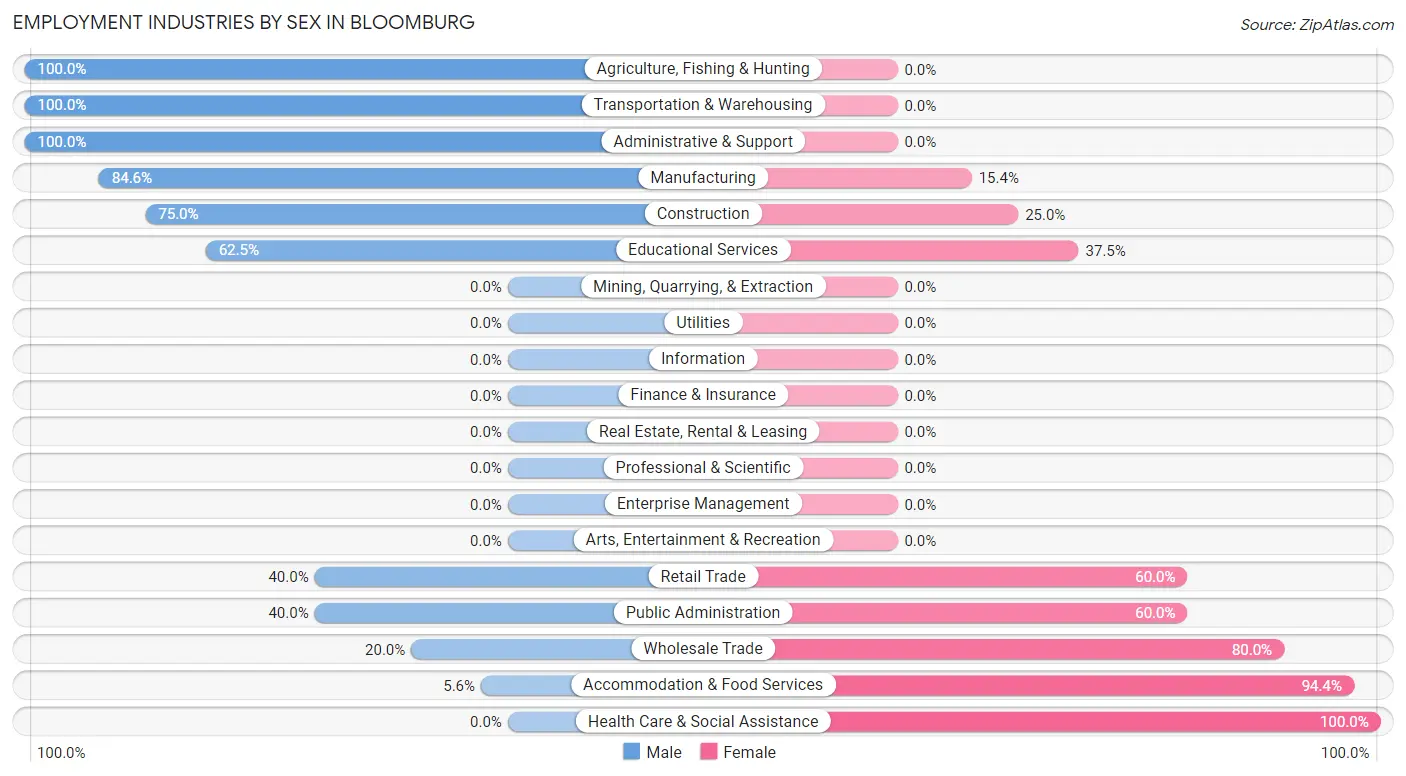
Employment Industries by Sex in Bloomburg
The Bloomburg industries that see more men than women are Agriculture, Fishing & Hunting (100.0%), Transportation & Warehousing (100.0%), and Administrative & Support (100.0%), whereas the industries that tend to have a higher number of women are Health Care & Social Assistance (100.0%), Accommodation & Food Services (94.4%), and Wholesale Trade (80.0%).
| Industry | Male | Female |
| Agriculture, Fishing & Hunting | 2 (100.0%) | 0 (0.0%) |
| Mining, Quarrying, & Extraction | 0 (0.0%) | 0 (0.0%) |
| Construction | 9 (75.0%) | 3 (25.0%) |
| Manufacturing | 11 (84.6%) | 2 (15.4%) |
| Wholesale Trade | 2 (20.0%) | 8 (80.0%) |
| Retail Trade | 2 (40.0%) | 3 (60.0%) |
| Transportation & Warehousing | 3 (100.0%) | 0 (0.0%) |
| Utilities | 0 (0.0%) | 0 (0.0%) |
| Information | 0 (0.0%) | 0 (0.0%) |
| Finance & Insurance | 0 (0.0%) | 0 (0.0%) |
| Real Estate, Rental & Leasing | 0 (0.0%) | 0 (0.0%) |
| Professional & Scientific | 0 (0.0%) | 0 (0.0%) |
| Enterprise Management | 0 (0.0%) | 0 (0.0%) |
| Administrative & Support | 4 (100.0%) | 0 (0.0%) |
| Educational Services | 5 (62.5%) | 3 (37.5%) |
| Health Care & Social Assistance | 0 (0.0%) | 44 (100.0%) |
| Arts, Entertainment & Recreation | 0 (0.0%) | 0 (0.0%) |
| Accommodation & Food Services | 1 (5.6%) | 17 (94.4%) |
| Public Administration | 4 (40.0%) | 6 (60.0%) |
| Total | 47 (34.6%) | 89 (65.4%) |
Education in Bloomburg
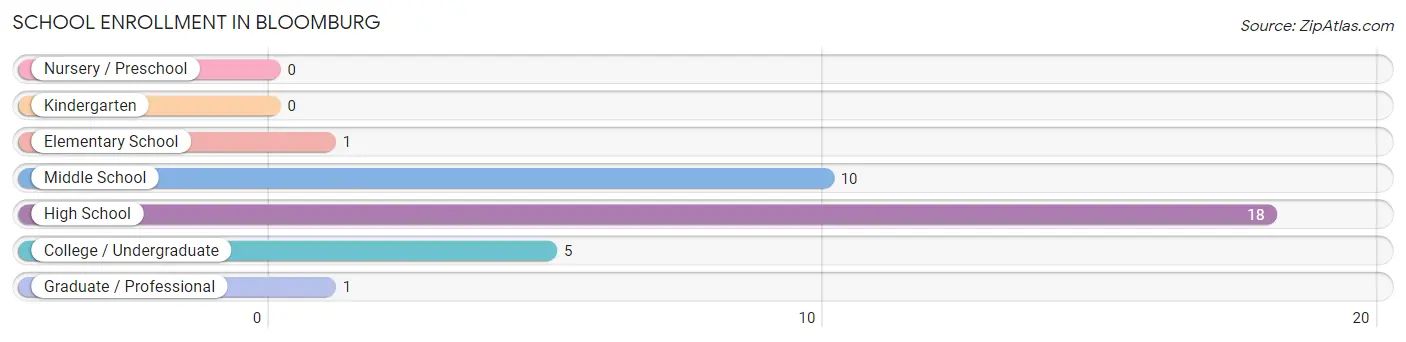
School Enrollment in Bloomburg
The most common levels of schooling among the 35 students in Bloomburg are high school (18 | 51.4%), middle school (10 | 28.6%), and college / undergraduate (5 | 14.3%).
| School Level | # Students | % Students |
| Nursery / Preschool | 0 | 0.0% |
| Kindergarten | 0 | 0.0% |
| Elementary School | 1 | 2.9% |
| Middle School | 10 | 28.6% |
| High School | 18 | 51.4% |
| College / Undergraduate | 5 | 14.3% |
| Graduate / Professional | 1 | 2.9% |
| Total | 35 | 100.0% |
School Enrollment by Age by Funding Source in Bloomburg
Out of a total of 35 students who are enrolled in schools in Bloomburg, 2 (5.7%) attend a private institution, while the remaining 33 (94.3%) are enrolled in public schools. The age group of 35 years and over has the highest likelihood of being enrolled in private schools, with 2 (40.0% in the age bracket) enrolled. Conversely, the age group of 5 to 9 year old has the lowest likelihood of being enrolled in a private school, with 1 (100.0% in the age bracket) attending a public institution.
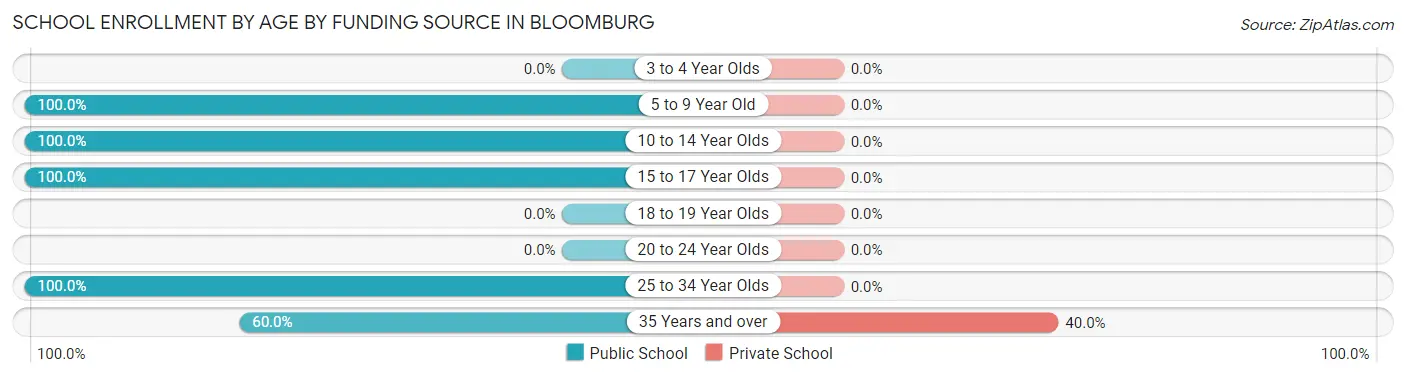
| Age Bracket | Public School | Private School |
| 3 to 4 Year Olds | 0 (0.0%) | 0 (0.0%) |
| 5 to 9 Year Old | 1 (100.0%) | 0 (0.0%) |
| 10 to 14 Year Olds | 12 (100.0%) | 0 (0.0%) |
| 15 to 17 Year Olds | 16 (100.0%) | 0 (0.0%) |
| 18 to 19 Year Olds | 0 (0.0%) | 0 (0.0%) |
| 20 to 24 Year Olds | 0 (0.0%) | 0 (0.0%) |
| 25 to 34 Year Olds | 1 (100.0%) | 0 (0.0%) |
| 35 Years and over | 3 (60.0%) | 2 (40.0%) |
| Total | 33 (94.3%) | 2 (5.7%) |
Educational Attainment by Field of Study in Bloomburg
Education (7 | 28.0%), science & technology (5 | 20.0%), business (5 | 20.0%), bio, nature & agricultural (4 | 16.0%), and engineering (2 | 8.0%) are the most common fields of study among 25 individuals in Bloomburg who have obtained a bachelor's degree or higher.
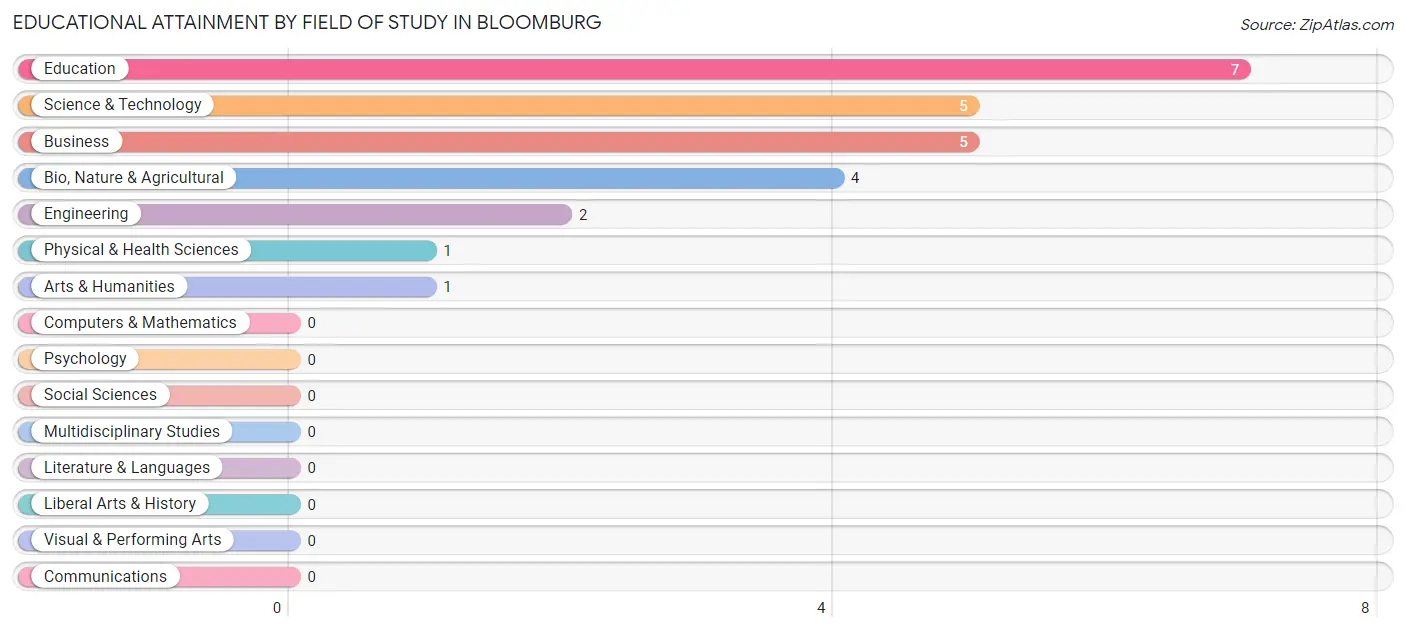
| Field of Study | # Graduates | % Graduates |
| Computers & Mathematics | 0 | 0.0% |
| Bio, Nature & Agricultural | 4 | 16.0% |
| Physical & Health Sciences | 1 | 4.0% |
| Psychology | 0 | 0.0% |
| Social Sciences | 0 | 0.0% |
| Engineering | 2 | 8.0% |
| Multidisciplinary Studies | 0 | 0.0% |
| Science & Technology | 5 | 20.0% |
| Business | 5 | 20.0% |
| Education | 7 | 28.0% |
| Literature & Languages | 0 | 0.0% |
| Liberal Arts & History | 0 | 0.0% |
| Visual & Performing Arts | 0 | 0.0% |
| Communications | 0 | 0.0% |
| Arts & Humanities | 1 | 4.0% |
| Total | 25 | 100.0% |
Transportation & Commute in Bloomburg
Vehicle Availability by Sex in Bloomburg
The most prevalent vehicle ownership categories in Bloomburg are males with 2 vehicles (21, accounting for 44.7%) and females with 2 vehicles (10, making up 23.6%).
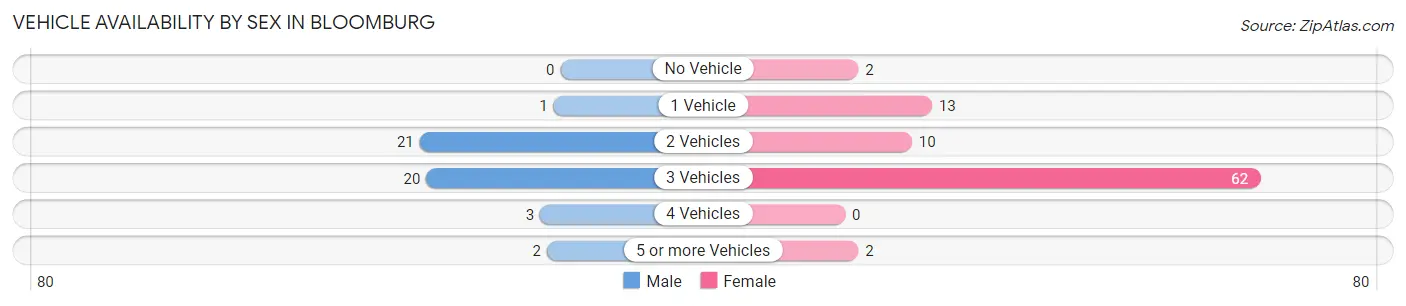
| Vehicles Available | Male | Female |
| No Vehicle | 0 (0.0%) | 2 (2.2%) |
| 1 Vehicle | 1 (2.1%) | 13 (14.6%) |
| 2 Vehicles | 21 (44.7%) | 10 (11.2%) |
| 3 Vehicles | 20 (42.5%) | 62 (69.7%) |
| 4 Vehicles | 3 (6.4%) | 0 (0.0%) |
| 5 or more Vehicles | 2 (4.3%) | 2 (2.2%) |
| Total | 47 (100.0%) | 89 (100.0%) |
Commute Time in Bloomburg
The most frequently occuring commute durations in Bloomburg are 15 to 19 minutes (47 commuters, 35.9%), 5 to 9 minutes (42 commuters, 32.1%), and 30 to 34 minutes (9 commuters, 6.9%).
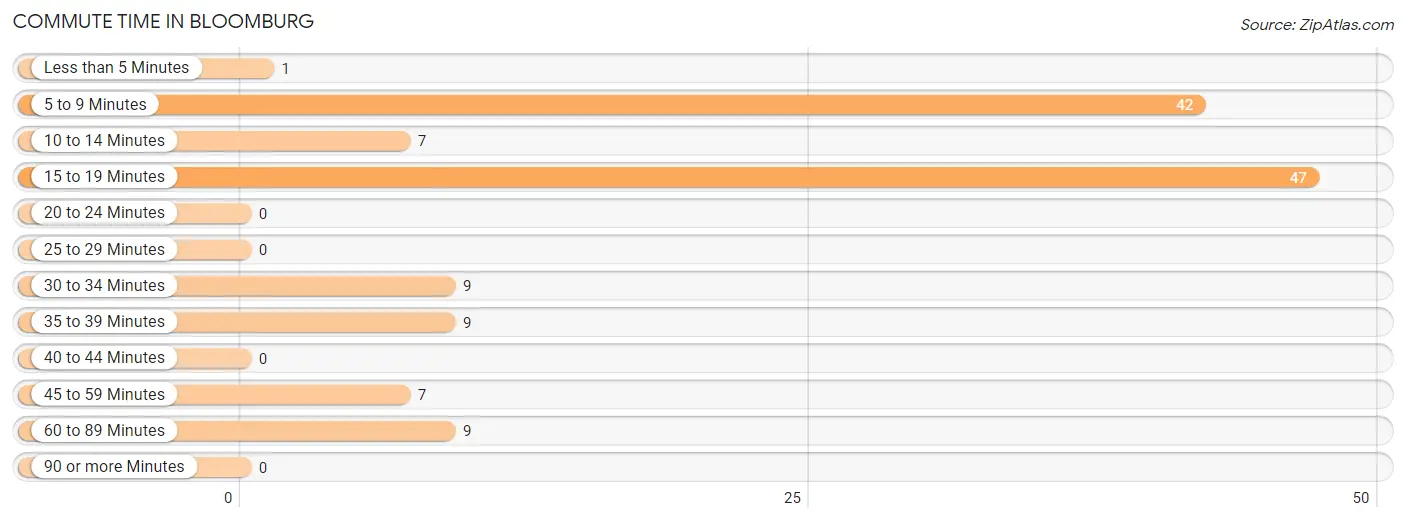
| Commute Time | # Commuters | % Commuters |
| Less than 5 Minutes | 1 | 0.8% |
| 5 to 9 Minutes | 42 | 32.1% |
| 10 to 14 Minutes | 7 | 5.3% |
| 15 to 19 Minutes | 47 | 35.9% |
| 20 to 24 Minutes | 0 | 0.0% |
| 25 to 29 Minutes | 0 | 0.0% |
| 30 to 34 Minutes | 9 | 6.9% |
| 35 to 39 Minutes | 9 | 6.9% |
| 40 to 44 Minutes | 0 | 0.0% |
| 45 to 59 Minutes | 7 | 5.3% |
| 60 to 89 Minutes | 9 | 6.9% |
| 90 or more Minutes | 0 | 0.0% |
Commute Time by Sex in Bloomburg
The most common commute times in Bloomburg are 5 to 9 minutes (23 commuters, 51.1%) for males and 15 to 19 minutes (41 commuters, 47.7%) for females.
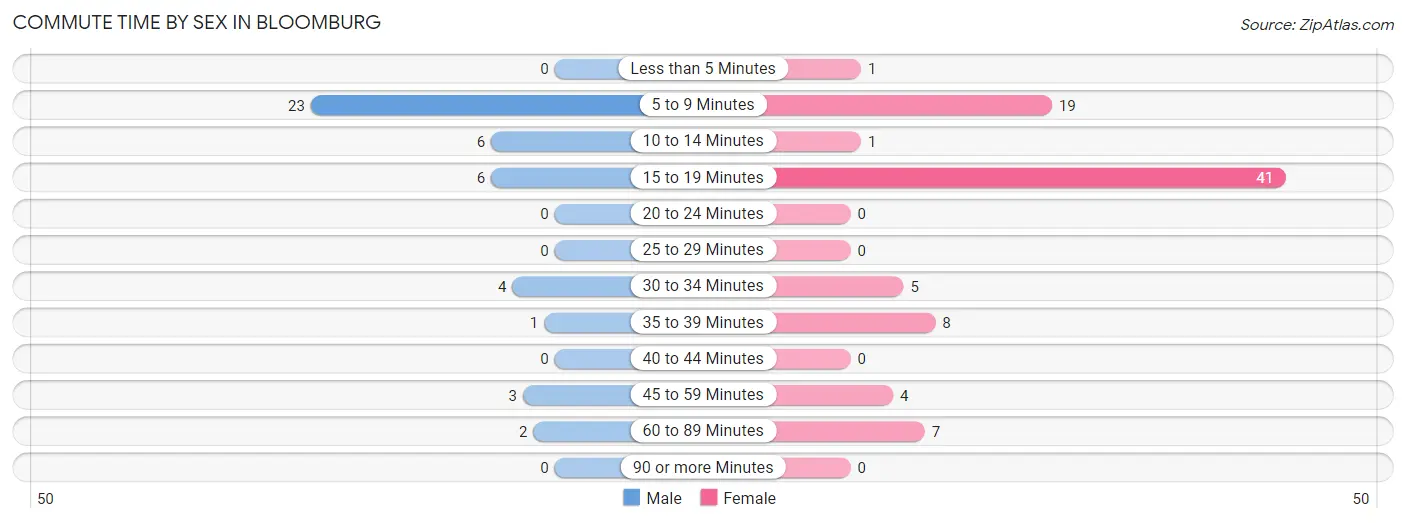
| Commute Time | Male | Female |
| Less than 5 Minutes | 0 (0.0%) | 1 (1.2%) |
| 5 to 9 Minutes | 23 (51.1%) | 19 (22.1%) |
| 10 to 14 Minutes | 6 (13.3%) | 1 (1.2%) |
| 15 to 19 Minutes | 6 (13.3%) | 41 (47.7%) |
| 20 to 24 Minutes | 0 (0.0%) | 0 (0.0%) |
| 25 to 29 Minutes | 0 (0.0%) | 0 (0.0%) |
| 30 to 34 Minutes | 4 (8.9%) | 5 (5.8%) |
| 35 to 39 Minutes | 1 (2.2%) | 8 (9.3%) |
| 40 to 44 Minutes | 0 (0.0%) | 0 (0.0%) |
| 45 to 59 Minutes | 3 (6.7%) | 4 (4.6%) |
| 60 to 89 Minutes | 2 (4.4%) | 7 (8.1%) |
| 90 or more Minutes | 0 (0.0%) | 0 (0.0%) |
Time of Departure to Work by Sex in Bloomburg
The most frequent times of departure to work in Bloomburg are 6:30 AM to 6:59 AM (23, 51.1%) for males and 12:00 PM to 3:59 PM (28, 32.6%) for females.
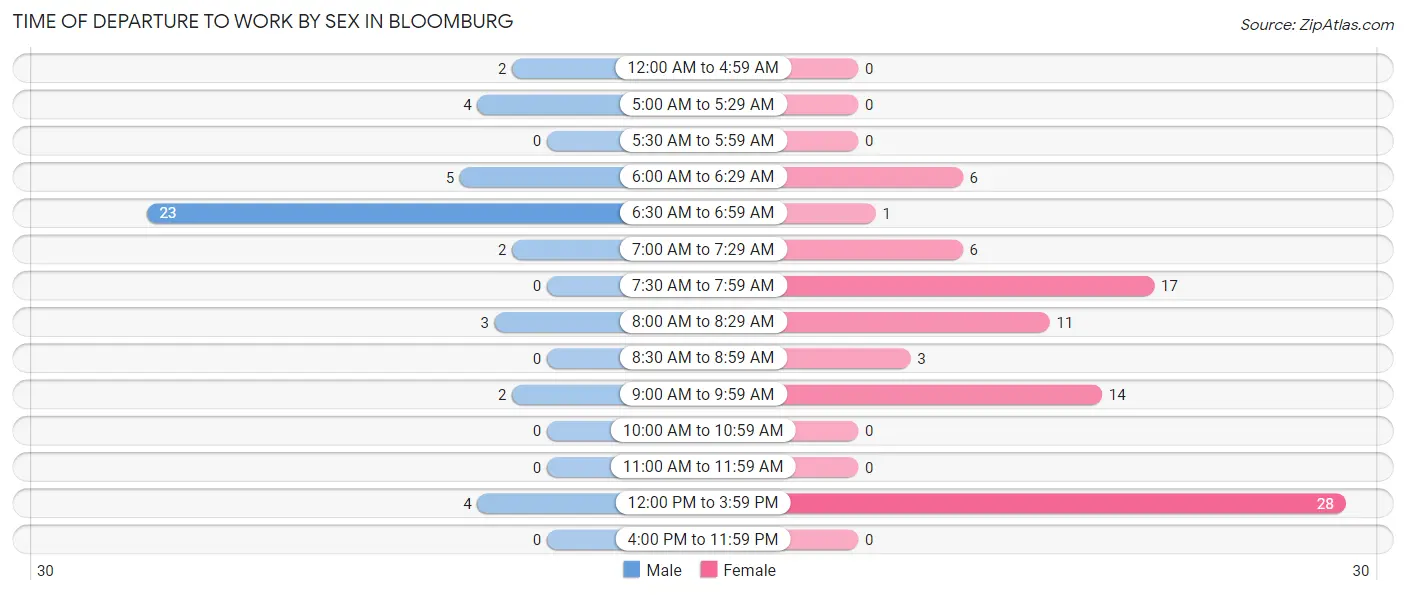
| Time of Departure | Male | Female |
| 12:00 AM to 4:59 AM | 2 (4.4%) | 0 (0.0%) |
| 5:00 AM to 5:29 AM | 4 (8.9%) | 0 (0.0%) |
| 5:30 AM to 5:59 AM | 0 (0.0%) | 0 (0.0%) |
| 6:00 AM to 6:29 AM | 5 (11.1%) | 6 (7.0%) |
| 6:30 AM to 6:59 AM | 23 (51.1%) | 1 (1.2%) |
| 7:00 AM to 7:29 AM | 2 (4.4%) | 6 (7.0%) |
| 7:30 AM to 7:59 AM | 0 (0.0%) | 17 (19.8%) |
| 8:00 AM to 8:29 AM | 3 (6.7%) | 11 (12.8%) |
| 8:30 AM to 8:59 AM | 0 (0.0%) | 3 (3.5%) |
| 9:00 AM to 9:59 AM | 2 (4.4%) | 14 (16.3%) |
| 10:00 AM to 10:59 AM | 0 (0.0%) | 0 (0.0%) |
| 11:00 AM to 11:59 AM | 0 (0.0%) | 0 (0.0%) |
| 12:00 PM to 3:59 PM | 4 (8.9%) | 28 (32.6%) |
| 4:00 PM to 11:59 PM | 0 (0.0%) | 0 (0.0%) |
| Total | 45 (100.0%) | 86 (100.0%) |
Housing Occupancy in Bloomburg
Occupancy by Ownership in Bloomburg
Of the total 122 dwellings in Bloomburg, owner-occupied units account for 105 (86.1%), while renter-occupied units make up 17 (13.9%).
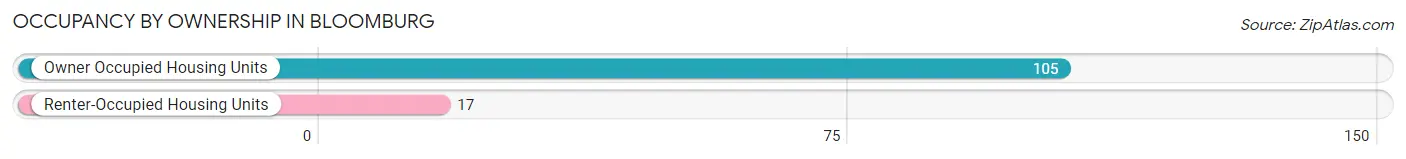
| Occupancy | # Housing Units | % Housing Units |
| Owner Occupied Housing Units | 105 | 86.1% |
| Renter-Occupied Housing Units | 17 | 13.9% |
| Total Occupied Housing Units | 122 | 100.0% |
Occupancy by Household Size in Bloomburg
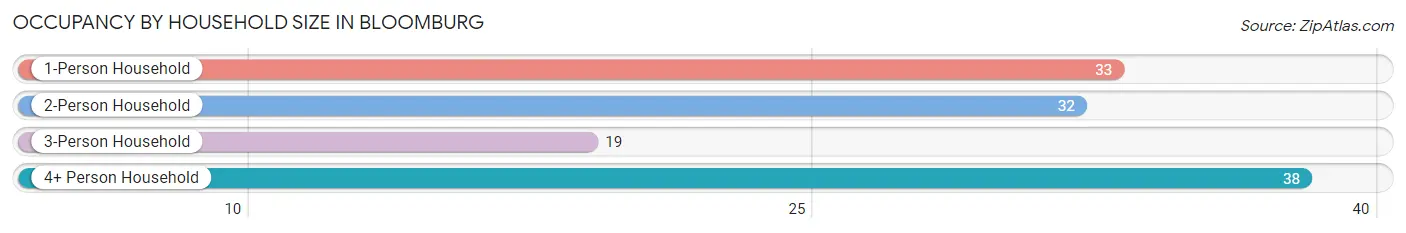
| Household Size | # Housing Units | % Housing Units |
| 1-Person Household | 33 | 27.1% |
| 2-Person Household | 32 | 26.2% |
| 3-Person Household | 19 | 15.6% |
| 4+ Person Household | 38 | 31.1% |
| Total Housing Units | 122 | 100.0% |
Occupancy by Ownership by Household Size in Bloomburg
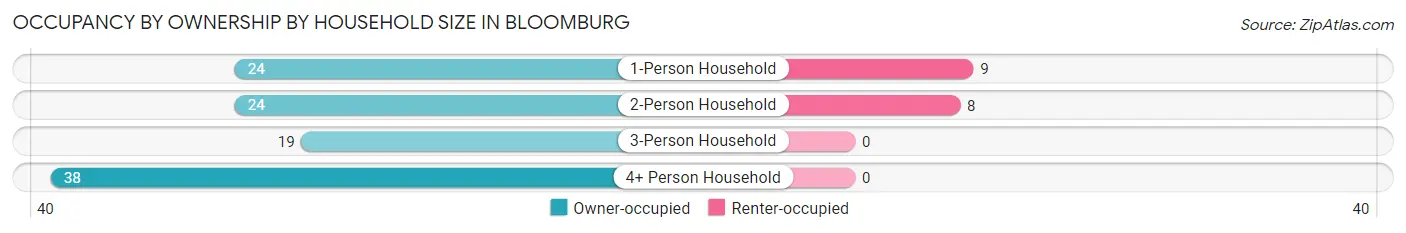
| Household Size | Owner-occupied | Renter-occupied |
| 1-Person Household | 24 (72.7%) | 9 (27.3%) |
| 2-Person Household | 24 (75.0%) | 8 (25.0%) |
| 3-Person Household | 19 (100.0%) | 0 (0.0%) |
| 4+ Person Household | 38 (100.0%) | 0 (0.0%) |
| Total Housing Units | 105 (86.1%) | 17 (13.9%) |
Occupancy by Educational Attainment in Bloomburg
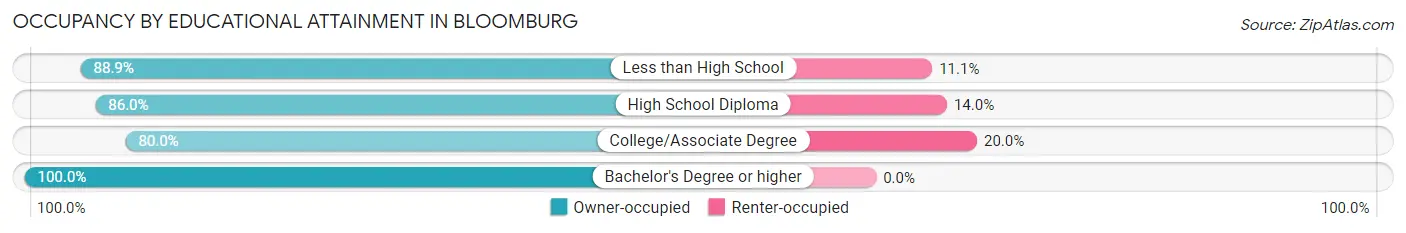
| Household Size | Owner-occupied | Renter-occupied |
| Less than High School | 8 (88.9%) | 1 (11.1%) |
| High School Diploma | 49 (86.0%) | 8 (14.0%) |
| College/Associate Degree | 32 (80.0%) | 8 (20.0%) |
| Bachelor's Degree or higher | 16 (100.0%) | 0 (0.0%) |
Occupancy by Age of Householder in Bloomburg
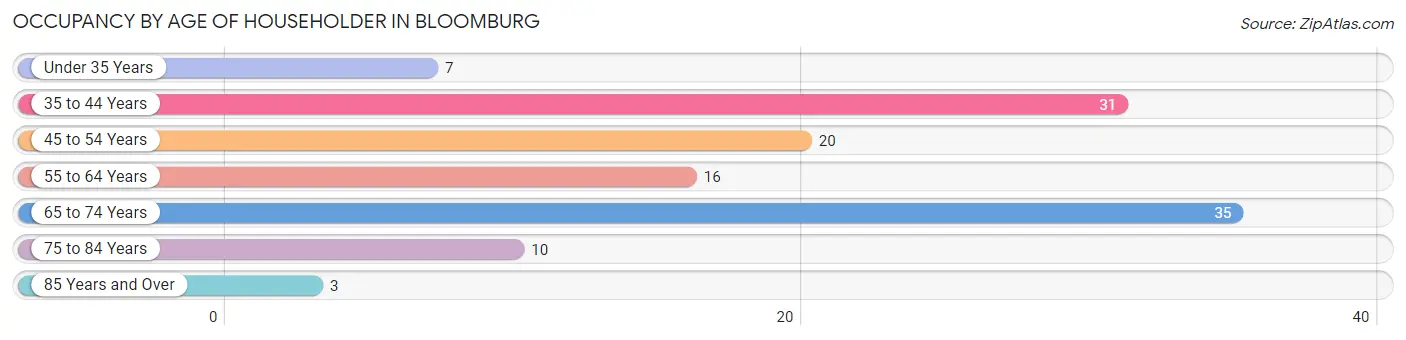
| Age Bracket | # Households | % Households |
| Under 35 Years | 7 | 5.7% |
| 35 to 44 Years | 31 | 25.4% |
| 45 to 54 Years | 20 | 16.4% |
| 55 to 64 Years | 16 | 13.1% |
| 65 to 74 Years | 35 | 28.7% |
| 75 to 84 Years | 10 | 8.2% |
| 85 Years and Over | 3 | 2.5% |
| Total | 122 | 100.0% |
Housing Finances in Bloomburg
Median Income by Occupancy in Bloomburg
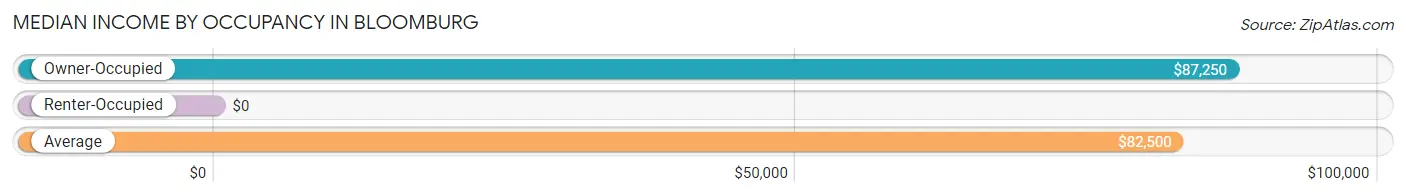
| Occupancy Type | # Households | Median Income |
| Owner-Occupied | 105 (86.1%) | $87,250 |
| Renter-Occupied | 17 (13.9%) | $0 |
| Average | 122 (100.0%) | $82,500 |
Occupancy by Householder Income Bracket in Bloomburg
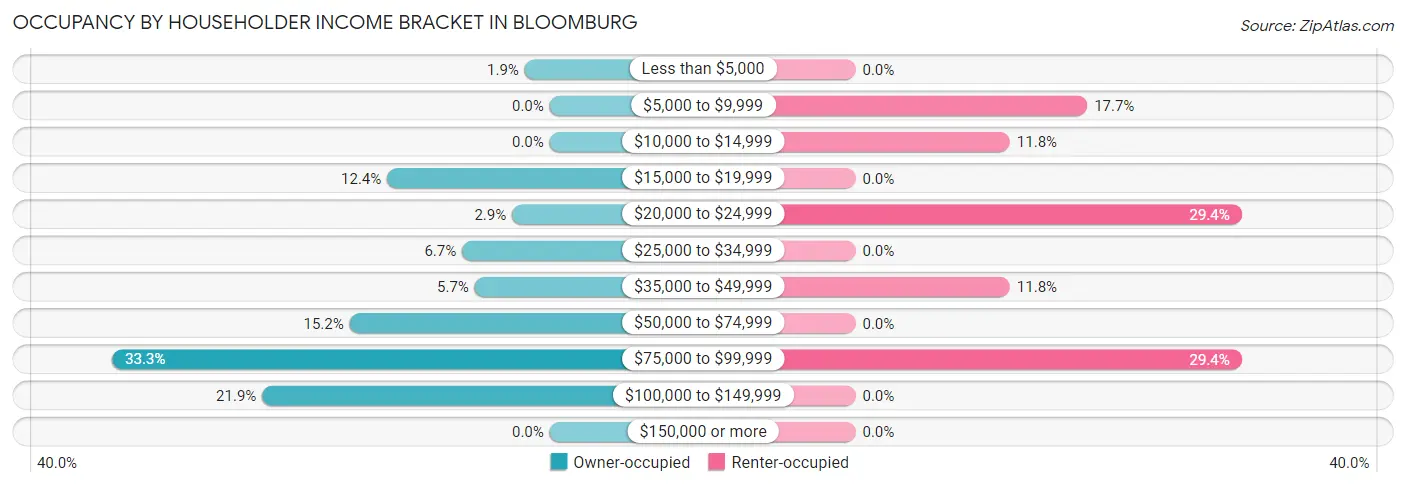
| Income Bracket | Owner-occupied | Renter-occupied |
| Less than $5,000 | 2 (1.9%) | 0 (0.0%) |
| $5,000 to $9,999 | 0 (0.0%) | 3 (17.6%) |
| $10,000 to $14,999 | 0 (0.0%) | 2 (11.8%) |
| $15,000 to $19,999 | 13 (12.4%) | 0 (0.0%) |
| $20,000 to $24,999 | 3 (2.9%) | 5 (29.4%) |
| $25,000 to $34,999 | 7 (6.7%) | 0 (0.0%) |
| $35,000 to $49,999 | 6 (5.7%) | 2 (11.8%) |
| $50,000 to $74,999 | 16 (15.2%) | 0 (0.0%) |
| $75,000 to $99,999 | 35 (33.3%) | 5 (29.4%) |
| $100,000 to $149,999 | 23 (21.9%) | 0 (0.0%) |
| $150,000 or more | 0 (0.0%) | 0 (0.0%) |
| Total | 105 (100.0%) | 17 (100.0%) |
Monthly Housing Cost Tiers in Bloomburg
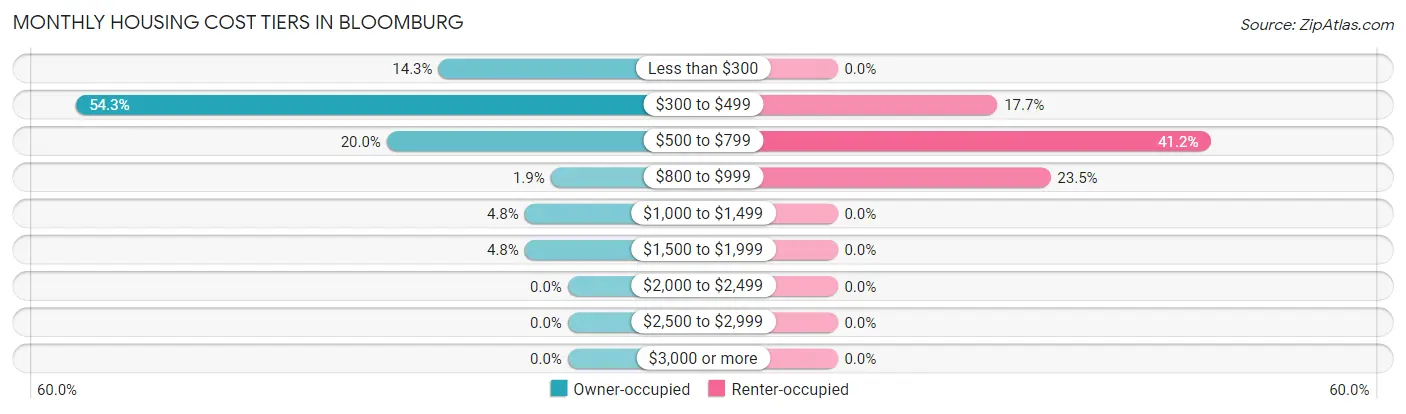
| Monthly Cost | Owner-occupied | Renter-occupied |
| Less than $300 | 15 (14.3%) | 0 (0.0%) |
| $300 to $499 | 57 (54.3%) | 3 (17.6%) |
| $500 to $799 | 21 (20.0%) | 7 (41.2%) |
| $800 to $999 | 2 (1.9%) | 4 (23.5%) |
| $1,000 to $1,499 | 5 (4.8%) | 0 (0.0%) |
| $1,500 to $1,999 | 5 (4.8%) | 0 (0.0%) |
| $2,000 to $2,499 | 0 (0.0%) | 0 (0.0%) |
| $2,500 to $2,999 | 0 (0.0%) | 0 (0.0%) |
| $3,000 or more | 0 (0.0%) | 0 (0.0%) |
| Total | 105 (100.0%) | 17 (100.0%) |
Physical Housing Characteristics in Bloomburg
Housing Structures in Bloomburg
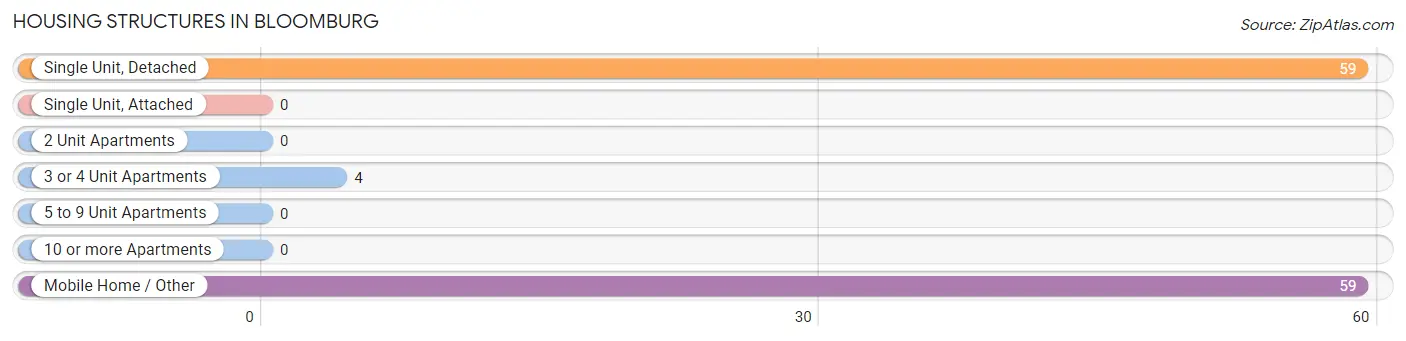
| Structure Type | # Housing Units | % Housing Units |
| Single Unit, Detached | 59 | 48.4% |
| Single Unit, Attached | 0 | 0.0% |
| 2 Unit Apartments | 0 | 0.0% |
| 3 or 4 Unit Apartments | 4 | 3.3% |
| 5 to 9 Unit Apartments | 0 | 0.0% |
| 10 or more Apartments | 0 | 0.0% |
| Mobile Home / Other | 59 | 48.4% |
| Total | 122 | 100.0% |
Housing Structures by Occupancy in Bloomburg
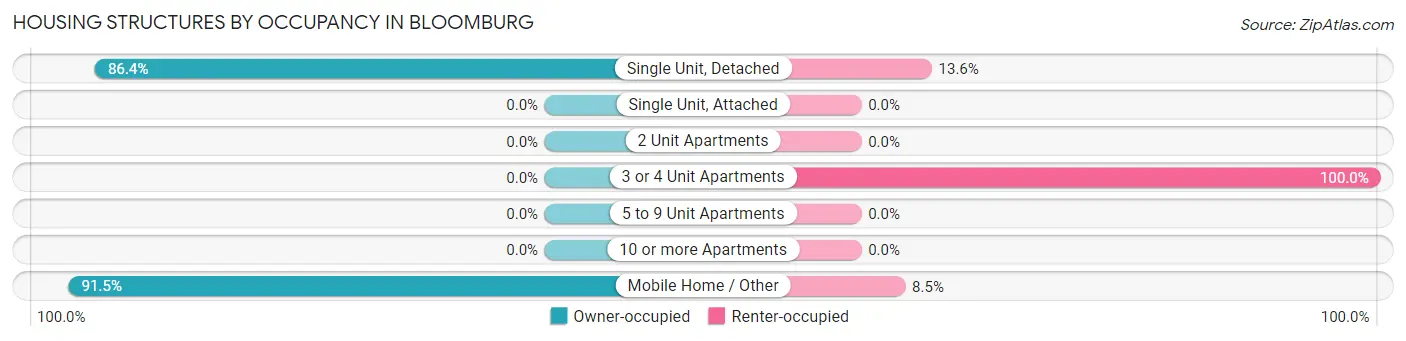
| Structure Type | Owner-occupied | Renter-occupied |
| Single Unit, Detached | 51 (86.4%) | 8 (13.6%) |
| Single Unit, Attached | 0 (0.0%) | 0 (0.0%) |
| 2 Unit Apartments | 0 (0.0%) | 0 (0.0%) |
| 3 or 4 Unit Apartments | 0 (0.0%) | 4 (100.0%) |
| 5 to 9 Unit Apartments | 0 (0.0%) | 0 (0.0%) |
| 10 or more Apartments | 0 (0.0%) | 0 (0.0%) |
| Mobile Home / Other | 54 (91.5%) | 5 (8.5%) |
| Total | 105 (86.1%) | 17 (13.9%) |
Housing Structures by Number of Rooms in Bloomburg
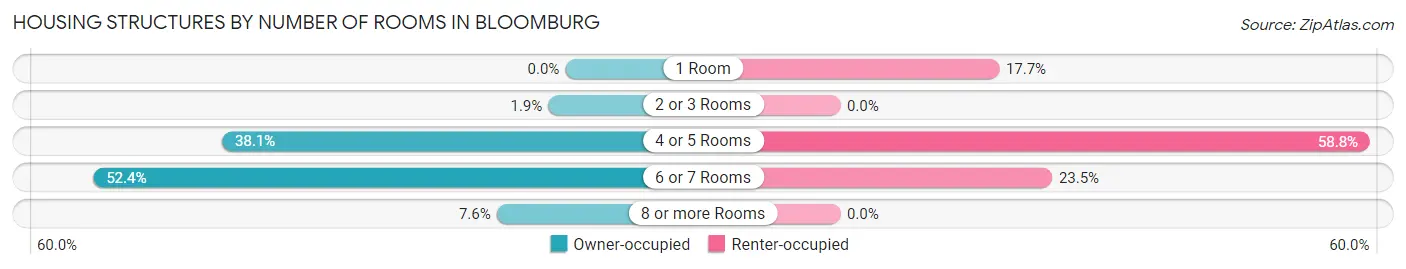
| Number of Rooms | Owner-occupied | Renter-occupied |
| 1 Room | 0 (0.0%) | 3 (17.6%) |
| 2 or 3 Rooms | 2 (1.9%) | 0 (0.0%) |
| 4 or 5 Rooms | 40 (38.1%) | 10 (58.8%) |
| 6 or 7 Rooms | 55 (52.4%) | 4 (23.5%) |
| 8 or more Rooms | 8 (7.6%) | 0 (0.0%) |
| Total | 105 (100.0%) | 17 (100.0%) |
Housing Structure by Heating Type in Bloomburg
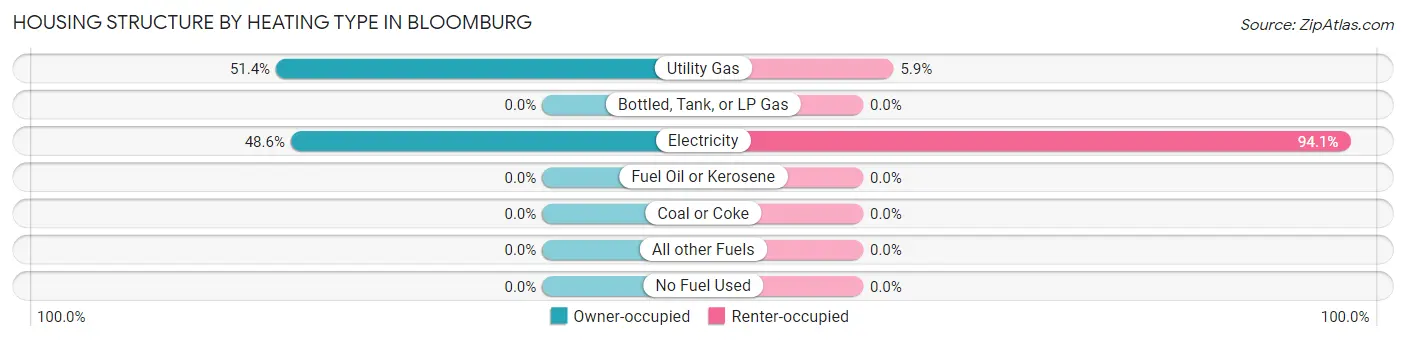
| Heating Type | Owner-occupied | Renter-occupied |
| Utility Gas | 54 (51.4%) | 1 (5.9%) |
| Bottled, Tank, or LP Gas | 0 (0.0%) | 0 (0.0%) |
| Electricity | 51 (48.6%) | 16 (94.1%) |
| Fuel Oil or Kerosene | 0 (0.0%) | 0 (0.0%) |
| Coal or Coke | 0 (0.0%) | 0 (0.0%) |
| All other Fuels | 0 (0.0%) | 0 (0.0%) |
| No Fuel Used | 0 (0.0%) | 0 (0.0%) |
| Total | 105 (100.0%) | 17 (100.0%) |
Household Vehicle Usage in Bloomburg
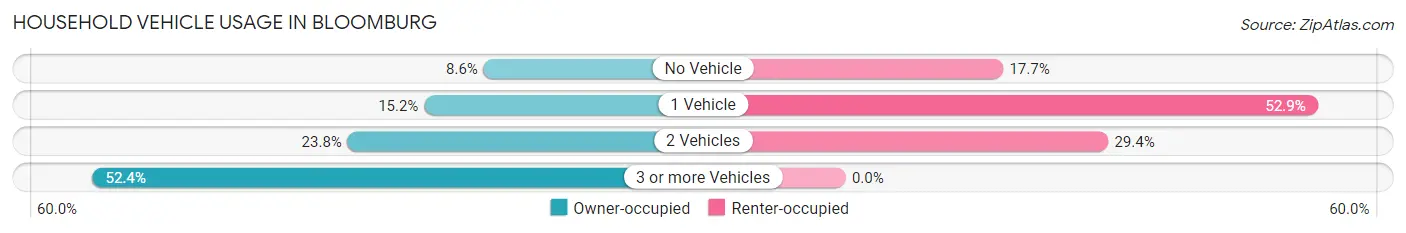
| Vehicles per Household | Owner-occupied | Renter-occupied |
| No Vehicle | 9 (8.6%) | 3 (17.6%) |
| 1 Vehicle | 16 (15.2%) | 9 (52.9%) |
| 2 Vehicles | 25 (23.8%) | 5 (29.4%) |
| 3 or more Vehicles | 55 (52.4%) | 0 (0.0%) |
| Total | 105 (100.0%) | 17 (100.0%) |
Real Estate & Mortgages in Bloomburg
Real Estate and Mortgage Overview in Bloomburg
| Characteristic | Without Mortgage | With Mortgage |
| Housing Units | 93 | 12 |
| Median Property Value | $63,800 | $143,800 |
| Median Household Income | $86,750 | $0 |
| Monthly Housing Costs | $352 | $0 |
| Real Estate Taxes | $1,136 | $0 |
Property Value by Mortgage Status in Bloomburg
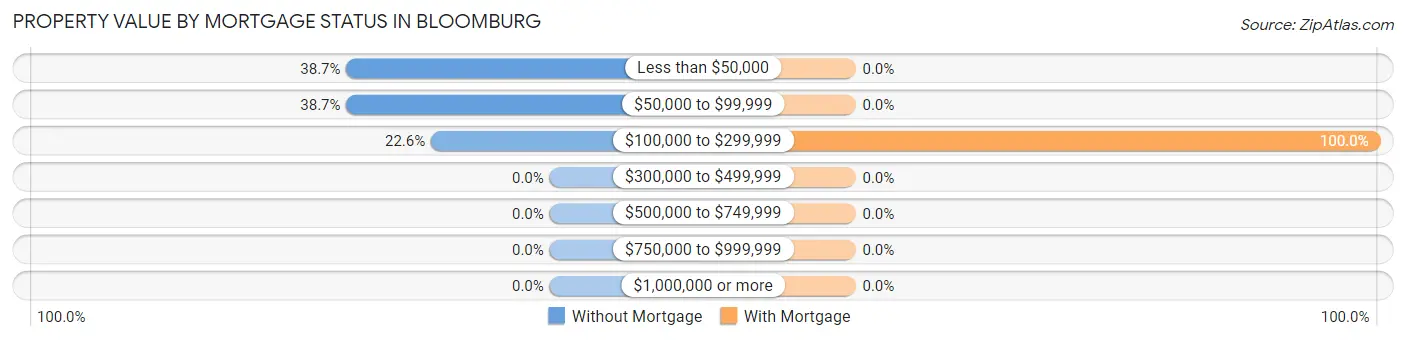
| Property Value | Without Mortgage | With Mortgage |
| Less than $50,000 | 36 (38.7%) | 0 (0.0%) |
| $50,000 to $99,999 | 36 (38.7%) | 0 (0.0%) |
| $100,000 to $299,999 | 21 (22.6%) | 12 (100.0%) |
| $300,000 to $499,999 | 0 (0.0%) | 0 (0.0%) |
| $500,000 to $749,999 | 0 (0.0%) | 0 (0.0%) |
| $750,000 to $999,999 | 0 (0.0%) | 0 (0.0%) |
| $1,000,000 or more | 0 (0.0%) | 0 (0.0%) |
| Total | 93 (100.0%) | 12 (100.0%) |
Household Income by Mortgage Status in Bloomburg
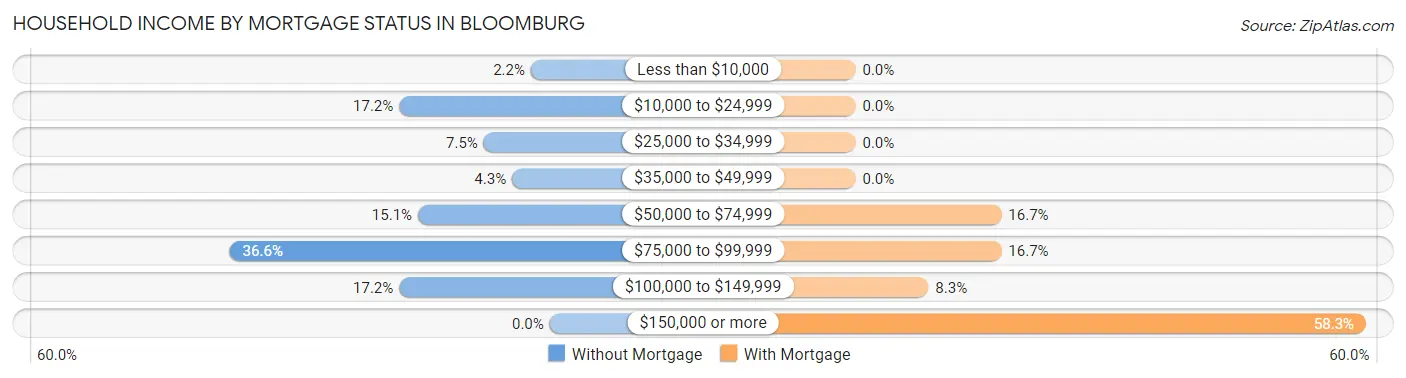
| Household Income | Without Mortgage | With Mortgage |
| Less than $10,000 | 2 (2.1%) | 0 (0.0%) |
| $10,000 to $24,999 | 16 (17.2%) | 0 (0.0%) |
| $25,000 to $34,999 | 7 (7.5%) | 0 (0.0%) |
| $35,000 to $49,999 | 4 (4.3%) | 0 (0.0%) |
| $50,000 to $74,999 | 14 (15.0%) | 2 (16.7%) |
| $75,000 to $99,999 | 34 (36.6%) | 2 (16.7%) |
| $100,000 to $149,999 | 16 (17.2%) | 1 (8.3%) |
| $150,000 or more | 0 (0.0%) | 7 (58.3%) |
| Total | 93 (100.0%) | 12 (100.0%) |
Property Value to Household Income Ratio in Bloomburg
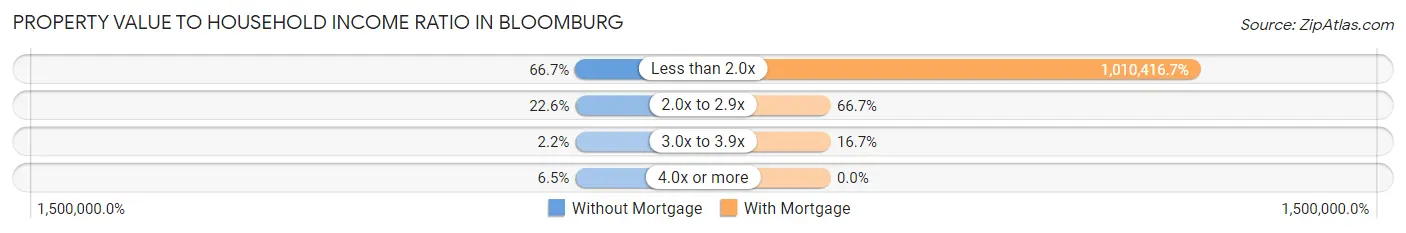
| Value-to-Income Ratio | Without Mortgage | With Mortgage |
| Less than 2.0x | 62 (66.7%) | 121,250 (1,010,416.7%) |
| 2.0x to 2.9x | 21 (22.6%) | 8 (66.7%) |
| 3.0x to 3.9x | 2 (2.1%) | 2 (16.7%) |
| 4.0x or more | 6 (6.5%) | 0 (0.0%) |
| Total | 93 (100.0%) | 12 (100.0%) |
Real Estate Taxes by Mortgage Status in Bloomburg
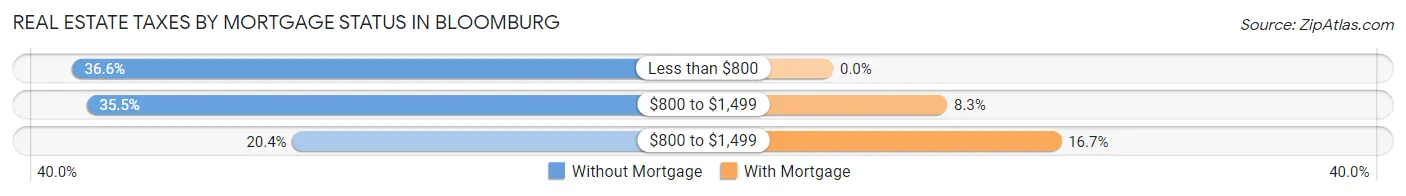
| Property Taxes | Without Mortgage | With Mortgage |
| Less than $800 | 34 (36.6%) | 0 (0.0%) |
| $800 to $1,499 | 33 (35.5%) | 1 (8.3%) |
| $800 to $1,499 | 19 (20.4%) | 2 (16.7%) |
| Total | 93 (100.0%) | 12 (100.0%) |
Health & Disability in Bloomburg
Health Insurance Coverage by Age in Bloomburg
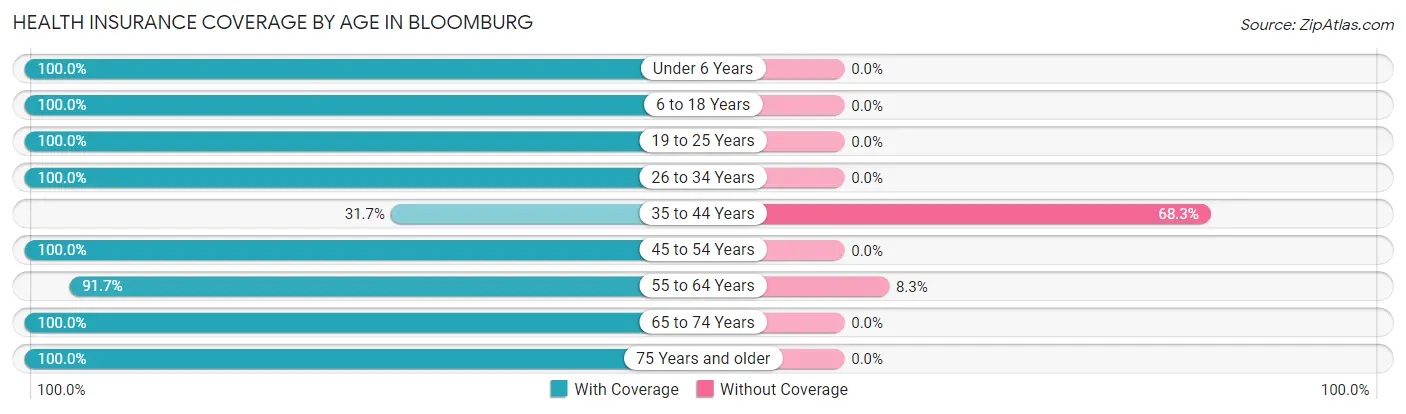
| Age Bracket | With Coverage | Without Coverage |
| Under 6 Years | 44 (100.0%) | 0 (0.0%) |
| 6 to 18 Years | 29 (100.0%) | 0 (0.0%) |
| 19 to 25 Years | 21 (100.0%) | 0 (0.0%) |
| 26 to 34 Years | 13 (100.0%) | 0 (0.0%) |
| 35 to 44 Years | 13 (31.7%) | 28 (68.3%) |
| 45 to 54 Years | 34 (100.0%) | 0 (0.0%) |
| 55 to 64 Years | 22 (91.7%) | 2 (8.3%) |
| 65 to 74 Years | 60 (100.0%) | 0 (0.0%) |
| 75 Years and older | 22 (100.0%) | 0 (0.0%) |
| Total | 258 (89.6%) | 30 (10.4%) |
Health Insurance Coverage by Citizenship Status in Bloomburg
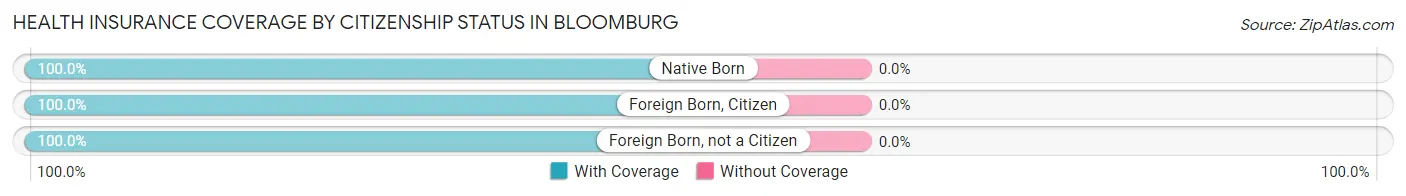
| Citizenship Status | With Coverage | Without Coverage |
| Native Born | 44 (100.0%) | 0 (0.0%) |
| Foreign Born, Citizen | 29 (100.0%) | 0 (0.0%) |
| Foreign Born, not a Citizen | 21 (100.0%) | 0 (0.0%) |
Health Insurance Coverage by Household Income in Bloomburg
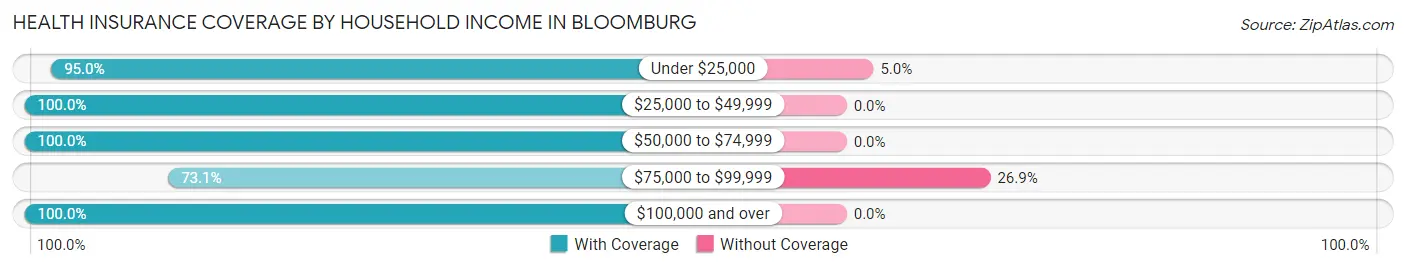
| Household Income | With Coverage | Without Coverage |
| Under $25,000 | 38 (95.0%) | 2 (5.0%) |
| $25,000 to $49,999 | 29 (100.0%) | 0 (0.0%) |
| $50,000 to $74,999 | 55 (100.0%) | 0 (0.0%) |
| $75,000 to $99,999 | 76 (73.1%) | 28 (26.9%) |
| $100,000 and over | 60 (100.0%) | 0 (0.0%) |
Public vs Private Health Insurance Coverage by Age in Bloomburg
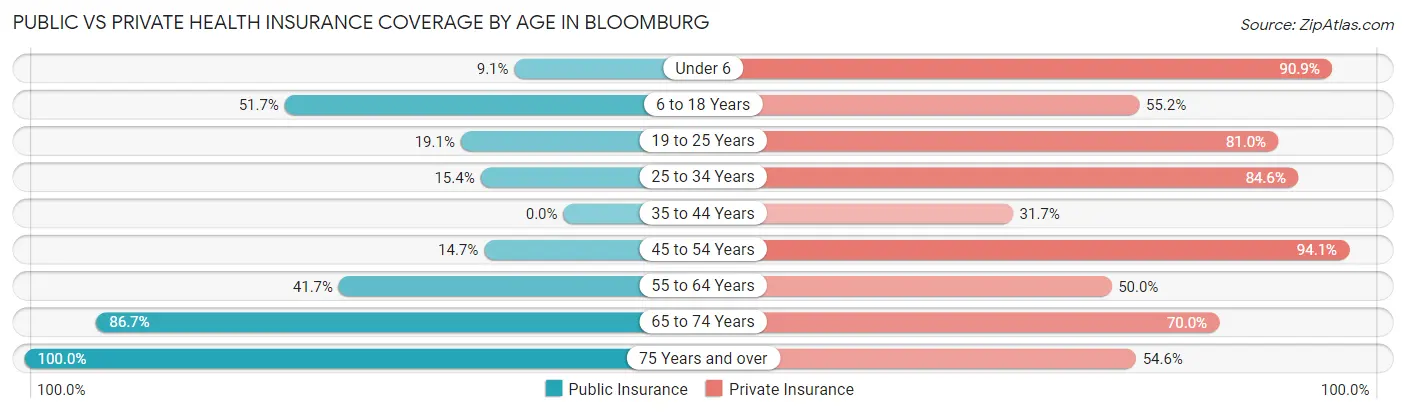
| Age Bracket | Public Insurance | Private Insurance |
| Under 6 | 4 (9.1%) | 40 (90.9%) |
| 6 to 18 Years | 15 (51.7%) | 16 (55.2%) |
| 19 to 25 Years | 4 (19.1%) | 17 (80.9%) |
| 25 to 34 Years | 2 (15.4%) | 11 (84.6%) |
| 35 to 44 Years | 0 (0.0%) | 13 (31.7%) |
| 45 to 54 Years | 5 (14.7%) | 32 (94.1%) |
| 55 to 64 Years | 10 (41.7%) | 12 (50.0%) |
| 65 to 74 Years | 52 (86.7%) | 42 (70.0%) |
| 75 Years and over | 22 (100.0%) | 12 (54.5%) |
| Total | 114 (39.6%) | 195 (67.7%) |
Disability Status by Sex by Age in Bloomburg
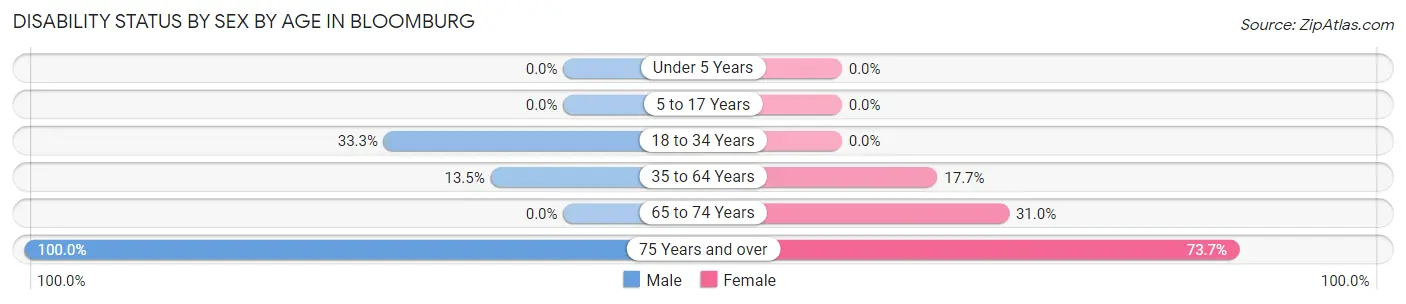
| Age Bracket | Male | Female |
| Under 5 Years | 0 (0.0%) | 0 (0.0%) |
| 5 to 17 Years | 0 (0.0%) | 0 (0.0%) |
| 18 to 34 Years | 3 (33.3%) | 0 (0.0%) |
| 35 to 64 Years | 5 (13.5%) | 11 (17.7%) |
| 65 to 74 Years | 0 (0.0%) | 9 (31.0%) |
| 75 Years and over | 3 (100.0%) | 14 (73.7%) |
Disability Class by Sex by Age in Bloomburg
Disability Class: Hearing Difficulty
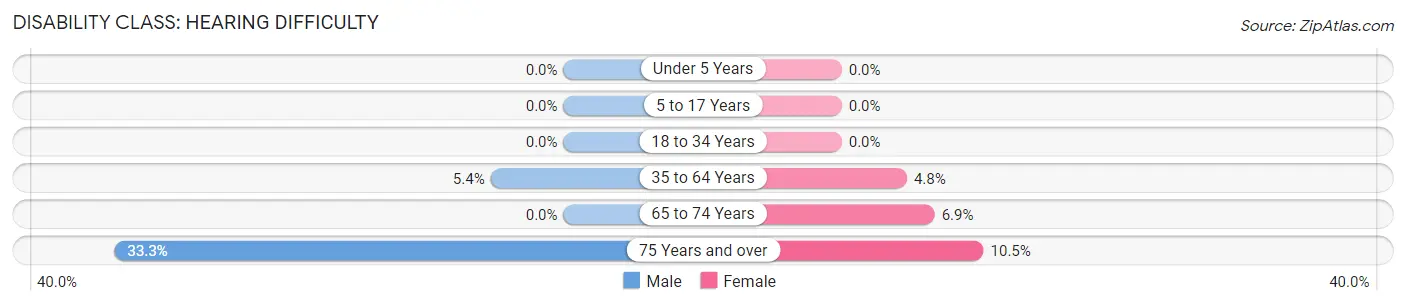
| Age Bracket | Male | Female |
| Under 5 Years | 0 (0.0%) | 0 (0.0%) |
| 5 to 17 Years | 0 (0.0%) | 0 (0.0%) |
| 18 to 34 Years | 0 (0.0%) | 0 (0.0%) |
| 35 to 64 Years | 2 (5.4%) | 3 (4.8%) |
| 65 to 74 Years | 0 (0.0%) | 2 (6.9%) |
| 75 Years and over | 1 (33.3%) | 2 (10.5%) |
Disability Class: Vision Difficulty
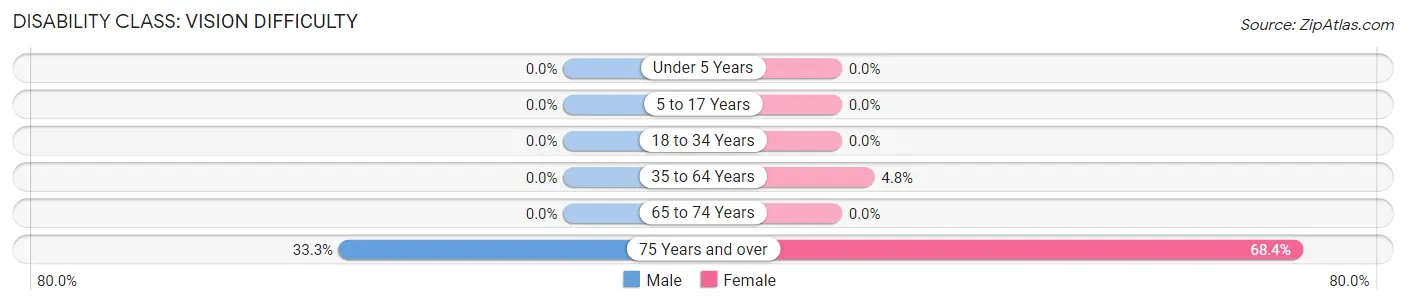
| Age Bracket | Male | Female |
| Under 5 Years | 0 (0.0%) | 0 (0.0%) |
| 5 to 17 Years | 0 (0.0%) | 0 (0.0%) |
| 18 to 34 Years | 0 (0.0%) | 0 (0.0%) |
| 35 to 64 Years | 0 (0.0%) | 3 (4.8%) |
| 65 to 74 Years | 0 (0.0%) | 0 (0.0%) |
| 75 Years and over | 1 (33.3%) | 13 (68.4%) |
Disability Class: Cognitive Difficulty
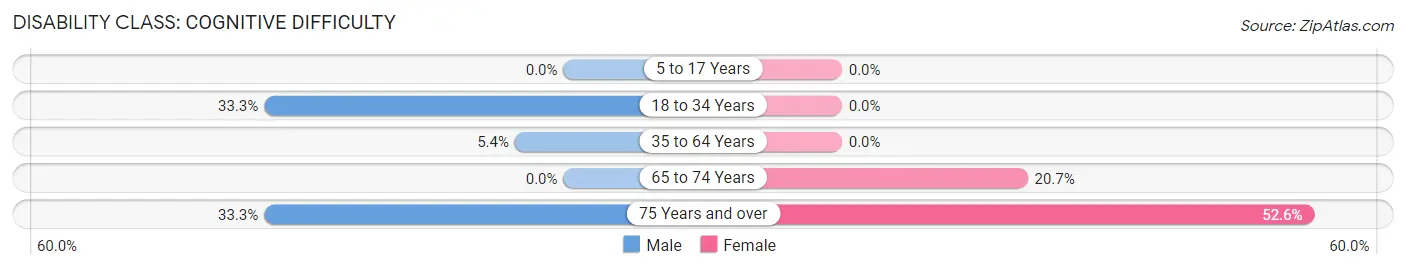
| Age Bracket | Male | Female |
| 5 to 17 Years | 0 (0.0%) | 0 (0.0%) |
| 18 to 34 Years | 3 (33.3%) | 0 (0.0%) |
| 35 to 64 Years | 2 (5.4%) | 0 (0.0%) |
| 65 to 74 Years | 0 (0.0%) | 6 (20.7%) |
| 75 Years and over | 1 (33.3%) | 10 (52.6%) |
Disability Class: Ambulatory Difficulty
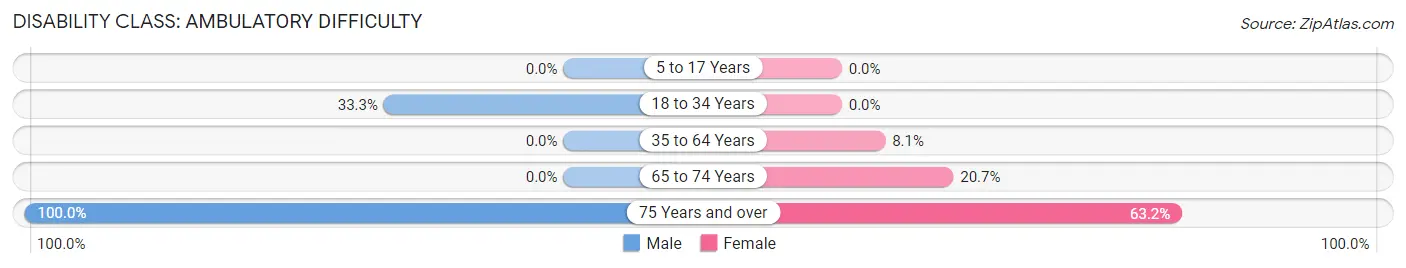
| Age Bracket | Male | Female |
| 5 to 17 Years | 0 (0.0%) | 0 (0.0%) |
| 18 to 34 Years | 3 (33.3%) | 0 (0.0%) |
| 35 to 64 Years | 0 (0.0%) | 5 (8.1%) |
| 65 to 74 Years | 0 (0.0%) | 6 (20.7%) |
| 75 Years and over | 3 (100.0%) | 12 (63.2%) |
Disability Class: Self-Care Difficulty
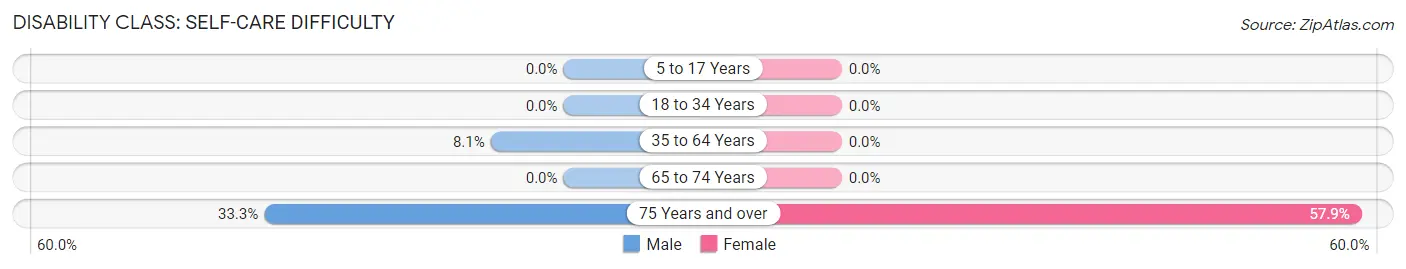
| Age Bracket | Male | Female |
| 5 to 17 Years | 0 (0.0%) | 0 (0.0%) |
| 18 to 34 Years | 0 (0.0%) | 0 (0.0%) |
| 35 to 64 Years | 3 (8.1%) | 0 (0.0%) |
| 65 to 74 Years | 0 (0.0%) | 0 (0.0%) |
| 75 Years and over | 1 (33.3%) | 11 (57.9%) |
Technology Access in Bloomburg
Computing Device Access in Bloomburg
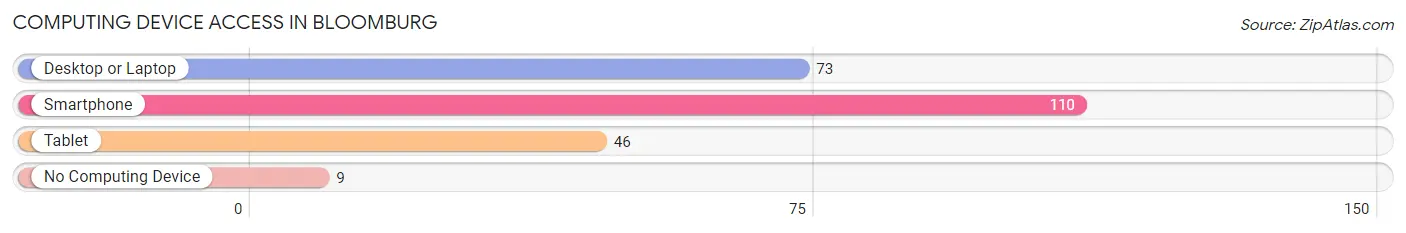
| Device Type | # Households | % Households |
| Desktop or Laptop | 73 | 59.8% |
| Smartphone | 110 | 90.2% |
| Tablet | 46 | 37.7% |
| No Computing Device | 9 | 7.4% |
| Total | 122 | 100.0% |
Internet Access in Bloomburg
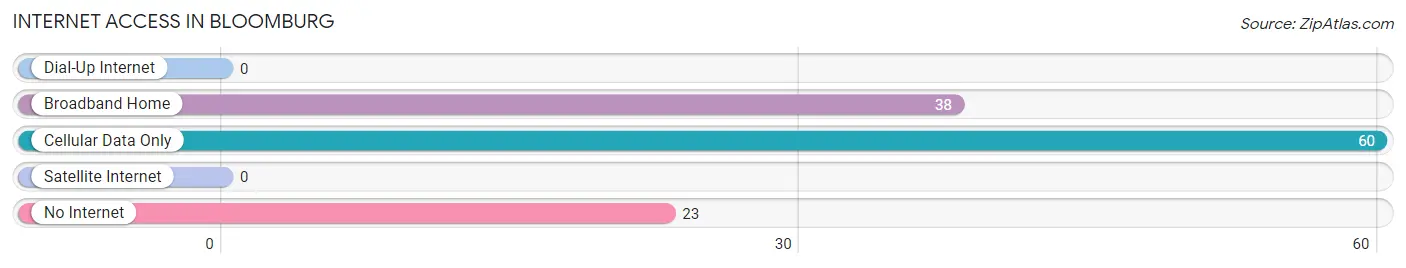
| Internet Type | # Households | % Households |
| Dial-Up Internet | 0 | 0.0% |
| Broadband Home | 38 | 31.1% |
| Cellular Data Only | 60 | 49.2% |
| Satellite Internet | 0 | 0.0% |
| No Internet | 23 | 18.9% |
| Total | 122 | 100.0% |
Bloomburg Summary
Bloomburg is a small town located in the northeast corner of Texas, in the county of Bowie. It is situated on the banks of the Red River, and is part of the Texarkana metropolitan area. The town has a population of just over 1,000 people, and is known for its rural charm and friendly atmosphere.
History
Bloomburg was founded in 1872 by a group of settlers from Arkansas. The town was named after one of the settlers, William Bloom, who was a prominent local businessman. The town quickly grew, and by the early 1900s, it had become a thriving agricultural center. The town was also home to a number of businesses, including a cotton gin, a sawmill, and a gristmill.
In the early 1900s, the town was also home to a number of churches, including the First Baptist Church, which was founded in 1873. The town also had a number of schools, including the Bloomburg High School, which was established in 1910.
Geography
Bloomburg is located in the northeast corner of Texas, in the county of Bowie. It is situated on the banks of the Red River, and is part of the Texarkana metropolitan area. The town is located about 25 miles south of the Arkansas border, and about 50 miles east of the Oklahoma border.
The town is located in a rural area, and is surrounded by rolling hills and farmland. The town is also located near several lakes, including Lake Wright Patman, Lake O' the Pines, and Lake Bob Sandlin.
Economy
The economy of Bloomburg is largely based on agriculture. The town is home to a number of farms, and the surrounding area is known for its production of cotton, soybeans, and other crops. The town is also home to a number of businesses, including a lumber mill, a feed store, and a number of restaurants.
Demographics
As of the 2010 census, the population of Bloomburg was 1,072. The town is predominantly white, with about 90% of the population being white. The town also has a small Hispanic population, with about 5% of the population being Hispanic. The median household income in the town is $37,000, and the median home value is $90,000.
Bloomburg is a small town with a rich history and a friendly atmosphere. The town is known for its rural charm and its agricultural roots, and is a great place to live for those looking for a quiet, rural lifestyle.
Common Questions
What is Per Capita Income in Bloomburg?
Per Capita income in Bloomburg is $23,206.
What is the Median Family Income in Bloomburg?
Median Family Income in Bloomburg is $90,240.
What is the Median Household income in Bloomburg?
Median Household Income in Bloomburg is $82,500.
What is Income or Wage Gap in Bloomburg?
Income or Wage Gap in Bloomburg is 73.4%.
Women in Bloomburg earn 26.6 cents for every dollar earned by a man.
What is Inequality or Gini Index in Bloomburg?
Inequality or Gini Index in Bloomburg is 0.30.
What is the Total Population of Bloomburg?
Total Population of Bloomburg is 288.
What is the Total Male Population of Bloomburg?
Total Male Population of Bloomburg is 143.
What is the Total Female Population of Bloomburg?
Total Female Population of Bloomburg is 145.
What is the Ratio of Males per 100 Females in Bloomburg?
There are 98.62 Males per 100 Females in Bloomburg.
What is the Ratio of Females per 100 Males in Bloomburg?
There are 101.40 Females per 100 Males in Bloomburg.
What is the Median Population Age in Bloomburg?
Median Population Age in Bloomburg is 42.7 Years.
What is the Average Family Size in Bloomburg
Average Family Size in Bloomburg is 2.9 People.
What is the Average Household Size in Bloomburg
Average Household Size in Bloomburg is 2.4 People.
How Large is the Labor Force in Bloomburg?
There are 136 People in the Labor Forcein in Bloomburg.
What is the Percentage of People in the Labor Force in Bloomburg?
61.3% of People are in the Labor Force in Bloomburg.