Zip Codes with the Highest Percentage of Population Employed in Health Diagnosing & Treating in Odessa, TX
RELATED REPORTS & OPTIONS
Health Diagnosing & Treating
Odessa
Compare Zip Codes
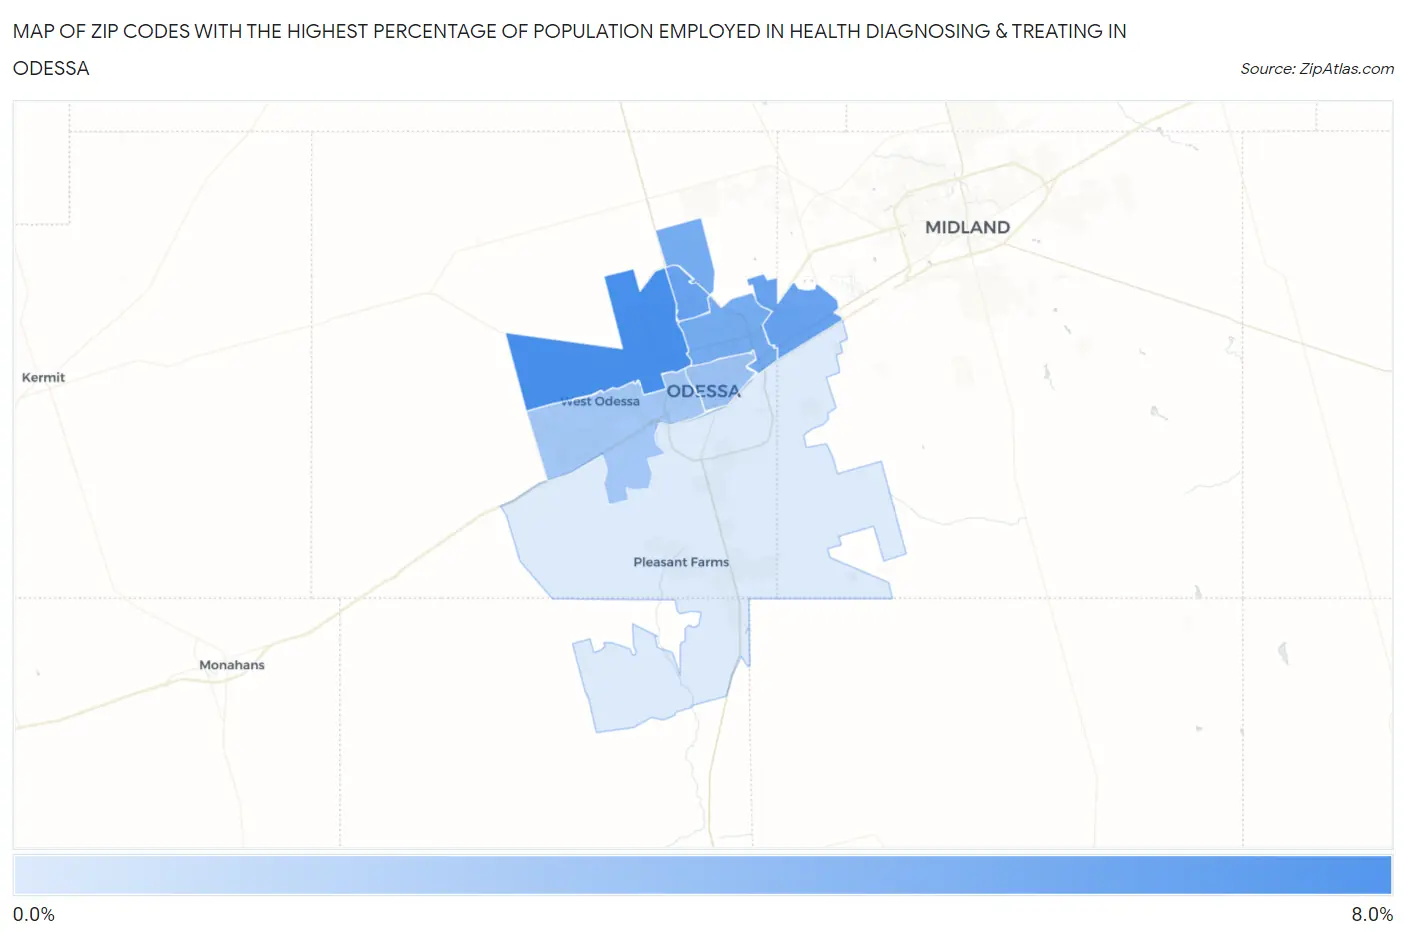
Map of Zip Codes with the Highest Percentage of Population Employed in Health Diagnosing & Treating in Odessa
0.65%
7.9%
Zip Codes with the Highest Percentage of Population Employed in Health Diagnosing & Treating in Odessa, TX
| Zip Code | % Employed | vs State | vs National | |
| 1. | 79764 | 7.9% | 5.5%(+2.37)#335 | 6.2%(+1.65)#7,774 |
| 2. | 79765 | 6.2% | 5.5%(+0.716)#556 | 6.2%(-0.010)#13,021 |
| 3. | 79762 | 5.6% | 5.5%(+0.068)#688 | 6.2%(-0.658)#15,447 |
| 4. | 79761 | 3.7% | 5.5%(-1.86)#1,143 | 6.2%(-2.59)#22,441 |
| 5. | 79763 | 3.4% | 5.5%(-2.15)#1,208 | 6.2%(-2.88)#23,286 |
| 6. | 79766 | 0.65% | 5.5%(-4.87)#1,625 | 6.2%(-5.60)#28,194 |
1
Common Questions
What are the Top 5 Zip Codes with the Highest Percentage of Population Employed in Health Diagnosing & Treating in Odessa, TX?
Top 5 Zip Codes with the Highest Percentage of Population Employed in Health Diagnosing & Treating in Odessa, TX are:
What zip code has the Highest Percentage of Population Employed in Health Diagnosing & Treating in Odessa, TX?
79764 has the Highest Percentage of Population Employed in Health Diagnosing & Treating in Odessa, TX with 7.9%.
What is the Percentage of Population Employed in Health Diagnosing & Treating in Odessa, TX?
Percentage of Population Employed in Health Diagnosing & Treating in Odessa is 4.9%.
What is the Percentage of Population Employed in Health Diagnosing & Treating in Texas?
Percentage of Population Employed in Health Diagnosing & Treating in Texas is 5.5%.
What is the Percentage of Population Employed in Health Diagnosing & Treating in the United States?
Percentage of Population Employed in Health Diagnosing & Treating in the United States is 6.2%.