Zip Codes with the Highest Percentage of Population Employed in Health Diagnosing & Treating in New Braunfels, TX
RELATED REPORTS & OPTIONS
Health Diagnosing & Treating
New Braunfels
Compare Zip Codes
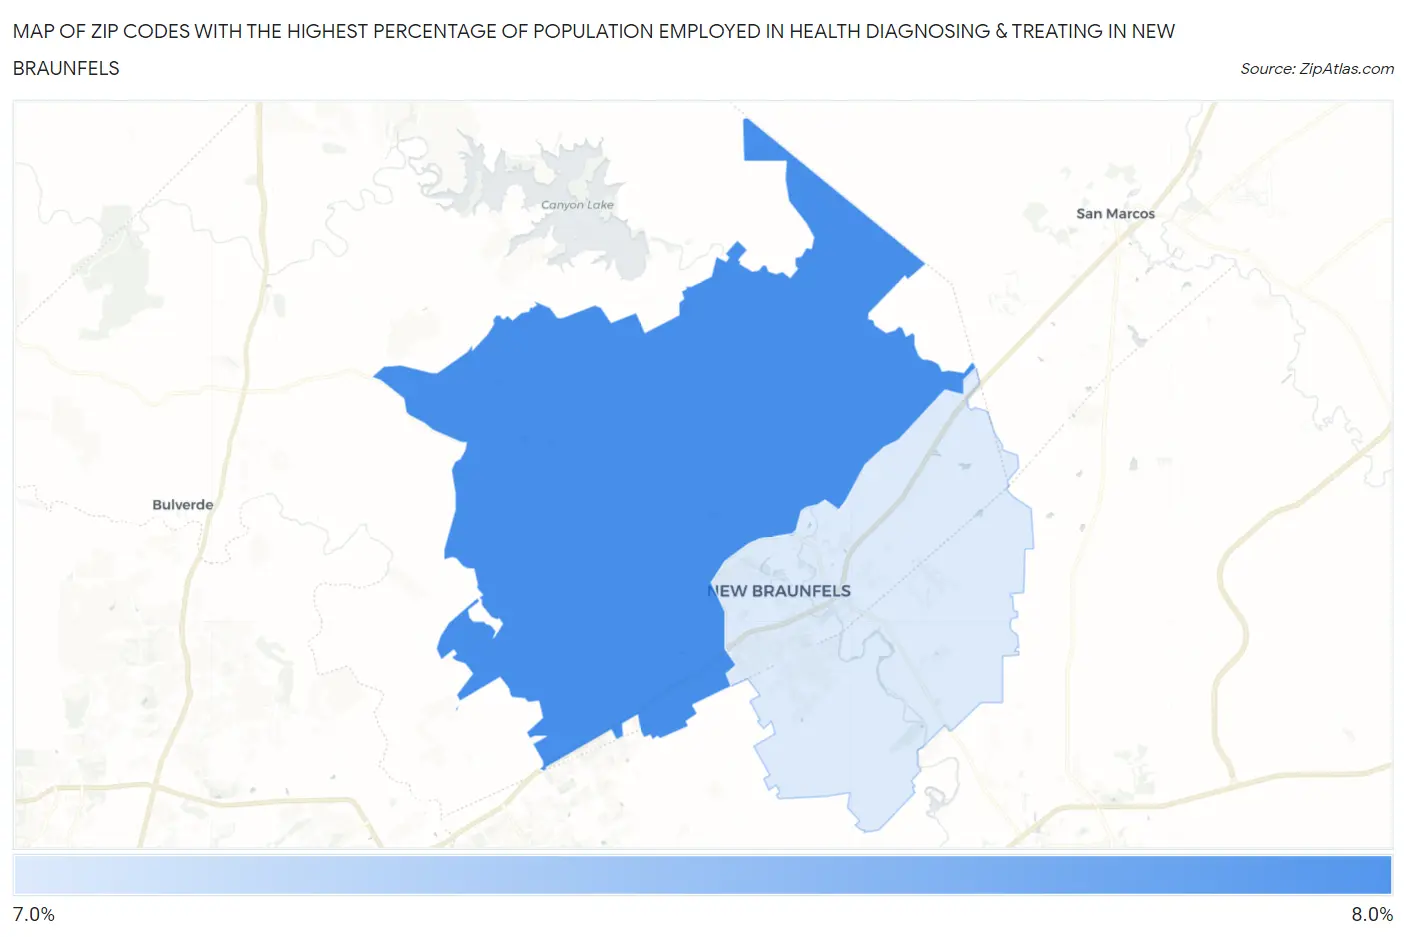
Map of Zip Codes with the Highest Percentage of Population Employed in Health Diagnosing & Treating in New Braunfels
7.0%
7.2%
Zip Codes with the Highest Percentage of Population Employed in Health Diagnosing & Treating in New Braunfels, TX
| Zip Code | % Employed | vs State | vs National | |
| 1. | 78132 | 7.2% | 5.5%(+1.70)#420 | 6.2%(+0.971)#9,674 |
| 2. | 78130 | 7.0% | 5.5%(+1.52)#444 | 6.2%(+0.791)#10,247 |
1
Common Questions
What are the Top Zip Codes with the Highest Percentage of Population Employed in Health Diagnosing & Treating in New Braunfels, TX?
Top Zip Codes with the Highest Percentage of Population Employed in Health Diagnosing & Treating in New Braunfels, TX are:
What zip code has the Highest Percentage of Population Employed in Health Diagnosing & Treating in New Braunfels, TX?
78132 has the Highest Percentage of Population Employed in Health Diagnosing & Treating in New Braunfels, TX with 7.2%.
What is the Percentage of Population Employed in Health Diagnosing & Treating in New Braunfels, TX?
Percentage of Population Employed in Health Diagnosing & Treating in New Braunfels is 6.9%.
What is the Percentage of Population Employed in Health Diagnosing & Treating in Texas?
Percentage of Population Employed in Health Diagnosing & Treating in Texas is 5.5%.
What is the Percentage of Population Employed in Health Diagnosing & Treating in the United States?
Percentage of Population Employed in Health Diagnosing & Treating in the United States is 6.2%.