Zip Codes with the Highest Percentage of Population Employed in Health Diagnosing & Treating in Allen, TX
RELATED REPORTS & OPTIONS
Health Diagnosing & Treating
Allen
Compare Zip Codes
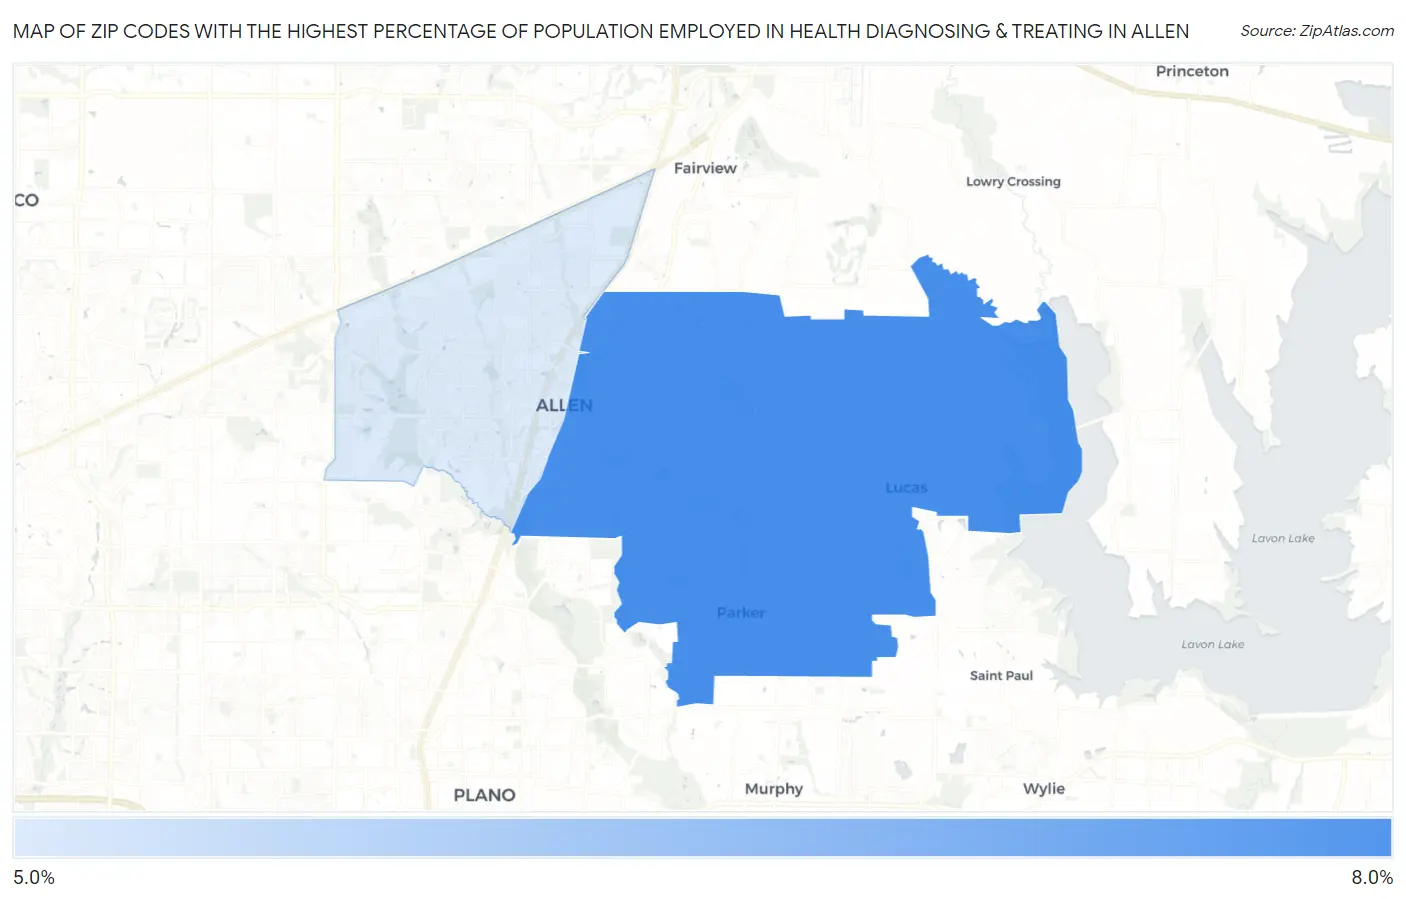
Map of Zip Codes with the Highest Percentage of Population Employed in Health Diagnosing & Treating in Allen
5.1%
6.3%
Zip Codes with the Highest Percentage of Population Employed in Health Diagnosing & Treating in Allen, TX
| Zip Code | % Employed | vs State | vs National | |
| 1. | 75002 | 6.3% | 5.5%(+0.765)#543 | 6.2%(+0.039)#12,819 |
| 2. | 75013 | 5.1% | 5.5%(-0.454)#810 | 6.2%(-1.18)#17,443 |
1
Common Questions
What are the Top Zip Codes with the Highest Percentage of Population Employed in Health Diagnosing & Treating in Allen, TX?
Top Zip Codes with the Highest Percentage of Population Employed in Health Diagnosing & Treating in Allen, TX are:
What zip code has the Highest Percentage of Population Employed in Health Diagnosing & Treating in Allen, TX?
75002 has the Highest Percentage of Population Employed in Health Diagnosing & Treating in Allen, TX with 6.3%.
What is the Percentage of Population Employed in Health Diagnosing & Treating in Allen, TX?
Percentage of Population Employed in Health Diagnosing & Treating in Allen is 5.3%.
What is the Percentage of Population Employed in Health Diagnosing & Treating in Texas?
Percentage of Population Employed in Health Diagnosing & Treating in Texas is 5.5%.
What is the Percentage of Population Employed in Health Diagnosing & Treating in the United States?
Percentage of Population Employed in Health Diagnosing & Treating in the United States is 6.2%.