Cities with the Highest Percentage of Population Employed in Health Diagnosing & Treating in Arizona
RELATED REPORTS & OPTIONS
Health Diagnosing & Treating
Arizona
Compare Cities
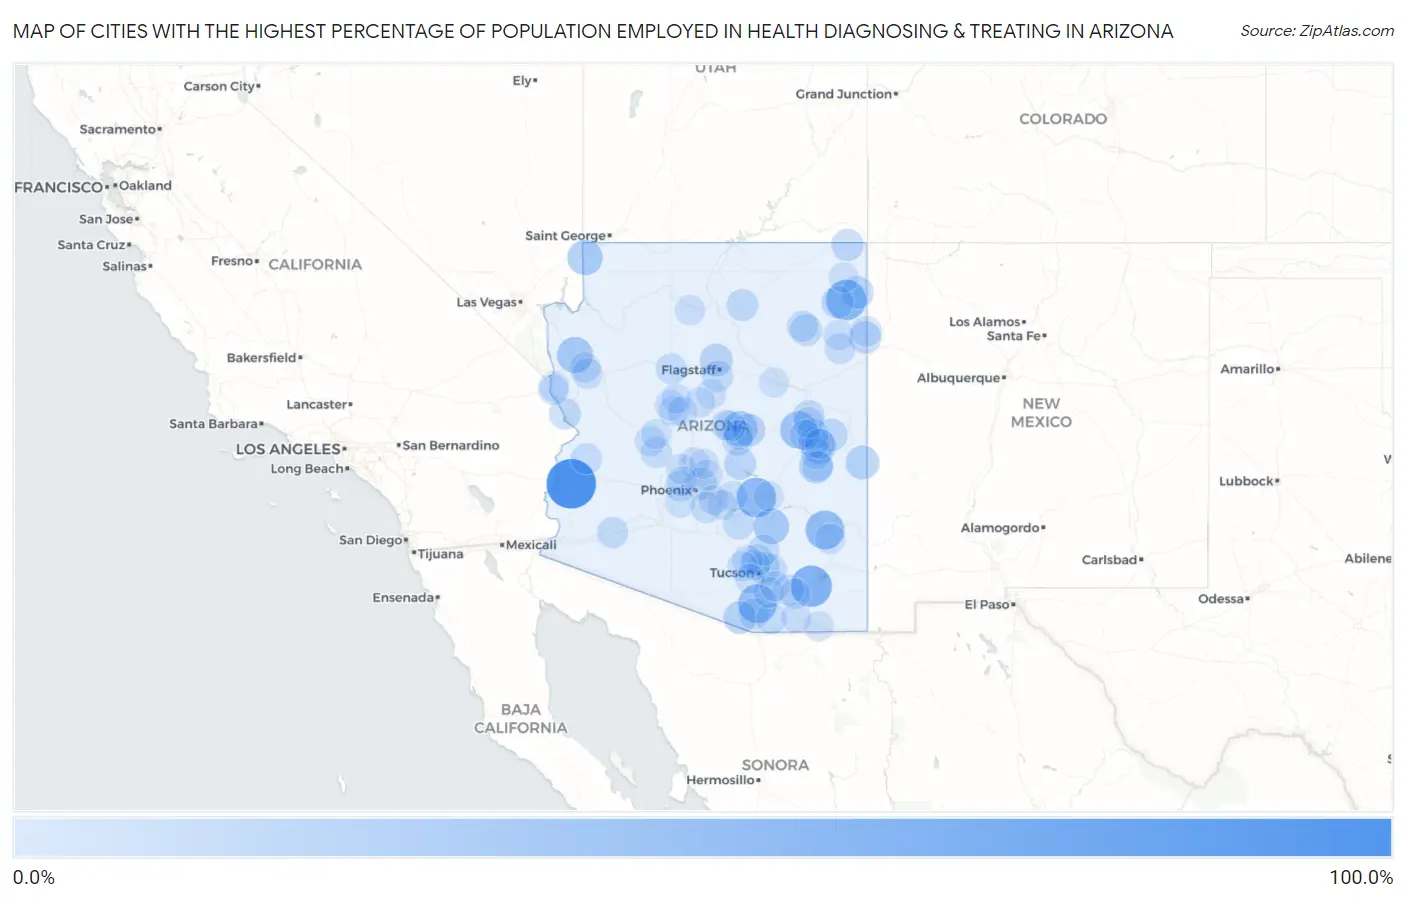
Map of Cities with the Highest Percentage of Population Employed in Health Diagnosing & Treating in Arizona
0.0%
100.0%
Cities with the Highest Percentage of Population Employed in Health Diagnosing & Treating in Arizona
| City | % Employed | vs State | vs National | |
| 1. | La Paz Valley | 100.0% | 5.9%(+94.1)#1 | 6.2%(+93.8)#1 |
| 2. | Dragoon | 59.0% | 5.9%(+53.2)#2 | 6.2%(+52.8)#45 |
| 3. | Del Muerto | 54.6% | 5.9%(+48.7)#3 | 6.2%(+48.4)#58 |
| 4. | Top Of The World | 51.4% | 5.9%(+45.5)#4 | 6.2%(+45.2)#73 |
| 5. | Central | 46.9% | 5.9%(+41.0)#5 | 6.2%(+40.6)#92 |
| 6. | Elephant Head | 46.3% | 5.9%(+40.4)#6 | 6.2%(+40.0)#96 |
| 7. | Pinedale | 39.6% | 5.9%(+33.8)#7 | 6.2%(+33.4)#147 |
| 8. | Chloride | 33.9% | 5.9%(+28.0)#8 | 6.2%(+27.6)#217 |
| 9. | Dudleyville | 31.9% | 5.9%(+26.0)#9 | 6.2%(+25.7)#270 |
| 10. | Beaver Valley | 31.0% | 5.9%(+25.1)#10 | 6.2%(+24.7)#292 |
| 11. | Scenic | 30.6% | 5.9%(+24.7)#11 | 6.2%(+24.4)#295 |
| 12. | Hondah | 27.6% | 5.9%(+21.7)#12 | 6.2%(+21.4)#360 |
| 13. | Seven Mile | 24.8% | 5.9%(+18.9)#13 | 6.2%(+18.5)#455 |
| 14. | Alpine | 23.5% | 5.9%(+17.6)#14 | 6.2%(+17.3)#518 |
| 15. | Bellemont | 23.1% | 5.9%(+17.2)#15 | 6.2%(+16.9)#540 |
| 16. | Arivaca | 20.0% | 5.9%(+14.1)#16 | 6.2%(+13.8)#738 |
| 17. | Tonto Village | 19.0% | 5.9%(+13.2)#17 | 6.2%(+12.8)#836 |
| 18. | Fort Valley | 18.6% | 5.9%(+12.7)#18 | 6.2%(+12.4)#882 |
| 19. | Vernon | 18.3% | 5.9%(+12.4)#19 | 6.2%(+12.1)#914 |
| 20. | Tsaile | 17.8% | 5.9%(+11.9)#20 | 6.2%(+11.6)#972 |
| 21. | St Michaels | 17.3% | 5.9%(+11.5)#21 | 6.2%(+11.1)#1,030 |
| 22. | Red Mesa | 16.4% | 5.9%(+10.5)#22 | 6.2%(+10.1)#1,200 |
| 23. | Greenehaven | 16.2% | 5.9%(+10.3)#23 | 6.2%(+9.97)#1,238 |
| 24. | Chinle | 16.0% | 5.9%(+10.1)#24 | 6.2%(+9.78)#1,282 |
| 25. | Tonto Basin | 15.4% | 5.9%(+9.50)#25 | 6.2%(+9.14)#1,416 |
| 26. | Jeddito | 15.0% | 5.9%(+9.12)#26 | 6.2%(+8.76)#1,509 |
| 27. | Tuba City | 14.7% | 5.9%(+8.77)#27 | 6.2%(+8.41)#1,590 |
| 28. | Snowflake | 14.6% | 5.9%(+8.73)#28 | 6.2%(+8.37)#1,613 |
| 29. | Paradise Valley | 13.7% | 5.9%(+7.84)#29 | 6.2%(+7.48)#1,895 |
| 30. | Catalina Foothills | 13.7% | 5.9%(+7.84)#30 | 6.2%(+7.48)#1,900 |
| 31. | Desert Hills | 13.7% | 5.9%(+7.82)#31 | 6.2%(+7.45)#1,917 |
| 32. | Cactus Forest | 13.6% | 5.9%(+7.68)#32 | 6.2%(+7.31)#1,956 |
| 33. | Kachina Village | 13.0% | 5.9%(+7.10)#33 | 6.2%(+6.73)#2,203 |
| 34. | Show Low | 12.9% | 5.9%(+7.02)#34 | 6.2%(+6.66)#2,232 |
| 35. | Dateland | 12.9% | 5.9%(+7.02)#35 | 6.2%(+6.66)#2,236 |
| 36. | Kaibab Estates West | 12.7% | 5.9%(+6.86)#36 | 6.2%(+6.49)#2,315 |
| 37. | Sunsites | 12.6% | 5.9%(+6.72)#37 | 6.2%(+6.36)#2,379 |
| 38. | Tanque Verde | 12.2% | 5.9%(+6.35)#38 | 6.2%(+5.98)#2,567 |
| 39. | Oxbow Estates | 12.1% | 5.9%(+6.24)#39 | 6.2%(+5.88)#2,619 |
| 40. | Oro Valley | 11.9% | 5.9%(+6.03)#40 | 6.2%(+5.67)#2,715 |
| 41. | Pine | 11.8% | 5.9%(+5.96)#41 | 6.2%(+5.60)#2,749 |
| 42. | Keams Canyon | 11.7% | 5.9%(+5.79)#42 | 6.2%(+5.42)#2,854 |
| 43. | Saddlebrooke | 11.4% | 5.9%(+5.56)#43 | 6.2%(+5.20)#3,035 |
| 44. | Tubac | 11.4% | 5.9%(+5.48)#44 | 6.2%(+5.12)#3,077 |
| 45. | Goodyear Village | 11.3% | 5.9%(+5.40)#45 | 6.2%(+5.03)#3,132 |
| 46. | Patagonia | 11.1% | 5.9%(+5.19)#46 | 6.2%(+4.83)#3,286 |
| 47. | Ash Fork | 11.0% | 5.9%(+5.12)#47 | 6.2%(+4.76)#3,326 |
| 48. | Bouse | 11.0% | 5.9%(+5.08)#48 | 6.2%(+4.71)#3,353 |
| 49. | Wickenburg | 10.9% | 5.9%(+5.03)#49 | 6.2%(+4.67)#3,378 |
| 50. | Tucson Mountains | 10.9% | 5.9%(+4.98)#50 | 6.2%(+4.61)#3,422 |
| 51. | Mescal | 10.5% | 5.9%(+4.65)#51 | 6.2%(+4.28)#3,706 |
| 52. | North Fork | 10.4% | 5.9%(+4.55)#52 | 6.2%(+4.18)#3,790 |
| 53. | Circle | 10.4% | 5.9%(+4.50)#53 | 6.2%(+4.14)#3,838 |
| 54. | Fort Defiance | 10.2% | 5.9%(+4.29)#54 | 6.2%(+3.92)#4,054 |
| 55. | Lake Of The Woods | 10.1% | 5.9%(+4.25)#55 | 6.2%(+3.88)#4,085 |
| 56. | Timberline-Fernwood | 10.0% | 5.9%(+4.09)#56 | 6.2%(+3.73)#4,250 |
| 57. | Gold Canyon | 9.7% | 5.9%(+3.79)#57 | 6.2%(+3.43)#4,571 |
| 58. | Corona De Tucson | 9.5% | 5.9%(+3.64)#58 | 6.2%(+3.27)#4,757 |
| 59. | Taylor | 9.5% | 5.9%(+3.61)#59 | 6.2%(+3.25)#4,773 |
| 60. | Lazy Y U | 9.2% | 5.9%(+3.37)#60 | 6.2%(+3.00)#5,083 |
| 61. | Linden | 9.2% | 5.9%(+3.31)#61 | 6.2%(+2.95)#5,131 |
| 62. | Klagetoh | 9.1% | 5.9%(+3.21)#62 | 6.2%(+2.85)#5,297 |
| 63. | Kingman | 8.9% | 5.9%(+3.06)#63 | 6.2%(+2.70)#5,504 |
| 64. | Ganado | 8.7% | 5.9%(+2.85)#64 | 6.2%(+2.48)#5,809 |
| 65. | Anthem | 8.6% | 5.9%(+2.72)#65 | 6.2%(+2.36)#6,004 |
| 66. | Benson | 8.6% | 5.9%(+2.67)#66 | 6.2%(+2.31)#6,079 |
| 67. | Mesquite Creek | 8.5% | 5.9%(+2.65)#67 | 6.2%(+2.28)#6,119 |
| 68. | Strawberry | 8.5% | 5.9%(+2.57)#68 | 6.2%(+2.21)#6,238 |
| 69. | Prescott | 8.3% | 5.9%(+2.41)#69 | 6.2%(+2.05)#6,494 |
| 70. | Casas Adobes | 8.3% | 5.9%(+2.41)#70 | 6.2%(+2.05)#6,496 |
| 71. | Swift Trail Junction | 8.2% | 5.9%(+2.36)#71 | 6.2%(+2.00)#6,570 |
| 72. | Williamson | 8.2% | 5.9%(+2.28)#72 | 6.2%(+1.91)#6,719 |
| 73. | Sierra Vista | 8.1% | 5.9%(+2.20)#73 | 6.2%(+1.83)#6,854 |
| 74. | Marana | 8.1% | 5.9%(+2.19)#74 | 6.2%(+1.83)#6,865 |
| 75. | Picture Rocks | 8.0% | 5.9%(+2.11)#75 | 6.2%(+1.74)#7,023 |
| 76. | Pinetop Country Club | 8.0% | 5.9%(+2.10)#76 | 6.2%(+1.73)#7,034 |
| 77. | Congress | 8.0% | 5.9%(+2.07)#77 | 6.2%(+1.71)#7,088 |
| 78. | Mohave Valley | 7.9% | 5.9%(+2.06)#78 | 6.2%(+1.70)#7,107 |
| 79. | Scottsdale | 7.8% | 5.9%(+1.97)#79 | 6.2%(+1.60)#7,287 |
| 80. | East Fork | 7.8% | 5.9%(+1.90)#80 | 6.2%(+1.54)#7,411 |
| 81. | Peeples Valley | 7.8% | 5.9%(+1.90)#81 | 6.2%(+1.53)#7,421 |
| 82. | Grand Canyon Village | 7.6% | 5.9%(+1.75)#82 | 6.2%(+1.39)#7,714 |
| 83. | Litchfield Park | 7.6% | 5.9%(+1.74)#83 | 6.2%(+1.38)#7,734 |
| 84. | Peoria | 7.4% | 5.9%(+1.48)#84 | 6.2%(+1.12)#8,332 |
| 85. | Gilbert | 7.4% | 5.9%(+1.47)#85 | 6.2%(+1.11)#8,347 |
| 86. | Queen Creek | 7.3% | 5.9%(+1.45)#86 | 6.2%(+1.09)#8,398 |
| 87. | Round Rock | 7.3% | 5.9%(+1.39)#87 | 6.2%(+1.03)#8,538 |
| 88. | Valencia West | 7.3% | 5.9%(+1.39)#88 | 6.2%(+1.02)#8,553 |
| 89. | Chino Valley | 7.2% | 5.9%(+1.32)#89 | 6.2%(+0.952)#8,692 |
| 90. | Bisbee | 7.1% | 5.9%(+1.22)#90 | 6.2%(+0.859)#8,916 |
| 91. | Sedona | 7.1% | 5.9%(+1.22)#91 | 6.2%(+0.856)#8,924 |
| 92. | Six Shooter Canyon | 7.0% | 5.9%(+1.10)#92 | 6.2%(+0.732)#9,217 |
| 93. | Verde Village | 7.0% | 5.9%(+1.09)#93 | 6.2%(+0.730)#9,237 |
| 94. | Goodyear | 6.9% | 5.9%(+1.06)#94 | 6.2%(+0.698)#9,320 |
| 95. | Winslow | 6.9% | 5.9%(+1.03)#95 | 6.2%(+0.671)#9,381 |
| 96. | Carefree | 6.9% | 5.9%(+1.03)#96 | 6.2%(+0.665)#9,400 |
| 97. | Youngtown | 6.8% | 5.9%(+0.940)#97 | 6.2%(+0.576)#9,618 |
| 98. | Payson | 6.8% | 5.9%(+0.924)#98 | 6.2%(+0.561)#9,663 |
| 99. | Prescott Valley | 6.7% | 5.9%(+0.850)#99 | 6.2%(+0.486)#9,853 |
| 100. | Vail | 6.7% | 5.9%(+0.793)#100 | 6.2%(+0.429)#9,984 |
Common Questions
What are the Top 10 Cities with the Highest Percentage of Population Employed in Health Diagnosing & Treating in Arizona?
Top 10 Cities with the Highest Percentage of Population Employed in Health Diagnosing & Treating in Arizona are:
#1
100.0%
#2
59.0%
#3
54.6%
#4
51.4%
#5
46.9%
#6
46.3%
#7
39.6%
#8
33.9%
#9
31.9%
#10
31.0%
What city has the Highest Percentage of Population Employed in Health Diagnosing & Treating in Arizona?
La Paz Valley has the Highest Percentage of Population Employed in Health Diagnosing & Treating in Arizona with 100.0%.
What is the Percentage of Population Employed in Health Diagnosing & Treating in the State of Arizona?
Percentage of Population Employed in Health Diagnosing & Treating in Arizona is 5.9%.
What is the Percentage of Population Employed in Health Diagnosing & Treating in the United States?
Percentage of Population Employed in Health Diagnosing & Treating in the United States is 6.2%.