Hallettsville, TX Map & Demographics
Hallettsville Map
Hallettsville Overview
$30,396
PER CAPITA INCOME
$60,913
AVG FAMILY INCOME
$47,090
AVG HOUSEHOLD INCOME
20.6%
WAGE / INCOME GAP [ % ]
79.4¢/ $1
WAGE / INCOME GAP [ $ ]
0.47
INEQUALITY / GINI INDEX
2,729
TOTAL POPULATION
1,387
MALE POPULATION
1,342
FEMALE POPULATION
103.35
MALES / 100 FEMALES
96.76
FEMALES / 100 MALES
42.3
MEDIAN AGE
2.9
AVG FAMILY SIZE
2.2
AVG HOUSEHOLD SIZE
1,379
LABOR FORCE [ PEOPLE ]
63.7%
PERCENT IN LABOR FORCE
5.8%
UNEMPLOYMENT RATE
Hallettsville Zip Codes
Income in Hallettsville
Income Overview in Hallettsville
Per Capita Income in Hallettsville is $30,396, while median incomes of families and households are $60,913 and $47,090 respectively.
| Characteristic | Number | Measure |
| Per Capita Income | 2,729 | $30,396 |
| Median Family Income | 655 | $60,913 |
| Mean Family Income | 655 | $89,049 |
| Median Household Income | 1,152 | $47,090 |
| Mean Household Income | 1,152 | $70,592 |
| Income Deficit | 655 | $0 |
| Wage / Income Gap (%) | 2,729 | 20.56% |
| Wage / Income Gap ($) | 2,729 | 79.44¢ per $1 |
| Gini / Inequality Index | 2,729 | 0.47 |
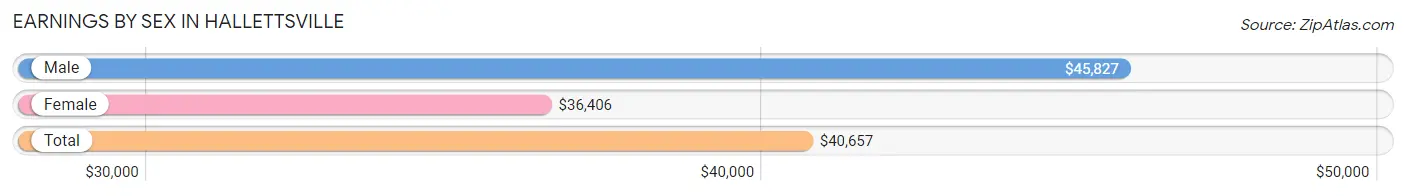
Earnings by Sex in Hallettsville
Average Earnings in Hallettsville are $40,657, $45,827 for men and $36,406 for women, a difference of 20.6%.
| Sex | Number | Average Earnings |
| Male | 641 (44.9%) | $45,827 |
| Female | 787 (55.1%) | $36,406 |
| Total | 1,428 (100.0%) | $40,657 |
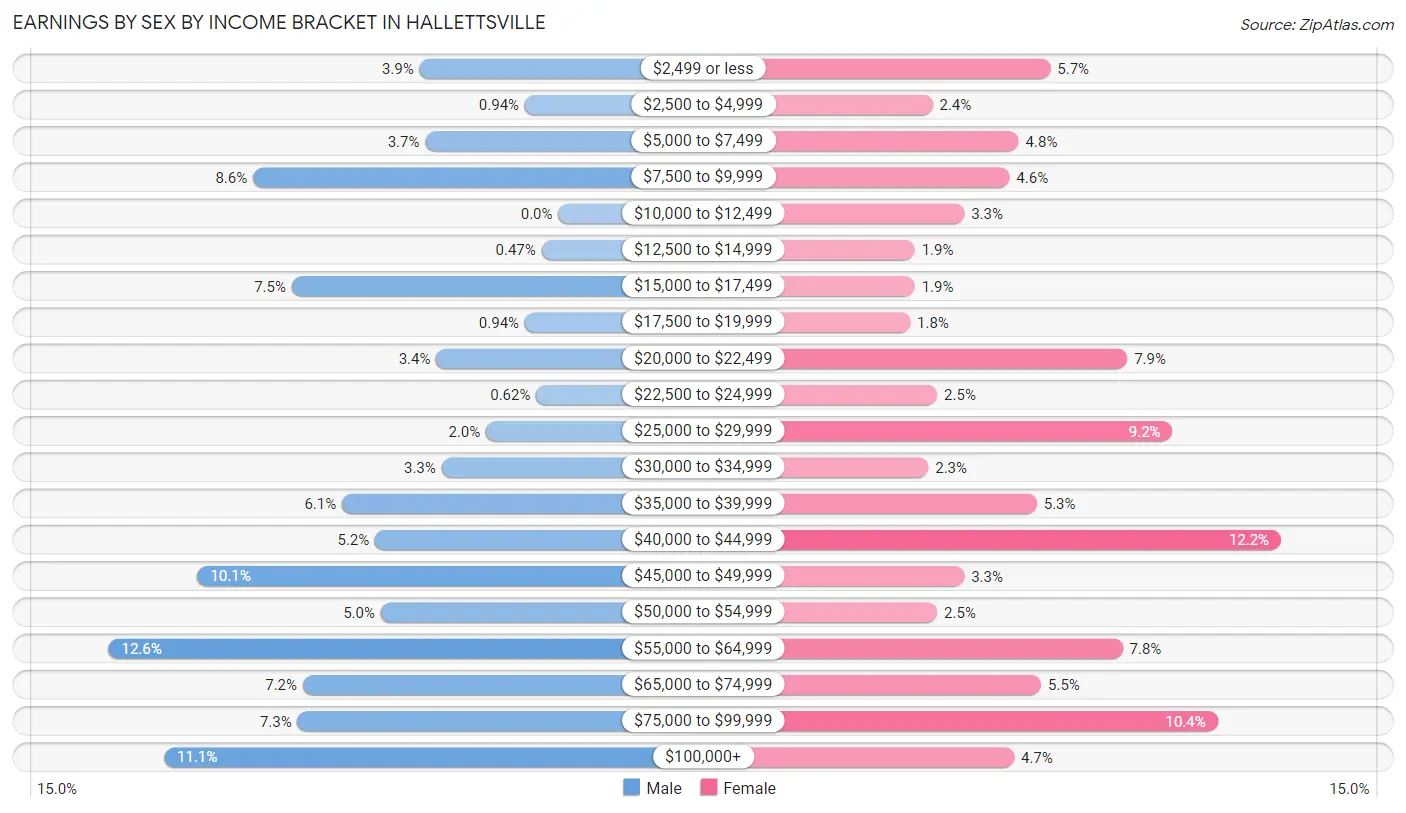
Earnings by Sex by Income Bracket in Hallettsville
The most common earnings brackets in Hallettsville are $55,000 to $64,999 for men (81 | 12.6%) and $40,000 to $44,999 for women (96 | 12.2%).
| Income | Male | Female |
| $2,499 or less | 25 (3.9%) | 45 (5.7%) |
| $2,500 to $4,999 | 6 (0.9%) | 19 (2.4%) |
| $5,000 to $7,499 | 24 (3.7%) | 38 (4.8%) |
| $7,500 to $9,999 | 55 (8.6%) | 36 (4.6%) |
| $10,000 to $12,499 | 0 (0.0%) | 26 (3.3%) |
| $12,500 to $14,999 | 3 (0.5%) | 15 (1.9%) |
| $15,000 to $17,499 | 48 (7.5%) | 15 (1.9%) |
| $17,500 to $19,999 | 6 (0.9%) | 14 (1.8%) |
| $20,000 to $22,499 | 22 (3.4%) | 62 (7.9%) |
| $22,500 to $24,999 | 4 (0.6%) | 20 (2.5%) |
| $25,000 to $29,999 | 13 (2.0%) | 72 (9.1%) |
| $30,000 to $34,999 | 21 (3.3%) | 18 (2.3%) |
| $35,000 to $39,999 | 39 (6.1%) | 42 (5.3%) |
| $40,000 to $44,999 | 33 (5.1%) | 96 (12.2%) |
| $45,000 to $49,999 | 65 (10.1%) | 26 (3.3%) |
| $50,000 to $54,999 | 32 (5.0%) | 20 (2.5%) |
| $55,000 to $64,999 | 81 (12.6%) | 61 (7.7%) |
| $65,000 to $74,999 | 46 (7.2%) | 43 (5.5%) |
| $75,000 to $99,999 | 47 (7.3%) | 82 (10.4%) |
| $100,000+ | 71 (11.1%) | 37 (4.7%) |
| Total | 641 (100.0%) | 787 (100.0%) |
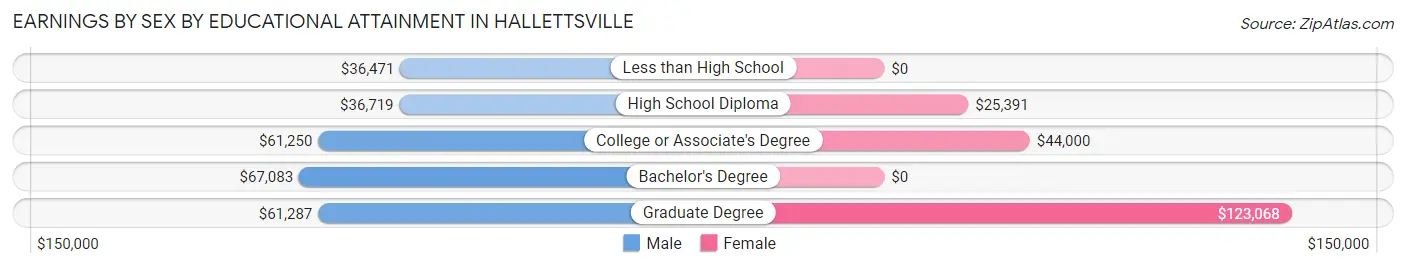
Earnings by Sex by Educational Attainment in Hallettsville
Average earnings in Hallettsville are $50,195 for men and $40,990 for women, a difference of 18.3%. Men with an educational attainment of bachelor's degree enjoy the highest average annual earnings of $67,083, while those with less than high school education earn the least with $36,471. Women with an educational attainment of graduate degree earn the most with the average annual earnings of $123,068, while those with high school diploma education have the smallest earnings of $25,391.
| Educational Attainment | Male Income | Female Income |
| Less than High School | $36,471 | $0 |
| High School Diploma | $36,719 | $25,391 |
| College or Associate's Degree | $61,250 | $44,000 |
| Bachelor's Degree | $67,083 | $0 |
| Graduate Degree | $61,287 | $123,068 |
| Total | $50,195 | $40,990 |
Family Income in Hallettsville
Family Income Brackets in Hallettsville
According to the Hallettsville family income data, there are 132 families falling into the $50,000 to $74,999 income range, which is the most common income bracket and makes up 20.2% of all families. Conversely, the less than $10,000 income bracket is the least frequent group with only 22 families (3.4%) belonging to this category.
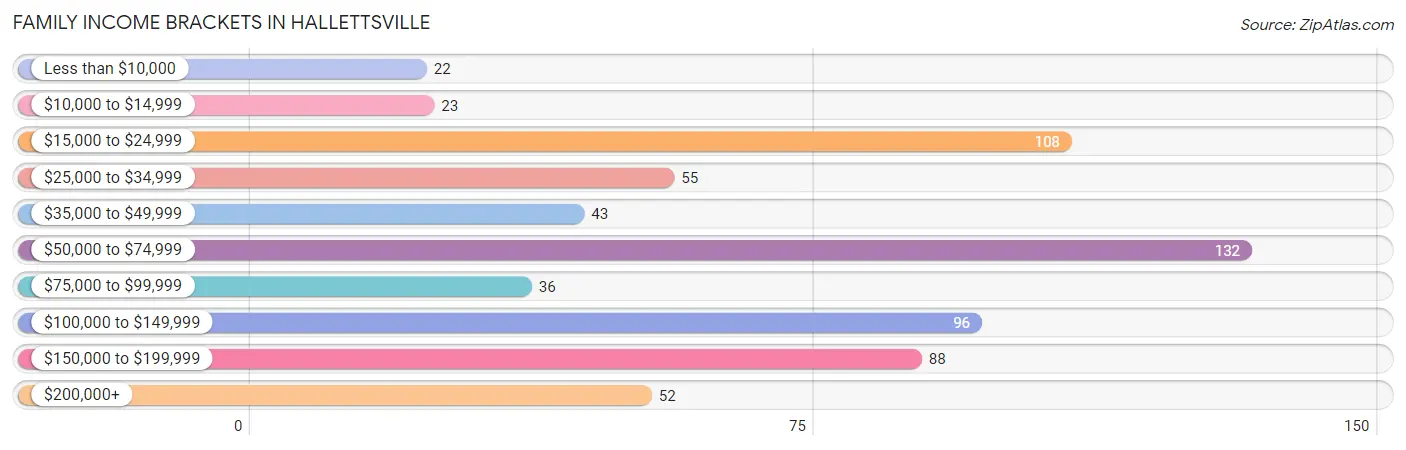
| Income Bracket | # Families | % Families |
| Less than $10,000 | 22 | 3.4% |
| $10,000 to $14,999 | 23 | 3.5% |
| $15,000 to $24,999 | 108 | 16.5% |
| $25,000 to $34,999 | 55 | 8.4% |
| $35,000 to $49,999 | 43 | 6.6% |
| $50,000 to $74,999 | 132 | 20.2% |
| $75,000 to $99,999 | 36 | 5.5% |
| $100,000 to $149,999 | 96 | 14.7% |
| $150,000 to $199,999 | 88 | 13.4% |
| $200,000+ | 52 | 7.9% |
Family Income by Famaliy Size in Hallettsville
4-person families (87 | 13.3%) account for the highest median family income in Hallettsville with $71,875 per family, while 2-person families (304 | 46.4%) have the highest median income of $26,704 per family member.
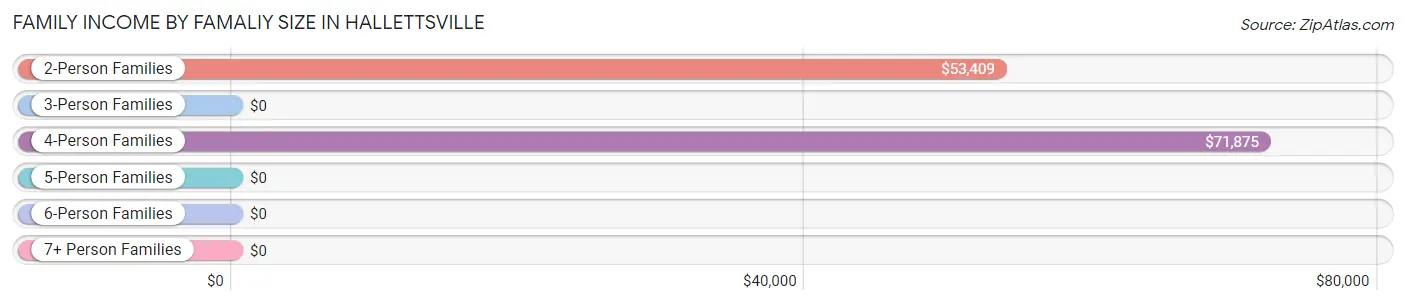
| Income Bracket | # Families | Median Income |
| 2-Person Families | 304 (46.4%) | $53,409 |
| 3-Person Families | 195 (29.8%) | $0 |
| 4-Person Families | 87 (13.3%) | $71,875 |
| 5-Person Families | 69 (10.5%) | $0 |
| 6-Person Families | 0 (0.0%) | $0 |
| 7+ Person Families | 0 (0.0%) | $0 |
| Total | 655 (100.0%) | $60,913 |
Family Income by Number of Earners in Hallettsville
The median family income in Hallettsville is $60,913, with families comprising 3+ earners (59) having the highest median family income of $176,250, while families with 1 earner (174) have the lowest median family income of $25,833, accounting for 9.0% and 26.6% of families, respectively.
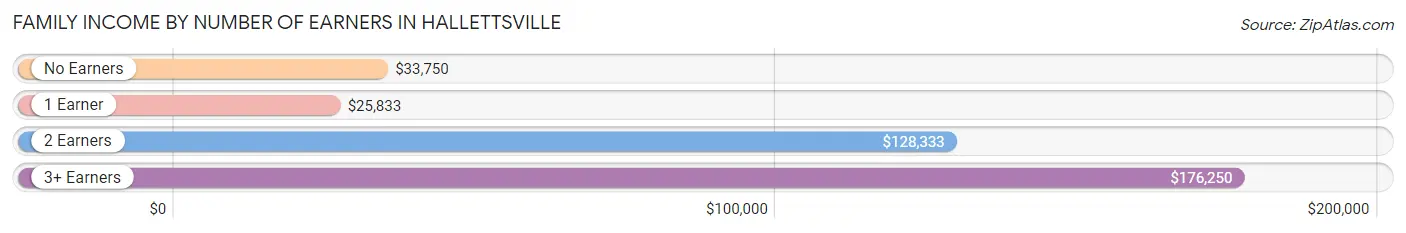
| Number of Earners | # Families | Median Income |
| No Earners | 120 (18.3%) | $33,750 |
| 1 Earner | 174 (26.6%) | $25,833 |
| 2 Earners | 302 (46.1%) | $128,333 |
| 3+ Earners | 59 (9.0%) | $176,250 |
| Total | 655 (100.0%) | $60,913 |
Household Income in Hallettsville
Household Income Brackets in Hallettsville
With 197 households falling in the category, the $35,000 to $49,999 income range is the most frequent in Hallettsville, accounting for 17.1% of all households. In contrast, only 56 households (4.9%) fall into the $200,000+ income bracket, making it the least populous group.
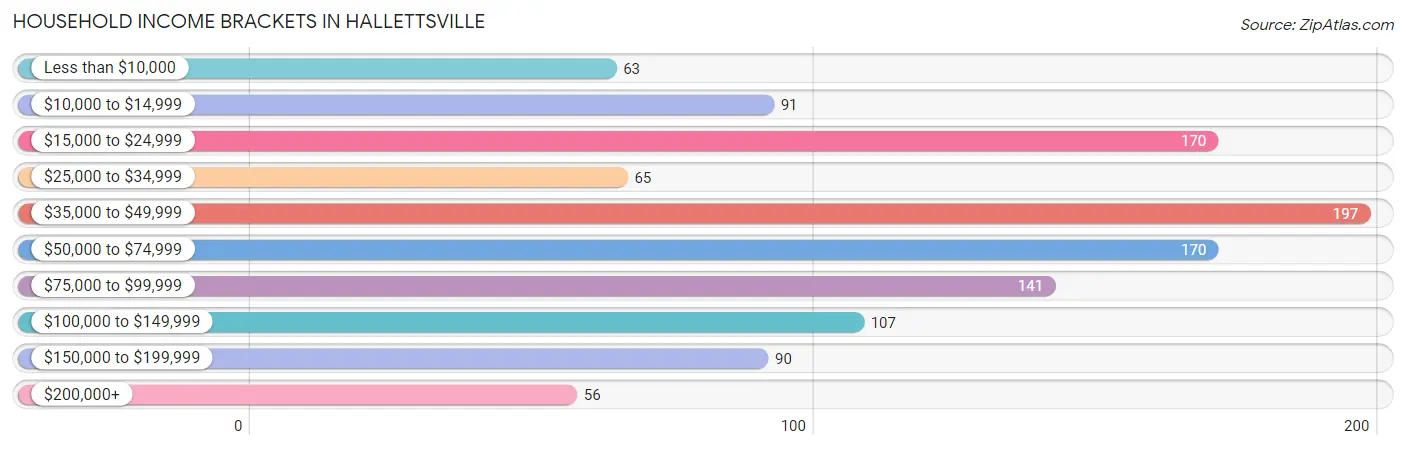
| Income Bracket | # Households | % Households |
| Less than $10,000 | 63 | 5.5% |
| $10,000 to $14,999 | 91 | 7.9% |
| $15,000 to $24,999 | 170 | 14.8% |
| $25,000 to $34,999 | 65 | 5.6% |
| $35,000 to $49,999 | 197 | 17.1% |
| $50,000 to $74,999 | 170 | 14.8% |
| $75,000 to $99,999 | 141 | 12.2% |
| $100,000 to $149,999 | 107 | 9.3% |
| $150,000 to $199,999 | 90 | 7.8% |
| $200,000+ | 56 | 4.9% |
Household Income by Householder Age in Hallettsville
The median household income in Hallettsville is $47,090, with the highest median household income of $85,870 found in the 15 to 24 years age bracket for the primary householder. A total of 74 households (6.4%) fall into this category. Meanwhile, the 65+ years age bracket for the primary householder has the lowest median household income of $32,353, with 354 households (30.7%) in this group.
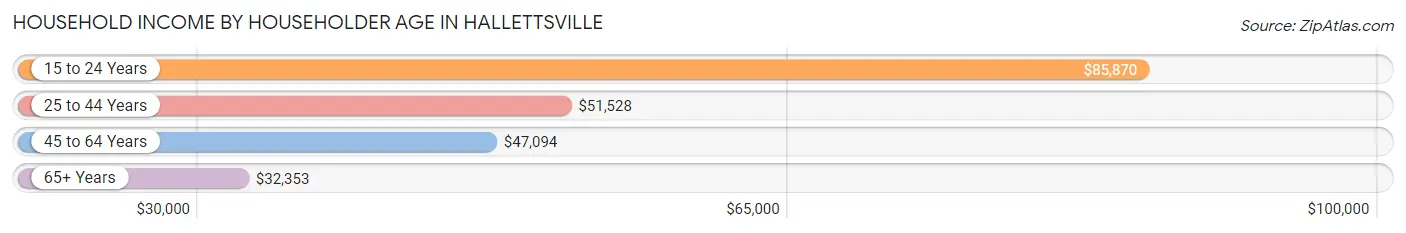
| Income Bracket | # Households | Median Income |
| 15 to 24 Years | 74 (6.4%) | $85,870 |
| 25 to 44 Years | 339 (29.4%) | $51,528 |
| 45 to 64 Years | 385 (33.4%) | $47,094 |
| 65+ Years | 354 (30.7%) | $32,353 |
| Total | 1,152 (100.0%) | $47,090 |
Poverty in Hallettsville
Income Below Poverty by Sex and Age in Hallettsville
With 24.4% poverty level for males and 19.3% for females among the residents of Hallettsville, under 5 year old males and 25 to 34 year old females are the most vulnerable to poverty, with 88 males (60.3%) and 77 females (52.7%) in their respective age groups living below the poverty level.
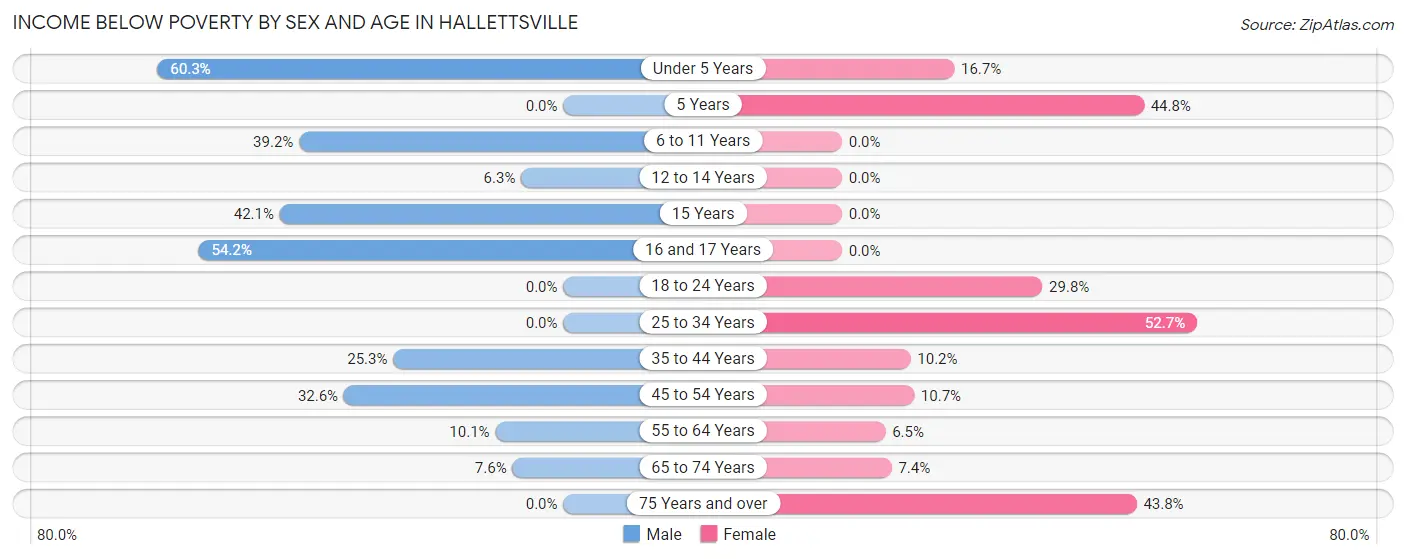
| Age Bracket | Male | Female |
| Under 5 Years | 88 (60.3%) | 5 (16.7%) |
| 5 Years | 0 (0.0%) | 13 (44.8%) |
| 6 to 11 Years | 51 (39.2%) | 0 (0.0%) |
| 12 to 14 Years | 6 (6.2%) | 0 (0.0%) |
| 15 Years | 16 (42.1%) | 0 (0.0%) |
| 16 and 17 Years | 39 (54.2%) | 0 (0.0%) |
| 18 to 24 Years | 0 (0.0%) | 36 (29.7%) |
| 25 to 34 Years | 0 (0.0%) | 77 (52.7%) |
| 35 to 44 Years | 50 (25.3%) | 17 (10.2%) |
| 45 to 54 Years | 43 (32.6%) | 18 (10.7%) |
| 55 to 64 Years | 11 (10.1%) | 12 (6.5%) |
| 65 to 74 Years | 8 (7.5%) | 14 (7.4%) |
| 75 Years and over | 0 (0.0%) | 42 (43.8%) |
| Total | 312 (24.4%) | 234 (19.3%) |
Income Above Poverty by Sex and Age in Hallettsville
According to the poverty statistics in Hallettsville, males aged 18 to 24 years and females aged 6 to 11 years are the age groups that are most secure financially, with 100.0% of males and 100.0% of females in these age groups living above the poverty line.
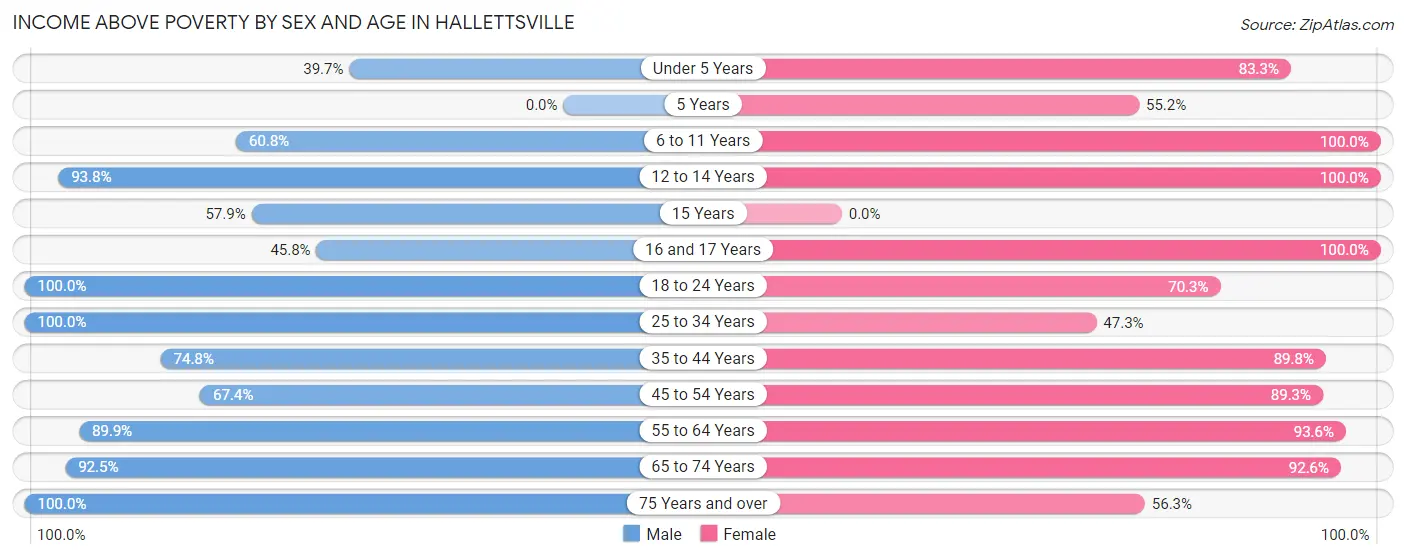
| Age Bracket | Male | Female |
| Under 5 Years | 58 (39.7%) | 25 (83.3%) |
| 5 Years | 0 (0.0%) | 16 (55.2%) |
| 6 to 11 Years | 79 (60.8%) | 29 (100.0%) |
| 12 to 14 Years | 90 (93.8%) | 24 (100.0%) |
| 15 Years | 22 (57.9%) | 0 (0.0%) |
| 16 and 17 Years | 33 (45.8%) | 29 (100.0%) |
| 18 to 24 Years | 89 (100.0%) | 85 (70.3%) |
| 25 to 34 Years | 70 (100.0%) | 69 (47.3%) |
| 35 to 44 Years | 148 (74.8%) | 150 (89.8%) |
| 45 to 54 Years | 89 (67.4%) | 150 (89.3%) |
| 55 to 64 Years | 98 (89.9%) | 174 (93.5%) |
| 65 to 74 Years | 98 (92.4%) | 176 (92.6%) |
| 75 Years and over | 91 (100.0%) | 54 (56.2%) |
| Total | 965 (75.6%) | 981 (80.7%) |
Income Below Poverty Among Married-Couple Families in Hallettsville
The poverty statistics for married-couple families in Hallettsville show that 6.3% or 27 of the total 426 families live below the poverty line. Families with 1 or 2 children have the highest poverty rate of 10.9%, comprising of 17 families. On the other hand, families with 3 or 4 children have the lowest poverty rate of 0.0%, which includes 0 families.
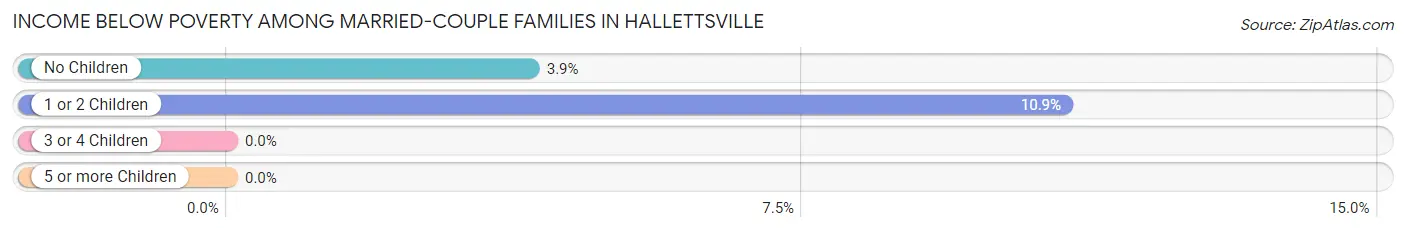
| Children | Above Poverty | Below Poverty |
| No Children | 244 (96.1%) | 10 (3.9%) |
| 1 or 2 Children | 139 (89.1%) | 17 (10.9%) |
| 3 or 4 Children | 16 (100.0%) | 0 (0.0%) |
| 5 or more Children | 0 (0.0%) | 0 (0.0%) |
| Total | 399 (93.7%) | 27 (6.3%) |
Income Below Poverty Among Single-Parent Households in Hallettsville
According to the poverty data in Hallettsville, 62.3% or 43 single-father households and 44.4% or 71 single-mother households are living below the poverty line. Among single-father households, those with 1 or 2 children have the highest poverty rate, with 43 households (62.3%) experiencing poverty. Likewise, among single-mother households, those with 1 or 2 children have the highest poverty rate, with 71 households (75.5%) falling below the poverty line.
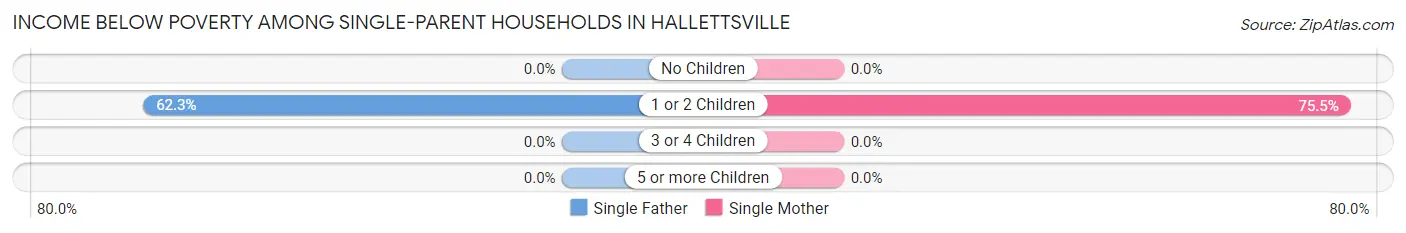
| Children | Single Father | Single Mother |
| No Children | 0 (0.0%) | 0 (0.0%) |
| 1 or 2 Children | 43 (62.3%) | 71 (75.5%) |
| 3 or 4 Children | 0 (0.0%) | 0 (0.0%) |
| 5 or more Children | 0 (0.0%) | 0 (0.0%) |
| Total | 43 (62.3%) | 71 (44.4%) |
Income Below Poverty Among Married-Couple vs Single-Parent Households in Hallettsville
The poverty data for Hallettsville shows that 27 of the married-couple family households (6.3%) and 114 of the single-parent households (49.8%) are living below the poverty level. Within the married-couple family households, those with 1 or 2 children have the highest poverty rate, with 17 households (10.9%) falling below the poverty line. Among the single-parent households, those with 1 or 2 children have the highest poverty rate, with 114 household (69.9%) living below poverty.
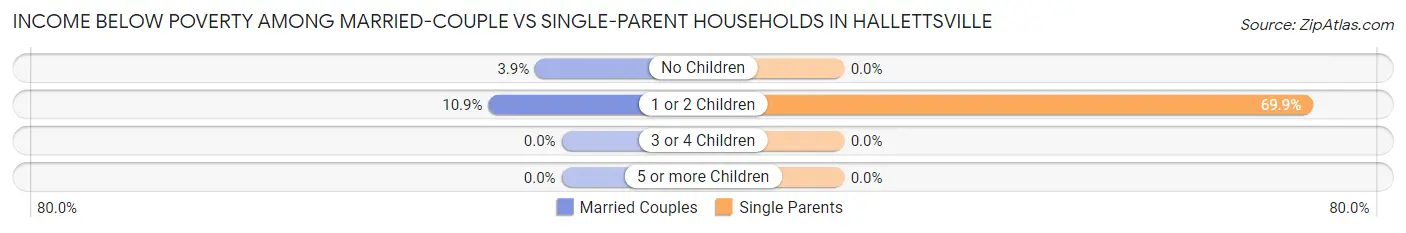
| Children | Married-Couple Families | Single-Parent Households |
| No Children | 10 (3.9%) | 0 (0.0%) |
| 1 or 2 Children | 17 (10.9%) | 114 (69.9%) |
| 3 or 4 Children | 0 (0.0%) | 0 (0.0%) |
| 5 or more Children | 0 (0.0%) | 0 (0.0%) |
| Total | 27 (6.3%) | 114 (49.8%) |
Race in Hallettsville
The most populous races in Hallettsville are White / Caucasian (1,479 | 54.2%), Black / African American (681 | 24.9%), and Hispanic or Latino (621 | 22.8%).
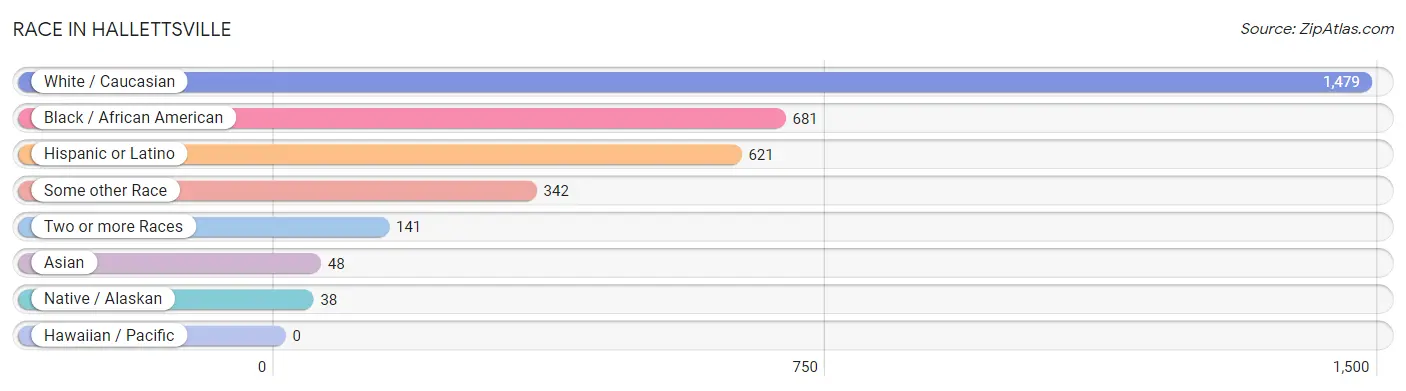
| Race | # Population | % Population |
| Asian | 48 | 1.8% |
| Black / African American | 681 | 24.9% |
| Hawaiian / Pacific | 0 | 0.0% |
| Hispanic or Latino | 621 | 22.8% |
| Native / Alaskan | 38 | 1.4% |
| White / Caucasian | 1,479 | 54.2% |
| Two or more Races | 141 | 5.2% |
| Some other Race | 342 | 12.5% |
| Total | 2,729 | 100.0% |
Ancestry in Hallettsville
The most populous ancestries reported in Hallettsville are German (744 | 27.3%), Mexican (590 | 21.6%), Czech (395 | 14.5%), Irish (273 | 10.0%), and English (134 | 4.9%), together accounting for 78.3% of all Hallettsville residents.
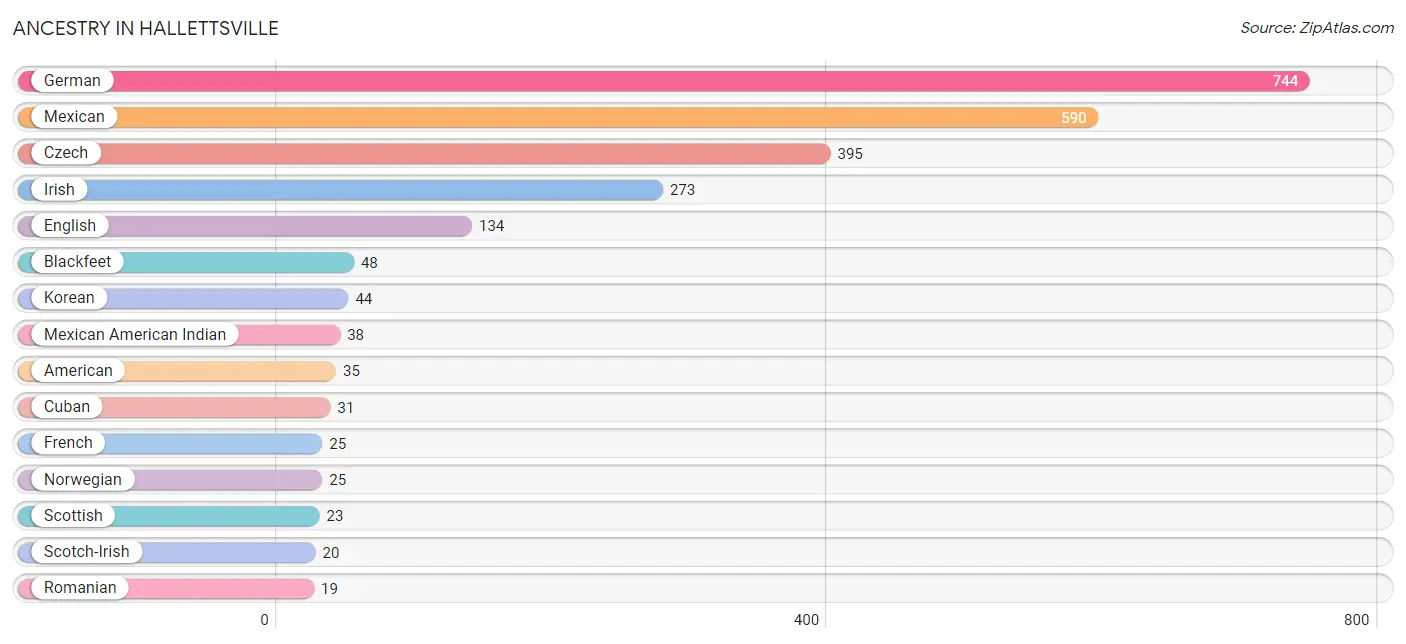
| Ancestry | # Population | % Population |
| American | 35 | 1.3% |
| Blackfeet | 48 | 1.8% |
| Cuban | 31 | 1.1% |
| Czech | 395 | 14.5% |
| Czechoslovakian | 18 | 0.7% |
| Dutch | 16 | 0.6% |
| English | 134 | 4.9% |
| French | 25 | 0.9% |
| German | 744 | 27.3% |
| Greek | 4 | 0.2% |
| Irish | 273 | 10.0% |
| Italian | 13 | 0.5% |
| Korean | 44 | 1.6% |
| Mexican | 590 | 21.6% |
| Mexican American Indian | 38 | 1.4% |
| Norwegian | 25 | 0.9% |
| Polish | 8 | 0.3% |
| Romanian | 19 | 0.7% |
| Scotch-Irish | 20 | 0.7% |
| Scottish | 23 | 0.8% |
| Swedish | 6 | 0.2% |
| Thai | 4 | 0.2% |
| Welsh | 4 | 0.2% | View All 23 Rows |
Immigrants in Hallettsville
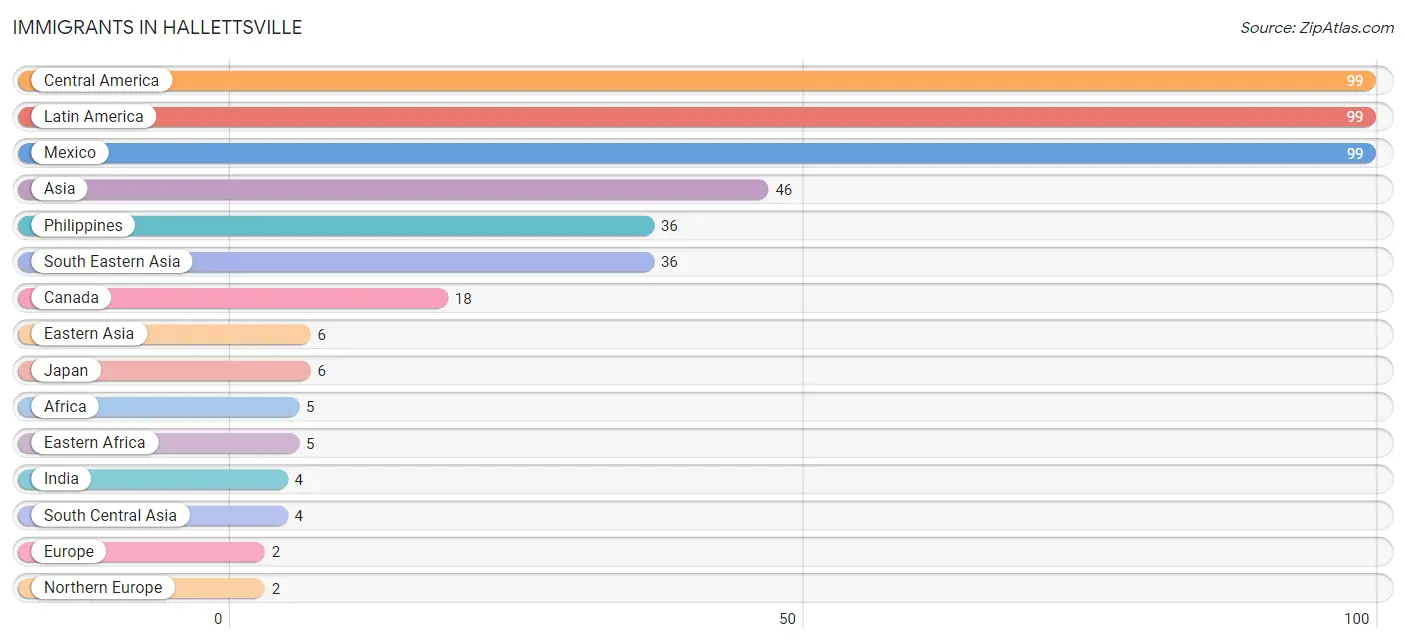
The most numerous immigrant groups reported in Hallettsville came from Central America (99 | 3.6%), Latin America (99 | 3.6%), Mexico (99 | 3.6%), Asia (46 | 1.7%), and Philippines (36 | 1.3%), together accounting for 13.9% of all Hallettsville residents.
| Immigration Origin | # Population | % Population |
| Africa | 5 | 0.2% |
| Asia | 46 | 1.7% |
| Canada | 18 | 0.7% |
| Central America | 99 | 3.6% |
| Eastern Africa | 5 | 0.2% |
| Eastern Asia | 6 | 0.2% |
| Europe | 2 | 0.1% |
| India | 4 | 0.2% |
| Japan | 6 | 0.2% |
| Latin America | 99 | 3.6% |
| Mexico | 99 | 3.6% |
| Northern Europe | 2 | 0.1% |
| Philippines | 36 | 1.3% |
| South Central Asia | 4 | 0.2% |
| South Eastern Asia | 36 | 1.3% | View All 15 Rows |
Sex and Age in Hallettsville
Sex and Age in Hallettsville
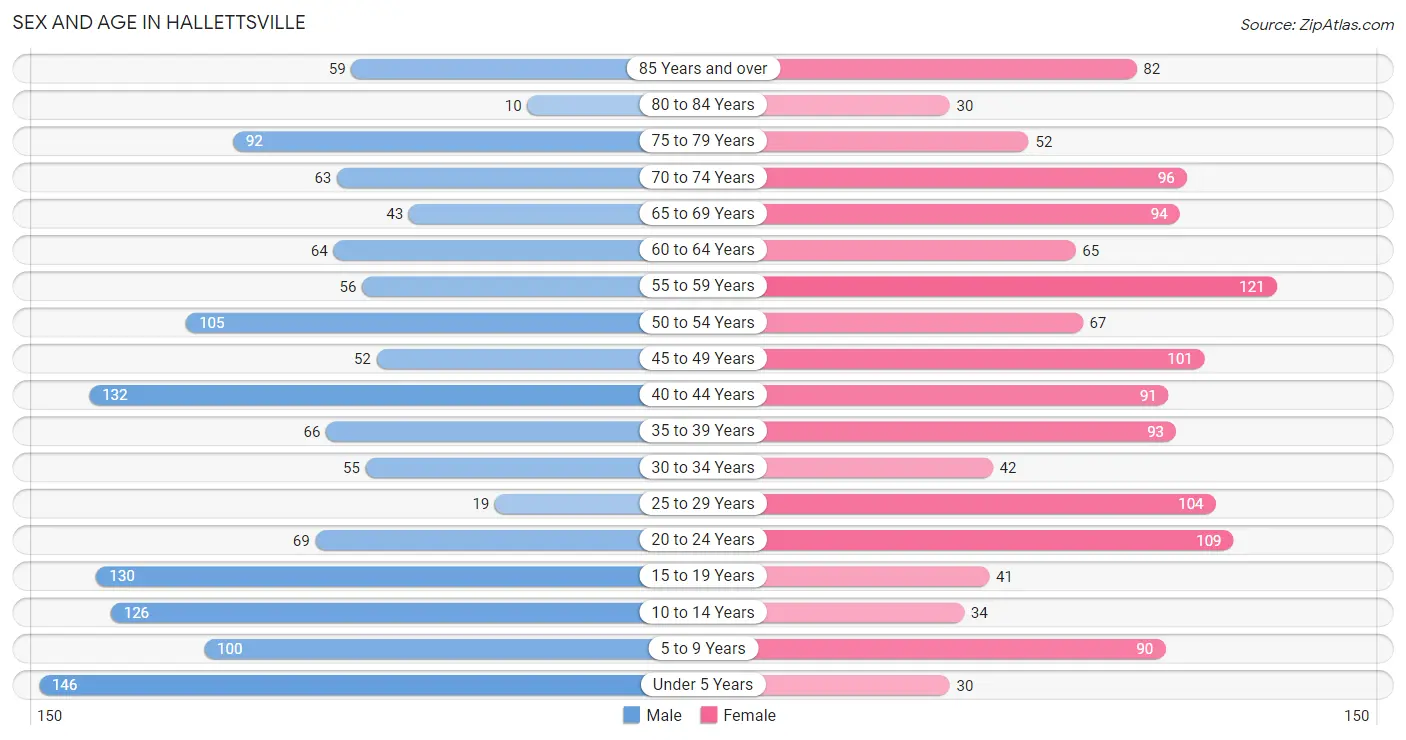
The most populous age groups in Hallettsville are Under 5 Years (146 | 10.5%) for men and 55 to 59 Years (121 | 9.0%) for women.
| Age Bracket | Male | Female |
| Under 5 Years | 146 (10.5%) | 30 (2.2%) |
| 5 to 9 Years | 100 (7.2%) | 90 (6.7%) |
| 10 to 14 Years | 126 (9.1%) | 34 (2.5%) |
| 15 to 19 Years | 130 (9.4%) | 41 (3.1%) |
| 20 to 24 Years | 69 (5.0%) | 109 (8.1%) |
| 25 to 29 Years | 19 (1.4%) | 104 (7.7%) |
| 30 to 34 Years | 55 (4.0%) | 42 (3.1%) |
| 35 to 39 Years | 66 (4.8%) | 93 (6.9%) |
| 40 to 44 Years | 132 (9.5%) | 91 (6.8%) |
| 45 to 49 Years | 52 (3.7%) | 101 (7.5%) |
| 50 to 54 Years | 105 (7.6%) | 67 (5.0%) |
| 55 to 59 Years | 56 (4.0%) | 121 (9.0%) |
| 60 to 64 Years | 64 (4.6%) | 65 (4.8%) |
| 65 to 69 Years | 43 (3.1%) | 94 (7.0%) |
| 70 to 74 Years | 63 (4.5%) | 96 (7.1%) |
| 75 to 79 Years | 92 (6.6%) | 52 (3.9%) |
| 80 to 84 Years | 10 (0.7%) | 30 (2.2%) |
| 85 Years and over | 59 (4.3%) | 82 (6.1%) |
| Total | 1,387 (100.0%) | 1,342 (100.0%) |
Families and Households in Hallettsville
Median Family Size in Hallettsville
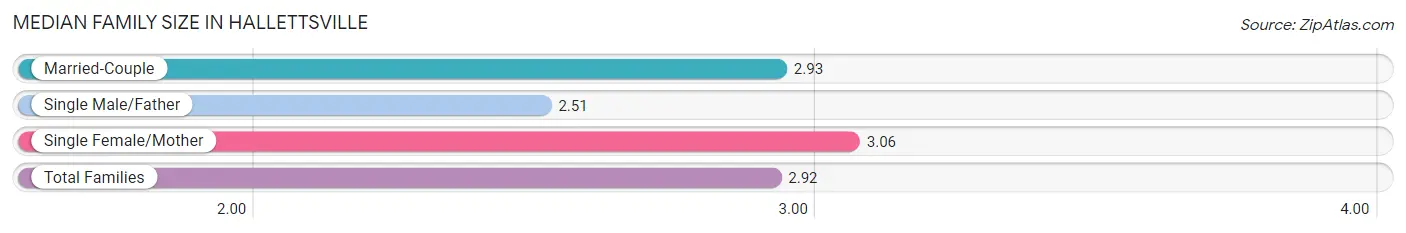
The median family size in Hallettsville is 2.92 persons per family, with single female/mother families (160 | 24.4%) accounting for the largest median family size of 3.06 persons per family. On the other hand, single male/father families (69 | 10.5%) represent the smallest median family size with 2.51 persons per family.
| Family Type | # Families | Family Size |
| Married-Couple | 426 (65.0%) | 2.93 |
| Single Male/Father | 69 (10.5%) | 2.51 |
| Single Female/Mother | 160 (24.4%) | 3.06 |
| Total Families | 655 (100.0%) | 2.92 |
Median Household Size in Hallettsville
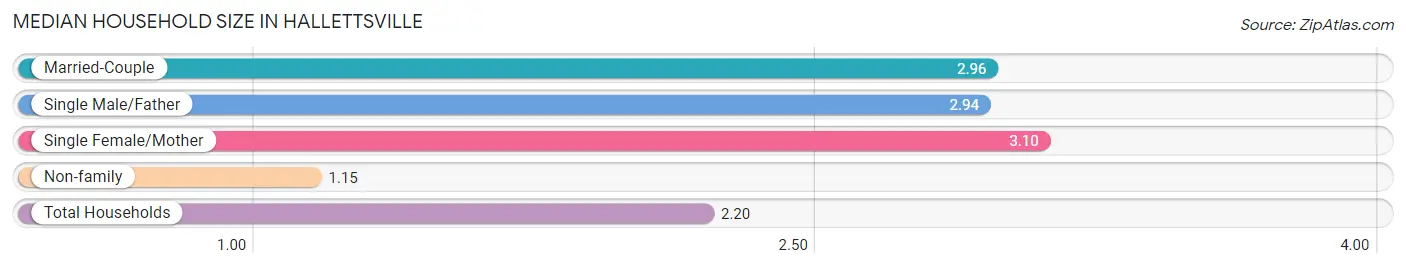
The median household size in Hallettsville is 2.20 persons per household, with single female/mother households (160 | 13.9%) accounting for the largest median household size of 3.1 persons per household. non-family households (497 | 43.1%) represent the smallest median household size with 1.15 persons per household.
| Household Type | # Households | Household Size |
| Married-Couple | 426 (37.0%) | 2.96 |
| Single Male/Father | 69 (6.0%) | 2.94 |
| Single Female/Mother | 160 (13.9%) | 3.10 |
| Non-family | 497 (43.1%) | 1.15 |
| Total Households | 1,152 (100.0%) | 2.20 |
Household Size by Marriage Status in Hallettsville
Out of a total of 1,152 households in Hallettsville, 655 (56.9%) are family households, while 497 (43.1%) are nonfamily households. The most numerous type of family households are 2-person households, comprising 283, and the most common type of nonfamily households are 1-person households, comprising 435.
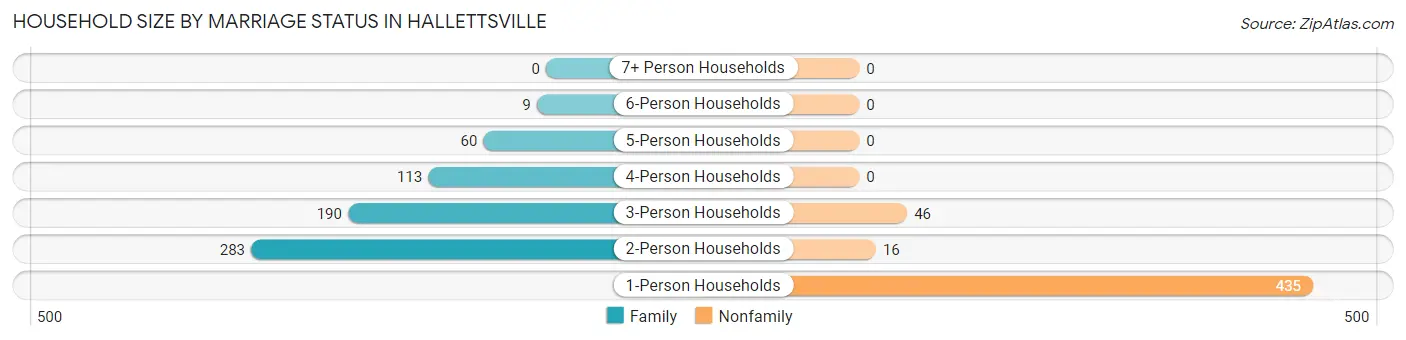
| Household Size | Family Households | Nonfamily Households |
| 1-Person Households | - | 435 (37.8%) |
| 2-Person Households | 283 (24.6%) | 16 (1.4%) |
| 3-Person Households | 190 (16.5%) | 46 (4.0%) |
| 4-Person Households | 113 (9.8%) | 0 (0.0%) |
| 5-Person Households | 60 (5.2%) | 0 (0.0%) |
| 6-Person Households | 9 (0.8%) | 0 (0.0%) |
| 7+ Person Households | 0 (0.0%) | 0 (0.0%) |
| Total | 655 (56.9%) | 497 (43.1%) |
Female Fertility in Hallettsville
Fertility by Age in Hallettsville
Average fertility rate in Hallettsville is 21.0 births per 1,000 women. Women in the age bracket of 35 to 50 years have the highest fertility rate with 25.0 births per 1,000 women. Women in the age bracket of 35 to 50 years acount for 61.5% of all women with births.
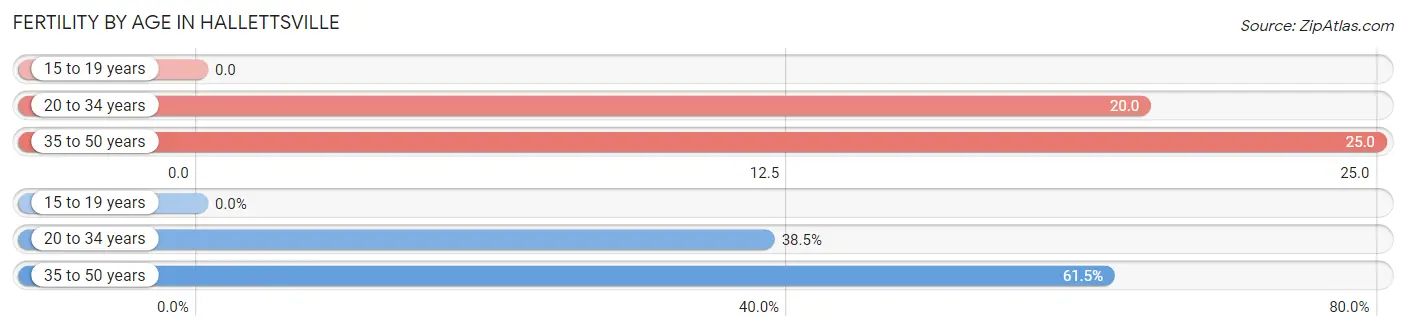
| Age Bracket | Women with Births | Births / 1,000 Women |
| 15 to 19 years | 0 (0.0%) | 0.0 |
| 20 to 34 years | 5 (38.5%) | 20.0 |
| 35 to 50 years | 8 (61.5%) | 25.0 |
| Total | 13 (100.0%) | 21.0 |
Fertility by Age by Marriage Status in Hallettsville
38.5% of women with births (13) in Hallettsville are married. The highest percentage of unmarried women with births falls into 35 to 50 years age bracket with 100.0% of them unmarried at the time of birth, while the lowest percentage of unmarried women with births belong to 20 to 34 years age bracket with 0.0% of them unmarried.
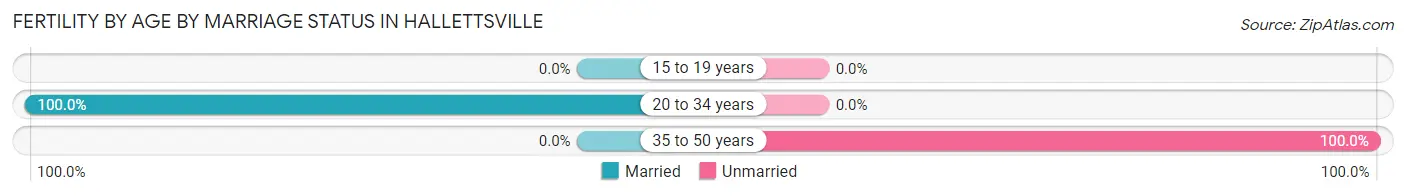
| Age Bracket | Married | Unmarried |
| 15 to 19 years | 0 (0.0%) | 0 (0.0%) |
| 20 to 34 years | 5 (100.0%) | 0 (0.0%) |
| 35 to 50 years | 0 (0.0%) | 8 (100.0%) |
| Total | 5 (38.5%) | 8 (61.5%) |
Fertility by Education in Hallettsville
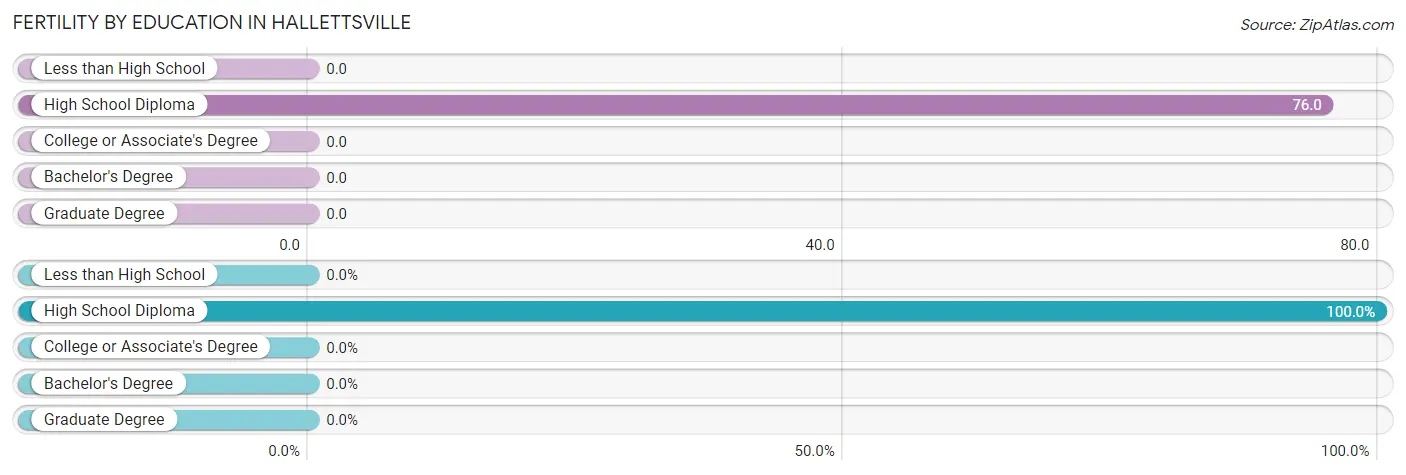
| Educational Attainment | Women with Births | Births / 1,000 Women |
| Less than High School | 0 (0.0%) | 0.0 |
| High School Diploma | 13 (100.0%) | 76.0 |
| College or Associate's Degree | 0 (0.0%) | 0.0 |
| Bachelor's Degree | 0 (0.0%) | 0.0 |
| Graduate Degree | 0 (0.0%) | 0.0 |
| Total | 13 (100.0%) | 21.0 |
Fertility by Education by Marriage Status in Hallettsville
61.5% of women with births in Hallettsville are unmarried. Women with the educational attainment of high school diploma are most likely to be married with 38.5% of them married at childbirth, while women with the educational attainment of high school diploma are least likely to be married with 61.5% of them unmarried at childbirth.
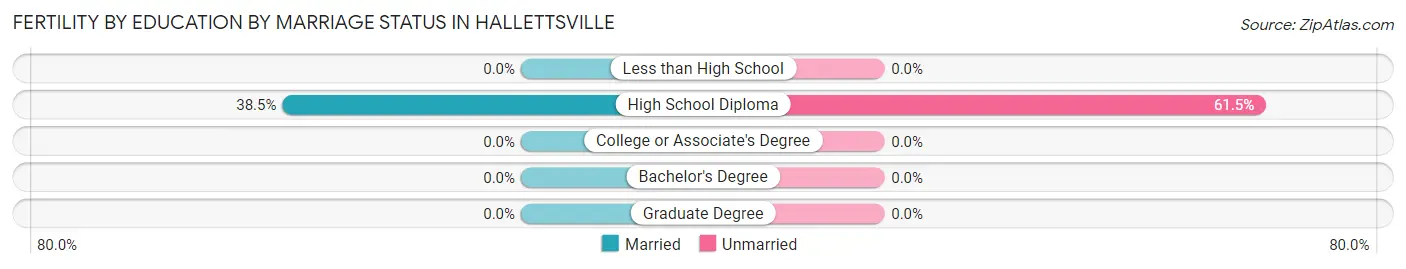
| Educational Attainment | Married | Unmarried |
| Less than High School | 0 (0.0%) | 0 (0.0%) |
| High School Diploma | 5 (38.5%) | 8 (61.5%) |
| College or Associate's Degree | 0 (0.0%) | 0 (0.0%) |
| Bachelor's Degree | 0 (0.0%) | 0 (0.0%) |
| Graduate Degree | 0 (0.0%) | 0 (0.0%) |
| Total | 5 (38.5%) | 8 (61.5%) |
Employment Characteristics in Hallettsville
Employment by Class of Employer in Hallettsville
Among the 1,281 employed individuals in Hallettsville, private company employees (798 | 62.3%), self-employed (not incorporated) (173 | 13.5%), and local government employees (142 | 11.1%) make up the most common classes of employment.
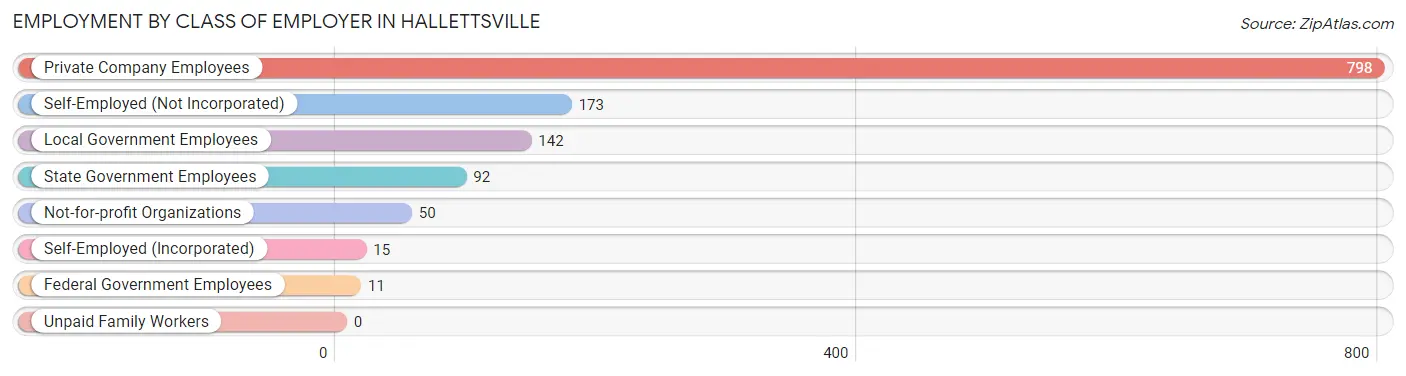
| Employer Class | # Employees | % Employees |
| Private Company Employees | 798 | 62.3% |
| Self-Employed (Incorporated) | 15 | 1.2% |
| Self-Employed (Not Incorporated) | 173 | 13.5% |
| Not-for-profit Organizations | 50 | 3.9% |
| Local Government Employees | 142 | 11.1% |
| State Government Employees | 92 | 7.2% |
| Federal Government Employees | 11 | 0.9% |
| Unpaid Family Workers | 0 | 0.0% |
| Total | 1,281 | 100.0% |
Employment Status by Age in Hallettsville
According to the labor force statistics for Hallettsville, out of the total population over 16 years of age (2,165), 63.7% or 1,379 individuals are in the labor force, with 5.8% or 80 of them unemployed. The age group with the highest labor force participation rate is 25 to 29 years, with 96.7% or 119 individuals in the labor force. Within the labor force, the 16 to 19 years age range has the highest percentage of unemployed individuals, with 35.7% or 20 of them being unemployed.
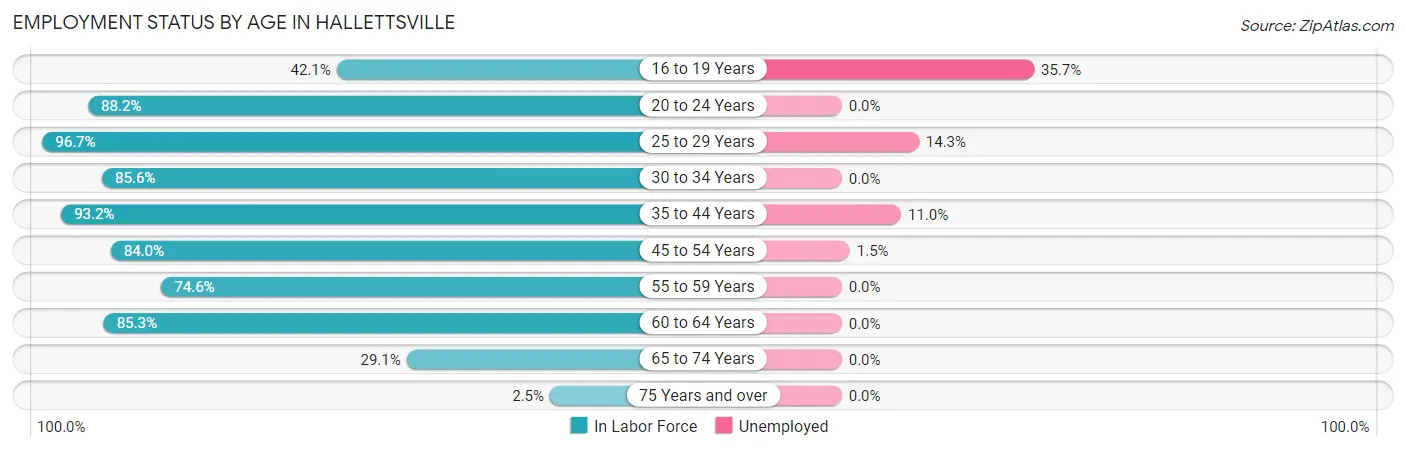
| Age Bracket | In Labor Force | Unemployed |
| 16 to 19 Years | 56 (42.1%) | 20 (35.7%) |
| 20 to 24 Years | 157 (88.2%) | 0 (0.0%) |
| 25 to 29 Years | 119 (96.7%) | 17 (14.3%) |
| 30 to 34 Years | 83 (85.6%) | 0 (0.0%) |
| 35 to 44 Years | 356 (93.2%) | 39 (11.0%) |
| 45 to 54 Years | 273 (84.0%) | 4 (1.5%) |
| 55 to 59 Years | 132 (74.6%) | 0 (0.0%) |
| 60 to 64 Years | 110 (85.3%) | 0 (0.0%) |
| 65 to 74 Years | 86 (29.1%) | 0 (0.0%) |
| 75 Years and over | 8 (2.5%) | 0 (0.0%) |
| Total | 1,379 (63.7%) | 80 (5.8%) |
Employment Status by Educational Attainment in Hallettsville
According to labor force statistics for Hallettsville, 87.0% of individuals (1,073) out of the total population between 25 and 64 years of age (1,233) are in the labor force, with 5.6% or 60 of them being unemployed. The group with the highest labor force participation rate are those with the educational attainment of bachelor's degree or higher, with 97.8% or 221 individuals in the labor force. Within the labor force, individuals with less than high school education have the highest percentage of unemployment, with 26.4% or 19 of them being unemployed.
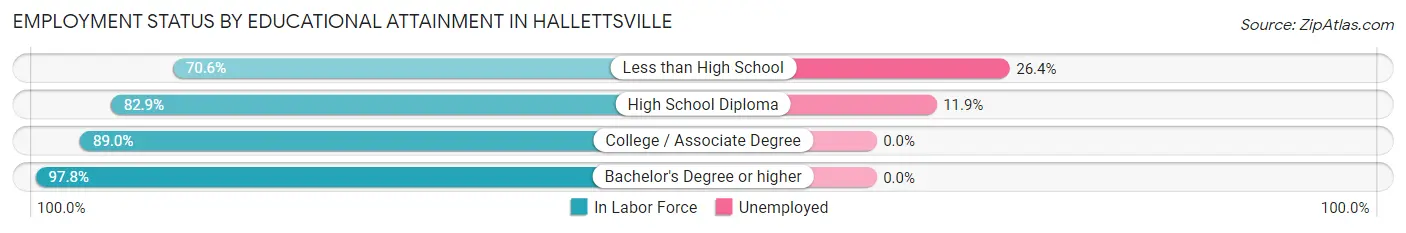
| Educational Attainment | In Labor Force | Unemployed |
| Less than High School | 72 (70.6%) | 27 (26.4%) |
| High School Diploma | 345 (82.9%) | 50 (11.9%) |
| College / Associate Degree | 435 (89.0%) | 0 (0.0%) |
| Bachelor's Degree or higher | 221 (97.8%) | 0 (0.0%) |
| Total | 1,073 (87.0%) | 69 (5.6%) |
Employment Occupations by Sex in Hallettsville
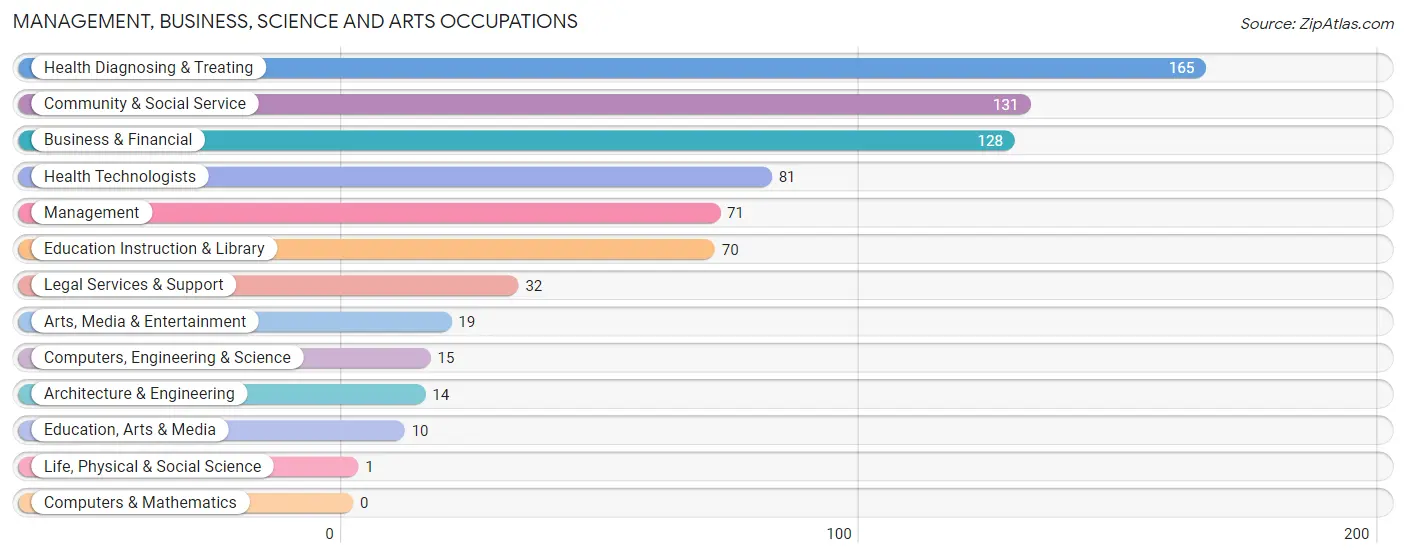
Management, Business, Science and Arts Occupations
The most common Management, Business, Science and Arts occupations in Hallettsville are Health Diagnosing & Treating (165 | 12.7%), Community & Social Service (131 | 10.1%), Business & Financial (128 | 9.9%), Health Technologists (81 | 6.2%), and Management (71 | 5.5%).
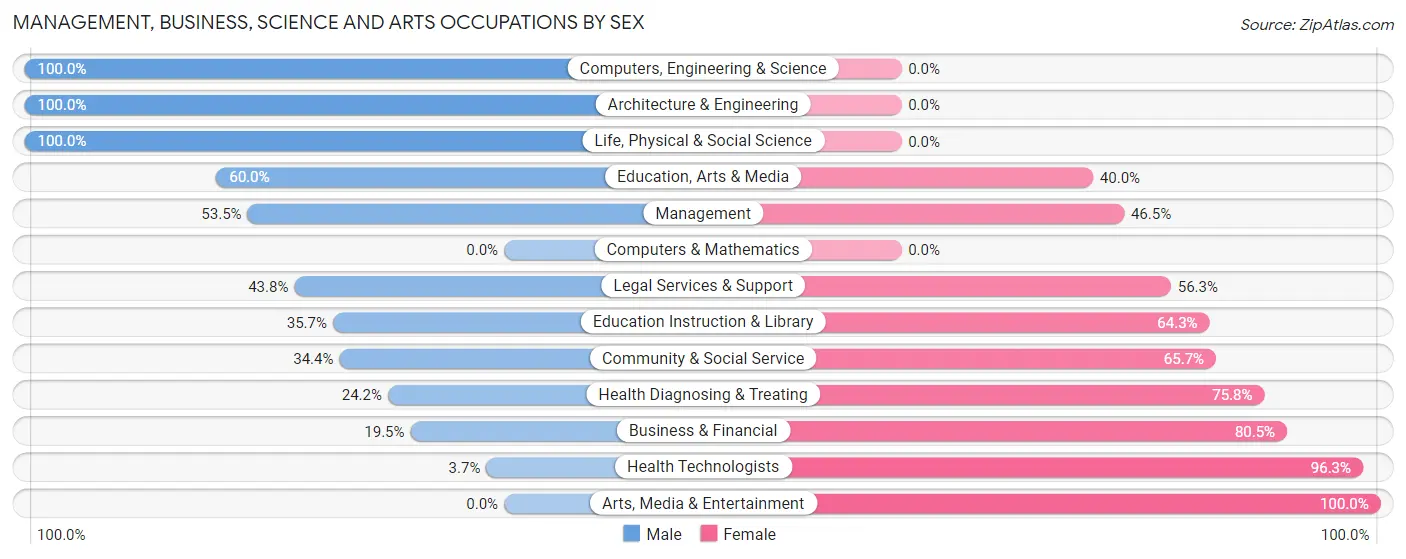
Management, Business, Science and Arts Occupations by Sex
Within the Management, Business, Science and Arts occupations in Hallettsville, the most male-oriented occupations are Computers, Engineering & Science (100.0%), Architecture & Engineering (100.0%), and Life, Physical & Social Science (100.0%), while the most female-oriented occupations are Arts, Media & Entertainment (100.0%), Health Technologists (96.3%), and Business & Financial (80.5%).
| Occupation | Male | Female |
| Management | 38 (53.5%) | 33 (46.5%) |
| Business & Financial | 25 (19.5%) | 103 (80.5%) |
| Computers, Engineering & Science | 15 (100.0%) | 0 (0.0%) |
| Computers & Mathematics | 0 (0.0%) | 0 (0.0%) |
| Architecture & Engineering | 14 (100.0%) | 0 (0.0%) |
| Life, Physical & Social Science | 1 (100.0%) | 0 (0.0%) |
| Community & Social Service | 45 (34.4%) | 86 (65.6%) |
| Education, Arts & Media | 6 (60.0%) | 4 (40.0%) |
| Legal Services & Support | 14 (43.8%) | 18 (56.2%) |
| Education Instruction & Library | 25 (35.7%) | 45 (64.3%) |
| Arts, Media & Entertainment | 0 (0.0%) | 19 (100.0%) |
| Health Diagnosing & Treating | 40 (24.2%) | 125 (75.8%) |
| Health Technologists | 3 (3.7%) | 78 (96.3%) |
| Total (Category) | 163 (32.0%) | 347 (68.0%) |
| Total (Overall) | 540 (41.5%) | 760 (58.5%) |
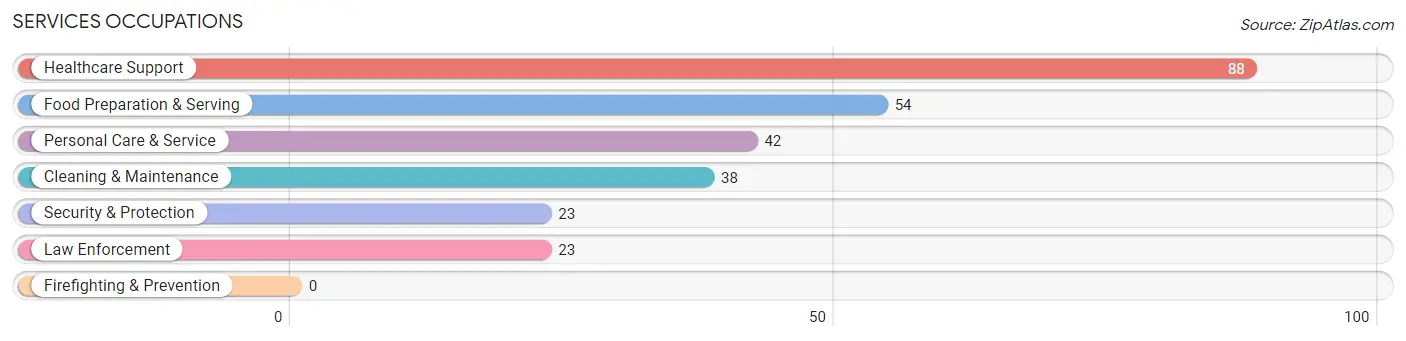
Services Occupations
The most common Services occupations in Hallettsville are Healthcare Support (88 | 6.8%), Food Preparation & Serving (54 | 4.2%), Personal Care & Service (42 | 3.2%), Cleaning & Maintenance (38 | 2.9%), and Security & Protection (23 | 1.8%).
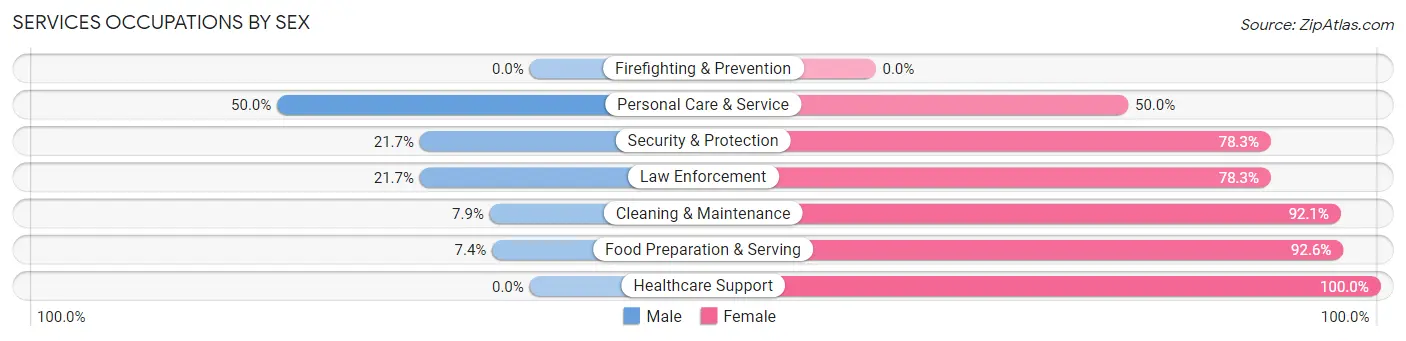
Services Occupations by Sex
Within the Services occupations in Hallettsville, the most male-oriented occupations are Personal Care & Service (50.0%), Security & Protection (21.7%), and Law Enforcement (21.7%), while the most female-oriented occupations are Healthcare Support (100.0%), Food Preparation & Serving (92.6%), and Cleaning & Maintenance (92.1%).
| Occupation | Male | Female |
| Healthcare Support | 0 (0.0%) | 88 (100.0%) |
| Security & Protection | 5 (21.7%) | 18 (78.3%) |
| Firefighting & Prevention | 0 (0.0%) | 0 (0.0%) |
| Law Enforcement | 5 (21.7%) | 18 (78.3%) |
| Food Preparation & Serving | 4 (7.4%) | 50 (92.6%) |
| Cleaning & Maintenance | 3 (7.9%) | 35 (92.1%) |
| Personal Care & Service | 21 (50.0%) | 21 (50.0%) |
| Total (Category) | 33 (13.5%) | 212 (86.5%) |
| Total (Overall) | 540 (41.5%) | 760 (58.5%) |
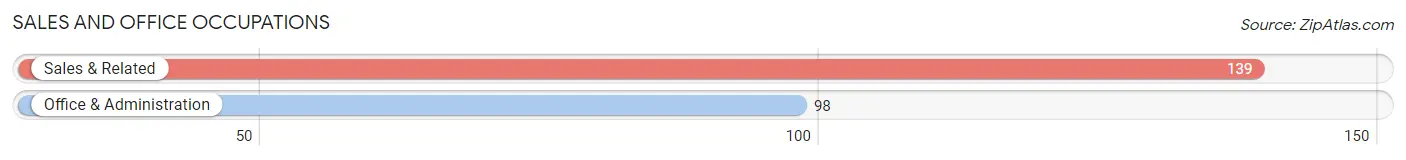
Sales and Office Occupations
The most common Sales and Office occupations in Hallettsville are Sales & Related (139 | 10.7%), and Office & Administration (98 | 7.5%).
Sales and Office Occupations by Sex
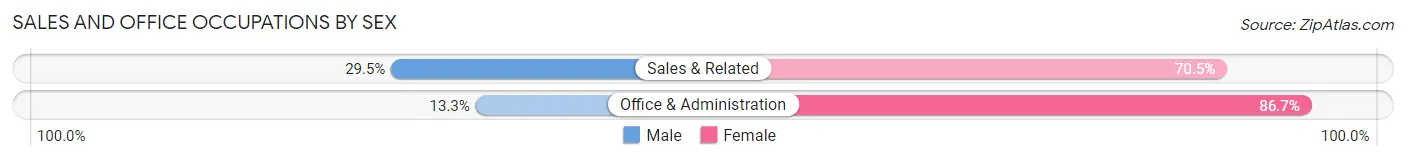
| Occupation | Male | Female |
| Sales & Related | 41 (29.5%) | 98 (70.5%) |
| Office & Administration | 13 (13.3%) | 85 (86.7%) |
| Total (Category) | 54 (22.8%) | 183 (77.2%) |
| Total (Overall) | 540 (41.5%) | 760 (58.5%) |
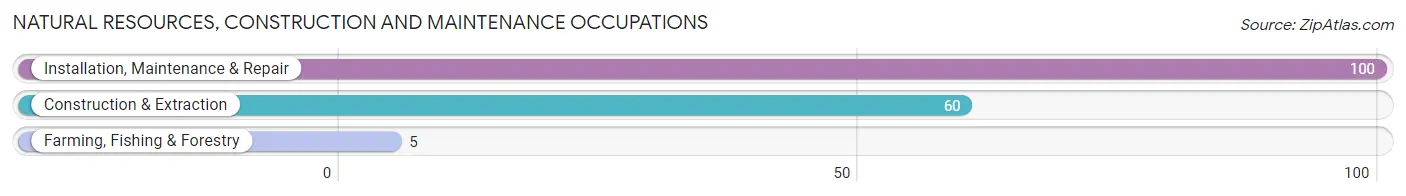
Natural Resources, Construction and Maintenance Occupations
The most common Natural Resources, Construction and Maintenance occupations in Hallettsville are Installation, Maintenance & Repair (100 | 7.7%), Construction & Extraction (60 | 4.6%), and Farming, Fishing & Forestry (5 | 0.4%).
Natural Resources, Construction and Maintenance Occupations by Sex
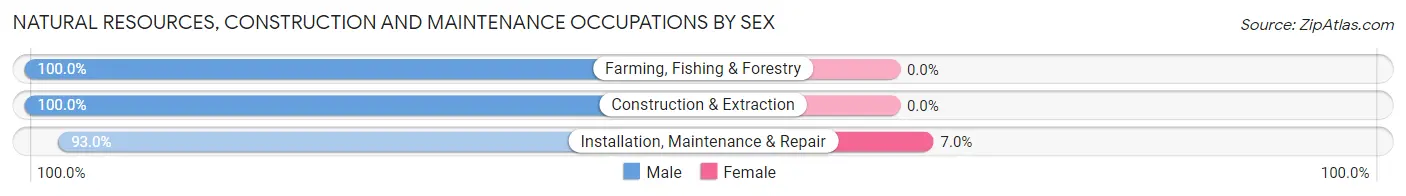
| Occupation | Male | Female |
| Farming, Fishing & Forestry | 5 (100.0%) | 0 (0.0%) |
| Construction & Extraction | 60 (100.0%) | 0 (0.0%) |
| Installation, Maintenance & Repair | 93 (93.0%) | 7 (7.0%) |
| Total (Category) | 158 (95.8%) | 7 (4.2%) |
| Total (Overall) | 540 (41.5%) | 760 (58.5%) |
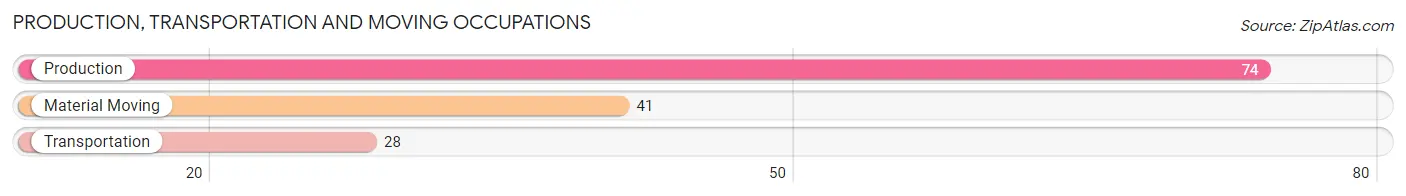
Production, Transportation and Moving Occupations
The most common Production, Transportation and Moving occupations in Hallettsville are Production (74 | 5.7%), Material Moving (41 | 3.2%), and Transportation (28 | 2.1%).
Production, Transportation and Moving Occupations by Sex
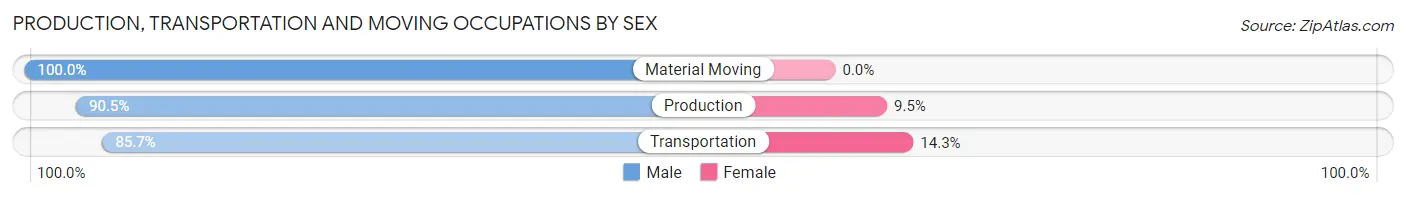
| Occupation | Male | Female |
| Production | 67 (90.5%) | 7 (9.5%) |
| Transportation | 24 (85.7%) | 4 (14.3%) |
| Material Moving | 41 (100.0%) | 0 (0.0%) |
| Total (Category) | 132 (92.3%) | 11 (7.7%) |
| Total (Overall) | 540 (41.5%) | 760 (58.5%) |
Employment Industries by Sex in Hallettsville
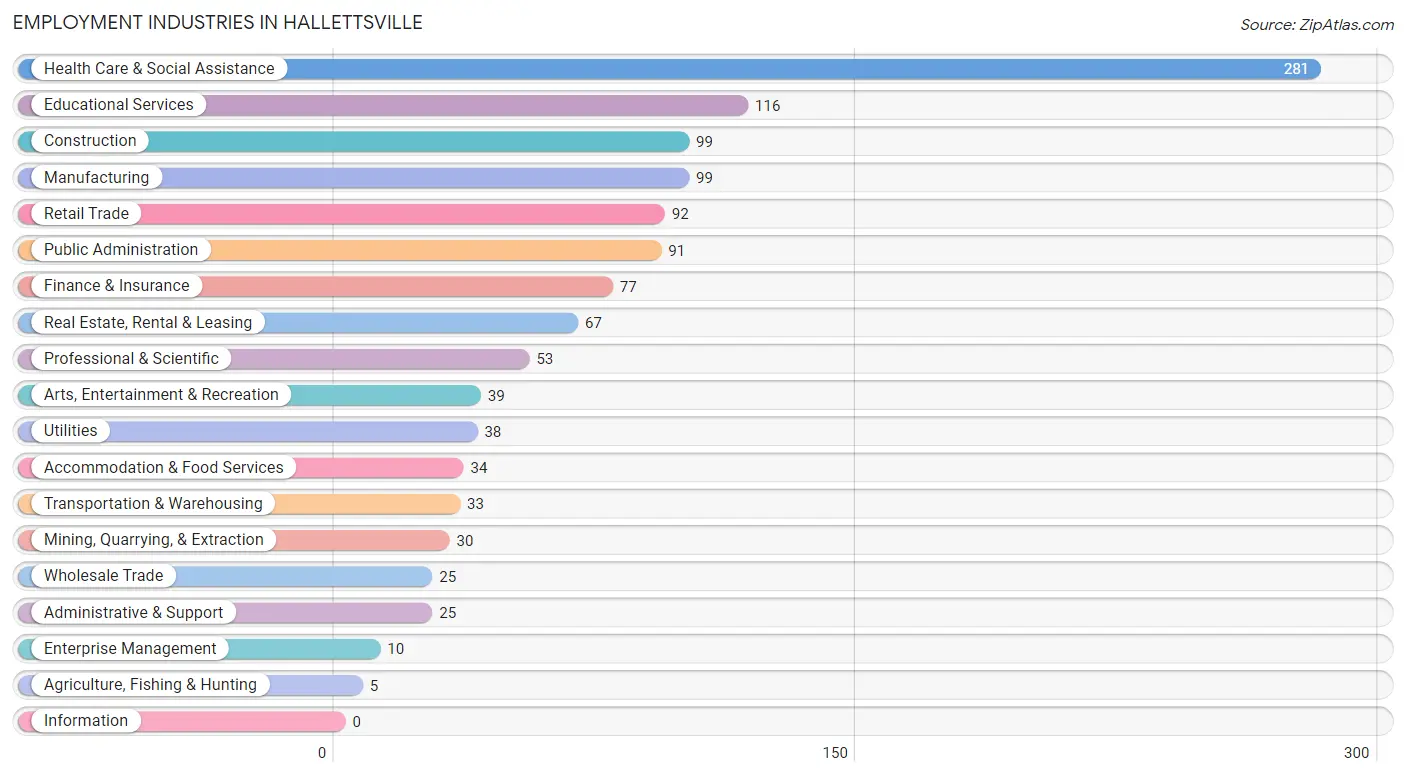
Employment Industries in Hallettsville
The major employment industries in Hallettsville include Health Care & Social Assistance (281 | 21.6%), Educational Services (116 | 8.9%), Construction (99 | 7.6%), Manufacturing (99 | 7.6%), and Retail Trade (92 | 7.1%).
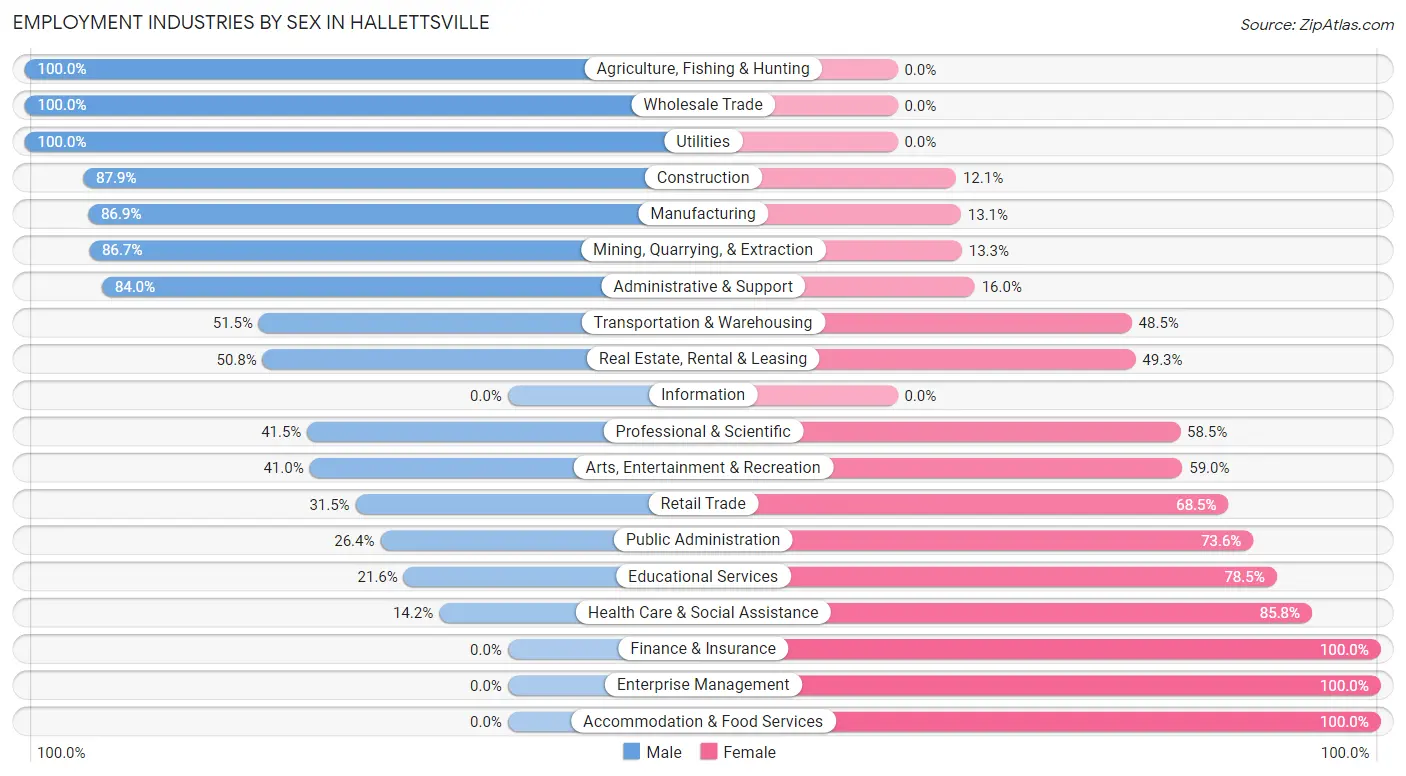
Employment Industries by Sex in Hallettsville
The Hallettsville industries that see more men than women are Agriculture, Fishing & Hunting (100.0%), Wholesale Trade (100.0%), and Utilities (100.0%), whereas the industries that tend to have a higher number of women are Finance & Insurance (100.0%), Enterprise Management (100.0%), and Accommodation & Food Services (100.0%).
| Industry | Male | Female |
| Agriculture, Fishing & Hunting | 5 (100.0%) | 0 (0.0%) |
| Mining, Quarrying, & Extraction | 26 (86.7%) | 4 (13.3%) |
| Construction | 87 (87.9%) | 12 (12.1%) |
| Manufacturing | 86 (86.9%) | 13 (13.1%) |
| Wholesale Trade | 25 (100.0%) | 0 (0.0%) |
| Retail Trade | 29 (31.5%) | 63 (68.5%) |
| Transportation & Warehousing | 17 (51.5%) | 16 (48.5%) |
| Utilities | 38 (100.0%) | 0 (0.0%) |
| Information | 0 (0.0%) | 0 (0.0%) |
| Finance & Insurance | 0 (0.0%) | 77 (100.0%) |
| Real Estate, Rental & Leasing | 34 (50.7%) | 33 (49.2%) |
| Professional & Scientific | 22 (41.5%) | 31 (58.5%) |
| Enterprise Management | 0 (0.0%) | 10 (100.0%) |
| Administrative & Support | 21 (84.0%) | 4 (16.0%) |
| Educational Services | 25 (21.5%) | 91 (78.4%) |
| Health Care & Social Assistance | 40 (14.2%) | 241 (85.8%) |
| Arts, Entertainment & Recreation | 16 (41.0%) | 23 (59.0%) |
| Accommodation & Food Services | 0 (0.0%) | 34 (100.0%) |
| Public Administration | 24 (26.4%) | 67 (73.6%) |
| Total | 540 (41.5%) | 760 (58.5%) |
Education in Hallettsville
School Enrollment in Hallettsville
The most common levels of schooling among the 575 students in Hallettsville are high school (151 | 26.3%), kindergarten (109 | 19.0%), and middle school (109 | 19.0%).
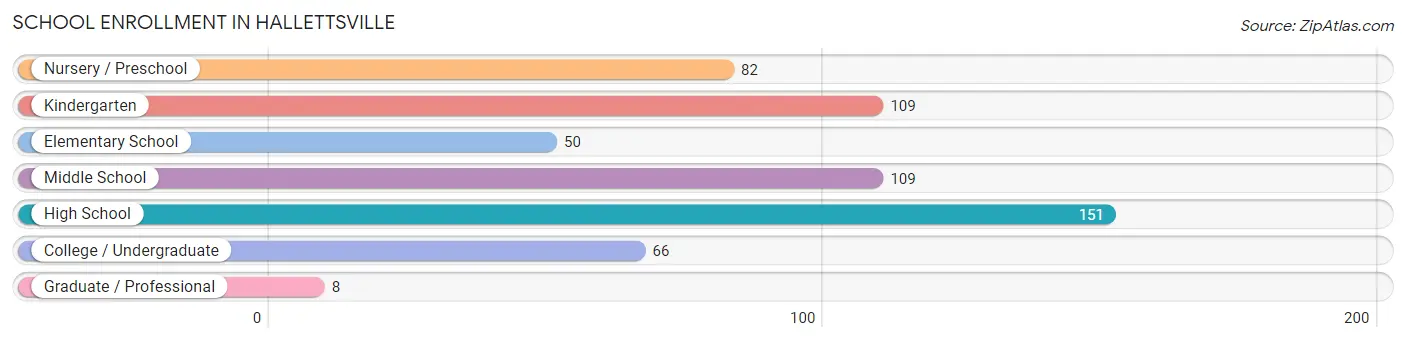
| School Level | # Students | % Students |
| Nursery / Preschool | 82 | 14.3% |
| Kindergarten | 109 | 19.0% |
| Elementary School | 50 | 8.7% |
| Middle School | 109 | 19.0% |
| High School | 151 | 26.3% |
| College / Undergraduate | 66 | 11.5% |
| Graduate / Professional | 8 | 1.4% |
| Total | 575 | 100.0% |
School Enrollment by Age by Funding Source in Hallettsville
Out of a total of 575 students who are enrolled in schools in Hallettsville, 11 (1.9%) attend a private institution, while the remaining 564 (98.1%) are enrolled in public schools. The age group of 10 to 14 year olds has the highest likelihood of being enrolled in private schools, with 8 (5.6% in the age bracket) enrolled. Conversely, the age group of 5 to 9 year old has the lowest likelihood of being enrolled in a private school, with 128 (100.0% in the age bracket) attending a public institution.
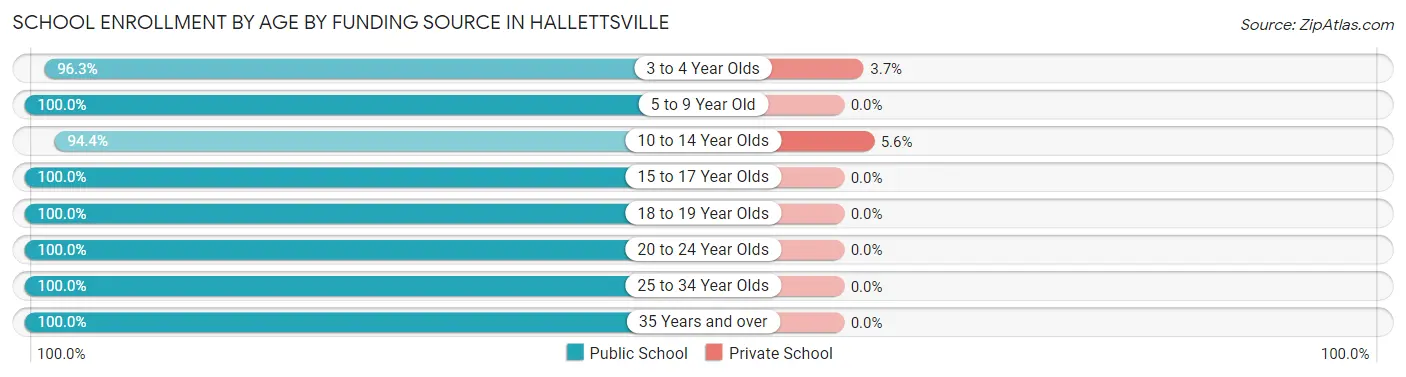
| Age Bracket | Public School | Private School |
| 3 to 4 Year Olds | 79 (96.3%) | 3 (3.7%) |
| 5 to 9 Year Old | 128 (100.0%) | 0 (0.0%) |
| 10 to 14 Year Olds | 135 (94.4%) | 8 (5.6%) |
| 15 to 17 Year Olds | 139 (100.0%) | 0 (0.0%) |
| 18 to 19 Year Olds | 12 (100.0%) | 0 (0.0%) |
| 20 to 24 Year Olds | 52 (100.0%) | 0 (0.0%) |
| 25 to 34 Year Olds | 8 (100.0%) | 0 (0.0%) |
| 35 Years and over | 11 (100.0%) | 0 (0.0%) |
| Total | 564 (98.1%) | 11 (1.9%) |
Educational Attainment by Field of Study in Hallettsville
Business (68 | 22.6%), education (58 | 19.3%), arts & humanities (48 | 16.0%), social sciences (40 | 13.3%), and science & technology (36 | 12.0%) are the most common fields of study among 301 individuals in Hallettsville who have obtained a bachelor's degree or higher.
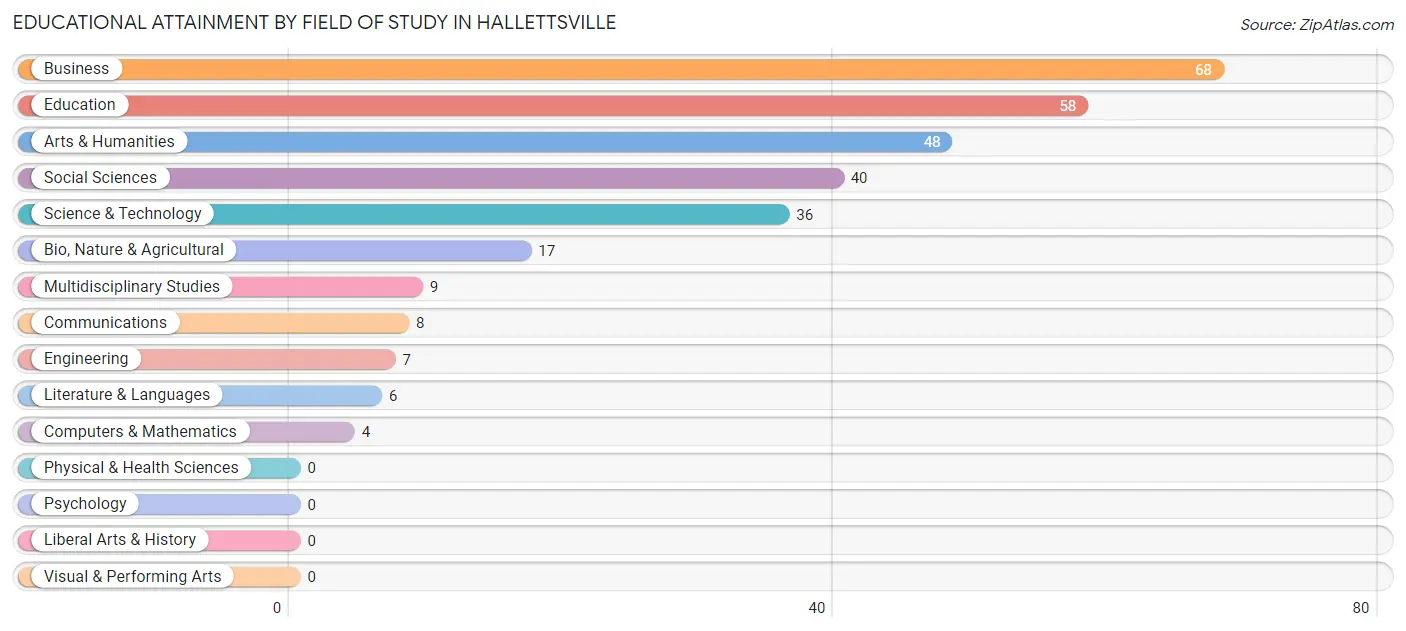
| Field of Study | # Graduates | % Graduates |
| Computers & Mathematics | 4 | 1.3% |
| Bio, Nature & Agricultural | 17 | 5.7% |
| Physical & Health Sciences | 0 | 0.0% |
| Psychology | 0 | 0.0% |
| Social Sciences | 40 | 13.3% |
| Engineering | 7 | 2.3% |
| Multidisciplinary Studies | 9 | 3.0% |
| Science & Technology | 36 | 12.0% |
| Business | 68 | 22.6% |
| Education | 58 | 19.3% |
| Literature & Languages | 6 | 2.0% |
| Liberal Arts & History | 0 | 0.0% |
| Visual & Performing Arts | 0 | 0.0% |
| Communications | 8 | 2.7% |
| Arts & Humanities | 48 | 16.0% |
| Total | 301 | 100.0% |
Transportation & Commute in Hallettsville
Vehicle Availability by Sex in Hallettsville
The most prevalent vehicle ownership categories in Hallettsville are males with 2 vehicles (265, accounting for 49.4%) and females with 2 vehicles (253, making up 35.8%).
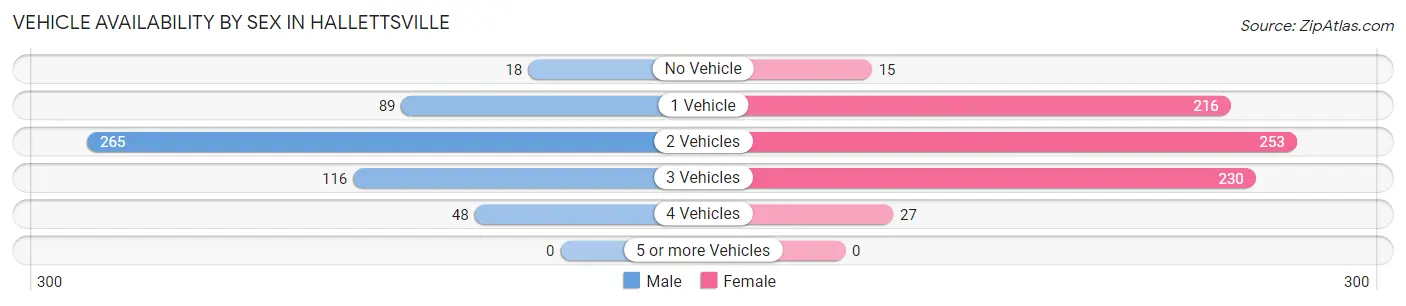
| Vehicles Available | Male | Female |
| No Vehicle | 18 (3.4%) | 15 (2.0%) |
| 1 Vehicle | 89 (16.6%) | 216 (29.1%) |
| 2 Vehicles | 265 (49.4%) | 253 (34.1%) |
| 3 Vehicles | 116 (21.6%) | 230 (31.0%) |
| 4 Vehicles | 48 (9.0%) | 27 (3.6%) |
| 5 or more Vehicles | 0 (0.0%) | 0 (0.0%) |
| Total | 536 (100.0%) | 741 (100.0%) |
Commute Time in Hallettsville
The most frequently occuring commute durations in Hallettsville are 5 to 9 minutes (246 commuters, 20.8%), 10 to 14 minutes (226 commuters, 19.1%), and 20 to 24 minutes (125 commuters, 10.6%).
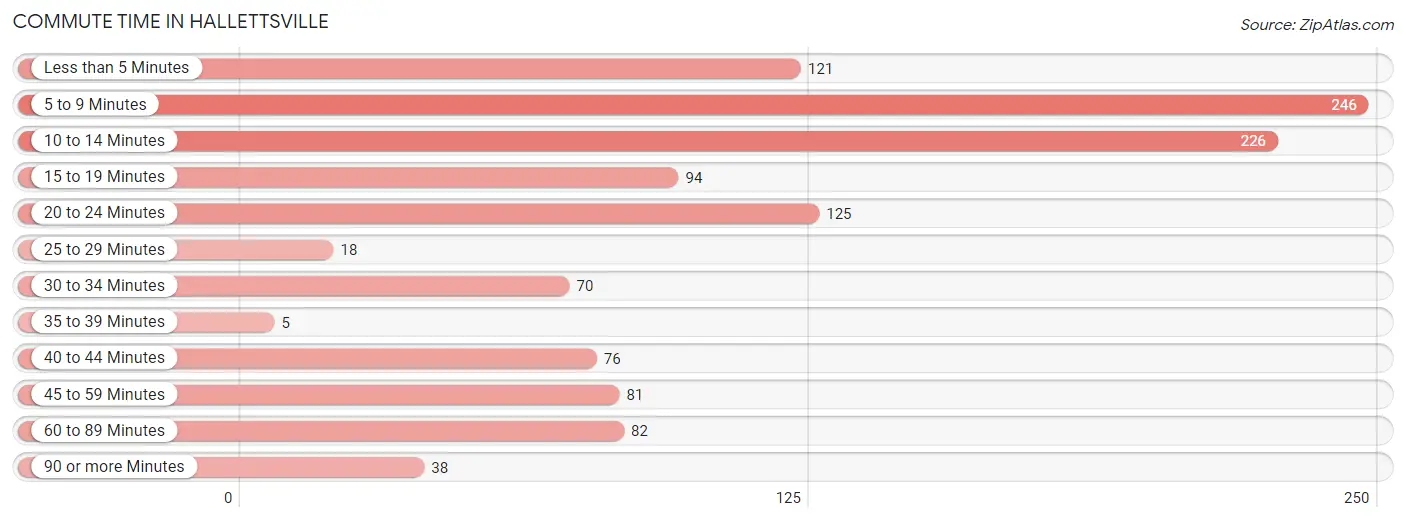
| Commute Time | # Commuters | % Commuters |
| Less than 5 Minutes | 121 | 10.2% |
| 5 to 9 Minutes | 246 | 20.8% |
| 10 to 14 Minutes | 226 | 19.1% |
| 15 to 19 Minutes | 94 | 8.0% |
| 20 to 24 Minutes | 125 | 10.6% |
| 25 to 29 Minutes | 18 | 1.5% |
| 30 to 34 Minutes | 70 | 5.9% |
| 35 to 39 Minutes | 5 | 0.4% |
| 40 to 44 Minutes | 76 | 6.4% |
| 45 to 59 Minutes | 81 | 6.9% |
| 60 to 89 Minutes | 82 | 6.9% |
| 90 or more Minutes | 38 | 3.2% |
Commute Time by Sex in Hallettsville
The most common commute times in Hallettsville are 5 to 9 minutes (96 commuters, 19.1%) for males and 10 to 14 minutes (169 commuters, 24.8%) for females.
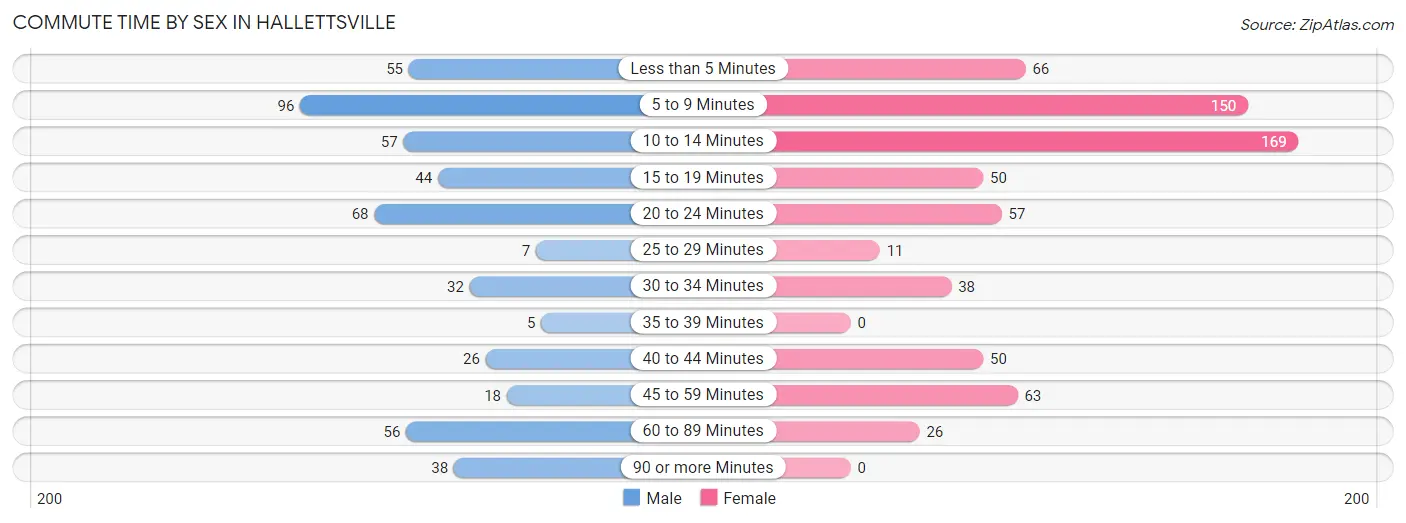
| Commute Time | Male | Female |
| Less than 5 Minutes | 55 (11.0%) | 66 (9.7%) |
| 5 to 9 Minutes | 96 (19.1%) | 150 (22.1%) |
| 10 to 14 Minutes | 57 (11.4%) | 169 (24.8%) |
| 15 to 19 Minutes | 44 (8.8%) | 50 (7.3%) |
| 20 to 24 Minutes | 68 (13.6%) | 57 (8.4%) |
| 25 to 29 Minutes | 7 (1.4%) | 11 (1.6%) |
| 30 to 34 Minutes | 32 (6.4%) | 38 (5.6%) |
| 35 to 39 Minutes | 5 (1.0%) | 0 (0.0%) |
| 40 to 44 Minutes | 26 (5.2%) | 50 (7.3%) |
| 45 to 59 Minutes | 18 (3.6%) | 63 (9.3%) |
| 60 to 89 Minutes | 56 (11.2%) | 26 (3.8%) |
| 90 or more Minutes | 38 (7.6%) | 0 (0.0%) |
Time of Departure to Work by Sex in Hallettsville
The most frequent times of departure to work in Hallettsville are 7:00 AM to 7:29 AM (143, 28.5%) for males and 7:30 AM to 7:59 AM (143, 21.0%) for females.
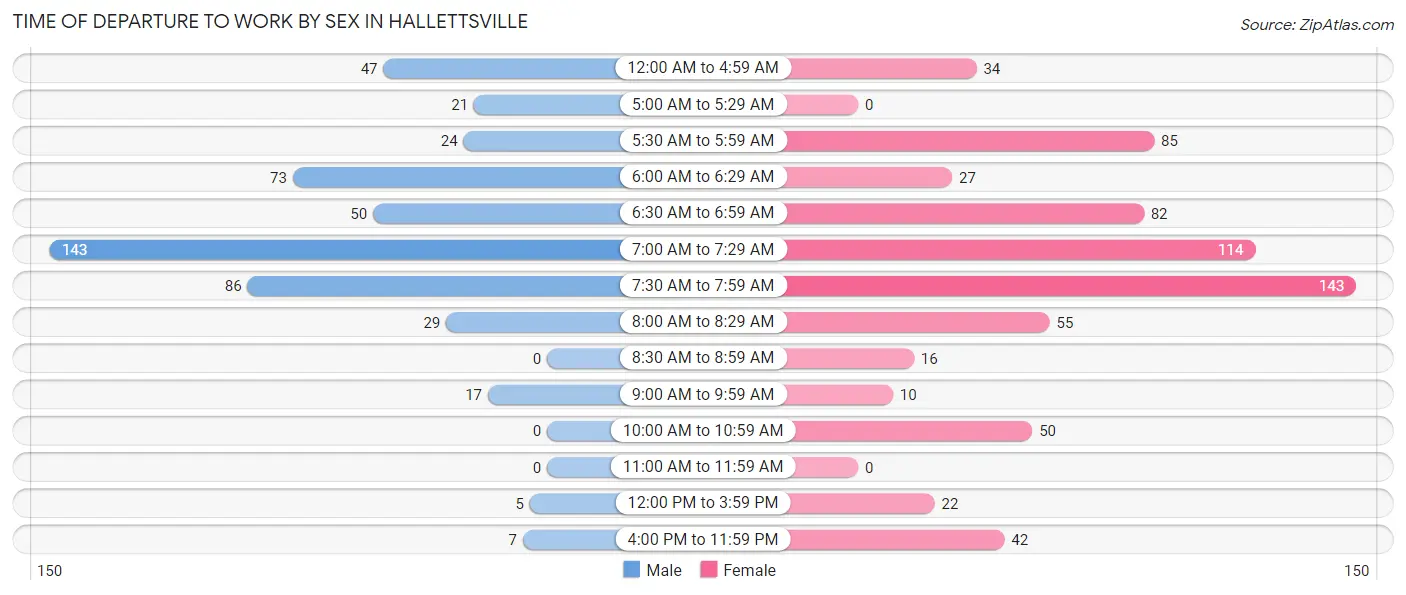
| Time of Departure | Male | Female |
| 12:00 AM to 4:59 AM | 47 (9.4%) | 34 (5.0%) |
| 5:00 AM to 5:29 AM | 21 (4.2%) | 0 (0.0%) |
| 5:30 AM to 5:59 AM | 24 (4.8%) | 85 (12.5%) |
| 6:00 AM to 6:29 AM | 73 (14.5%) | 27 (4.0%) |
| 6:30 AM to 6:59 AM | 50 (10.0%) | 82 (12.1%) |
| 7:00 AM to 7:29 AM | 143 (28.5%) | 114 (16.8%) |
| 7:30 AM to 7:59 AM | 86 (17.1%) | 143 (21.0%) |
| 8:00 AM to 8:29 AM | 29 (5.8%) | 55 (8.1%) |
| 8:30 AM to 8:59 AM | 0 (0.0%) | 16 (2.4%) |
| 9:00 AM to 9:59 AM | 17 (3.4%) | 10 (1.5%) |
| 10:00 AM to 10:59 AM | 0 (0.0%) | 50 (7.3%) |
| 11:00 AM to 11:59 AM | 0 (0.0%) | 0 (0.0%) |
| 12:00 PM to 3:59 PM | 5 (1.0%) | 22 (3.2%) |
| 4:00 PM to 11:59 PM | 7 (1.4%) | 42 (6.2%) |
| Total | 502 (100.0%) | 680 (100.0%) |
Housing Occupancy in Hallettsville
Occupancy by Ownership in Hallettsville
Of the total 1,152 dwellings in Hallettsville, owner-occupied units account for 640 (55.6%), while renter-occupied units make up 512 (44.4%).
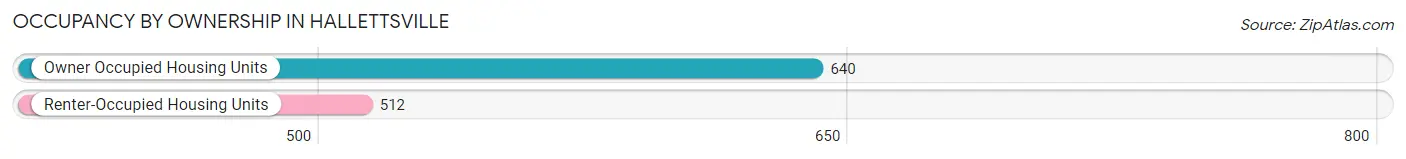
| Occupancy | # Housing Units | % Housing Units |
| Owner Occupied Housing Units | 640 | 55.6% |
| Renter-Occupied Housing Units | 512 | 44.4% |
| Total Occupied Housing Units | 1,152 | 100.0% |
Occupancy by Household Size in Hallettsville
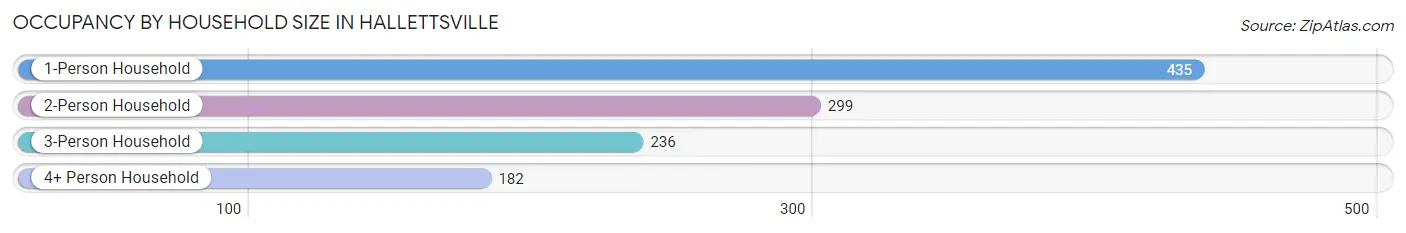
| Household Size | # Housing Units | % Housing Units |
| 1-Person Household | 435 | 37.8% |
| 2-Person Household | 299 | 26.0% |
| 3-Person Household | 236 | 20.5% |
| 4+ Person Household | 182 | 15.8% |
| Total Housing Units | 1,152 | 100.0% |
Occupancy by Ownership by Household Size in Hallettsville
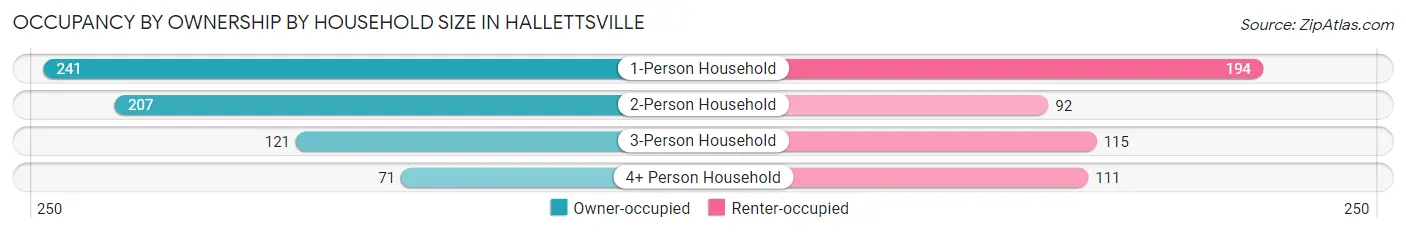
| Household Size | Owner-occupied | Renter-occupied |
| 1-Person Household | 241 (55.4%) | 194 (44.6%) |
| 2-Person Household | 207 (69.2%) | 92 (30.8%) |
| 3-Person Household | 121 (51.3%) | 115 (48.7%) |
| 4+ Person Household | 71 (39.0%) | 111 (61.0%) |
| Total Housing Units | 640 (55.6%) | 512 (44.4%) |
Occupancy by Educational Attainment in Hallettsville
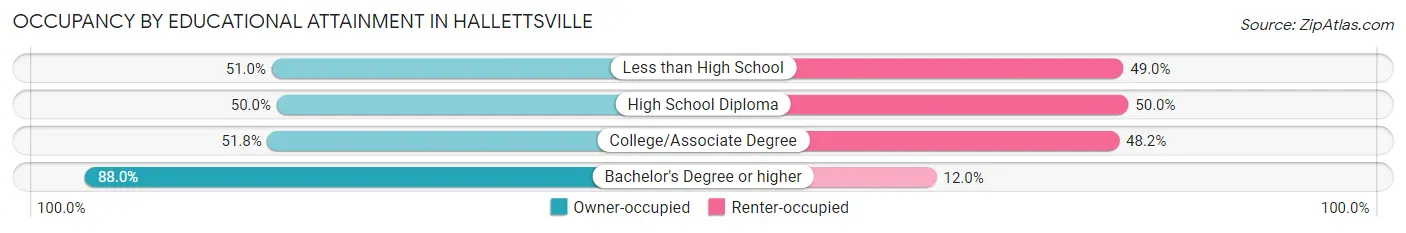
| Household Size | Owner-occupied | Renter-occupied |
| Less than High School | 77 (51.0%) | 74 (49.0%) |
| High School Diploma | 197 (50.0%) | 197 (50.0%) |
| College/Associate Degree | 241 (51.8%) | 224 (48.2%) |
| Bachelor's Degree or higher | 125 (88.0%) | 17 (12.0%) |
Occupancy by Age of Householder in Hallettsville
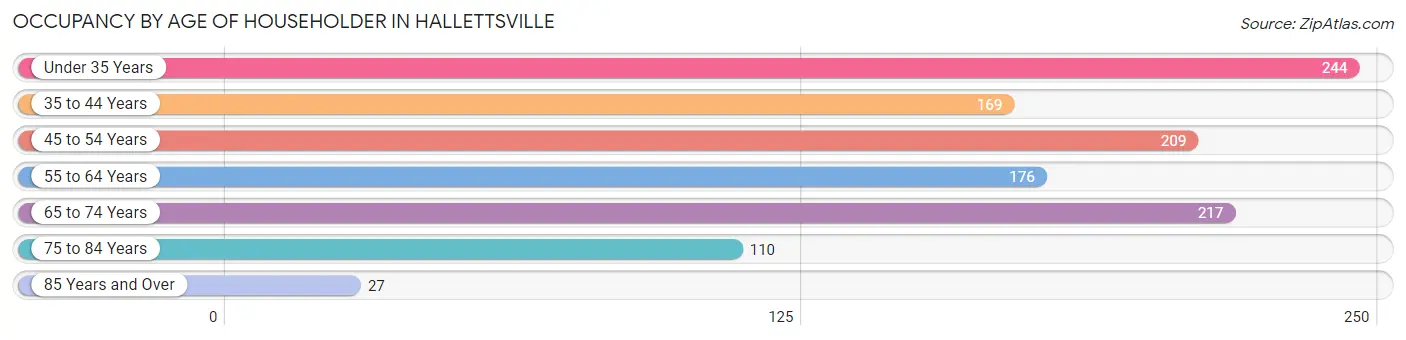
| Age Bracket | # Households | % Households |
| Under 35 Years | 244 | 21.2% |
| 35 to 44 Years | 169 | 14.7% |
| 45 to 54 Years | 209 | 18.1% |
| 55 to 64 Years | 176 | 15.3% |
| 65 to 74 Years | 217 | 18.8% |
| 75 to 84 Years | 110 | 9.6% |
| 85 Years and Over | 27 | 2.3% |
| Total | 1,152 | 100.0% |
Housing Finances in Hallettsville
Median Income by Occupancy in Hallettsville
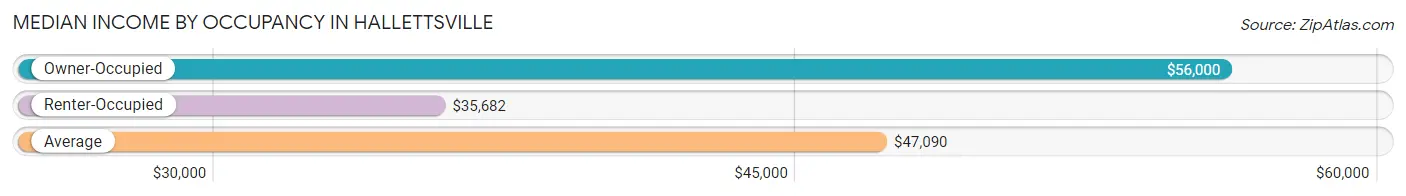
| Occupancy Type | # Households | Median Income |
| Owner-Occupied | 640 (55.6%) | $56,000 |
| Renter-Occupied | 512 (44.4%) | $35,682 |
| Average | 1,152 (100.0%) | $47,090 |
Occupancy by Householder Income Bracket in Hallettsville
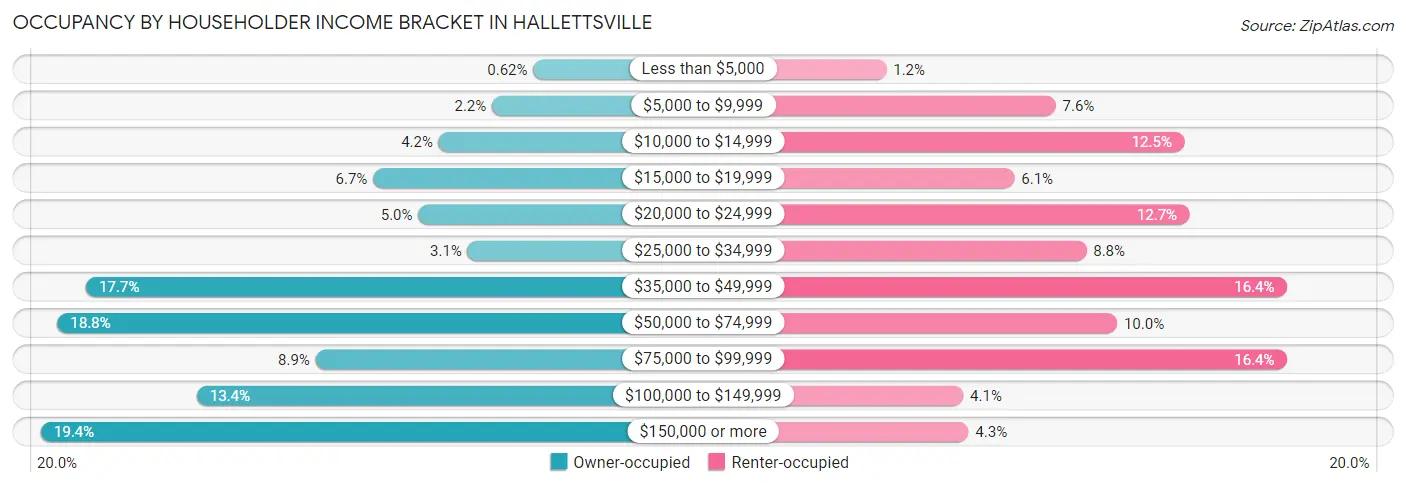
| Income Bracket | Owner-occupied | Renter-occupied |
| Less than $5,000 | 4 (0.6%) | 6 (1.2%) |
| $5,000 to $9,999 | 14 (2.2%) | 39 (7.6%) |
| $10,000 to $14,999 | 27 (4.2%) | 64 (12.5%) |
| $15,000 to $19,999 | 43 (6.7%) | 31 (6.0%) |
| $20,000 to $24,999 | 32 (5.0%) | 65 (12.7%) |
| $25,000 to $34,999 | 20 (3.1%) | 45 (8.8%) |
| $35,000 to $49,999 | 113 (17.7%) | 84 (16.4%) |
| $50,000 to $74,999 | 120 (18.8%) | 51 (10.0%) |
| $75,000 to $99,999 | 57 (8.9%) | 84 (16.4%) |
| $100,000 to $149,999 | 86 (13.4%) | 21 (4.1%) |
| $150,000 or more | 124 (19.4%) | 22 (4.3%) |
| Total | 640 (100.0%) | 512 (100.0%) |
Monthly Housing Cost Tiers in Hallettsville
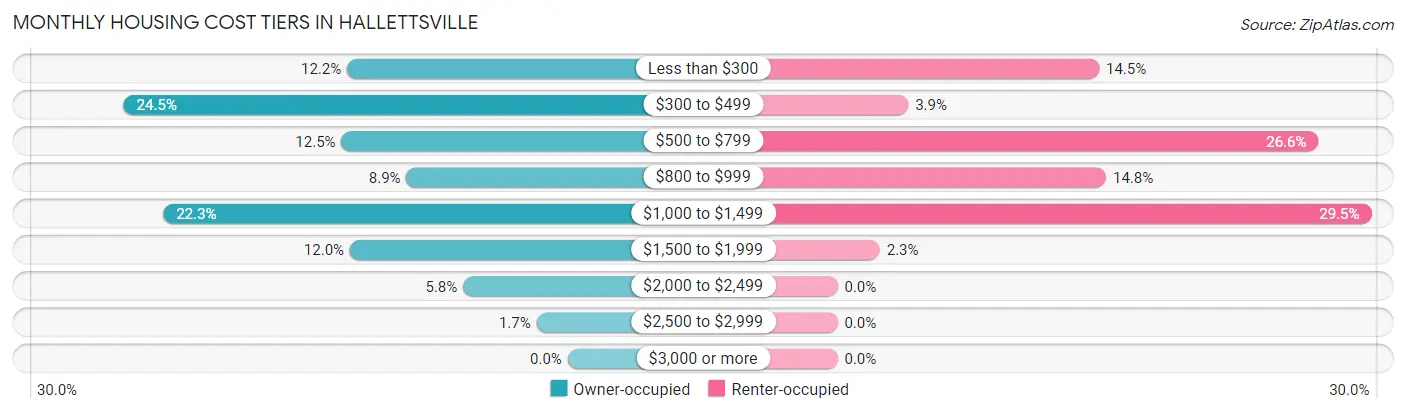
| Monthly Cost | Owner-occupied | Renter-occupied |
| Less than $300 | 78 (12.2%) | 74 (14.4%) |
| $300 to $499 | 157 (24.5%) | 20 (3.9%) |
| $500 to $799 | 80 (12.5%) | 136 (26.6%) |
| $800 to $999 | 57 (8.9%) | 76 (14.8%) |
| $1,000 to $1,499 | 143 (22.3%) | 151 (29.5%) |
| $1,500 to $1,999 | 77 (12.0%) | 12 (2.3%) |
| $2,000 to $2,499 | 37 (5.8%) | 0 (0.0%) |
| $2,500 to $2,999 | 11 (1.7%) | 0 (0.0%) |
| $3,000 or more | 0 (0.0%) | 0 (0.0%) |
| Total | 640 (100.0%) | 512 (100.0%) |
Physical Housing Characteristics in Hallettsville
Housing Structures in Hallettsville
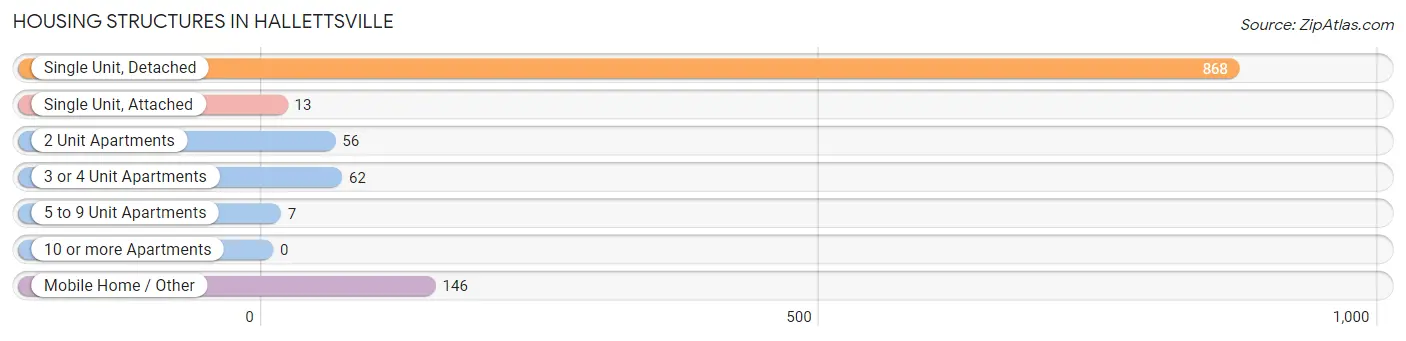
| Structure Type | # Housing Units | % Housing Units |
| Single Unit, Detached | 868 | 75.3% |
| Single Unit, Attached | 13 | 1.1% |
| 2 Unit Apartments | 56 | 4.9% |
| 3 or 4 Unit Apartments | 62 | 5.4% |
| 5 to 9 Unit Apartments | 7 | 0.6% |
| 10 or more Apartments | 0 | 0.0% |
| Mobile Home / Other | 146 | 12.7% |
| Total | 1,152 | 100.0% |
Housing Structures by Occupancy in Hallettsville
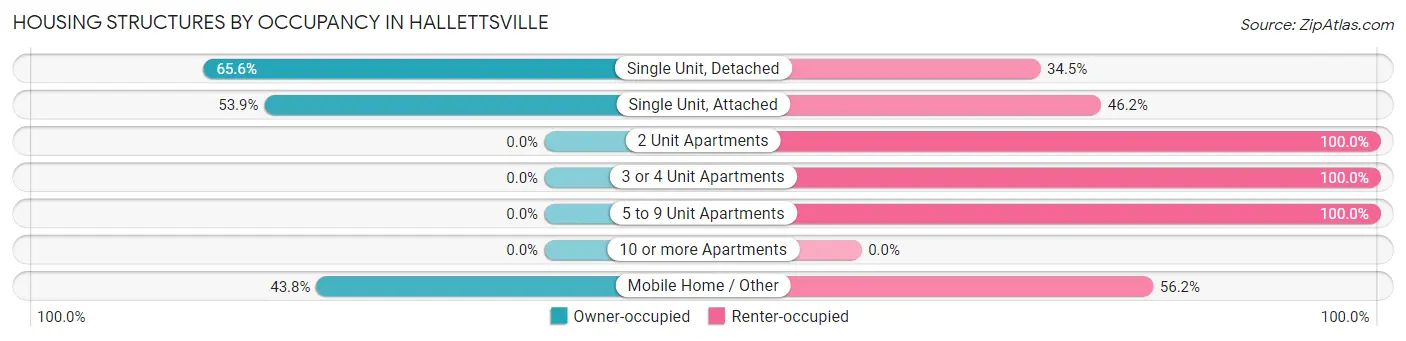
| Structure Type | Owner-occupied | Renter-occupied |
| Single Unit, Detached | 569 (65.5%) | 299 (34.4%) |
| Single Unit, Attached | 7 (53.8%) | 6 (46.2%) |
| 2 Unit Apartments | 0 (0.0%) | 56 (100.0%) |
| 3 or 4 Unit Apartments | 0 (0.0%) | 62 (100.0%) |
| 5 to 9 Unit Apartments | 0 (0.0%) | 7 (100.0%) |
| 10 or more Apartments | 0 (0.0%) | 0 (0.0%) |
| Mobile Home / Other | 64 (43.8%) | 82 (56.2%) |
| Total | 640 (55.6%) | 512 (44.4%) |
Housing Structures by Number of Rooms in Hallettsville
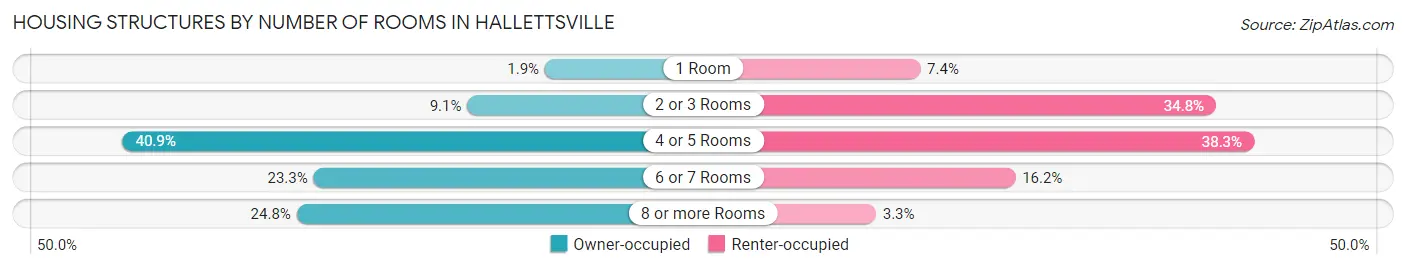
| Number of Rooms | Owner-occupied | Renter-occupied |
| 1 Room | 12 (1.9%) | 38 (7.4%) |
| 2 or 3 Rooms | 58 (9.1%) | 178 (34.8%) |
| 4 or 5 Rooms | 262 (40.9%) | 196 (38.3%) |
| 6 or 7 Rooms | 149 (23.3%) | 83 (16.2%) |
| 8 or more Rooms | 159 (24.8%) | 17 (3.3%) |
| Total | 640 (100.0%) | 512 (100.0%) |
Housing Structure by Heating Type in Hallettsville
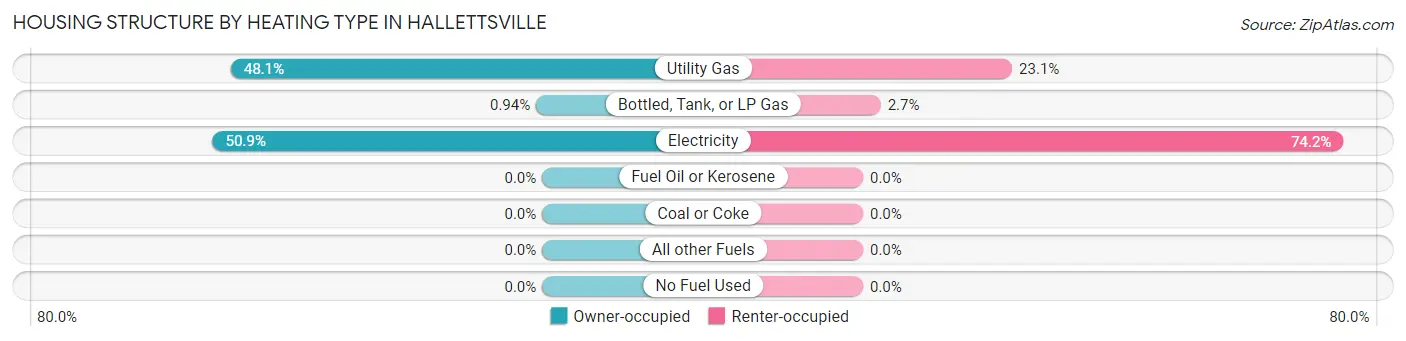
| Heating Type | Owner-occupied | Renter-occupied |
| Utility Gas | 308 (48.1%) | 118 (23.1%) |
| Bottled, Tank, or LP Gas | 6 (0.9%) | 14 (2.7%) |
| Electricity | 326 (50.9%) | 380 (74.2%) |
| Fuel Oil or Kerosene | 0 (0.0%) | 0 (0.0%) |
| Coal or Coke | 0 (0.0%) | 0 (0.0%) |
| All other Fuels | 0 (0.0%) | 0 (0.0%) |
| No Fuel Used | 0 (0.0%) | 0 (0.0%) |
| Total | 640 (100.0%) | 512 (100.0%) |
Household Vehicle Usage in Hallettsville
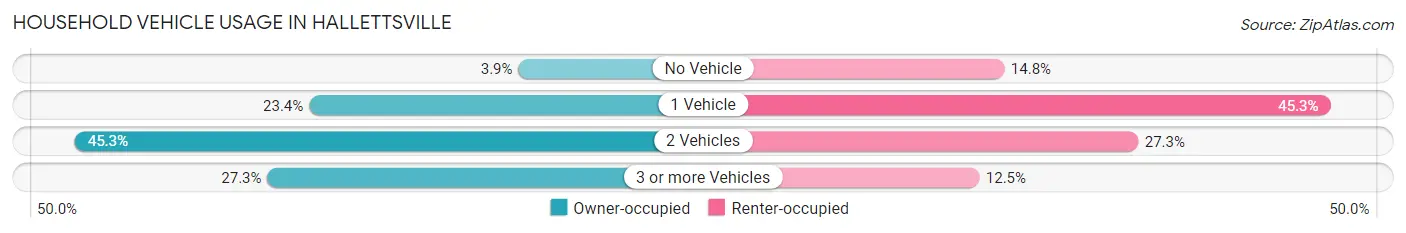
| Vehicles per Household | Owner-occupied | Renter-occupied |
| No Vehicle | 25 (3.9%) | 76 (14.8%) |
| 1 Vehicle | 150 (23.4%) | 232 (45.3%) |
| 2 Vehicles | 290 (45.3%) | 140 (27.3%) |
| 3 or more Vehicles | 175 (27.3%) | 64 (12.5%) |
| Total | 640 (100.0%) | 512 (100.0%) |
Real Estate & Mortgages in Hallettsville
Real Estate and Mortgage Overview in Hallettsville
| Characteristic | Without Mortgage | With Mortgage |
| Housing Units | 370 | 270 |
| Median Property Value | $92,200 | $129,200 |
| Median Household Income | $47,400 | $55 |
| Monthly Housing Costs | $431 | $0 |
| Real Estate Taxes | $1,028 | $13 |
Property Value by Mortgage Status in Hallettsville
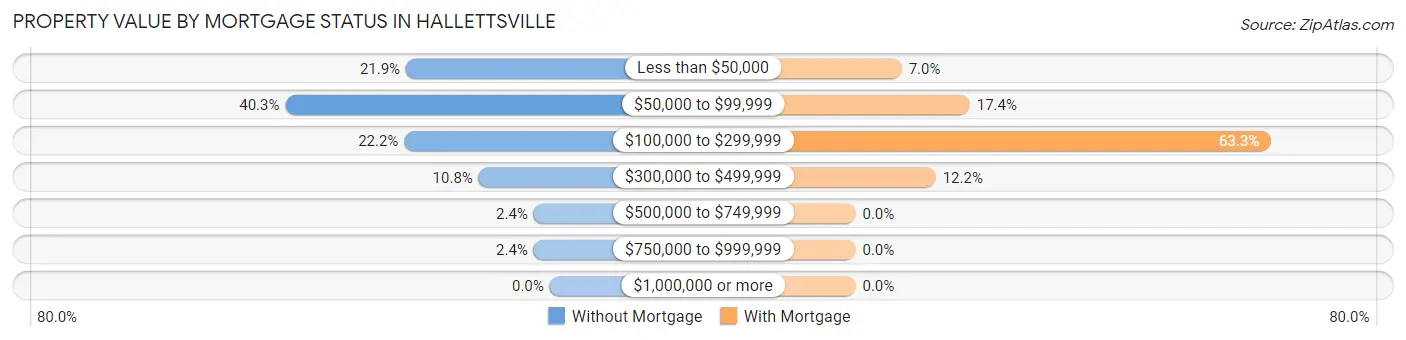
| Property Value | Without Mortgage | With Mortgage |
| Less than $50,000 | 81 (21.9%) | 19 (7.0%) |
| $50,000 to $99,999 | 149 (40.3%) | 47 (17.4%) |
| $100,000 to $299,999 | 82 (22.2%) | 171 (63.3%) |
| $300,000 to $499,999 | 40 (10.8%) | 33 (12.2%) |
| $500,000 to $749,999 | 9 (2.4%) | 0 (0.0%) |
| $750,000 to $999,999 | 9 (2.4%) | 0 (0.0%) |
| $1,000,000 or more | 0 (0.0%) | 0 (0.0%) |
| Total | 370 (100.0%) | 270 (100.0%) |
Household Income by Mortgage Status in Hallettsville
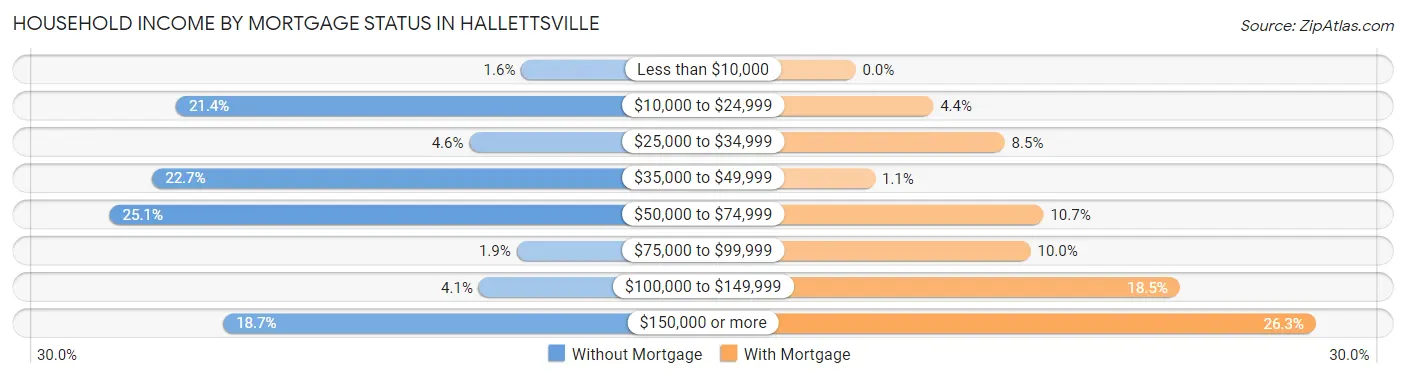
| Household Income | Without Mortgage | With Mortgage |
| Less than $10,000 | 6 (1.6%) | 0 (0.0%) |
| $10,000 to $24,999 | 79 (21.3%) | 12 (4.4%) |
| $25,000 to $34,999 | 17 (4.6%) | 23 (8.5%) |
| $35,000 to $49,999 | 84 (22.7%) | 3 (1.1%) |
| $50,000 to $74,999 | 93 (25.1%) | 29 (10.7%) |
| $75,000 to $99,999 | 7 (1.9%) | 27 (10.0%) |
| $100,000 to $149,999 | 15 (4.1%) | 50 (18.5%) |
| $150,000 or more | 69 (18.6%) | 71 (26.3%) |
| Total | 370 (100.0%) | 270 (100.0%) |
Property Value to Household Income Ratio in Hallettsville
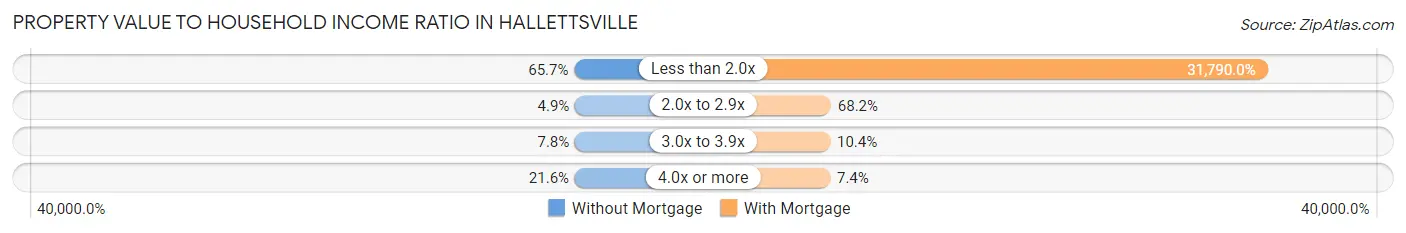
| Value-to-Income Ratio | Without Mortgage | With Mortgage |
| Less than 2.0x | 243 (65.7%) | 85,833 (31,790.0%) |
| 2.0x to 2.9x | 18 (4.9%) | 184 (68.1%) |
| 3.0x to 3.9x | 29 (7.8%) | 28 (10.4%) |
| 4.0x or more | 80 (21.6%) | 20 (7.4%) |
| Total | 370 (100.0%) | 270 (100.0%) |
Real Estate Taxes by Mortgage Status in Hallettsville
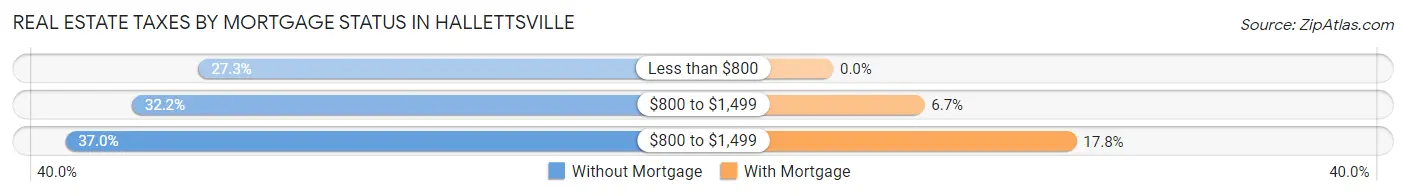
| Property Taxes | Without Mortgage | With Mortgage |
| Less than $800 | 101 (27.3%) | 0 (0.0%) |
| $800 to $1,499 | 119 (32.2%) | 18 (6.7%) |
| $800 to $1,499 | 137 (37.0%) | 48 (17.8%) |
| Total | 370 (100.0%) | 270 (100.0%) |
Health & Disability in Hallettsville
Health Insurance Coverage by Age in Hallettsville
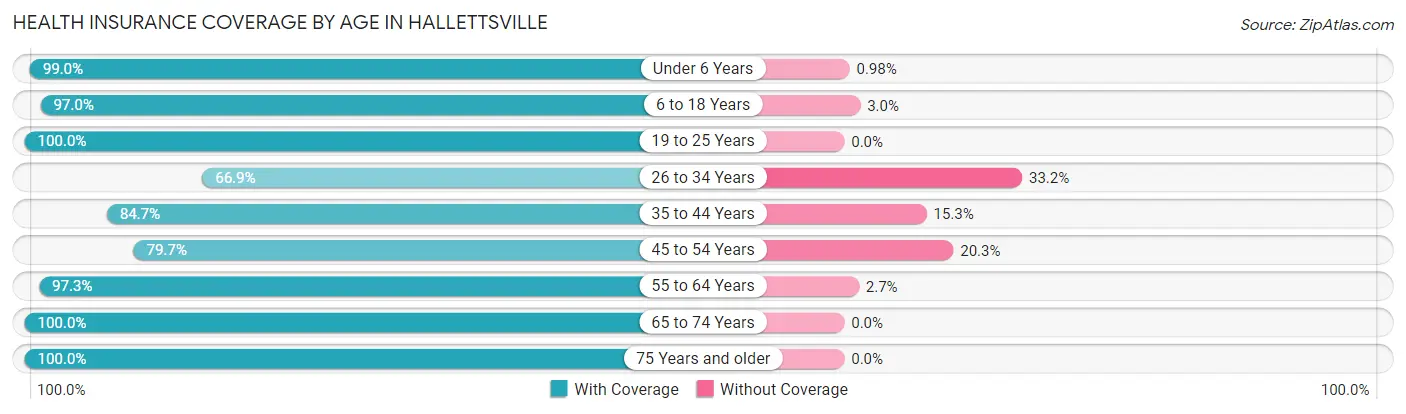
| Age Bracket | With Coverage | Without Coverage |
| Under 6 Years | 203 (99.0%) | 2 (1.0%) |
| 6 to 18 Years | 458 (97.0%) | 14 (3.0%) |
| 19 to 25 Years | 233 (100.0%) | 0 (0.0%) |
| 26 to 34 Years | 121 (66.8%) | 60 (33.2%) |
| 35 to 44 Years | 309 (84.7%) | 56 (15.3%) |
| 45 to 54 Years | 239 (79.7%) | 61 (20.3%) |
| 55 to 64 Years | 287 (97.3%) | 8 (2.7%) |
| 65 to 74 Years | 296 (100.0%) | 0 (0.0%) |
| 75 Years and older | 187 (100.0%) | 0 (0.0%) |
| Total | 2,333 (92.1%) | 201 (7.9%) |
Health Insurance Coverage by Citizenship Status in Hallettsville
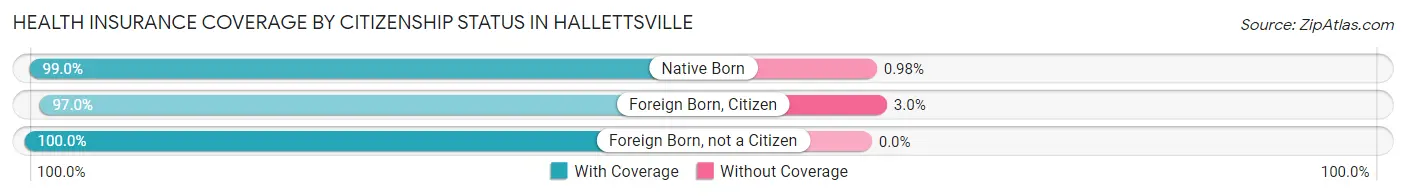
| Citizenship Status | With Coverage | Without Coverage |
| Native Born | 203 (99.0%) | 2 (1.0%) |
| Foreign Born, Citizen | 458 (97.0%) | 14 (3.0%) |
| Foreign Born, not a Citizen | 233 (100.0%) | 0 (0.0%) |
Health Insurance Coverage by Household Income in Hallettsville
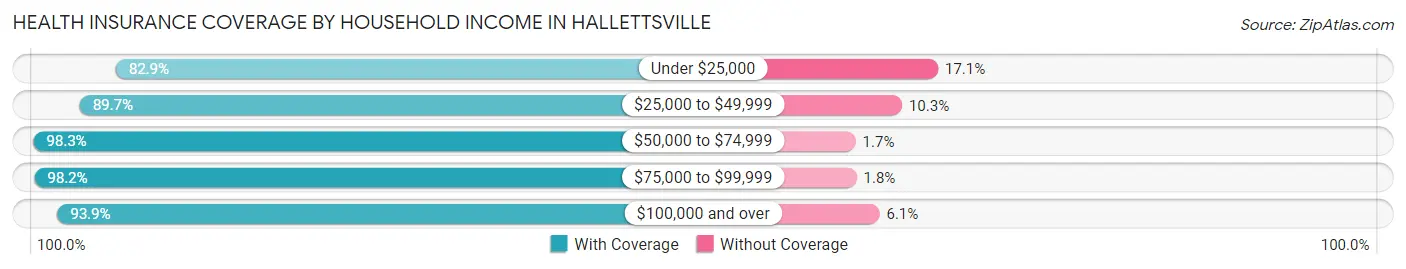
| Household Income | With Coverage | Without Coverage |
| Under $25,000 | 490 (82.9%) | 101 (17.1%) |
| $25,000 to $49,999 | 347 (89.7%) | 40 (10.3%) |
| $50,000 to $74,999 | 414 (98.3%) | 7 (1.7%) |
| $75,000 to $99,999 | 373 (98.2%) | 7 (1.8%) |
| $100,000 and over | 705 (93.9%) | 46 (6.1%) |
Public vs Private Health Insurance Coverage by Age in Hallettsville
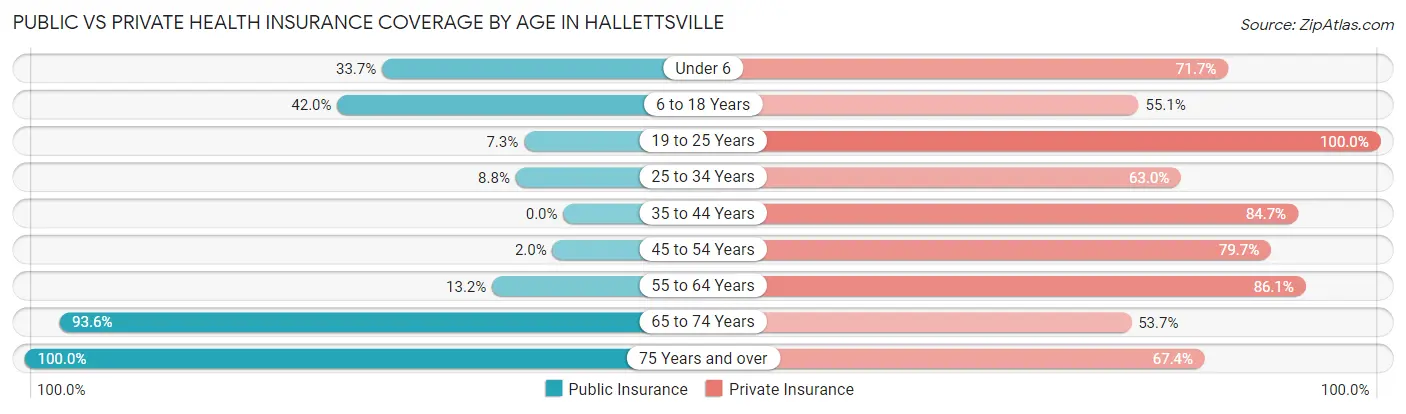
| Age Bracket | Public Insurance | Private Insurance |
| Under 6 | 69 (33.7%) | 147 (71.7%) |
| 6 to 18 Years | 198 (41.9%) | 260 (55.1%) |
| 19 to 25 Years | 17 (7.3%) | 233 (100.0%) |
| 25 to 34 Years | 16 (8.8%) | 114 (63.0%) |
| 35 to 44 Years | 0 (0.0%) | 309 (84.7%) |
| 45 to 54 Years | 6 (2.0%) | 239 (79.7%) |
| 55 to 64 Years | 39 (13.2%) | 254 (86.1%) |
| 65 to 74 Years | 277 (93.6%) | 159 (53.7%) |
| 75 Years and over | 187 (100.0%) | 126 (67.4%) |
| Total | 809 (31.9%) | 1,841 (72.7%) |
Disability Status by Sex by Age in Hallettsville
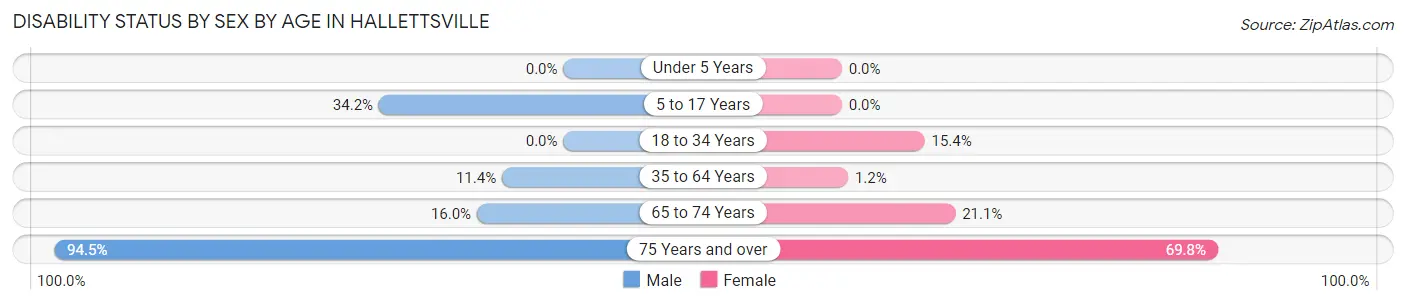
| Age Bracket | Male | Female |
| Under 5 Years | 0 (0.0%) | 0 (0.0%) |
| 5 to 17 Years | 115 (34.2%) | 0 (0.0%) |
| 18 to 34 Years | 0 (0.0%) | 41 (15.4%) |
| 35 to 64 Years | 50 (11.4%) | 6 (1.1%) |
| 65 to 74 Years | 17 (16.0%) | 40 (21.0%) |
| 75 Years and over | 86 (94.5%) | 67 (69.8%) |
Disability Class by Sex by Age in Hallettsville
Disability Class: Hearing Difficulty
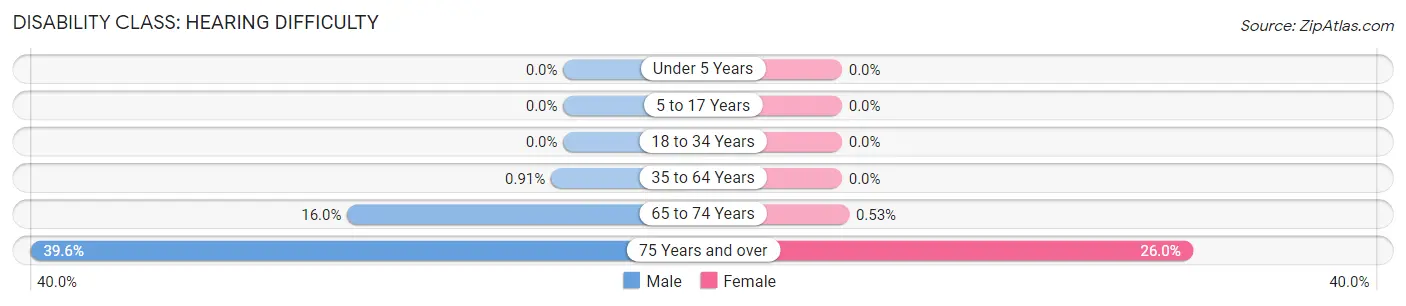
| Age Bracket | Male | Female |
| Under 5 Years | 0 (0.0%) | 0 (0.0%) |
| 5 to 17 Years | 0 (0.0%) | 0 (0.0%) |
| 18 to 34 Years | 0 (0.0%) | 0 (0.0%) |
| 35 to 64 Years | 4 (0.9%) | 0 (0.0%) |
| 65 to 74 Years | 17 (16.0%) | 1 (0.5%) |
| 75 Years and over | 36 (39.6%) | 25 (26.0%) |
Disability Class: Vision Difficulty
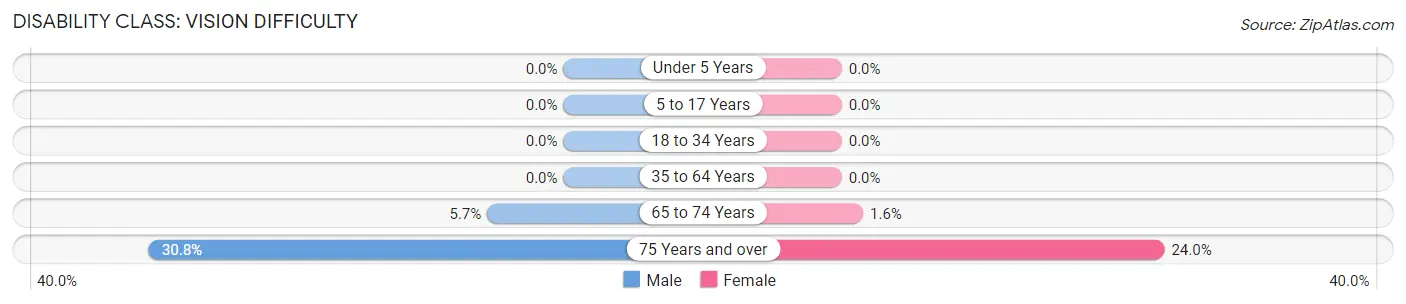
| Age Bracket | Male | Female |
| Under 5 Years | 0 (0.0%) | 0 (0.0%) |
| 5 to 17 Years | 0 (0.0%) | 0 (0.0%) |
| 18 to 34 Years | 0 (0.0%) | 0 (0.0%) |
| 35 to 64 Years | 0 (0.0%) | 0 (0.0%) |
| 65 to 74 Years | 6 (5.7%) | 3 (1.6%) |
| 75 Years and over | 28 (30.8%) | 23 (24.0%) |
Disability Class: Cognitive Difficulty
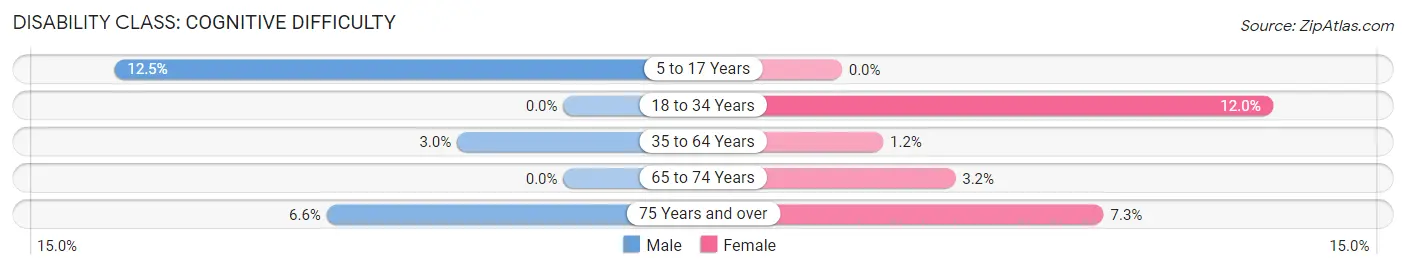
| Age Bracket | Male | Female |
| 5 to 17 Years | 42 (12.5%) | 0 (0.0%) |
| 18 to 34 Years | 0 (0.0%) | 32 (12.0%) |
| 35 to 64 Years | 13 (3.0%) | 6 (1.1%) |
| 65 to 74 Years | 0 (0.0%) | 6 (3.2%) |
| 75 Years and over | 6 (6.6%) | 7 (7.3%) |
Disability Class: Ambulatory Difficulty
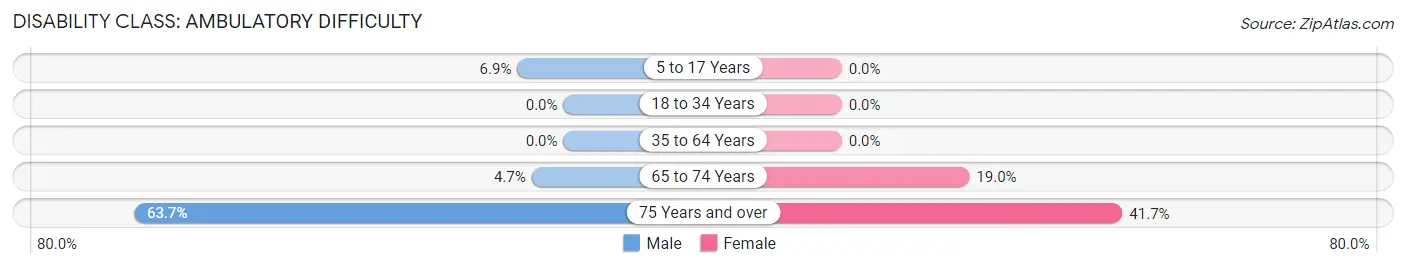
| Age Bracket | Male | Female |
| 5 to 17 Years | 23 (6.9%) | 0 (0.0%) |
| 18 to 34 Years | 0 (0.0%) | 0 (0.0%) |
| 35 to 64 Years | 0 (0.0%) | 0 (0.0%) |
| 65 to 74 Years | 5 (4.7%) | 36 (19.0%) |
| 75 Years and over | 58 (63.7%) | 40 (41.7%) |
Disability Class: Self-Care Difficulty
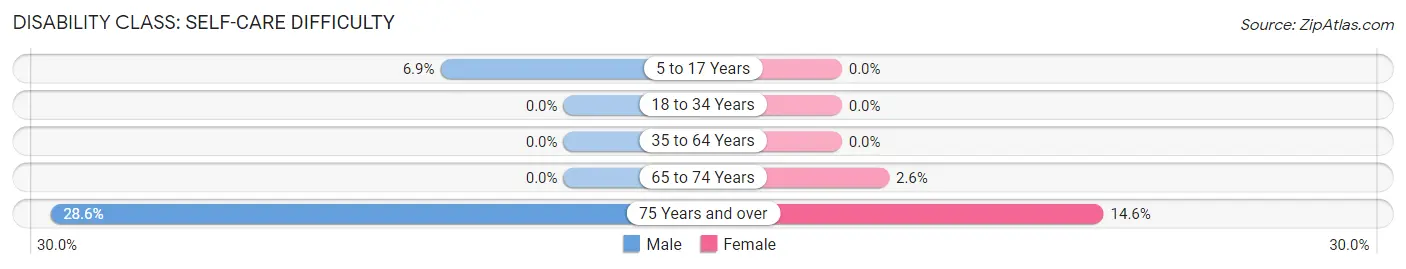
| Age Bracket | Male | Female |
| 5 to 17 Years | 23 (6.9%) | 0 (0.0%) |
| 18 to 34 Years | 0 (0.0%) | 0 (0.0%) |
| 35 to 64 Years | 0 (0.0%) | 0 (0.0%) |
| 65 to 74 Years | 0 (0.0%) | 5 (2.6%) |
| 75 Years and over | 26 (28.6%) | 14 (14.6%) |
Technology Access in Hallettsville
Computing Device Access in Hallettsville
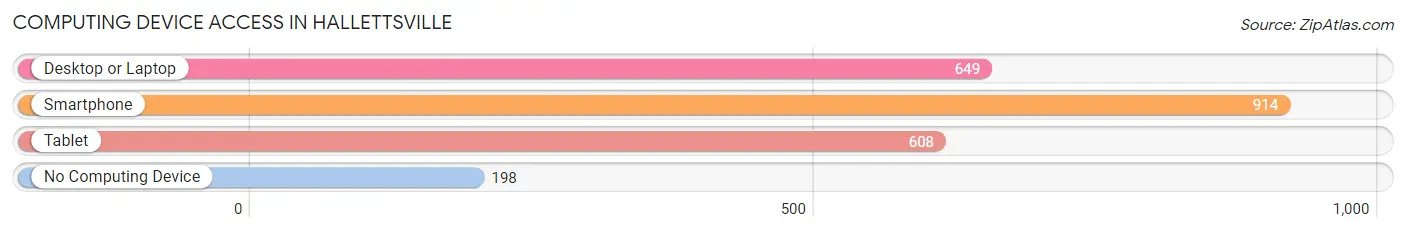
| Device Type | # Households | % Households |
| Desktop or Laptop | 649 | 56.3% |
| Smartphone | 914 | 79.3% |
| Tablet | 608 | 52.8% |
| No Computing Device | 198 | 17.2% |
| Total | 1,152 | 100.0% |
Internet Access in Hallettsville
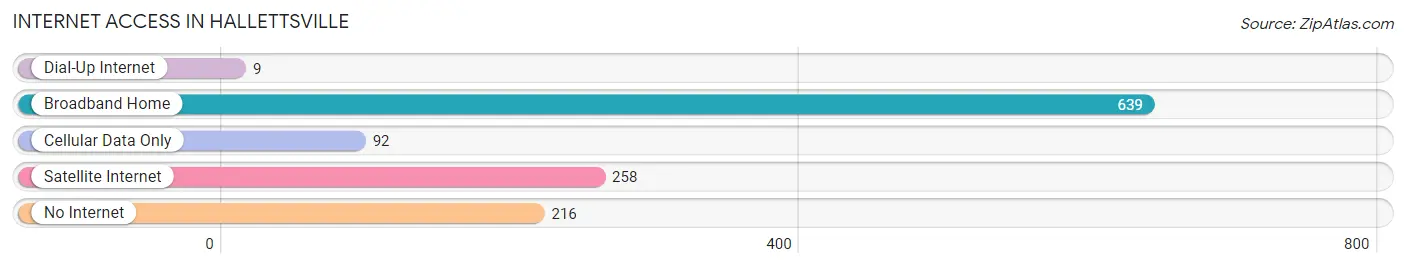
| Internet Type | # Households | % Households |
| Dial-Up Internet | 9 | 0.8% |
| Broadband Home | 639 | 55.5% |
| Cellular Data Only | 92 | 8.0% |
| Satellite Internet | 258 | 22.4% |
| No Internet | 216 | 18.8% |
| Total | 1,152 | 100.0% |
Hallettsville Summary
Hallettville is a small town located in Lavaca County, Texas. It is situated in the southeastern part of the state, about halfway between Houston and San Antonio. The town was founded in 1873 and has a population of 2,072 as of the 2010 census.
History
Hallettville was founded in 1873 by a group of German immigrants led by John Hallett. The town was named after him and was originally called Hallettville. The town was established as a trading post and was a popular stop for travelers on the stagecoach line between Houston and San Antonio.
In 1876, the town was incorporated and the first post office was established. The town grew slowly but steadily over the years and by the early 1900s, it had become a thriving agricultural center. Cotton, corn, and hay were the main crops grown in the area.
In the 1920s, the town began to experience a period of growth and development. The first bank was established in 1923 and the first school was built in 1925. The town also had a movie theater, a hotel, and several stores.
Geography
Hallettville is located in southeastern Texas, about halfway between Houston and San Antonio. It is situated in Lavaca County, which is part of the Coastal Plains region of the state. The town is located on the banks of the Lavaca River, which flows through the area.
The town has a total area of 1.2 square miles, all of which is land. The terrain is mostly flat and the climate is humid subtropical, with hot summers and mild winters.
Economy
The economy of Hallettville is largely based on agriculture. Cotton, corn, and hay are the main crops grown in the area. The town also has a few small businesses, including a grocery store, a hardware store, and a few restaurants.
The town is also home to a few manufacturing companies, including a furniture factory and a plastics factory. The town also has a few small tourist attractions, including a museum and a historic theater.
Demographics
As of the 2010 census, Hallettville had a population of 2,072. The racial makeup of the town was 79.3% White, 16.2% Hispanic or Latino, 1.2% African American, 0.7% Native American, 0.3% Asian, and 2.5% from other races.
The median household income in Hallettville was $37,917, and the median family income was $45,938. The per capita income was $18,945. About 16.2% of the population was below the poverty line.
Conclusion
Hallettville is a small town located in Lavaca County, Texas. It was founded in 1873 by a group of German immigrants and has a population of 2,072 as of the 2010 census. The town's economy is largely based on agriculture, with cotton, corn, and hay being the main crops grown in the area. The town also has a few small businesses and tourist attractions. The racial makeup of the town is mostly White, with a small percentage of Hispanic or Latino, African American, Native American, and Asian residents. The median household income in Hallettville is $37,917 and the per capita income is $18,945.
Common Questions
What is Per Capita Income in Hallettsville?
Per Capita income in Hallettsville is $30,396.
What is the Median Family Income in Hallettsville?
Median Family Income in Hallettsville is $60,913.
What is the Median Household income in Hallettsville?
Median Household Income in Hallettsville is $47,090.
What is Income or Wage Gap in Hallettsville?
Income or Wage Gap in Hallettsville is 20.6%.
Women in Hallettsville earn 79.4 cents for every dollar earned by a man.
What is Inequality or Gini Index in Hallettsville?
Inequality or Gini Index in Hallettsville is 0.47.
What is the Total Population of Hallettsville?
Total Population of Hallettsville is 2,729.
What is the Total Male Population of Hallettsville?
Total Male Population of Hallettsville is 1,387.
What is the Total Female Population of Hallettsville?
Total Female Population of Hallettsville is 1,342.
What is the Ratio of Males per 100 Females in Hallettsville?
There are 103.35 Males per 100 Females in Hallettsville.
What is the Ratio of Females per 100 Males in Hallettsville?
There are 96.76 Females per 100 Males in Hallettsville.
What is the Median Population Age in Hallettsville?
Median Population Age in Hallettsville is 42.3 Years.
What is the Average Family Size in Hallettsville
Average Family Size in Hallettsville is 2.9 People.
What is the Average Household Size in Hallettsville
Average Household Size in Hallettsville is 2.2 People.
How Large is the Labor Force in Hallettsville?
There are 1,379 People in the Labor Forcein in Hallettsville.
What is the Percentage of People in the Labor Force in Hallettsville?
63.7% of People are in the Labor Force in Hallettsville.
What is the Unemployment Rate in Hallettsville?
Unemployment Rate in Hallettsville is 5.8%.