Petrolia, TX Map & Demographics
Petrolia Map
Petrolia Overview
$29,362
PER CAPITA INCOME
$59,250
AVG FAMILY INCOME
$43,750
AVG HOUSEHOLD INCOME
18.0%
WAGE / INCOME GAP [ % ]
82.0¢/ $1
WAGE / INCOME GAP [ $ ]
0.40
INEQUALITY / GINI INDEX
368
TOTAL POPULATION
174
MALE POPULATION
194
FEMALE POPULATION
89.69
MALES / 100 FEMALES
111.49
FEMALES / 100 MALES
55.5
MEDIAN AGE
2.6
AVG FAMILY SIZE
1.9
AVG HOUSEHOLD SIZE
130
LABOR FORCE [ PEOPLE ]
41.8%
PERCENT IN LABOR FORCE
Petrolia Zip Codes
Petrolia Area Codes
Income in Petrolia
Income Overview in Petrolia
Per Capita Income in Petrolia is $29,362, while median incomes of families and households are $59,250 and $43,750 respectively.
| Characteristic | Number | Measure |
| Per Capita Income | 368 | $29,362 |
| Median Family Income | 107 | $59,250 |
| Mean Family Income | 107 | $64,606 |
| Median Household Income | 194 | $43,750 |
| Mean Household Income | 194 | $55,755 |
| Income Deficit | 107 | $0 |
| Wage / Income Gap (%) | 368 | 18.02% |
| Wage / Income Gap ($) | 368 | 81.98¢ per $1 |
| Gini / Inequality Index | 368 | 0.40 |
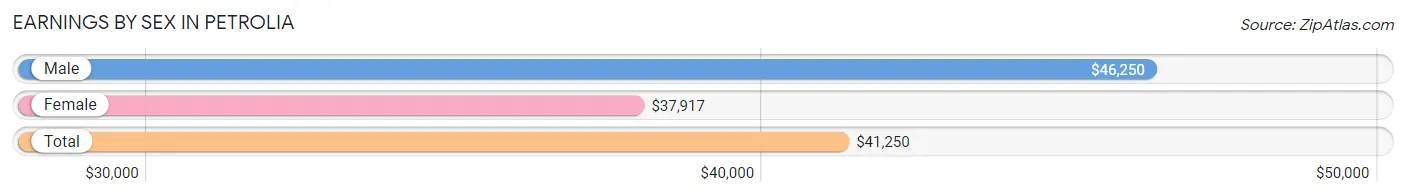
Earnings by Sex in Petrolia
Average Earnings in Petrolia are $41,250, $46,250 for men and $37,917 for women, a difference of 18.0%.
| Sex | Number | Average Earnings |
| Male | 63 (48.5%) | $46,250 |
| Female | 67 (51.5%) | $37,917 |
| Total | 130 (100.0%) | $41,250 |
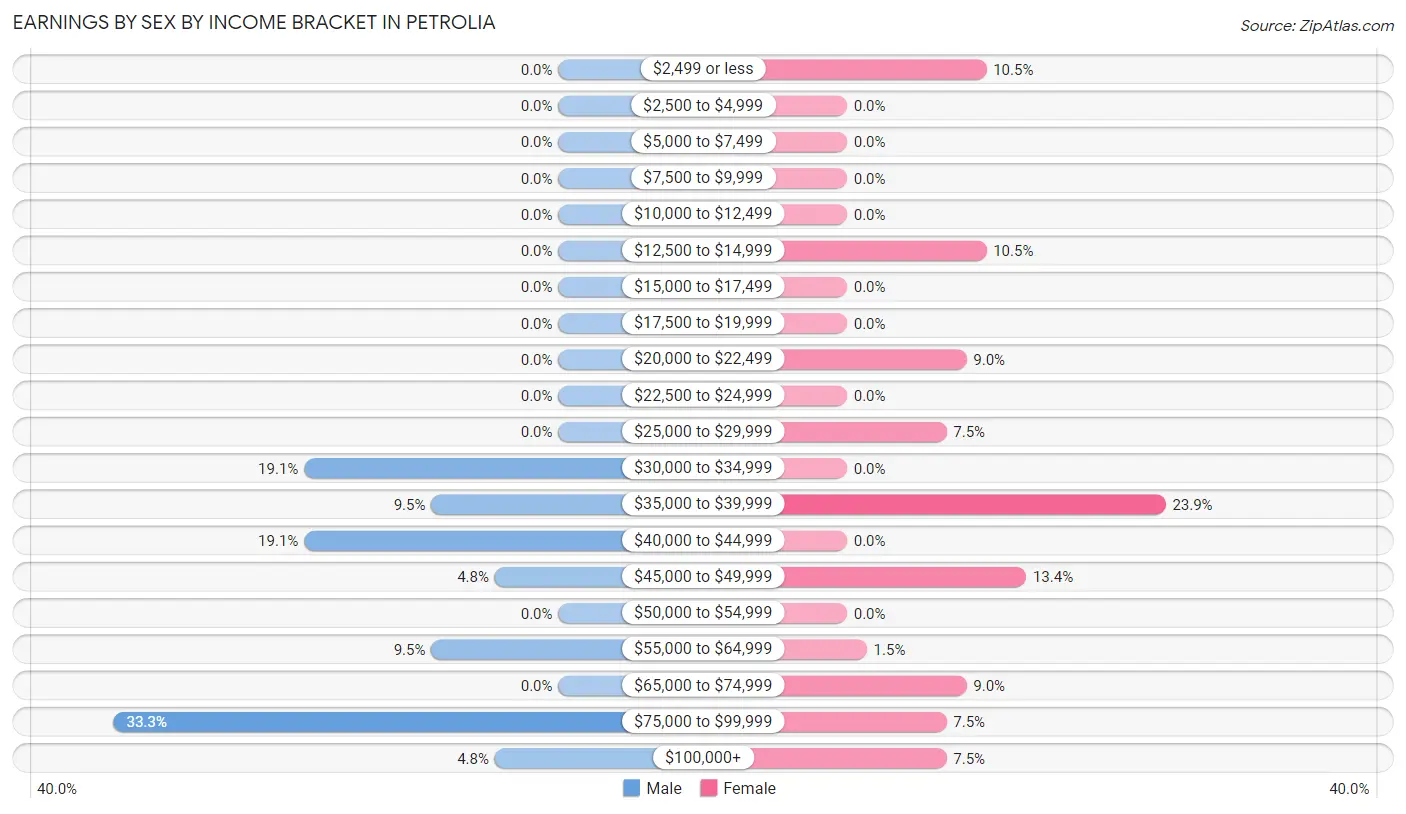
Earnings by Sex by Income Bracket in Petrolia
The most common earnings brackets in Petrolia are $75,000 to $99,999 for men (21 | 33.3%) and $35,000 to $39,999 for women (16 | 23.9%).
| Income | Male | Female |
| $2,499 or less | 0 (0.0%) | 7 (10.4%) |
| $2,500 to $4,999 | 0 (0.0%) | 0 (0.0%) |
| $5,000 to $7,499 | 0 (0.0%) | 0 (0.0%) |
| $7,500 to $9,999 | 0 (0.0%) | 0 (0.0%) |
| $10,000 to $12,499 | 0 (0.0%) | 0 (0.0%) |
| $12,500 to $14,999 | 0 (0.0%) | 7 (10.4%) |
| $15,000 to $17,499 | 0 (0.0%) | 0 (0.0%) |
| $17,500 to $19,999 | 0 (0.0%) | 0 (0.0%) |
| $20,000 to $22,499 | 0 (0.0%) | 6 (9.0%) |
| $22,500 to $24,999 | 0 (0.0%) | 0 (0.0%) |
| $25,000 to $29,999 | 0 (0.0%) | 5 (7.5%) |
| $30,000 to $34,999 | 12 (19.1%) | 0 (0.0%) |
| $35,000 to $39,999 | 6 (9.5%) | 16 (23.9%) |
| $40,000 to $44,999 | 12 (19.1%) | 0 (0.0%) |
| $45,000 to $49,999 | 3 (4.8%) | 9 (13.4%) |
| $50,000 to $54,999 | 0 (0.0%) | 0 (0.0%) |
| $55,000 to $64,999 | 6 (9.5%) | 1 (1.5%) |
| $65,000 to $74,999 | 0 (0.0%) | 6 (9.0%) |
| $75,000 to $99,999 | 21 (33.3%) | 5 (7.5%) |
| $100,000+ | 3 (4.8%) | 5 (7.5%) |
| Total | 63 (100.0%) | 67 (100.0%) |
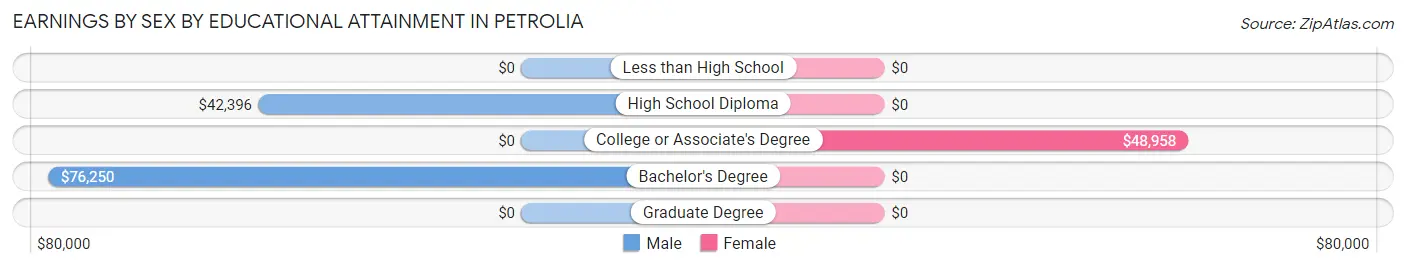
Earnings by Sex by Educational Attainment in Petrolia
Average earnings in Petrolia are $46,250 for men and $37,778 for women, a difference of 18.3%. Men with an educational attainment of bachelor's degree enjoy the highest average annual earnings of $76,250, while those with high school diploma education earn the least with $42,396. Women with an educational attainment of college or associate's degree earn the most with the average annual earnings of $48,958, while those with college or associate's degree education have the smallest earnings of $48,958.
| Educational Attainment | Male Income | Female Income |
| Less than High School | - | - |
| High School Diploma | $42,396 | $0 |
| College or Associate's Degree | - | - |
| Bachelor's Degree | $76,250 | $0 |
| Graduate Degree | - | - |
| Total | $46,250 | $37,778 |
Family Income in Petrolia
Family Income Brackets in Petrolia
According to the Petrolia family income data, there are 32 families falling into the $50,000 to $74,999 income range, which is the most common income bracket and makes up 29.9% of all families.
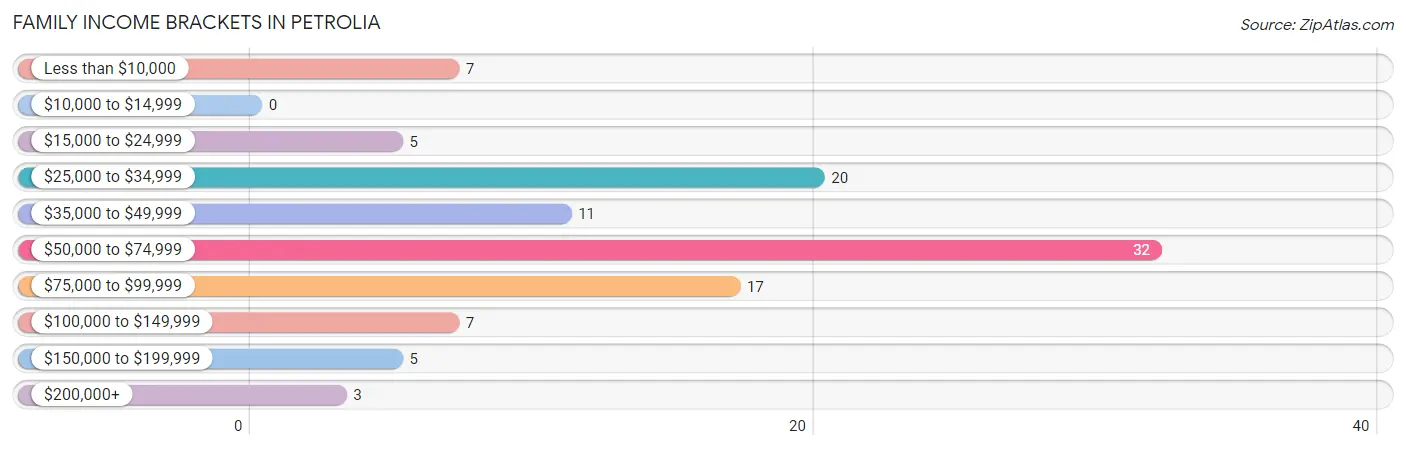
| Income Bracket | # Families | % Families |
| Less than $10,000 | 7 | 6.5% |
| $10,000 to $14,999 | 0 | 0.0% |
| $15,000 to $24,999 | 5 | 4.7% |
| $25,000 to $34,999 | 20 | 18.7% |
| $35,000 to $49,999 | 11 | 10.3% |
| $50,000 to $74,999 | 32 | 29.9% |
| $75,000 to $99,999 | 17 | 15.9% |
| $100,000 to $149,999 | 7 | 6.5% |
| $150,000 to $199,999 | 5 | 4.7% |
| $200,000+ | 3 | 2.8% |
Family Income by Famaliy Size in Petrolia
2-person families (59 | 55.1%) account for the highest median family income in Petrolia with $38,438 per family, while 2-person families (59 | 55.1%) have the highest median income of $19,219 per family member.
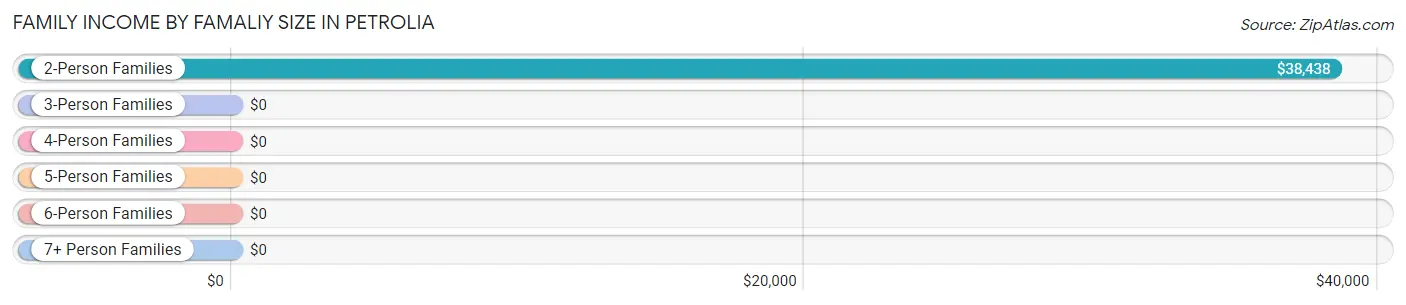
| Income Bracket | # Families | Median Income |
| 2-Person Families | 59 (55.1%) | $38,438 |
| 3-Person Families | 33 (30.8%) | $0 |
| 4-Person Families | 14 (13.1%) | $0 |
| 5-Person Families | 1 (0.9%) | $0 |
| 6-Person Families | 0 (0.0%) | $0 |
| 7+ Person Families | 0 (0.0%) | $0 |
| Total | 107 (100.0%) | $59,250 |
Family Income by Number of Earners in Petrolia
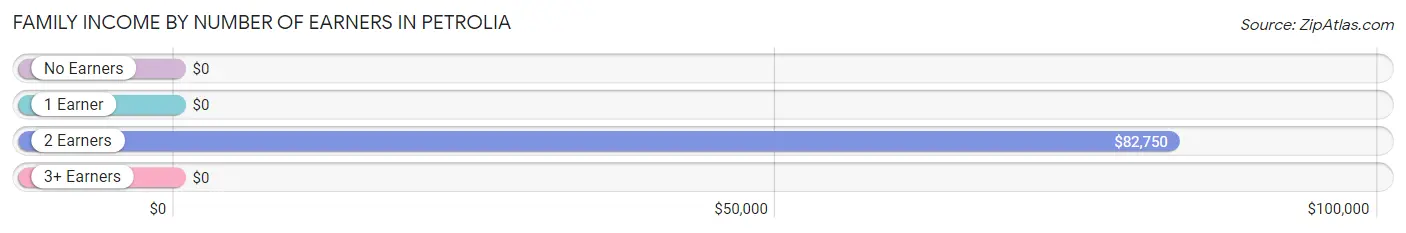
| Number of Earners | # Families | Median Income |
| No Earners | 33 (30.8%) | $0 |
| 1 Earner | 49 (45.8%) | $0 |
| 2 Earners | 25 (23.4%) | $82,750 |
| 3+ Earners | 0 (0.0%) | $0 |
| Total | 107 (100.0%) | $59,250 |
Household Income in Petrolia
Household Income Brackets in Petrolia
With 37 households falling in the category, the $75,000 to $99,999 income range is the most frequent in Petrolia, accounting for 19.1% of all households. In contrast, only 3 households (1.5%) fall into the $200,000+ income bracket, making it the least populous group.
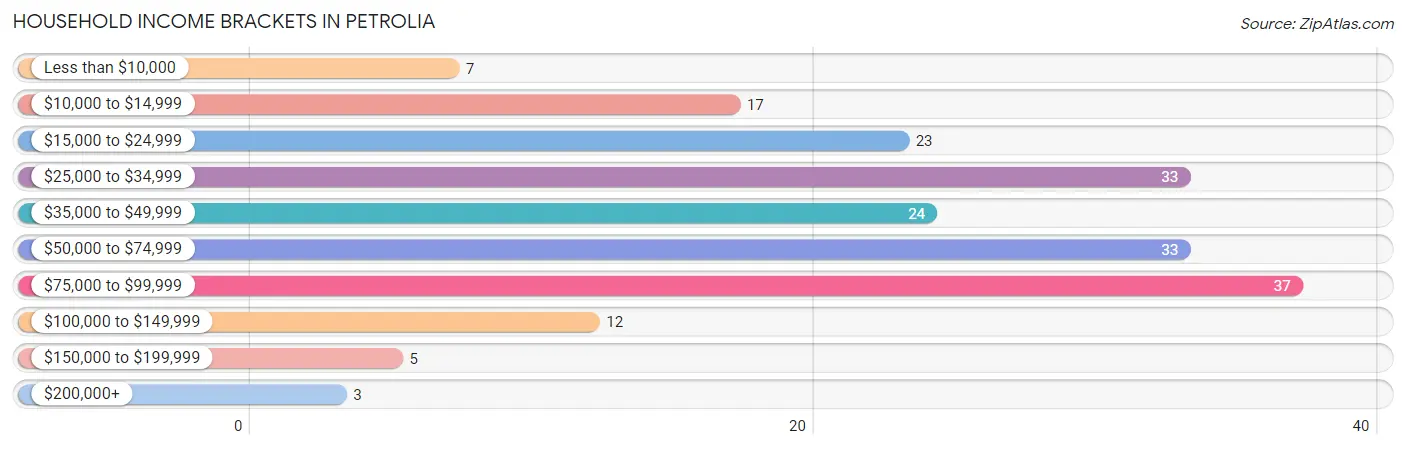
| Income Bracket | # Households | % Households |
| Less than $10,000 | 7 | 3.6% |
| $10,000 to $14,999 | 17 | 8.8% |
| $15,000 to $24,999 | 23 | 11.9% |
| $25,000 to $34,999 | 33 | 17.0% |
| $35,000 to $49,999 | 24 | 12.4% |
| $50,000 to $74,999 | 33 | 17.0% |
| $75,000 to $99,999 | 37 | 19.1% |
| $100,000 to $149,999 | 12 | 6.2% |
| $150,000 to $199,999 | 5 | 2.6% |
| $200,000+ | 3 | 1.5% |
Household Income by Householder Age in Petrolia
The median household income in Petrolia is $43,750, with the highest median household income of $59,750 found in the 45 to 64 years age bracket for the primary householder. A total of 87 households (44.9%) fall into this category. Meanwhile, the 15 to 24 years age bracket for the primary householder has the lowest median household income of $0, with 1 households (0.5%) in this group.
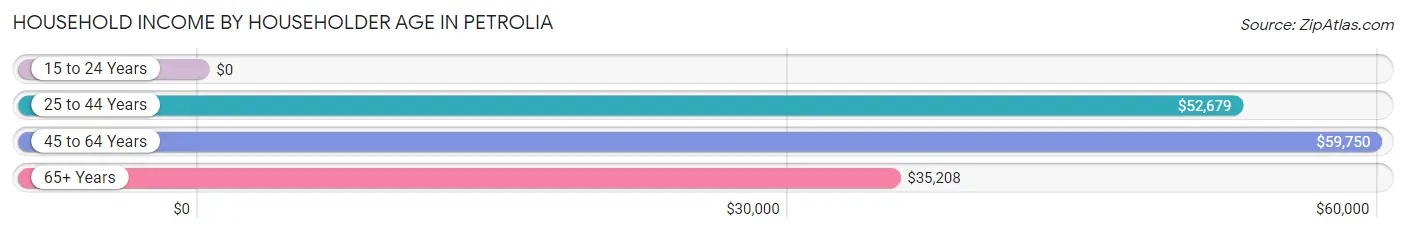
| Income Bracket | # Households | Median Income |
| 15 to 24 Years | 1 (0.5%) | $0 |
| 25 to 44 Years | 37 (19.1%) | $52,679 |
| 45 to 64 Years | 87 (44.9%) | $59,750 |
| 65+ Years | 69 (35.6%) | $35,208 |
| Total | 194 (100.0%) | $43,750 |
Poverty in Petrolia
Income Below Poverty by Sex and Age in Petrolia
With 6.3% poverty level for males and 10.3% for females among the residents of Petrolia, under 5 year old males and 35 to 44 year old females are the most vulnerable to poverty, with 5 males (26.3%) and 7 females (28.0%) in their respective age groups living below the poverty level.
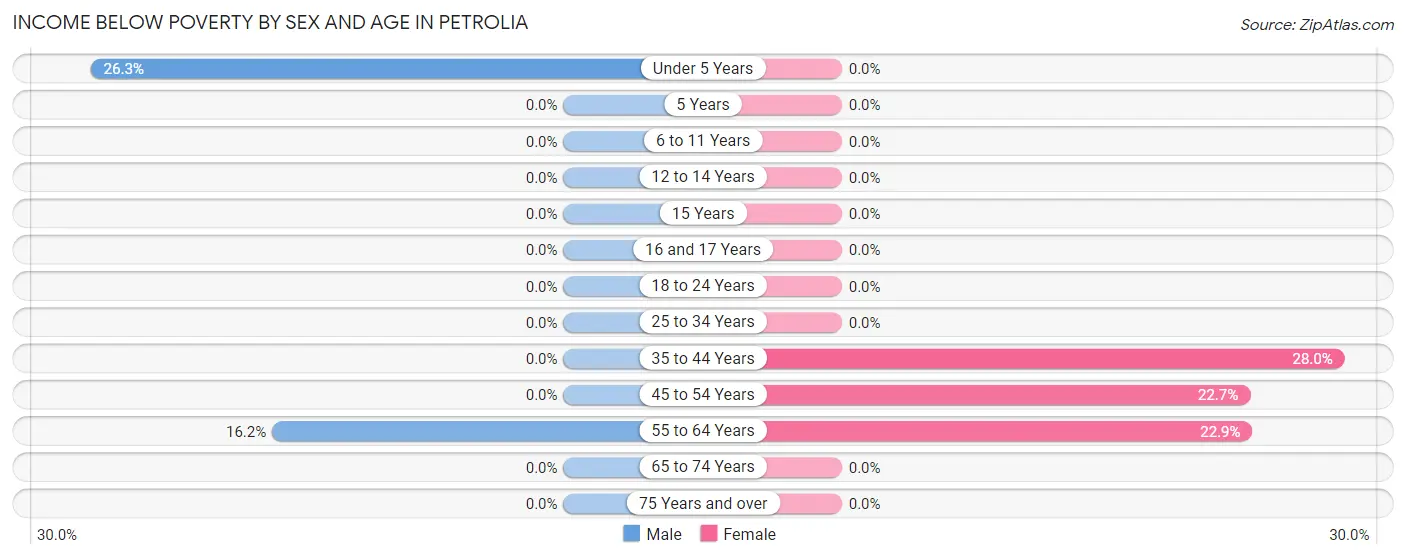
| Age Bracket | Male | Female |
| Under 5 Years | 5 (26.3%) | 0 (0.0%) |
| 5 Years | 0 (0.0%) | 0 (0.0%) |
| 6 to 11 Years | 0 (0.0%) | 0 (0.0%) |
| 12 to 14 Years | 0 (0.0%) | 0 (0.0%) |
| 15 Years | 0 (0.0%) | 0 (0.0%) |
| 16 and 17 Years | 0 (0.0%) | 0 (0.0%) |
| 18 to 24 Years | 0 (0.0%) | 0 (0.0%) |
| 25 to 34 Years | 0 (0.0%) | 0 (0.0%) |
| 35 to 44 Years | 0 (0.0%) | 7 (28.0%) |
| 45 to 54 Years | 0 (0.0%) | 5 (22.7%) |
| 55 to 64 Years | 6 (16.2%) | 8 (22.9%) |
| 65 to 74 Years | 0 (0.0%) | 0 (0.0%) |
| 75 Years and over | 0 (0.0%) | 0 (0.0%) |
| Total | 11 (6.3%) | 20 (10.3%) |
Income Above Poverty by Sex and Age in Petrolia
According to the poverty statistics in Petrolia, males aged 5 years and females aged under 5 years are the age groups that are most secure financially, with 100.0% of males and 100.0% of females in these age groups living above the poverty line.
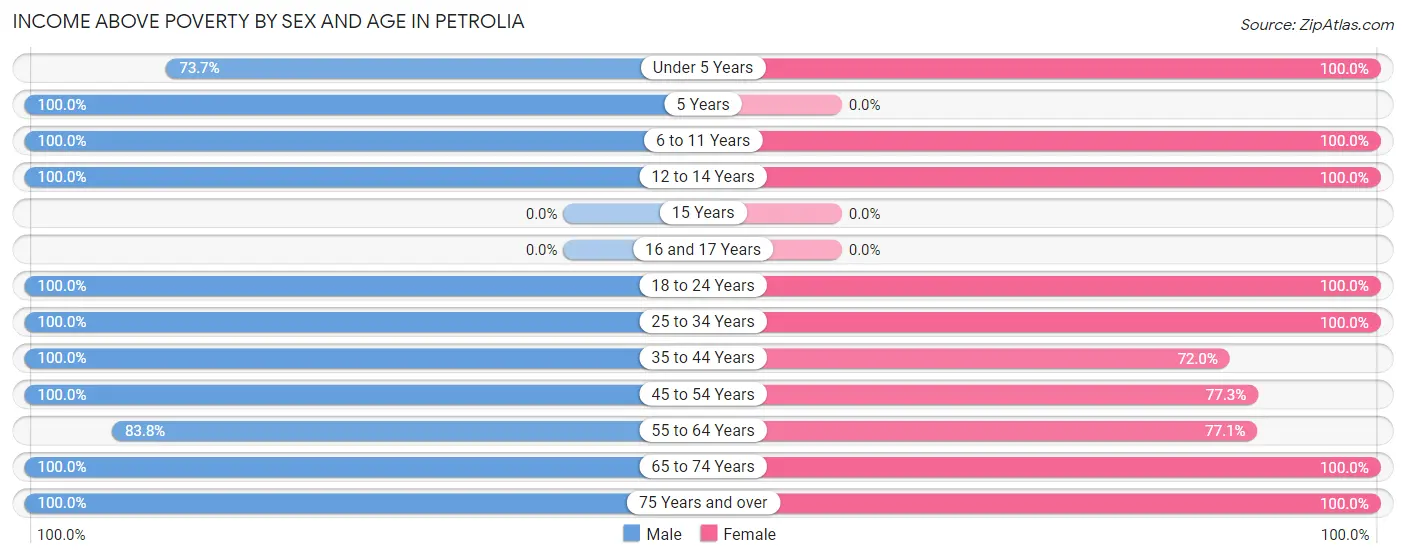
| Age Bracket | Male | Female |
| Under 5 Years | 14 (73.7%) | 6 (100.0%) |
| 5 Years | 2 (100.0%) | 0 (0.0%) |
| 6 to 11 Years | 10 (100.0%) | 2 (100.0%) |
| 12 to 14 Years | 8 (100.0%) | 10 (100.0%) |
| 15 Years | 0 (0.0%) | 0 (0.0%) |
| 16 and 17 Years | 0 (0.0%) | 0 (0.0%) |
| 18 to 24 Years | 7 (100.0%) | 11 (100.0%) |
| 25 to 34 Years | 5 (100.0%) | 6 (100.0%) |
| 35 to 44 Years | 13 (100.0%) | 18 (72.0%) |
| 45 to 54 Years | 33 (100.0%) | 17 (77.3%) |
| 55 to 64 Years | 31 (83.8%) | 27 (77.1%) |
| 65 to 74 Years | 15 (100.0%) | 12 (100.0%) |
| 75 Years and over | 25 (100.0%) | 65 (100.0%) |
| Total | 163 (93.7%) | 174 (89.7%) |
Income Below Poverty Among Married-Couple Families in Petrolia
The poverty statistics for married-couple families in Petrolia show that 7.5% or 5 of the total 67 families live below the poverty line. Families with no children have the highest poverty rate of 11.9%, comprising of 5 families. On the other hand, families with 1 or 2 children have the lowest poverty rate of 0.0%, which includes 0 families.
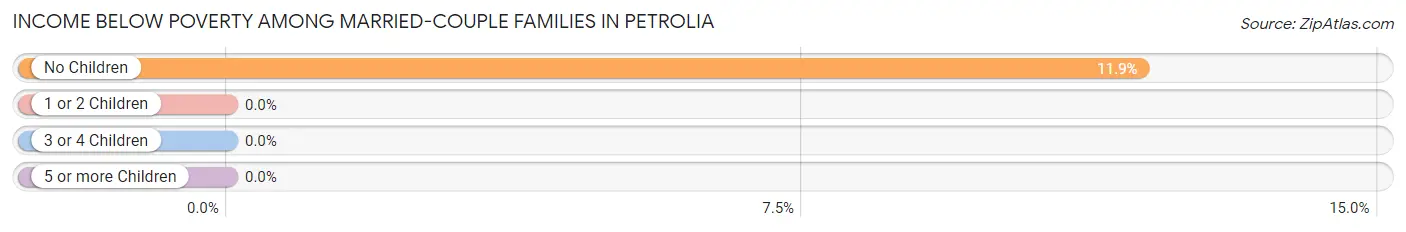
| Children | Above Poverty | Below Poverty |
| No Children | 37 (88.1%) | 5 (11.9%) |
| 1 or 2 Children | 24 (100.0%) | 0 (0.0%) |
| 3 or 4 Children | 1 (100.0%) | 0 (0.0%) |
| 5 or more Children | 0 (0.0%) | 0 (0.0%) |
| Total | 62 (92.5%) | 5 (7.5%) |
Income Below Poverty Among Single-Parent Households in Petrolia
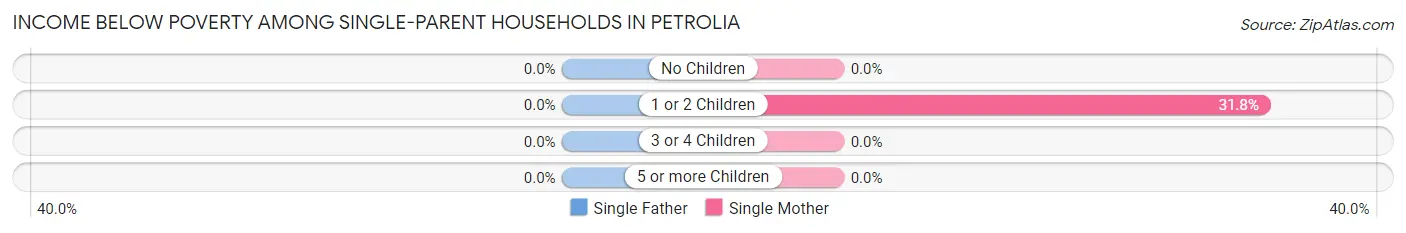
| Children | Single Father | Single Mother |
| No Children | 0 (0.0%) | 0 (0.0%) |
| 1 or 2 Children | 0 (0.0%) | 7 (31.8%) |
| 3 or 4 Children | 0 (0.0%) | 0 (0.0%) |
| 5 or more Children | 0 (0.0%) | 0 (0.0%) |
| Total | 0 (0.0%) | 7 (31.8%) |
Income Below Poverty Among Married-Couple vs Single-Parent Households in Petrolia
The poverty data for Petrolia shows that 5 of the married-couple family households (7.5%) and 7 of the single-parent households (17.5%) are living below the poverty level. Within the married-couple family households, those with no children have the highest poverty rate, with 5 households (11.9%) falling below the poverty line. Among the single-parent households, those with 1 or 2 children have the highest poverty rate, with 7 household (31.8%) living below poverty.
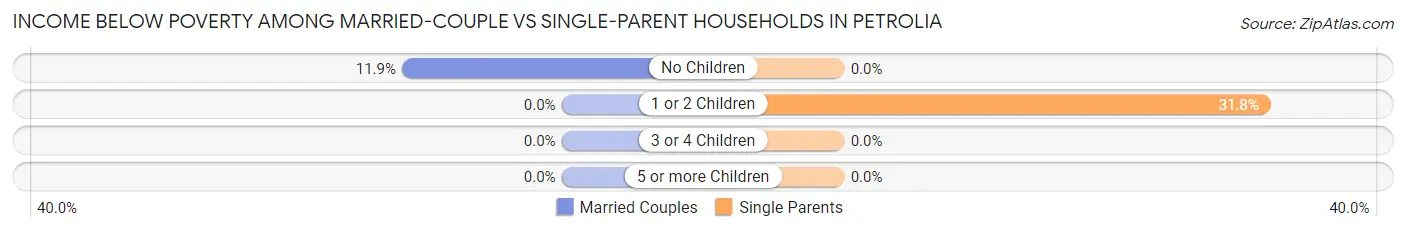
| Children | Married-Couple Families | Single-Parent Households |
| No Children | 5 (11.9%) | 0 (0.0%) |
| 1 or 2 Children | 0 (0.0%) | 7 (31.8%) |
| 3 or 4 Children | 0 (0.0%) | 0 (0.0%) |
| 5 or more Children | 0 (0.0%) | 0 (0.0%) |
| Total | 5 (7.5%) | 7 (17.5%) |
Race in Petrolia
The most populous races in Petrolia are White / Caucasian (368 | 100.0%), and Hispanic or Latino (13 | 3.5%).
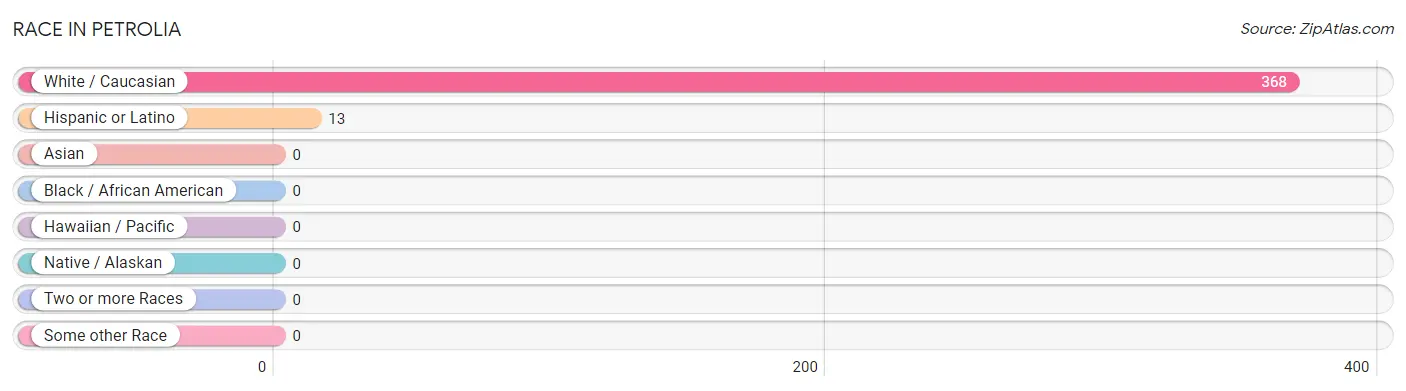
| Race | # Population | % Population |
| Asian | 0 | 0.0% |
| Black / African American | 0 | 0.0% |
| Hawaiian / Pacific | 0 | 0.0% |
| Hispanic or Latino | 13 | 3.5% |
| Native / Alaskan | 0 | 0.0% |
| White / Caucasian | 368 | 100.0% |
| Two or more Races | 0 | 0.0% |
| Some other Race | 0 | 0.0% |
| Total | 368 | 100.0% |
Ancestry in Petrolia
The most populous ancestries reported in Petrolia are German (39 | 10.6%), English (23 | 6.2%), Irish (13 | 3.5%), and Mexican (13 | 3.5%), together accounting for 23.9% of all Petrolia residents.
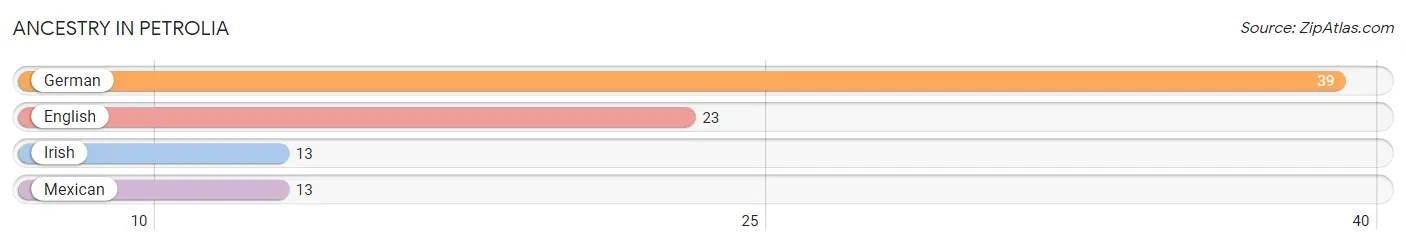
| Ancestry | # Population | % Population |
| English | 23 | 6.2% |
| German | 39 | 10.6% |
| Irish | 13 | 3.5% |
| Mexican | 13 | 3.5% | View All 4 Rows |
Immigrants in Petrolia

| Immigration Origin | # Population | % Population | View All 0 Rows |
Sex and Age in Petrolia
Sex and Age in Petrolia
The most populous age groups in Petrolia are 50 to 54 Years (26 | 14.9%) for men and 75 to 79 Years (51 | 26.3%) for women.
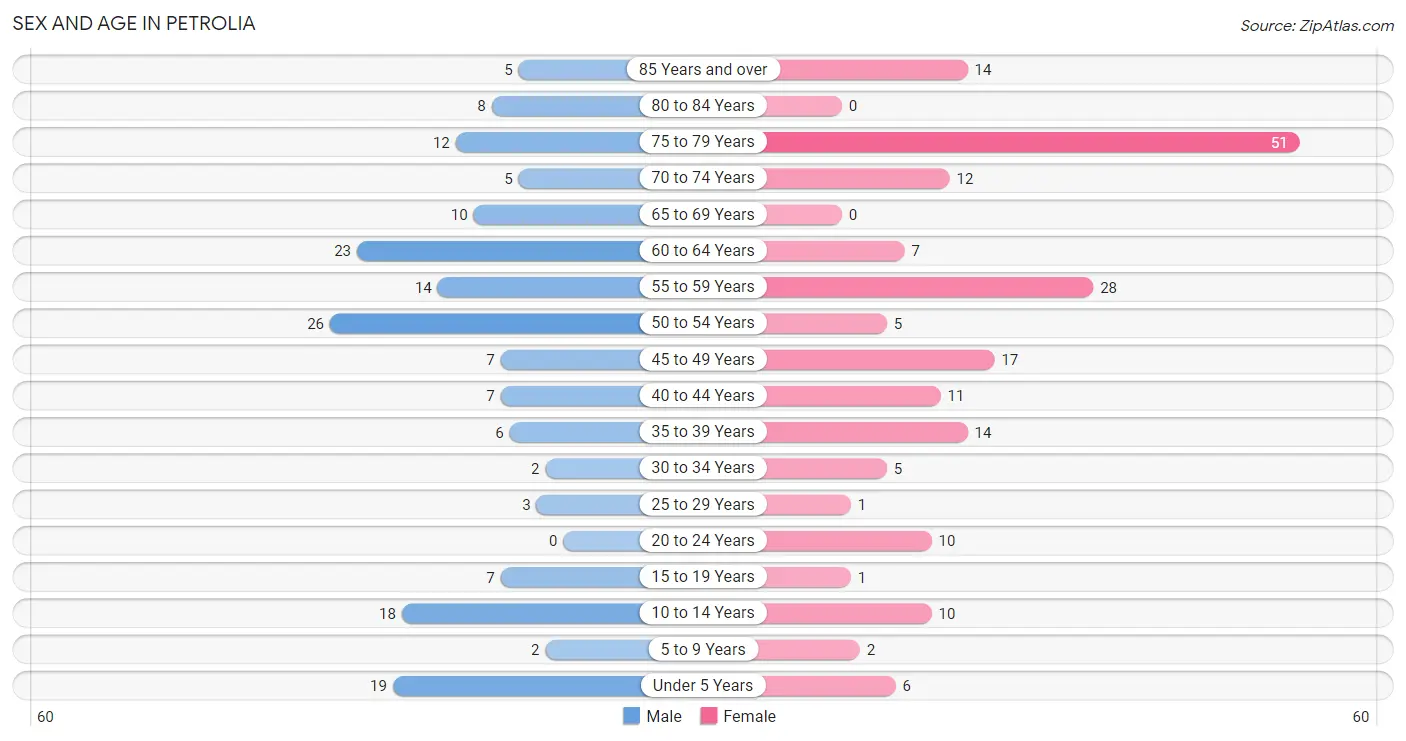
| Age Bracket | Male | Female |
| Under 5 Years | 19 (10.9%) | 6 (3.1%) |
| 5 to 9 Years | 2 (1.1%) | 2 (1.0%) |
| 10 to 14 Years | 18 (10.3%) | 10 (5.1%) |
| 15 to 19 Years | 7 (4.0%) | 1 (0.5%) |
| 20 to 24 Years | 0 (0.0%) | 10 (5.1%) |
| 25 to 29 Years | 3 (1.7%) | 1 (0.5%) |
| 30 to 34 Years | 2 (1.1%) | 5 (2.6%) |
| 35 to 39 Years | 6 (3.5%) | 14 (7.2%) |
| 40 to 44 Years | 7 (4.0%) | 11 (5.7%) |
| 45 to 49 Years | 7 (4.0%) | 17 (8.8%) |
| 50 to 54 Years | 26 (14.9%) | 5 (2.6%) |
| 55 to 59 Years | 14 (8.1%) | 28 (14.4%) |
| 60 to 64 Years | 23 (13.2%) | 7 (3.6%) |
| 65 to 69 Years | 10 (5.8%) | 0 (0.0%) |
| 70 to 74 Years | 5 (2.9%) | 12 (6.2%) |
| 75 to 79 Years | 12 (6.9%) | 51 (26.3%) |
| 80 to 84 Years | 8 (4.6%) | 0 (0.0%) |
| 85 Years and over | 5 (2.9%) | 14 (7.2%) |
| Total | 174 (100.0%) | 194 (100.0%) |
Families and Households in Petrolia
Median Family Size in Petrolia
The median family size in Petrolia is 2.57 persons per family, with married-couple families (67 | 62.6%) accounting for the largest median family size of 2.72 persons per family. On the other hand, single male/father families (18 | 16.8%) represent the smallest median family size with 2.11 persons per family.
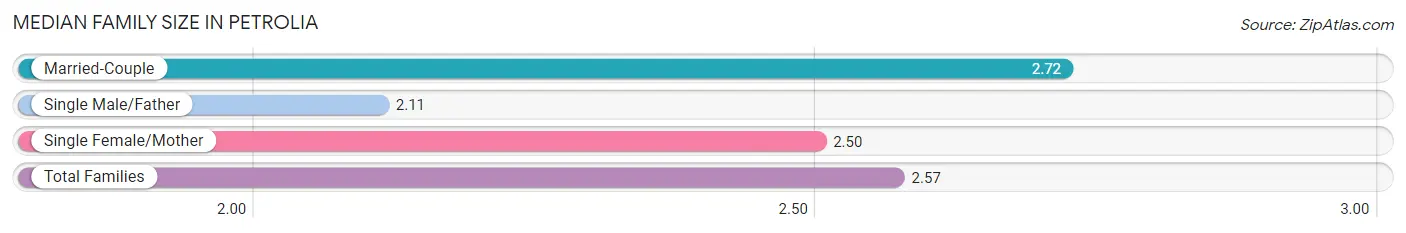
| Family Type | # Families | Family Size |
| Married-Couple | 67 (62.6%) | 2.72 |
| Single Male/Father | 18 (16.8%) | 2.11 |
| Single Female/Mother | 22 (20.6%) | 2.50 |
| Total Families | 107 (100.0%) | 2.57 |
Median Household Size in Petrolia
The median household size in Petrolia is 1.90 persons per household, with married-couple households (67 | 34.5%) accounting for the largest median household size of 2.72 persons per household. non-family households (87 | 44.9%) represent the smallest median household size with 1.07 persons per household.
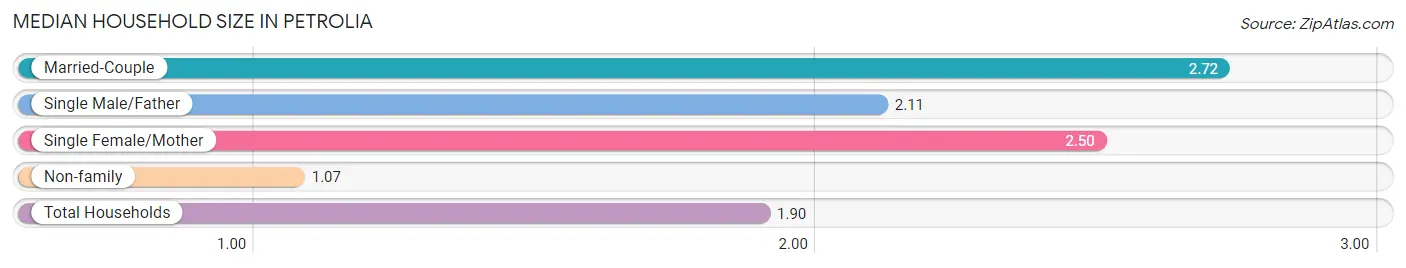
| Household Type | # Households | Household Size |
| Married-Couple | 67 (34.5%) | 2.72 |
| Single Male/Father | 18 (9.3%) | 2.11 |
| Single Female/Mother | 22 (11.3%) | 2.50 |
| Non-family | 87 (44.9%) | 1.07 |
| Total Households | 194 (100.0%) | 1.90 |
Household Size by Marriage Status in Petrolia
Out of a total of 194 households in Petrolia, 107 (55.1%) are family households, while 87 (44.9%) are nonfamily households. The most numerous type of family households are 2-person households, comprising 59, and the most common type of nonfamily households are 1-person households, comprising 82.
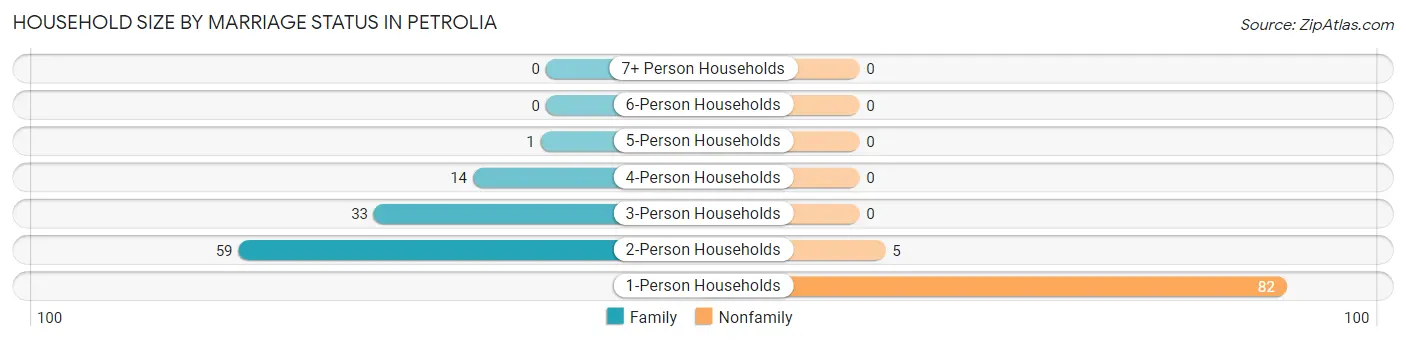
| Household Size | Family Households | Nonfamily Households |
| 1-Person Households | - | 82 (42.3%) |
| 2-Person Households | 59 (30.4%) | 5 (2.6%) |
| 3-Person Households | 33 (17.0%) | 0 (0.0%) |
| 4-Person Households | 14 (7.2%) | 0 (0.0%) |
| 5-Person Households | 1 (0.5%) | 0 (0.0%) |
| 6-Person Households | 0 (0.0%) | 0 (0.0%) |
| 7+ Person Households | 0 (0.0%) | 0 (0.0%) |
| Total | 107 (55.1%) | 87 (44.9%) |
Female Fertility in Petrolia
Fertility by Age in Petrolia
Average fertility rate in Petrolia is 254.0 births per 1,000 women. Women in the age bracket of 20 to 34 years have the highest fertility rate with 938.0 births per 1,000 women. Women in the age bracket of 20 to 34 years acount for 100.0% of all women with births.
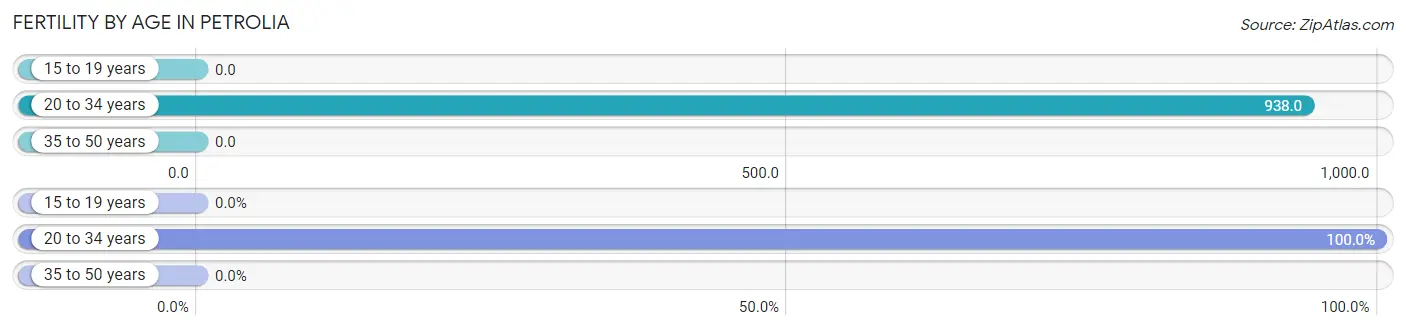
| Age Bracket | Women with Births | Births / 1,000 Women |
| 15 to 19 years | 0 (0.0%) | 0.0 |
| 20 to 34 years | 15 (100.0%) | 938.0 |
| 35 to 50 years | 0 (0.0%) | 0.0 |
| Total | 15 (100.0%) | 254.0 |
Fertility by Age by Marriage Status in Petrolia
33.3% of women with births (15) in Petrolia are married. The highest percentage of unmarried women with births falls into 20 to 34 years age bracket with 66.7% of them unmarried at the time of birth, while the lowest percentage of unmarried women with births belong to 20 to 34 years age bracket with 66.7% of them unmarried.
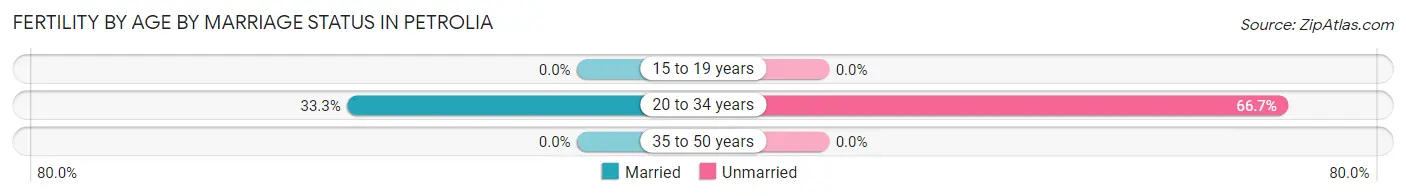
| Age Bracket | Married | Unmarried |
| 15 to 19 years | 0 (0.0%) | 0 (0.0%) |
| 20 to 34 years | 5 (33.3%) | 10 (66.7%) |
| 35 to 50 years | 0 (0.0%) | 0 (0.0%) |
| Total | 5 (33.3%) | 10 (66.7%) |
Fertility by Education in Petrolia
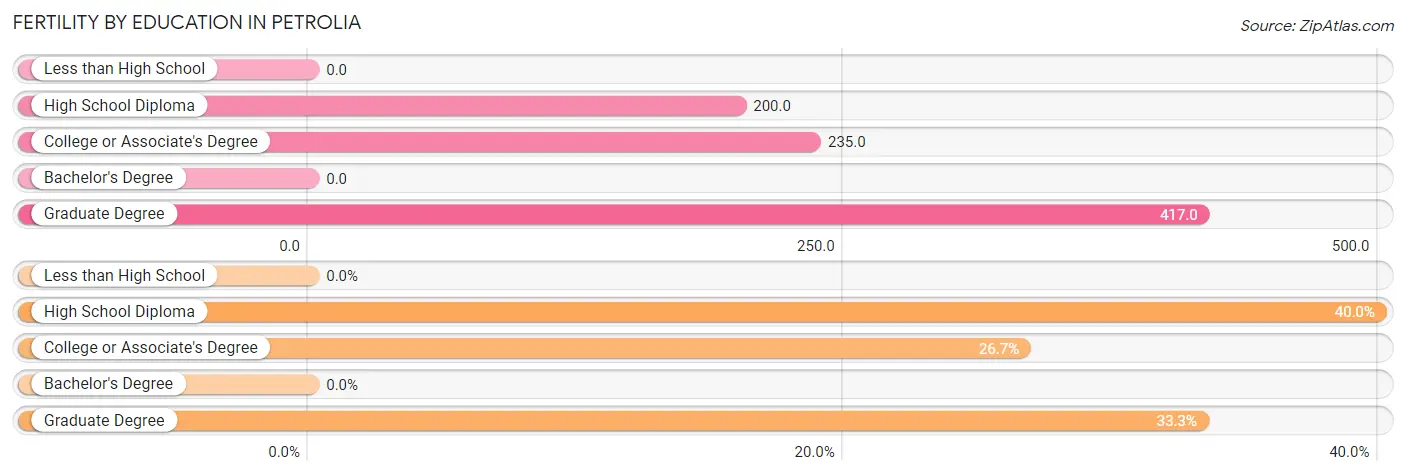
| Educational Attainment | Women with Births | Births / 1,000 Women |
| Less than High School | 0 (0.0%) | 0.0 |
| High School Diploma | 6 (40.0%) | 200.0 |
| College or Associate's Degree | 4 (26.7%) | 235.0 |
| Bachelor's Degree | 0 (0.0%) | 0.0 |
| Graduate Degree | 5 (33.3%) | 417.0 |
| Total | 15 (100.0%) | 254.0 |
Fertility by Education by Marriage Status in Petrolia
66.7% of women with births in Petrolia are unmarried. Women with the educational attainment of graduate degree are most likely to be married with 100.0% of them married at childbirth, while women with the educational attainment of high school diploma are least likely to be married with 100.0% of them unmarried at childbirth.
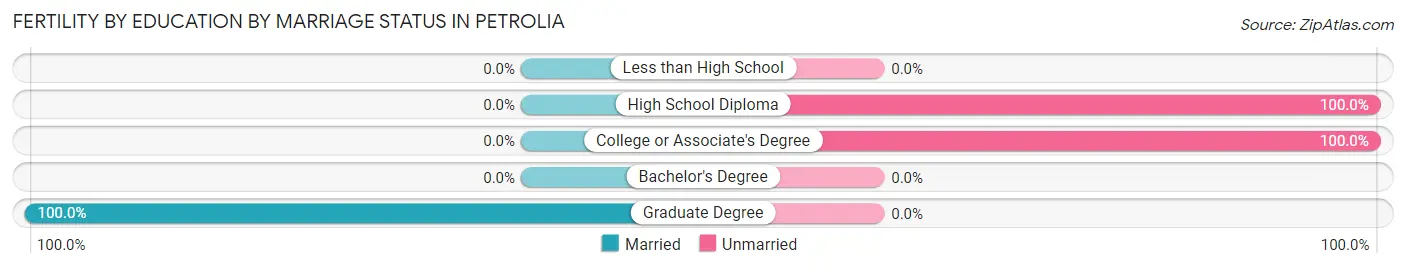
| Educational Attainment | Married | Unmarried |
| Less than High School | 0 (0.0%) | 0 (0.0%) |
| High School Diploma | 0 (0.0%) | 6 (100.0%) |
| College or Associate's Degree | 0 (0.0%) | 4 (100.0%) |
| Bachelor's Degree | 0 (0.0%) | 0 (0.0%) |
| Graduate Degree | 5 (100.0%) | 0 (0.0%) |
| Total | 5 (33.3%) | 10 (66.7%) |
Employment Characteristics in Petrolia
Employment by Class of Employer in Petrolia
Among the 130 employed individuals in Petrolia, private company employees (78 | 60.0%), not-for-profit organizations (19 | 14.6%), and self-employed (not incorporated) (17 | 13.1%) make up the most common classes of employment.
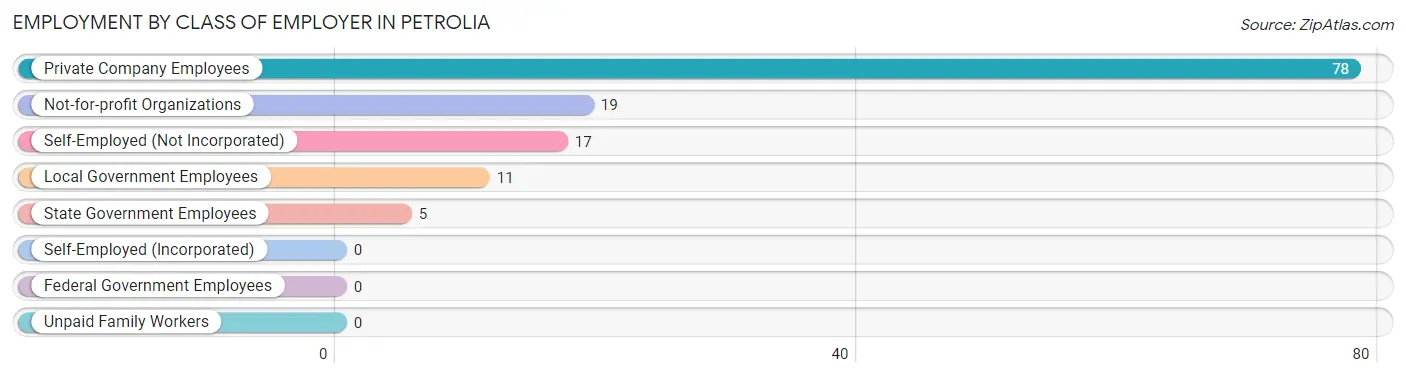
| Employer Class | # Employees | % Employees |
| Private Company Employees | 78 | 60.0% |
| Self-Employed (Incorporated) | 0 | 0.0% |
| Self-Employed (Not Incorporated) | 17 | 13.1% |
| Not-for-profit Organizations | 19 | 14.6% |
| Local Government Employees | 11 | 8.5% |
| State Government Employees | 5 | 3.8% |
| Federal Government Employees | 0 | 0.0% |
| Unpaid Family Workers | 0 | 0.0% |
| Total | 130 | 100.0% |
Employment Status by Age in Petrolia
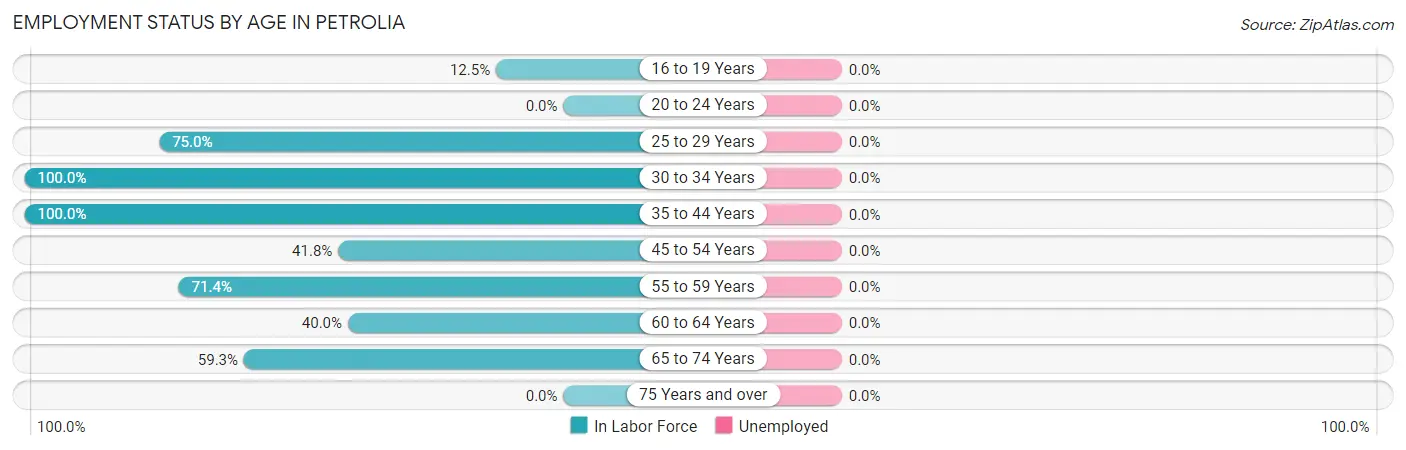
| Age Bracket | In Labor Force | Unemployed |
| 16 to 19 Years | 1 (12.5%) | 0 (0.0%) |
| 20 to 24 Years | 0 (0.0%) | 0 (0.0%) |
| 25 to 29 Years | 3 (75.0%) | 0 (0.0%) |
| 30 to 34 Years | 7 (100.0%) | 0 (0.0%) |
| 35 to 44 Years | 38 (100.0%) | 0 (0.0%) |
| 45 to 54 Years | 23 (41.8%) | 0 (0.0%) |
| 55 to 59 Years | 30 (71.4%) | 0 (0.0%) |
| 60 to 64 Years | 12 (40.0%) | 0 (0.0%) |
| 65 to 74 Years | 16 (59.3%) | 0 (0.0%) |
| 75 Years and over | 0 (0.0%) | 0 (0.0%) |
| Total | 130 (41.8%) | 0 (0.0%) |
Employment Status by Educational Attainment in Petrolia
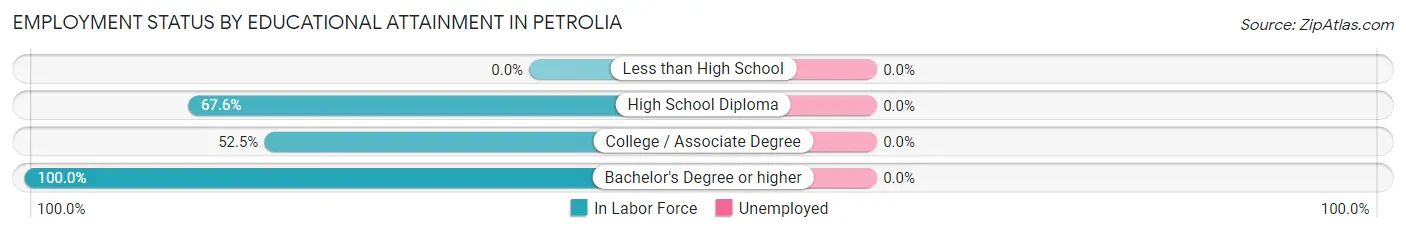
| Educational Attainment | In Labor Force | Unemployed |
| Less than High School | 0 (0.0%) | 0 (0.0%) |
| High School Diploma | 50 (67.6%) | 0 (0.0%) |
| College / Associate Degree | 31 (52.5%) | 0 (0.0%) |
| Bachelor's Degree or higher | 32 (100.0%) | 0 (0.0%) |
| Total | 113 (64.2%) | 0 (0.0%) |
Employment Occupations by Sex in Petrolia
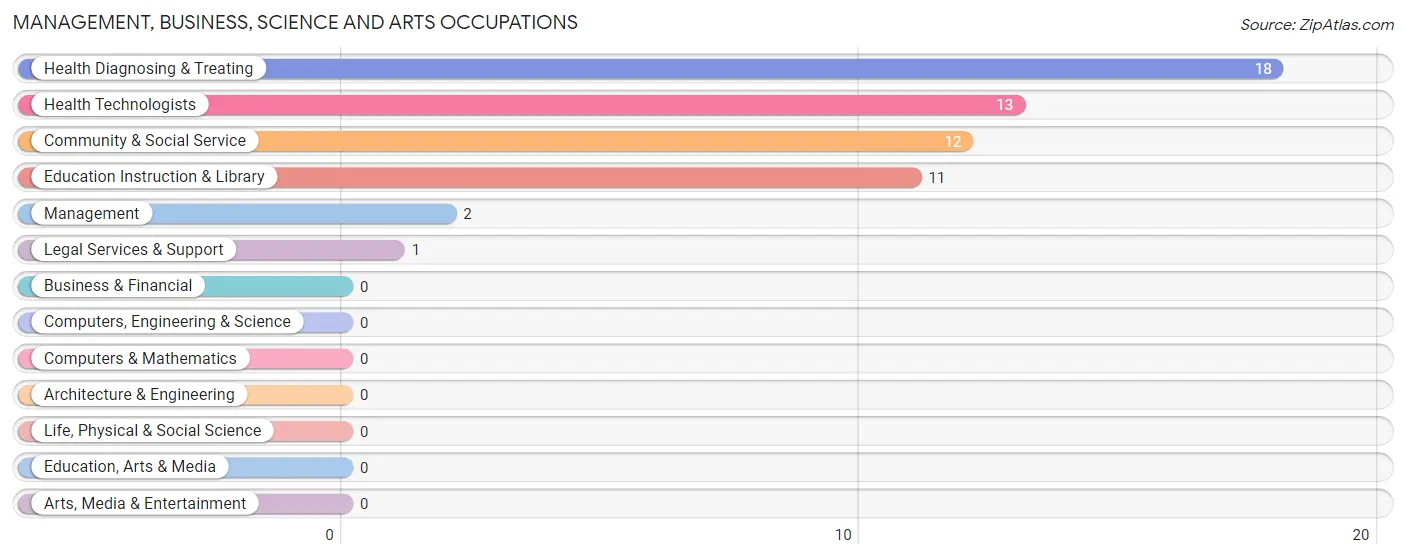
Management, Business, Science and Arts Occupations
The most common Management, Business, Science and Arts occupations in Petrolia are Health Diagnosing & Treating (18 | 13.9%), Health Technologists (13 | 10.0%), Community & Social Service (12 | 9.2%), Education Instruction & Library (11 | 8.5%), and Management (2 | 1.5%).
Management, Business, Science and Arts Occupations by Sex
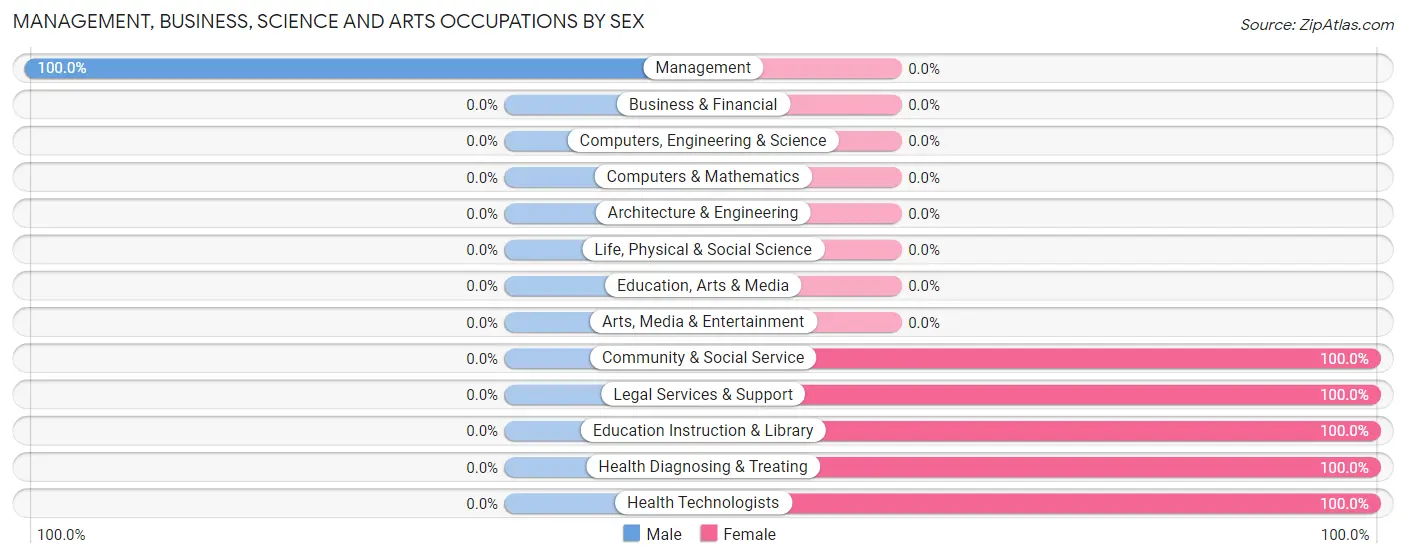
| Occupation | Male | Female |
| Management | 2 (100.0%) | 0 (0.0%) |
| Business & Financial | 0 (0.0%) | 0 (0.0%) |
| Computers, Engineering & Science | 0 (0.0%) | 0 (0.0%) |
| Computers & Mathematics | 0 (0.0%) | 0 (0.0%) |
| Architecture & Engineering | 0 (0.0%) | 0 (0.0%) |
| Life, Physical & Social Science | 0 (0.0%) | 0 (0.0%) |
| Community & Social Service | 0 (0.0%) | 12 (100.0%) |
| Education, Arts & Media | 0 (0.0%) | 0 (0.0%) |
| Legal Services & Support | 0 (0.0%) | 1 (100.0%) |
| Education Instruction & Library | 0 (0.0%) | 11 (100.0%) |
| Arts, Media & Entertainment | 0 (0.0%) | 0 (0.0%) |
| Health Diagnosing & Treating | 0 (0.0%) | 18 (100.0%) |
| Health Technologists | 0 (0.0%) | 13 (100.0%) |
| Total (Category) | 2 (6.2%) | 30 (93.8%) |
| Total (Overall) | 63 (48.5%) | 67 (51.5%) |
Services Occupations
The most common Services occupations in Petrolia are Healthcare Support (21 | 16.2%), and Cleaning & Maintenance (7 | 5.4%).
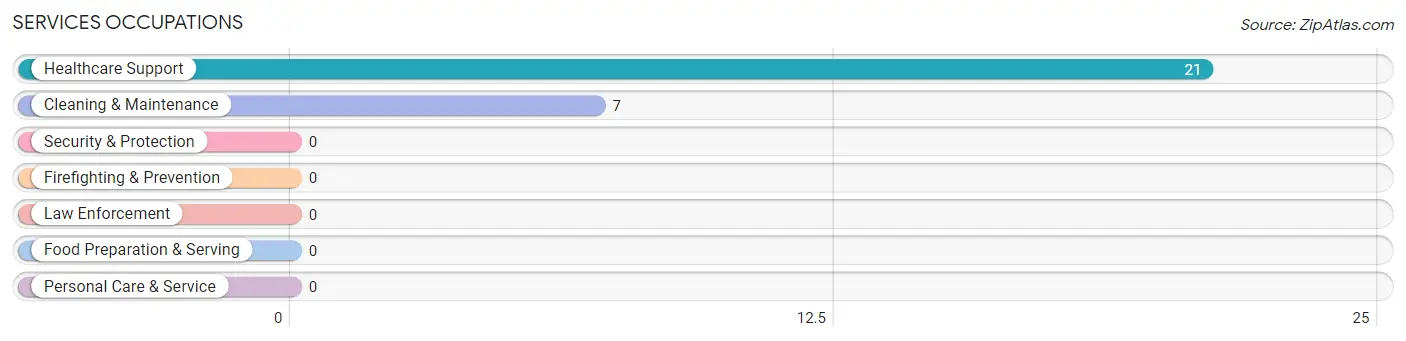
Services Occupations by Sex
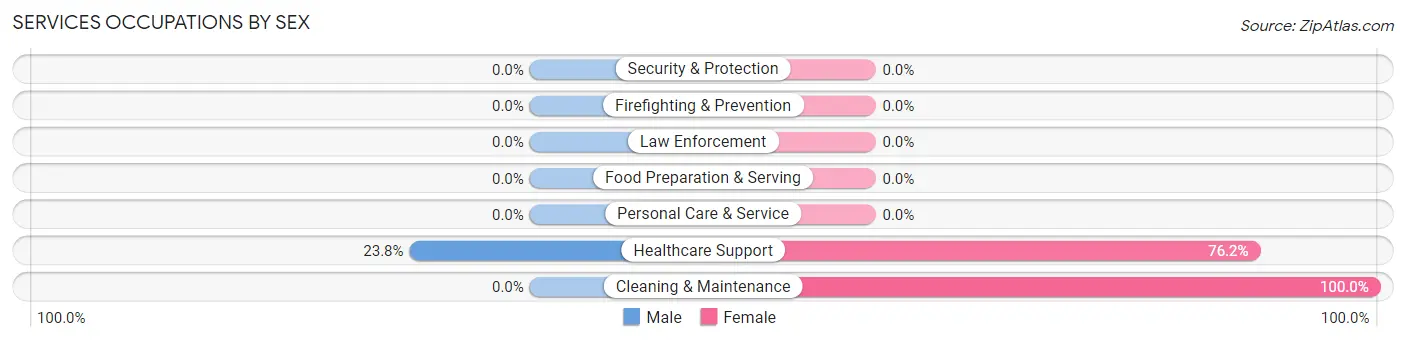
| Occupation | Male | Female |
| Healthcare Support | 5 (23.8%) | 16 (76.2%) |
| Security & Protection | 0 (0.0%) | 0 (0.0%) |
| Firefighting & Prevention | 0 (0.0%) | 0 (0.0%) |
| Law Enforcement | 0 (0.0%) | 0 (0.0%) |
| Food Preparation & Serving | 0 (0.0%) | 0 (0.0%) |
| Cleaning & Maintenance | 0 (0.0%) | 7 (100.0%) |
| Personal Care & Service | 0 (0.0%) | 0 (0.0%) |
| Total (Category) | 5 (17.9%) | 23 (82.1%) |
| Total (Overall) | 63 (48.5%) | 67 (51.5%) |
Sales and Office Occupations
The most common Sales and Office occupations in Petrolia are Office & Administration (12 | 9.2%), and Sales & Related (10 | 7.7%).

Sales and Office Occupations by Sex
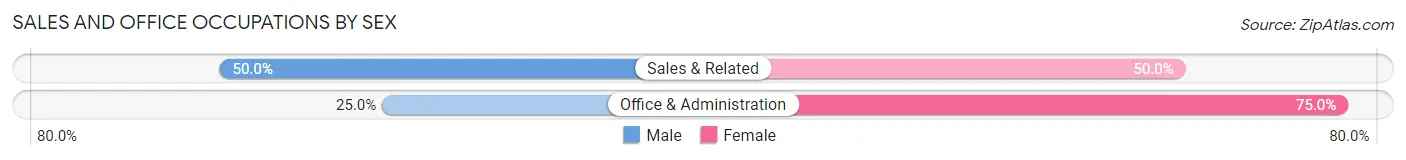
| Occupation | Male | Female |
| Sales & Related | 5 (50.0%) | 5 (50.0%) |
| Office & Administration | 3 (25.0%) | 9 (75.0%) |
| Total (Category) | 8 (36.4%) | 14 (63.6%) |
| Total (Overall) | 63 (48.5%) | 67 (51.5%) |
Natural Resources, Construction and Maintenance Occupations
The most common Natural Resources, Construction and Maintenance occupations in Petrolia are , and Construction & Extraction (16 | 12.3%).
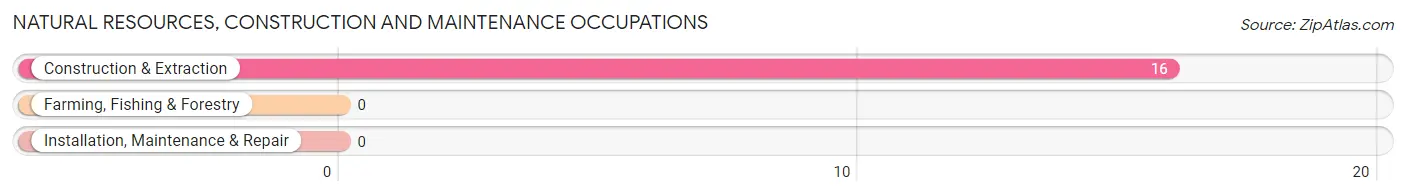
Natural Resources, Construction and Maintenance Occupations by Sex
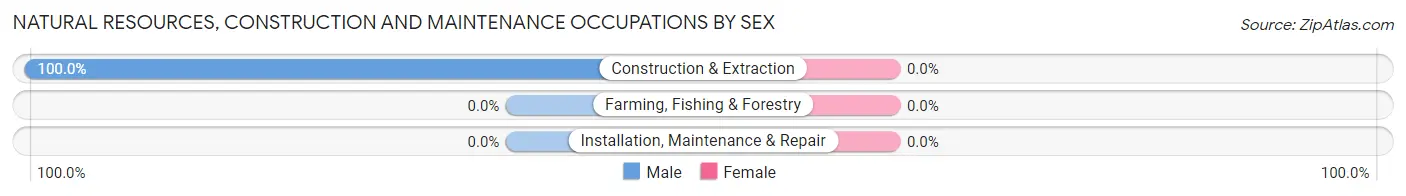
| Occupation | Male | Female |
| Farming, Fishing & Forestry | 0 (0.0%) | 0 (0.0%) |
| Construction & Extraction | 16 (100.0%) | 0 (0.0%) |
| Installation, Maintenance & Repair | 0 (0.0%) | 0 (0.0%) |
| Total (Category) | 16 (100.0%) | 0 (0.0%) |
| Total (Overall) | 63 (48.5%) | 67 (51.5%) |
Production, Transportation and Moving Occupations
The most common Production, Transportation and Moving occupations in Petrolia are Transportation (22 | 16.9%), Production (6 | 4.6%), and Material Moving (4 | 3.1%).
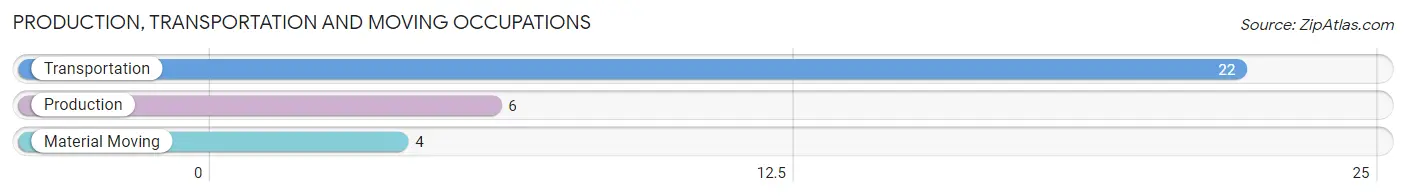
Production, Transportation and Moving Occupations by Sex
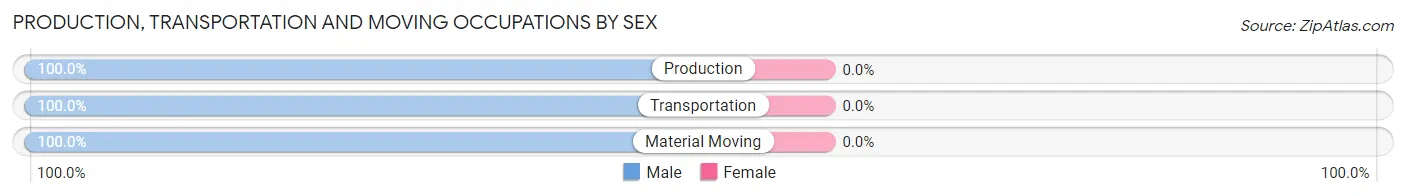
| Occupation | Male | Female |
| Production | 6 (100.0%) | 0 (0.0%) |
| Transportation | 22 (100.0%) | 0 (0.0%) |
| Material Moving | 4 (100.0%) | 0 (0.0%) |
| Total (Category) | 32 (100.0%) | 0 (0.0%) |
| Total (Overall) | 63 (48.5%) | 67 (51.5%) |
Employment Industries by Sex in Petrolia
Employment Industries in Petrolia
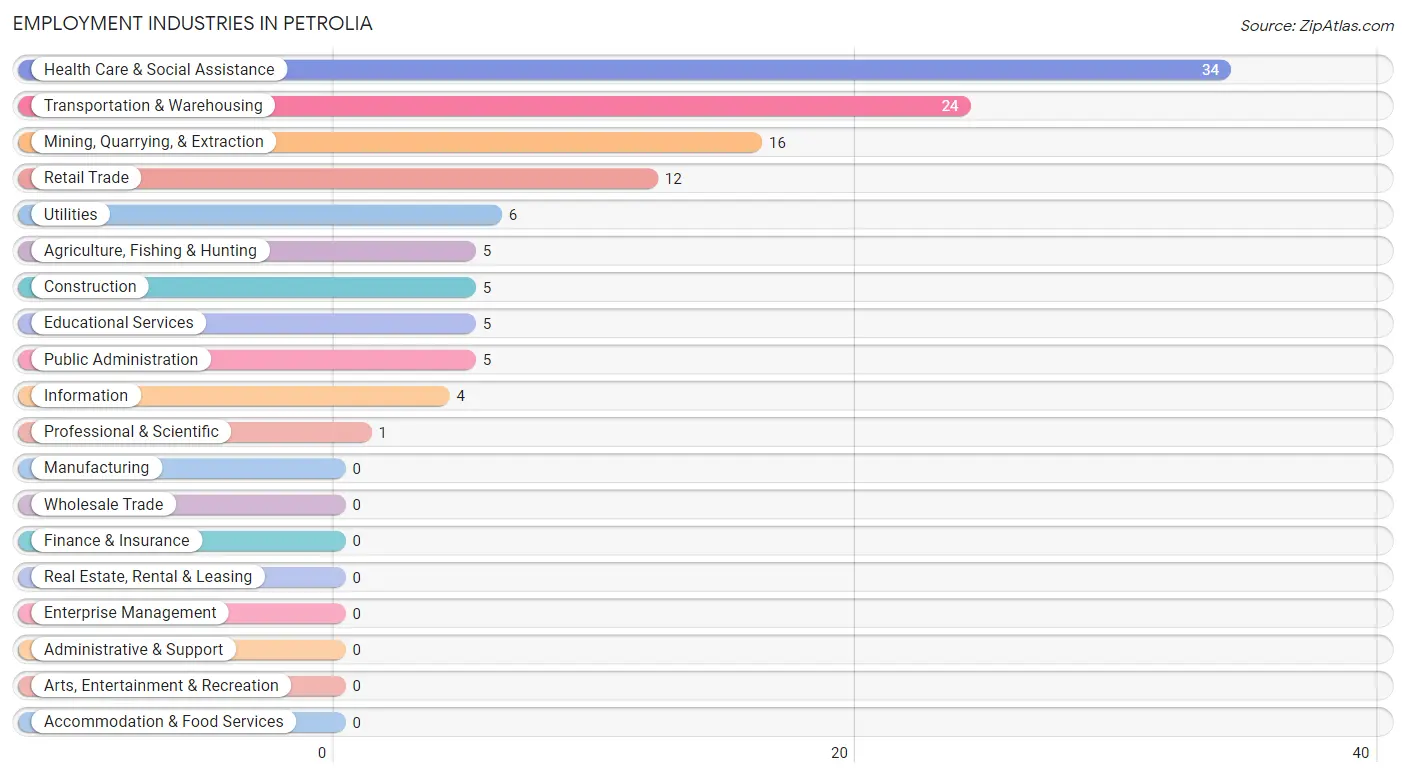
The major employment industries in Petrolia include Health Care & Social Assistance (34 | 26.2%), Transportation & Warehousing (24 | 18.5%), Mining, Quarrying, & Extraction (16 | 12.3%), Retail Trade (12 | 9.2%), and Utilities (6 | 4.6%).
Employment Industries by Sex in Petrolia
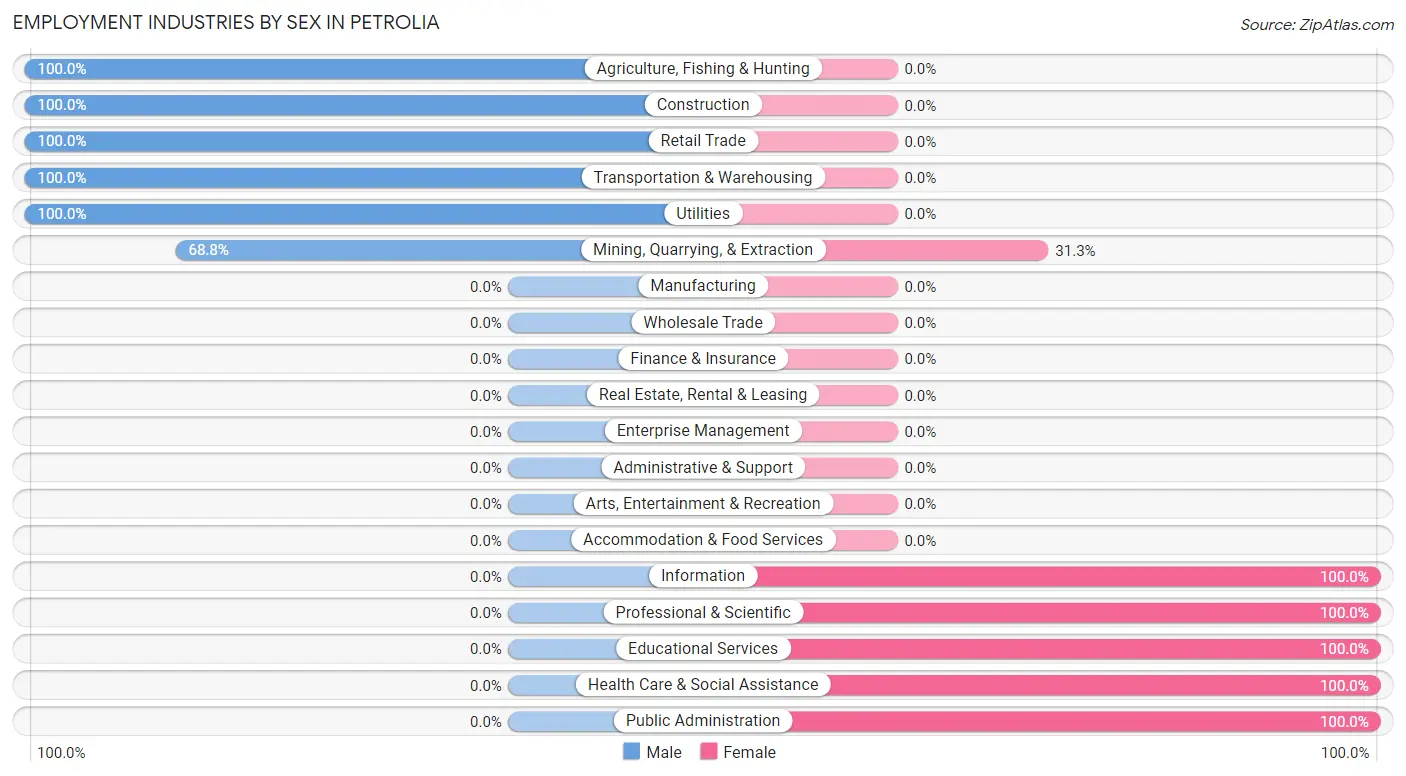
The Petrolia industries that see more men than women are Agriculture, Fishing & Hunting (100.0%), Construction (100.0%), and Retail Trade (100.0%), whereas the industries that tend to have a higher number of women are Information (100.0%), Professional & Scientific (100.0%), and Educational Services (100.0%).
| Industry | Male | Female |
| Agriculture, Fishing & Hunting | 5 (100.0%) | 0 (0.0%) |
| Mining, Quarrying, & Extraction | 11 (68.8%) | 5 (31.2%) |
| Construction | 5 (100.0%) | 0 (0.0%) |
| Manufacturing | 0 (0.0%) | 0 (0.0%) |
| Wholesale Trade | 0 (0.0%) | 0 (0.0%) |
| Retail Trade | 12 (100.0%) | 0 (0.0%) |
| Transportation & Warehousing | 24 (100.0%) | 0 (0.0%) |
| Utilities | 6 (100.0%) | 0 (0.0%) |
| Information | 0 (0.0%) | 4 (100.0%) |
| Finance & Insurance | 0 (0.0%) | 0 (0.0%) |
| Real Estate, Rental & Leasing | 0 (0.0%) | 0 (0.0%) |
| Professional & Scientific | 0 (0.0%) | 1 (100.0%) |
| Enterprise Management | 0 (0.0%) | 0 (0.0%) |
| Administrative & Support | 0 (0.0%) | 0 (0.0%) |
| Educational Services | 0 (0.0%) | 5 (100.0%) |
| Health Care & Social Assistance | 0 (0.0%) | 34 (100.0%) |
| Arts, Entertainment & Recreation | 0 (0.0%) | 0 (0.0%) |
| Accommodation & Food Services | 0 (0.0%) | 0 (0.0%) |
| Public Administration | 0 (0.0%) | 5 (100.0%) |
| Total | 63 (48.5%) | 67 (51.5%) |
Education in Petrolia
School Enrollment in Petrolia
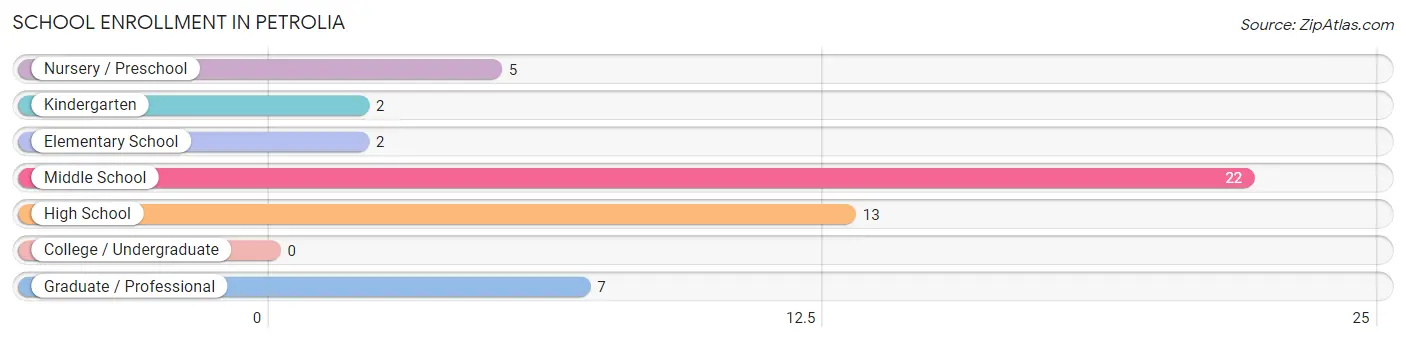
The most common levels of schooling among the 51 students in Petrolia are middle school (22 | 43.1%), high school (13 | 25.5%), and graduate / professional (7 | 13.7%).
| School Level | # Students | % Students |
| Nursery / Preschool | 5 | 9.8% |
| Kindergarten | 2 | 3.9% |
| Elementary School | 2 | 3.9% |
| Middle School | 22 | 43.1% |
| High School | 13 | 25.5% |
| College / Undergraduate | 0 | 0.0% |
| Graduate / Professional | 7 | 13.7% |
| Total | 51 | 100.0% |
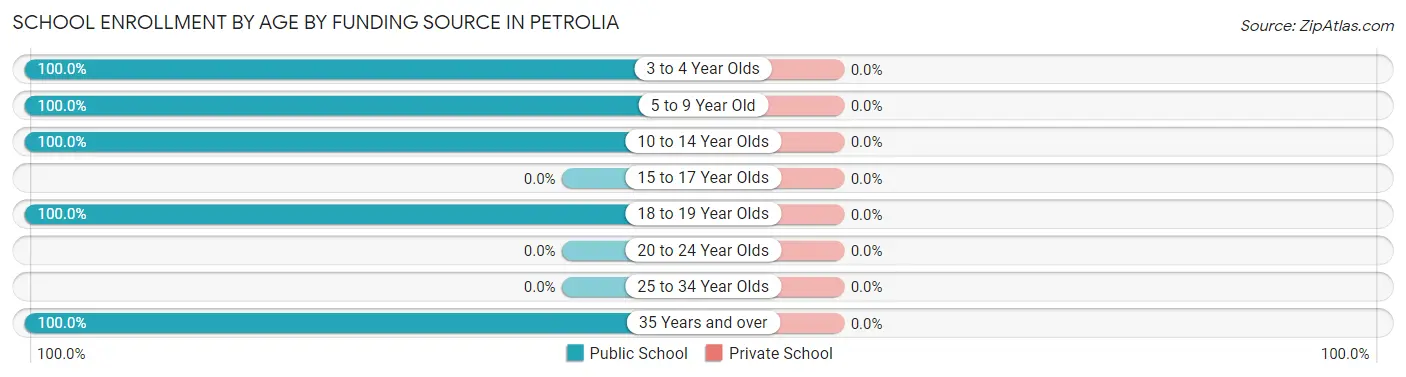
School Enrollment by Age by Funding Source in Petrolia
| Age Bracket | Public School | Private School |
| 3 to 4 Year Olds | 5 (100.0%) | 0 (0.0%) |
| 5 to 9 Year Old | 4 (100.0%) | 0 (0.0%) |
| 10 to 14 Year Olds | 28 (100.0%) | 0 (0.0%) |
| 15 to 17 Year Olds | 0 (0.0%) | 0 (0.0%) |
| 18 to 19 Year Olds | 7 (100.0%) | 0 (0.0%) |
| 20 to 24 Year Olds | 0 (0.0%) | 0 (0.0%) |
| 25 to 34 Year Olds | 0 (0.0%) | 0 (0.0%) |
| 35 Years and over | 7 (100.0%) | 0 (0.0%) |
| Total | 51 (100.0%) | 0 (0.0%) |
Educational Attainment by Field of Study in Petrolia
Science & technology (14 | 21.2%), physical & health sciences (13 | 19.7%), bio, nature & agricultural (12 | 18.2%), computers & mathematics (7 | 10.6%), and literature & languages (7 | 10.6%) are the most common fields of study among 66 individuals in Petrolia who have obtained a bachelor's degree or higher.
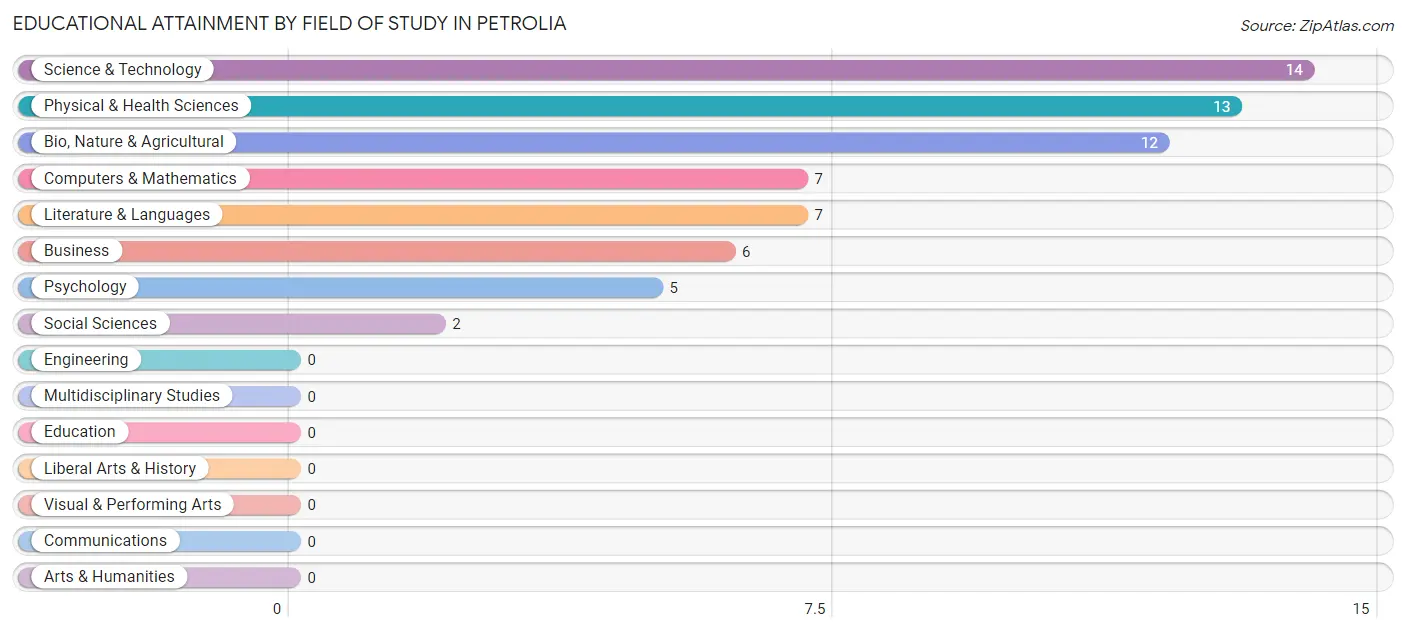
| Field of Study | # Graduates | % Graduates |
| Computers & Mathematics | 7 | 10.6% |
| Bio, Nature & Agricultural | 12 | 18.2% |
| Physical & Health Sciences | 13 | 19.7% |
| Psychology | 5 | 7.6% |
| Social Sciences | 2 | 3.0% |
| Engineering | 0 | 0.0% |
| Multidisciplinary Studies | 0 | 0.0% |
| Science & Technology | 14 | 21.2% |
| Business | 6 | 9.1% |
| Education | 0 | 0.0% |
| Literature & Languages | 7 | 10.6% |
| Liberal Arts & History | 0 | 0.0% |
| Visual & Performing Arts | 0 | 0.0% |
| Communications | 0 | 0.0% |
| Arts & Humanities | 0 | 0.0% |
| Total | 66 | 100.0% |
Transportation & Commute in Petrolia
Vehicle Availability by Sex in Petrolia
The most prevalent vehicle ownership categories in Petrolia are males with 2 vehicles (44, accounting for 69.8%) and females with 2 vehicles (32, making up 65.7%).
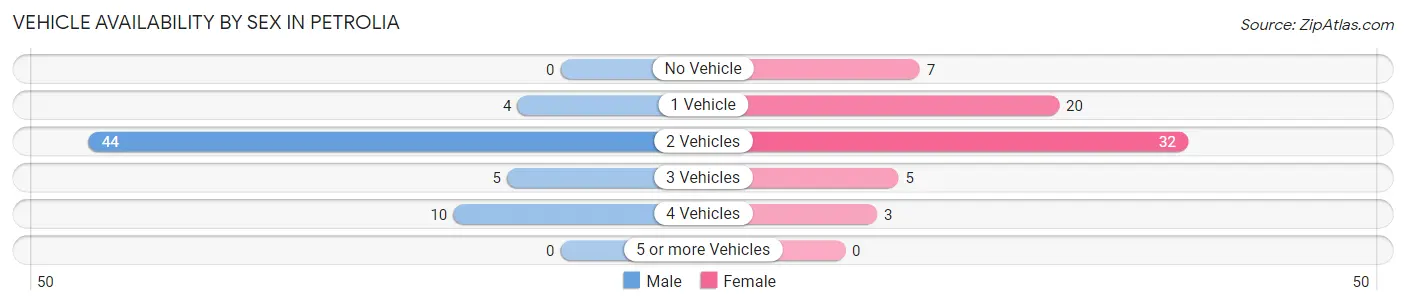
| Vehicles Available | Male | Female |
| No Vehicle | 0 (0.0%) | 7 (10.4%) |
| 1 Vehicle | 4 (6.4%) | 20 (29.8%) |
| 2 Vehicles | 44 (69.8%) | 32 (47.8%) |
| 3 Vehicles | 5 (7.9%) | 5 (7.5%) |
| 4 Vehicles | 10 (15.9%) | 3 (4.5%) |
| 5 or more Vehicles | 0 (0.0%) | 0 (0.0%) |
| Total | 63 (100.0%) | 67 (100.0%) |
Commute Time in Petrolia
The most frequently occuring commute durations in Petrolia are 25 to 29 minutes (46 commuters, 35.4%), 20 to 24 minutes (33 commuters, 25.4%), and 30 to 34 minutes (20 commuters, 15.4%).
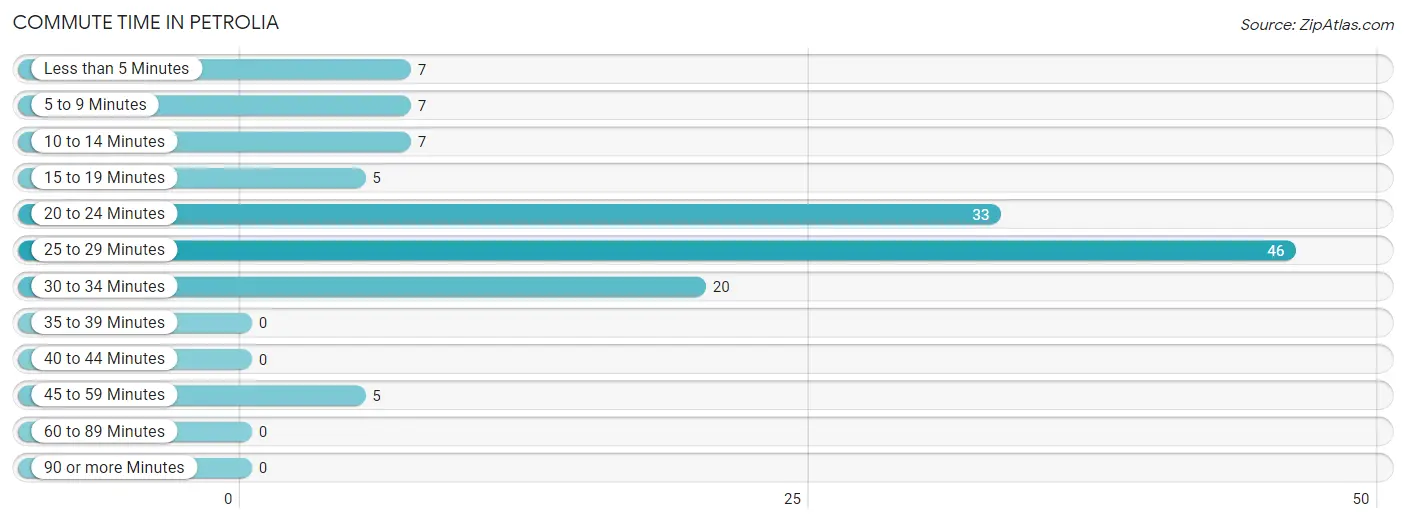
| Commute Time | # Commuters | % Commuters |
| Less than 5 Minutes | 7 | 5.4% |
| 5 to 9 Minutes | 7 | 5.4% |
| 10 to 14 Minutes | 7 | 5.4% |
| 15 to 19 Minutes | 5 | 3.8% |
| 20 to 24 Minutes | 33 | 25.4% |
| 25 to 29 Minutes | 46 | 35.4% |
| 30 to 34 Minutes | 20 | 15.4% |
| 35 to 39 Minutes | 0 | 0.0% |
| 40 to 44 Minutes | 0 | 0.0% |
| 45 to 59 Minutes | 5 | 3.8% |
| 60 to 89 Minutes | 0 | 0.0% |
| 90 or more Minutes | 0 | 0.0% |
Commute Time by Sex in Petrolia
The most common commute times in Petrolia are 20 to 24 minutes (25 commuters, 39.7%) for males and 25 to 29 minutes (28 commuters, 41.8%) for females.
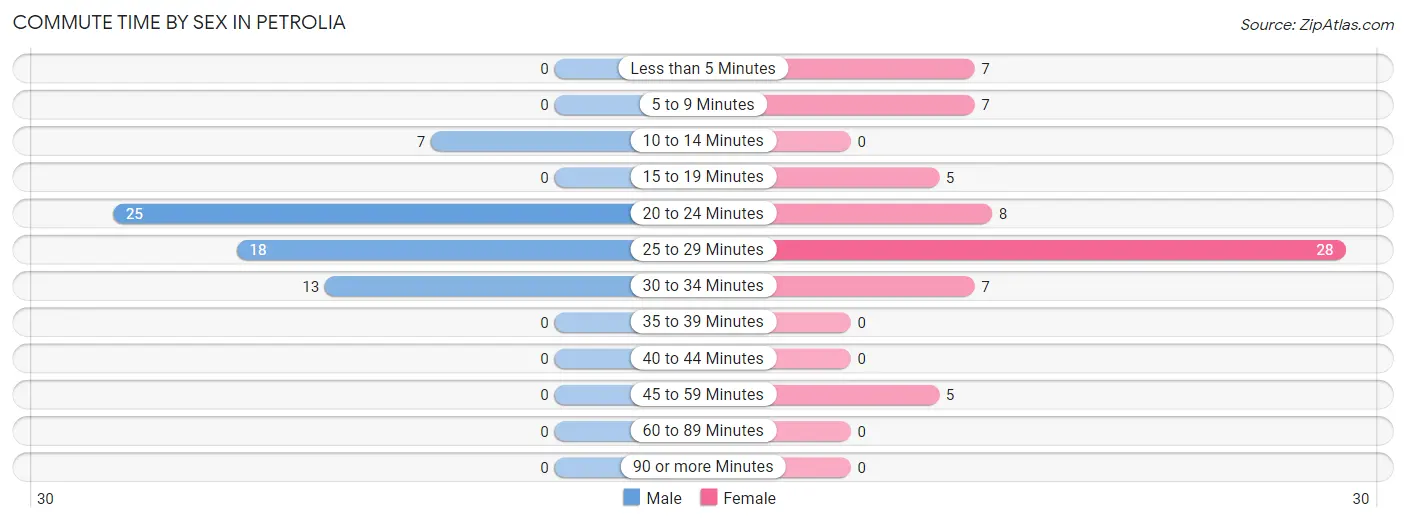
| Commute Time | Male | Female |
| Less than 5 Minutes | 0 (0.0%) | 7 (10.4%) |
| 5 to 9 Minutes | 0 (0.0%) | 7 (10.4%) |
| 10 to 14 Minutes | 7 (11.1%) | 0 (0.0%) |
| 15 to 19 Minutes | 0 (0.0%) | 5 (7.5%) |
| 20 to 24 Minutes | 25 (39.7%) | 8 (11.9%) |
| 25 to 29 Minutes | 18 (28.6%) | 28 (41.8%) |
| 30 to 34 Minutes | 13 (20.6%) | 7 (10.4%) |
| 35 to 39 Minutes | 0 (0.0%) | 0 (0.0%) |
| 40 to 44 Minutes | 0 (0.0%) | 0 (0.0%) |
| 45 to 59 Minutes | 0 (0.0%) | 5 (7.5%) |
| 60 to 89 Minutes | 0 (0.0%) | 0 (0.0%) |
| 90 or more Minutes | 0 (0.0%) | 0 (0.0%) |
Time of Departure to Work by Sex in Petrolia
The most frequent times of departure to work in Petrolia are 7:00 AM to 7:29 AM (27, 42.9%) for males and 7:30 AM to 7:59 AM (26, 38.8%) for females.
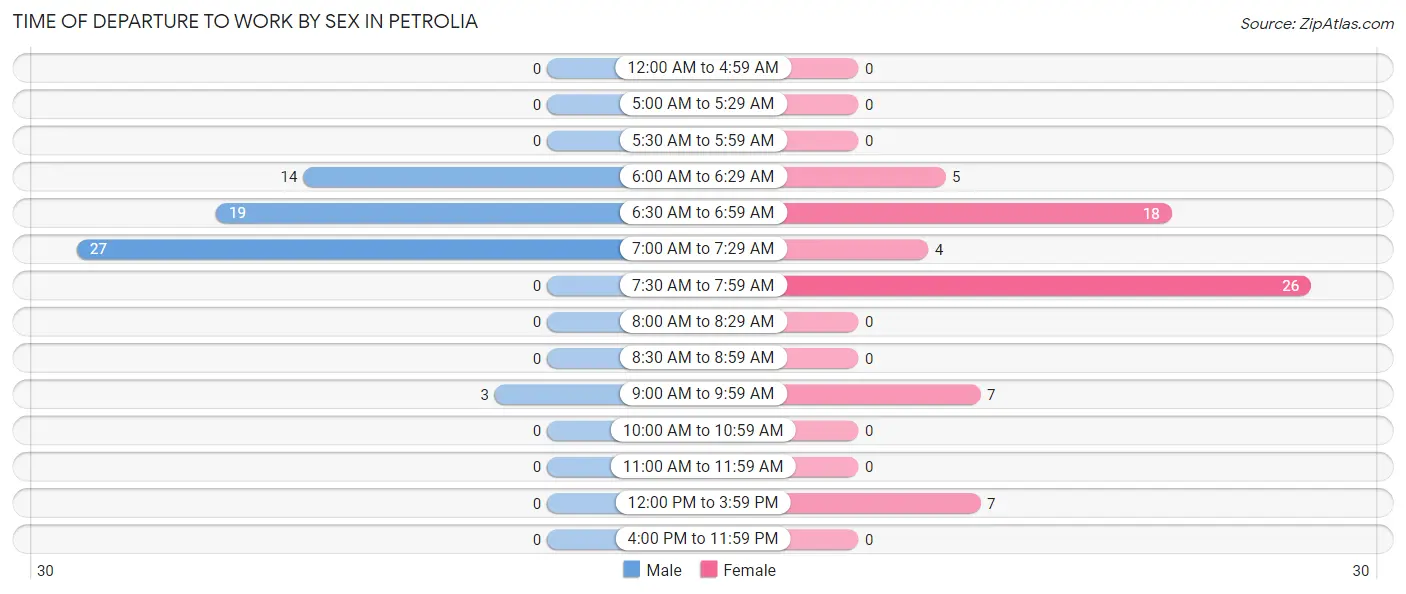
| Time of Departure | Male | Female |
| 12:00 AM to 4:59 AM | 0 (0.0%) | 0 (0.0%) |
| 5:00 AM to 5:29 AM | 0 (0.0%) | 0 (0.0%) |
| 5:30 AM to 5:59 AM | 0 (0.0%) | 0 (0.0%) |
| 6:00 AM to 6:29 AM | 14 (22.2%) | 5 (7.5%) |
| 6:30 AM to 6:59 AM | 19 (30.2%) | 18 (26.9%) |
| 7:00 AM to 7:29 AM | 27 (42.9%) | 4 (6.0%) |
| 7:30 AM to 7:59 AM | 0 (0.0%) | 26 (38.8%) |
| 8:00 AM to 8:29 AM | 0 (0.0%) | 0 (0.0%) |
| 8:30 AM to 8:59 AM | 0 (0.0%) | 0 (0.0%) |
| 9:00 AM to 9:59 AM | 3 (4.8%) | 7 (10.4%) |
| 10:00 AM to 10:59 AM | 0 (0.0%) | 0 (0.0%) |
| 11:00 AM to 11:59 AM | 0 (0.0%) | 0 (0.0%) |
| 12:00 PM to 3:59 PM | 0 (0.0%) | 7 (10.4%) |
| 4:00 PM to 11:59 PM | 0 (0.0%) | 0 (0.0%) |
| Total | 63 (100.0%) | 67 (100.0%) |
Housing Occupancy in Petrolia
Occupancy by Ownership in Petrolia
Of the total 194 dwellings in Petrolia, owner-occupied units account for 158 (81.4%), while renter-occupied units make up 36 (18.6%).
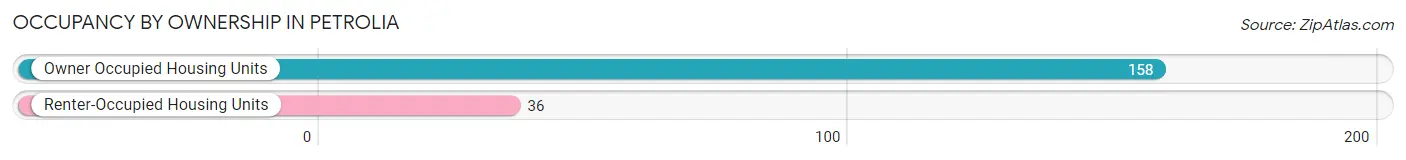
| Occupancy | # Housing Units | % Housing Units |
| Owner Occupied Housing Units | 158 | 81.4% |
| Renter-Occupied Housing Units | 36 | 18.6% |
| Total Occupied Housing Units | 194 | 100.0% |
Occupancy by Household Size in Petrolia
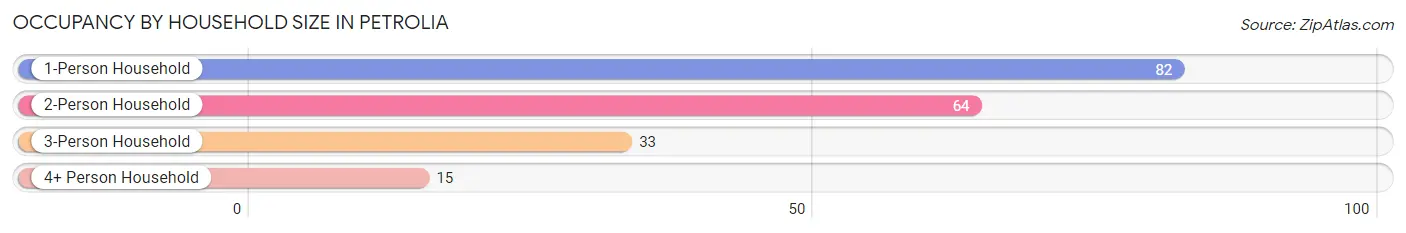
| Household Size | # Housing Units | % Housing Units |
| 1-Person Household | 82 | 42.3% |
| 2-Person Household | 64 | 33.0% |
| 3-Person Household | 33 | 17.0% |
| 4+ Person Household | 15 | 7.7% |
| Total Housing Units | 194 | 100.0% |
Occupancy by Ownership by Household Size in Petrolia
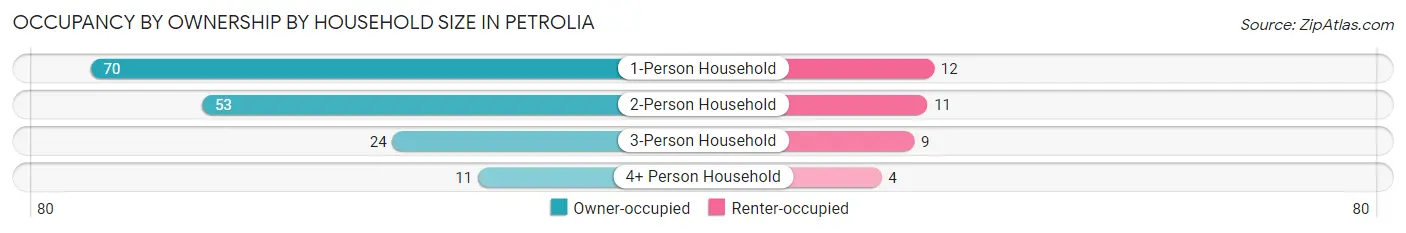
| Household Size | Owner-occupied | Renter-occupied |
| 1-Person Household | 70 (85.4%) | 12 (14.6%) |
| 2-Person Household | 53 (82.8%) | 11 (17.2%) |
| 3-Person Household | 24 (72.7%) | 9 (27.3%) |
| 4+ Person Household | 11 (73.3%) | 4 (26.7%) |
| Total Housing Units | 158 (81.4%) | 36 (18.6%) |
Occupancy by Educational Attainment in Petrolia
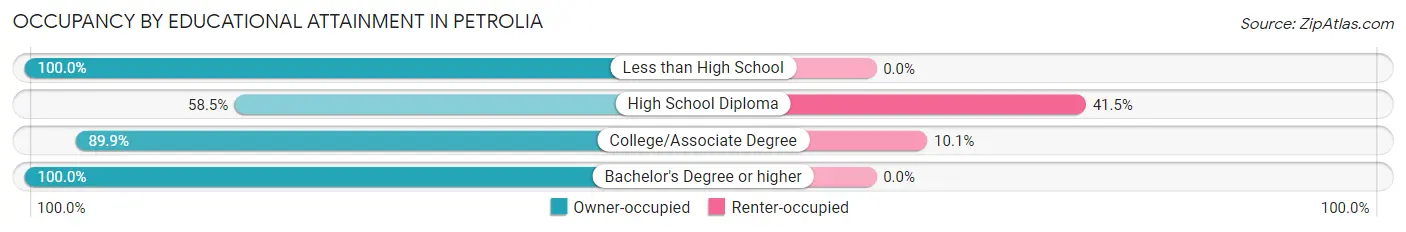
| Household Size | Owner-occupied | Renter-occupied |
| Less than High School | 8 (100.0%) | 0 (0.0%) |
| High School Diploma | 38 (58.5%) | 27 (41.5%) |
| College/Associate Degree | 80 (89.9%) | 9 (10.1%) |
| Bachelor's Degree or higher | 32 (100.0%) | 0 (0.0%) |
Occupancy by Age of Householder in Petrolia
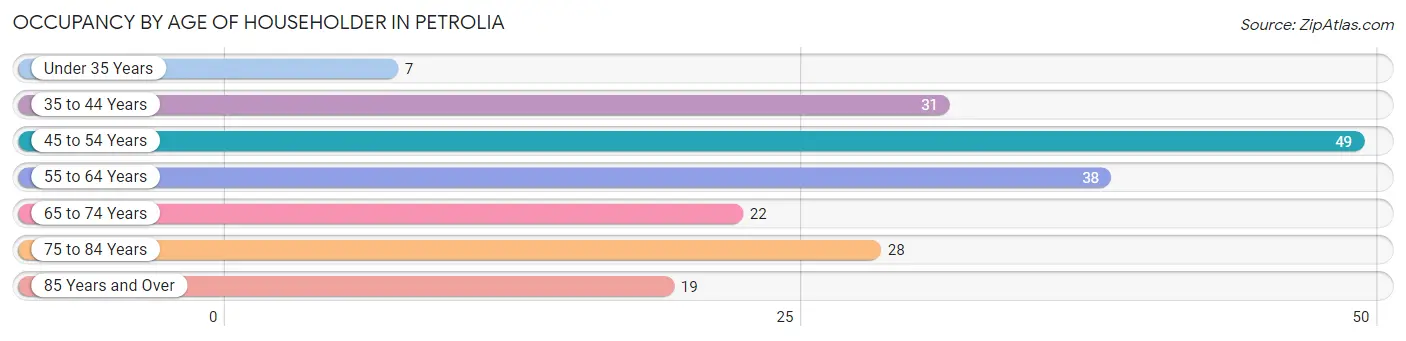
| Age Bracket | # Households | % Households |
| Under 35 Years | 7 | 3.6% |
| 35 to 44 Years | 31 | 16.0% |
| 45 to 54 Years | 49 | 25.3% |
| 55 to 64 Years | 38 | 19.6% |
| 65 to 74 Years | 22 | 11.3% |
| 75 to 84 Years | 28 | 14.4% |
| 85 Years and Over | 19 | 9.8% |
| Total | 194 | 100.0% |
Housing Finances in Petrolia
Median Income by Occupancy in Petrolia
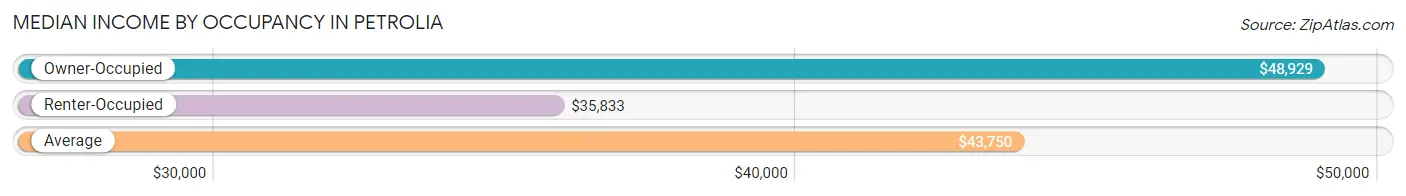
| Occupancy Type | # Households | Median Income |
| Owner-Occupied | 158 (81.4%) | $48,929 |
| Renter-Occupied | 36 (18.6%) | $35,833 |
| Average | 194 (100.0%) | $43,750 |
Occupancy by Householder Income Bracket in Petrolia
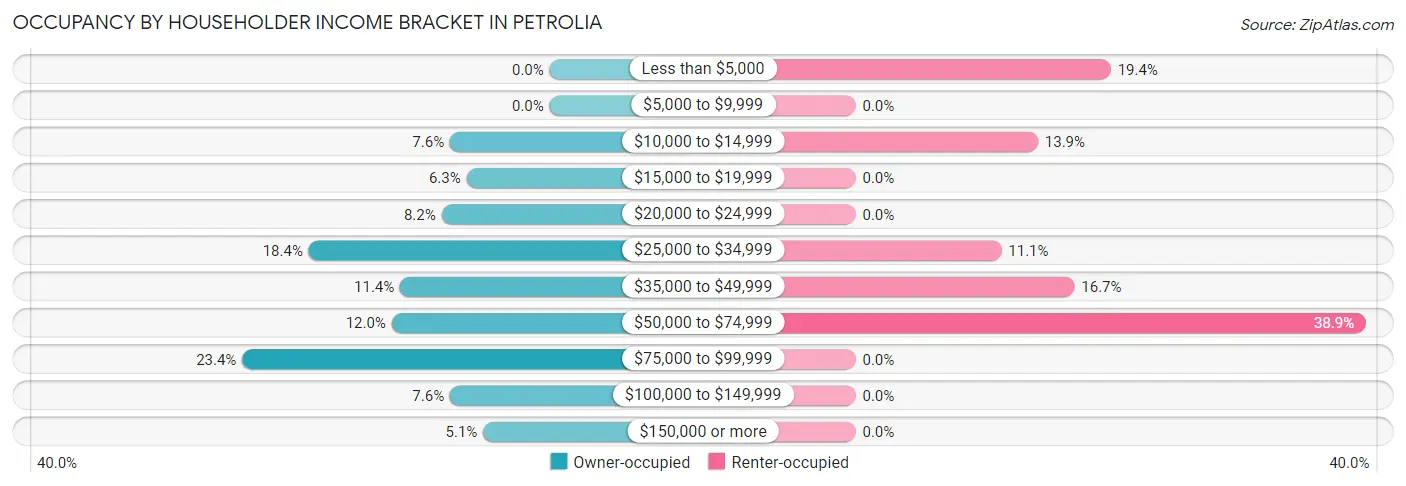
| Income Bracket | Owner-occupied | Renter-occupied |
| Less than $5,000 | 0 (0.0%) | 7 (19.4%) |
| $5,000 to $9,999 | 0 (0.0%) | 0 (0.0%) |
| $10,000 to $14,999 | 12 (7.6%) | 5 (13.9%) |
| $15,000 to $19,999 | 10 (6.3%) | 0 (0.0%) |
| $20,000 to $24,999 | 13 (8.2%) | 0 (0.0%) |
| $25,000 to $34,999 | 29 (18.3%) | 4 (11.1%) |
| $35,000 to $49,999 | 18 (11.4%) | 6 (16.7%) |
| $50,000 to $74,999 | 19 (12.0%) | 14 (38.9%) |
| $75,000 to $99,999 | 37 (23.4%) | 0 (0.0%) |
| $100,000 to $149,999 | 12 (7.6%) | 0 (0.0%) |
| $150,000 or more | 8 (5.1%) | 0 (0.0%) |
| Total | 158 (100.0%) | 36 (100.0%) |
Monthly Housing Cost Tiers in Petrolia
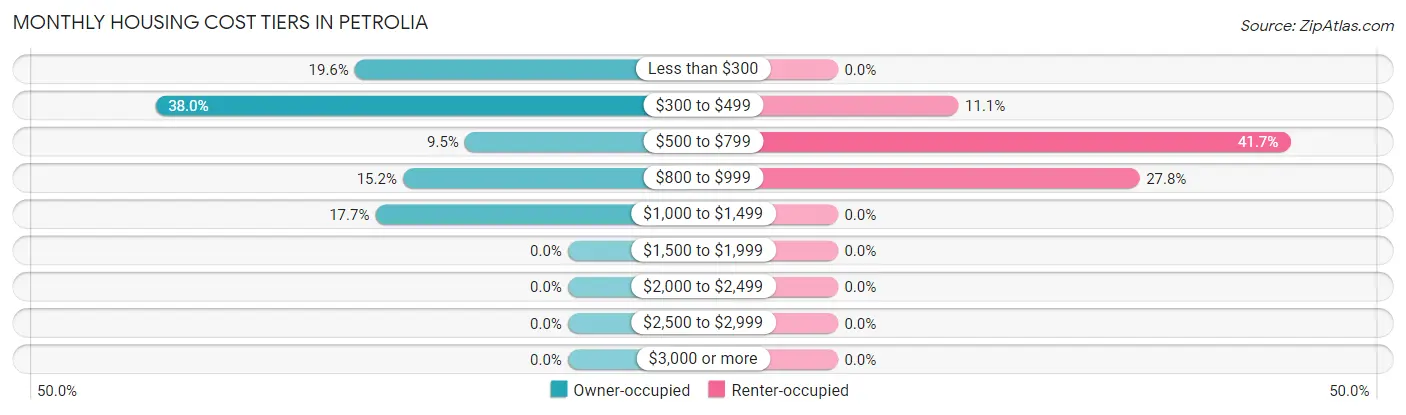
| Monthly Cost | Owner-occupied | Renter-occupied |
| Less than $300 | 31 (19.6%) | 0 (0.0%) |
| $300 to $499 | 60 (38.0%) | 4 (11.1%) |
| $500 to $799 | 15 (9.5%) | 15 (41.7%) |
| $800 to $999 | 24 (15.2%) | 10 (27.8%) |
| $1,000 to $1,499 | 28 (17.7%) | 0 (0.0%) |
| $1,500 to $1,999 | 0 (0.0%) | 0 (0.0%) |
| $2,000 to $2,499 | 0 (0.0%) | 0 (0.0%) |
| $2,500 to $2,999 | 0 (0.0%) | 0 (0.0%) |
| $3,000 or more | 0 (0.0%) | 0 (0.0%) |
| Total | 158 (100.0%) | 36 (100.0%) |
Physical Housing Characteristics in Petrolia
Housing Structures in Petrolia
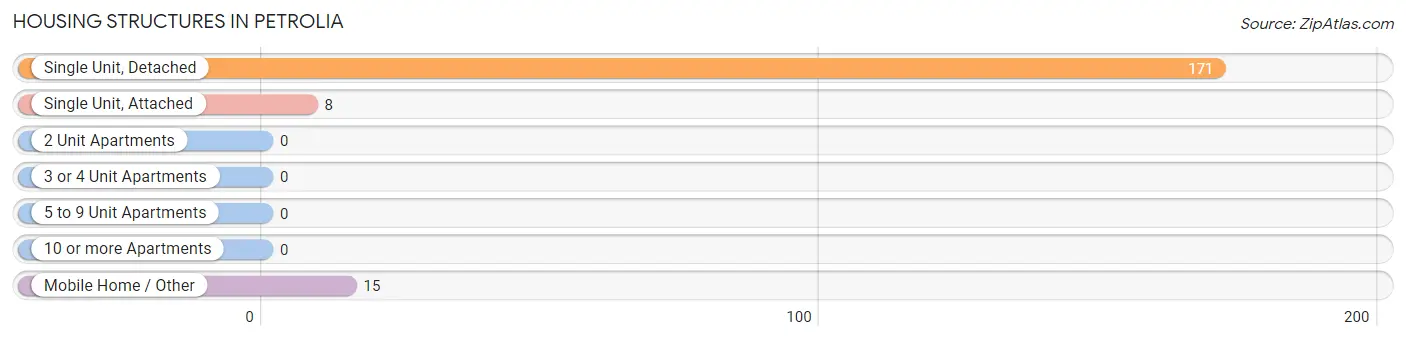
| Structure Type | # Housing Units | % Housing Units |
| Single Unit, Detached | 171 | 88.1% |
| Single Unit, Attached | 8 | 4.1% |
| 2 Unit Apartments | 0 | 0.0% |
| 3 or 4 Unit Apartments | 0 | 0.0% |
| 5 to 9 Unit Apartments | 0 | 0.0% |
| 10 or more Apartments | 0 | 0.0% |
| Mobile Home / Other | 15 | 7.7% |
| Total | 194 | 100.0% |
Housing Structures by Occupancy in Petrolia
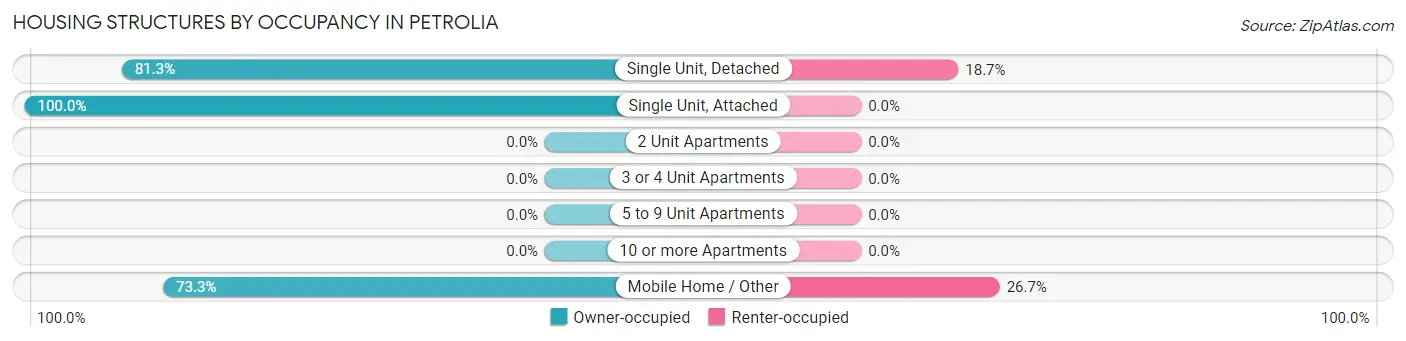
| Structure Type | Owner-occupied | Renter-occupied |
| Single Unit, Detached | 139 (81.3%) | 32 (18.7%) |
| Single Unit, Attached | 8 (100.0%) | 0 (0.0%) |
| 2 Unit Apartments | 0 (0.0%) | 0 (0.0%) |
| 3 or 4 Unit Apartments | 0 (0.0%) | 0 (0.0%) |
| 5 to 9 Unit Apartments | 0 (0.0%) | 0 (0.0%) |
| 10 or more Apartments | 0 (0.0%) | 0 (0.0%) |
| Mobile Home / Other | 11 (73.3%) | 4 (26.7%) |
| Total | 158 (81.4%) | 36 (18.6%) |
Housing Structures by Number of Rooms in Petrolia
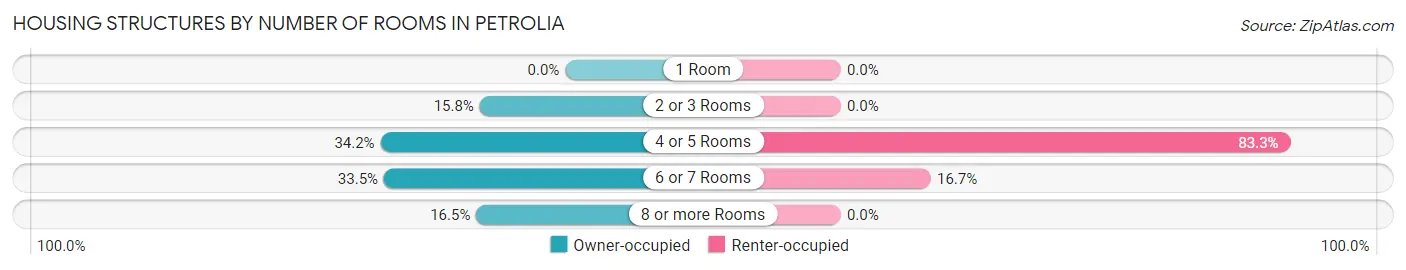
| Number of Rooms | Owner-occupied | Renter-occupied |
| 1 Room | 0 (0.0%) | 0 (0.0%) |
| 2 or 3 Rooms | 25 (15.8%) | 0 (0.0%) |
| 4 or 5 Rooms | 54 (34.2%) | 30 (83.3%) |
| 6 or 7 Rooms | 53 (33.5%) | 6 (16.7%) |
| 8 or more Rooms | 26 (16.5%) | 0 (0.0%) |
| Total | 158 (100.0%) | 36 (100.0%) |
Housing Structure by Heating Type in Petrolia
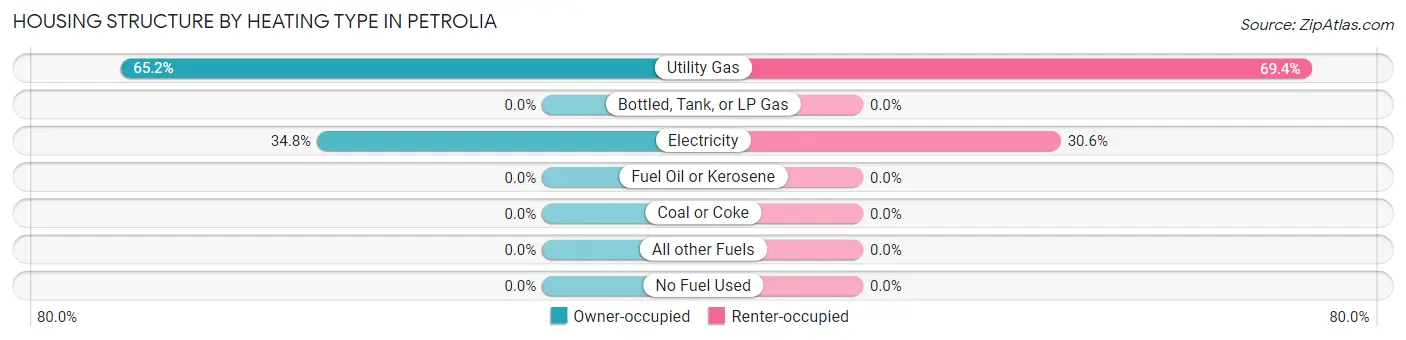
| Heating Type | Owner-occupied | Renter-occupied |
| Utility Gas | 103 (65.2%) | 25 (69.4%) |
| Bottled, Tank, or LP Gas | 0 (0.0%) | 0 (0.0%) |
| Electricity | 55 (34.8%) | 11 (30.6%) |
| Fuel Oil or Kerosene | 0 (0.0%) | 0 (0.0%) |
| Coal or Coke | 0 (0.0%) | 0 (0.0%) |
| All other Fuels | 0 (0.0%) | 0 (0.0%) |
| No Fuel Used | 0 (0.0%) | 0 (0.0%) |
| Total | 158 (100.0%) | 36 (100.0%) |
Household Vehicle Usage in Petrolia
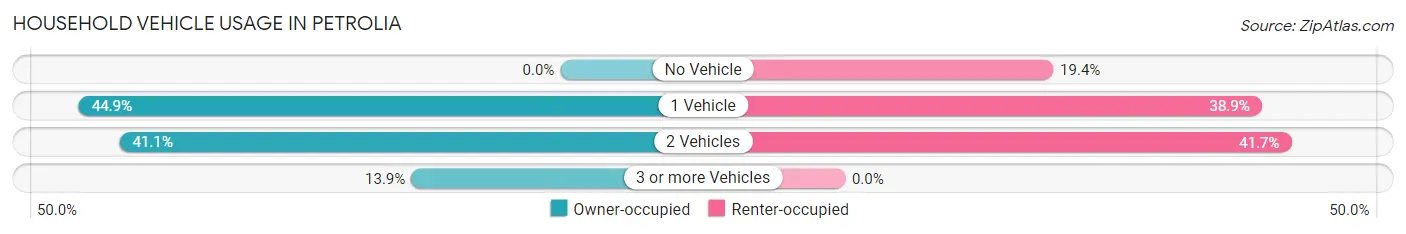
| Vehicles per Household | Owner-occupied | Renter-occupied |
| No Vehicle | 0 (0.0%) | 7 (19.4%) |
| 1 Vehicle | 71 (44.9%) | 14 (38.9%) |
| 2 Vehicles | 65 (41.1%) | 15 (41.7%) |
| 3 or more Vehicles | 22 (13.9%) | 0 (0.0%) |
| Total | 158 (100.0%) | 36 (100.0%) |
Real Estate & Mortgages in Petrolia
Real Estate and Mortgage Overview in Petrolia
| Characteristic | Without Mortgage | With Mortgage |
| Housing Units | 106 | 52 |
| Median Property Value | $71,700 | $86,400 |
| Median Household Income | - | - |
| Monthly Housing Costs | $361 | $0 |
| Real Estate Taxes | $900 | $0 |
Property Value by Mortgage Status in Petrolia
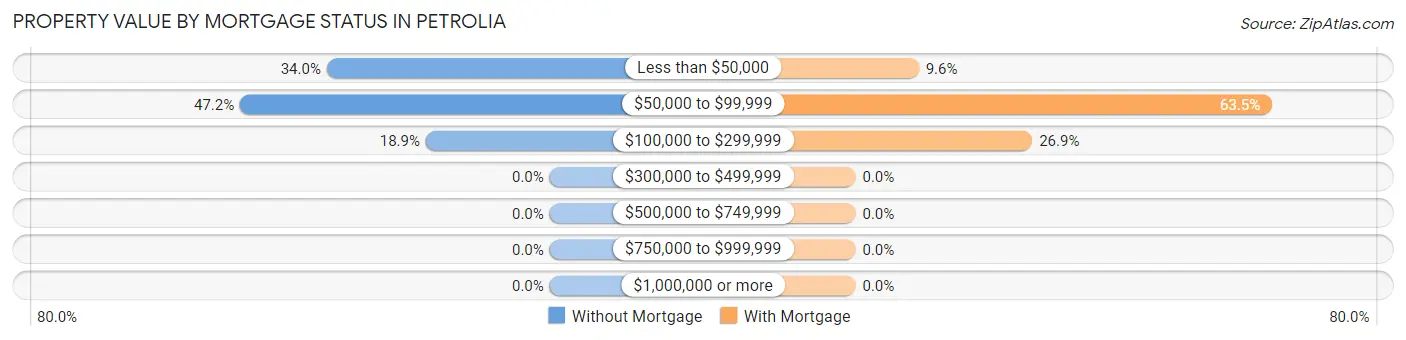
| Property Value | Without Mortgage | With Mortgage |
| Less than $50,000 | 36 (34.0%) | 5 (9.6%) |
| $50,000 to $99,999 | 50 (47.2%) | 33 (63.5%) |
| $100,000 to $299,999 | 20 (18.9%) | 14 (26.9%) |
| $300,000 to $499,999 | 0 (0.0%) | 0 (0.0%) |
| $500,000 to $749,999 | 0 (0.0%) | 0 (0.0%) |
| $750,000 to $999,999 | 0 (0.0%) | 0 (0.0%) |
| $1,000,000 or more | 0 (0.0%) | 0 (0.0%) |
| Total | 106 (100.0%) | 52 (100.0%) |
Household Income by Mortgage Status in Petrolia
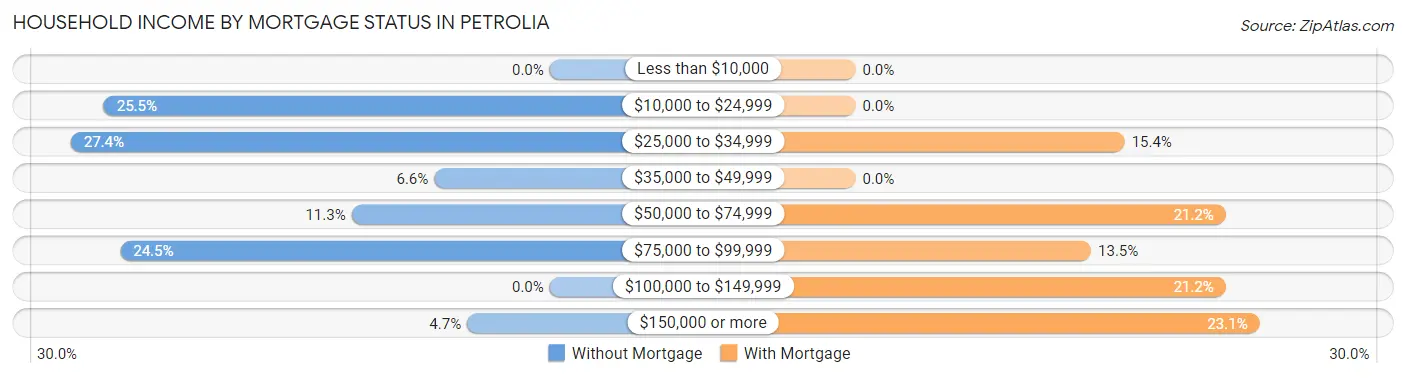
| Household Income | Without Mortgage | With Mortgage |
| Less than $10,000 | 0 (0.0%) | 0 (0.0%) |
| $10,000 to $24,999 | 27 (25.5%) | 0 (0.0%) |
| $25,000 to $34,999 | 29 (27.4%) | 8 (15.4%) |
| $35,000 to $49,999 | 7 (6.6%) | 0 (0.0%) |
| $50,000 to $74,999 | 12 (11.3%) | 11 (21.1%) |
| $75,000 to $99,999 | 26 (24.5%) | 7 (13.5%) |
| $100,000 to $149,999 | 0 (0.0%) | 11 (21.1%) |
| $150,000 or more | 5 (4.7%) | 12 (23.1%) |
| Total | 106 (100.0%) | 52 (100.0%) |
Property Value to Household Income Ratio in Petrolia
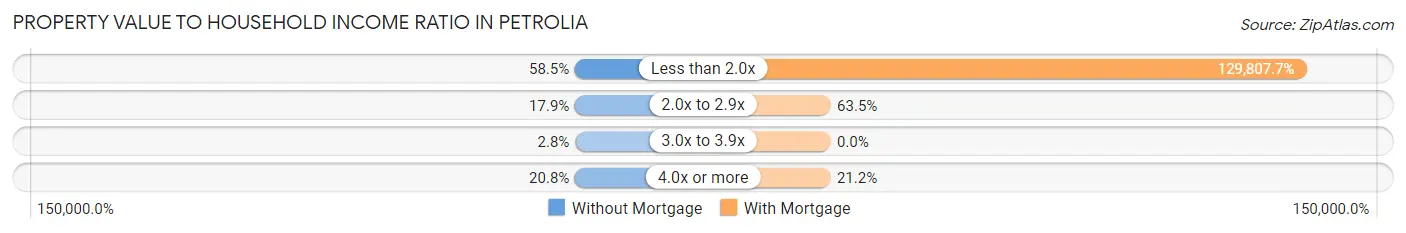
| Value-to-Income Ratio | Without Mortgage | With Mortgage |
| Less than 2.0x | 62 (58.5%) | 67,500 (129,807.7%) |
| 2.0x to 2.9x | 19 (17.9%) | 33 (63.5%) |
| 3.0x to 3.9x | 3 (2.8%) | 0 (0.0%) |
| 4.0x or more | 22 (20.7%) | 11 (21.1%) |
| Total | 106 (100.0%) | 52 (100.0%) |
Real Estate Taxes by Mortgage Status in Petrolia
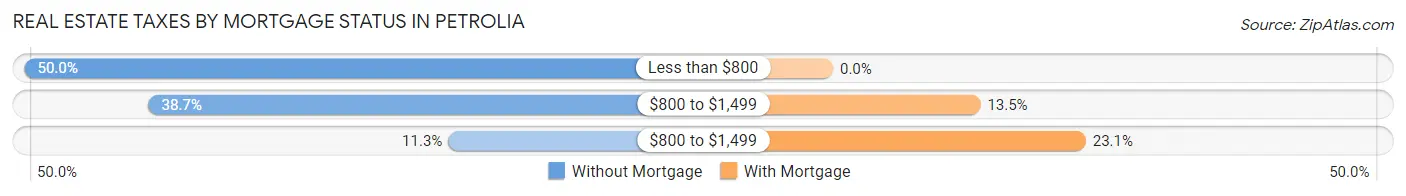
| Property Taxes | Without Mortgage | With Mortgage |
| Less than $800 | 53 (50.0%) | 0 (0.0%) |
| $800 to $1,499 | 41 (38.7%) | 7 (13.5%) |
| $800 to $1,499 | 12 (11.3%) | 12 (23.1%) |
| Total | 106 (100.0%) | 52 (100.0%) |
Health & Disability in Petrolia
Health Insurance Coverage by Age in Petrolia
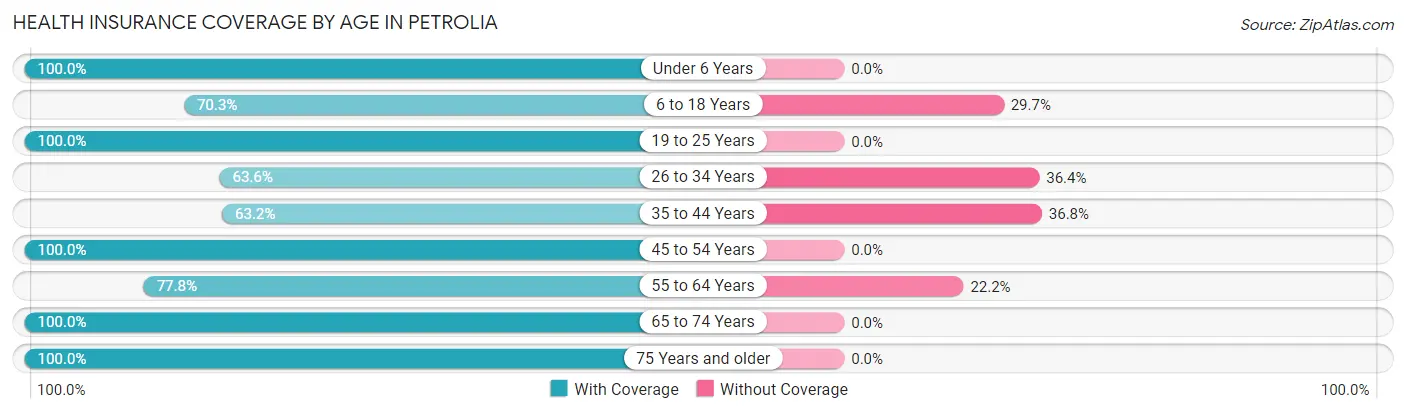
| Age Bracket | With Coverage | Without Coverage |
| Under 6 Years | 27 (100.0%) | 0 (0.0%) |
| 6 to 18 Years | 26 (70.3%) | 11 (29.7%) |
| 19 to 25 Years | 11 (100.0%) | 0 (0.0%) |
| 26 to 34 Years | 7 (63.6%) | 4 (36.4%) |
| 35 to 44 Years | 24 (63.2%) | 14 (36.8%) |
| 45 to 54 Years | 55 (100.0%) | 0 (0.0%) |
| 55 to 64 Years | 56 (77.8%) | 16 (22.2%) |
| 65 to 74 Years | 27 (100.0%) | 0 (0.0%) |
| 75 Years and older | 90 (100.0%) | 0 (0.0%) |
| Total | 323 (87.8%) | 45 (12.2%) |
Health Insurance Coverage by Citizenship Status in Petrolia
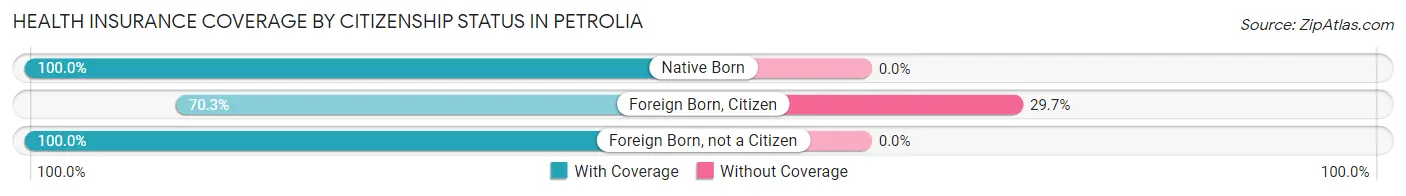
| Citizenship Status | With Coverage | Without Coverage |
| Native Born | 27 (100.0%) | 0 (0.0%) |
| Foreign Born, Citizen | 26 (70.3%) | 11 (29.7%) |
| Foreign Born, not a Citizen | 11 (100.0%) | 0 (0.0%) |
Health Insurance Coverage by Household Income in Petrolia
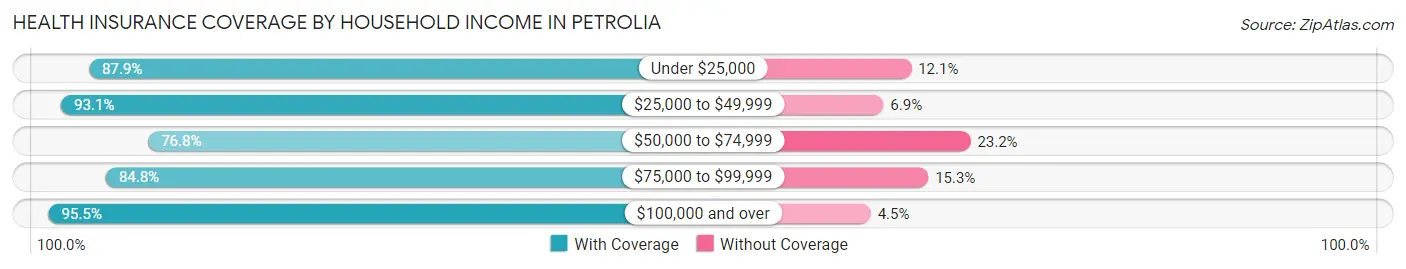
| Household Income | With Coverage | Without Coverage |
| Under $25,000 | 51 (87.9%) | 7 (12.1%) |
| $25,000 to $49,999 | 95 (93.1%) | 7 (6.9%) |
| $50,000 to $74,999 | 63 (76.8%) | 19 (23.2%) |
| $75,000 to $99,999 | 50 (84.8%) | 9 (15.2%) |
| $100,000 and over | 64 (95.5%) | 3 (4.5%) |
Public vs Private Health Insurance Coverage by Age in Petrolia
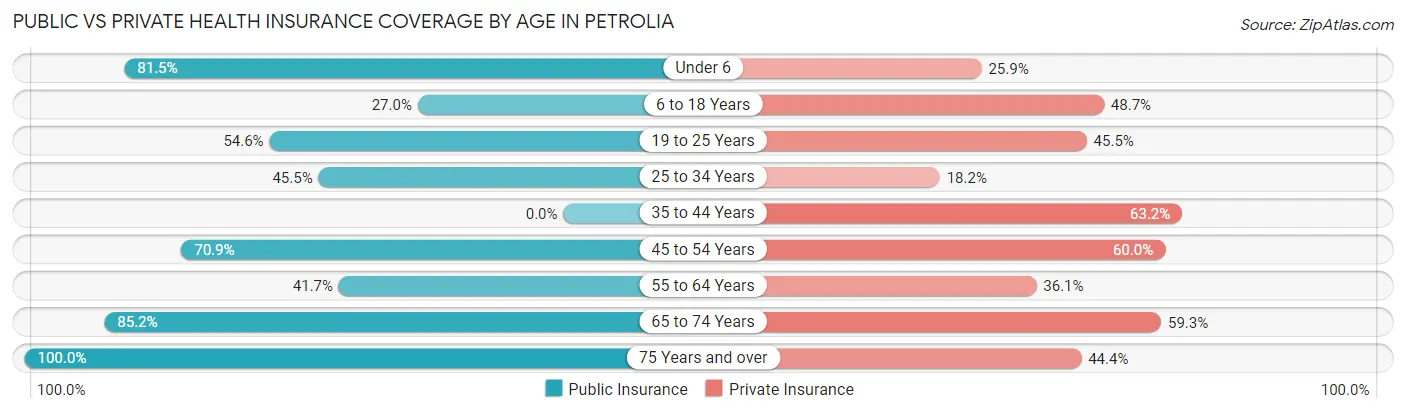
| Age Bracket | Public Insurance | Private Insurance |
| Under 6 | 22 (81.5%) | 7 (25.9%) |
| 6 to 18 Years | 10 (27.0%) | 18 (48.6%) |
| 19 to 25 Years | 6 (54.5%) | 5 (45.5%) |
| 25 to 34 Years | 5 (45.5%) | 2 (18.2%) |
| 35 to 44 Years | 0 (0.0%) | 24 (63.2%) |
| 45 to 54 Years | 39 (70.9%) | 33 (60.0%) |
| 55 to 64 Years | 30 (41.7%) | 26 (36.1%) |
| 65 to 74 Years | 23 (85.2%) | 16 (59.3%) |
| 75 Years and over | 90 (100.0%) | 40 (44.4%) |
| Total | 225 (61.1%) | 171 (46.5%) |
Disability Status by Sex by Age in Petrolia
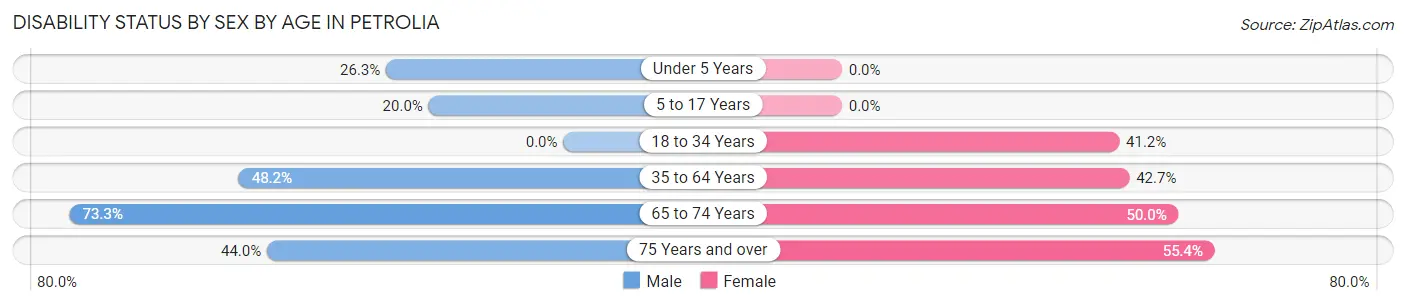
| Age Bracket | Male | Female |
| Under 5 Years | 5 (26.3%) | 0 (0.0%) |
| 5 to 17 Years | 4 (20.0%) | 0 (0.0%) |
| 18 to 34 Years | 0 (0.0%) | 7 (41.2%) |
| 35 to 64 Years | 40 (48.2%) | 35 (42.7%) |
| 65 to 74 Years | 11 (73.3%) | 6 (50.0%) |
| 75 Years and over | 11 (44.0%) | 36 (55.4%) |
Disability Class by Sex by Age in Petrolia
Disability Class: Hearing Difficulty
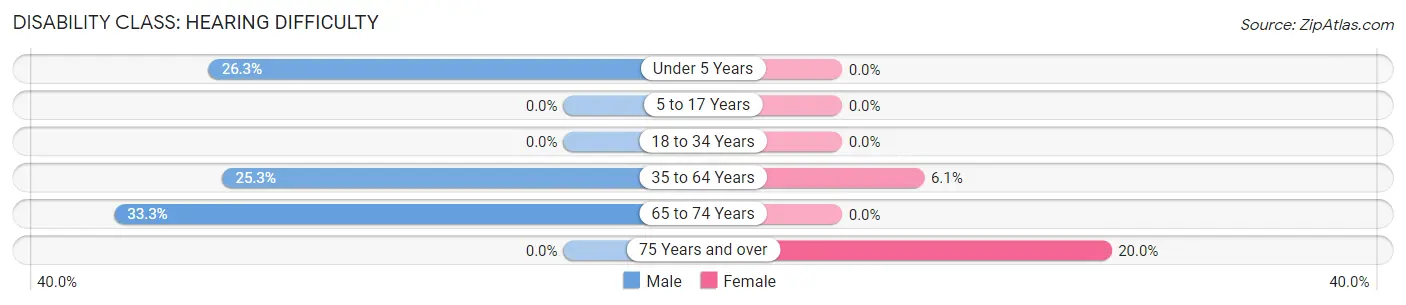
| Age Bracket | Male | Female |
| Under 5 Years | 5 (26.3%) | 0 (0.0%) |
| 5 to 17 Years | 0 (0.0%) | 0 (0.0%) |
| 18 to 34 Years | 0 (0.0%) | 0 (0.0%) |
| 35 to 64 Years | 21 (25.3%) | 5 (6.1%) |
| 65 to 74 Years | 5 (33.3%) | 0 (0.0%) |
| 75 Years and over | 0 (0.0%) | 13 (20.0%) |
Disability Class: Vision Difficulty
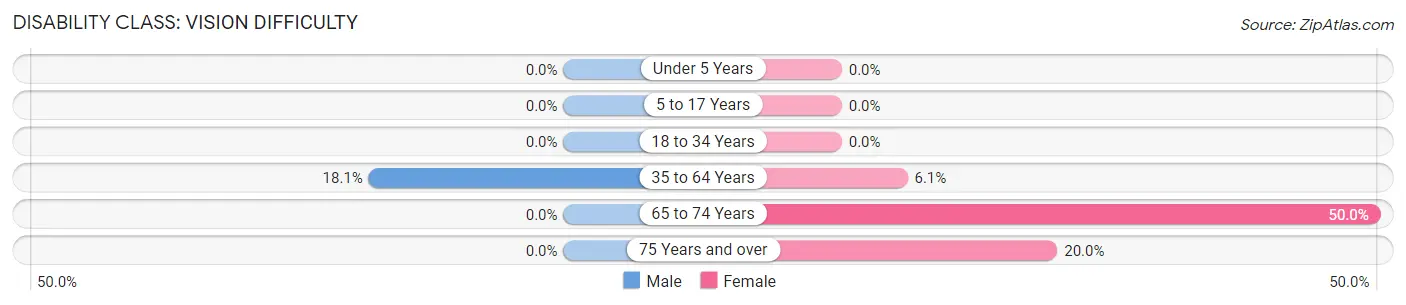
| Age Bracket | Male | Female |
| Under 5 Years | 0 (0.0%) | 0 (0.0%) |
| 5 to 17 Years | 0 (0.0%) | 0 (0.0%) |
| 18 to 34 Years | 0 (0.0%) | 0 (0.0%) |
| 35 to 64 Years | 15 (18.1%) | 5 (6.1%) |
| 65 to 74 Years | 0 (0.0%) | 6 (50.0%) |
| 75 Years and over | 0 (0.0%) | 13 (20.0%) |
Disability Class: Cognitive Difficulty
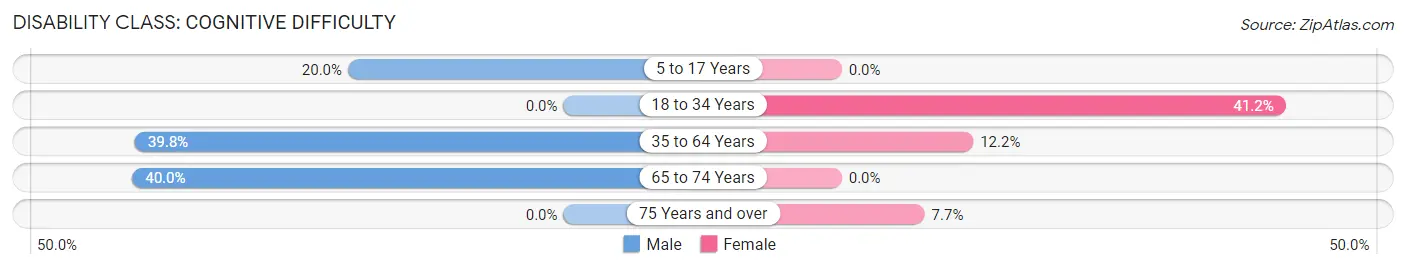
| Age Bracket | Male | Female |
| 5 to 17 Years | 4 (20.0%) | 0 (0.0%) |
| 18 to 34 Years | 0 (0.0%) | 7 (41.2%) |
| 35 to 64 Years | 33 (39.8%) | 10 (12.2%) |
| 65 to 74 Years | 6 (40.0%) | 0 (0.0%) |
| 75 Years and over | 0 (0.0%) | 5 (7.7%) |
Disability Class: Ambulatory Difficulty
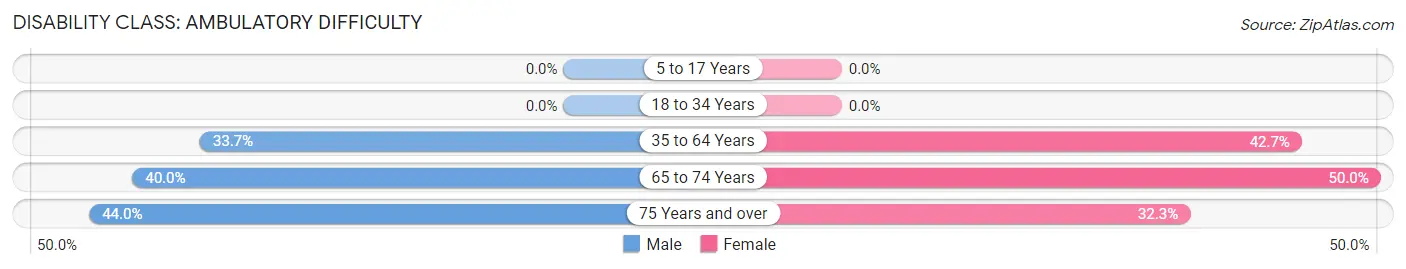
| Age Bracket | Male | Female |
| 5 to 17 Years | 0 (0.0%) | 0 (0.0%) |
| 18 to 34 Years | 0 (0.0%) | 0 (0.0%) |
| 35 to 64 Years | 28 (33.7%) | 35 (42.7%) |
| 65 to 74 Years | 6 (40.0%) | 6 (50.0%) |
| 75 Years and over | 11 (44.0%) | 21 (32.3%) |
Disability Class: Self-Care Difficulty
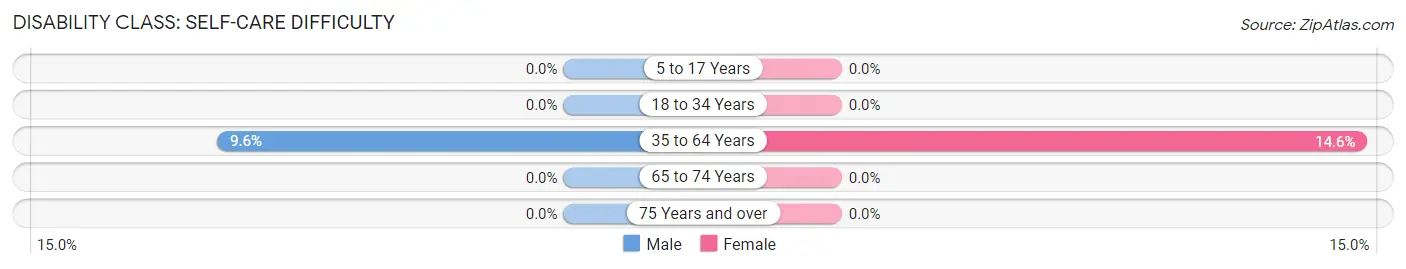
| Age Bracket | Male | Female |
| 5 to 17 Years | 0 (0.0%) | 0 (0.0%) |
| 18 to 34 Years | 0 (0.0%) | 0 (0.0%) |
| 35 to 64 Years | 8 (9.6%) | 12 (14.6%) |
| 65 to 74 Years | 0 (0.0%) | 0 (0.0%) |
| 75 Years and over | 0 (0.0%) | 0 (0.0%) |
Technology Access in Petrolia
Computing Device Access in Petrolia
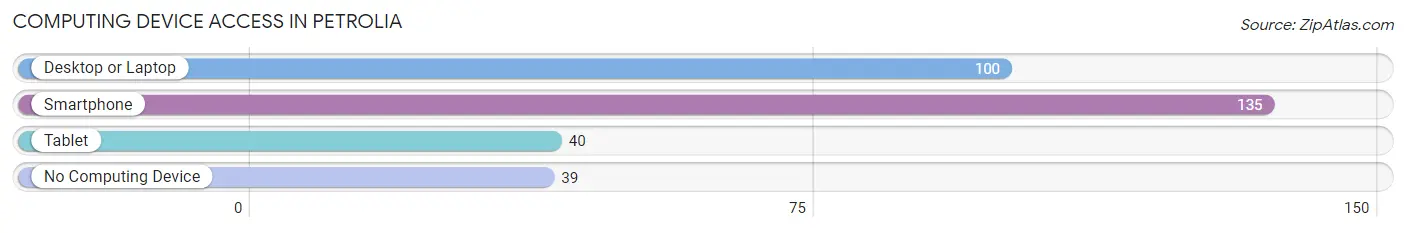
| Device Type | # Households | % Households |
| Desktop or Laptop | 100 | 51.5% |
| Smartphone | 135 | 69.6% |
| Tablet | 40 | 20.6% |
| No Computing Device | 39 | 20.1% |
| Total | 194 | 100.0% |
Internet Access in Petrolia
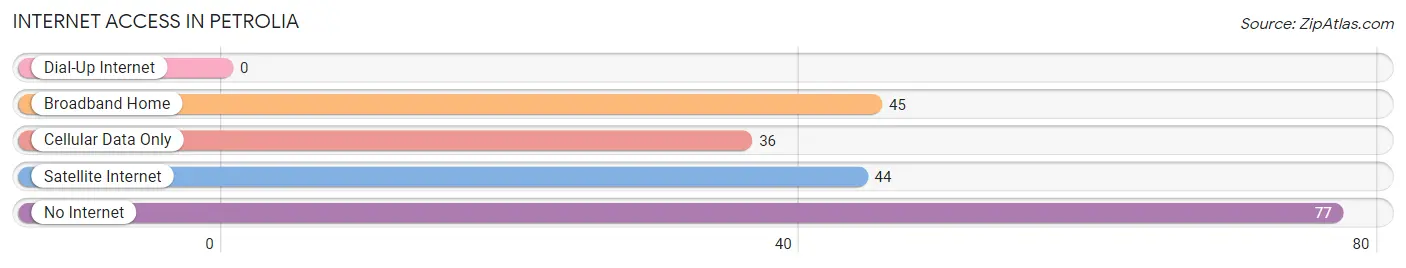
| Internet Type | # Households | % Households |
| Dial-Up Internet | 0 | 0.0% |
| Broadband Home | 45 | 23.2% |
| Cellular Data Only | 36 | 18.6% |
| Satellite Internet | 44 | 22.7% |
| No Internet | 77 | 39.7% |
| Total | 194 | 100.0% |
Petrolia Summary
Petrolia, Texas is a small town located in Clay County, Texas, United States. It is situated on the banks of the Red River, approximately 20 miles north of Wichita Falls. The town was founded in 1891 and was named after the nearby oil fields. The population of Petrolia was estimated to be 545 in 2019.
History
Petrolia was founded in 1891 by a group of settlers from the nearby town of Henrietta. The town was named after the nearby oil fields, which were discovered in the late 1880s. The first oil well was drilled in 1891 and the town quickly grew as a result of the oil boom. The town was incorporated in 1892 and the first mayor was elected in 1893.
The town experienced a period of rapid growth in the early 1900s, with the population reaching 1,000 by 1910. The town was home to several businesses, including a bank, a hotel, a newspaper, and a variety of stores. The town also had a school, a post office, and a railroad station.
In the 1920s, the oil industry began to decline and the population of Petrolia began to decline as well. The Great Depression further exacerbated the decline and by 1940, the population had dropped to just over 500. The population continued to decline until the 1970s, when it began to slowly increase again.
Geography
Petrolia is located in Clay County, Texas, approximately 20 miles north of Wichita Falls. The town is situated on the banks of the Red River and is surrounded by rolling hills and prairies. The climate is semi-arid, with hot summers and mild winters.
The town covers an area of 1.2 square miles and has an elevation of 890 feet. The nearest major cities are Wichita Falls (20 miles south) and Oklahoma City (90 miles north).
Economy
Petrolia’s economy is largely based on agriculture and oil production. The town is home to several farms and ranches, as well as several oil wells. The town also has a few small businesses, including a grocery store, a hardware store, and a few restaurants.
Demographics
As of 2019, the population of Petrolia was estimated to be 545. The racial makeup of the town is predominantly white (94.2%), with small percentages of African American (2.2%), Hispanic (2.2%), and Native American (1.3%) residents. The median household income is $37,500 and the median home value is $90,000. The town has a poverty rate of 17.3%.
Conclusion
Petrolia, Texas is a small town located in Clay County, Texas, United States. It was founded in 1891 and was named after the nearby oil fields. The town experienced a period of rapid growth in the early 1900s, but the population has since declined. The town’s economy is largely based on agriculture and oil production. The population of Petrolia was estimated to be 545 in 2019.
Common Questions
What is Per Capita Income in Petrolia?
Per Capita income in Petrolia is $29,362.
What is the Median Family Income in Petrolia?
Median Family Income in Petrolia is $59,250.
What is the Median Household income in Petrolia?
Median Household Income in Petrolia is $43,750.
What is Income or Wage Gap in Petrolia?
Income or Wage Gap in Petrolia is 18.0%.
Women in Petrolia earn 82.0 cents for every dollar earned by a man.
What is Inequality or Gini Index in Petrolia?
Inequality or Gini Index in Petrolia is 0.40.
What is the Total Population of Petrolia?
Total Population of Petrolia is 368.
What is the Total Male Population of Petrolia?
Total Male Population of Petrolia is 174.
What is the Total Female Population of Petrolia?
Total Female Population of Petrolia is 194.
What is the Ratio of Males per 100 Females in Petrolia?
There are 89.69 Males per 100 Females in Petrolia.
What is the Ratio of Females per 100 Males in Petrolia?
There are 111.49 Females per 100 Males in Petrolia.
What is the Median Population Age in Petrolia?
Median Population Age in Petrolia is 55.5 Years.
What is the Average Family Size in Petrolia
Average Family Size in Petrolia is 2.6 People.
What is the Average Household Size in Petrolia
Average Household Size in Petrolia is 1.9 People.
How Large is the Labor Force in Petrolia?
There are 130 People in the Labor Forcein in Petrolia.
What is the Percentage of People in the Labor Force in Petrolia?
41.8% of People are in the Labor Force in Petrolia.