Powderly, TX Map & Demographics
Powderly Map
Powderly Overview
$37,693
PER CAPITA INCOME
$82,750
AVG FAMILY INCOME
$81,402
AVG HOUSEHOLD INCOME
12.0%
WAGE / INCOME GAP [ % ]
88.0¢/ $1
WAGE / INCOME GAP [ $ ]
0.31
INEQUALITY / GINI INDEX
1,251
TOTAL POPULATION
616
MALE POPULATION
635
FEMALE POPULATION
97.01
MALES / 100 FEMALES
103.08
FEMALES / 100 MALES
44.5
MEDIAN AGE
2.9
AVG FAMILY SIZE
2.5
AVG HOUSEHOLD SIZE
648
LABOR FORCE [ PEOPLE ]
62.4%
PERCENT IN LABOR FORCE
5.7%
UNEMPLOYMENT RATE
Powderly Zip Codes
Powderly Area Codes
Income in Powderly
Income Overview in Powderly
Per Capita Income in Powderly is $37,693, while median incomes of families and households are $82,750 and $81,402 respectively.
| Characteristic | Number | Measure |
| Per Capita Income | 1,251 | $37,693 |
| Median Family Income | 398 | $82,750 |
| Mean Family Income | 398 | $100,694 |
| Median Household Income | 505 | $81,402 |
| Mean Household Income | 505 | $90,471 |
| Income Deficit | 398 | $0 |
| Wage / Income Gap (%) | 1,251 | 11.99% |
| Wage / Income Gap ($) | 1,251 | 88.01¢ per $1 |
| Gini / Inequality Index | 1,251 | 0.31 |
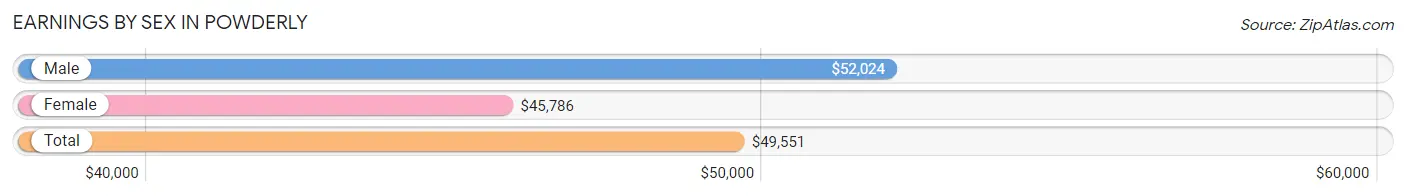
Earnings by Sex in Powderly
Average Earnings in Powderly are $49,551, $52,024 for men and $45,786 for women, a difference of 12.0%.
| Sex | Number | Average Earnings |
| Male | 360 (52.5%) | $52,024 |
| Female | 326 (47.5%) | $45,786 |
| Total | 686 (100.0%) | $49,551 |
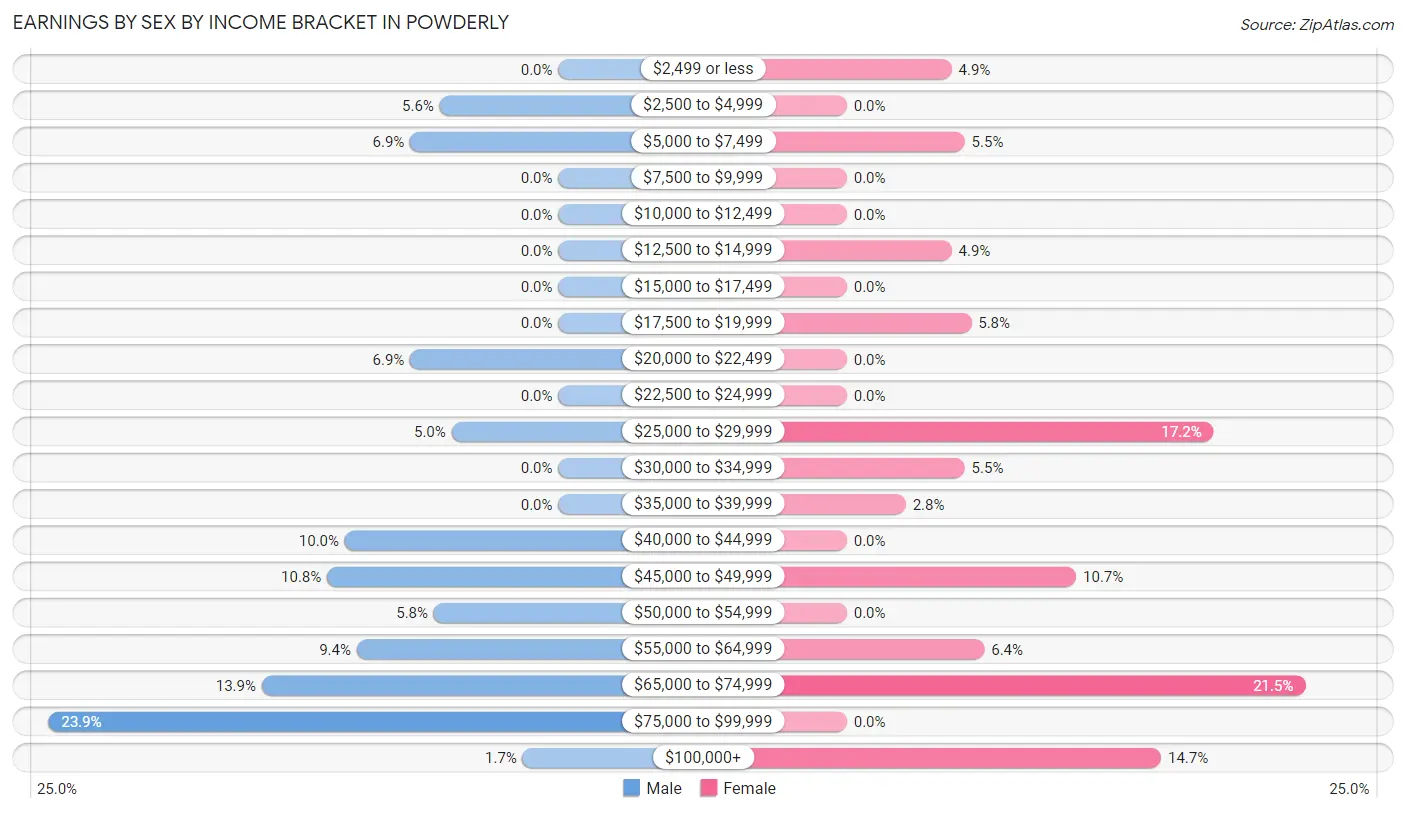
Earnings by Sex by Income Bracket in Powderly
The most common earnings brackets in Powderly are $75,000 to $99,999 for men (86 | 23.9%) and $65,000 to $74,999 for women (70 | 21.5%).
| Income | Male | Female |
| $2,499 or less | 0 (0.0%) | 16 (4.9%) |
| $2,500 to $4,999 | 20 (5.6%) | 0 (0.0%) |
| $5,000 to $7,499 | 25 (6.9%) | 18 (5.5%) |
| $7,500 to $9,999 | 0 (0.0%) | 0 (0.0%) |
| $10,000 to $12,499 | 0 (0.0%) | 0 (0.0%) |
| $12,500 to $14,999 | 0 (0.0%) | 16 (4.9%) |
| $15,000 to $17,499 | 0 (0.0%) | 0 (0.0%) |
| $17,500 to $19,999 | 0 (0.0%) | 19 (5.8%) |
| $20,000 to $22,499 | 25 (6.9%) | 0 (0.0%) |
| $22,500 to $24,999 | 0 (0.0%) | 0 (0.0%) |
| $25,000 to $29,999 | 18 (5.0%) | 56 (17.2%) |
| $30,000 to $34,999 | 0 (0.0%) | 18 (5.5%) |
| $35,000 to $39,999 | 0 (0.0%) | 9 (2.8%) |
| $40,000 to $44,999 | 36 (10.0%) | 0 (0.0%) |
| $45,000 to $49,999 | 39 (10.8%) | 35 (10.7%) |
| $50,000 to $54,999 | 21 (5.8%) | 0 (0.0%) |
| $55,000 to $64,999 | 34 (9.4%) | 21 (6.4%) |
| $65,000 to $74,999 | 50 (13.9%) | 70 (21.5%) |
| $75,000 to $99,999 | 86 (23.9%) | 0 (0.0%) |
| $100,000+ | 6 (1.7%) | 48 (14.7%) |
| Total | 360 (100.0%) | 326 (100.0%) |
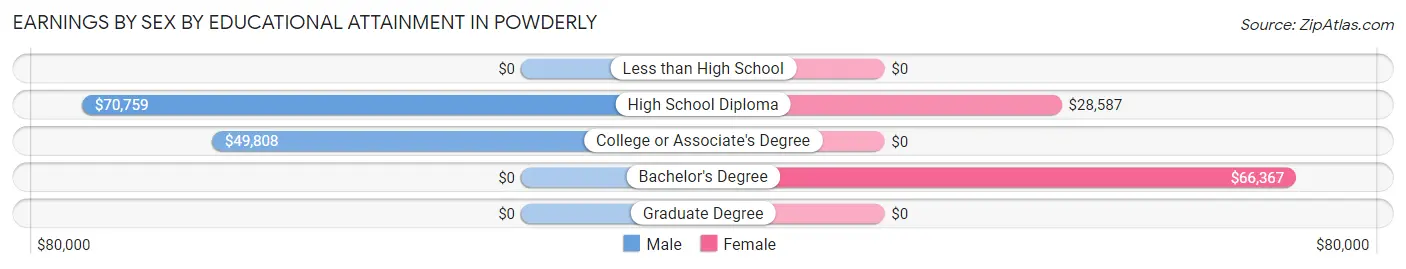
Earnings by Sex by Educational Attainment in Powderly
Average earnings in Powderly are $58,500 for men and $45,786 for women, a difference of 21.7%. Men with an educational attainment of high school diploma enjoy the highest average annual earnings of $70,759, while those with college or associate's degree education earn the least with $49,808. Women with an educational attainment of bachelor's degree earn the most with the average annual earnings of $66,367, while those with high school diploma education have the smallest earnings of $28,587.
| Educational Attainment | Male Income | Female Income |
| Less than High School | - | - |
| High School Diploma | $70,759 | $28,587 |
| College or Associate's Degree | $49,808 | $0 |
| Bachelor's Degree | - | - |
| Graduate Degree | - | - |
| Total | $58,500 | $45,786 |
Family Income in Powderly
Family Income Brackets in Powderly
According to the Powderly family income data, there are 139 families falling into the $75,000 to $99,999 income range, which is the most common income bracket and makes up 34.9% of all families.
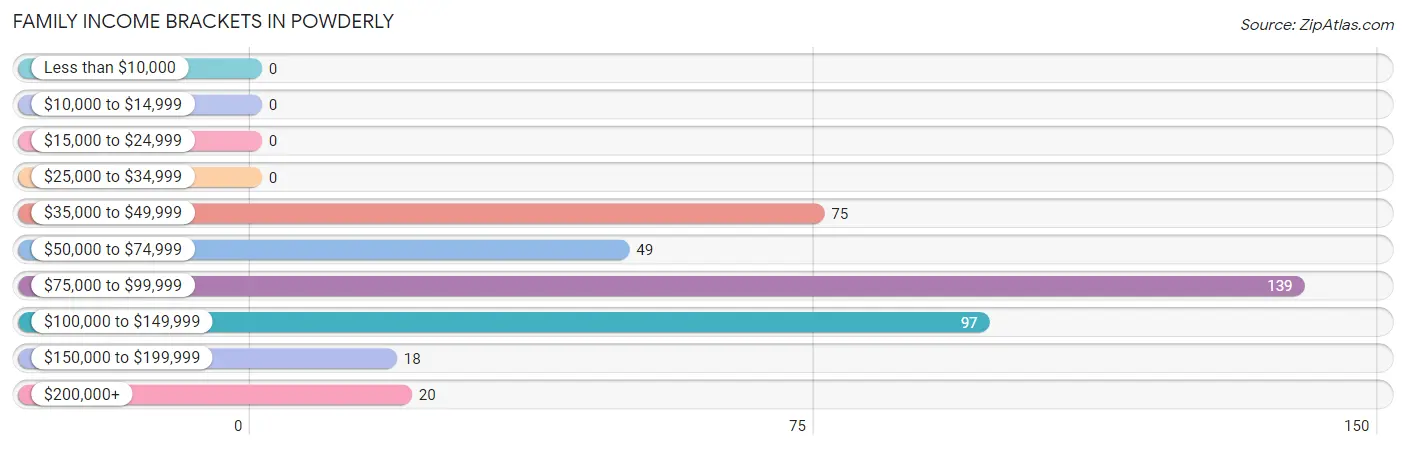
| Income Bracket | # Families | % Families |
| Less than $10,000 | 0 | 0.0% |
| $10,000 to $14,999 | 0 | 0.0% |
| $15,000 to $24,999 | 0 | 0.0% |
| $25,000 to $34,999 | 0 | 0.0% |
| $35,000 to $49,999 | 75 | 18.8% |
| $50,000 to $74,999 | 49 | 12.3% |
| $75,000 to $99,999 | 139 | 34.9% |
| $100,000 to $149,999 | 97 | 24.4% |
| $150,000 to $199,999 | 18 | 4.5% |
| $200,000+ | 20 | 5.0% |
Family Income by Famaliy Size in Powderly
3-person families (109 | 27.4%) account for the highest median family income in Powderly with $145,436 per family, while 3-person families (109 | 27.4%) have the highest median income of $48,479 per family member.
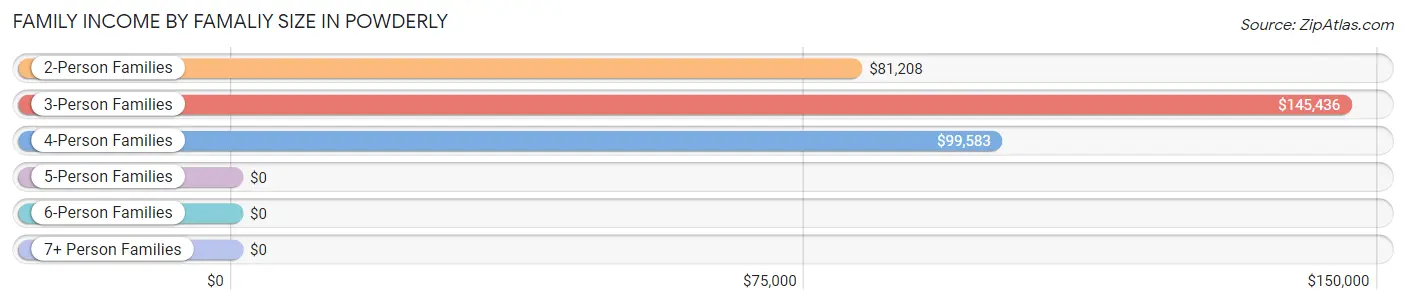
| Income Bracket | # Families | Median Income |
| 2-Person Families | 212 (53.3%) | $81,208 |
| 3-Person Families | 109 (27.4%) | $145,436 |
| 4-Person Families | 35 (8.8%) | $99,583 |
| 5-Person Families | 36 (9.0%) | $0 |
| 6-Person Families | 6 (1.5%) | $0 |
| 7+ Person Families | 0 (0.0%) | $0 |
| Total | 398 (100.0%) | $82,750 |
Family Income by Number of Earners in Powderly
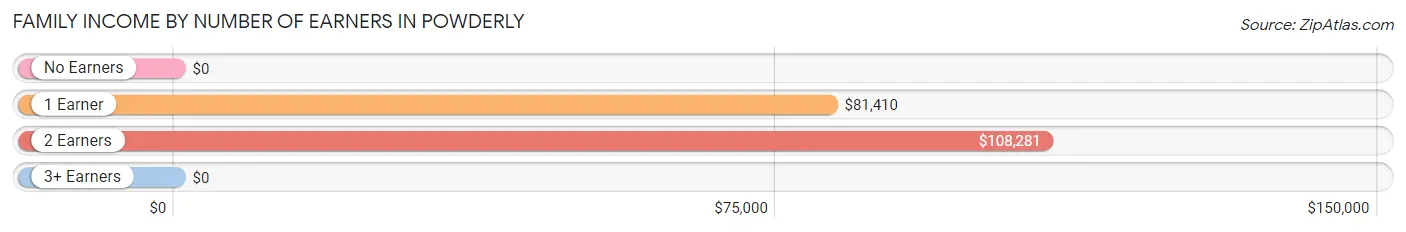
| Number of Earners | # Families | Median Income |
| No Earners | 57 (14.3%) | $0 |
| 1 Earner | 102 (25.6%) | $81,410 |
| 2 Earners | 212 (53.3%) | $108,281 |
| 3+ Earners | 27 (6.8%) | $0 |
| Total | 398 (100.0%) | $82,750 |
Household Income in Powderly
Household Income Brackets in Powderly
With 159 households falling in the category, the $75,000 to $99,999 income range is the most frequent in Powderly, accounting for 31.5% of all households.
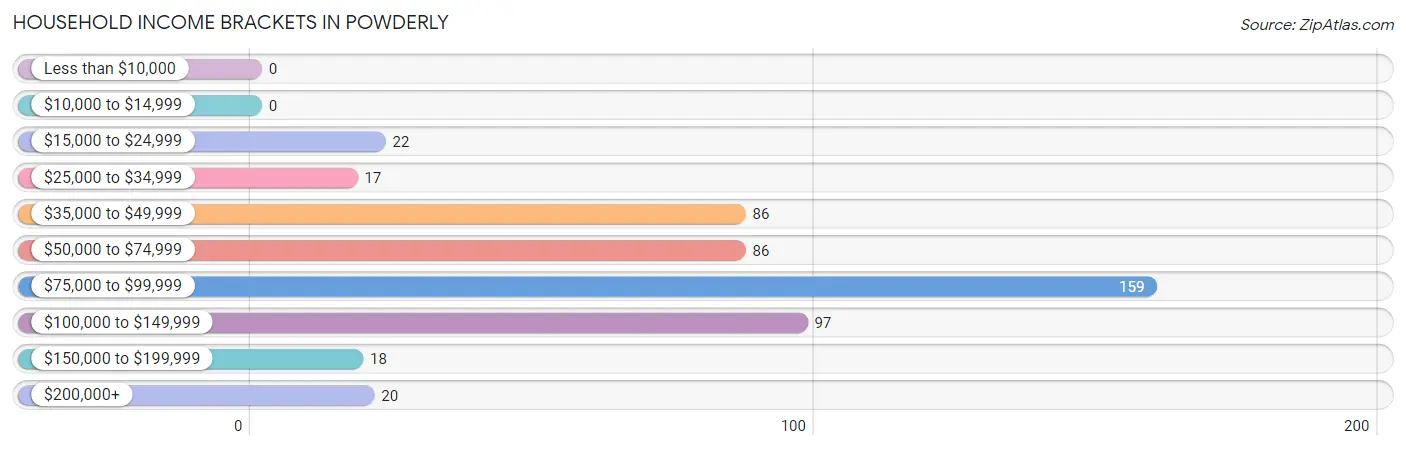
| Income Bracket | # Households | % Households |
| Less than $10,000 | 0 | 0.0% |
| $10,000 to $14,999 | 0 | 0.0% |
| $15,000 to $24,999 | 22 | 4.4% |
| $25,000 to $34,999 | 17 | 3.4% |
| $35,000 to $49,999 | 86 | 17.0% |
| $50,000 to $74,999 | 86 | 17.0% |
| $75,000 to $99,999 | 159 | 31.5% |
| $100,000 to $149,999 | 97 | 19.2% |
| $150,000 to $199,999 | 18 | 3.6% |
| $200,000+ | 20 | 4.0% |
Household Income by Householder Age in Powderly
The median household income in Powderly is $81,402, with the highest median household income of $145,114 found in the 45 to 64 years age bracket for the primary householder. A total of 202 households (40.0%) fall into this category. Meanwhile, the 15 to 24 years age bracket for the primary householder has the lowest median household income of $0, with 9 households (1.8%) in this group.
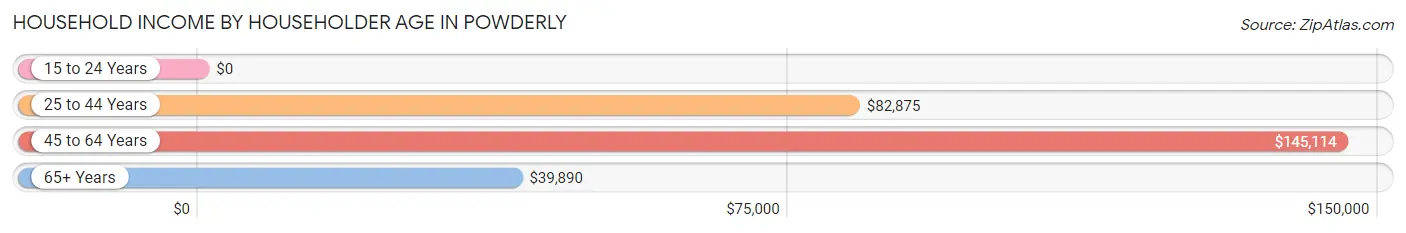
| Income Bracket | # Households | Median Income |
| 15 to 24 Years | 9 (1.8%) | $0 |
| 25 to 44 Years | 137 (27.1%) | $82,875 |
| 45 to 64 Years | 202 (40.0%) | $145,114 |
| 65+ Years | 157 (31.1%) | $39,890 |
| Total | 505 (100.0%) | $81,402 |
Poverty in Powderly
Income Below Poverty by Sex and Age in Powderly
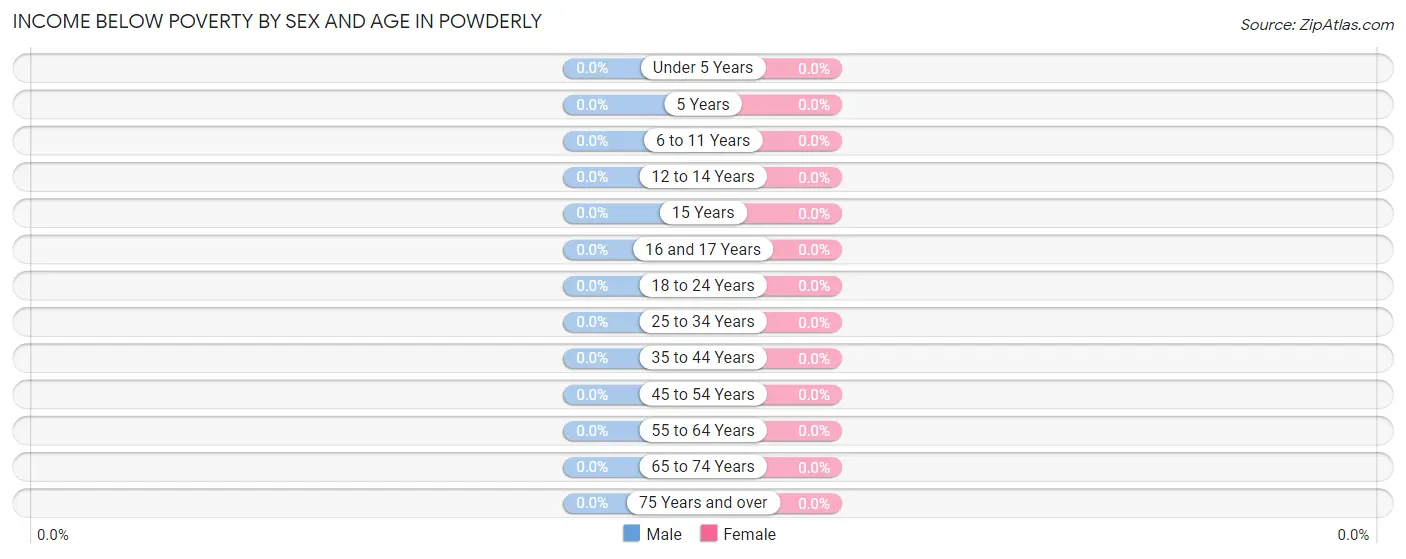
| Age Bracket | Male | Female |
| Under 5 Years | 0 (0.0%) | 0 (0.0%) |
| 5 Years | 0 (0.0%) | 0 (0.0%) |
| 6 to 11 Years | 0 (0.0%) | 0 (0.0%) |
| 12 to 14 Years | 0 (0.0%) | 0 (0.0%) |
| 15 Years | 0 (0.0%) | 0 (0.0%) |
| 16 and 17 Years | 0 (0.0%) | 0 (0.0%) |
| 18 to 24 Years | 0 (0.0%) | 0 (0.0%) |
| 25 to 34 Years | 0 (0.0%) | 0 (0.0%) |
| 35 to 44 Years | 0 (0.0%) | 0 (0.0%) |
| 45 to 54 Years | 0 (0.0%) | 0 (0.0%) |
| 55 to 64 Years | 0 (0.0%) | 0 (0.0%) |
| 65 to 74 Years | 0 (0.0%) | 0 (0.0%) |
| 75 Years and over | 0 (0.0%) | 0 (0.0%) |
| Total | 0 (0.0%) | 0 (0.0%) |
Income Above Poverty by Sex and Age in Powderly
According to the poverty statistics in Powderly, males aged under 5 years and females aged under 5 years are the age groups that are most secure financially, with 100.0% of males and 100.0% of females in these age groups living above the poverty line.
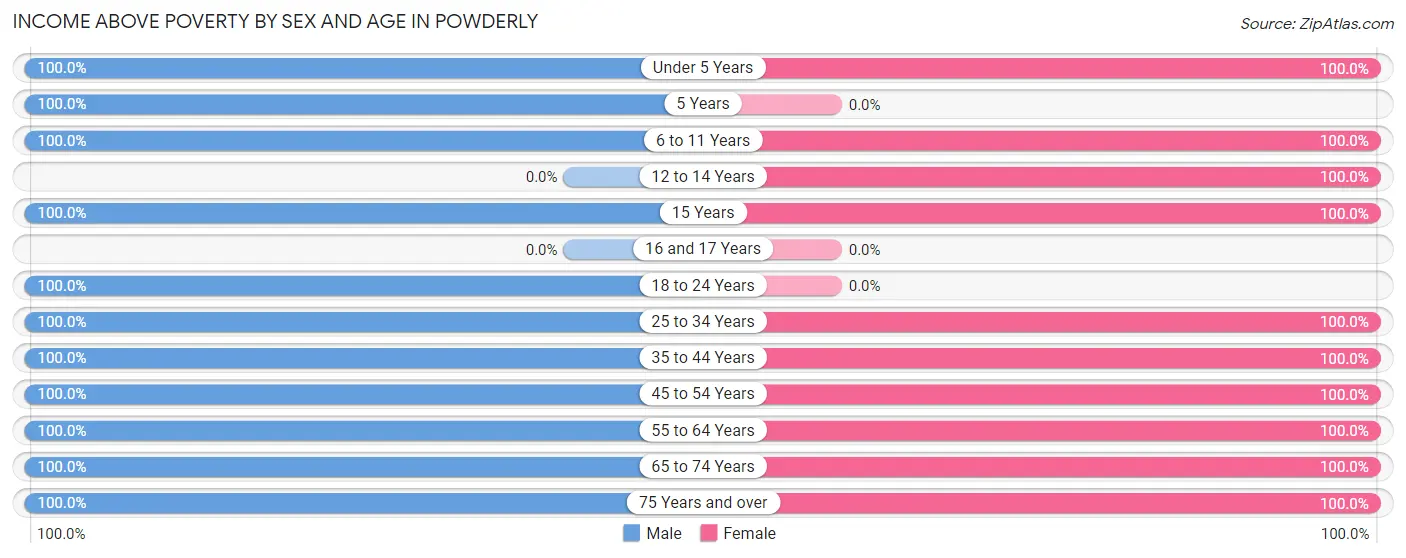
| Age Bracket | Male | Female |
| Under 5 Years | 14 (100.0%) | 28 (100.0%) |
| 5 Years | 7 (100.0%) | 0 (0.0%) |
| 6 to 11 Years | 27 (100.0%) | 54 (100.0%) |
| 12 to 14 Years | 0 (0.0%) | 15 (100.0%) |
| 15 Years | 34 (100.0%) | 33 (100.0%) |
| 16 and 17 Years | 0 (0.0%) | 0 (0.0%) |
| 18 to 24 Years | 16 (100.0%) | 0 (0.0%) |
| 25 to 34 Years | 137 (100.0%) | 126 (100.0%) |
| 35 to 44 Years | 74 (100.0%) | 73 (100.0%) |
| 45 to 54 Years | 99 (100.0%) | 45 (100.0%) |
| 55 to 64 Years | 113 (100.0%) | 85 (100.0%) |
| 65 to 74 Years | 38 (100.0%) | 86 (100.0%) |
| 75 Years and over | 57 (100.0%) | 90 (100.0%) |
| Total | 616 (100.0%) | 635 (100.0%) |
Income Below Poverty Among Married-Couple Families in Powderly
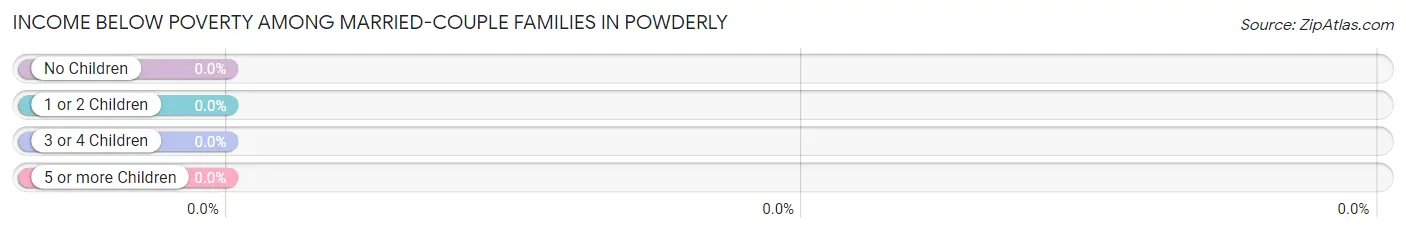
| Children | Above Poverty | Below Poverty |
| No Children | 169 (100.0%) | 0 (0.0%) |
| 1 or 2 Children | 53 (100.0%) | 0 (0.0%) |
| 3 or 4 Children | 24 (100.0%) | 0 (0.0%) |
| 5 or more Children | 0 (0.0%) | 0 (0.0%) |
| Total | 246 (100.0%) | 0 (0.0%) |
Income Below Poverty Among Single-Parent Households in Powderly
| Children | Single Father | Single Mother |
| No Children | 0 (0.0%) | 0 (0.0%) |
| 1 or 2 Children | 0 (0.0%) | 0 (0.0%) |
| 3 or 4 Children | 0 (0.0%) | 0 (0.0%) |
| 5 or more Children | 0 (0.0%) | 0 (0.0%) |
| Total | 0 (0.0%) | 0 (0.0%) |
Income Below Poverty Among Married-Couple vs Single-Parent Households in Powderly
| Children | Married-Couple Families | Single-Parent Households |
| No Children | 0 (0.0%) | 0 (0.0%) |
| 1 or 2 Children | 0 (0.0%) | 0 (0.0%) |
| 3 or 4 Children | 0 (0.0%) | 0 (0.0%) |
| 5 or more Children | 0 (0.0%) | 0 (0.0%) |
| Total | 0 (0.0%) | 0 (0.0%) |
Race in Powderly
The most populous races in Powderly are White / Caucasian (1,214 | 97.0%), Black / African American (21 | 1.7%), and Hispanic or Latino (15 | 1.2%).
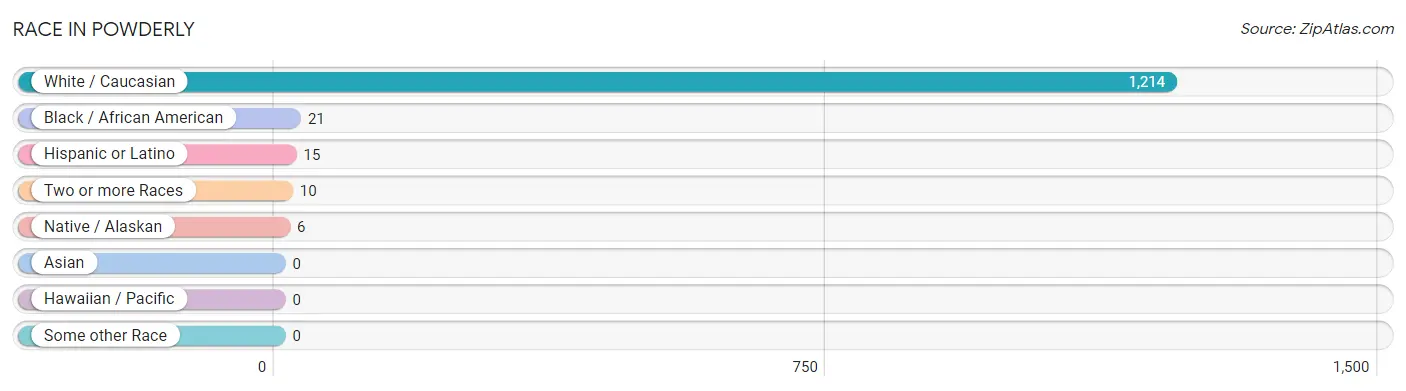
| Race | # Population | % Population |
| Asian | 0 | 0.0% |
| Black / African American | 21 | 1.7% |
| Hawaiian / Pacific | 0 | 0.0% |
| Hispanic or Latino | 15 | 1.2% |
| Native / Alaskan | 6 | 0.5% |
| White / Caucasian | 1,214 | 97.0% |
| Two or more Races | 10 | 0.8% |
| Some other Race | 0 | 0.0% |
| Total | 1,251 | 100.0% |
Ancestry in Powderly
The most populous ancestries reported in Powderly are American (190 | 15.2%), English (54 | 4.3%), Irish (53 | 4.2%), German (46 | 3.7%), and Dutch West Indian (27 | 2.2%), together accounting for 29.6% of all Powderly residents.
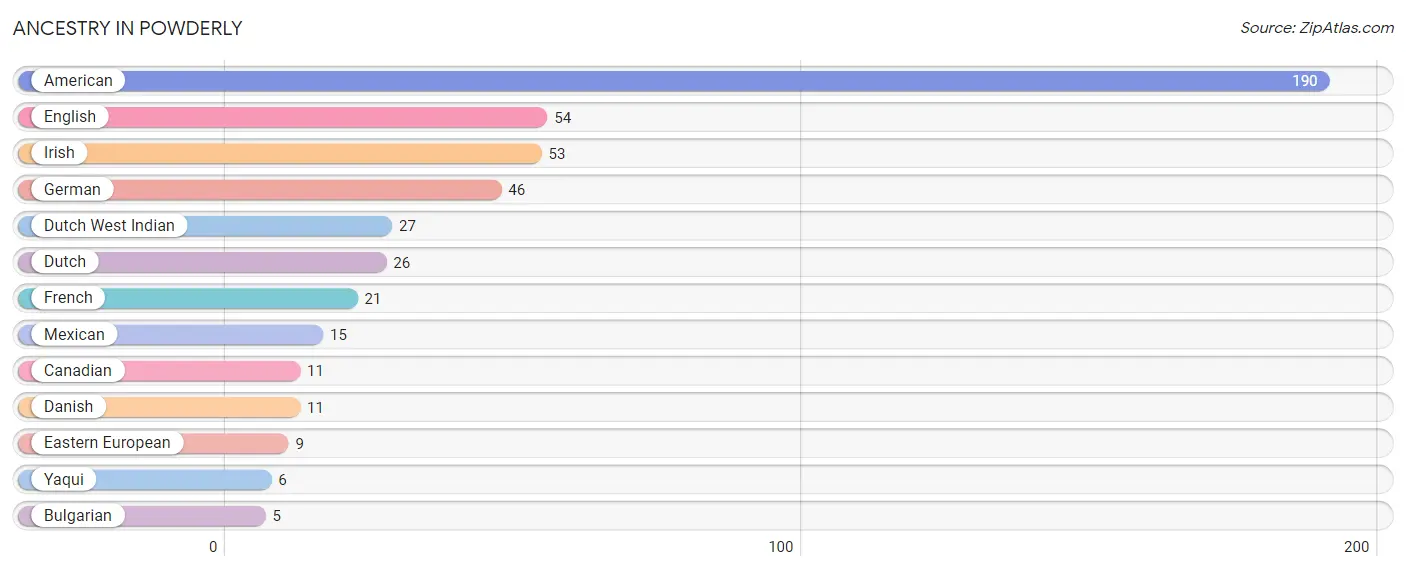
| Ancestry | # Population | % Population |
| American | 190 | 15.2% |
| Bulgarian | 5 | 0.4% |
| Canadian | 11 | 0.9% |
| Danish | 11 | 0.9% |
| Dutch | 26 | 2.1% |
| Dutch West Indian | 27 | 2.2% |
| Eastern European | 9 | 0.7% |
| English | 54 | 4.3% |
| French | 21 | 1.7% |
| German | 46 | 3.7% |
| Irish | 53 | 4.2% |
| Mexican | 15 | 1.2% |
| Yaqui | 6 | 0.5% | View All 13 Rows |
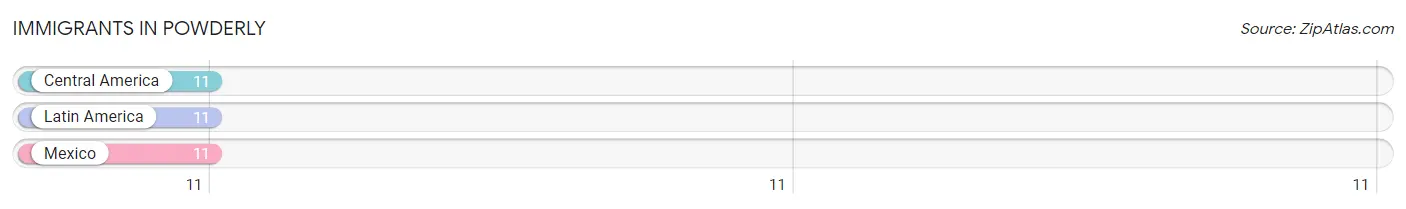
Immigrants in Powderly
The most numerous immigrant groups reported in Powderly came from Central America (11 | 0.9%), Latin America (11 | 0.9%), and Mexico (11 | 0.9%), together accounting for 2.6% of all Powderly residents.
| Immigration Origin | # Population | % Population |
| Central America | 11 | 0.9% |
| Latin America | 11 | 0.9% |
| Mexico | 11 | 0.9% | View All 3 Rows |
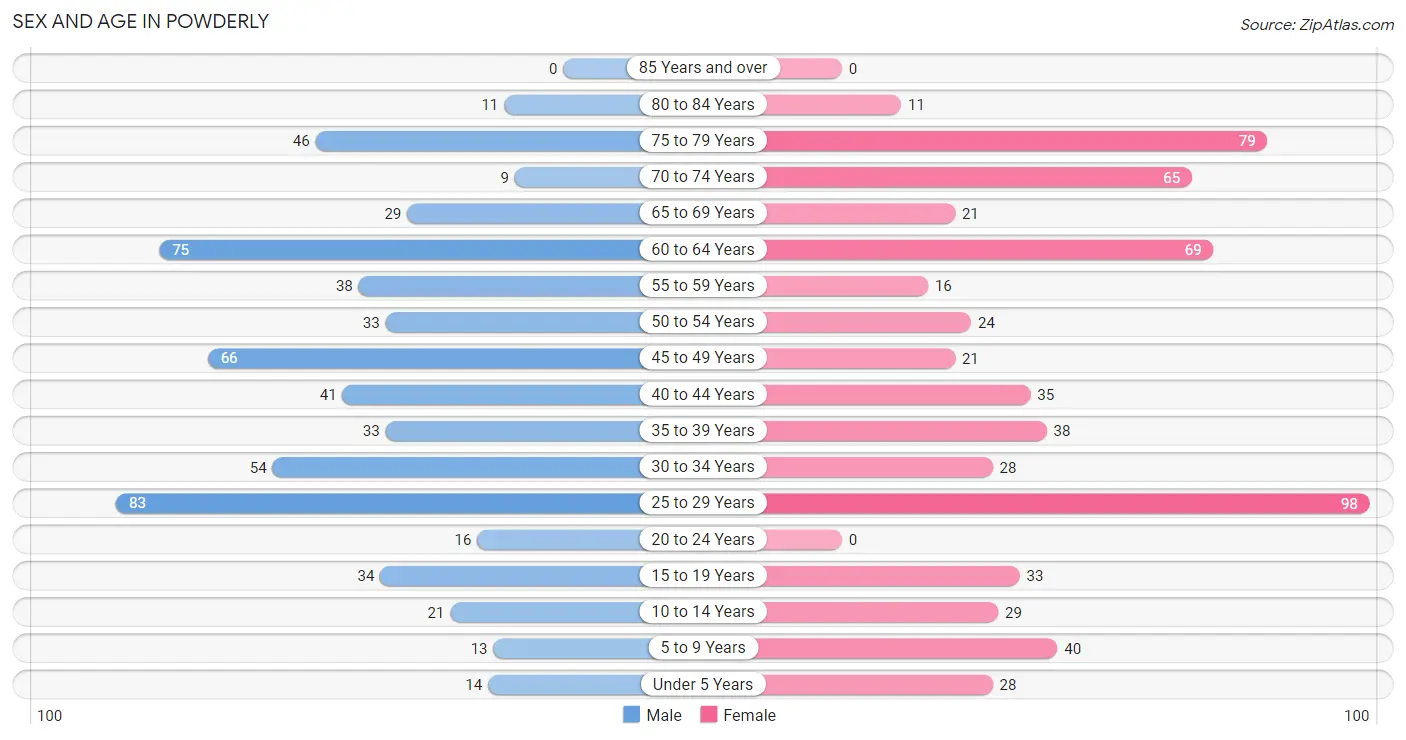
Sex and Age in Powderly
Sex and Age in Powderly
The most populous age groups in Powderly are 25 to 29 Years (83 | 13.5%) for men and 25 to 29 Years (98 | 15.4%) for women.
| Age Bracket | Male | Female |
| Under 5 Years | 14 (2.3%) | 28 (4.4%) |
| 5 to 9 Years | 13 (2.1%) | 40 (6.3%) |
| 10 to 14 Years | 21 (3.4%) | 29 (4.6%) |
| 15 to 19 Years | 34 (5.5%) | 33 (5.2%) |
| 20 to 24 Years | 16 (2.6%) | 0 (0.0%) |
| 25 to 29 Years | 83 (13.5%) | 98 (15.4%) |
| 30 to 34 Years | 54 (8.8%) | 28 (4.4%) |
| 35 to 39 Years | 33 (5.4%) | 38 (6.0%) |
| 40 to 44 Years | 41 (6.7%) | 35 (5.5%) |
| 45 to 49 Years | 66 (10.7%) | 21 (3.3%) |
| 50 to 54 Years | 33 (5.4%) | 24 (3.8%) |
| 55 to 59 Years | 38 (6.2%) | 16 (2.5%) |
| 60 to 64 Years | 75 (12.2%) | 69 (10.9%) |
| 65 to 69 Years | 29 (4.7%) | 21 (3.3%) |
| 70 to 74 Years | 9 (1.5%) | 65 (10.2%) |
| 75 to 79 Years | 46 (7.5%) | 79 (12.4%) |
| 80 to 84 Years | 11 (1.8%) | 11 (1.7%) |
| 85 Years and over | 0 (0.0%) | 0 (0.0%) |
| Total | 616 (100.0%) | 635 (100.0%) |
Families and Households in Powderly
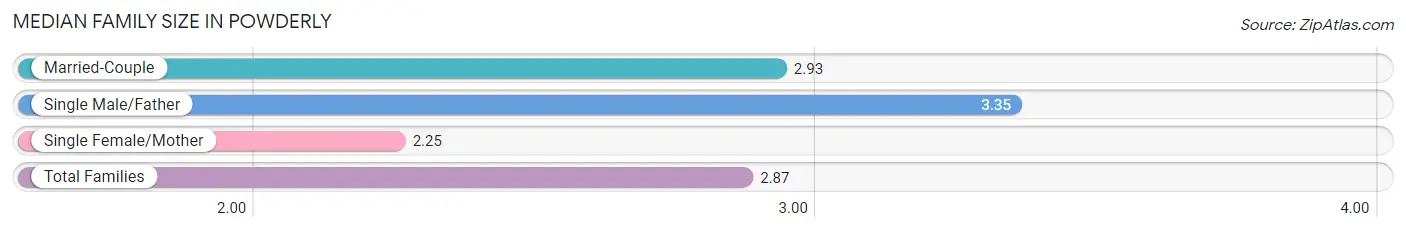
Median Family Size in Powderly
The median family size in Powderly is 2.87 persons per family, with single male/father families (75 | 18.8%) accounting for the largest median family size of 3.35 persons per family. On the other hand, single female/mother families (77 | 19.4%) represent the smallest median family size with 2.25 persons per family.
| Family Type | # Families | Family Size |
| Married-Couple | 246 (61.8%) | 2.93 |
| Single Male/Father | 75 (18.8%) | 3.35 |
| Single Female/Mother | 77 (19.4%) | 2.25 |
| Total Families | 398 (100.0%) | 2.87 |
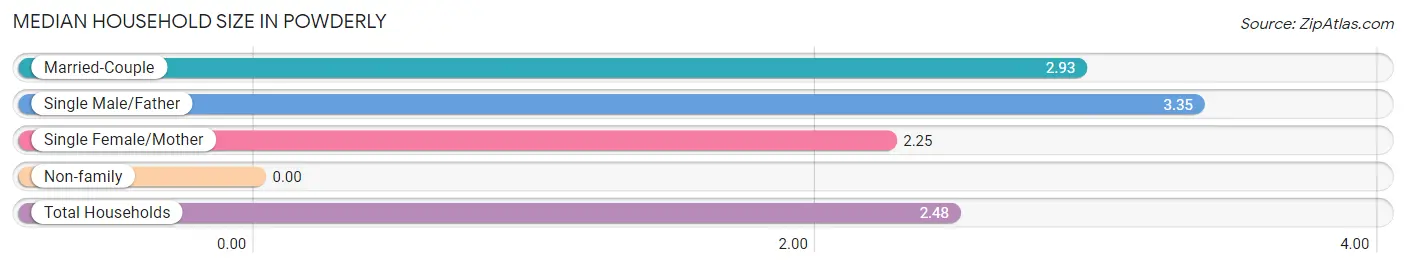
Median Household Size in Powderly
| Household Type | # Households | Household Size |
| Married-Couple | 246 (48.7%) | 2.93 |
| Single Male/Father | 75 (14.8%) | 3.35 |
| Single Female/Mother | 77 (15.2%) | 2.25 |
| Non-family | 107 (21.2%) | - |
| Total Households | 505 (100.0%) | 2.48 |
Household Size by Marriage Status in Powderly
Out of a total of 505 households in Powderly, 398 (78.8%) are family households, while 107 (21.2%) are nonfamily households. The most numerous type of family households are 2-person households, comprising 212, and the most common type of nonfamily households are 1-person households, comprising 107.
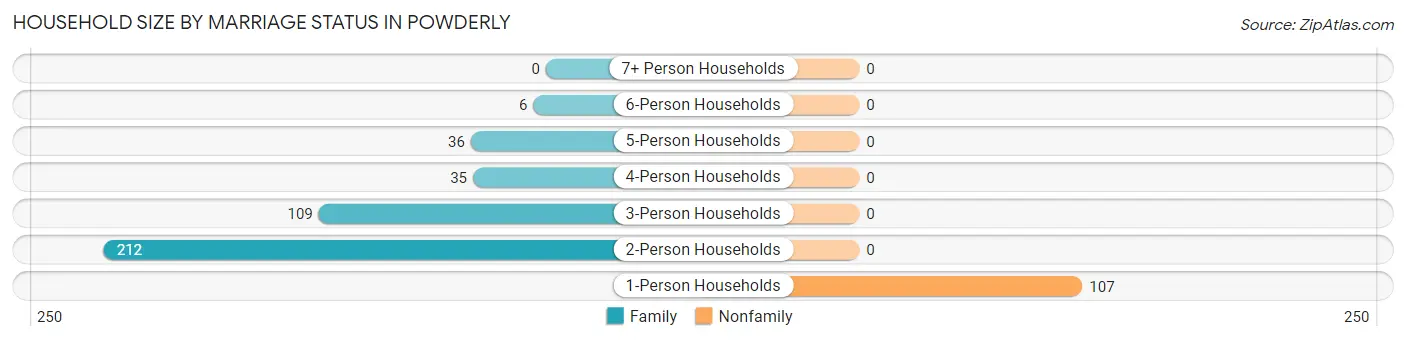
| Household Size | Family Households | Nonfamily Households |
| 1-Person Households | - | 107 (21.2%) |
| 2-Person Households | 212 (42.0%) | 0 (0.0%) |
| 3-Person Households | 109 (21.6%) | 0 (0.0%) |
| 4-Person Households | 35 (6.9%) | 0 (0.0%) |
| 5-Person Households | 36 (7.1%) | 0 (0.0%) |
| 6-Person Households | 6 (1.2%) | 0 (0.0%) |
| 7+ Person Households | 0 (0.0%) | 0 (0.0%) |
| Total | 398 (78.8%) | 107 (21.2%) |
Female Fertility in Powderly
Fertility by Age in Powderly
Average fertility rate in Powderly is 23.0 births per 1,000 women. Women in the age bracket of 20 to 34 years have the highest fertility rate with 48.0 births per 1,000 women. Women in the age bracket of 20 to 34 years acount for 100.0% of all women with births.
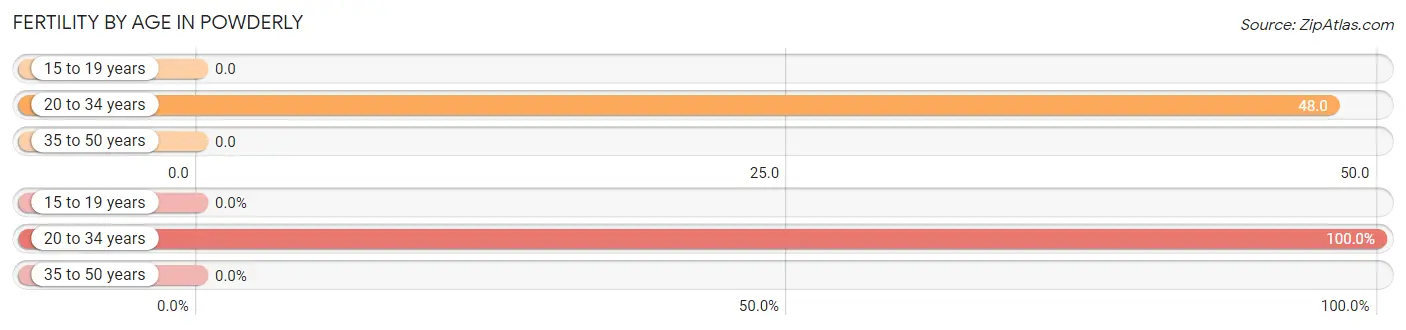
| Age Bracket | Women with Births | Births / 1,000 Women |
| 15 to 19 years | 0 (0.0%) | 0.0 |
| 20 to 34 years | 6 (100.0%) | 48.0 |
| 35 to 50 years | 0 (0.0%) | 0.0 |
| Total | 6 (100.0%) | 23.0 |
Fertility by Age by Marriage Status in Powderly
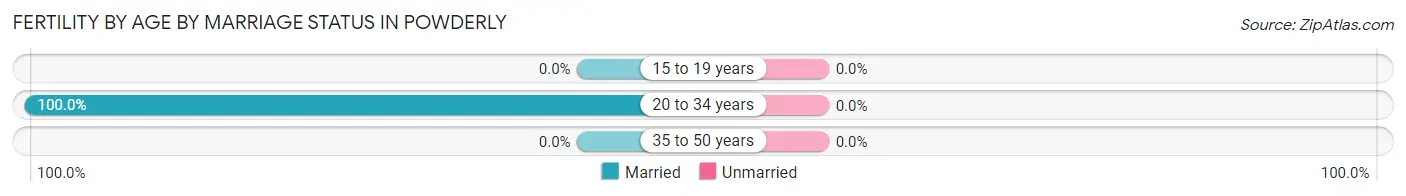
| Age Bracket | Married | Unmarried |
| 15 to 19 years | 0 (0.0%) | 0 (0.0%) |
| 20 to 34 years | 6 (100.0%) | 0 (0.0%) |
| 35 to 50 years | 0 (0.0%) | 0 (0.0%) |
| Total | 6 (100.0%) | 0 (0.0%) |
Fertility by Education in Powderly
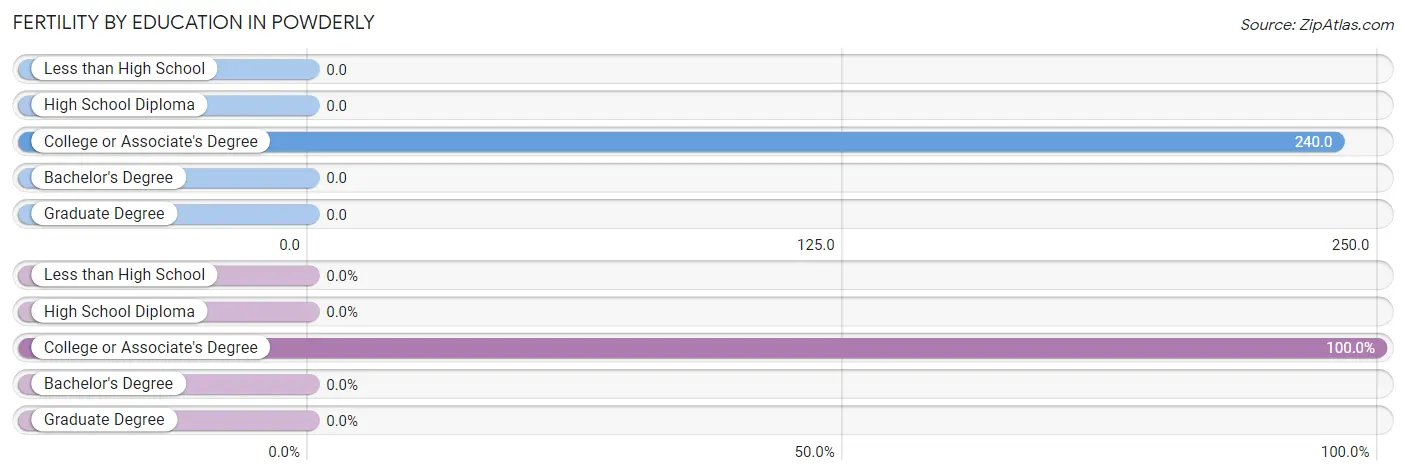
| Educational Attainment | Women with Births | Births / 1,000 Women |
| Less than High School | 0 (0.0%) | 0.0 |
| High School Diploma | 0 (0.0%) | 0.0 |
| College or Associate's Degree | 6 (100.0%) | 240.0 |
| Bachelor's Degree | 0 (0.0%) | 0.0 |
| Graduate Degree | 0 (0.0%) | 0.0 |
| Total | 6 (100.0%) | 23.0 |
Fertility by Education by Marriage Status in Powderly
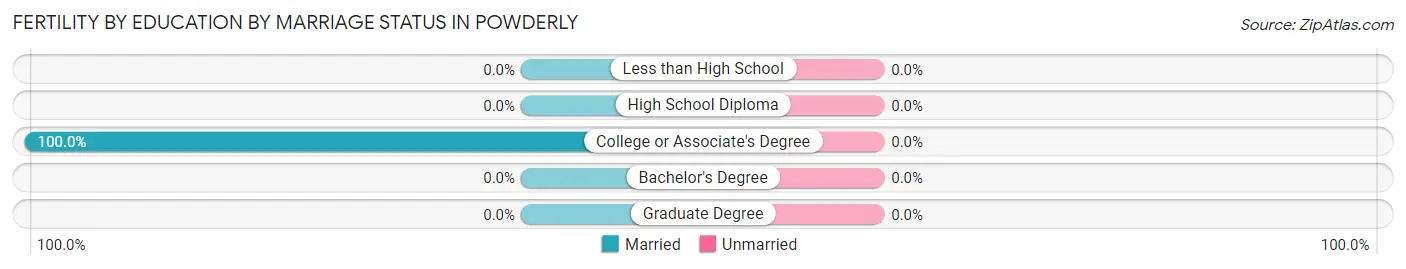
| Educational Attainment | Married | Unmarried |
| Less than High School | 0 (0.0%) | 0 (0.0%) |
| High School Diploma | 0 (0.0%) | 0 (0.0%) |
| College or Associate's Degree | 6 (100.0%) | 0 (0.0%) |
| Bachelor's Degree | 0 (0.0%) | 0 (0.0%) |
| Graduate Degree | 0 (0.0%) | 0 (0.0%) |
| Total | 6 (100.0%) | 0 (0.0%) |
Employment Characteristics in Powderly
Employment by Class of Employer in Powderly
Among the 611 employed individuals in Powderly, private company employees (241 | 39.4%), local government employees (126 | 20.6%), and state government employees (86 | 14.1%) make up the most common classes of employment.
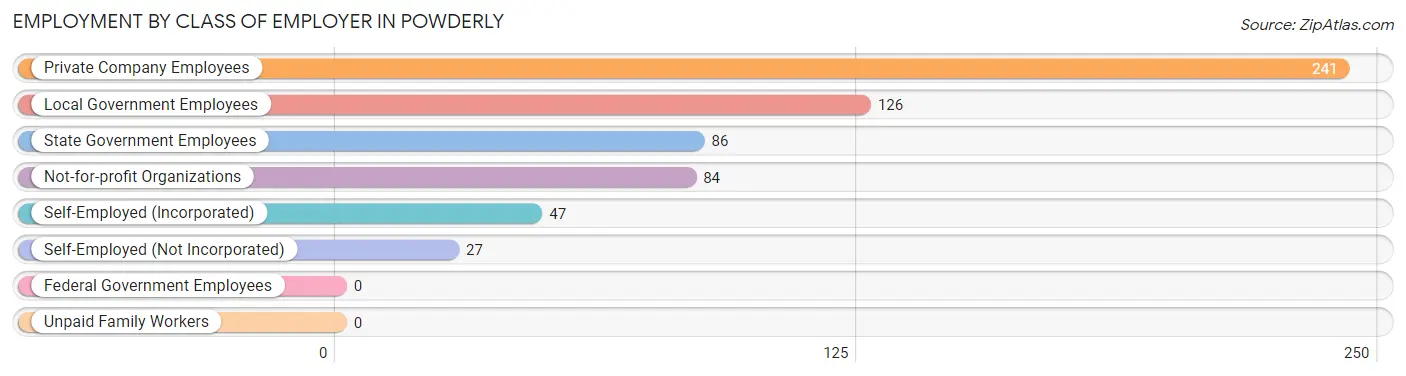
| Employer Class | # Employees | % Employees |
| Private Company Employees | 241 | 39.4% |
| Self-Employed (Incorporated) | 47 | 7.7% |
| Self-Employed (Not Incorporated) | 27 | 4.4% |
| Not-for-profit Organizations | 84 | 13.8% |
| Local Government Employees | 126 | 20.6% |
| State Government Employees | 86 | 14.1% |
| Federal Government Employees | 0 | 0.0% |
| Unpaid Family Workers | 0 | 0.0% |
| Total | 611 | 100.0% |
Employment Status by Age in Powderly
According to the labor force statistics for Powderly, out of the total population over 16 years of age (1,039), 62.4% or 648 individuals are in the labor force, with 5.7% or 37 of them unemployed. The age group with the highest labor force participation rate is 20 to 24 years, with 100.0% or 16 individuals in the labor force. Within the labor force, the 20 to 24 years age range has the highest percentage of unemployed individuals, with 43.8% or 7 of them being unemployed.
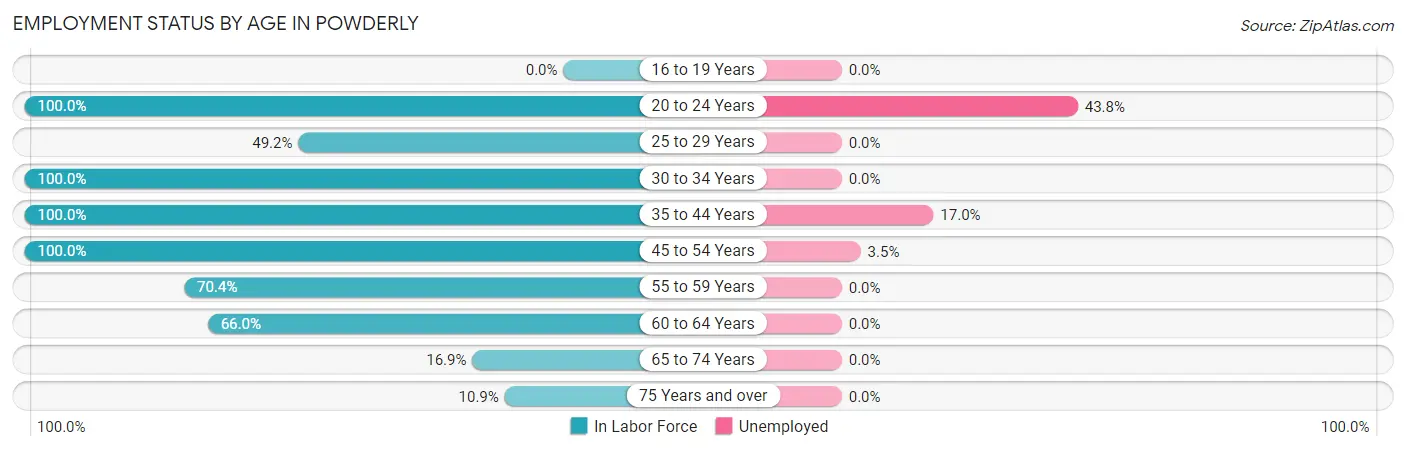
| Age Bracket | In Labor Force | Unemployed |
| 16 to 19 Years | 0 (0.0%) | 0 (0.0%) |
| 20 to 24 Years | 16 (100.0%) | 7 (43.8%) |
| 25 to 29 Years | 89 (49.2%) | 0 (0.0%) |
| 30 to 34 Years | 82 (100.0%) | 0 (0.0%) |
| 35 to 44 Years | 147 (100.0%) | 25 (17.0%) |
| 45 to 54 Years | 144 (100.0%) | 5 (3.5%) |
| 55 to 59 Years | 38 (70.4%) | 0 (0.0%) |
| 60 to 64 Years | 95 (66.0%) | 0 (0.0%) |
| 65 to 74 Years | 21 (16.9%) | 0 (0.0%) |
| 75 Years and over | 16 (10.9%) | 0 (0.0%) |
| Total | 648 (62.4%) | 37 (5.7%) |
Employment Status by Educational Attainment in Powderly
According to labor force statistics for Powderly, 79.1% of individuals (595) out of the total population between 25 and 64 years of age (752) are in the labor force, with 5.0% or 30 of them being unemployed. The group with the highest labor force participation rate are those with the educational attainment of less than high school, with 100.0% or 31 individuals in the labor force. Within the labor force, individuals with bachelor's degree or higher education have the highest percentage of unemployment, with 15.3% or 25 of them being unemployed.
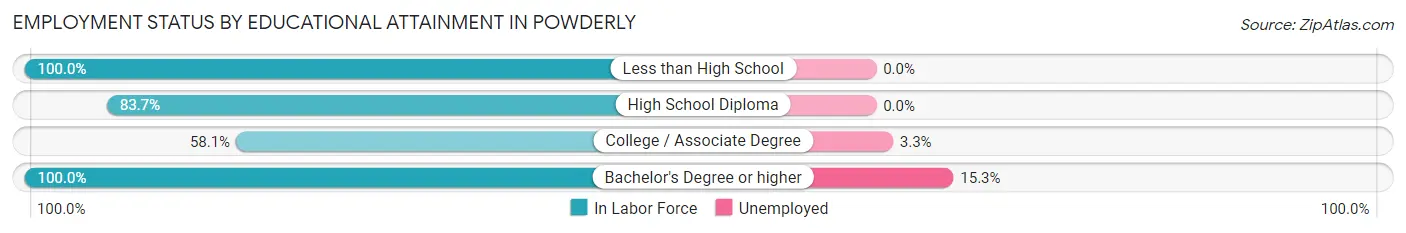
| Educational Attainment | In Labor Force | Unemployed |
| Less than High School | 31 (100.0%) | 0 (0.0%) |
| High School Diploma | 251 (83.7%) | 0 (0.0%) |
| College / Associate Degree | 150 (58.1%) | 9 (3.3%) |
| Bachelor's Degree or higher | 163 (100.0%) | 25 (15.3%) |
| Total | 595 (79.1%) | 38 (5.0%) |
Employment Occupations by Sex in Powderly
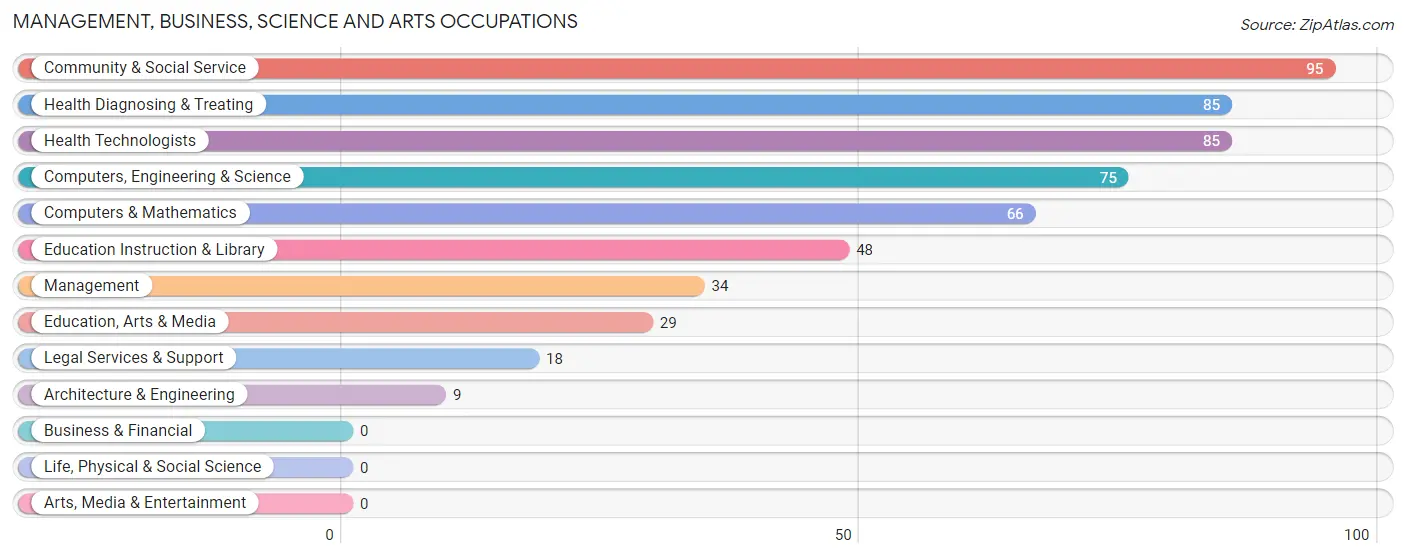
Management, Business, Science and Arts Occupations
The most common Management, Business, Science and Arts occupations in Powderly are Community & Social Service (95 | 15.5%), Health Diagnosing & Treating (85 | 13.9%), Health Technologists (85 | 13.9%), Computers, Engineering & Science (75 | 12.3%), and Computers & Mathematics (66 | 10.8%).
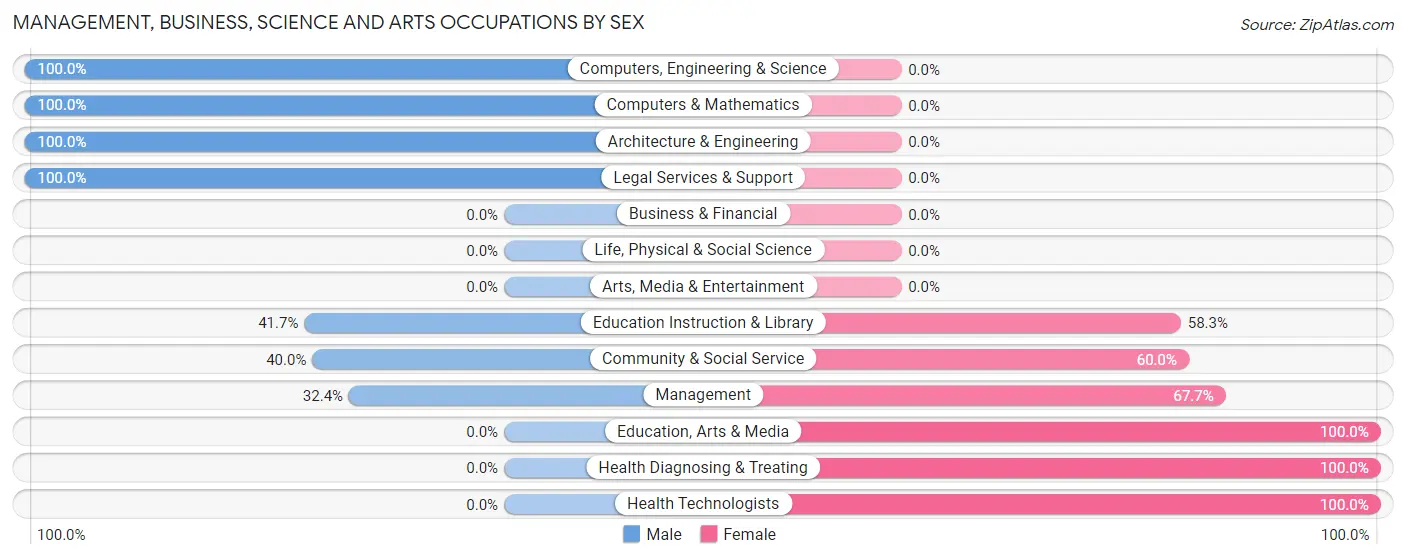
Management, Business, Science and Arts Occupations by Sex
Within the Management, Business, Science and Arts occupations in Powderly, the most male-oriented occupations are Computers, Engineering & Science (100.0%), Computers & Mathematics (100.0%), and Architecture & Engineering (100.0%), while the most female-oriented occupations are Education, Arts & Media (100.0%), Health Diagnosing & Treating (100.0%), and Health Technologists (100.0%).
| Occupation | Male | Female |
| Management | 11 (32.4%) | 23 (67.6%) |
| Business & Financial | 0 (0.0%) | 0 (0.0%) |
| Computers, Engineering & Science | 75 (100.0%) | 0 (0.0%) |
| Computers & Mathematics | 66 (100.0%) | 0 (0.0%) |
| Architecture & Engineering | 9 (100.0%) | 0 (0.0%) |
| Life, Physical & Social Science | 0 (0.0%) | 0 (0.0%) |
| Community & Social Service | 38 (40.0%) | 57 (60.0%) |
| Education, Arts & Media | 0 (0.0%) | 29 (100.0%) |
| Legal Services & Support | 18 (100.0%) | 0 (0.0%) |
| Education Instruction & Library | 20 (41.7%) | 28 (58.3%) |
| Arts, Media & Entertainment | 0 (0.0%) | 0 (0.0%) |
| Health Diagnosing & Treating | 0 (0.0%) | 85 (100.0%) |
| Health Technologists | 0 (0.0%) | 85 (100.0%) |
| Total (Category) | 124 (42.9%) | 165 (57.1%) |
| Total (Overall) | 319 (52.2%) | 292 (47.8%) |
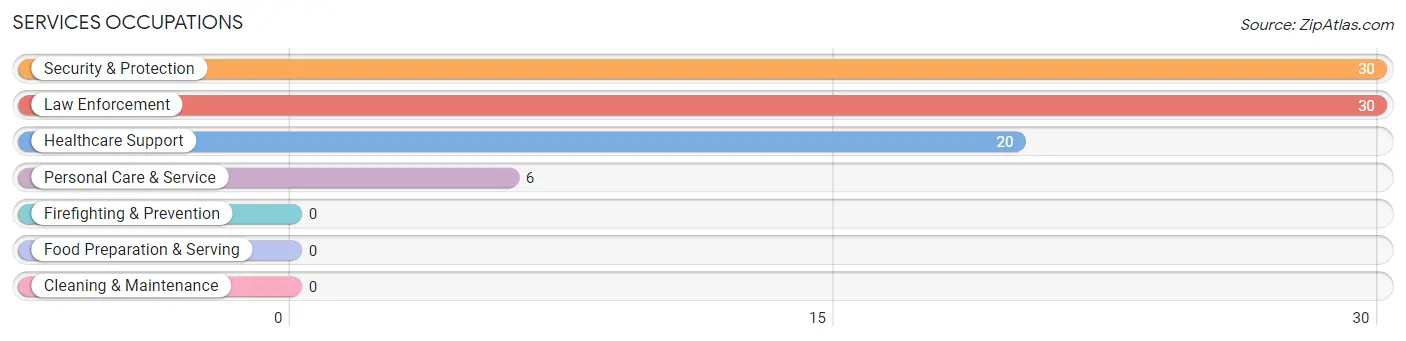
Services Occupations
The most common Services occupations in Powderly are Security & Protection (30 | 4.9%), Law Enforcement (30 | 4.9%), Healthcare Support (20 | 3.3%), and Personal Care & Service (6 | 1.0%).
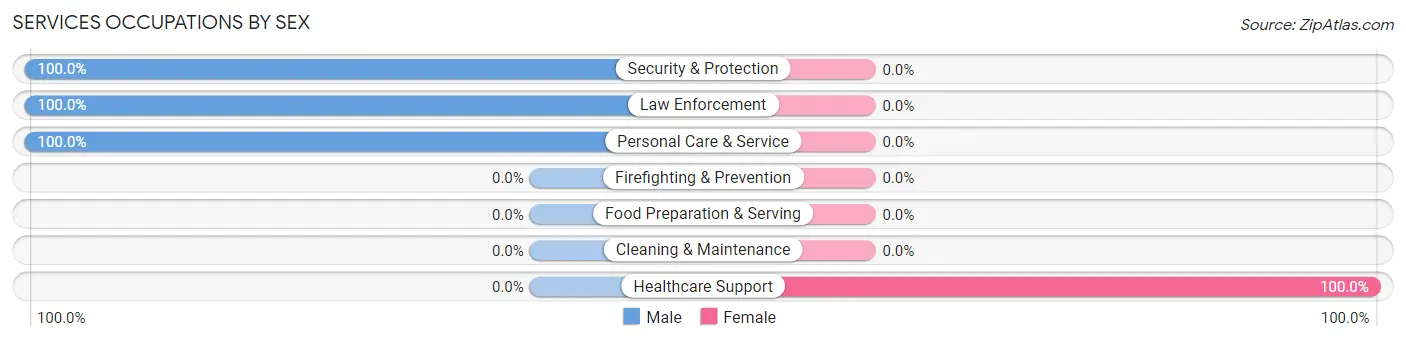
Services Occupations by Sex
| Occupation | Male | Female |
| Healthcare Support | 0 (0.0%) | 20 (100.0%) |
| Security & Protection | 30 (100.0%) | 0 (0.0%) |
| Firefighting & Prevention | 0 (0.0%) | 0 (0.0%) |
| Law Enforcement | 30 (100.0%) | 0 (0.0%) |
| Food Preparation & Serving | 0 (0.0%) | 0 (0.0%) |
| Cleaning & Maintenance | 0 (0.0%) | 0 (0.0%) |
| Personal Care & Service | 6 (100.0%) | 0 (0.0%) |
| Total (Category) | 36 (64.3%) | 20 (35.7%) |
| Total (Overall) | 319 (52.2%) | 292 (47.8%) |
Sales and Office Occupations
The most common Sales and Office occupations in Powderly are Sales & Related (77 | 12.6%), and Office & Administration (39 | 6.4%).
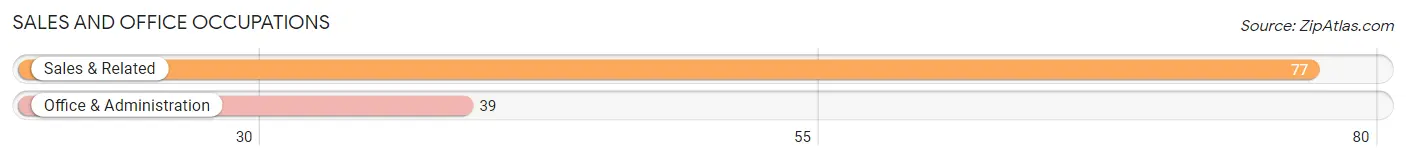
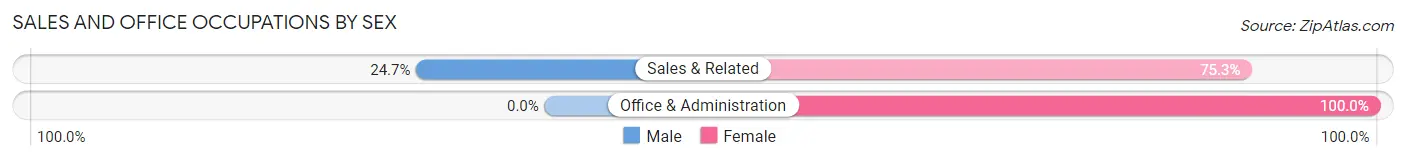
Sales and Office Occupations by Sex
| Occupation | Male | Female |
| Sales & Related | 19 (24.7%) | 58 (75.3%) |
| Office & Administration | 0 (0.0%) | 39 (100.0%) |
| Total (Category) | 19 (16.4%) | 97 (83.6%) |
| Total (Overall) | 319 (52.2%) | 292 (47.8%) |
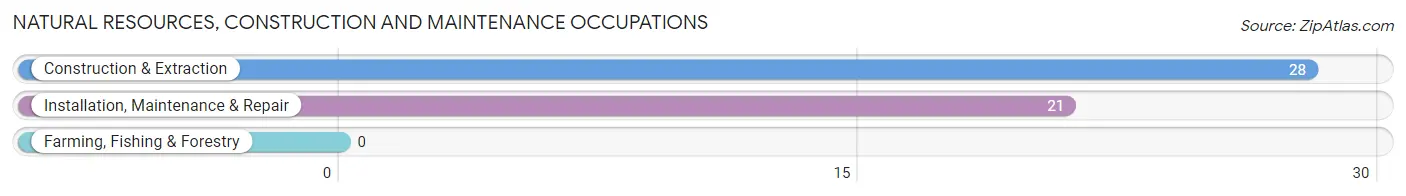
Natural Resources, Construction and Maintenance Occupations
The most common Natural Resources, Construction and Maintenance occupations in Powderly are Construction & Extraction (28 | 4.6%), and Installation, Maintenance & Repair (21 | 3.4%).
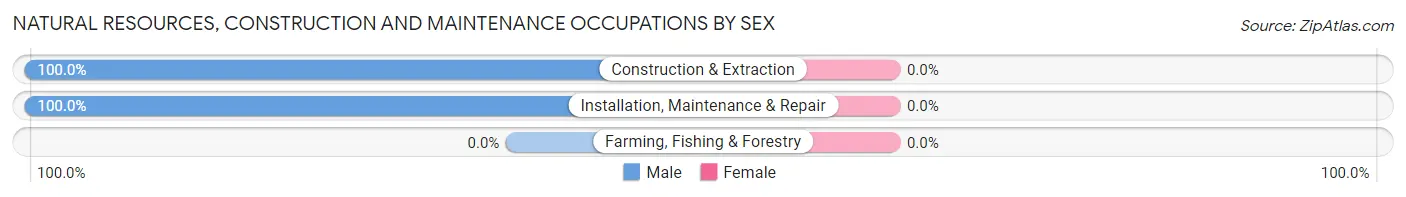
Natural Resources, Construction and Maintenance Occupations by Sex
| Occupation | Male | Female |
| Farming, Fishing & Forestry | 0 (0.0%) | 0 (0.0%) |
| Construction & Extraction | 28 (100.0%) | 0 (0.0%) |
| Installation, Maintenance & Repair | 21 (100.0%) | 0 (0.0%) |
| Total (Category) | 49 (100.0%) | 0 (0.0%) |
| Total (Overall) | 319 (52.2%) | 292 (47.8%) |
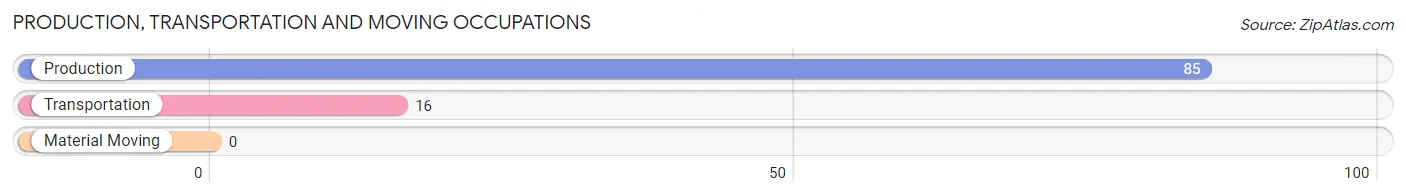
Production, Transportation and Moving Occupations
The most common Production, Transportation and Moving occupations in Powderly are Production (85 | 13.9%), and Transportation (16 | 2.6%).
Production, Transportation and Moving Occupations by Sex
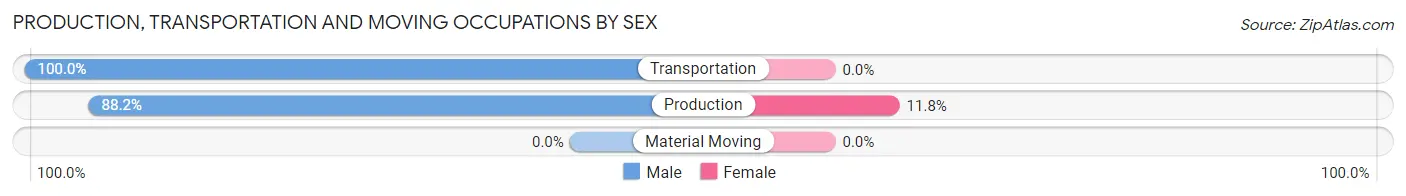
| Occupation | Male | Female |
| Production | 75 (88.2%) | 10 (11.8%) |
| Transportation | 16 (100.0%) | 0 (0.0%) |
| Material Moving | 0 (0.0%) | 0 (0.0%) |
| Total (Category) | 91 (90.1%) | 10 (9.9%) |
| Total (Overall) | 319 (52.2%) | 292 (47.8%) |
Employment Industries by Sex in Powderly
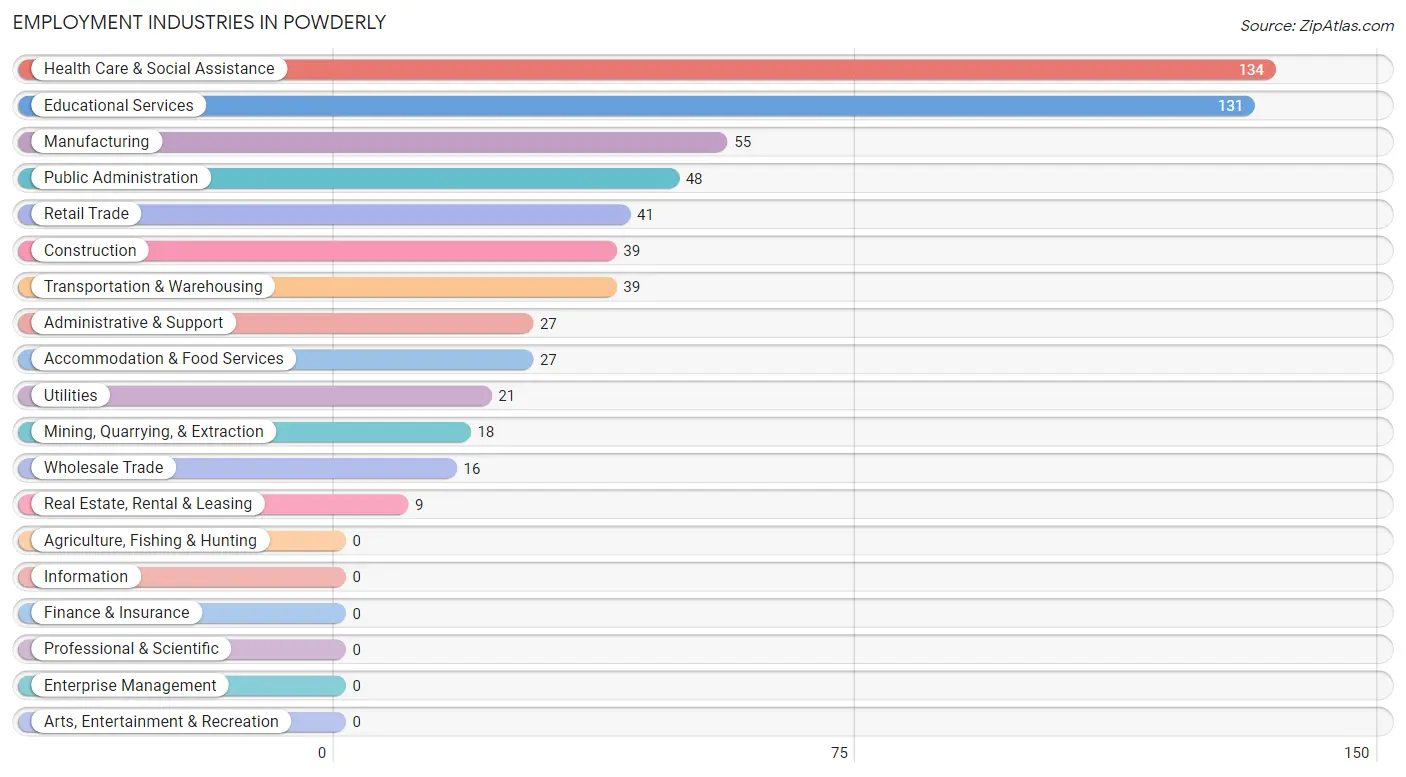
Employment Industries in Powderly
The major employment industries in Powderly include Health Care & Social Assistance (134 | 21.9%), Educational Services (131 | 21.4%), Manufacturing (55 | 9.0%), Public Administration (48 | 7.9%), and Retail Trade (41 | 6.7%).
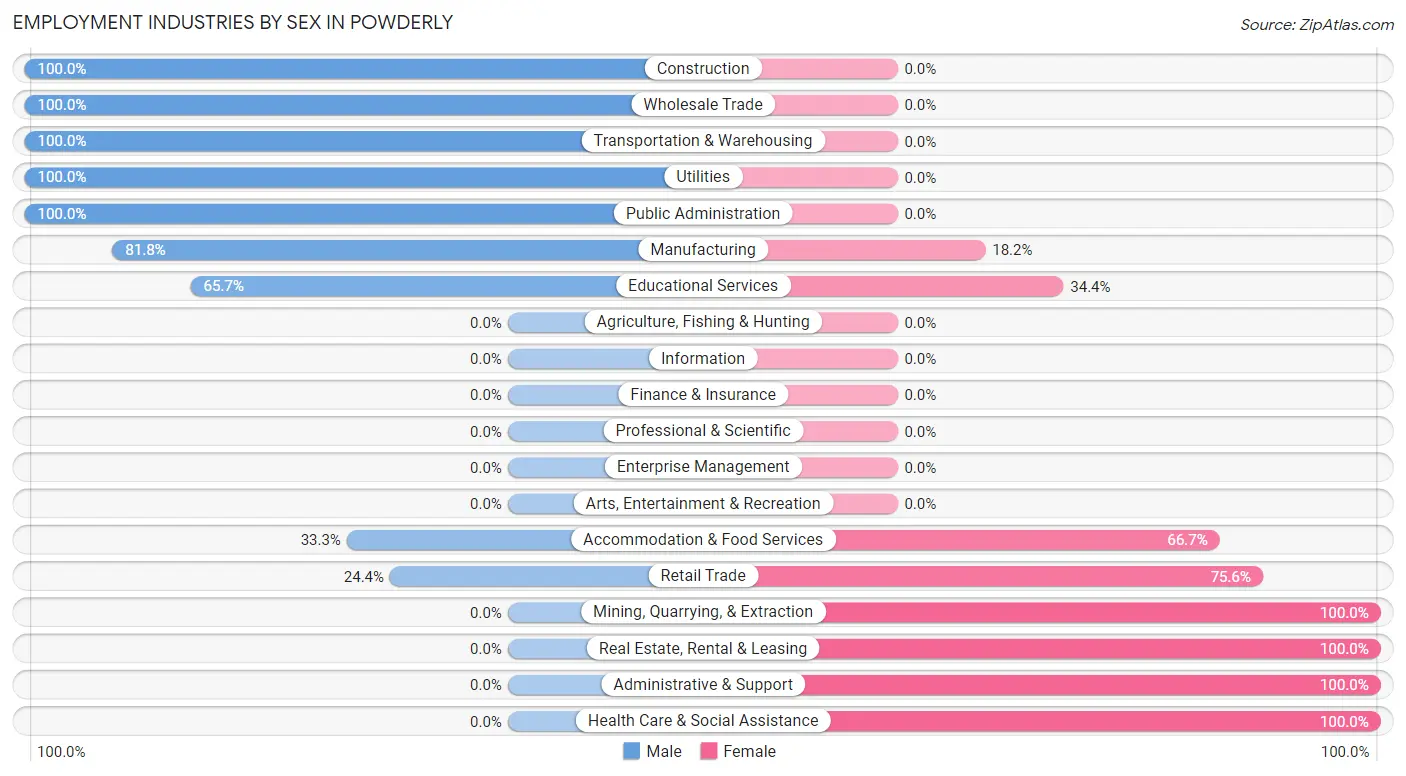
Employment Industries by Sex in Powderly
The Powderly industries that see more men than women are Construction (100.0%), Wholesale Trade (100.0%), and Transportation & Warehousing (100.0%), whereas the industries that tend to have a higher number of women are Mining, Quarrying, & Extraction (100.0%), Real Estate, Rental & Leasing (100.0%), and Administrative & Support (100.0%).
| Industry | Male | Female |
| Agriculture, Fishing & Hunting | 0 (0.0%) | 0 (0.0%) |
| Mining, Quarrying, & Extraction | 0 (0.0%) | 18 (100.0%) |
| Construction | 39 (100.0%) | 0 (0.0%) |
| Manufacturing | 45 (81.8%) | 10 (18.2%) |
| Wholesale Trade | 16 (100.0%) | 0 (0.0%) |
| Retail Trade | 10 (24.4%) | 31 (75.6%) |
| Transportation & Warehousing | 39 (100.0%) | 0 (0.0%) |
| Utilities | 21 (100.0%) | 0 (0.0%) |
| Information | 0 (0.0%) | 0 (0.0%) |
| Finance & Insurance | 0 (0.0%) | 0 (0.0%) |
| Real Estate, Rental & Leasing | 0 (0.0%) | 9 (100.0%) |
| Professional & Scientific | 0 (0.0%) | 0 (0.0%) |
| Enterprise Management | 0 (0.0%) | 0 (0.0%) |
| Administrative & Support | 0 (0.0%) | 27 (100.0%) |
| Educational Services | 86 (65.6%) | 45 (34.4%) |
| Health Care & Social Assistance | 0 (0.0%) | 134 (100.0%) |
| Arts, Entertainment & Recreation | 0 (0.0%) | 0 (0.0%) |
| Accommodation & Food Services | 9 (33.3%) | 18 (66.7%) |
| Public Administration | 48 (100.0%) | 0 (0.0%) |
| Total | 319 (52.2%) | 292 (47.8%) |
Education in Powderly
School Enrollment in Powderly
The most common levels of schooling among the 186 students in Powderly are high school (67 | 36.0%), middle school (50 | 26.9%), and elementary school (37 | 19.9%).
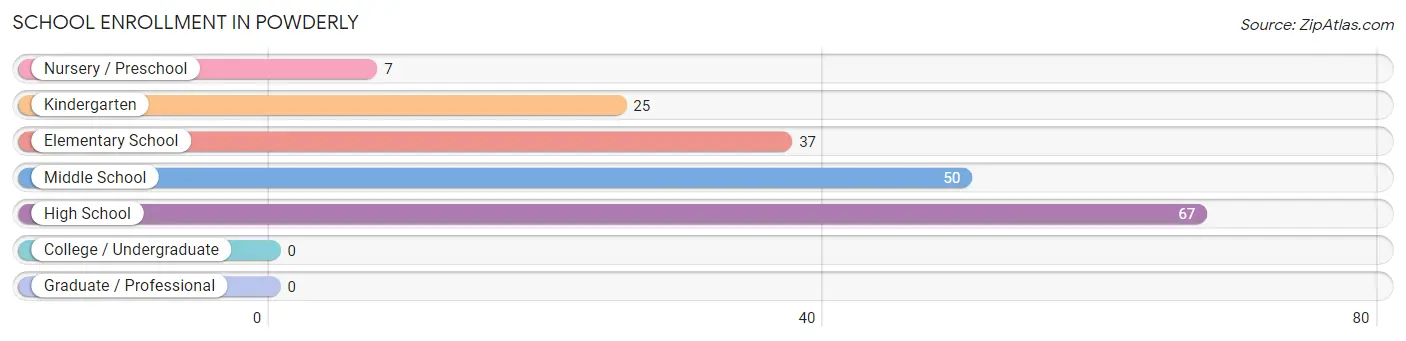
| School Level | # Students | % Students |
| Nursery / Preschool | 7 | 3.8% |
| Kindergarten | 25 | 13.4% |
| Elementary School | 37 | 19.9% |
| Middle School | 50 | 26.9% |
| High School | 67 | 36.0% |
| College / Undergraduate | 0 | 0.0% |
| Graduate / Professional | 0 | 0.0% |
| Total | 186 | 100.0% |
School Enrollment by Age by Funding Source in Powderly
Out of a total of 186 students who are enrolled in schools in Powderly, 13 (7.0%) attend a private institution, while the remaining 173 (93.0%) are enrolled in public schools. The age group of 5 to 9 year old has the highest likelihood of being enrolled in private schools, with 13 (24.5% in the age bracket) enrolled. Conversely, the age group of 3 to 4 year olds has the lowest likelihood of being enrolled in a private school, with 16 (100.0% in the age bracket) attending a public institution.
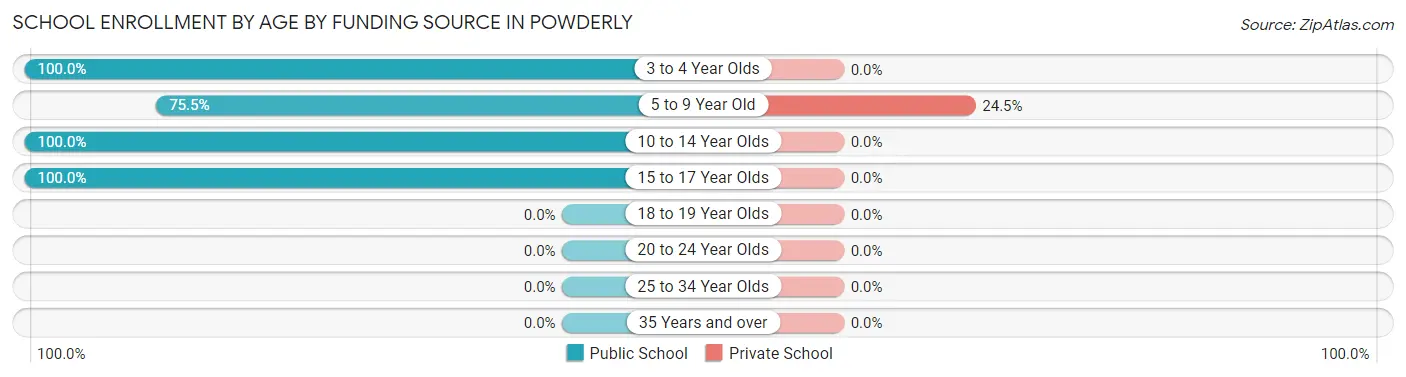
| Age Bracket | Public School | Private School |
| 3 to 4 Year Olds | 16 (100.0%) | 0 (0.0%) |
| 5 to 9 Year Old | 40 (75.5%) | 13 (24.5%) |
| 10 to 14 Year Olds | 50 (100.0%) | 0 (0.0%) |
| 15 to 17 Year Olds | 67 (100.0%) | 0 (0.0%) |
| 18 to 19 Year Olds | 0 (0.0%) | 0 (0.0%) |
| 20 to 24 Year Olds | 0 (0.0%) | 0 (0.0%) |
| 25 to 34 Year Olds | 0 (0.0%) | 0 (0.0%) |
| 35 Years and over | 0 (0.0%) | 0 (0.0%) |
| Total | 173 (93.0%) | 13 (7.0%) |
Educational Attainment by Field of Study in Powderly
Computers & mathematics (64 | 32.7%), education (51 | 26.0%), social sciences (36 | 18.4%), science & technology (21 | 10.7%), and engineering (9 | 4.6%) are the most common fields of study among 196 individuals in Powderly who have obtained a bachelor's degree or higher.
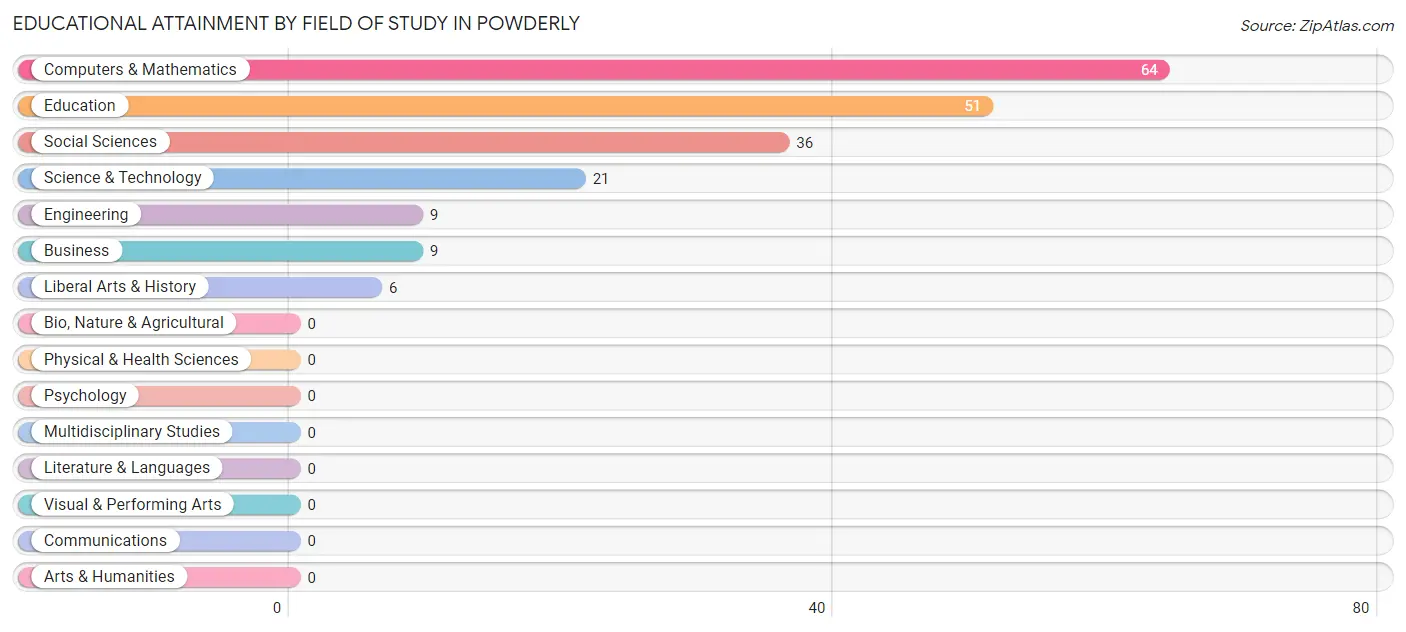
| Field of Study | # Graduates | % Graduates |
| Computers & Mathematics | 64 | 32.7% |
| Bio, Nature & Agricultural | 0 | 0.0% |
| Physical & Health Sciences | 0 | 0.0% |
| Psychology | 0 | 0.0% |
| Social Sciences | 36 | 18.4% |
| Engineering | 9 | 4.6% |
| Multidisciplinary Studies | 0 | 0.0% |
| Science & Technology | 21 | 10.7% |
| Business | 9 | 4.6% |
| Education | 51 | 26.0% |
| Literature & Languages | 0 | 0.0% |
| Liberal Arts & History | 6 | 3.1% |
| Visual & Performing Arts | 0 | 0.0% |
| Communications | 0 | 0.0% |
| Arts & Humanities | 0 | 0.0% |
| Total | 196 | 100.0% |
Transportation & Commute in Powderly
Vehicle Availability by Sex in Powderly
The most prevalent vehicle ownership categories in Powderly are males with 2 vehicles (142, accounting for 44.5%) and females with 2 vehicles (88, making up 48.6%).
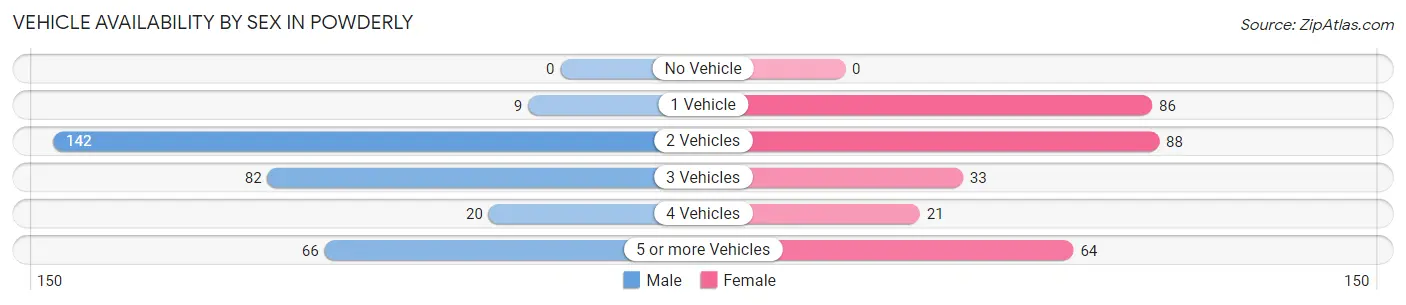
| Vehicles Available | Male | Female |
| No Vehicle | 0 (0.0%) | 0 (0.0%) |
| 1 Vehicle | 9 (2.8%) | 86 (29.4%) |
| 2 Vehicles | 142 (44.5%) | 88 (30.1%) |
| 3 Vehicles | 82 (25.7%) | 33 (11.3%) |
| 4 Vehicles | 20 (6.3%) | 21 (7.2%) |
| 5 or more Vehicles | 66 (20.7%) | 64 (21.9%) |
| Total | 319 (100.0%) | 292 (100.0%) |
Commute Time in Powderly
The most frequently occuring commute durations in Powderly are 15 to 19 minutes (193 commuters, 32.8%), 25 to 29 minutes (130 commuters, 22.1%), and 20 to 24 minutes (108 commuters, 18.3%).
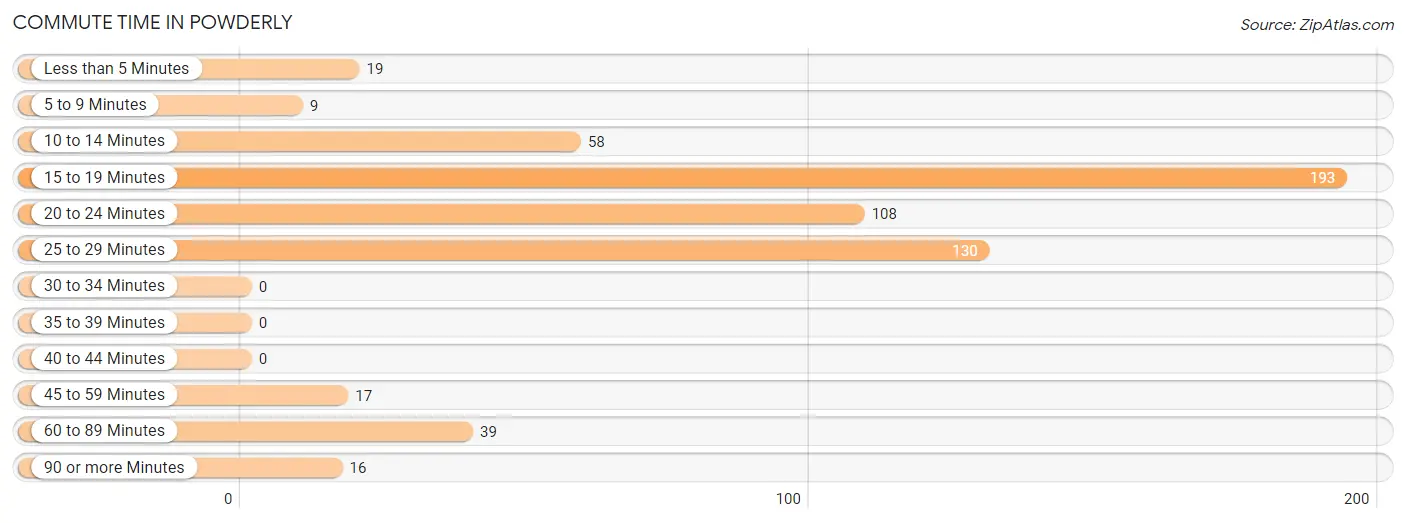
| Commute Time | # Commuters | % Commuters |
| Less than 5 Minutes | 19 | 3.2% |
| 5 to 9 Minutes | 9 | 1.5% |
| 10 to 14 Minutes | 58 | 9.9% |
| 15 to 19 Minutes | 193 | 32.8% |
| 20 to 24 Minutes | 108 | 18.3% |
| 25 to 29 Minutes | 130 | 22.1% |
| 30 to 34 Minutes | 0 | 0.0% |
| 35 to 39 Minutes | 0 | 0.0% |
| 40 to 44 Minutes | 0 | 0.0% |
| 45 to 59 Minutes | 17 | 2.9% |
| 60 to 89 Minutes | 39 | 6.6% |
| 90 or more Minutes | 16 | 2.7% |
Commute Time by Sex in Powderly
The most common commute times in Powderly are 25 to 29 minutes (66 commuters, 22.2%) for males and 15 to 19 minutes (132 commuters, 45.2%) for females.
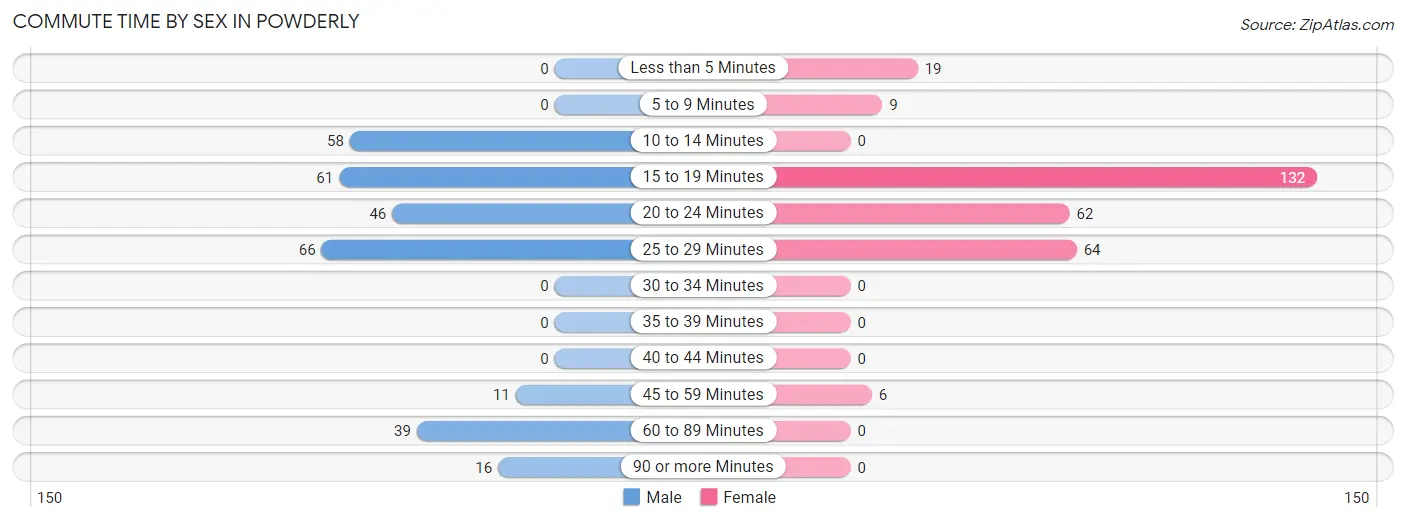
| Commute Time | Male | Female |
| Less than 5 Minutes | 0 (0.0%) | 19 (6.5%) |
| 5 to 9 Minutes | 0 (0.0%) | 9 (3.1%) |
| 10 to 14 Minutes | 58 (19.5%) | 0 (0.0%) |
| 15 to 19 Minutes | 61 (20.5%) | 132 (45.2%) |
| 20 to 24 Minutes | 46 (15.5%) | 62 (21.2%) |
| 25 to 29 Minutes | 66 (22.2%) | 64 (21.9%) |
| 30 to 34 Minutes | 0 (0.0%) | 0 (0.0%) |
| 35 to 39 Minutes | 0 (0.0%) | 0 (0.0%) |
| 40 to 44 Minutes | 0 (0.0%) | 0 (0.0%) |
| 45 to 59 Minutes | 11 (3.7%) | 6 (2.1%) |
| 60 to 89 Minutes | 39 (13.1%) | 0 (0.0%) |
| 90 or more Minutes | 16 (5.4%) | 0 (0.0%) |
Time of Departure to Work by Sex in Powderly
The most frequent times of departure to work in Powderly are 7:00 AM to 7:29 AM (83, 28.0%) for males and 7:00 AM to 7:29 AM (102, 34.9%) for females.
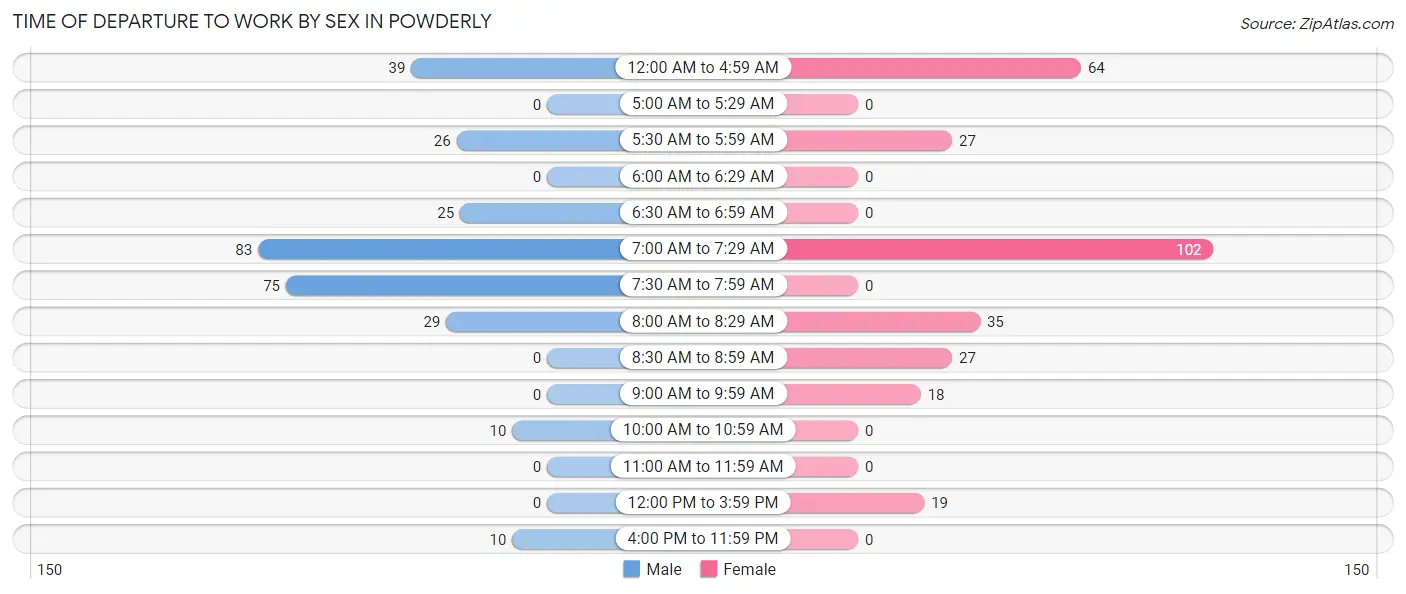
| Time of Departure | Male | Female |
| 12:00 AM to 4:59 AM | 39 (13.1%) | 64 (21.9%) |
| 5:00 AM to 5:29 AM | 0 (0.0%) | 0 (0.0%) |
| 5:30 AM to 5:59 AM | 26 (8.7%) | 27 (9.2%) |
| 6:00 AM to 6:29 AM | 0 (0.0%) | 0 (0.0%) |
| 6:30 AM to 6:59 AM | 25 (8.4%) | 0 (0.0%) |
| 7:00 AM to 7:29 AM | 83 (28.0%) | 102 (34.9%) |
| 7:30 AM to 7:59 AM | 75 (25.3%) | 0 (0.0%) |
| 8:00 AM to 8:29 AM | 29 (9.8%) | 35 (12.0%) |
| 8:30 AM to 8:59 AM | 0 (0.0%) | 27 (9.2%) |
| 9:00 AM to 9:59 AM | 0 (0.0%) | 18 (6.2%) |
| 10:00 AM to 10:59 AM | 10 (3.4%) | 0 (0.0%) |
| 11:00 AM to 11:59 AM | 0 (0.0%) | 0 (0.0%) |
| 12:00 PM to 3:59 PM | 0 (0.0%) | 19 (6.5%) |
| 4:00 PM to 11:59 PM | 10 (3.4%) | 0 (0.0%) |
| Total | 297 (100.0%) | 292 (100.0%) |
Housing Occupancy in Powderly
Occupancy by Ownership in Powderly
Of the total 505 dwellings in Powderly, owner-occupied units account for 495 (98.0%), while renter-occupied units make up 10 (2.0%).
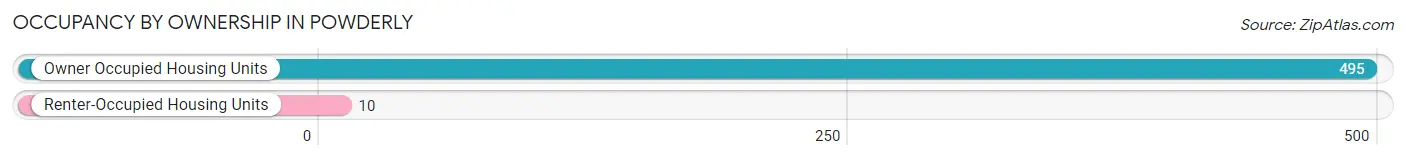
| Occupancy | # Housing Units | % Housing Units |
| Owner Occupied Housing Units | 495 | 98.0% |
| Renter-Occupied Housing Units | 10 | 2.0% |
| Total Occupied Housing Units | 505 | 100.0% |
Occupancy by Household Size in Powderly
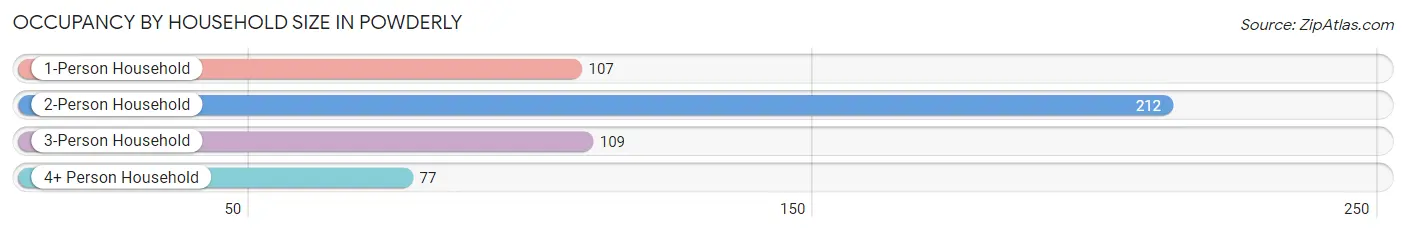
| Household Size | # Housing Units | % Housing Units |
| 1-Person Household | 107 | 21.2% |
| 2-Person Household | 212 | 42.0% |
| 3-Person Household | 109 | 21.6% |
| 4+ Person Household | 77 | 15.2% |
| Total Housing Units | 505 | 100.0% |
Occupancy by Ownership by Household Size in Powderly
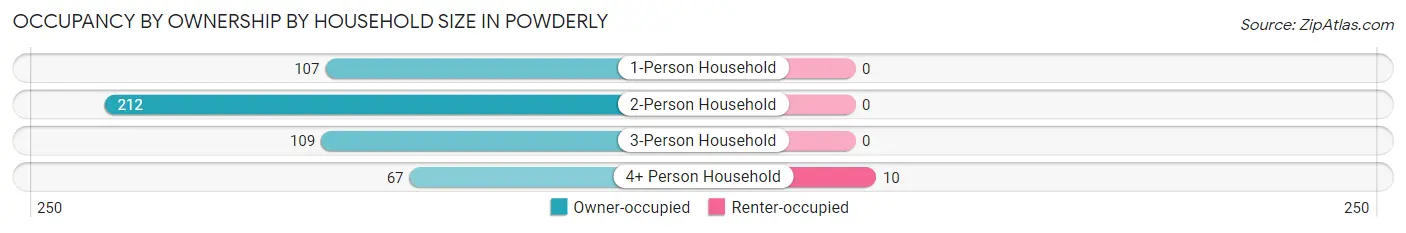
| Household Size | Owner-occupied | Renter-occupied |
| 1-Person Household | 107 (100.0%) | 0 (0.0%) |
| 2-Person Household | 212 (100.0%) | 0 (0.0%) |
| 3-Person Household | 109 (100.0%) | 0 (0.0%) |
| 4+ Person Household | 67 (87.0%) | 10 (13.0%) |
| Total Housing Units | 495 (98.0%) | 10 (2.0%) |
Occupancy by Educational Attainment in Powderly
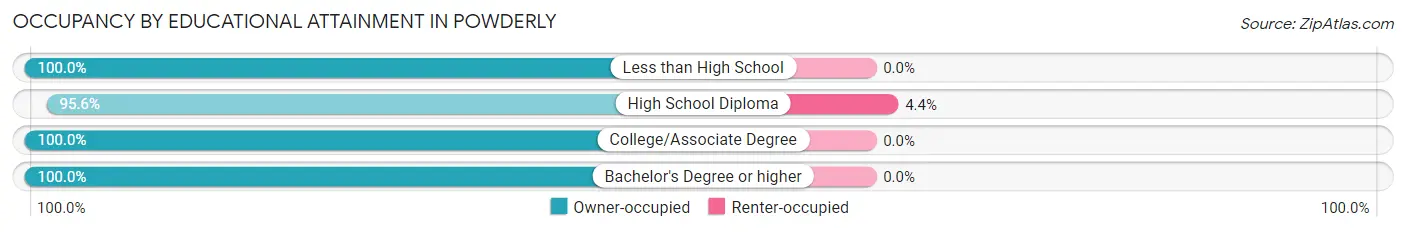
| Household Size | Owner-occupied | Renter-occupied |
| Less than High School | 38 (100.0%) | 0 (0.0%) |
| High School Diploma | 219 (95.6%) | 10 (4.4%) |
| College/Associate Degree | 169 (100.0%) | 0 (0.0%) |
| Bachelor's Degree or higher | 69 (100.0%) | 0 (0.0%) |
Occupancy by Age of Householder in Powderly
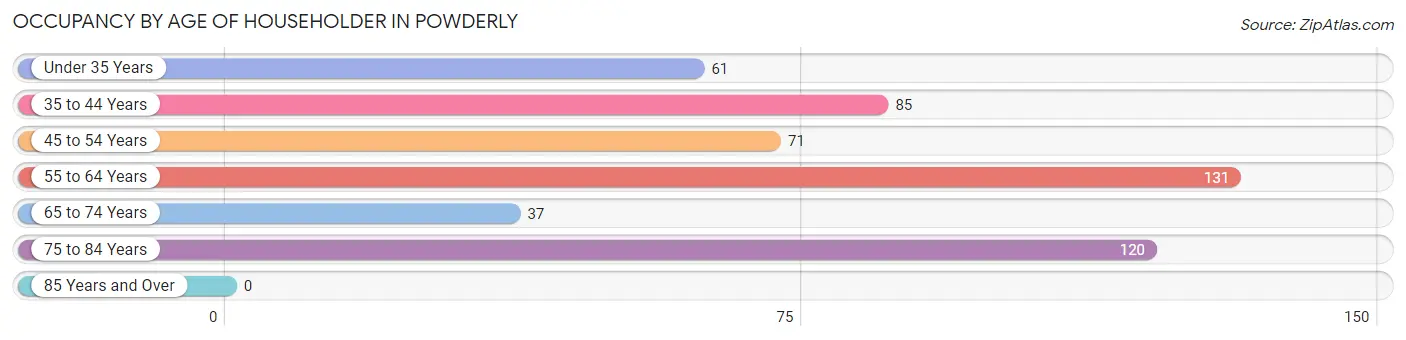
| Age Bracket | # Households | % Households |
| Under 35 Years | 61 | 12.1% |
| 35 to 44 Years | 85 | 16.8% |
| 45 to 54 Years | 71 | 14.1% |
| 55 to 64 Years | 131 | 25.9% |
| 65 to 74 Years | 37 | 7.3% |
| 75 to 84 Years | 120 | 23.8% |
| 85 Years and Over | 0 | 0.0% |
| Total | 505 | 100.0% |
Housing Finances in Powderly
Median Income by Occupancy in Powderly
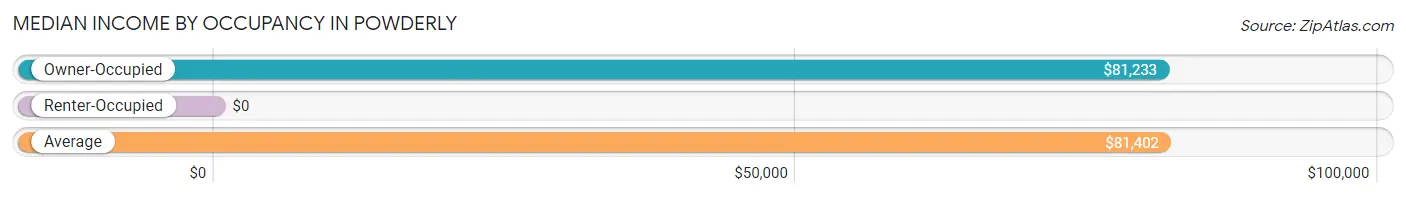
| Occupancy Type | # Households | Median Income |
| Owner-Occupied | 495 (98.0%) | $81,233 |
| Renter-Occupied | 10 (2.0%) | $0 |
| Average | 505 (100.0%) | $81,402 |
Occupancy by Householder Income Bracket in Powderly
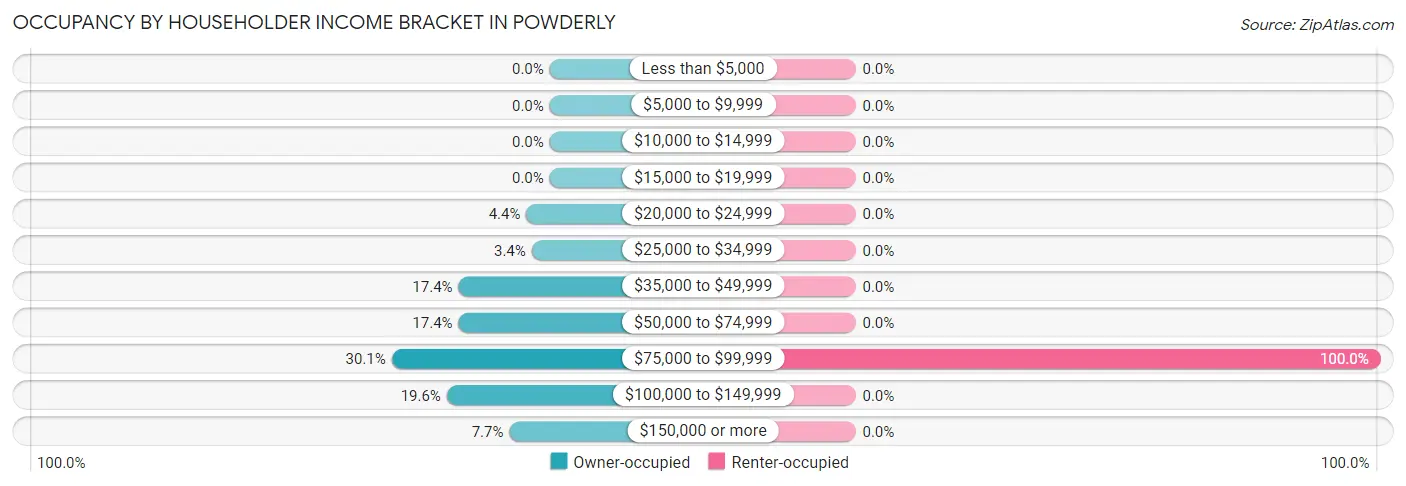
| Income Bracket | Owner-occupied | Renter-occupied |
| Less than $5,000 | 0 (0.0%) | 0 (0.0%) |
| $5,000 to $9,999 | 0 (0.0%) | 0 (0.0%) |
| $10,000 to $14,999 | 0 (0.0%) | 0 (0.0%) |
| $15,000 to $19,999 | 0 (0.0%) | 0 (0.0%) |
| $20,000 to $24,999 | 22 (4.4%) | 0 (0.0%) |
| $25,000 to $34,999 | 17 (3.4%) | 0 (0.0%) |
| $35,000 to $49,999 | 86 (17.4%) | 0 (0.0%) |
| $50,000 to $74,999 | 86 (17.4%) | 0 (0.0%) |
| $75,000 to $99,999 | 149 (30.1%) | 10 (100.0%) |
| $100,000 to $149,999 | 97 (19.6%) | 0 (0.0%) |
| $150,000 or more | 38 (7.7%) | 0 (0.0%) |
| Total | 495 (100.0%) | 10 (100.0%) |
Monthly Housing Cost Tiers in Powderly
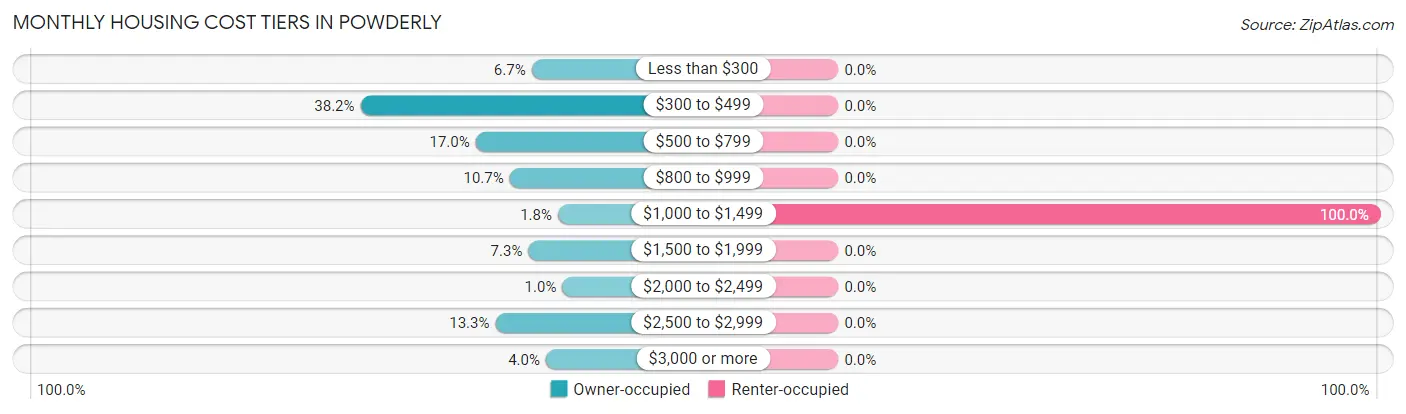
| Monthly Cost | Owner-occupied | Renter-occupied |
| Less than $300 | 33 (6.7%) | 0 (0.0%) |
| $300 to $499 | 189 (38.2%) | 0 (0.0%) |
| $500 to $799 | 84 (17.0%) | 0 (0.0%) |
| $800 to $999 | 53 (10.7%) | 0 (0.0%) |
| $1,000 to $1,499 | 9 (1.8%) | 10 (100.0%) |
| $1,500 to $1,999 | 36 (7.3%) | 0 (0.0%) |
| $2,000 to $2,499 | 5 (1.0%) | 0 (0.0%) |
| $2,500 to $2,999 | 66 (13.3%) | 0 (0.0%) |
| $3,000 or more | 20 (4.0%) | 0 (0.0%) |
| Total | 495 (100.0%) | 10 (100.0%) |
Physical Housing Characteristics in Powderly
Housing Structures in Powderly
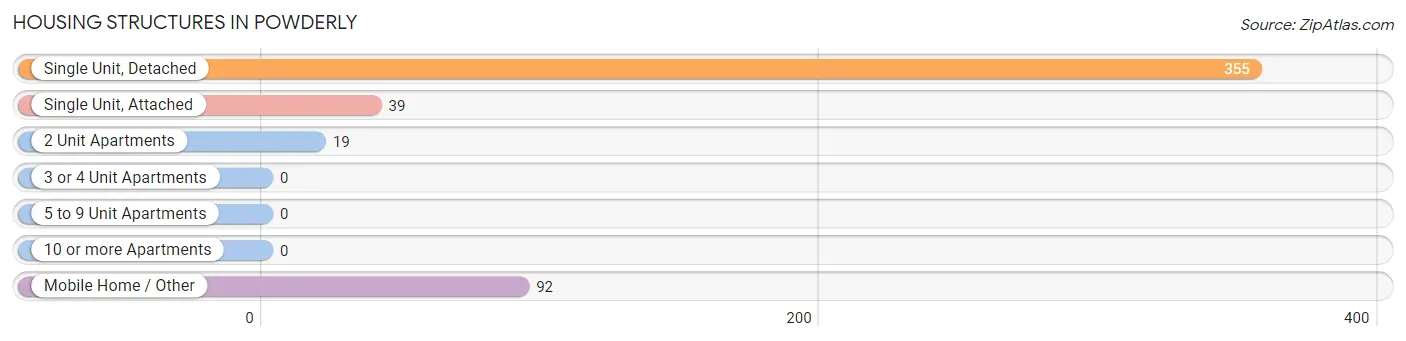
| Structure Type | # Housing Units | % Housing Units |
| Single Unit, Detached | 355 | 70.3% |
| Single Unit, Attached | 39 | 7.7% |
| 2 Unit Apartments | 19 | 3.8% |
| 3 or 4 Unit Apartments | 0 | 0.0% |
| 5 to 9 Unit Apartments | 0 | 0.0% |
| 10 or more Apartments | 0 | 0.0% |
| Mobile Home / Other | 92 | 18.2% |
| Total | 505 | 100.0% |
Housing Structures by Occupancy in Powderly
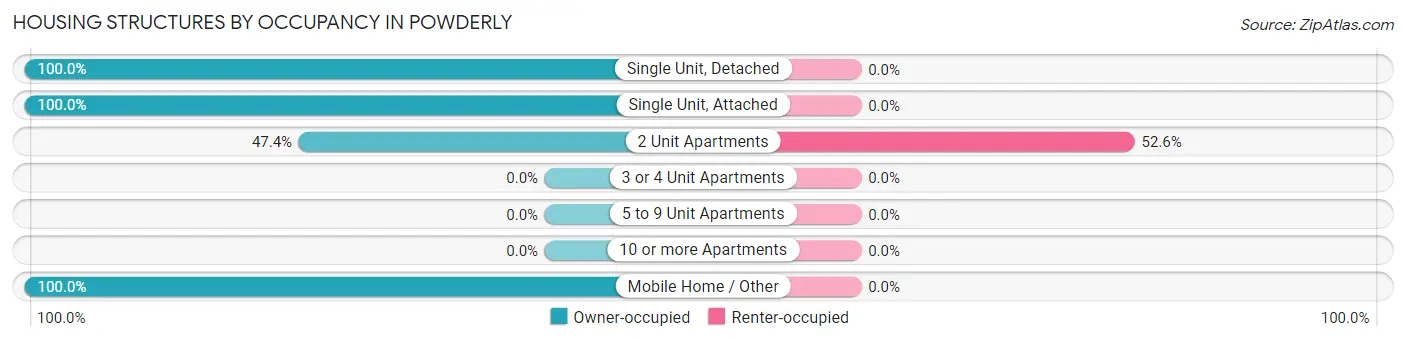
| Structure Type | Owner-occupied | Renter-occupied |
| Single Unit, Detached | 355 (100.0%) | 0 (0.0%) |
| Single Unit, Attached | 39 (100.0%) | 0 (0.0%) |
| 2 Unit Apartments | 9 (47.4%) | 10 (52.6%) |
| 3 or 4 Unit Apartments | 0 (0.0%) | 0 (0.0%) |
| 5 to 9 Unit Apartments | 0 (0.0%) | 0 (0.0%) |
| 10 or more Apartments | 0 (0.0%) | 0 (0.0%) |
| Mobile Home / Other | 92 (100.0%) | 0 (0.0%) |
| Total | 495 (98.0%) | 10 (2.0%) |
Housing Structures by Number of Rooms in Powderly
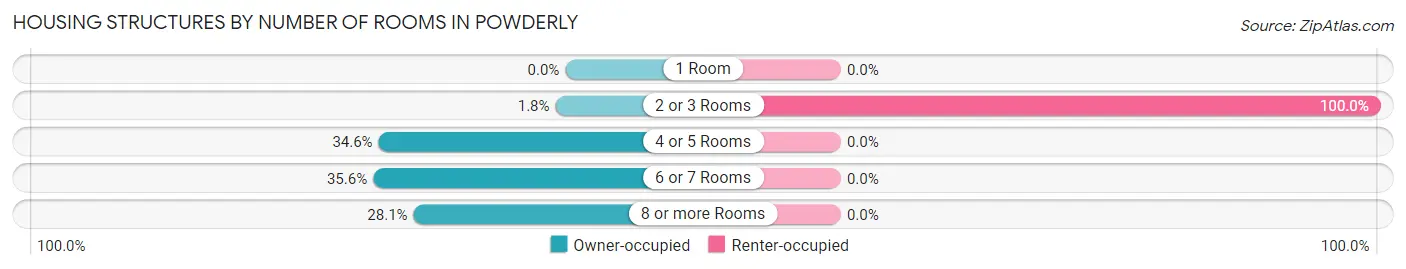
| Number of Rooms | Owner-occupied | Renter-occupied |
| 1 Room | 0 (0.0%) | 0 (0.0%) |
| 2 or 3 Rooms | 9 (1.8%) | 10 (100.0%) |
| 4 or 5 Rooms | 171 (34.5%) | 0 (0.0%) |
| 6 or 7 Rooms | 176 (35.6%) | 0 (0.0%) |
| 8 or more Rooms | 139 (28.1%) | 0 (0.0%) |
| Total | 495 (100.0%) | 10 (100.0%) |
Housing Structure by Heating Type in Powderly
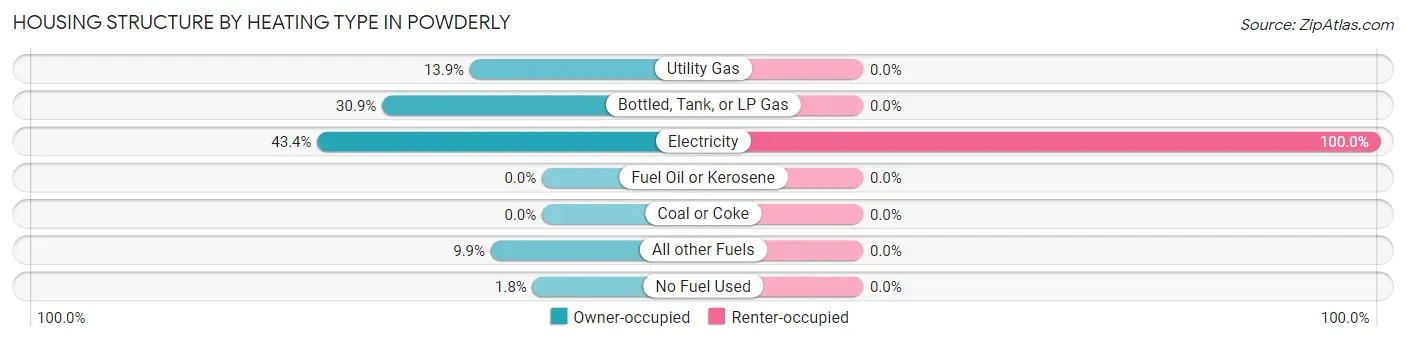
| Heating Type | Owner-occupied | Renter-occupied |
| Utility Gas | 69 (13.9%) | 0 (0.0%) |
| Bottled, Tank, or LP Gas | 153 (30.9%) | 0 (0.0%) |
| Electricity | 215 (43.4%) | 10 (100.0%) |
| Fuel Oil or Kerosene | 0 (0.0%) | 0 (0.0%) |
| Coal or Coke | 0 (0.0%) | 0 (0.0%) |
| All other Fuels | 49 (9.9%) | 0 (0.0%) |
| No Fuel Used | 9 (1.8%) | 0 (0.0%) |
| Total | 495 (100.0%) | 10 (100.0%) |
Household Vehicle Usage in Powderly
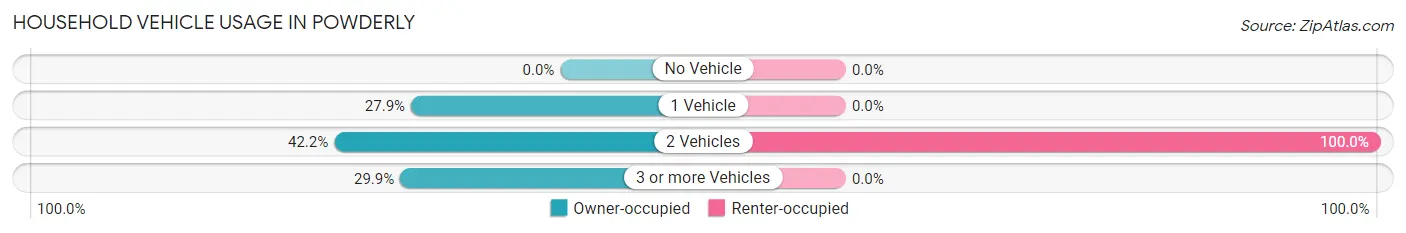
| Vehicles per Household | Owner-occupied | Renter-occupied |
| No Vehicle | 0 (0.0%) | 0 (0.0%) |
| 1 Vehicle | 138 (27.9%) | 0 (0.0%) |
| 2 Vehicles | 209 (42.2%) | 10 (100.0%) |
| 3 or more Vehicles | 148 (29.9%) | 0 (0.0%) |
| Total | 495 (100.0%) | 10 (100.0%) |
Real Estate & Mortgages in Powderly
Real Estate and Mortgage Overview in Powderly
| Characteristic | Without Mortgage | With Mortgage |
| Housing Units | 341 | 154 |
| Median Property Value | $96,500 | $526,200 |
| Median Household Income | $67,313 | $38 |
| Monthly Housing Costs | $468 | $20 |
| Real Estate Taxes | $909 | $9 |
Property Value by Mortgage Status in Powderly
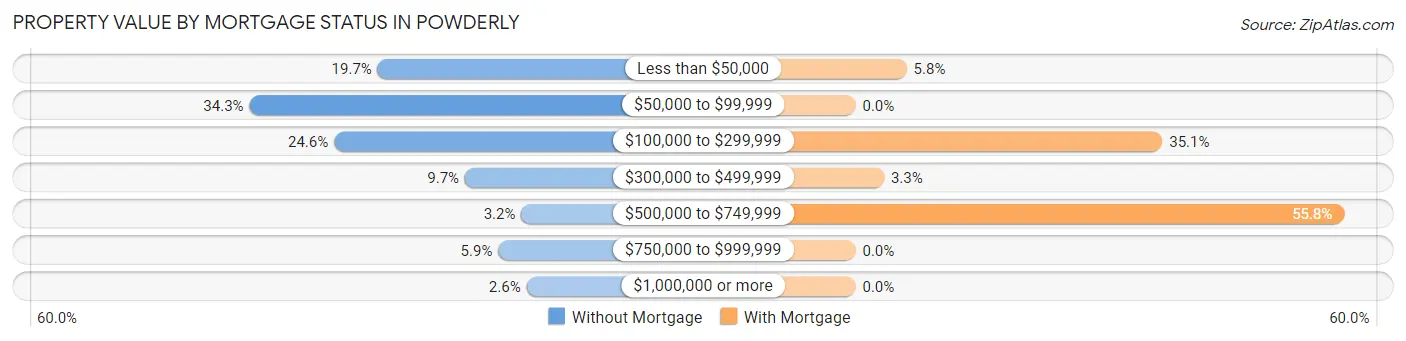
| Property Value | Without Mortgage | With Mortgage |
| Less than $50,000 | 67 (19.7%) | 9 (5.8%) |
| $50,000 to $99,999 | 117 (34.3%) | 0 (0.0%) |
| $100,000 to $299,999 | 84 (24.6%) | 54 (35.1%) |
| $300,000 to $499,999 | 33 (9.7%) | 5 (3.3%) |
| $500,000 to $749,999 | 11 (3.2%) | 86 (55.8%) |
| $750,000 to $999,999 | 20 (5.9%) | 0 (0.0%) |
| $1,000,000 or more | 9 (2.6%) | 0 (0.0%) |
| Total | 341 (100.0%) | 154 (100.0%) |
Household Income by Mortgage Status in Powderly
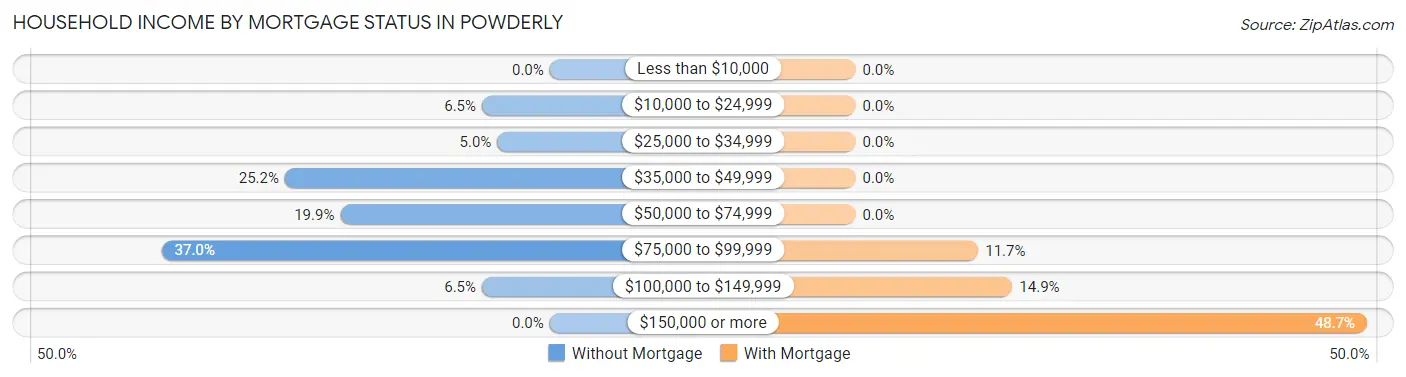
| Household Income | Without Mortgage | With Mortgage |
| Less than $10,000 | 0 (0.0%) | 0 (0.0%) |
| $10,000 to $24,999 | 22 (6.5%) | 0 (0.0%) |
| $25,000 to $34,999 | 17 (5.0%) | 0 (0.0%) |
| $35,000 to $49,999 | 86 (25.2%) | 0 (0.0%) |
| $50,000 to $74,999 | 68 (19.9%) | 0 (0.0%) |
| $75,000 to $99,999 | 126 (36.9%) | 18 (11.7%) |
| $100,000 to $149,999 | 22 (6.5%) | 23 (14.9%) |
| $150,000 or more | 0 (0.0%) | 75 (48.7%) |
| Total | 341 (100.0%) | 154 (100.0%) |
Property Value to Household Income Ratio in Powderly
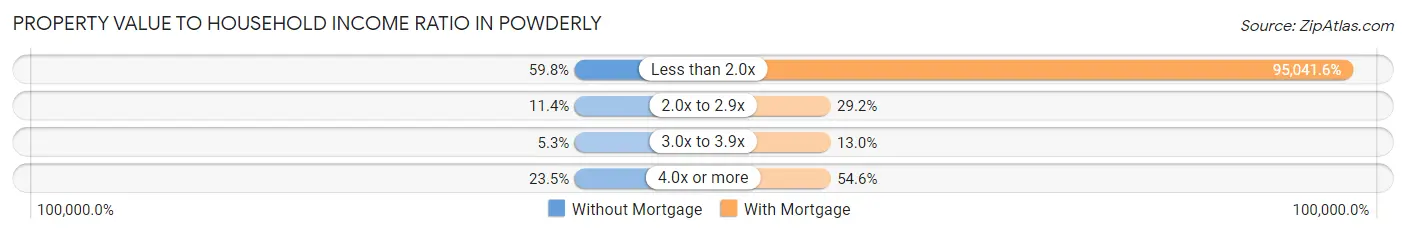
| Value-to-Income Ratio | Without Mortgage | With Mortgage |
| Less than 2.0x | 204 (59.8%) | 146,364 (95,041.6%) |
| 2.0x to 2.9x | 39 (11.4%) | 45 (29.2%) |
| 3.0x to 3.9x | 18 (5.3%) | 20 (13.0%) |
| 4.0x or more | 80 (23.5%) | 84 (54.5%) |
| Total | 341 (100.0%) | 154 (100.0%) |
Real Estate Taxes by Mortgage Status in Powderly
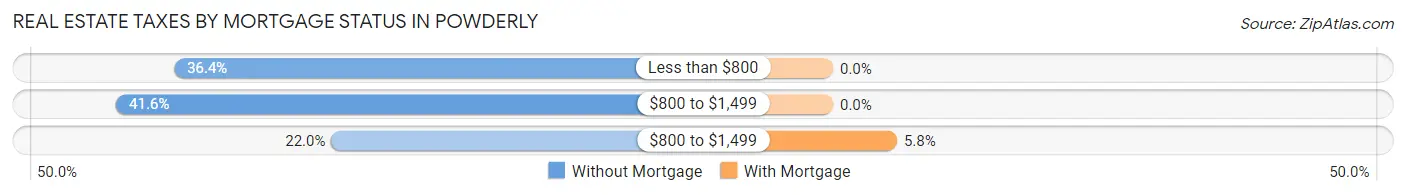
| Property Taxes | Without Mortgage | With Mortgage |
| Less than $800 | 124 (36.4%) | 0 (0.0%) |
| $800 to $1,499 | 142 (41.6%) | 0 (0.0%) |
| $800 to $1,499 | 75 (22.0%) | 9 (5.8%) |
| Total | 341 (100.0%) | 154 (100.0%) |
Health & Disability in Powderly
Health Insurance Coverage by Age in Powderly
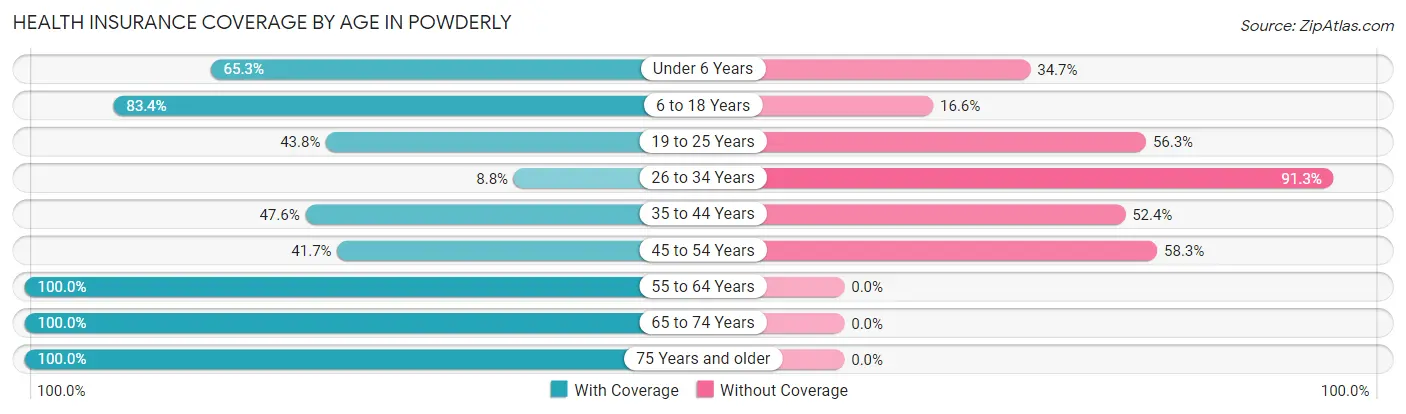
| Age Bracket | With Coverage | Without Coverage |
| Under 6 Years | 32 (65.3%) | 17 (34.7%) |
| 6 to 18 Years | 136 (83.4%) | 27 (16.6%) |
| 19 to 25 Years | 7 (43.8%) | 9 (56.2%) |
| 26 to 34 Years | 23 (8.7%) | 240 (91.2%) |
| 35 to 44 Years | 70 (47.6%) | 77 (52.4%) |
| 45 to 54 Years | 60 (41.7%) | 84 (58.3%) |
| 55 to 64 Years | 198 (100.0%) | 0 (0.0%) |
| 65 to 74 Years | 124 (100.0%) | 0 (0.0%) |
| 75 Years and older | 147 (100.0%) | 0 (0.0%) |
| Total | 797 (63.7%) | 454 (36.3%) |
Health Insurance Coverage by Citizenship Status in Powderly
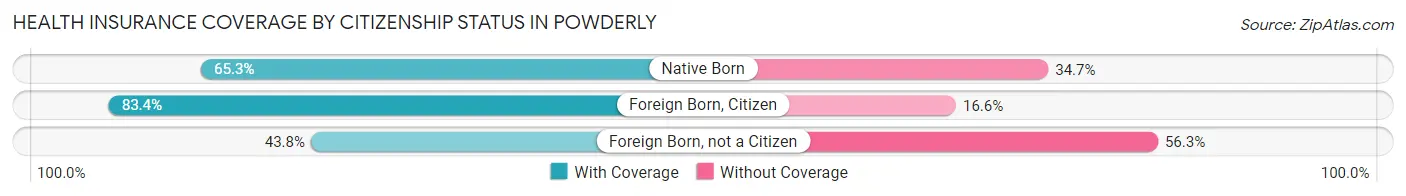
| Citizenship Status | With Coverage | Without Coverage |
| Native Born | 32 (65.3%) | 17 (34.7%) |
| Foreign Born, Citizen | 136 (83.4%) | 27 (16.6%) |
| Foreign Born, not a Citizen | 7 (43.8%) | 9 (56.2%) |
Health Insurance Coverage by Household Income in Powderly
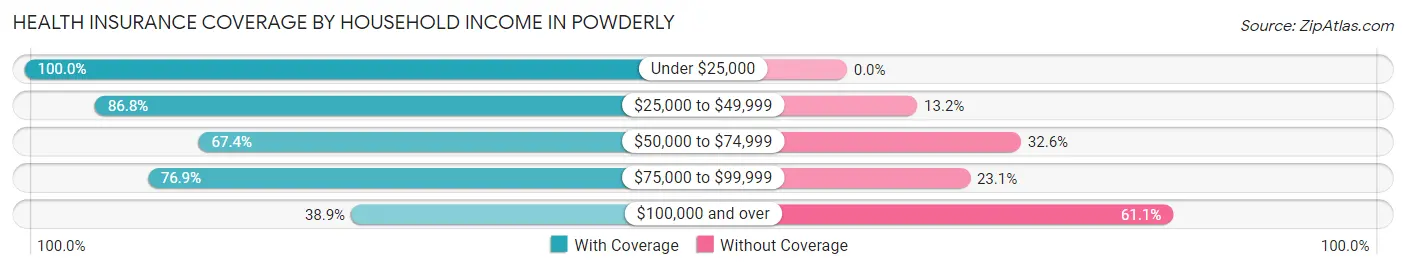
| Household Income | With Coverage | Without Coverage |
| Under $25,000 | 22 (100.0%) | 0 (0.0%) |
| $25,000 to $49,999 | 191 (86.8%) | 29 (13.2%) |
| $50,000 to $74,999 | 126 (67.4%) | 61 (32.6%) |
| $75,000 to $99,999 | 280 (76.9%) | 84 (23.1%) |
| $100,000 and over | 178 (38.9%) | 280 (61.1%) |
Public vs Private Health Insurance Coverage by Age in Powderly
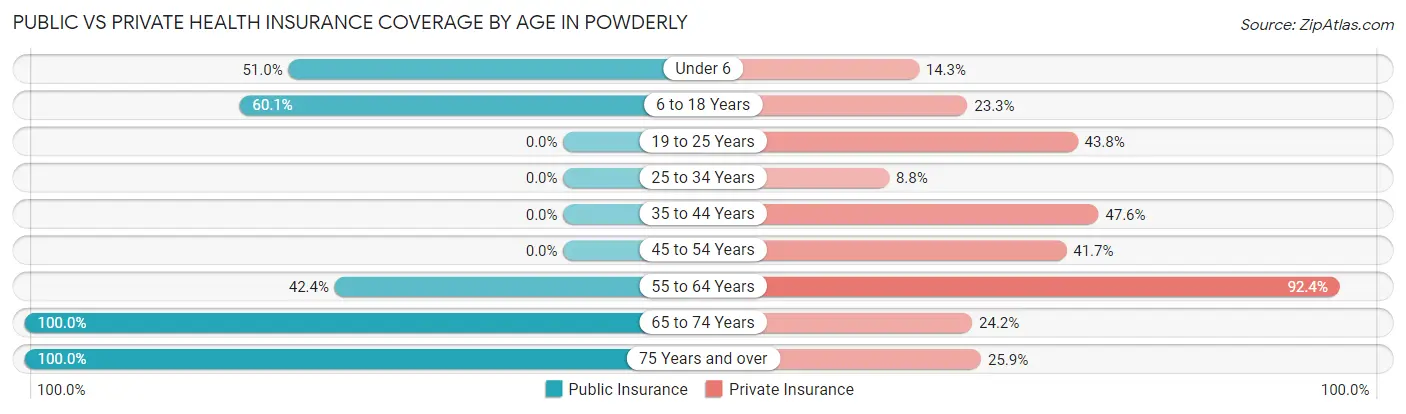
| Age Bracket | Public Insurance | Private Insurance |
| Under 6 | 25 (51.0%) | 7 (14.3%) |
| 6 to 18 Years | 98 (60.1%) | 38 (23.3%) |
| 19 to 25 Years | 0 (0.0%) | 7 (43.8%) |
| 25 to 34 Years | 0 (0.0%) | 23 (8.7%) |
| 35 to 44 Years | 0 (0.0%) | 70 (47.6%) |
| 45 to 54 Years | 0 (0.0%) | 60 (41.7%) |
| 55 to 64 Years | 84 (42.4%) | 183 (92.4%) |
| 65 to 74 Years | 124 (100.0%) | 30 (24.2%) |
| 75 Years and over | 147 (100.0%) | 38 (25.9%) |
| Total | 478 (38.2%) | 456 (36.4%) |
Disability Status by Sex by Age in Powderly
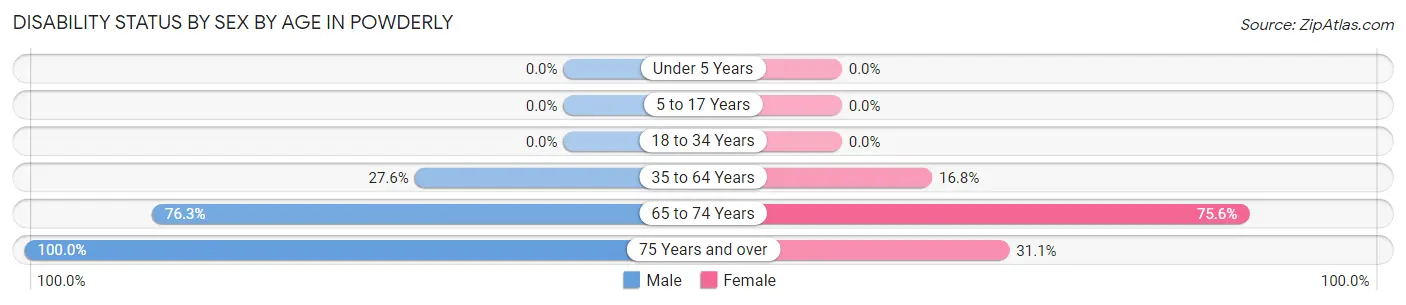
| Age Bracket | Male | Female |
| Under 5 Years | 0 (0.0%) | 0 (0.0%) |
| 5 to 17 Years | 0 (0.0%) | 0 (0.0%) |
| 18 to 34 Years | 0 (0.0%) | 0 (0.0%) |
| 35 to 64 Years | 79 (27.6%) | 34 (16.8%) |
| 65 to 74 Years | 29 (76.3%) | 65 (75.6%) |
| 75 Years and over | 57 (100.0%) | 28 (31.1%) |
Disability Class by Sex by Age in Powderly
Disability Class: Hearing Difficulty
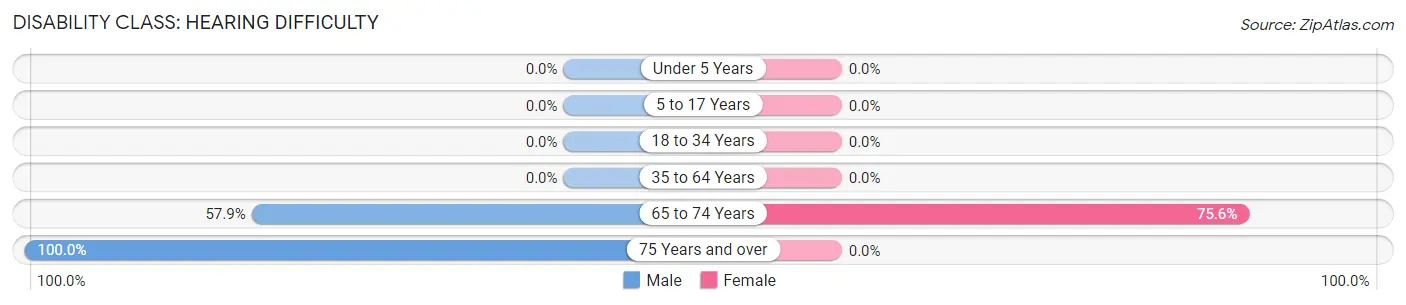
| Age Bracket | Male | Female |
| Under 5 Years | 0 (0.0%) | 0 (0.0%) |
| 5 to 17 Years | 0 (0.0%) | 0 (0.0%) |
| 18 to 34 Years | 0 (0.0%) | 0 (0.0%) |
| 35 to 64 Years | 0 (0.0%) | 0 (0.0%) |
| 65 to 74 Years | 22 (57.9%) | 65 (75.6%) |
| 75 Years and over | 57 (100.0%) | 0 (0.0%) |
Disability Class: Vision Difficulty
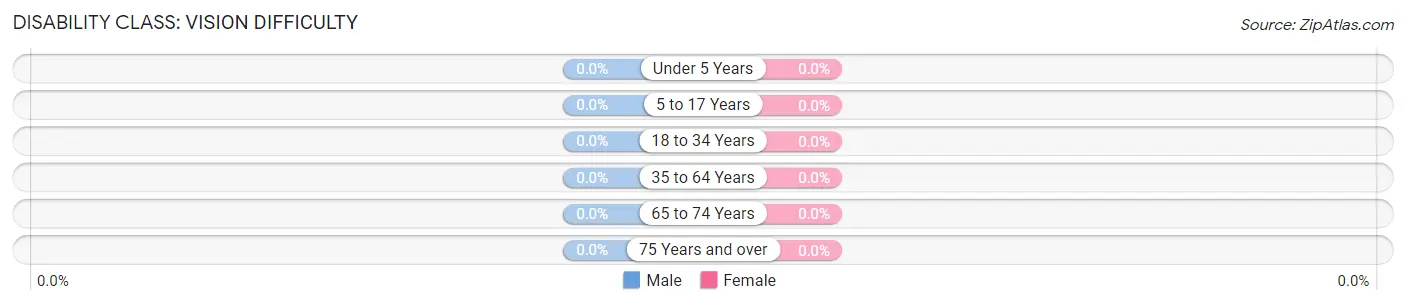
| Age Bracket | Male | Female |
| Under 5 Years | 0 (0.0%) | 0 (0.0%) |
| 5 to 17 Years | 0 (0.0%) | 0 (0.0%) |
| 18 to 34 Years | 0 (0.0%) | 0 (0.0%) |
| 35 to 64 Years | 0 (0.0%) | 0 (0.0%) |
| 65 to 74 Years | 0 (0.0%) | 0 (0.0%) |
| 75 Years and over | 0 (0.0%) | 0 (0.0%) |
Disability Class: Cognitive Difficulty
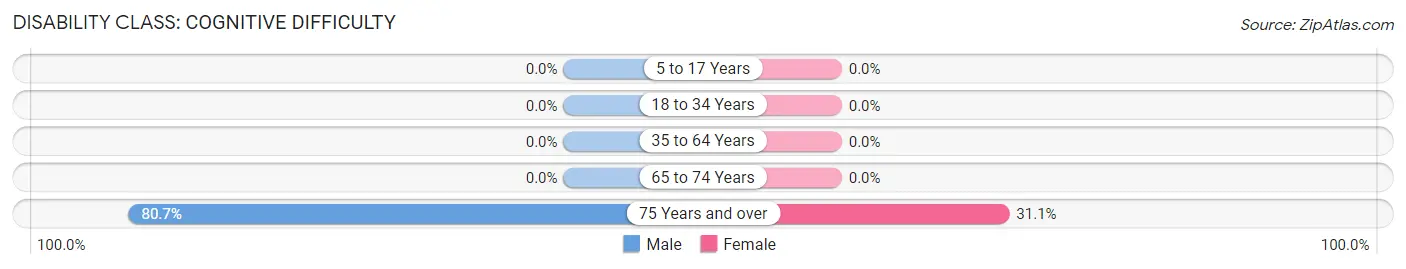
| Age Bracket | Male | Female |
| 5 to 17 Years | 0 (0.0%) | 0 (0.0%) |
| 18 to 34 Years | 0 (0.0%) | 0 (0.0%) |
| 35 to 64 Years | 0 (0.0%) | 0 (0.0%) |
| 65 to 74 Years | 0 (0.0%) | 0 (0.0%) |
| 75 Years and over | 46 (80.7%) | 28 (31.1%) |
Disability Class: Ambulatory Difficulty
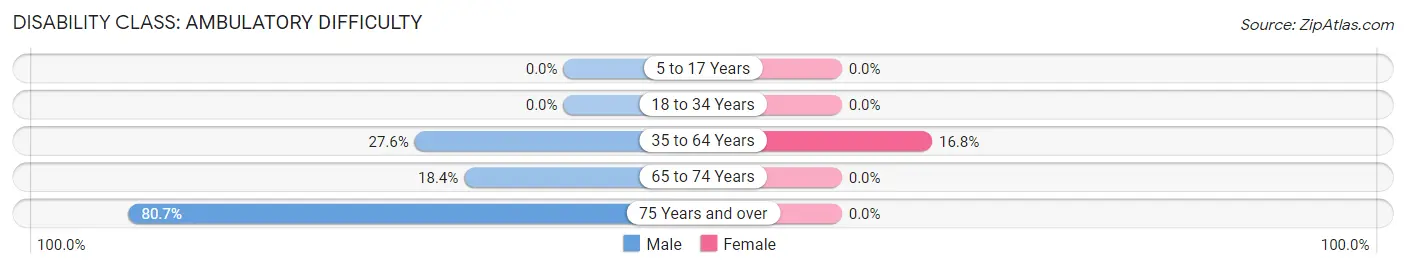
| Age Bracket | Male | Female |
| 5 to 17 Years | 0 (0.0%) | 0 (0.0%) |
| 18 to 34 Years | 0 (0.0%) | 0 (0.0%) |
| 35 to 64 Years | 79 (27.6%) | 34 (16.8%) |
| 65 to 74 Years | 7 (18.4%) | 0 (0.0%) |
| 75 Years and over | 46 (80.7%) | 0 (0.0%) |
Disability Class: Self-Care Difficulty
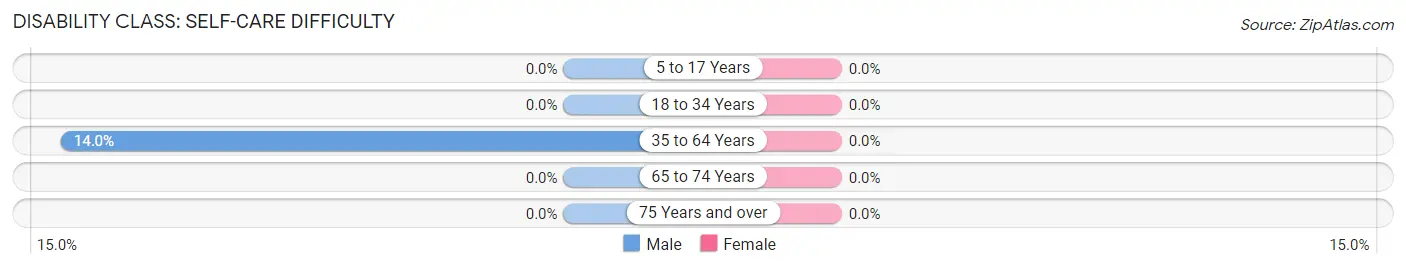
| Age Bracket | Male | Female |
| 5 to 17 Years | 0 (0.0%) | 0 (0.0%) |
| 18 to 34 Years | 0 (0.0%) | 0 (0.0%) |
| 35 to 64 Years | 40 (14.0%) | 0 (0.0%) |
| 65 to 74 Years | 0 (0.0%) | 0 (0.0%) |
| 75 Years and over | 0 (0.0%) | 0 (0.0%) |
Technology Access in Powderly
Computing Device Access in Powderly
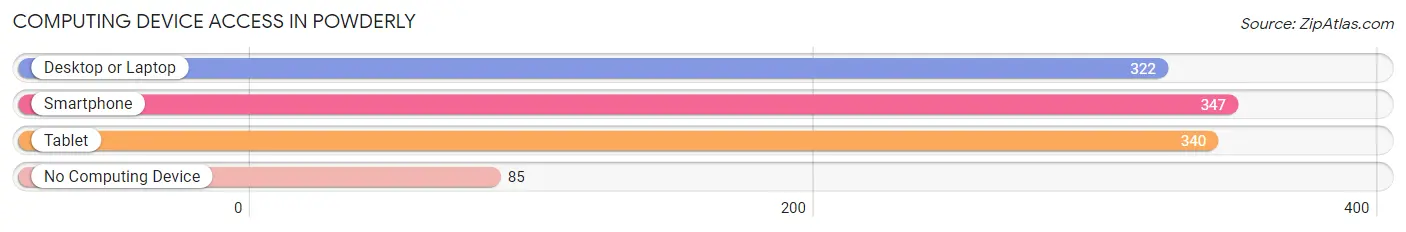
| Device Type | # Households | % Households |
| Desktop or Laptop | 322 | 63.8% |
| Smartphone | 347 | 68.7% |
| Tablet | 340 | 67.3% |
| No Computing Device | 85 | 16.8% |
| Total | 505 | 100.0% |
Internet Access in Powderly
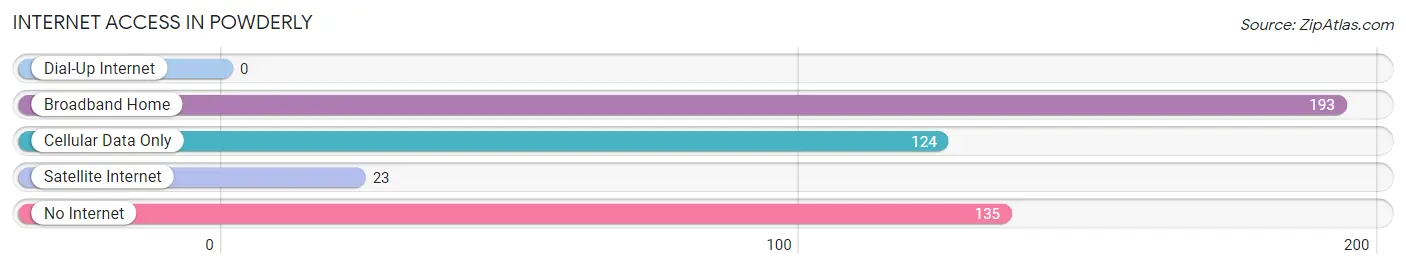
| Internet Type | # Households | % Households |
| Dial-Up Internet | 0 | 0.0% |
| Broadband Home | 193 | 38.2% |
| Cellular Data Only | 124 | 24.5% |
| Satellite Internet | 23 | 4.5% |
| No Internet | 135 | 26.7% |
| Total | 505 | 100.0% |
Powderly Summary
Powderly is a small town located in Lamar County, Texas, United States. It is situated on the western edge of the county, approximately 10 miles south of Paris, the county seat. The population of Powderly was estimated to be 545 in the year 2000.
History
Powderly was founded in 1887 by the Texas and Pacific Railway. The town was named after Terence V. Powderly, a labor leader and former mayor of Scranton, Pennsylvania. The town was incorporated in 1891 and was home to a variety of businesses, including a cotton gin, a blacksmith shop, a general store, and a hotel.
In the early 1900s, the town was a thriving agricultural center, with cotton, corn, and wheat being the main crops. The town also had a number of churches, including the First Baptist Church, which was established in 1891.
In the 1920s, the town began to decline as the railroad industry began to decline. The Great Depression further exacerbated the town's decline, and by the 1940s, the population had dropped to just over 200.
Geography
Powderly is located in Lamar County, Texas, approximately 10 miles south of Paris, the county seat. The town is situated on the western edge of the county, near the Red River. The terrain is mostly flat, with some rolling hills in the area. The climate is humid subtropical, with hot summers and mild winters.
Economy
The economy of Powderly is largely based on agriculture. Cotton, corn, and wheat are the main crops grown in the area. The town also has a number of small businesses, including a grocery store, a hardware store, and a few restaurants.
Demographics
As of the 2000 census, the population of Powderly was 545. The racial makeup of the town was 97.3% White, 0.7% African American, 0.2% Native American, 0.2% Asian, 0.2% from other races, and 1.6% from two or more races. Hispanic or Latino of any race were 1.3% of the population.
The median income for a household in the town was $30,000, and the median income for a family was $35,000. The per capita income for the town was $14,000. About 15.7% of families and 18.2% of the population were below the poverty line, including 25.0% of those under age 18 and 10.7% of those age 65 or over.
Conclusion
Powderly is a small town located in Lamar County, Texas, United States. It was founded in 1887 and was once a thriving agricultural center. The town has since declined, and the population was estimated to be 545 in the year 2000. The economy of Powderly is largely based on agriculture, with cotton, corn, and wheat being the main crops. The racial makeup of the town is mostly White, with a small percentage of African American, Native American, Asian, and other races. The median income for a household in the town was $30,000, and the median income for a family was $35,000.
Common Questions
What is Per Capita Income in Powderly?
Per Capita income in Powderly is $37,693.
What is the Median Family Income in Powderly?
Median Family Income in Powderly is $82,750.
What is the Median Household income in Powderly?
Median Household Income in Powderly is $81,402.
What is Income or Wage Gap in Powderly?
Income or Wage Gap in Powderly is 12.0%.
Women in Powderly earn 88.0 cents for every dollar earned by a man.
What is Inequality or Gini Index in Powderly?
Inequality or Gini Index in Powderly is 0.31.
What is the Total Population of Powderly?
Total Population of Powderly is 1,251.
What is the Total Male Population of Powderly?
Total Male Population of Powderly is 616.
What is the Total Female Population of Powderly?
Total Female Population of Powderly is 635.
What is the Ratio of Males per 100 Females in Powderly?
There are 97.01 Males per 100 Females in Powderly.
What is the Ratio of Females per 100 Males in Powderly?
There are 103.08 Females per 100 Males in Powderly.
What is the Median Population Age in Powderly?
Median Population Age in Powderly is 44.5 Years.
What is the Average Family Size in Powderly
Average Family Size in Powderly is 2.9 People.
What is the Average Household Size in Powderly
Average Household Size in Powderly is 2.5 People.
How Large is the Labor Force in Powderly?
There are 648 People in the Labor Forcein in Powderly.
What is the Percentage of People in the Labor Force in Powderly?
62.4% of People are in the Labor Force in Powderly.
What is the Unemployment Rate in Powderly?
Unemployment Rate in Powderly is 5.7%.