Ravenna, TX Map & Demographics
Ravenna Map
Ravenna Overview
$45,778
PER CAPITA INCOME
$88,750
AVG FAMILY INCOME
$82,596
AVG HOUSEHOLD INCOME
0.61
INEQUALITY / GINI INDEX
196
TOTAL POPULATION
90
MALE POPULATION
106
FEMALE POPULATION
84.91
MALES / 100 FEMALES
117.78
FEMALES / 100 MALES
46.0
MEDIAN AGE
3.0
AVG FAMILY SIZE
2.2
AVG HOUSEHOLD SIZE
102
LABOR FORCE [ PEOPLE ]
68.0%
PERCENT IN LABOR FORCE
2.9%
UNEMPLOYMENT RATE
Ravenna Zip Codes
Ravenna Area Codes
Income in Ravenna
Income Overview in Ravenna
Per Capita Income in Ravenna is $45,778, while median incomes of families and households are $88,750 and $82,596 respectively.
| Characteristic | Number | Measure |
| Per Capita Income | 196 | $45,778 |
| Median Family Income | 54 | $88,750 |
| Mean Family Income | 54 | $187,602 |
| Median Household Income | 87 | $82,596 |
| Mean Household Income | 87 | $126,599 |
| Income Deficit | 54 | $0 |
| Wage / Income Gap (%) | 196 | 0.00% |
| Wage / Income Gap ($) | 196 | 100.00¢ per $1 |
| Gini / Inequality Index | 196 | 0.61 |
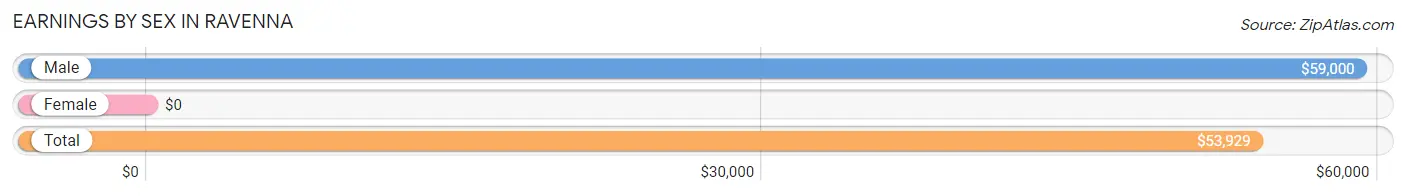
Earnings by Sex in Ravenna
| Sex | Number | Average Earnings |
| Male | 50 (47.2%) | $59,000 |
| Female | 56 (52.8%) | $0 |
| Total | 106 (100.0%) | $53,929 |
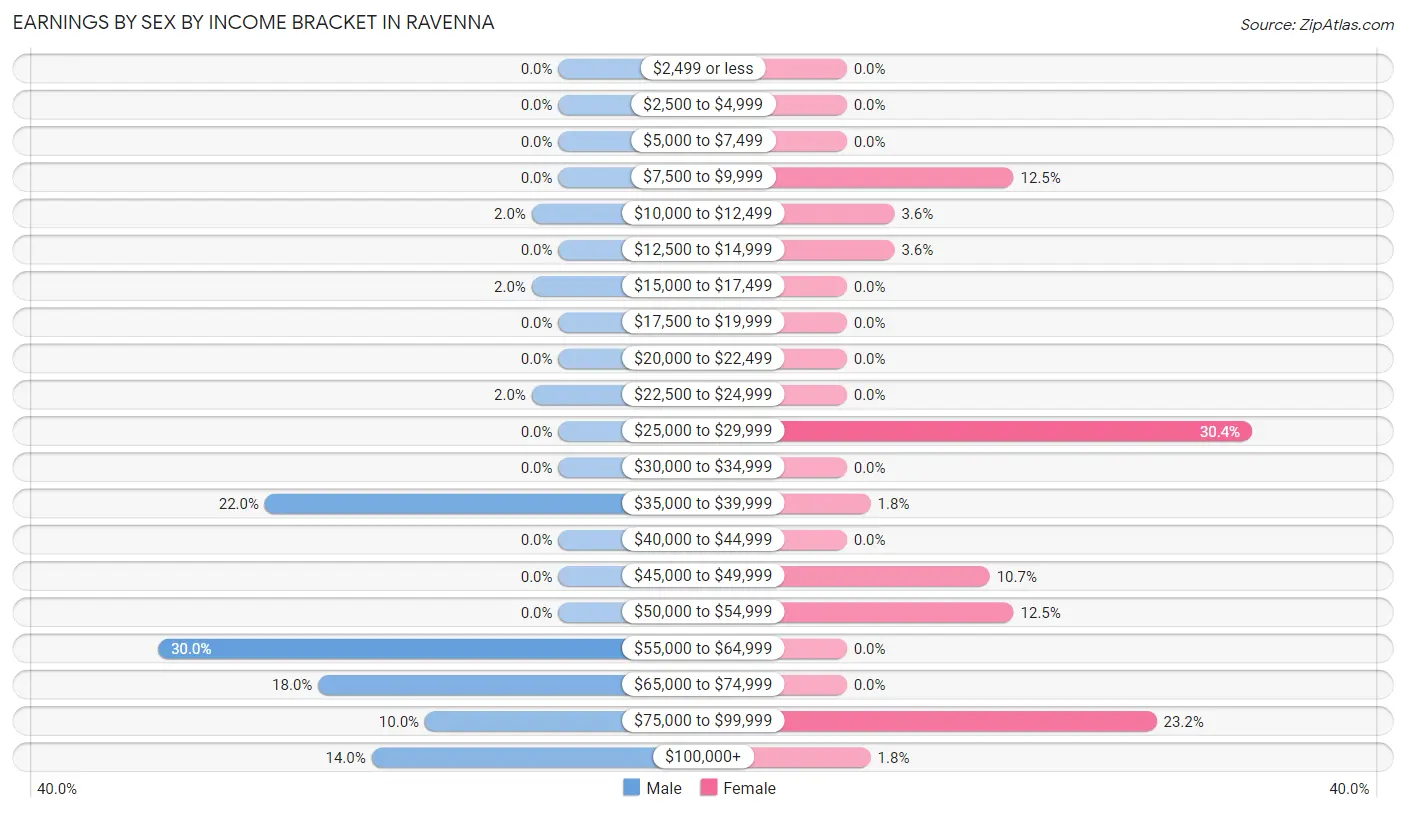
Earnings by Sex by Income Bracket in Ravenna
The most common earnings brackets in Ravenna are $55,000 to $64,999 for men (15 | 30.0%) and $25,000 to $29,999 for women (17 | 30.4%).
| Income | Male | Female |
| $2,499 or less | 0 (0.0%) | 0 (0.0%) |
| $2,500 to $4,999 | 0 (0.0%) | 0 (0.0%) |
| $5,000 to $7,499 | 0 (0.0%) | 0 (0.0%) |
| $7,500 to $9,999 | 0 (0.0%) | 7 (12.5%) |
| $10,000 to $12,499 | 1 (2.0%) | 2 (3.6%) |
| $12,500 to $14,999 | 0 (0.0%) | 2 (3.6%) |
| $15,000 to $17,499 | 1 (2.0%) | 0 (0.0%) |
| $17,500 to $19,999 | 0 (0.0%) | 0 (0.0%) |
| $20,000 to $22,499 | 0 (0.0%) | 0 (0.0%) |
| $22,500 to $24,999 | 1 (2.0%) | 0 (0.0%) |
| $25,000 to $29,999 | 0 (0.0%) | 17 (30.4%) |
| $30,000 to $34,999 | 0 (0.0%) | 0 (0.0%) |
| $35,000 to $39,999 | 11 (22.0%) | 1 (1.8%) |
| $40,000 to $44,999 | 0 (0.0%) | 0 (0.0%) |
| $45,000 to $49,999 | 0 (0.0%) | 6 (10.7%) |
| $50,000 to $54,999 | 0 (0.0%) | 7 (12.5%) |
| $55,000 to $64,999 | 15 (30.0%) | 0 (0.0%) |
| $65,000 to $74,999 | 9 (18.0%) | 0 (0.0%) |
| $75,000 to $99,999 | 5 (10.0%) | 13 (23.2%) |
| $100,000+ | 7 (14.0%) | 1 (1.8%) |
| Total | 50 (100.0%) | 56 (100.0%) |
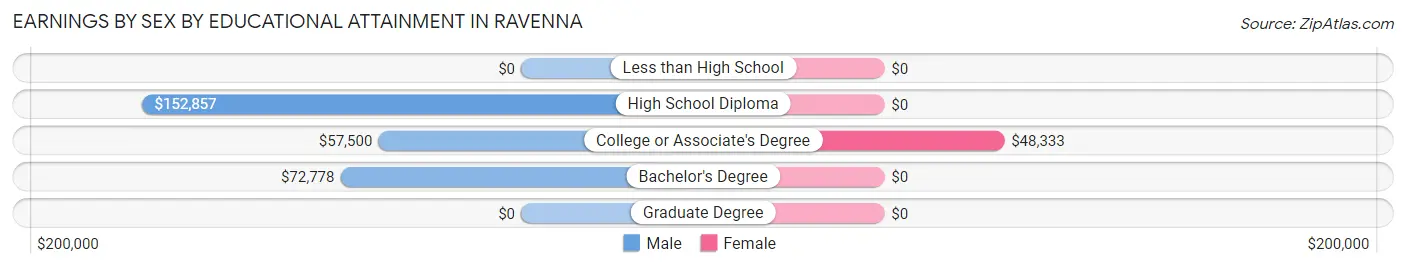
Earnings by Sex by Educational Attainment in Ravenna
| Educational Attainment | Male Income | Female Income |
| Less than High School | - | - |
| High School Diploma | $152,857 | $0 |
| College or Associate's Degree | $57,500 | $48,333 |
| Bachelor's Degree | $72,778 | $0 |
| Graduate Degree | - | - |
| Total | $59,000 | $0 |
Family Income in Ravenna
Family Income Brackets in Ravenna
According to the Ravenna family income data, there are 21 families falling into the $75,000 to $99,999 income range, which is the most common income bracket and makes up 38.9% of all families.
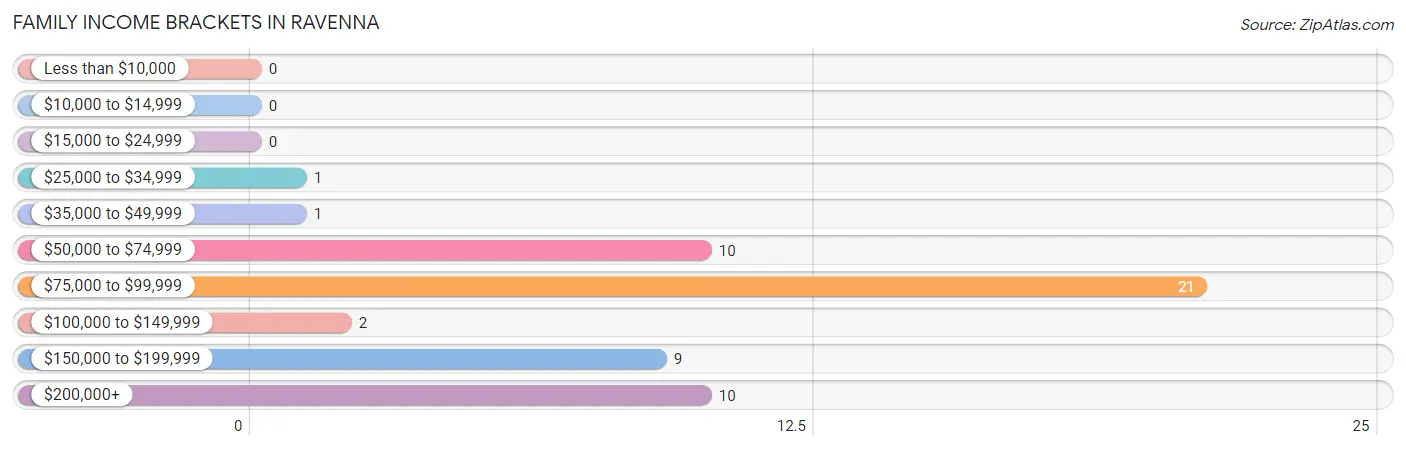
| Income Bracket | # Families | % Families |
| Less than $10,000 | 0 | 0.0% |
| $10,000 to $14,999 | 0 | 0.0% |
| $15,000 to $24,999 | 0 | 0.0% |
| $25,000 to $34,999 | 1 | 1.9% |
| $35,000 to $49,999 | 1 | 1.9% |
| $50,000 to $74,999 | 10 | 18.5% |
| $75,000 to $99,999 | 21 | 38.9% |
| $100,000 to $149,999 | 2 | 3.7% |
| $150,000 to $199,999 | 9 | 16.7% |
| $200,000+ | 10 | 18.5% |
Family Income by Famaliy Size in Ravenna
2-person families (25 | 46.3%) account for the highest median family income in Ravenna with $165,972 per family, while 2-person families (25 | 46.3%) have the highest median income of $82,986 per family member.
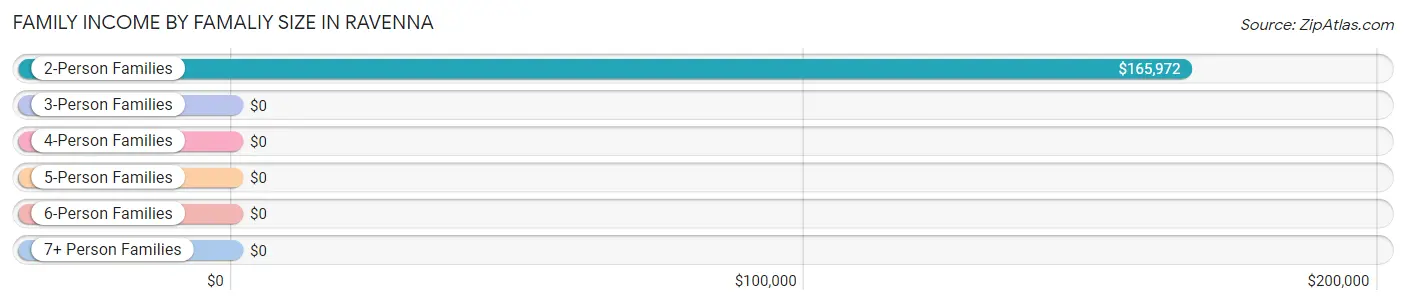
| Income Bracket | # Families | Median Income |
| 2-Person Families | 25 (46.3%) | $165,972 |
| 3-Person Families | 10 (18.5%) | $0 |
| 4-Person Families | 7 (13.0%) | $0 |
| 5-Person Families | 12 (22.2%) | $0 |
| 6-Person Families | 0 (0.0%) | $0 |
| 7+ Person Families | 0 (0.0%) | $0 |
| Total | 54 (100.0%) | $88,750 |
Family Income by Number of Earners in Ravenna
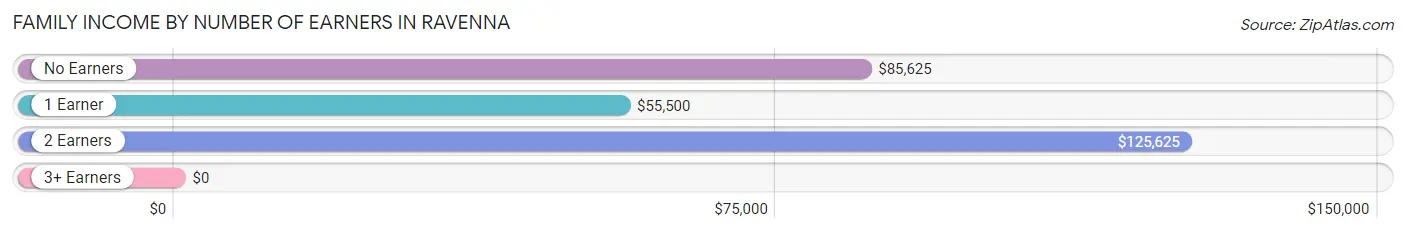
| Number of Earners | # Families | Median Income |
| No Earners | 5 (9.3%) | $85,625 |
| 1 Earner | 8 (14.8%) | $55,500 |
| 2 Earners | 41 (75.9%) | $125,625 |
| 3+ Earners | 0 (0.0%) | $0 |
| Total | 54 (100.0%) | $88,750 |
Household Income in Ravenna
Household Income Brackets in Ravenna
With 21 households falling in the category, the $75,000 to $99,999 income range is the most frequent in Ravenna, accounting for 24.1% of all households. In contrast, only 2 households (2.3%) fall into the $10,000 to $14,999 income bracket, making it the least populous group.
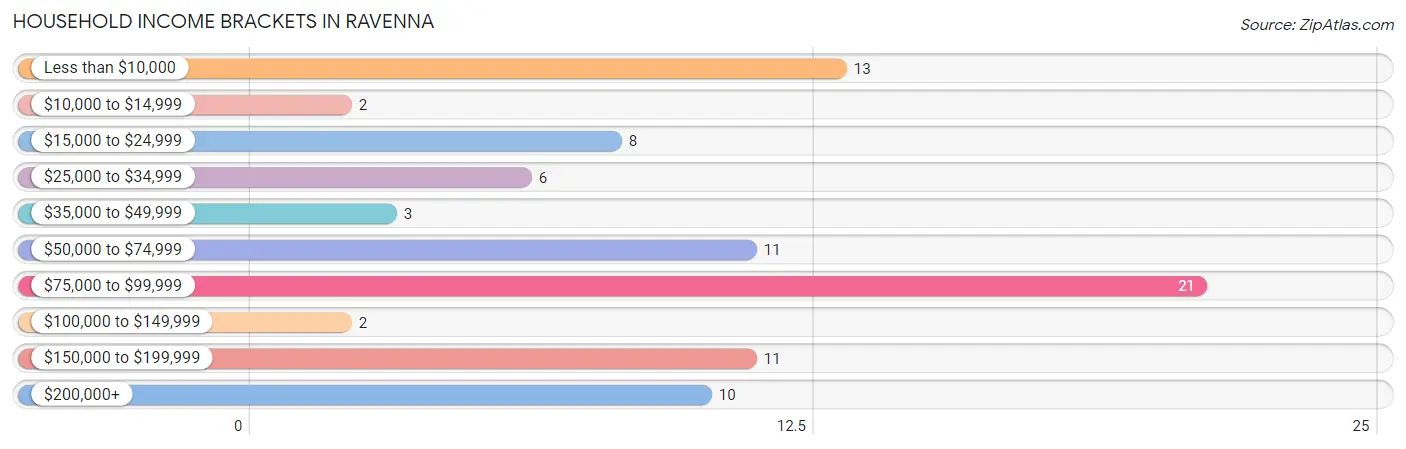
| Income Bracket | # Households | % Households |
| Less than $10,000 | 13 | 14.9% |
| $10,000 to $14,999 | 2 | 2.3% |
| $15,000 to $24,999 | 8 | 9.2% |
| $25,000 to $34,999 | 6 | 6.9% |
| $35,000 to $49,999 | 3 | 3.4% |
| $50,000 to $74,999 | 11 | 12.6% |
| $75,000 to $99,999 | 21 | 24.1% |
| $100,000 to $149,999 | 2 | 2.3% |
| $150,000 to $199,999 | 11 | 12.6% |
| $200,000+ | 10 | 11.5% |
Household Income by Householder Age in Ravenna
The median household income in Ravenna is $82,596, with the highest median household income of $83,958 found in the 25 to 44 years age bracket for the primary householder. A total of 24 households (27.6%) fall into this category.
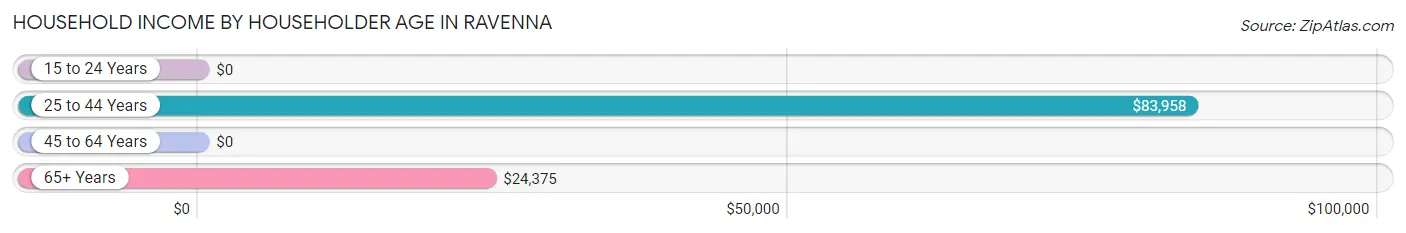
| Income Bracket | # Households | Median Income |
| 15 to 24 Years | 0 (0.0%) | $0 |
| 25 to 44 Years | 24 (27.6%) | $83,958 |
| 45 to 64 Years | 38 (43.7%) | $0 |
| 65+ Years | 25 (28.7%) | $24,375 |
| Total | 87 (100.0%) | $82,596 |
Poverty in Ravenna
Income Below Poverty by Sex and Age in Ravenna
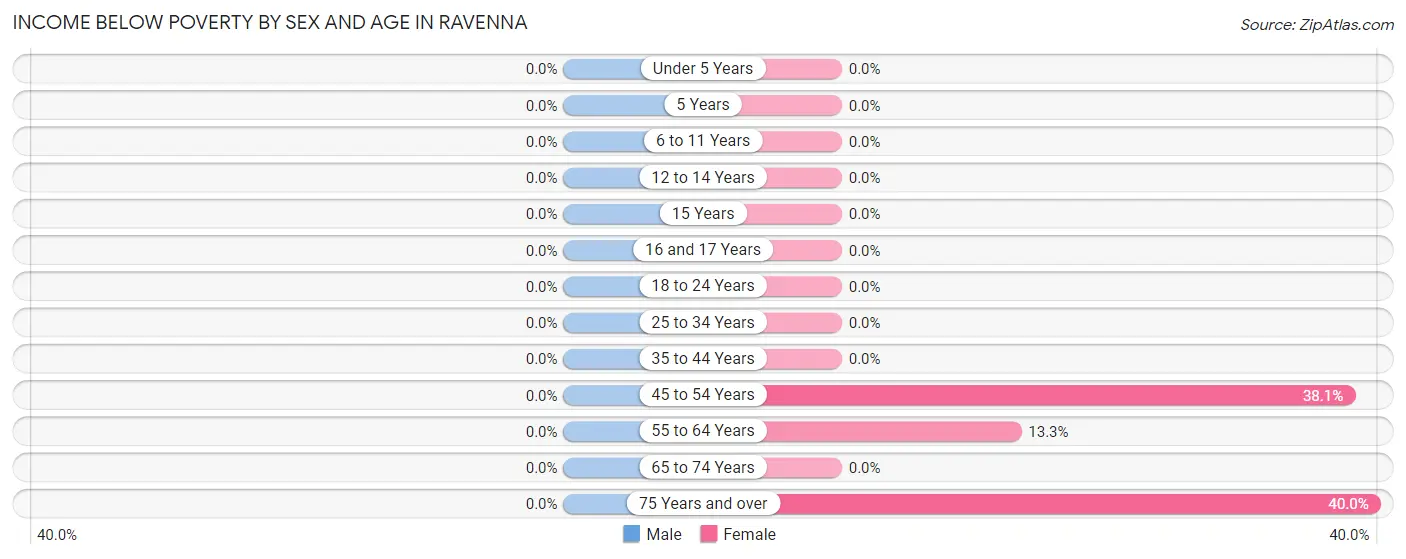
| Age Bracket | Male | Female |
| Under 5 Years | 0 (0.0%) | 0 (0.0%) |
| 5 Years | 0 (0.0%) | 0 (0.0%) |
| 6 to 11 Years | 0 (0.0%) | 0 (0.0%) |
| 12 to 14 Years | 0 (0.0%) | 0 (0.0%) |
| 15 Years | 0 (0.0%) | 0 (0.0%) |
| 16 and 17 Years | 0 (0.0%) | 0 (0.0%) |
| 18 to 24 Years | 0 (0.0%) | 0 (0.0%) |
| 25 to 34 Years | 0 (0.0%) | 0 (0.0%) |
| 35 to 44 Years | 0 (0.0%) | 0 (0.0%) |
| 45 to 54 Years | 0 (0.0%) | 8 (38.1%) |
| 55 to 64 Years | 0 (0.0%) | 2 (13.3%) |
| 65 to 74 Years | 0 (0.0%) | 0 (0.0%) |
| 75 Years and over | 0 (0.0%) | 6 (40.0%) |
| Total | 0 (0.0%) | 16 (15.1%) |
Income Above Poverty by Sex and Age in Ravenna
According to the poverty statistics in Ravenna, males aged under 5 years and females aged under 5 years are the age groups that are most secure financially, with 100.0% of males and 100.0% of females in these age groups living above the poverty line.
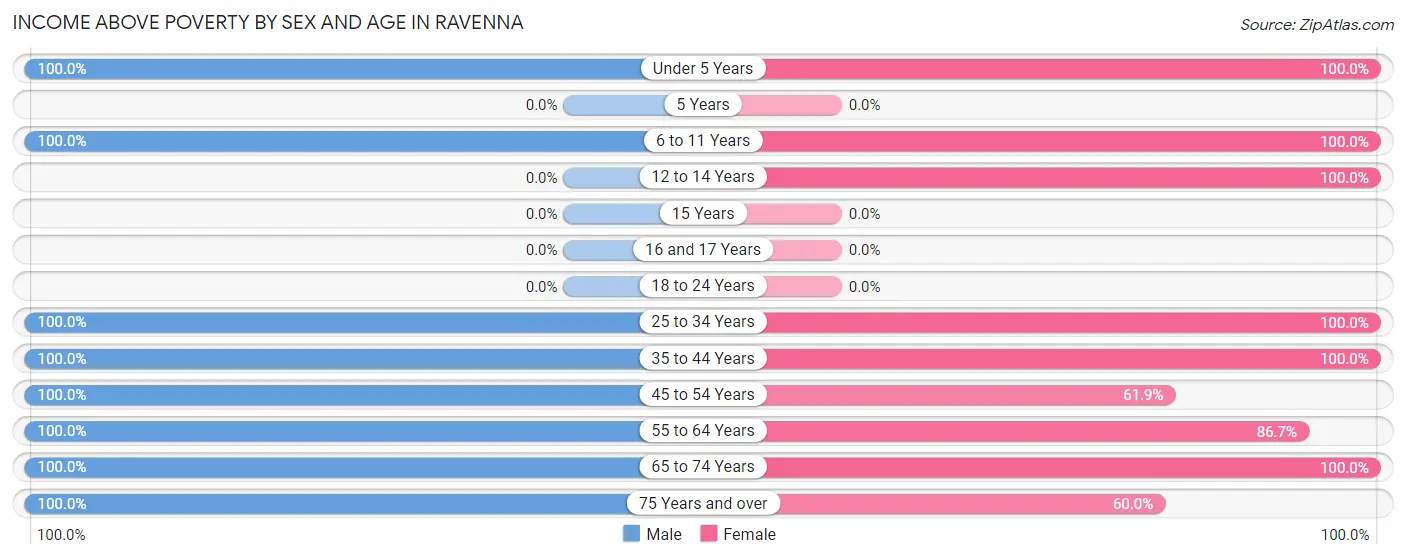
| Age Bracket | Male | Female |
| Under 5 Years | 18 (100.0%) | 5 (100.0%) |
| 5 Years | 0 (0.0%) | 0 (0.0%) |
| 6 to 11 Years | 5 (100.0%) | 11 (100.0%) |
| 12 to 14 Years | 0 (0.0%) | 7 (100.0%) |
| 15 Years | 0 (0.0%) | 0 (0.0%) |
| 16 and 17 Years | 0 (0.0%) | 0 (0.0%) |
| 18 to 24 Years | 0 (0.0%) | 0 (0.0%) |
| 25 to 34 Years | 3 (100.0%) | 20 (100.0%) |
| 35 to 44 Years | 22 (100.0%) | 7 (100.0%) |
| 45 to 54 Years | 13 (100.0%) | 13 (61.9%) |
| 55 to 64 Years | 18 (100.0%) | 13 (86.7%) |
| 65 to 74 Years | 7 (100.0%) | 5 (100.0%) |
| 75 Years and over | 4 (100.0%) | 9 (60.0%) |
| Total | 90 (100.0%) | 90 (84.9%) |
Income Below Poverty Among Married-Couple Families in Ravenna
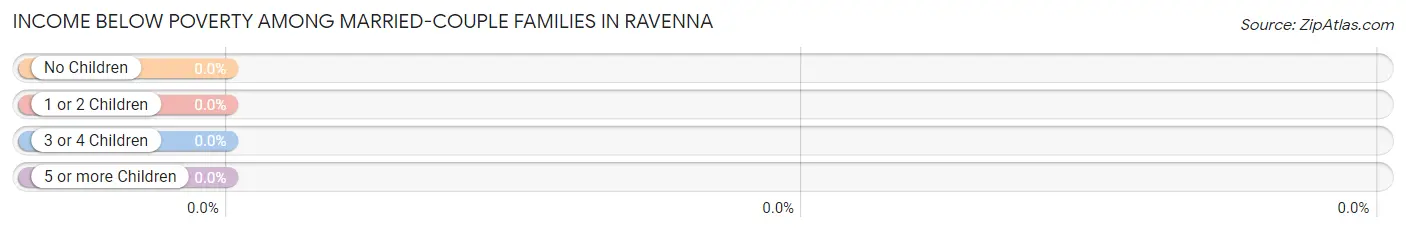
| Children | Above Poverty | Below Poverty |
| No Children | 28 (100.0%) | 0 (0.0%) |
| 1 or 2 Children | 11 (100.0%) | 0 (0.0%) |
| 3 or 4 Children | 12 (100.0%) | 0 (0.0%) |
| 5 or more Children | 0 (0.0%) | 0 (0.0%) |
| Total | 51 (100.0%) | 0 (0.0%) |
Income Below Poverty Among Single-Parent Households in Ravenna
| Children | Single Father | Single Mother |
| No Children | 0 (0.0%) | 0 (0.0%) |
| 1 or 2 Children | 0 (0.0%) | 0 (0.0%) |
| 3 or 4 Children | 0 (0.0%) | 0 (0.0%) |
| 5 or more Children | 0 (0.0%) | 0 (0.0%) |
| Total | 0 (0.0%) | 0 (0.0%) |
Income Below Poverty Among Married-Couple vs Single-Parent Households in Ravenna
| Children | Married-Couple Families | Single-Parent Households |
| No Children | 0 (0.0%) | 0 (0.0%) |
| 1 or 2 Children | 0 (0.0%) | 0 (0.0%) |
| 3 or 4 Children | 0 (0.0%) | 0 (0.0%) |
| 5 or more Children | 0 (0.0%) | 0 (0.0%) |
| Total | 0 (0.0%) | 0 (0.0%) |
Race in Ravenna
The most populous races in Ravenna are White / Caucasian (150 | 76.5%), Two or more Races (43 | 21.9%), and Hispanic or Latino (14 | 7.1%).
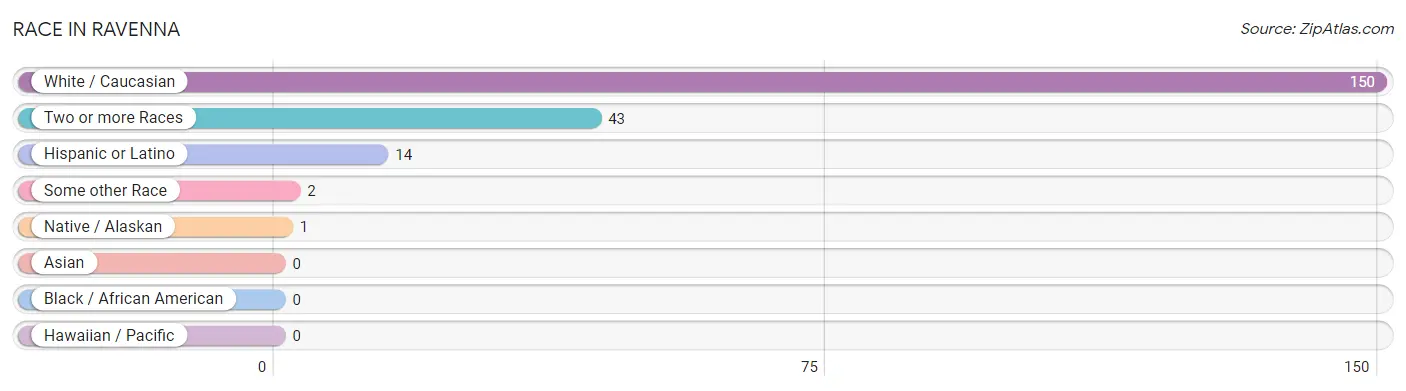
| Race | # Population | % Population |
| Asian | 0 | 0.0% |
| Black / African American | 0 | 0.0% |
| Hawaiian / Pacific | 0 | 0.0% |
| Hispanic or Latino | 14 | 7.1% |
| Native / Alaskan | 1 | 0.5% |
| White / Caucasian | 150 | 76.5% |
| Two or more Races | 43 | 21.9% |
| Some other Race | 2 | 1.0% |
| Total | 196 | 100.0% |
Ancestry in Ravenna
The most populous ancestries reported in Ravenna are Burmese (40 | 20.4%), German (19 | 9.7%), Mexican (14 | 7.1%), English (12 | 6.1%), and American (7 | 3.6%), together accounting for 46.9% of all Ravenna residents.
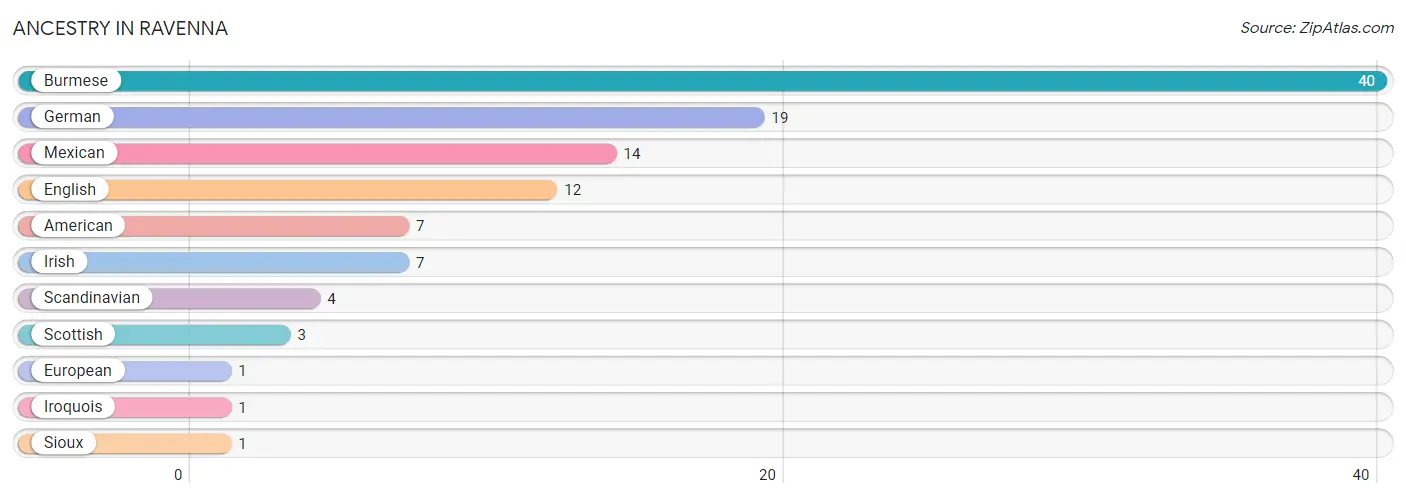
| Ancestry | # Population | % Population |
| American | 7 | 3.6% |
| Burmese | 40 | 20.4% |
| English | 12 | 6.1% |
| European | 1 | 0.5% |
| German | 19 | 9.7% |
| Irish | 7 | 3.6% |
| Iroquois | 1 | 0.5% |
| Mexican | 14 | 7.1% |
| Scandinavian | 4 | 2.0% |
| Scottish | 3 | 1.5% |
| Sioux | 1 | 0.5% | View All 11 Rows |
Immigrants in Ravenna
The most numerous immigrant groups reported in Ravenna came from Central America (2 | 1.0%), Latin America (2 | 1.0%), and Mexico (2 | 1.0%), together accounting for 3.1% of all Ravenna residents.
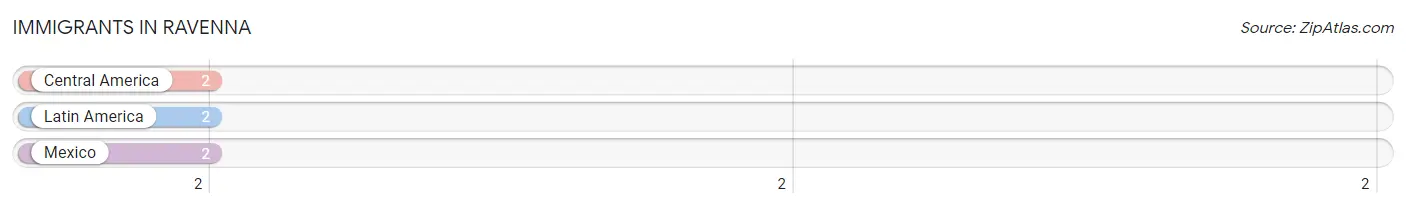
| Immigration Origin | # Population | % Population |
| Central America | 2 | 1.0% |
| Latin America | 2 | 1.0% |
| Mexico | 2 | 1.0% | View All 3 Rows |
Sex and Age in Ravenna
Sex and Age in Ravenna
The most populous age groups in Ravenna are Under 5 Years (18 | 20.0%) for men and 50 to 54 Years (20 | 18.9%) for women.
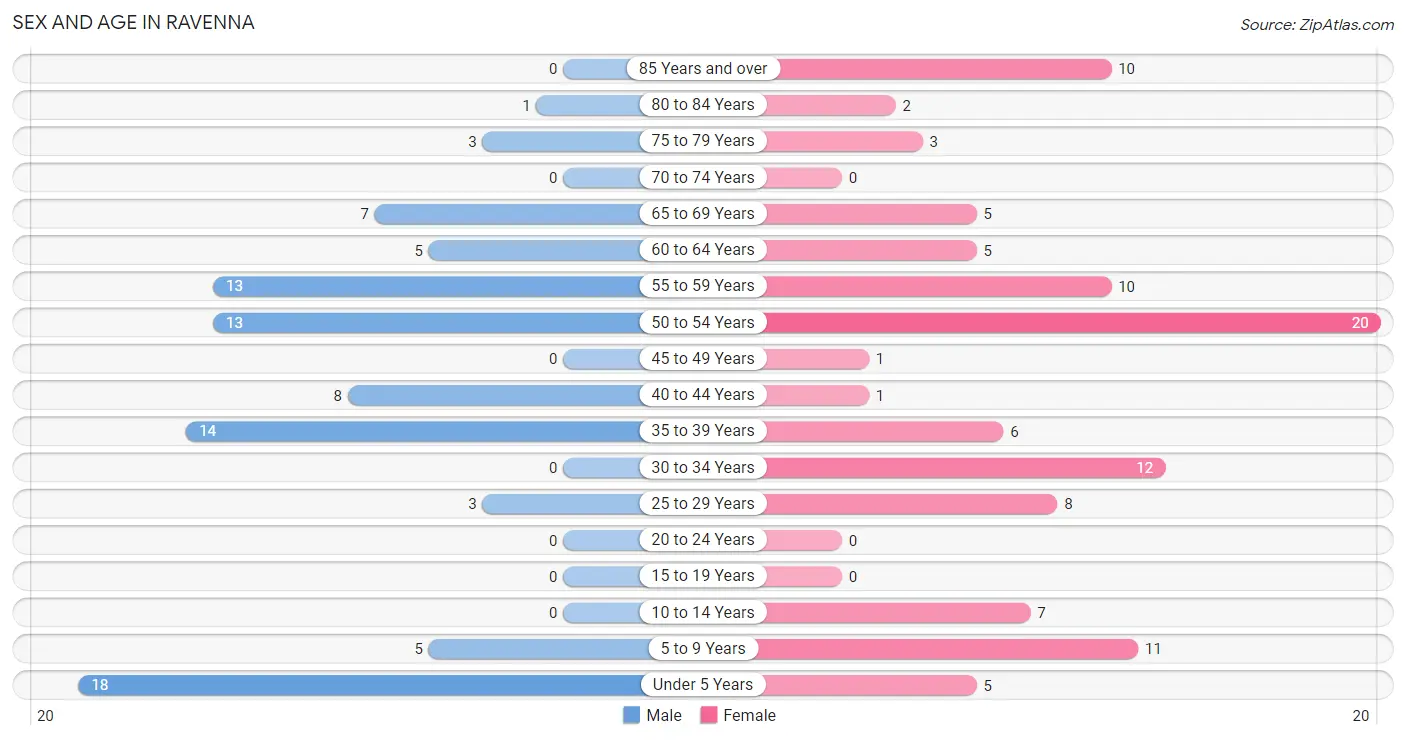
| Age Bracket | Male | Female |
| Under 5 Years | 18 (20.0%) | 5 (4.7%) |
| 5 to 9 Years | 5 (5.6%) | 11 (10.4%) |
| 10 to 14 Years | 0 (0.0%) | 7 (6.6%) |
| 15 to 19 Years | 0 (0.0%) | 0 (0.0%) |
| 20 to 24 Years | 0 (0.0%) | 0 (0.0%) |
| 25 to 29 Years | 3 (3.3%) | 8 (7.5%) |
| 30 to 34 Years | 0 (0.0%) | 12 (11.3%) |
| 35 to 39 Years | 14 (15.6%) | 6 (5.7%) |
| 40 to 44 Years | 8 (8.9%) | 1 (0.9%) |
| 45 to 49 Years | 0 (0.0%) | 1 (0.9%) |
| 50 to 54 Years | 13 (14.4%) | 20 (18.9%) |
| 55 to 59 Years | 13 (14.4%) | 10 (9.4%) |
| 60 to 64 Years | 5 (5.6%) | 5 (4.7%) |
| 65 to 69 Years | 7 (7.8%) | 5 (4.7%) |
| 70 to 74 Years | 0 (0.0%) | 0 (0.0%) |
| 75 to 79 Years | 3 (3.3%) | 3 (2.8%) |
| 80 to 84 Years | 1 (1.1%) | 2 (1.9%) |
| 85 Years and over | 0 (0.0%) | 10 (9.4%) |
| Total | 90 (100.0%) | 106 (100.0%) |
Families and Households in Ravenna
Median Family Size in Ravenna
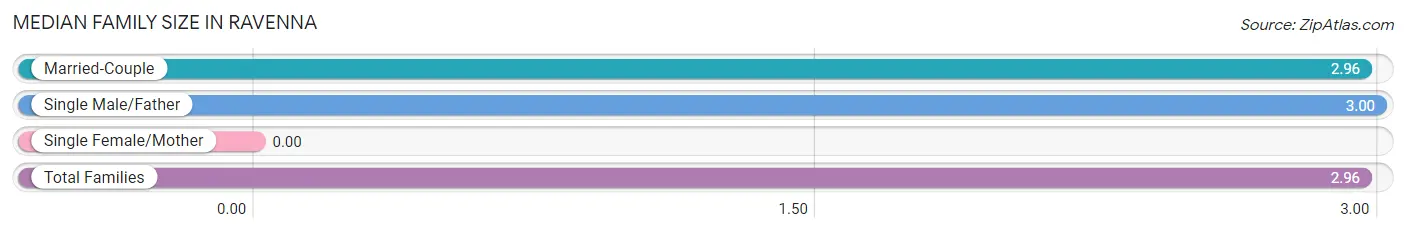
| Family Type | # Families | Family Size |
| Married-Couple | 51 (94.4%) | 2.96 |
| Single Male/Father | 3 (5.6%) | 3.00 |
| Single Female/Mother | 0 (0.0%) | - |
| Total Families | 54 (100.0%) | 2.96 |
Median Household Size in Ravenna
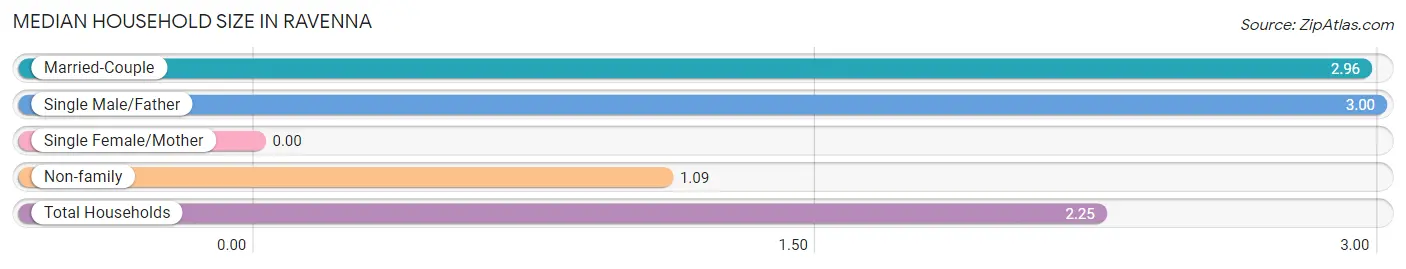
| Household Type | # Households | Household Size |
| Married-Couple | 51 (58.6%) | 2.96 |
| Single Male/Father | 3 (3.5%) | 3.00 |
| Single Female/Mother | 0 (0.0%) | - |
| Non-family | 33 (37.9%) | 1.09 |
| Total Households | 87 (100.0%) | 2.25 |
Household Size by Marriage Status in Ravenna
Out of a total of 87 households in Ravenna, 54 (62.1%) are family households, while 33 (37.9%) are nonfamily households. The most numerous type of family households are 2-person households, comprising 25, and the most common type of nonfamily households are 1-person households, comprising 29.
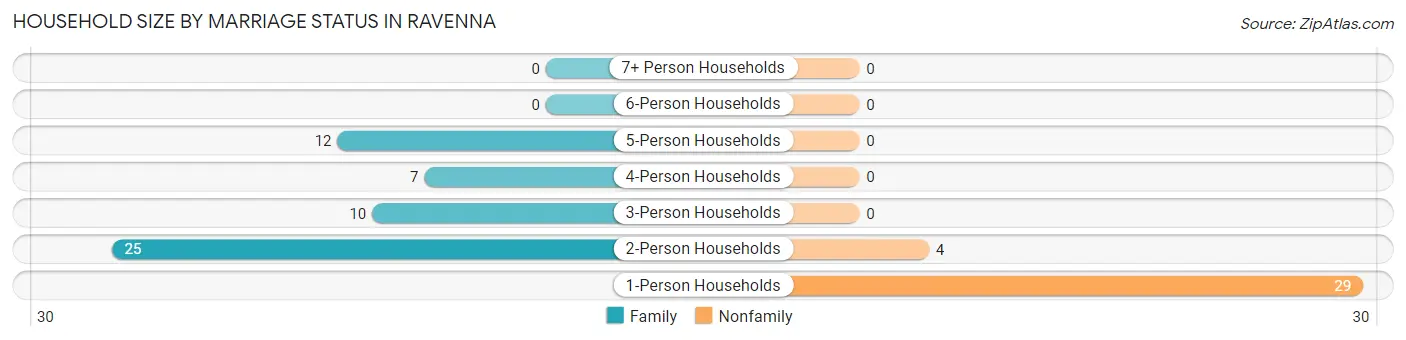
| Household Size | Family Households | Nonfamily Households |
| 1-Person Households | - | 29 (33.3%) |
| 2-Person Households | 25 (28.7%) | 4 (4.6%) |
| 3-Person Households | 10 (11.5%) | 0 (0.0%) |
| 4-Person Households | 7 (8.1%) | 0 (0.0%) |
| 5-Person Households | 12 (13.8%) | 0 (0.0%) |
| 6-Person Households | 0 (0.0%) | 0 (0.0%) |
| 7+ Person Households | 0 (0.0%) | 0 (0.0%) |
| Total | 54 (62.1%) | 33 (37.9%) |
Female Fertility in Ravenna
Fertility by Age in Ravenna
Average fertility rate in Ravenna is 188.0 births per 1,000 women. Women in the age bracket of 20 to 34 years have the highest fertility rate with 250.0 births per 1,000 women. Women in the age bracket of 20 to 34 years acount for 55.6% of all women with births.
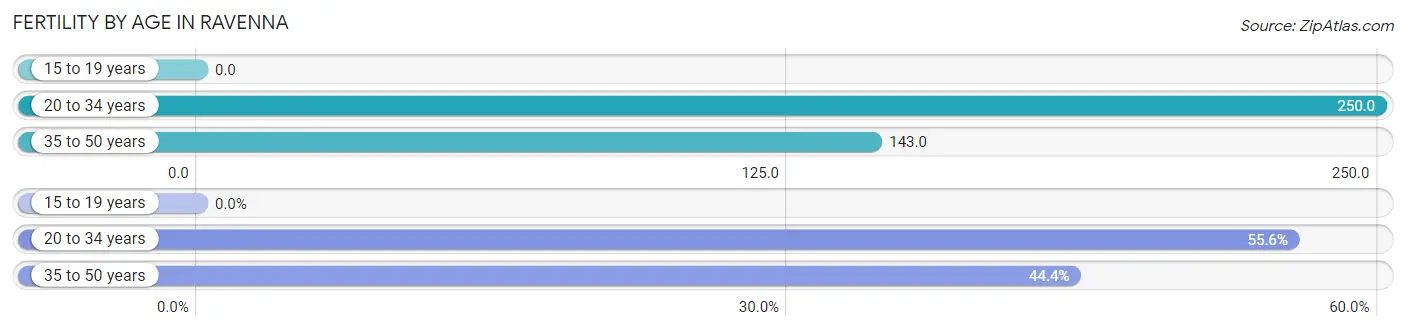
| Age Bracket | Women with Births | Births / 1,000 Women |
| 15 to 19 years | 0 (0.0%) | 0.0 |
| 20 to 34 years | 5 (55.6%) | 250.0 |
| 35 to 50 years | 4 (44.4%) | 143.0 |
| Total | 9 (100.0%) | 188.0 |
Fertility by Age by Marriage Status in Ravenna
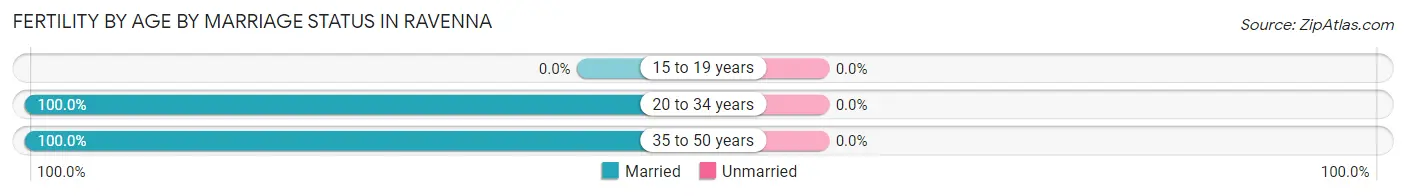
| Age Bracket | Married | Unmarried |
| 15 to 19 years | 0 (0.0%) | 0 (0.0%) |
| 20 to 34 years | 5 (100.0%) | 0 (0.0%) |
| 35 to 50 years | 4 (100.0%) | 0 (0.0%) |
| Total | 9 (100.0%) | 0 (0.0%) |
Fertility by Education in Ravenna
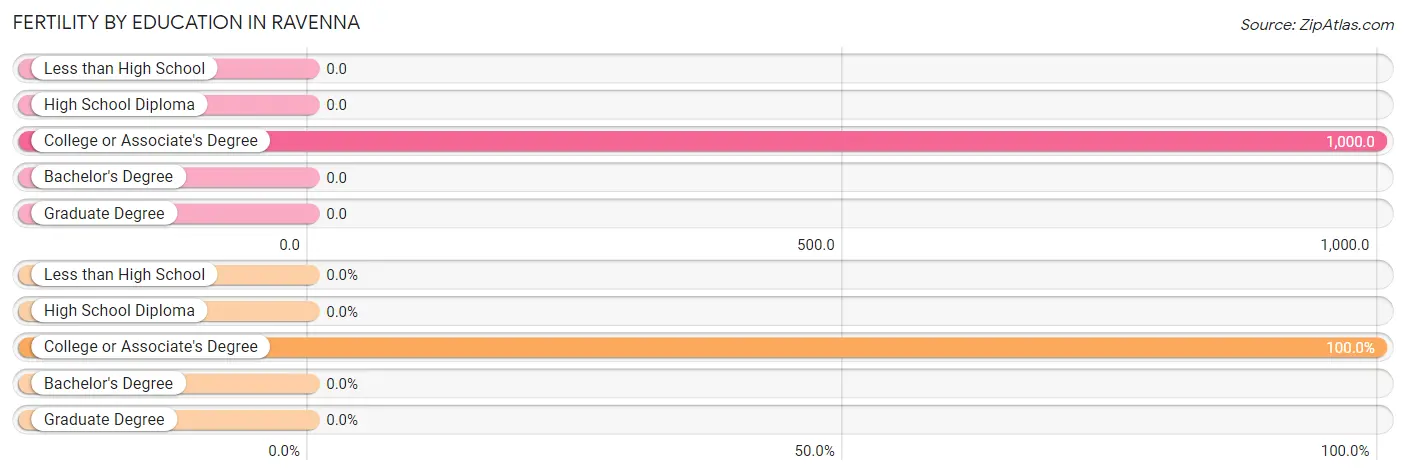
| Educational Attainment | Women with Births | Births / 1,000 Women |
| Less than High School | 0 (0.0%) | 0.0 |
| High School Diploma | 0 (0.0%) | 0.0 |
| College or Associate's Degree | 9 (100.0%) | 1,000.0 |
| Bachelor's Degree | 0 (0.0%) | 0.0 |
| Graduate Degree | 0 (0.0%) | 0.0 |
| Total | 9 (100.0%) | 188.0 |
Fertility by Education by Marriage Status in Ravenna
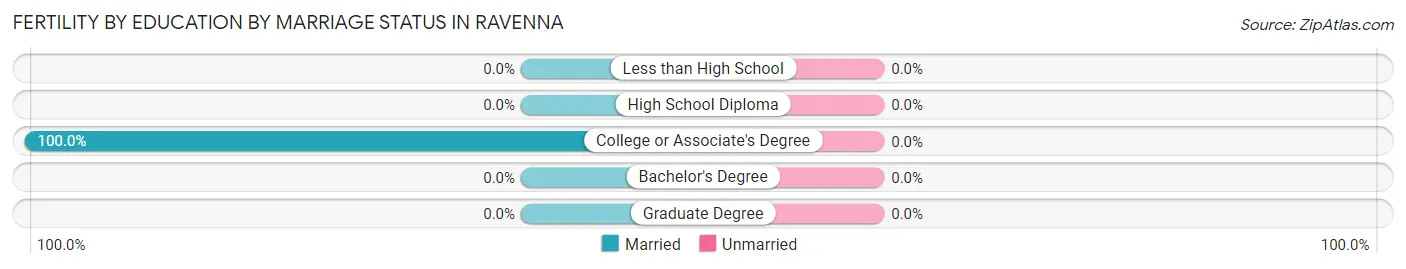
| Educational Attainment | Married | Unmarried |
| Less than High School | 0 (0.0%) | 0 (0.0%) |
| High School Diploma | 0 (0.0%) | 0 (0.0%) |
| College or Associate's Degree | 9 (100.0%) | 0 (0.0%) |
| Bachelor's Degree | 0 (0.0%) | 0 (0.0%) |
| Graduate Degree | 0 (0.0%) | 0 (0.0%) |
| Total | 9 (100.0%) | 0 (0.0%) |
Employment Characteristics in Ravenna
Employment by Class of Employer in Ravenna
Among the 99 employed individuals in Ravenna, private company employees (73 | 73.7%), self-employed (not incorporated) (16 | 16.2%), and not-for-profit organizations (9 | 9.1%) make up the most common classes of employment.
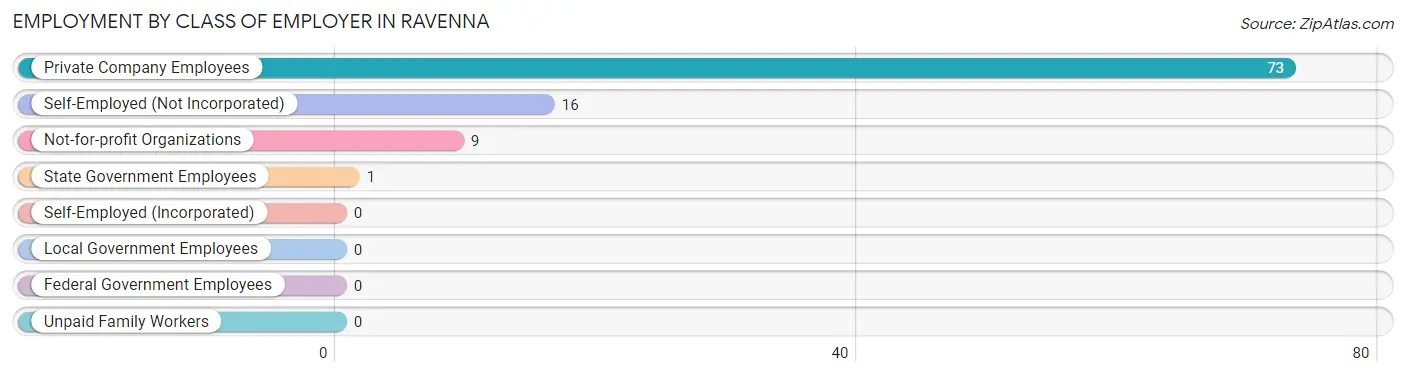
| Employer Class | # Employees | % Employees |
| Private Company Employees | 73 | 73.7% |
| Self-Employed (Incorporated) | 0 | 0.0% |
| Self-Employed (Not Incorporated) | 16 | 16.2% |
| Not-for-profit Organizations | 9 | 9.1% |
| Local Government Employees | 0 | 0.0% |
| State Government Employees | 1 | 1.0% |
| Federal Government Employees | 0 | 0.0% |
| Unpaid Family Workers | 0 | 0.0% |
| Total | 99 | 100.0% |
Employment Status by Age in Ravenna
According to the labor force statistics for Ravenna, out of the total population over 16 years of age (150), 68.0% or 102 individuals are in the labor force, with 2.9% or 3 of them unemployed. The age group with the highest labor force participation rate is 30 to 34 years, with 100.0% or 12 individuals in the labor force. Within the labor force, the 45 to 54 years age range has the highest percentage of unemployed individuals, with 9.1% or 3 of them being unemployed.
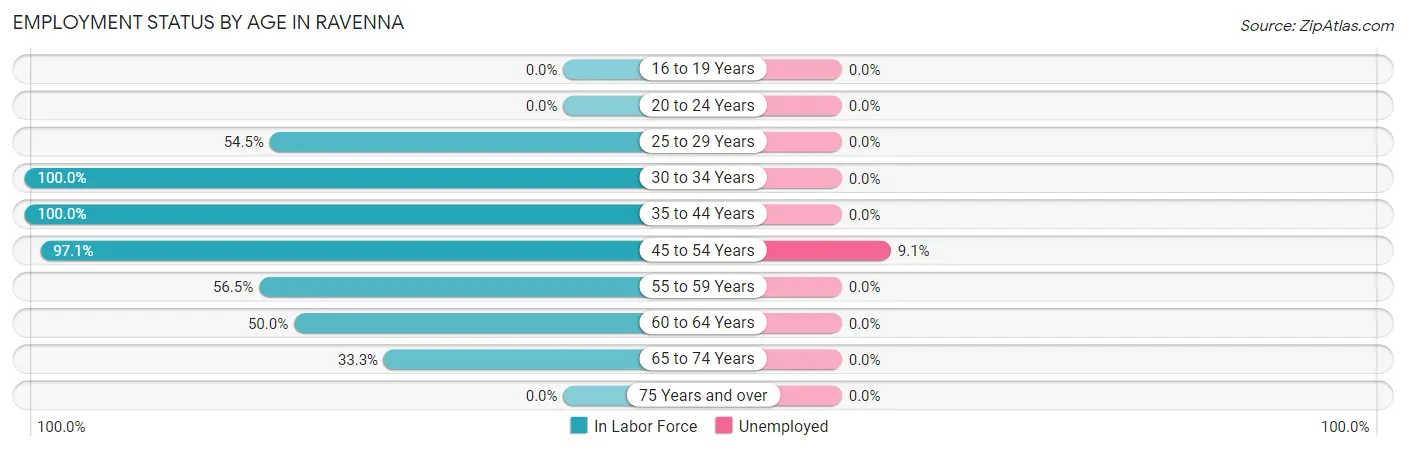
| Age Bracket | In Labor Force | Unemployed |
| 16 to 19 Years | 0 (0.0%) | 0 (0.0%) |
| 20 to 24 Years | 0 (0.0%) | 0 (0.0%) |
| 25 to 29 Years | 6 (54.5%) | 0 (0.0%) |
| 30 to 34 Years | 12 (100.0%) | 0 (0.0%) |
| 35 to 44 Years | 29 (100.0%) | 0 (0.0%) |
| 45 to 54 Years | 33 (97.1%) | 3 (9.1%) |
| 55 to 59 Years | 13 (56.5%) | 0 (0.0%) |
| 60 to 64 Years | 5 (50.0%) | 0 (0.0%) |
| 65 to 74 Years | 4 (33.3%) | 0 (0.0%) |
| 75 Years and over | 0 (0.0%) | 0 (0.0%) |
| Total | 102 (68.0%) | 3 (2.9%) |
Employment Status by Educational Attainment in Ravenna
According to labor force statistics for Ravenna, 82.4% of individuals (98) out of the total population between 25 and 64 years of age (119) are in the labor force, with 3.1% or 3 of them being unemployed. The group with the highest labor force participation rate are those with the educational attainment of less than high school, with 92.9% or 13 individuals in the labor force. Within the labor force, individuals with college / associate degree education have the highest percentage of unemployment, with 12.0% or 3 of them being unemployed.
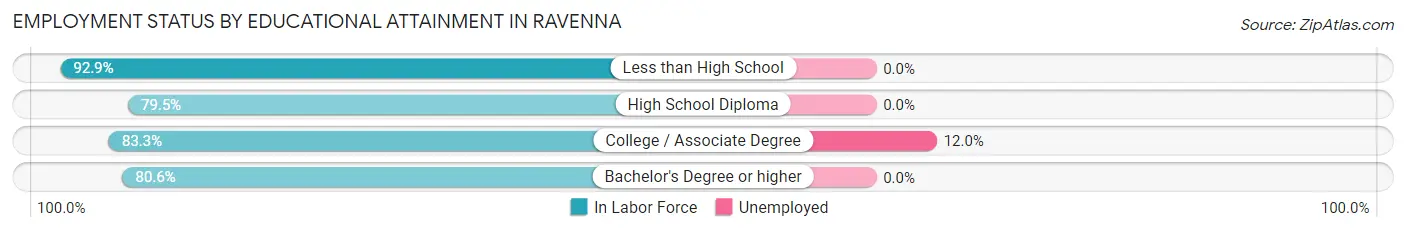
| Educational Attainment | In Labor Force | Unemployed |
| Less than High School | 13 (92.9%) | 0 (0.0%) |
| High School Diploma | 31 (79.5%) | 0 (0.0%) |
| College / Associate Degree | 25 (83.3%) | 4 (12.0%) |
| Bachelor's Degree or higher | 29 (80.6%) | 0 (0.0%) |
| Total | 98 (82.4%) | 4 (3.1%) |
Employment Occupations by Sex in Ravenna
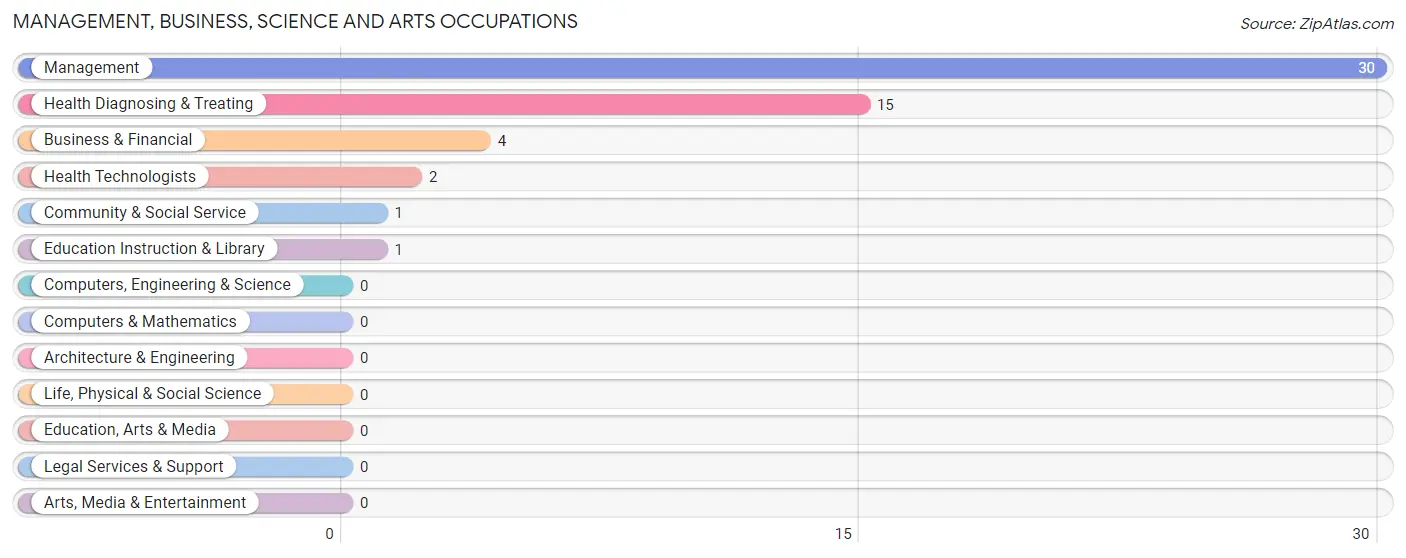
Management, Business, Science and Arts Occupations
The most common Management, Business, Science and Arts occupations in Ravenna are Management (30 | 30.3%), Health Diagnosing & Treating (15 | 15.1%), Business & Financial (4 | 4.0%), Health Technologists (2 | 2.0%), and Community & Social Service (1 | 1.0%).
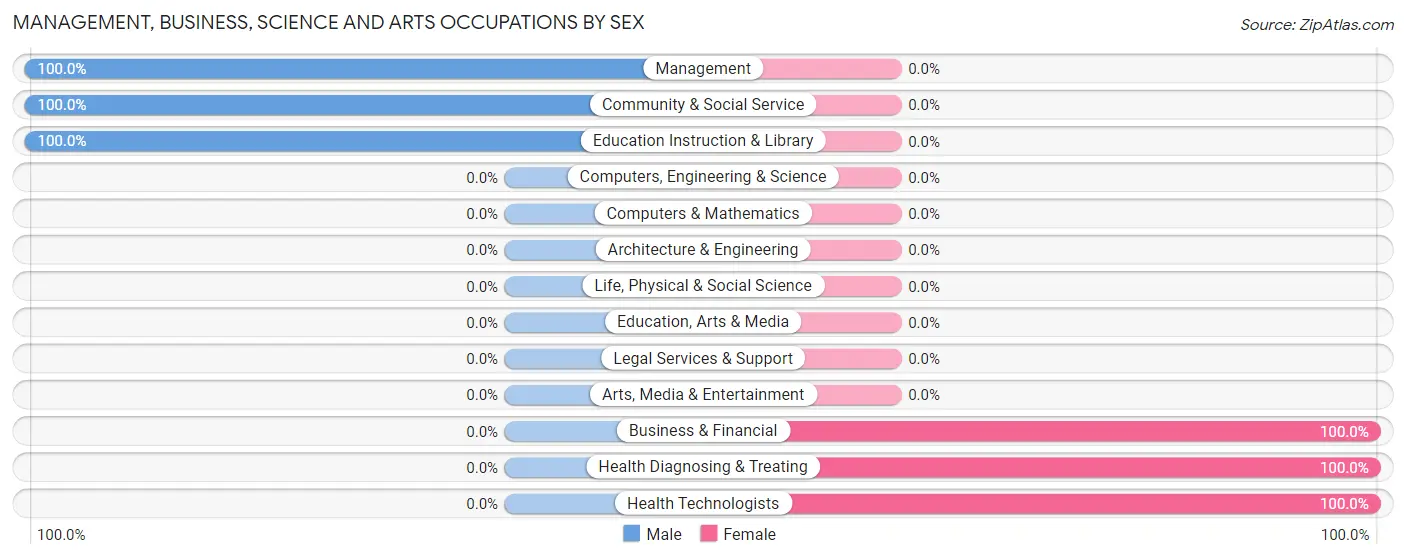
Management, Business, Science and Arts Occupations by Sex
Within the Management, Business, Science and Arts occupations in Ravenna, the most male-oriented occupations are Management (100.0%), Community & Social Service (100.0%), and Education Instruction & Library (100.0%), while the most female-oriented occupations are Business & Financial (100.0%), Health Diagnosing & Treating (100.0%), and Health Technologists (100.0%).
| Occupation | Male | Female |
| Management | 30 (100.0%) | 0 (0.0%) |
| Business & Financial | 0 (0.0%) | 4 (100.0%) |
| Computers, Engineering & Science | 0 (0.0%) | 0 (0.0%) |
| Computers & Mathematics | 0 (0.0%) | 0 (0.0%) |
| Architecture & Engineering | 0 (0.0%) | 0 (0.0%) |
| Life, Physical & Social Science | 0 (0.0%) | 0 (0.0%) |
| Community & Social Service | 1 (100.0%) | 0 (0.0%) |
| Education, Arts & Media | 0 (0.0%) | 0 (0.0%) |
| Legal Services & Support | 0 (0.0%) | 0 (0.0%) |
| Education Instruction & Library | 1 (100.0%) | 0 (0.0%) |
| Arts, Media & Entertainment | 0 (0.0%) | 0 (0.0%) |
| Health Diagnosing & Treating | 0 (0.0%) | 15 (100.0%) |
| Health Technologists | 0 (0.0%) | 2 (100.0%) |
| Total (Category) | 31 (62.0%) | 19 (38.0%) |
| Total (Overall) | 50 (50.5%) | 49 (49.5%) |
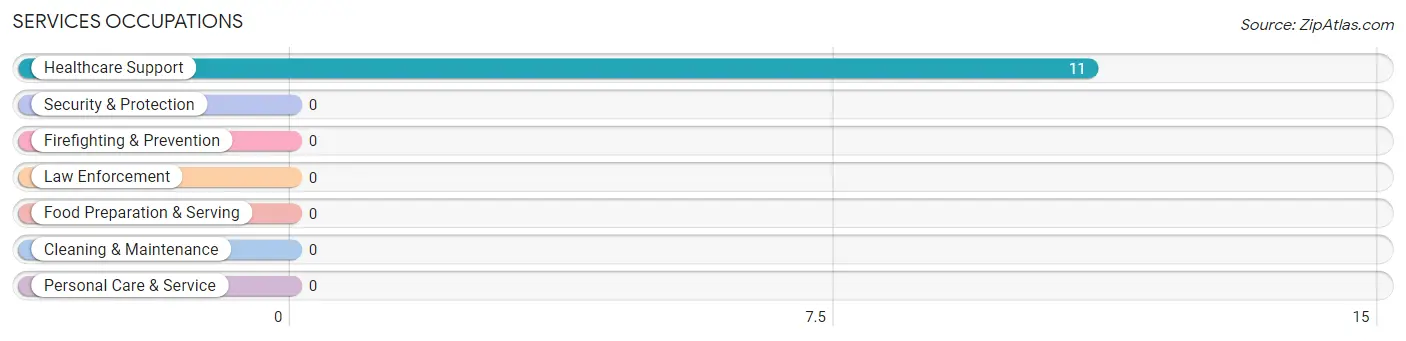
Services Occupations
The most common Services occupations in Ravenna are , and Healthcare Support (11 | 11.1%).
Services Occupations by Sex
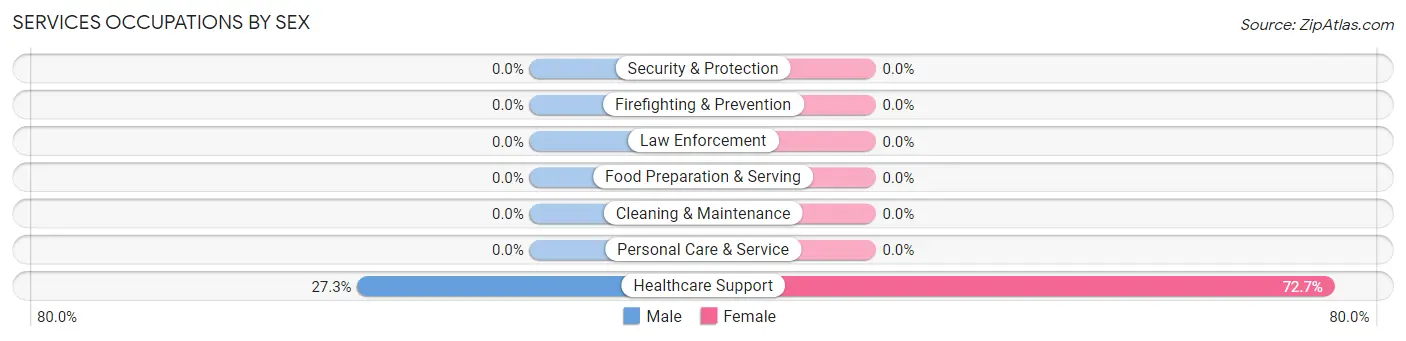
| Occupation | Male | Female |
| Healthcare Support | 3 (27.3%) | 8 (72.7%) |
| Security & Protection | 0 (0.0%) | 0 (0.0%) |
| Firefighting & Prevention | 0 (0.0%) | 0 (0.0%) |
| Law Enforcement | 0 (0.0%) | 0 (0.0%) |
| Food Preparation & Serving | 0 (0.0%) | 0 (0.0%) |
| Cleaning & Maintenance | 0 (0.0%) | 0 (0.0%) |
| Personal Care & Service | 0 (0.0%) | 0 (0.0%) |
| Total (Category) | 3 (27.3%) | 8 (72.7%) |
| Total (Overall) | 50 (50.5%) | 49 (49.5%) |
Sales and Office Occupations
The most common Sales and Office occupations in Ravenna are Office & Administration (10 | 10.1%), and Sales & Related (3 | 3.0%).
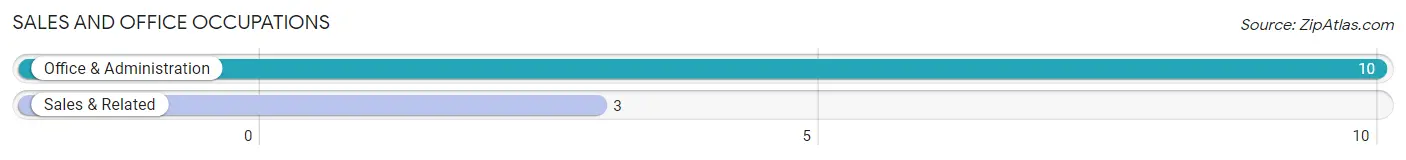
Sales and Office Occupations by Sex
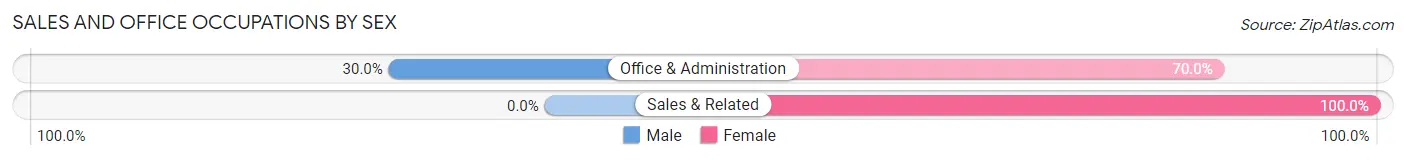
| Occupation | Male | Female |
| Sales & Related | 0 (0.0%) | 3 (100.0%) |
| Office & Administration | 3 (30.0%) | 7 (70.0%) |
| Total (Category) | 3 (23.1%) | 10 (76.9%) |
| Total (Overall) | 50 (50.5%) | 49 (49.5%) |
Natural Resources, Construction and Maintenance Occupations
The most common Natural Resources, Construction and Maintenance occupations in Ravenna are , and Construction & Extraction (5 | 5.1%).
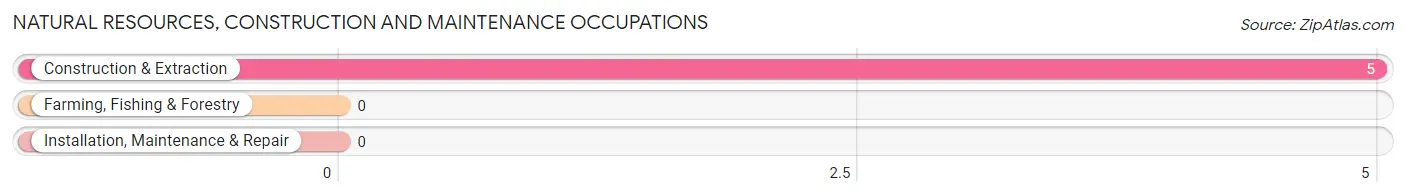
Natural Resources, Construction and Maintenance Occupations by Sex
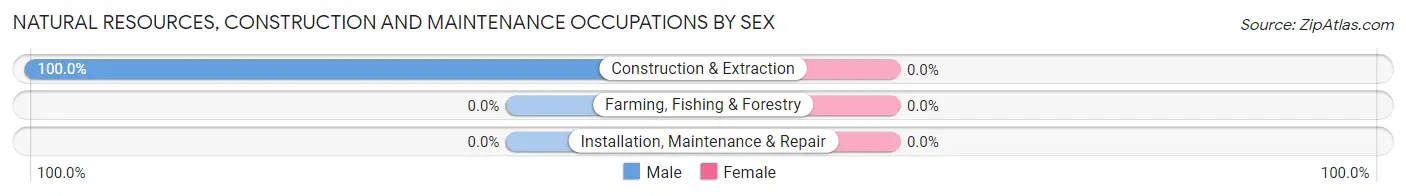
| Occupation | Male | Female |
| Farming, Fishing & Forestry | 0 (0.0%) | 0 (0.0%) |
| Construction & Extraction | 5 (100.0%) | 0 (0.0%) |
| Installation, Maintenance & Repair | 0 (0.0%) | 0 (0.0%) |
| Total (Category) | 5 (100.0%) | 0 (0.0%) |
| Total (Overall) | 50 (50.5%) | 49 (49.5%) |
Production, Transportation and Moving Occupations
The most common Production, Transportation and Moving occupations in Ravenna are Production (15 | 15.1%), and Transportation (5 | 5.1%).
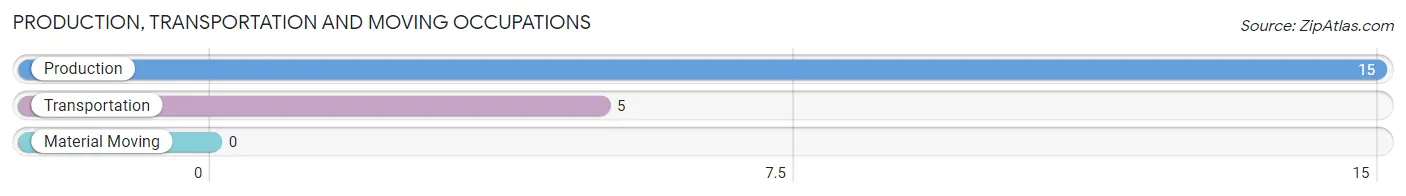
Production, Transportation and Moving Occupations by Sex
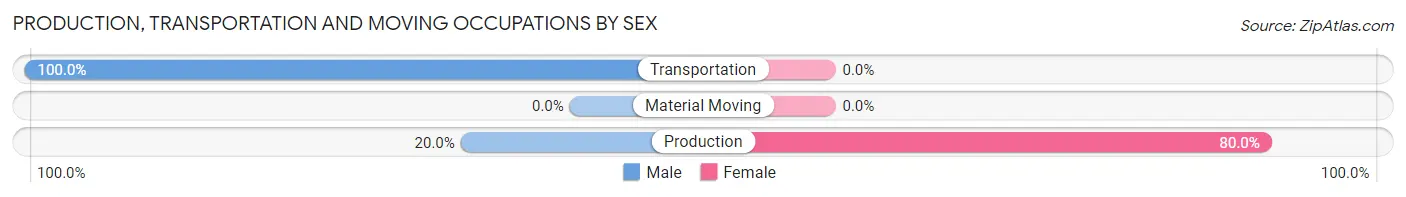
| Occupation | Male | Female |
| Production | 3 (20.0%) | 12 (80.0%) |
| Transportation | 5 (100.0%) | 0 (0.0%) |
| Material Moving | 0 (0.0%) | 0 (0.0%) |
| Total (Category) | 8 (40.0%) | 12 (60.0%) |
| Total (Overall) | 50 (50.5%) | 49 (49.5%) |
Employment Industries by Sex in Ravenna
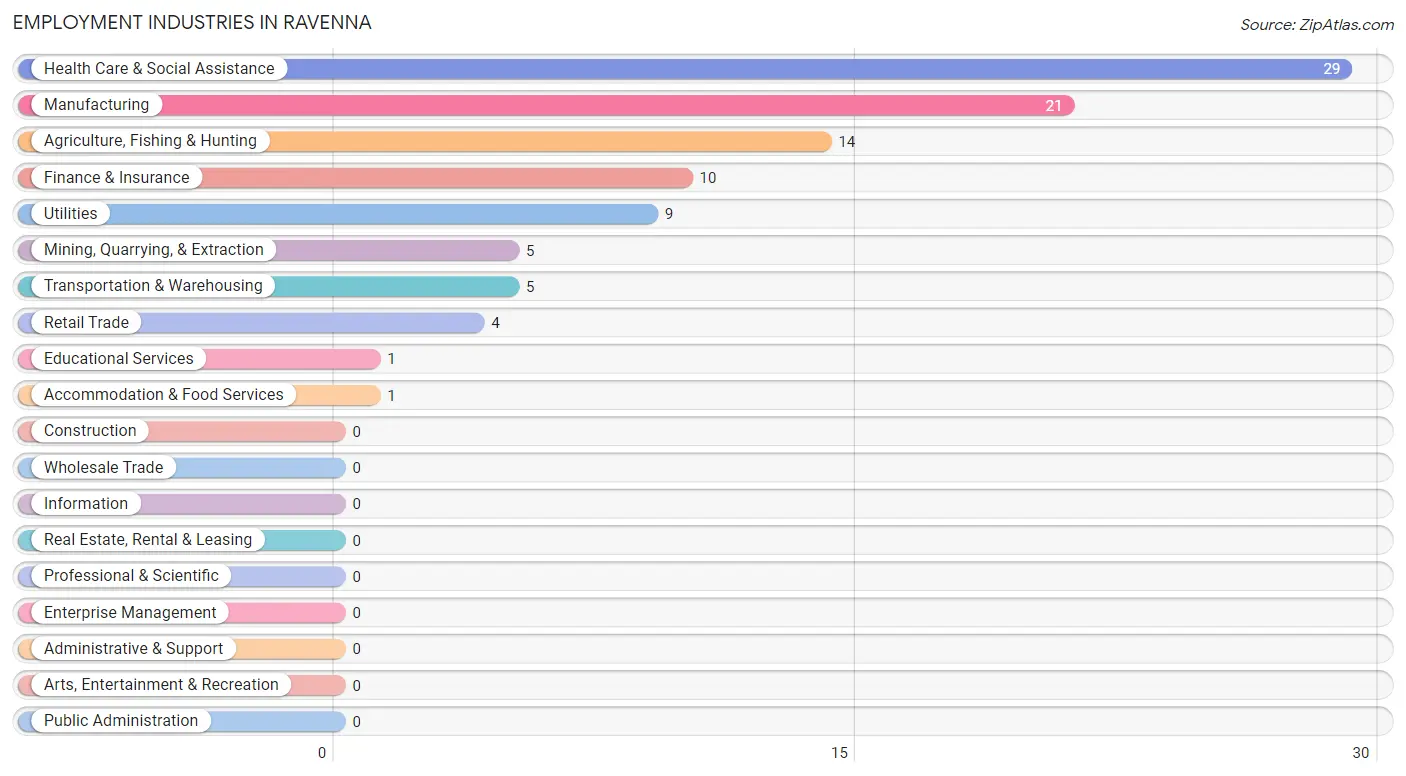
Employment Industries in Ravenna
The major employment industries in Ravenna include Health Care & Social Assistance (29 | 29.3%), Manufacturing (21 | 21.2%), Agriculture, Fishing & Hunting (14 | 14.1%), Finance & Insurance (10 | 10.1%), and Utilities (9 | 9.1%).
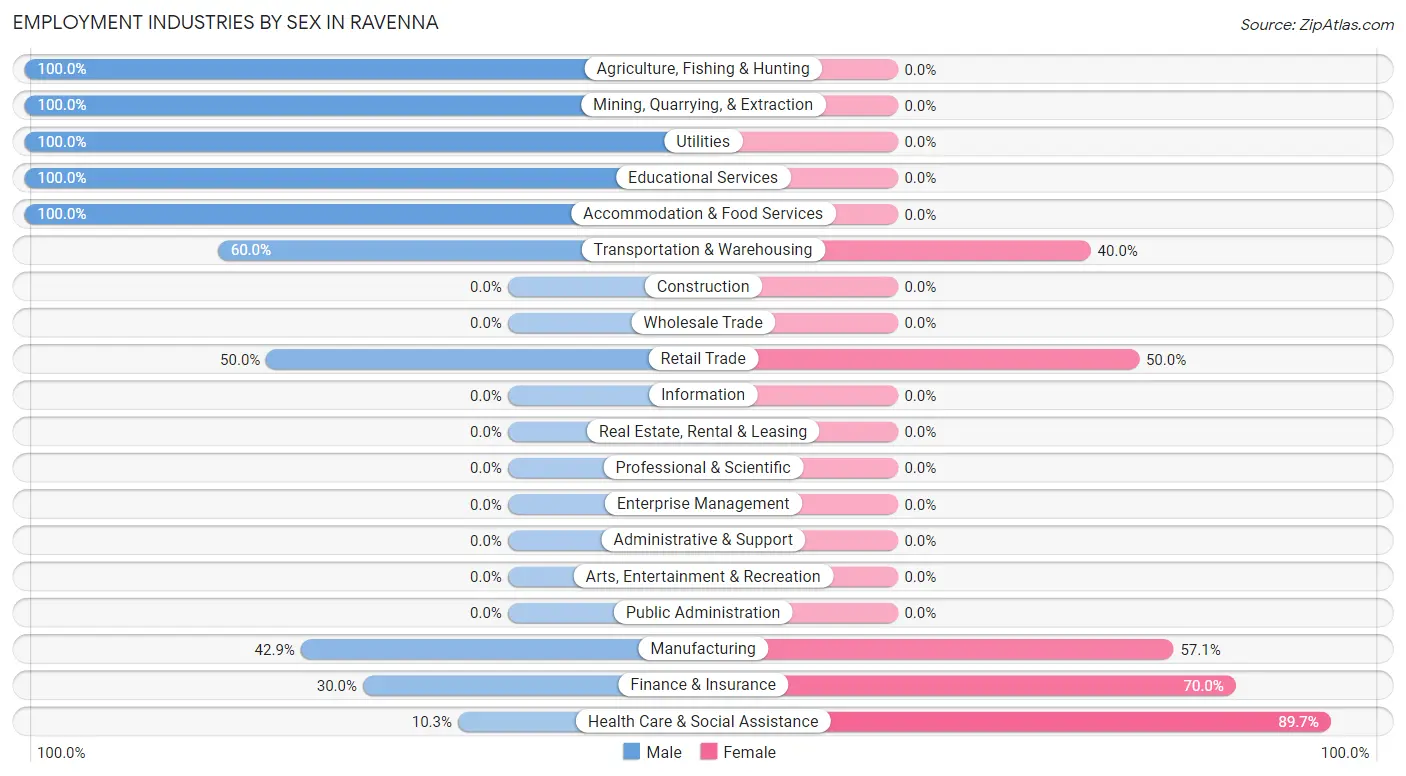
Employment Industries by Sex in Ravenna
The Ravenna industries that see more men than women are Agriculture, Fishing & Hunting (100.0%), Mining, Quarrying, & Extraction (100.0%), and Utilities (100.0%), whereas the industries that tend to have a higher number of women are Health Care & Social Assistance (89.7%), Finance & Insurance (70.0%), and Manufacturing (57.1%).
| Industry | Male | Female |
| Agriculture, Fishing & Hunting | 14 (100.0%) | 0 (0.0%) |
| Mining, Quarrying, & Extraction | 5 (100.0%) | 0 (0.0%) |
| Construction | 0 (0.0%) | 0 (0.0%) |
| Manufacturing | 9 (42.9%) | 12 (57.1%) |
| Wholesale Trade | 0 (0.0%) | 0 (0.0%) |
| Retail Trade | 2 (50.0%) | 2 (50.0%) |
| Transportation & Warehousing | 3 (60.0%) | 2 (40.0%) |
| Utilities | 9 (100.0%) | 0 (0.0%) |
| Information | 0 (0.0%) | 0 (0.0%) |
| Finance & Insurance | 3 (30.0%) | 7 (70.0%) |
| Real Estate, Rental & Leasing | 0 (0.0%) | 0 (0.0%) |
| Professional & Scientific | 0 (0.0%) | 0 (0.0%) |
| Enterprise Management | 0 (0.0%) | 0 (0.0%) |
| Administrative & Support | 0 (0.0%) | 0 (0.0%) |
| Educational Services | 1 (100.0%) | 0 (0.0%) |
| Health Care & Social Assistance | 3 (10.3%) | 26 (89.7%) |
| Arts, Entertainment & Recreation | 0 (0.0%) | 0 (0.0%) |
| Accommodation & Food Services | 1 (100.0%) | 0 (0.0%) |
| Public Administration | 0 (0.0%) | 0 (0.0%) |
| Total | 50 (50.5%) | 49 (49.5%) |
Education in Ravenna
School Enrollment in Ravenna
The most common levels of schooling among the 37 students in Ravenna are elementary school (16 | 43.2%), nursery / preschool (14 | 37.8%), and middle school (7 | 18.9%).
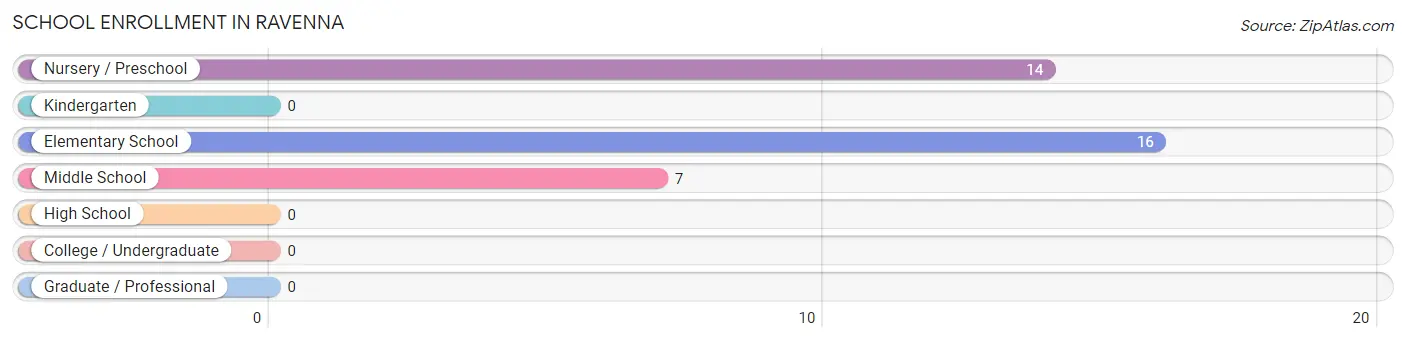
| School Level | # Students | % Students |
| Nursery / Preschool | 14 | 37.8% |
| Kindergarten | 0 | 0.0% |
| Elementary School | 16 | 43.2% |
| Middle School | 7 | 18.9% |
| High School | 0 | 0.0% |
| College / Undergraduate | 0 | 0.0% |
| Graduate / Professional | 0 | 0.0% |
| Total | 37 | 100.0% |
School Enrollment by Age by Funding Source in Ravenna
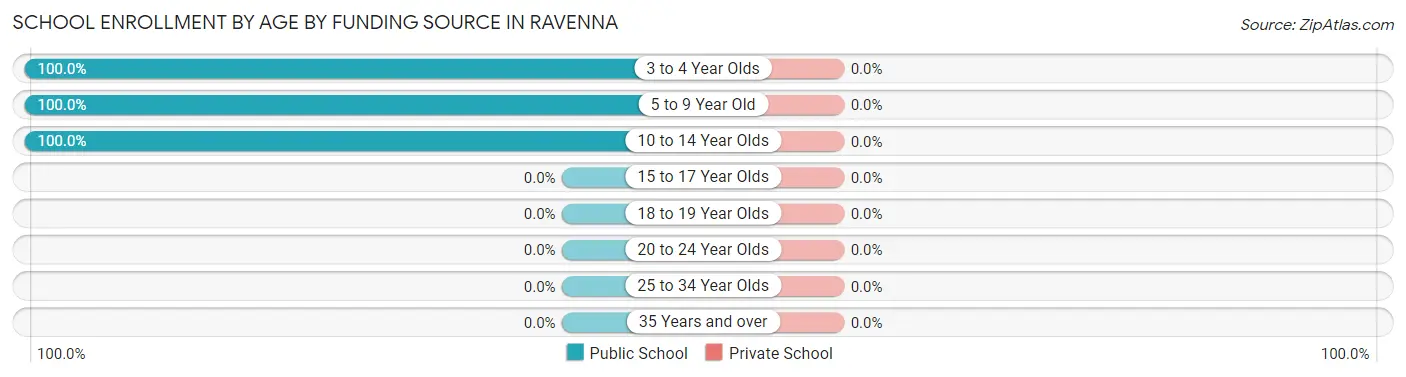
| Age Bracket | Public School | Private School |
| 3 to 4 Year Olds | 14 (100.0%) | 0 (0.0%) |
| 5 to 9 Year Old | 16 (100.0%) | 0 (0.0%) |
| 10 to 14 Year Olds | 7 (100.0%) | 0 (0.0%) |
| 15 to 17 Year Olds | 0 (0.0%) | 0 (0.0%) |
| 18 to 19 Year Olds | 0 (0.0%) | 0 (0.0%) |
| 20 to 24 Year Olds | 0 (0.0%) | 0 (0.0%) |
| 25 to 34 Year Olds | 0 (0.0%) | 0 (0.0%) |
| 35 Years and over | 0 (0.0%) | 0 (0.0%) |
| Total | 37 (100.0%) | 0 (0.0%) |
Educational Attainment by Field of Study in Ravenna
Computers & mathematics (12 | 32.4%), business (10 | 27.0%), education (8 | 21.6%), bio, nature & agricultural (6 | 16.2%), and literature & languages (1 | 2.7%) are the most common fields of study among 37 individuals in Ravenna who have obtained a bachelor's degree or higher.
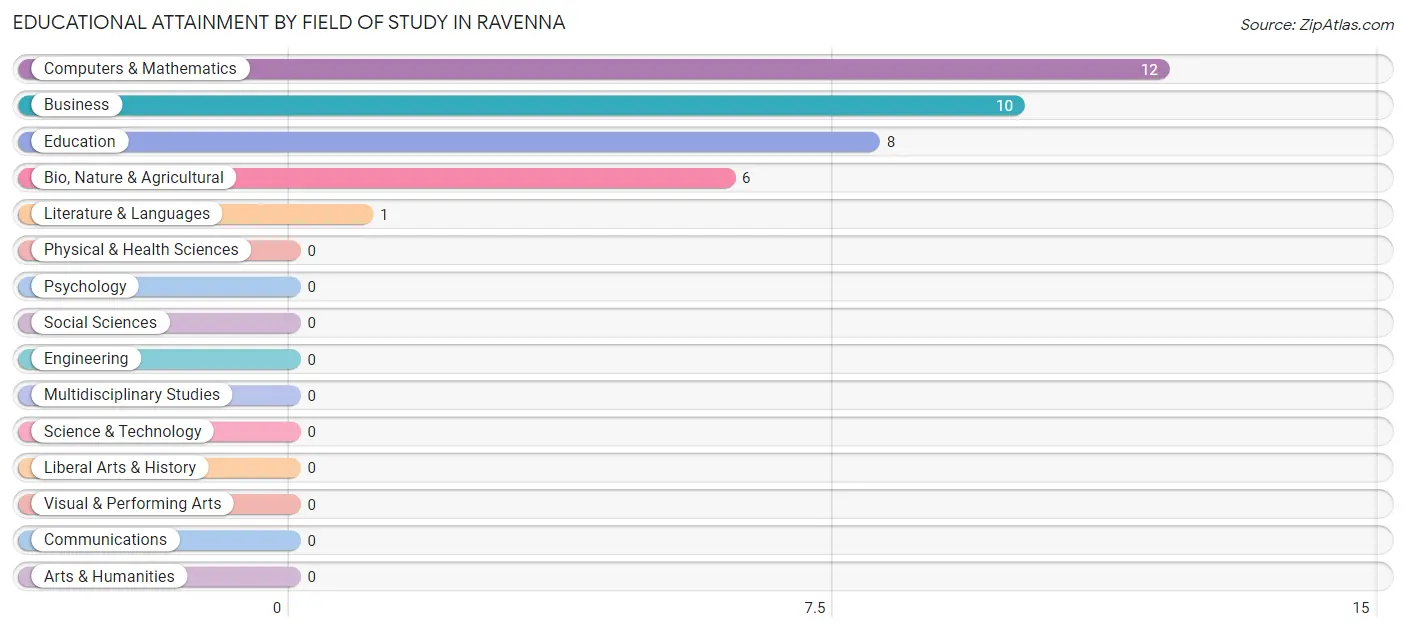
| Field of Study | # Graduates | % Graduates |
| Computers & Mathematics | 12 | 32.4% |
| Bio, Nature & Agricultural | 6 | 16.2% |
| Physical & Health Sciences | 0 | 0.0% |
| Psychology | 0 | 0.0% |
| Social Sciences | 0 | 0.0% |
| Engineering | 0 | 0.0% |
| Multidisciplinary Studies | 0 | 0.0% |
| Science & Technology | 0 | 0.0% |
| Business | 10 | 27.0% |
| Education | 8 | 21.6% |
| Literature & Languages | 1 | 2.7% |
| Liberal Arts & History | 0 | 0.0% |
| Visual & Performing Arts | 0 | 0.0% |
| Communications | 0 | 0.0% |
| Arts & Humanities | 0 | 0.0% |
| Total | 37 | 100.0% |
Transportation & Commute in Ravenna
Vehicle Availability by Sex in Ravenna
The most prevalent vehicle ownership categories in Ravenna are males with 3 vehicles (23, accounting for 46.0%) and females with 3 vehicles (14, making up 46.9%).
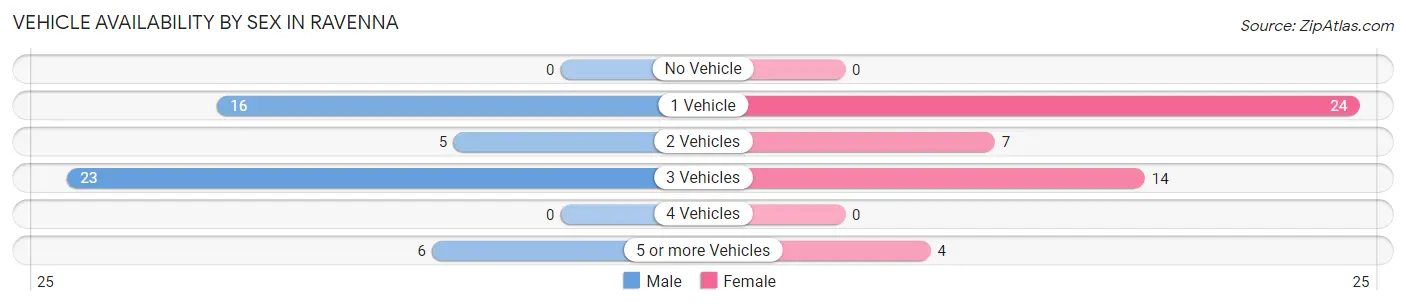
| Vehicles Available | Male | Female |
| No Vehicle | 0 (0.0%) | 0 (0.0%) |
| 1 Vehicle | 16 (32.0%) | 24 (49.0%) |
| 2 Vehicles | 5 (10.0%) | 7 (14.3%) |
| 3 Vehicles | 23 (46.0%) | 14 (28.6%) |
| 4 Vehicles | 0 (0.0%) | 0 (0.0%) |
| 5 or more Vehicles | 6 (12.0%) | 4 (8.2%) |
| Total | 50 (100.0%) | 49 (100.0%) |
Commute Time in Ravenna
The most frequently occuring commute durations in Ravenna are 15 to 19 minutes (28 commuters, 32.6%), 90 or more minutes (15 commuters, 17.4%), and 60 to 89 minutes (12 commuters, 14.0%).
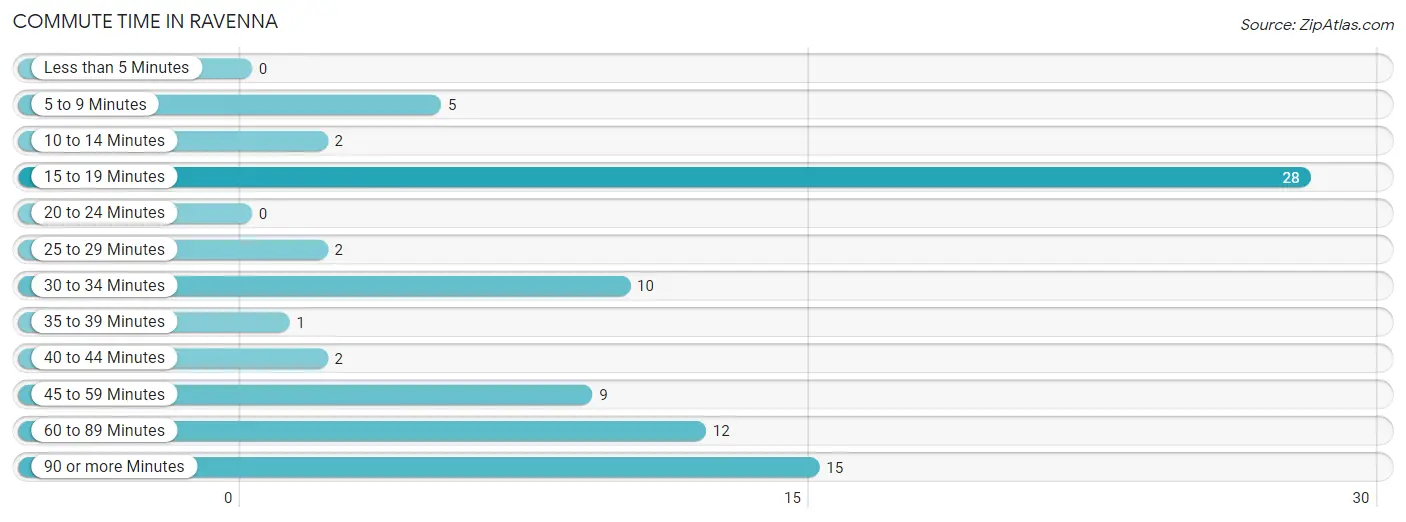
| Commute Time | # Commuters | % Commuters |
| Less than 5 Minutes | 0 | 0.0% |
| 5 to 9 Minutes | 5 | 5.8% |
| 10 to 14 Minutes | 2 | 2.3% |
| 15 to 19 Minutes | 28 | 32.6% |
| 20 to 24 Minutes | 0 | 0.0% |
| 25 to 29 Minutes | 2 | 2.3% |
| 30 to 34 Minutes | 10 | 11.6% |
| 35 to 39 Minutes | 1 | 1.2% |
| 40 to 44 Minutes | 2 | 2.3% |
| 45 to 59 Minutes | 9 | 10.5% |
| 60 to 89 Minutes | 12 | 14.0% |
| 90 or more Minutes | 15 | 17.4% |
Commute Time by Sex in Ravenna
The most common commute times in Ravenna are 15 to 19 minutes (20 commuters, 48.8%) for males and 90 or more minutes (15 commuters, 33.3%) for females.
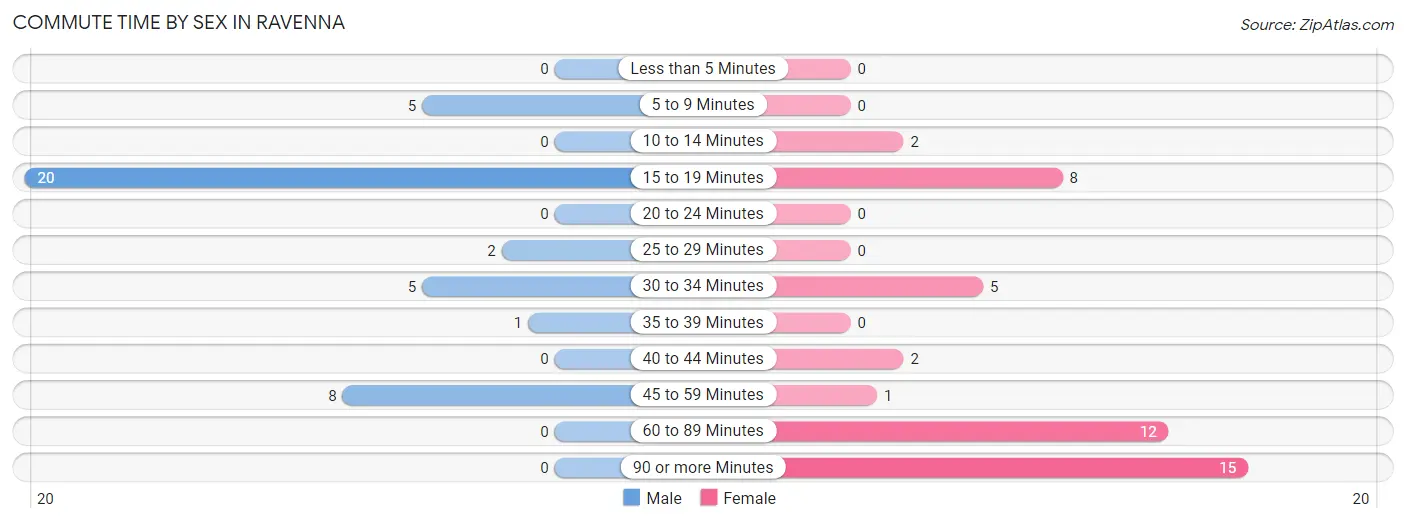
| Commute Time | Male | Female |
| Less than 5 Minutes | 0 (0.0%) | 0 (0.0%) |
| 5 to 9 Minutes | 5 (12.2%) | 0 (0.0%) |
| 10 to 14 Minutes | 0 (0.0%) | 2 (4.4%) |
| 15 to 19 Minutes | 20 (48.8%) | 8 (17.8%) |
| 20 to 24 Minutes | 0 (0.0%) | 0 (0.0%) |
| 25 to 29 Minutes | 2 (4.9%) | 0 (0.0%) |
| 30 to 34 Minutes | 5 (12.2%) | 5 (11.1%) |
| 35 to 39 Minutes | 1 (2.4%) | 0 (0.0%) |
| 40 to 44 Minutes | 0 (0.0%) | 2 (4.4%) |
| 45 to 59 Minutes | 8 (19.5%) | 1 (2.2%) |
| 60 to 89 Minutes | 0 (0.0%) | 12 (26.7%) |
| 90 or more Minutes | 0 (0.0%) | 15 (33.3%) |
Time of Departure to Work by Sex in Ravenna
The most frequent times of departure to work in Ravenna are 12:00 AM to 4:59 AM (9, 22.0%) for males and 5:00 AM to 5:29 AM (14, 31.1%) for females.
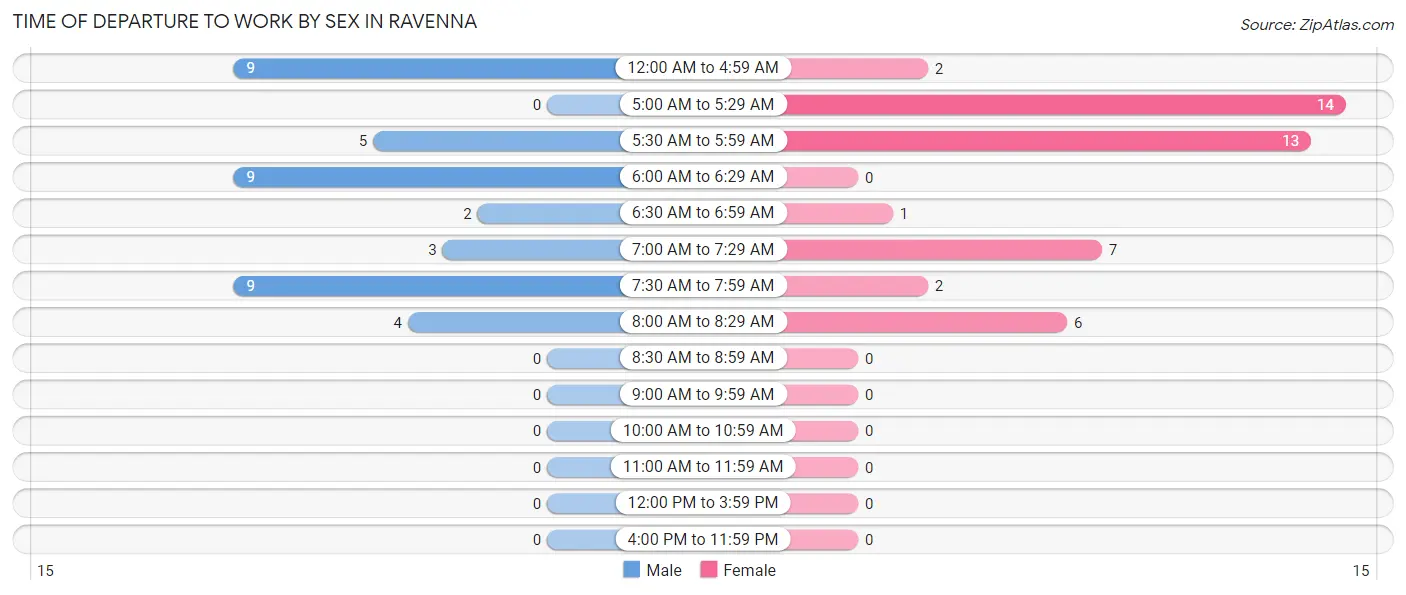
| Time of Departure | Male | Female |
| 12:00 AM to 4:59 AM | 9 (22.0%) | 2 (4.4%) |
| 5:00 AM to 5:29 AM | 0 (0.0%) | 14 (31.1%) |
| 5:30 AM to 5:59 AM | 5 (12.2%) | 13 (28.9%) |
| 6:00 AM to 6:29 AM | 9 (22.0%) | 0 (0.0%) |
| 6:30 AM to 6:59 AM | 2 (4.9%) | 1 (2.2%) |
| 7:00 AM to 7:29 AM | 3 (7.3%) | 7 (15.6%) |
| 7:30 AM to 7:59 AM | 9 (22.0%) | 2 (4.4%) |
| 8:00 AM to 8:29 AM | 4 (9.8%) | 6 (13.3%) |
| 8:30 AM to 8:59 AM | 0 (0.0%) | 0 (0.0%) |
| 9:00 AM to 9:59 AM | 0 (0.0%) | 0 (0.0%) |
| 10:00 AM to 10:59 AM | 0 (0.0%) | 0 (0.0%) |
| 11:00 AM to 11:59 AM | 0 (0.0%) | 0 (0.0%) |
| 12:00 PM to 3:59 PM | 0 (0.0%) | 0 (0.0%) |
| 4:00 PM to 11:59 PM | 0 (0.0%) | 0 (0.0%) |
| Total | 41 (100.0%) | 45 (100.0%) |
Housing Occupancy in Ravenna
Occupancy by Ownership in Ravenna
Of the total 87 dwellings in Ravenna, owner-occupied units account for 79 (90.8%), while renter-occupied units make up 8 (9.2%).
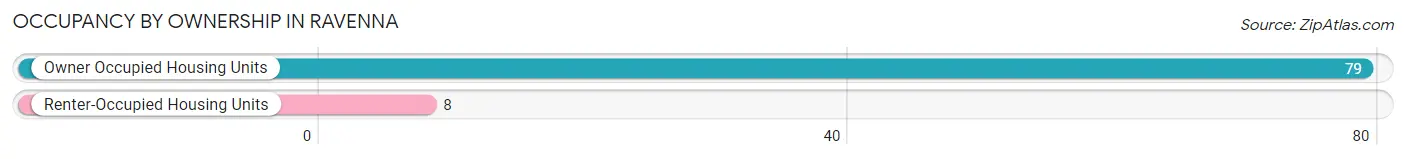
| Occupancy | # Housing Units | % Housing Units |
| Owner Occupied Housing Units | 79 | 90.8% |
| Renter-Occupied Housing Units | 8 | 9.2% |
| Total Occupied Housing Units | 87 | 100.0% |
Occupancy by Household Size in Ravenna
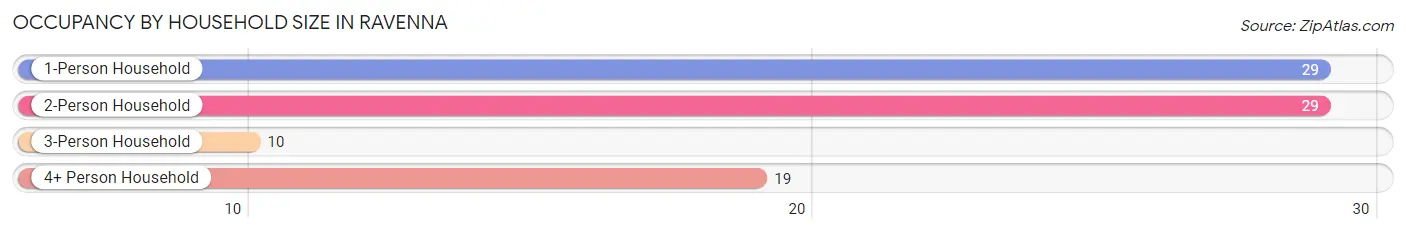
| Household Size | # Housing Units | % Housing Units |
| 1-Person Household | 29 | 33.3% |
| 2-Person Household | 29 | 33.3% |
| 3-Person Household | 10 | 11.5% |
| 4+ Person Household | 19 | 21.8% |
| Total Housing Units | 87 | 100.0% |
Occupancy by Ownership by Household Size in Ravenna
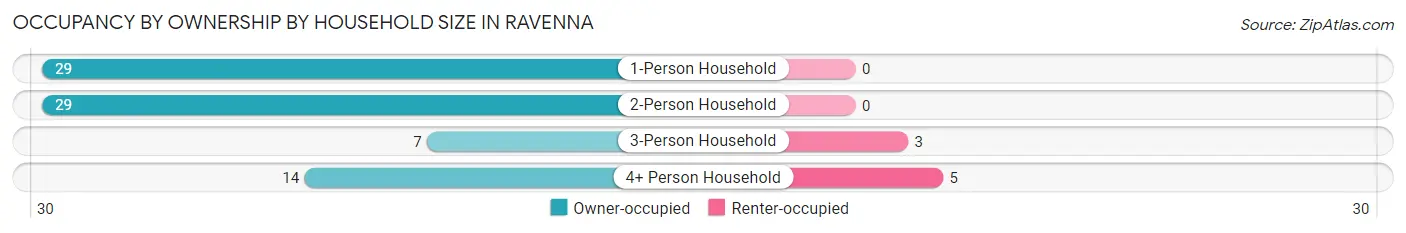
| Household Size | Owner-occupied | Renter-occupied |
| 1-Person Household | 29 (100.0%) | 0 (0.0%) |
| 2-Person Household | 29 (100.0%) | 0 (0.0%) |
| 3-Person Household | 7 (70.0%) | 3 (30.0%) |
| 4+ Person Household | 14 (73.7%) | 5 (26.3%) |
| Total Housing Units | 79 (90.8%) | 8 (9.2%) |
Occupancy by Educational Attainment in Ravenna
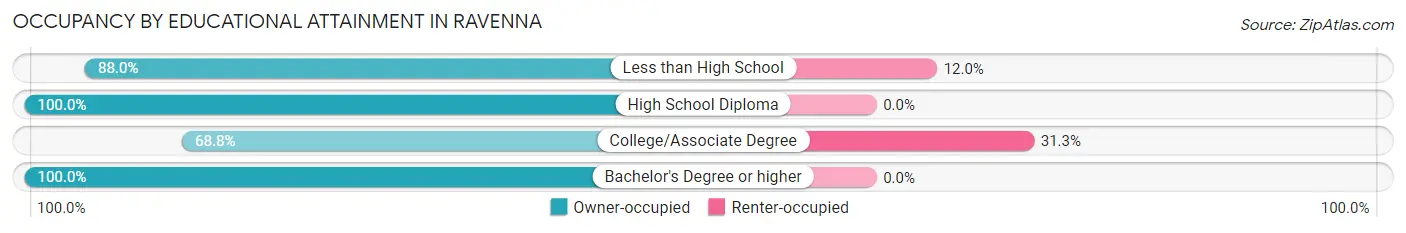
| Household Size | Owner-occupied | Renter-occupied |
| Less than High School | 22 (88.0%) | 3 (12.0%) |
| High School Diploma | 16 (100.0%) | 0 (0.0%) |
| College/Associate Degree | 11 (68.8%) | 5 (31.2%) |
| Bachelor's Degree or higher | 30 (100.0%) | 0 (0.0%) |
Occupancy by Age of Householder in Ravenna
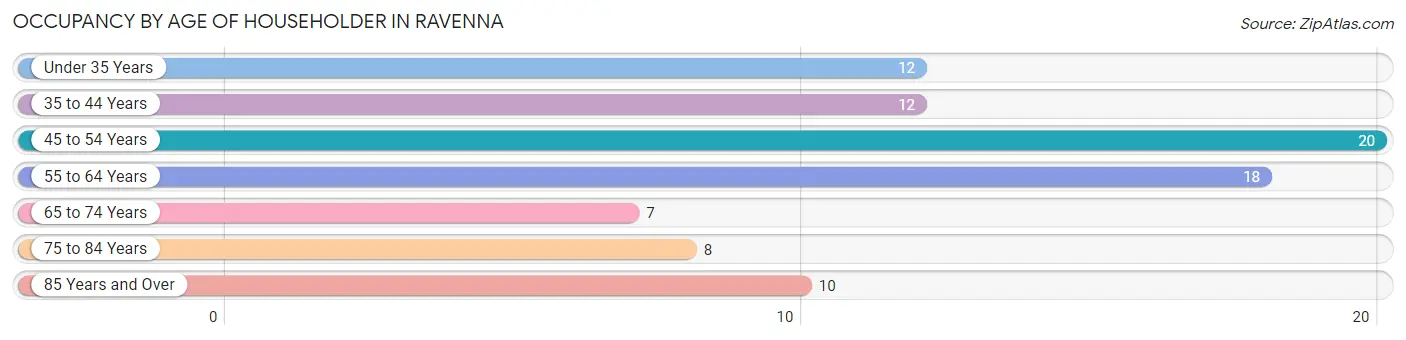
| Age Bracket | # Households | % Households |
| Under 35 Years | 12 | 13.8% |
| 35 to 44 Years | 12 | 13.8% |
| 45 to 54 Years | 20 | 23.0% |
| 55 to 64 Years | 18 | 20.7% |
| 65 to 74 Years | 7 | 8.1% |
| 75 to 84 Years | 8 | 9.2% |
| 85 Years and Over | 10 | 11.5% |
| Total | 87 | 100.0% |
Housing Finances in Ravenna
Median Income by Occupancy in Ravenna
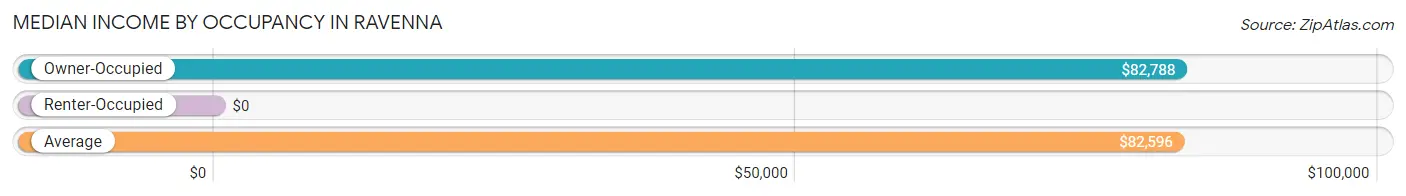
| Occupancy Type | # Households | Median Income |
| Owner-Occupied | 79 (90.8%) | $82,788 |
| Renter-Occupied | 8 (9.2%) | $0 |
| Average | 87 (100.0%) | $82,596 |
Occupancy by Householder Income Bracket in Ravenna
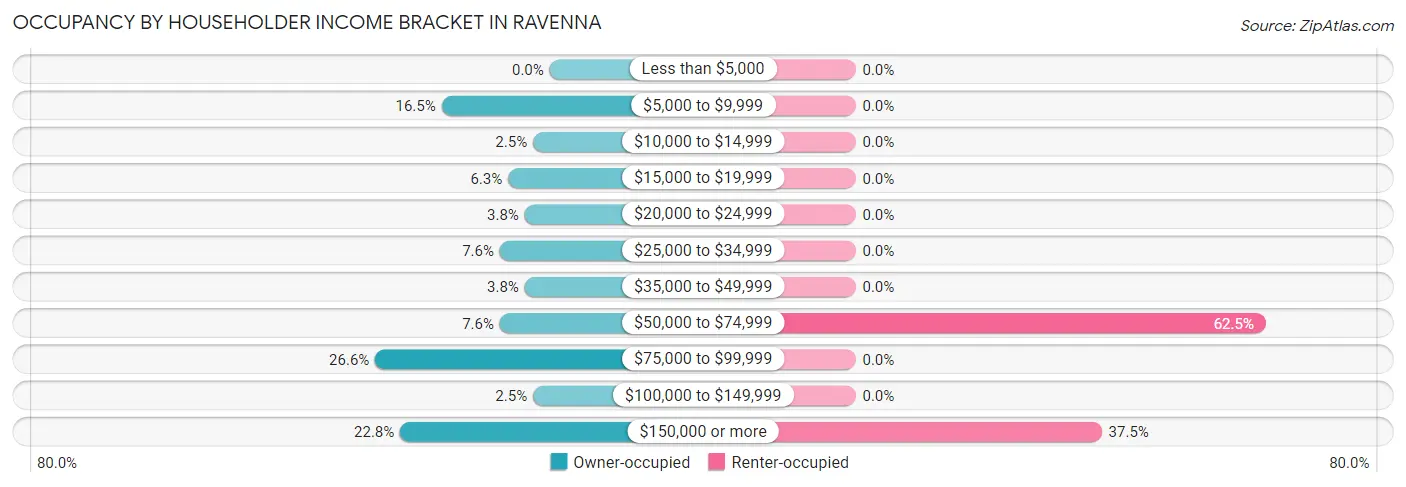
| Income Bracket | Owner-occupied | Renter-occupied |
| Less than $5,000 | 0 (0.0%) | 0 (0.0%) |
| $5,000 to $9,999 | 13 (16.5%) | 0 (0.0%) |
| $10,000 to $14,999 | 2 (2.5%) | 0 (0.0%) |
| $15,000 to $19,999 | 5 (6.3%) | 0 (0.0%) |
| $20,000 to $24,999 | 3 (3.8%) | 0 (0.0%) |
| $25,000 to $34,999 | 6 (7.6%) | 0 (0.0%) |
| $35,000 to $49,999 | 3 (3.8%) | 0 (0.0%) |
| $50,000 to $74,999 | 6 (7.6%) | 5 (62.5%) |
| $75,000 to $99,999 | 21 (26.6%) | 0 (0.0%) |
| $100,000 to $149,999 | 2 (2.5%) | 0 (0.0%) |
| $150,000 or more | 18 (22.8%) | 3 (37.5%) |
| Total | 79 (100.0%) | 8 (100.0%) |
Monthly Housing Cost Tiers in Ravenna
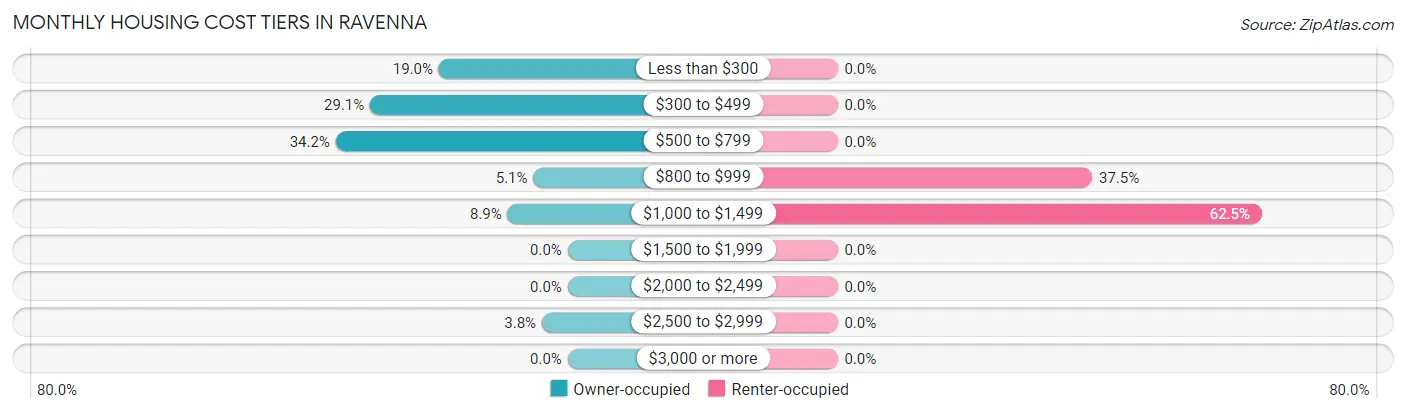
| Monthly Cost | Owner-occupied | Renter-occupied |
| Less than $300 | 15 (19.0%) | 0 (0.0%) |
| $300 to $499 | 23 (29.1%) | 0 (0.0%) |
| $500 to $799 | 27 (34.2%) | 0 (0.0%) |
| $800 to $999 | 4 (5.1%) | 3 (37.5%) |
| $1,000 to $1,499 | 7 (8.9%) | 5 (62.5%) |
| $1,500 to $1,999 | 0 (0.0%) | 0 (0.0%) |
| $2,000 to $2,499 | 0 (0.0%) | 0 (0.0%) |
| $2,500 to $2,999 | 3 (3.8%) | 0 (0.0%) |
| $3,000 or more | 0 (0.0%) | 0 (0.0%) |
| Total | 79 (100.0%) | 8 (100.0%) |
Physical Housing Characteristics in Ravenna
Housing Structures in Ravenna
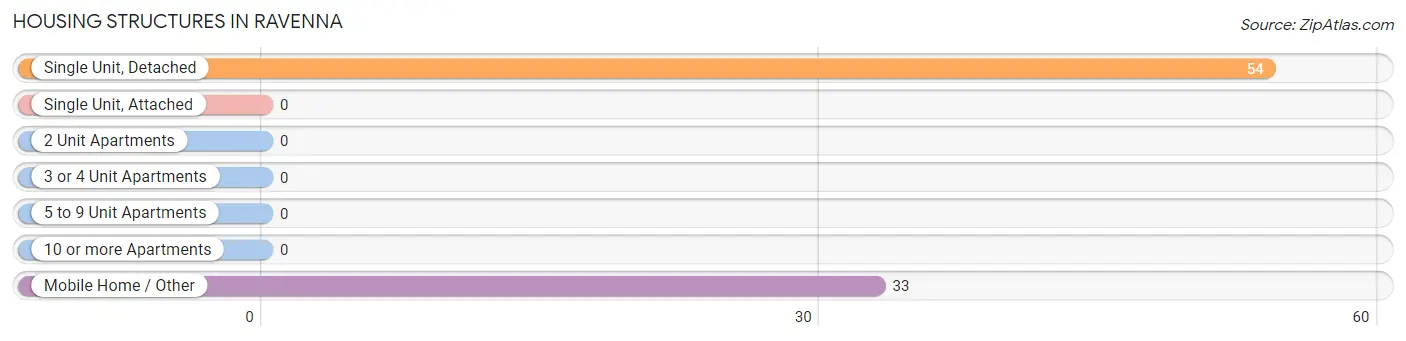
| Structure Type | # Housing Units | % Housing Units |
| Single Unit, Detached | 54 | 62.1% |
| Single Unit, Attached | 0 | 0.0% |
| 2 Unit Apartments | 0 | 0.0% |
| 3 or 4 Unit Apartments | 0 | 0.0% |
| 5 to 9 Unit Apartments | 0 | 0.0% |
| 10 or more Apartments | 0 | 0.0% |
| Mobile Home / Other | 33 | 37.9% |
| Total | 87 | 100.0% |
Housing Structures by Occupancy in Ravenna
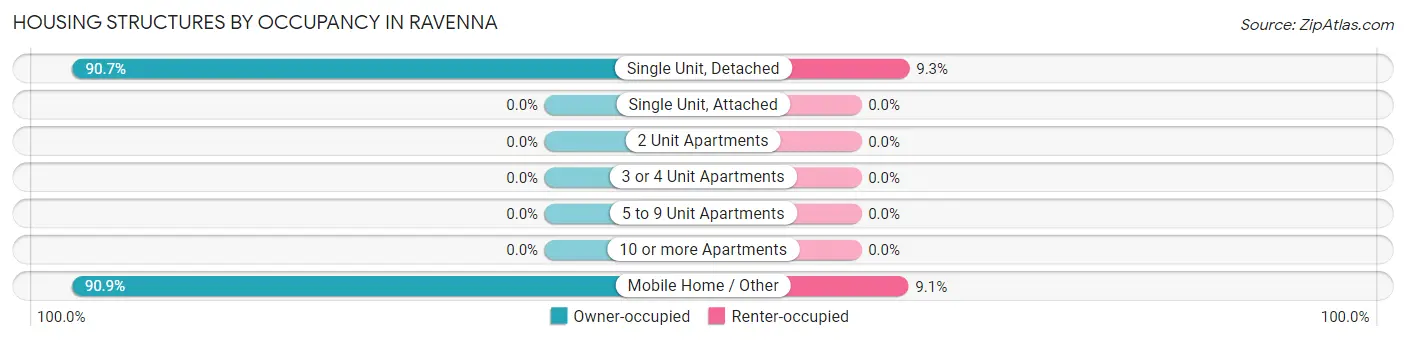
| Structure Type | Owner-occupied | Renter-occupied |
| Single Unit, Detached | 49 (90.7%) | 5 (9.3%) |
| Single Unit, Attached | 0 (0.0%) | 0 (0.0%) |
| 2 Unit Apartments | 0 (0.0%) | 0 (0.0%) |
| 3 or 4 Unit Apartments | 0 (0.0%) | 0 (0.0%) |
| 5 to 9 Unit Apartments | 0 (0.0%) | 0 (0.0%) |
| 10 or more Apartments | 0 (0.0%) | 0 (0.0%) |
| Mobile Home / Other | 30 (90.9%) | 3 (9.1%) |
| Total | 79 (90.8%) | 8 (9.2%) |
Housing Structures by Number of Rooms in Ravenna
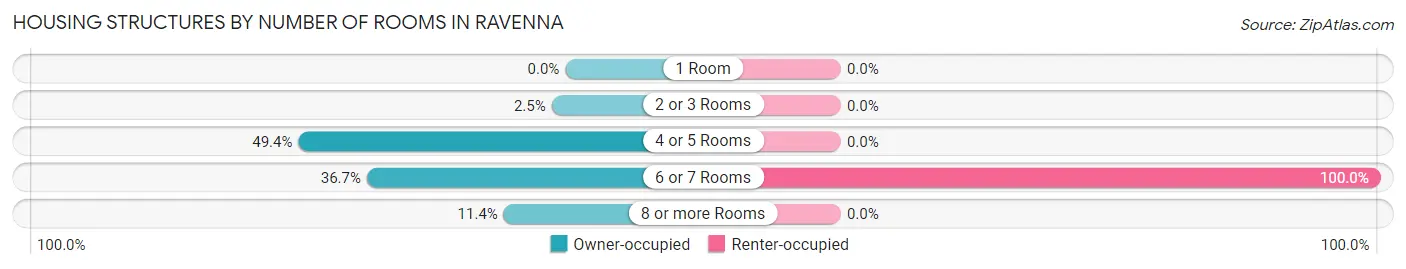
| Number of Rooms | Owner-occupied | Renter-occupied |
| 1 Room | 0 (0.0%) | 0 (0.0%) |
| 2 or 3 Rooms | 2 (2.5%) | 0 (0.0%) |
| 4 or 5 Rooms | 39 (49.4%) | 0 (0.0%) |
| 6 or 7 Rooms | 29 (36.7%) | 8 (100.0%) |
| 8 or more Rooms | 9 (11.4%) | 0 (0.0%) |
| Total | 79 (100.0%) | 8 (100.0%) |
Housing Structure by Heating Type in Ravenna
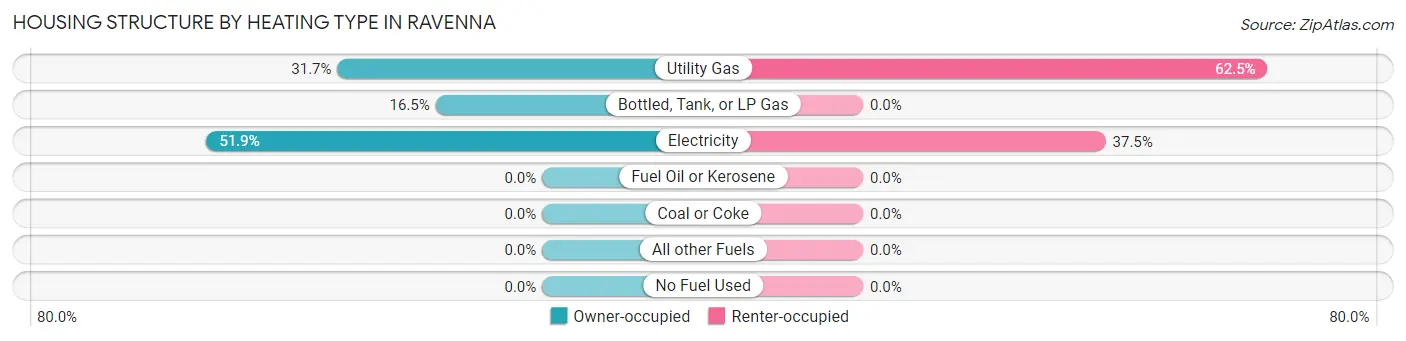
| Heating Type | Owner-occupied | Renter-occupied |
| Utility Gas | 25 (31.7%) | 5 (62.5%) |
| Bottled, Tank, or LP Gas | 13 (16.5%) | 0 (0.0%) |
| Electricity | 41 (51.9%) | 3 (37.5%) |
| Fuel Oil or Kerosene | 0 (0.0%) | 0 (0.0%) |
| Coal or Coke | 0 (0.0%) | 0 (0.0%) |
| All other Fuels | 0 (0.0%) | 0 (0.0%) |
| No Fuel Used | 0 (0.0%) | 0 (0.0%) |
| Total | 79 (100.0%) | 8 (100.0%) |
Household Vehicle Usage in Ravenna
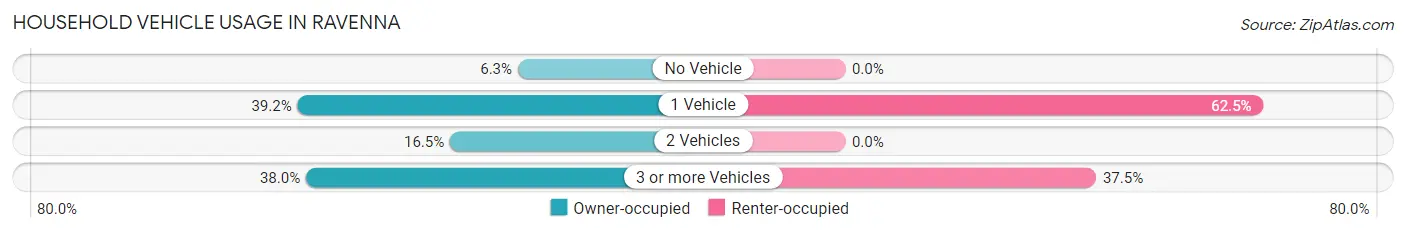
| Vehicles per Household | Owner-occupied | Renter-occupied |
| No Vehicle | 5 (6.3%) | 0 (0.0%) |
| 1 Vehicle | 31 (39.2%) | 5 (62.5%) |
| 2 Vehicles | 13 (16.5%) | 0 (0.0%) |
| 3 or more Vehicles | 30 (38.0%) | 3 (37.5%) |
| Total | 79 (100.0%) | 8 (100.0%) |
Real Estate & Mortgages in Ravenna
Real Estate and Mortgage Overview in Ravenna
| Characteristic | Without Mortgage | With Mortgage |
| Housing Units | 52 | 27 |
| Median Property Value | $125,000 | $77,100 |
| Median Household Income | - | - |
| Monthly Housing Costs | $379 | $0 |
| Real Estate Taxes | $771 | $12 |
Property Value by Mortgage Status in Ravenna
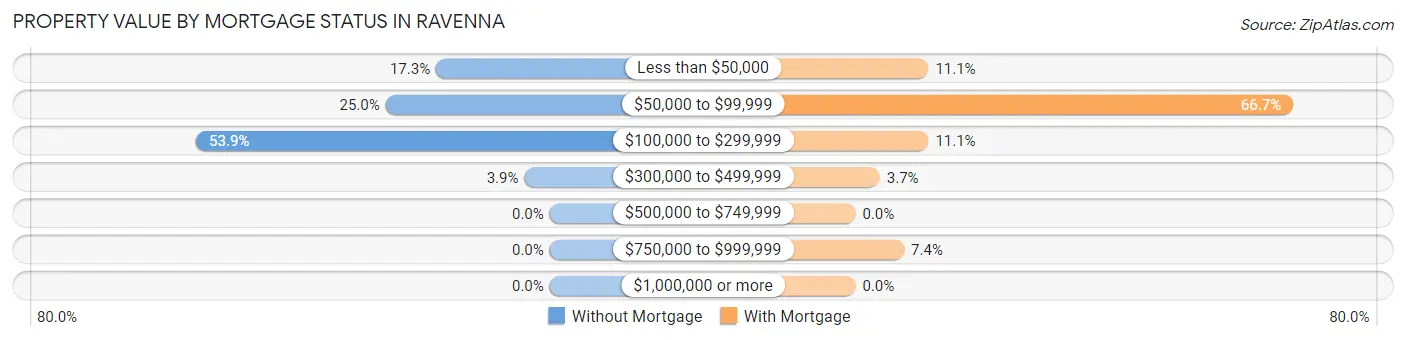
| Property Value | Without Mortgage | With Mortgage |
| Less than $50,000 | 9 (17.3%) | 3 (11.1%) |
| $50,000 to $99,999 | 13 (25.0%) | 18 (66.7%) |
| $100,000 to $299,999 | 28 (53.8%) | 3 (11.1%) |
| $300,000 to $499,999 | 2 (3.8%) | 1 (3.7%) |
| $500,000 to $749,999 | 0 (0.0%) | 0 (0.0%) |
| $750,000 to $999,999 | 0 (0.0%) | 2 (7.4%) |
| $1,000,000 or more | 0 (0.0%) | 0 (0.0%) |
| Total | 52 (100.0%) | 27 (100.0%) |
Household Income by Mortgage Status in Ravenna
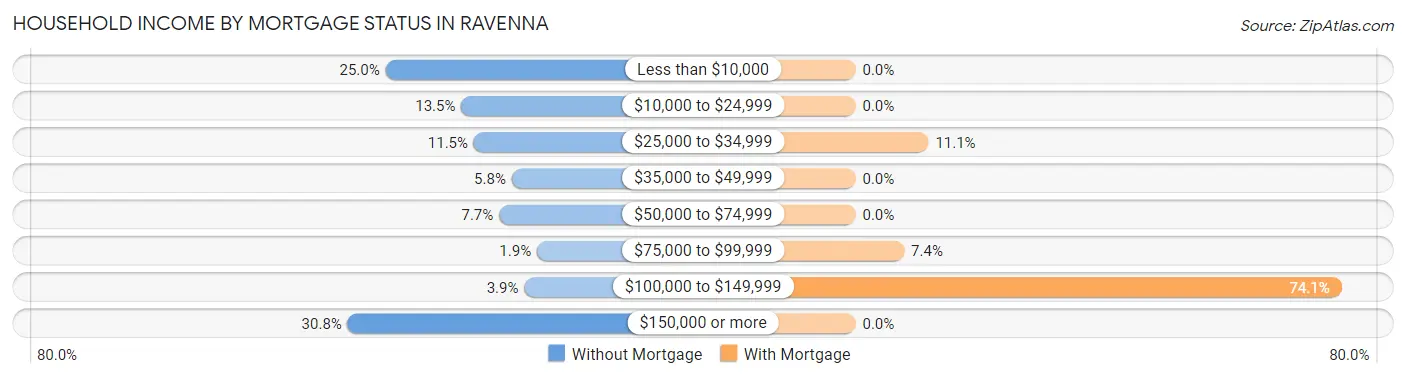
| Household Income | Without Mortgage | With Mortgage |
| Less than $10,000 | 13 (25.0%) | 0 (0.0%) |
| $10,000 to $24,999 | 7 (13.5%) | 0 (0.0%) |
| $25,000 to $34,999 | 6 (11.5%) | 3 (11.1%) |
| $35,000 to $49,999 | 3 (5.8%) | 0 (0.0%) |
| $50,000 to $74,999 | 4 (7.7%) | 0 (0.0%) |
| $75,000 to $99,999 | 1 (1.9%) | 2 (7.4%) |
| $100,000 to $149,999 | 2 (3.8%) | 20 (74.1%) |
| $150,000 or more | 16 (30.8%) | 0 (0.0%) |
| Total | 52 (100.0%) | 27 (100.0%) |
Property Value to Household Income Ratio in Ravenna
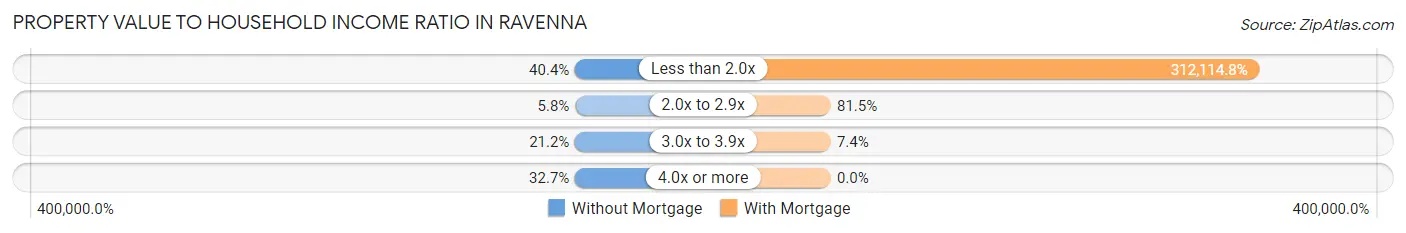
| Value-to-Income Ratio | Without Mortgage | With Mortgage |
| Less than 2.0x | 21 (40.4%) | 84,271 (312,114.8%) |
| 2.0x to 2.9x | 3 (5.8%) | 22 (81.5%) |
| 3.0x to 3.9x | 11 (21.1%) | 2 (7.4%) |
| 4.0x or more | 17 (32.7%) | 0 (0.0%) |
| Total | 52 (100.0%) | 27 (100.0%) |
Real Estate Taxes by Mortgage Status in Ravenna
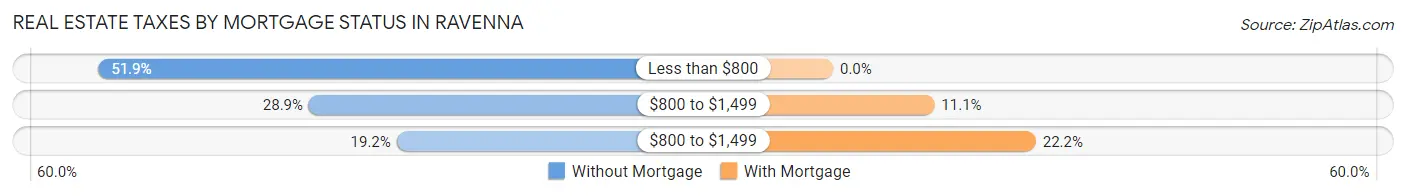
| Property Taxes | Without Mortgage | With Mortgage |
| Less than $800 | 27 (51.9%) | 0 (0.0%) |
| $800 to $1,499 | 15 (28.8%) | 3 (11.1%) |
| $800 to $1,499 | 10 (19.2%) | 6 (22.2%) |
| Total | 52 (100.0%) | 27 (100.0%) |
Health & Disability in Ravenna
Health Insurance Coverage by Age in Ravenna
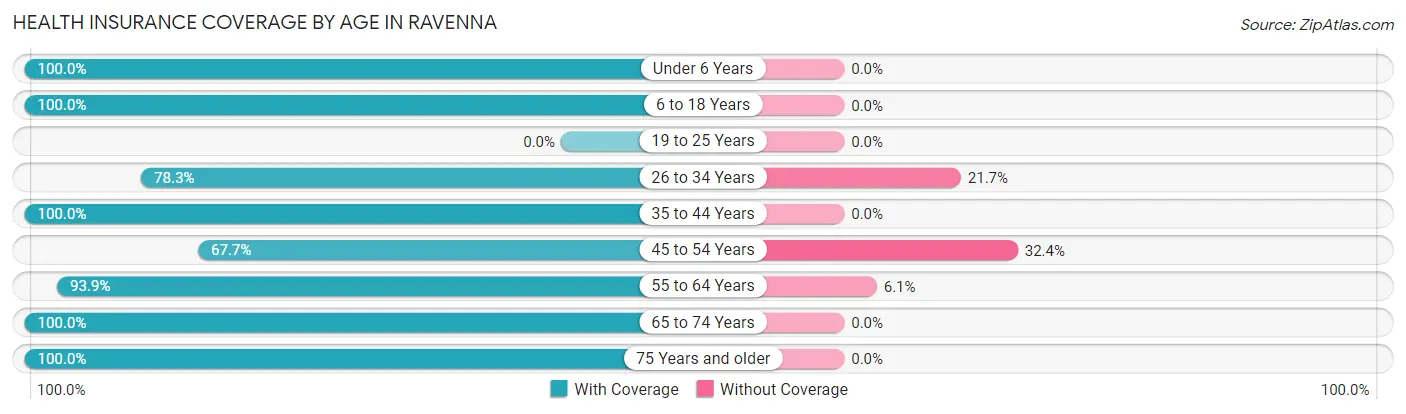
| Age Bracket | With Coverage | Without Coverage |
| Under 6 Years | 23 (100.0%) | 0 (0.0%) |
| 6 to 18 Years | 23 (100.0%) | 0 (0.0%) |
| 19 to 25 Years | 0 (0.0%) | 0 (0.0%) |
| 26 to 34 Years | 18 (78.3%) | 5 (21.7%) |
| 35 to 44 Years | 29 (100.0%) | 0 (0.0%) |
| 45 to 54 Years | 23 (67.6%) | 11 (32.4%) |
| 55 to 64 Years | 31 (93.9%) | 2 (6.1%) |
| 65 to 74 Years | 12 (100.0%) | 0 (0.0%) |
| 75 Years and older | 19 (100.0%) | 0 (0.0%) |
| Total | 178 (90.8%) | 18 (9.2%) |
Health Insurance Coverage by Citizenship Status in Ravenna
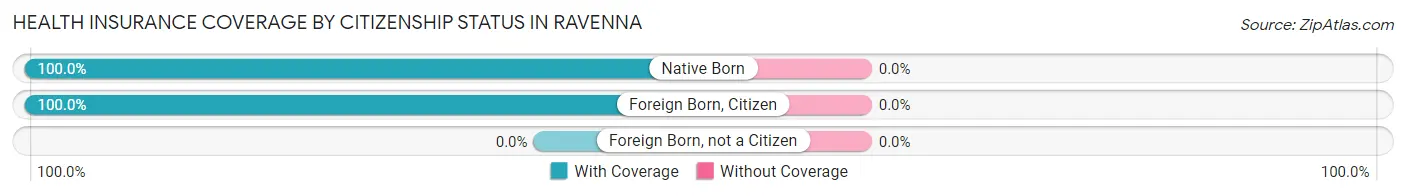
| Citizenship Status | With Coverage | Without Coverage |
| Native Born | 23 (100.0%) | 0 (0.0%) |
| Foreign Born, Citizen | 23 (100.0%) | 0 (0.0%) |
| Foreign Born, not a Citizen | 0 (0.0%) | 0 (0.0%) |
Health Insurance Coverage by Household Income in Ravenna
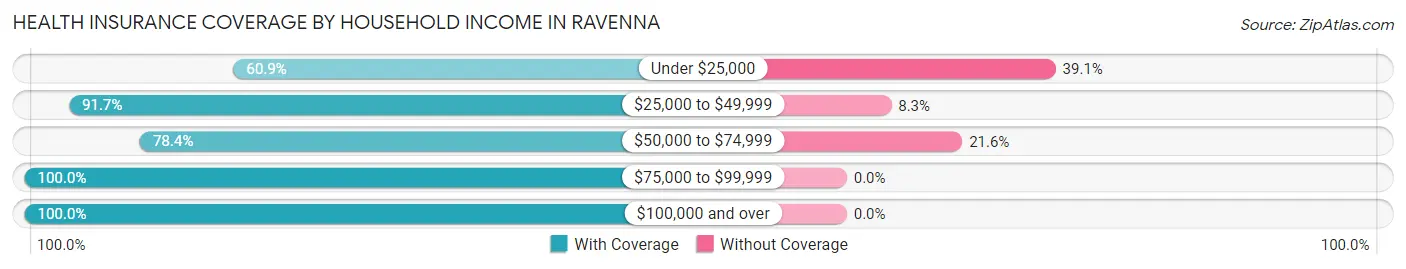
| Household Income | With Coverage | Without Coverage |
| Under $25,000 | 14 (60.9%) | 9 (39.1%) |
| $25,000 to $49,999 | 11 (91.7%) | 1 (8.3%) |
| $50,000 to $74,999 | 29 (78.4%) | 8 (21.6%) |
| $75,000 to $99,999 | 73 (100.0%) | 0 (0.0%) |
| $100,000 and over | 51 (100.0%) | 0 (0.0%) |
Public vs Private Health Insurance Coverage by Age in Ravenna
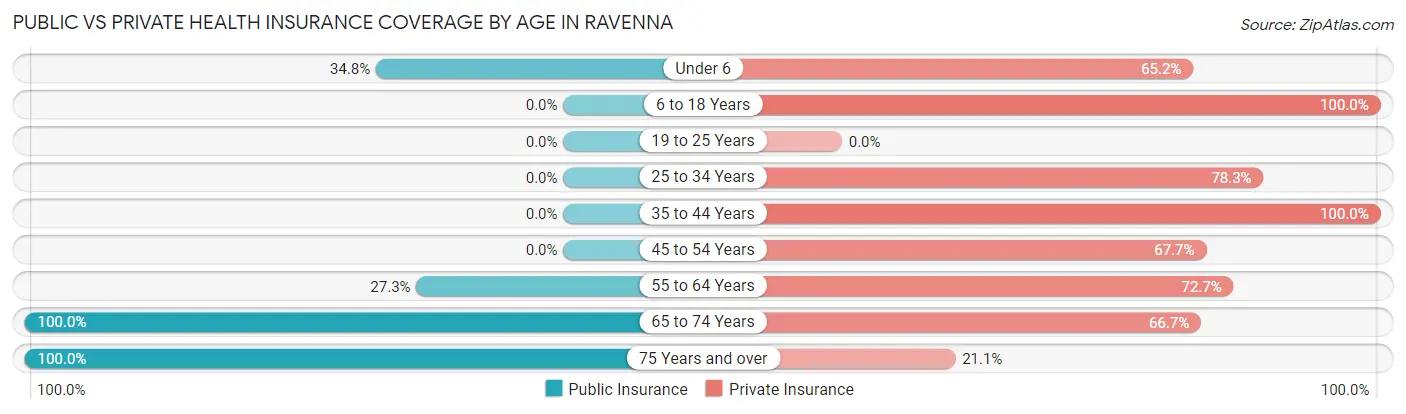
| Age Bracket | Public Insurance | Private Insurance |
| Under 6 | 8 (34.8%) | 15 (65.2%) |
| 6 to 18 Years | 0 (0.0%) | 23 (100.0%) |
| 19 to 25 Years | 0 (0.0%) | 0 (0.0%) |
| 25 to 34 Years | 0 (0.0%) | 18 (78.3%) |
| 35 to 44 Years | 0 (0.0%) | 29 (100.0%) |
| 45 to 54 Years | 0 (0.0%) | 23 (67.6%) |
| 55 to 64 Years | 9 (27.3%) | 24 (72.7%) |
| 65 to 74 Years | 12 (100.0%) | 8 (66.7%) |
| 75 Years and over | 19 (100.0%) | 4 (21.0%) |
| Total | 48 (24.5%) | 144 (73.5%) |
Disability Status by Sex by Age in Ravenna
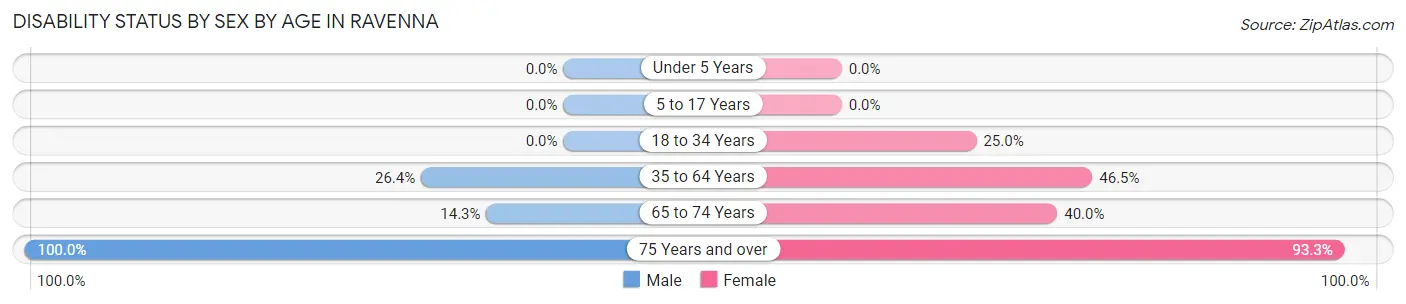
| Age Bracket | Male | Female |
| Under 5 Years | 0 (0.0%) | 0 (0.0%) |
| 5 to 17 Years | 0 (0.0%) | 0 (0.0%) |
| 18 to 34 Years | 0 (0.0%) | 5 (25.0%) |
| 35 to 64 Years | 14 (26.4%) | 20 (46.5%) |
| 65 to 74 Years | 1 (14.3%) | 2 (40.0%) |
| 75 Years and over | 4 (100.0%) | 14 (93.3%) |
Disability Class by Sex by Age in Ravenna
Disability Class: Hearing Difficulty
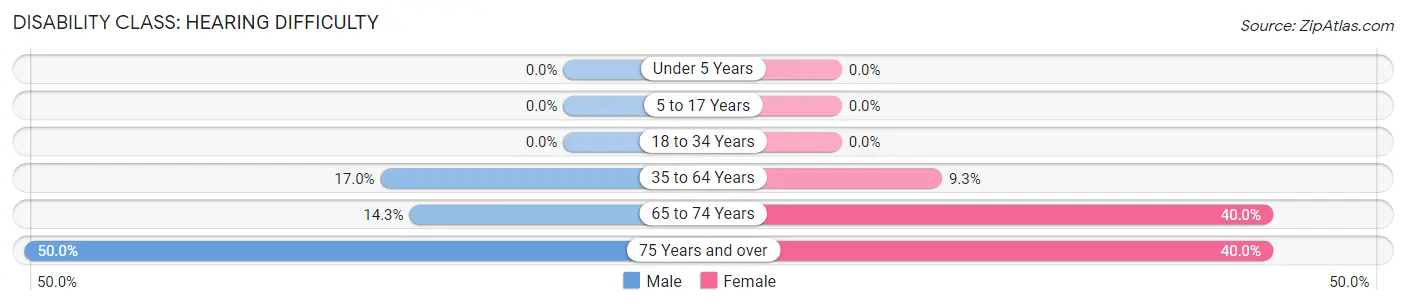
| Age Bracket | Male | Female |
| Under 5 Years | 0 (0.0%) | 0 (0.0%) |
| 5 to 17 Years | 0 (0.0%) | 0 (0.0%) |
| 18 to 34 Years | 0 (0.0%) | 0 (0.0%) |
| 35 to 64 Years | 9 (17.0%) | 4 (9.3%) |
| 65 to 74 Years | 1 (14.3%) | 2 (40.0%) |
| 75 Years and over | 2 (50.0%) | 6 (40.0%) |
Disability Class: Vision Difficulty
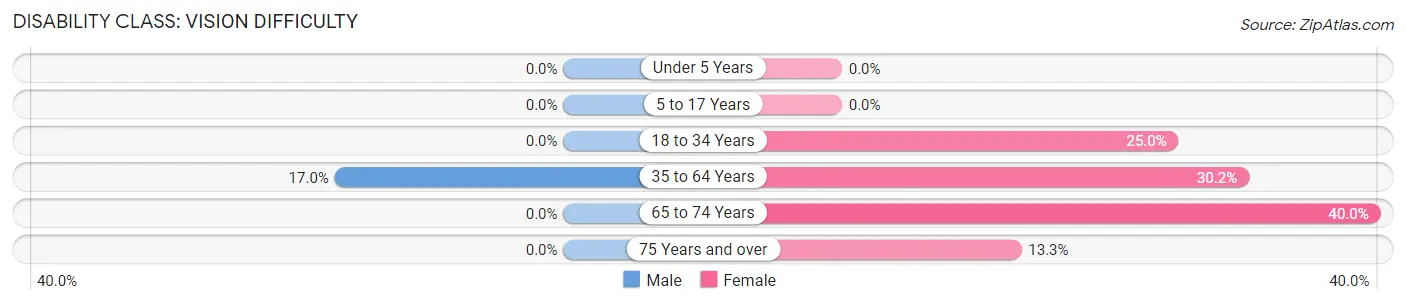
| Age Bracket | Male | Female |
| Under 5 Years | 0 (0.0%) | 0 (0.0%) |
| 5 to 17 Years | 0 (0.0%) | 0 (0.0%) |
| 18 to 34 Years | 0 (0.0%) | 5 (25.0%) |
| 35 to 64 Years | 9 (17.0%) | 13 (30.2%) |
| 65 to 74 Years | 0 (0.0%) | 2 (40.0%) |
| 75 Years and over | 0 (0.0%) | 2 (13.3%) |
Disability Class: Cognitive Difficulty
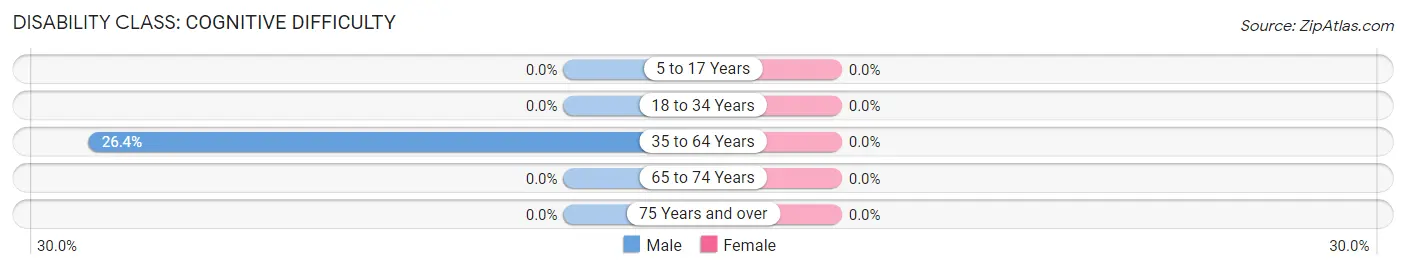
| Age Bracket | Male | Female |
| 5 to 17 Years | 0 (0.0%) | 0 (0.0%) |
| 18 to 34 Years | 0 (0.0%) | 0 (0.0%) |
| 35 to 64 Years | 14 (26.4%) | 0 (0.0%) |
| 65 to 74 Years | 0 (0.0%) | 0 (0.0%) |
| 75 Years and over | 0 (0.0%) | 0 (0.0%) |
Disability Class: Ambulatory Difficulty
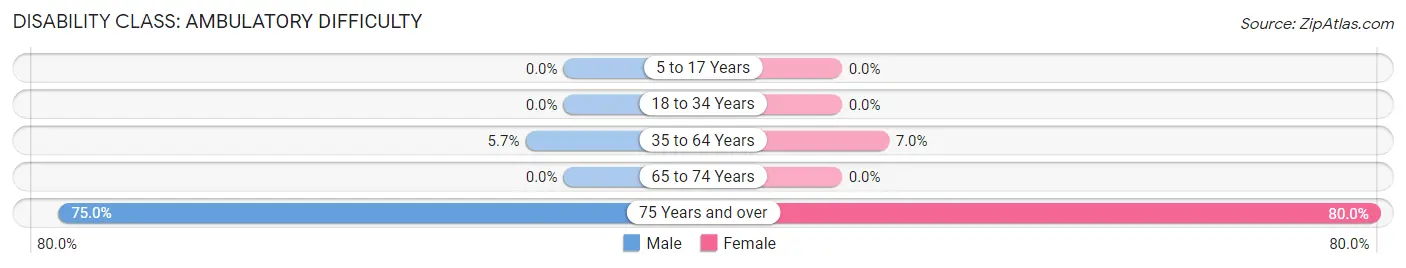
| Age Bracket | Male | Female |
| 5 to 17 Years | 0 (0.0%) | 0 (0.0%) |
| 18 to 34 Years | 0 (0.0%) | 0 (0.0%) |
| 35 to 64 Years | 3 (5.7%) | 3 (7.0%) |
| 65 to 74 Years | 0 (0.0%) | 0 (0.0%) |
| 75 Years and over | 3 (75.0%) | 12 (80.0%) |
Disability Class: Self-Care Difficulty
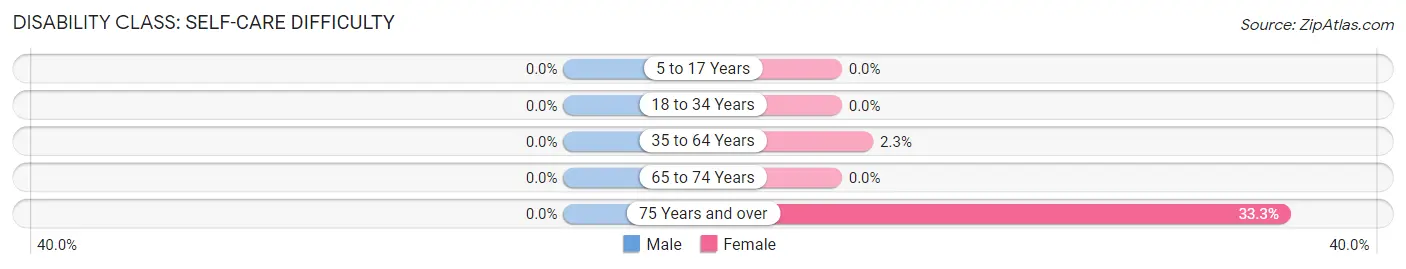
| Age Bracket | Male | Female |
| 5 to 17 Years | 0 (0.0%) | 0 (0.0%) |
| 18 to 34 Years | 0 (0.0%) | 0 (0.0%) |
| 35 to 64 Years | 0 (0.0%) | 1 (2.3%) |
| 65 to 74 Years | 0 (0.0%) | 0 (0.0%) |
| 75 Years and over | 0 (0.0%) | 5 (33.3%) |
Technology Access in Ravenna
Computing Device Access in Ravenna
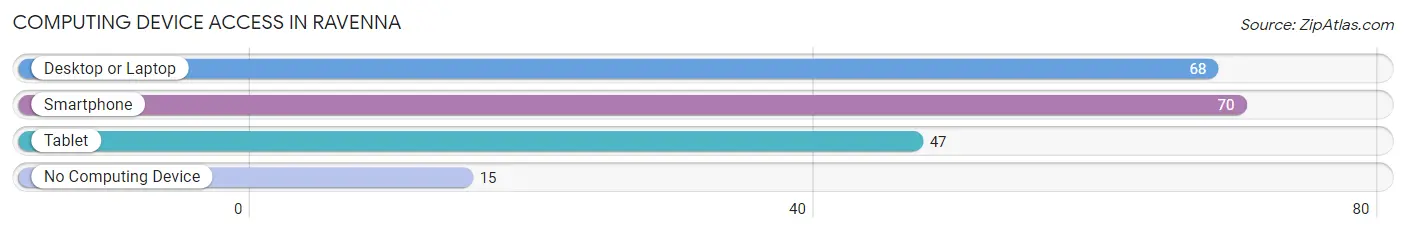
| Device Type | # Households | % Households |
| Desktop or Laptop | 68 | 78.2% |
| Smartphone | 70 | 80.5% |
| Tablet | 47 | 54.0% |
| No Computing Device | 15 | 17.2% |
| Total | 87 | 100.0% |
Internet Access in Ravenna
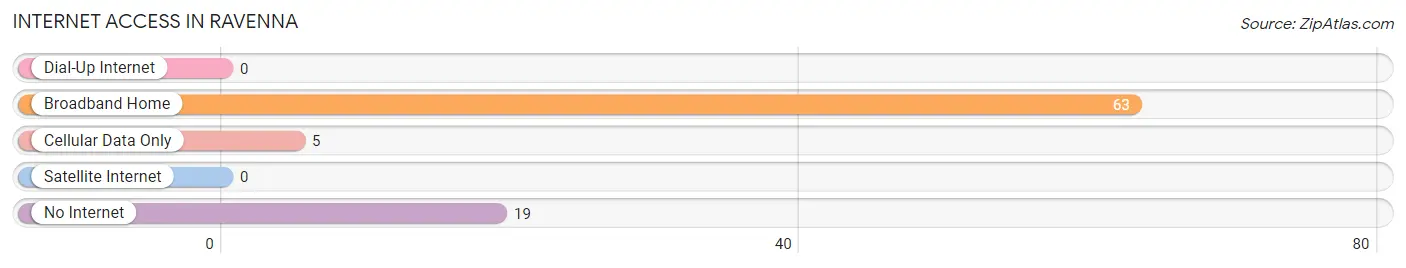
| Internet Type | # Households | % Households |
| Dial-Up Internet | 0 | 0.0% |
| Broadband Home | 63 | 72.4% |
| Cellular Data Only | 5 | 5.8% |
| Satellite Internet | 0 | 0.0% |
| No Internet | 19 | 21.8% |
| Total | 87 | 100.0% |
Ravenna Summary
Ravenna, Texas is a small town located in the northeastern corner of Texas, in the county of Red River. It is situated on the banks of the Red River, near the Oklahoma border. The town was founded in 1876 and was named after the Italian city of Ravenna. The population of Ravenna was estimated to be around 1,000 people in 2020.
History
The area around Ravenna was first settled by Native Americans, who were later displaced by European settlers. The first settlers in the area were the Choctaw and Chickasaw tribes, who were later joined by the Cherokee and Creek tribes. The first European settlers in the area were French fur traders, who established trading posts in the area in the late 1700s.
In 1876, the town of Ravenna was founded by a group of settlers from Arkansas. The town was named after the Italian city of Ravenna, which was the birthplace of one of the settlers. The town quickly grew and became a center of commerce for the surrounding area.
In the early 1900s, the town was a major stop on the Texas and Pacific Railway. The railway brought in new settlers and businesses, and the town continued to grow. In the 1920s, the town was home to several cotton gins, a cottonseed oil mill, and a lumber mill.
Geography
Ravenna is located in the northeastern corner of Texas, in the county of Red River. It is situated on the banks of the Red River, near the Oklahoma border. The town is located in a rural area, surrounded by rolling hills and farmland. The climate in Ravenna is generally mild, with hot summers and cold winters.
Economy
The economy of Ravenna is largely based on agriculture. The town is home to several farms, which produce a variety of crops, including cotton, corn, soybeans, and wheat. The town is also home to several businesses, including a lumber mill, a cottonseed oil mill, and several cotton gins.
Demographics
The population of Ravenna was estimated to be around 1,000 people in 2020. The town is predominantly white, with a small Hispanic population. The median household income in Ravenna is around $35,000, and the median home value is around $90,000. The town has a low unemployment rate, and the majority of the population is employed in the agricultural sector.
Common Questions
What is Per Capita Income in Ravenna?
Per Capita income in Ravenna is $45,778.
What is the Median Family Income in Ravenna?
Median Family Income in Ravenna is $88,750.
What is the Median Household income in Ravenna?
Median Household Income in Ravenna is $82,596.
What is Inequality or Gini Index in Ravenna?
Inequality or Gini Index in Ravenna is 0.61.
What is the Total Population of Ravenna?
Total Population of Ravenna is 196.
What is the Total Male Population of Ravenna?
Total Male Population of Ravenna is 90.
What is the Total Female Population of Ravenna?
Total Female Population of Ravenna is 106.
What is the Ratio of Males per 100 Females in Ravenna?
There are 84.91 Males per 100 Females in Ravenna.
What is the Ratio of Females per 100 Males in Ravenna?
There are 117.78 Females per 100 Males in Ravenna.
What is the Median Population Age in Ravenna?
Median Population Age in Ravenna is 46.0 Years.
What is the Average Family Size in Ravenna
Average Family Size in Ravenna is 3.0 People.
What is the Average Household Size in Ravenna
Average Household Size in Ravenna is 2.2 People.
How Large is the Labor Force in Ravenna?
There are 102 People in the Labor Forcein in Ravenna.
What is the Percentage of People in the Labor Force in Ravenna?
68.0% of People are in the Labor Force in Ravenna.
What is the Unemployment Rate in Ravenna?
Unemployment Rate in Ravenna is 2.9%.