San Ygnacio, TX Map & Demographics
San Ygnacio Map
San Ygnacio Overview
$24,594
PER CAPITA INCOME
$137,617
AVG FAMILY INCOME
$82,917
AVG HOUSEHOLD INCOME
0.36
INEQUALITY / GINI INDEX
590
TOTAL POPULATION
268
MALE POPULATION
322
FEMALE POPULATION
83.23
MALES / 100 FEMALES
120.15
FEMALES / 100 MALES
39.9
MEDIAN AGE
3.5
AVG FAMILY SIZE
2.8
AVG HOUSEHOLD SIZE
211
LABOR FORCE [ PEOPLE ]
50.2%
PERCENT IN LABOR FORCE
6.6%
UNEMPLOYMENT RATE
San Ygnacio Zip Codes
San Ygnacio Area Codes
Income in San Ygnacio
Income Overview in San Ygnacio
Per Capita Income in San Ygnacio is $24,594, while median incomes of families and households are $137,617 and $82,917 respectively.
| Characteristic | Number | Measure |
| Per Capita Income | 590 | $24,594 |
| Median Family Income | 145 | $137,617 |
| Mean Family Income | 145 | $100,925 |
| Median Household Income | 208 | $82,917 |
| Mean Household Income | 208 | $78,833 |
| Income Deficit | 145 | $0 |
| Wage / Income Gap (%) | 590 | 0.00% |
| Wage / Income Gap ($) | 590 | 100.00¢ per $1 |
| Gini / Inequality Index | 590 | 0.36 |
Earnings by Sex in San Ygnacio
| Sex | Number | Average Earnings |
| Male | 82 (37.8%) | $0 |
| Female | 135 (62.2%) | $0 |
| Total | 217 (100.0%) | $0 |
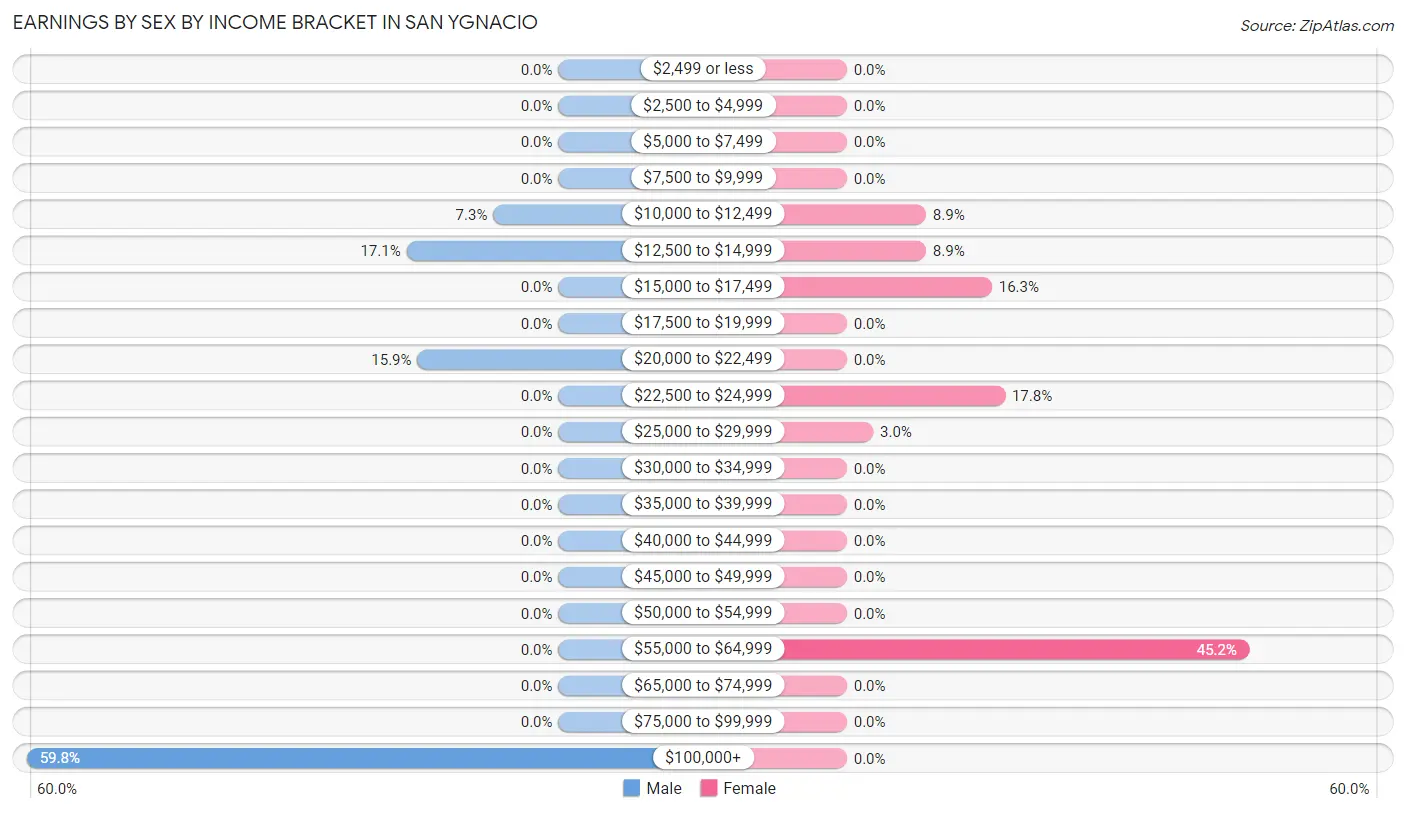
Earnings by Sex by Income Bracket in San Ygnacio
The most common earnings brackets in San Ygnacio are $100,000+ for men (49 | 59.8%) and $55,000 to $64,999 for women (61 | 45.2%).
| Income | Male | Female |
| $2,499 or less | 0 (0.0%) | 0 (0.0%) |
| $2,500 to $4,999 | 0 (0.0%) | 0 (0.0%) |
| $5,000 to $7,499 | 0 (0.0%) | 0 (0.0%) |
| $7,500 to $9,999 | 0 (0.0%) | 0 (0.0%) |
| $10,000 to $12,499 | 6 (7.3%) | 12 (8.9%) |
| $12,500 to $14,999 | 14 (17.1%) | 12 (8.9%) |
| $15,000 to $17,499 | 0 (0.0%) | 22 (16.3%) |
| $17,500 to $19,999 | 0 (0.0%) | 0 (0.0%) |
| $20,000 to $22,499 | 13 (15.9%) | 0 (0.0%) |
| $22,500 to $24,999 | 0 (0.0%) | 24 (17.8%) |
| $25,000 to $29,999 | 0 (0.0%) | 4 (3.0%) |
| $30,000 to $34,999 | 0 (0.0%) | 0 (0.0%) |
| $35,000 to $39,999 | 0 (0.0%) | 0 (0.0%) |
| $40,000 to $44,999 | 0 (0.0%) | 0 (0.0%) |
| $45,000 to $49,999 | 0 (0.0%) | 0 (0.0%) |
| $50,000 to $54,999 | 0 (0.0%) | 0 (0.0%) |
| $55,000 to $64,999 | 0 (0.0%) | 61 (45.2%) |
| $65,000 to $74,999 | 0 (0.0%) | 0 (0.0%) |
| $75,000 to $99,999 | 0 (0.0%) | 0 (0.0%) |
| $100,000+ | 49 (59.8%) | 0 (0.0%) |
| Total | 82 (100.0%) | 135 (100.0%) |
Earnings by Sex by Educational Attainment in San Ygnacio
| Educational Attainment | Male Income | Female Income |
| Less than High School | - | - |
| High School Diploma | - | - |
| College or Associate's Degree | - | - |
| Bachelor's Degree | - | - |
| Graduate Degree | - | - |
| Total | - | - |
Family Income in San Ygnacio
Family Income Brackets in San Ygnacio
According to the San Ygnacio family income data, there are 74 families falling into the $100,000 to $149,999 income range, which is the most common income bracket and makes up 51.0% of all families.
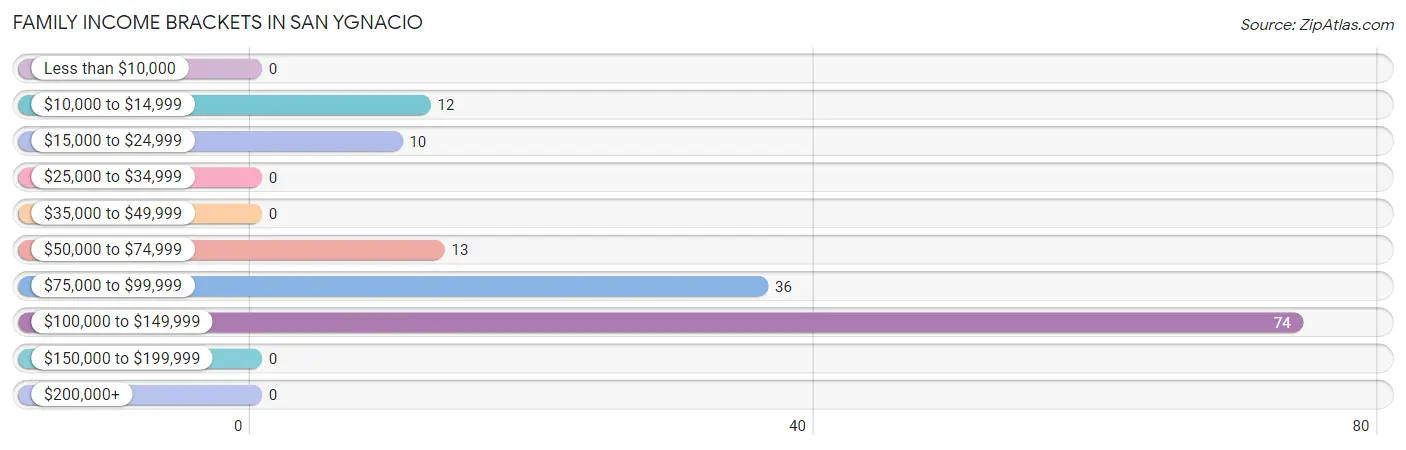
| Income Bracket | # Families | % Families |
| Less than $10,000 | 0 | 0.0% |
| $10,000 to $14,999 | 12 | 8.3% |
| $15,000 to $24,999 | 10 | 6.9% |
| $25,000 to $34,999 | 0 | 0.0% |
| $35,000 to $49,999 | 0 | 0.0% |
| $50,000 to $74,999 | 13 | 9.0% |
| $75,000 to $99,999 | 36 | 24.8% |
| $100,000 to $149,999 | 74 | 51.0% |
| $150,000 to $199,999 | 0 | 0.0% |
| $200,000+ | 0 | 0.0% |
Family Income by Famaliy Size in San Ygnacio
5-person families (54 | 37.2%) account for the highest median family income in San Ygnacio with $83,125 per family, while 5-person families (54 | 37.2%) have the highest median income of $16,625 per family member.
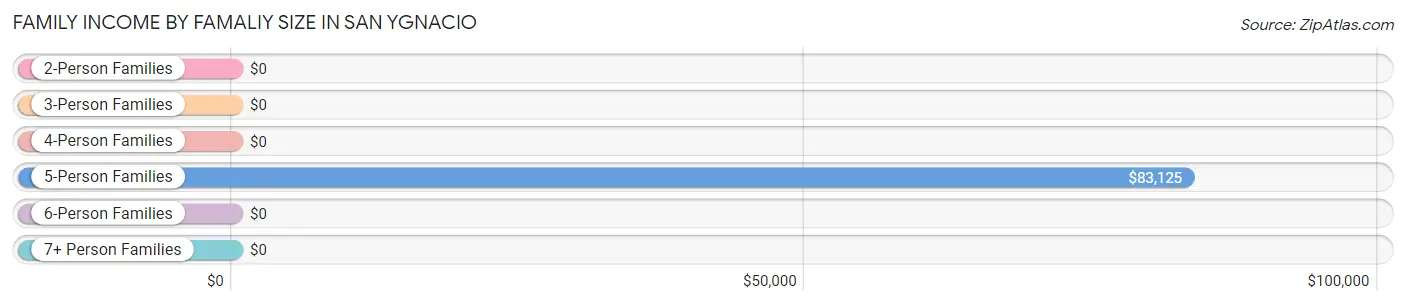
| Income Bracket | # Families | Median Income |
| 2-Person Families | 39 (26.9%) | $0 |
| 3-Person Families | 10 (6.9%) | $0 |
| 4-Person Families | 42 (29.0%) | $0 |
| 5-Person Families | 54 (37.2%) | $83,125 |
| 6-Person Families | 0 (0.0%) | $0 |
| 7+ Person Families | 0 (0.0%) | $0 |
| Total | 145 (100.0%) | $137,617 |
Family Income by Number of Earners in San Ygnacio
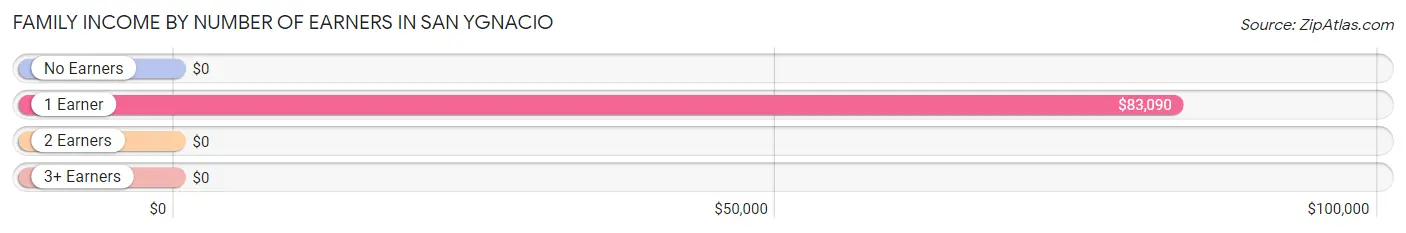
| Number of Earners | # Families | Median Income |
| No Earners | 10 (6.9%) | $0 |
| 1 Earner | 55 (37.9%) | $83,090 |
| 2 Earners | 74 (51.0%) | $0 |
| 3+ Earners | 6 (4.1%) | $0 |
| Total | 145 (100.0%) | $137,617 |
Household Income in San Ygnacio
Household Income Brackets in San Ygnacio
With 74 households falling in the category, the $100,000 to $149,999 income range is the most frequent in San Ygnacio, accounting for 35.6% of all households.
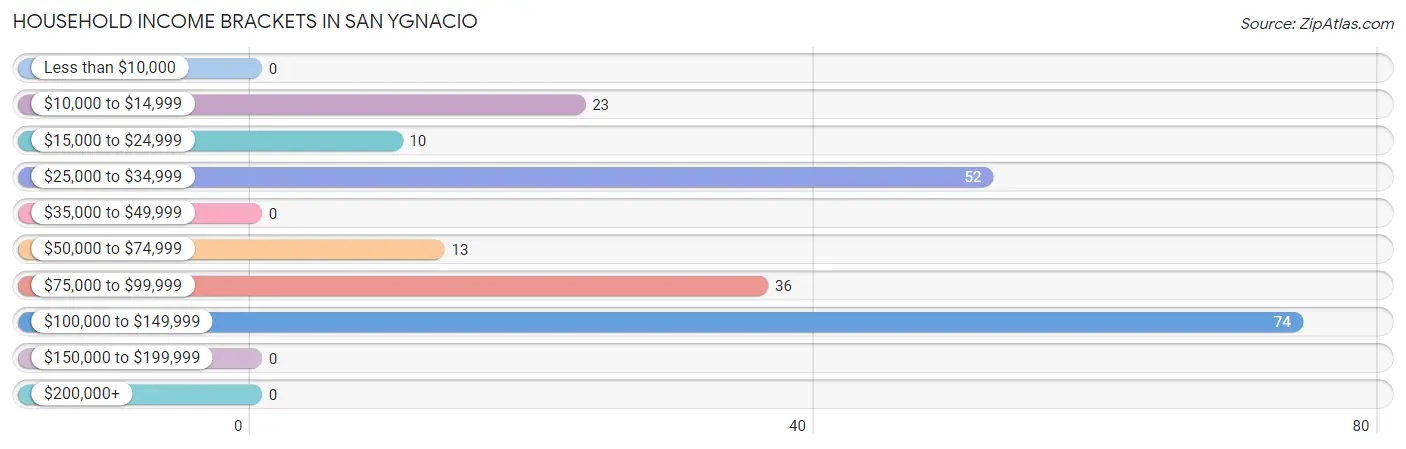
| Income Bracket | # Households | % Households |
| Less than $10,000 | 0 | 0.0% |
| $10,000 to $14,999 | 23 | 11.1% |
| $15,000 to $24,999 | 10 | 4.8% |
| $25,000 to $34,999 | 52 | 25.0% |
| $35,000 to $49,999 | 0 | 0.0% |
| $50,000 to $74,999 | 13 | 6.3% |
| $75,000 to $99,999 | 36 | 17.3% |
| $100,000 to $149,999 | 74 | 35.6% |
| $150,000 to $199,999 | 0 | 0.0% |
| $200,000+ | 0 | 0.0% |
Household Income by Householder Age in San Ygnacio
The median household income in San Ygnacio is $82,917, with the highest median household income of $142,619 found in the 45 to 64 years age bracket for the primary householder. A total of 80 households (38.5%) fall into this category.
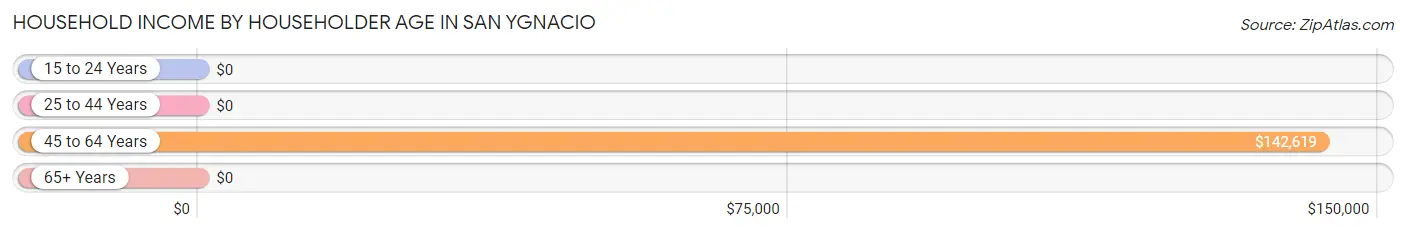
| Income Bracket | # Households | Median Income |
| 15 to 24 Years | 0 (0.0%) | $0 |
| 25 to 44 Years | 12 (5.8%) | $0 |
| 45 to 64 Years | 80 (38.5%) | $142,619 |
| 65+ Years | 116 (55.8%) | $0 |
| Total | 208 (100.0%) | $82,917 |
Poverty in San Ygnacio
Income Below Poverty by Sex and Age in San Ygnacio
With 17.9% poverty level for males and 24.2% for females among the residents of San Ygnacio, under 5 year old males and under 5 year old females are the most vulnerable to poverty, with 16 males (100.0%) and 11 females (100.0%) in their respective age groups living below the poverty level.
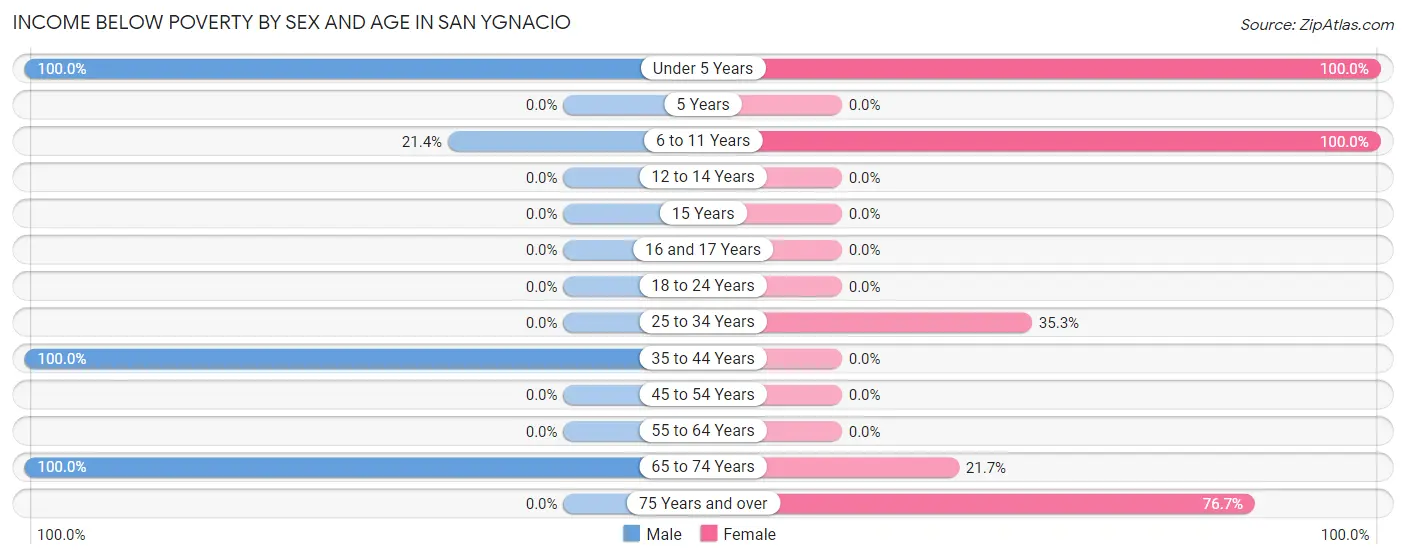
| Age Bracket | Male | Female |
| Under 5 Years | 16 (100.0%) | 11 (100.0%) |
| 5 Years | 0 (0.0%) | 0 (0.0%) |
| 6 to 11 Years | 9 (21.4%) | 22 (100.0%) |
| 12 to 14 Years | 0 (0.0%) | 0 (0.0%) |
| 15 Years | 0 (0.0%) | 0 (0.0%) |
| 16 and 17 Years | 0 (0.0%) | 0 (0.0%) |
| 18 to 24 Years | 0 (0.0%) | 0 (0.0%) |
| 25 to 34 Years | 0 (0.0%) | 12 (35.3%) |
| 35 to 44 Years | 14 (100.0%) | 0 (0.0%) |
| 45 to 54 Years | 0 (0.0%) | 0 (0.0%) |
| 55 to 64 Years | 0 (0.0%) | 0 (0.0%) |
| 65 to 74 Years | 9 (100.0%) | 10 (21.7%) |
| 75 Years and over | 0 (0.0%) | 23 (76.7%) |
| Total | 48 (17.9%) | 78 (24.2%) |
Income Above Poverty by Sex and Age in San Ygnacio
According to the poverty statistics in San Ygnacio, males aged 15 years and females aged 12 to 14 years are the age groups that are most secure financially, with 100.0% of males and 100.0% of females in these age groups living above the poverty line.
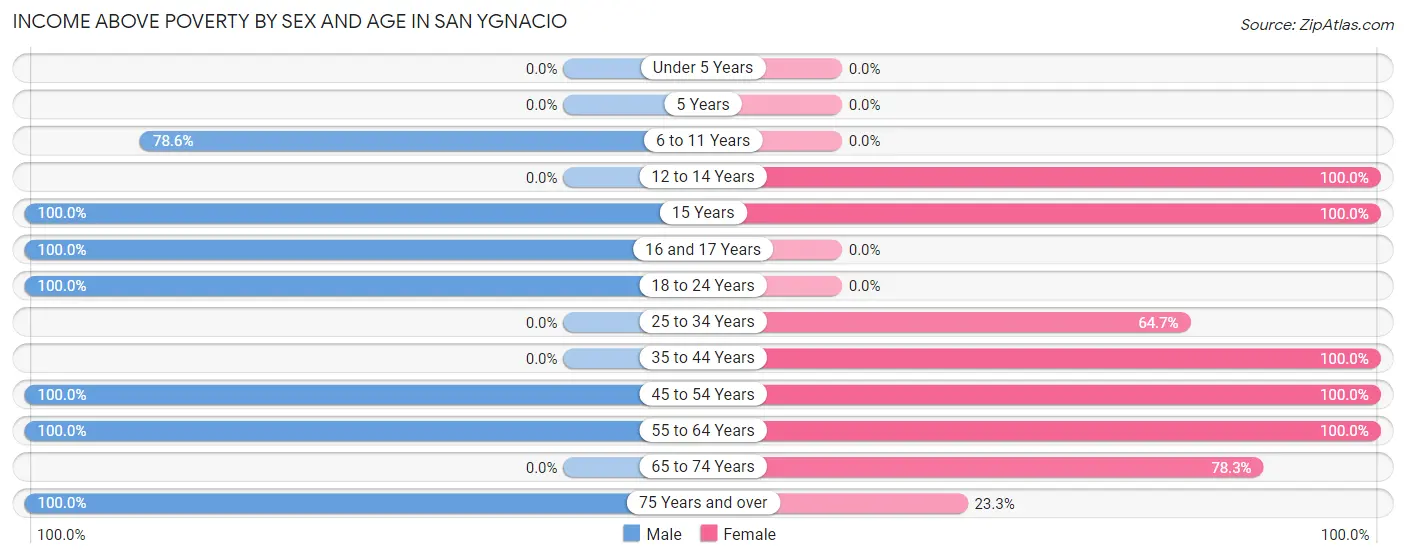
| Age Bracket | Male | Female |
| Under 5 Years | 0 (0.0%) | 0 (0.0%) |
| 5 Years | 0 (0.0%) | 0 (0.0%) |
| 6 to 11 Years | 33 (78.6%) | 0 (0.0%) |
| 12 to 14 Years | 0 (0.0%) | 25 (100.0%) |
| 15 Years | 43 (100.0%) | 11 (100.0%) |
| 16 and 17 Years | 24 (100.0%) | 0 (0.0%) |
| 18 to 24 Years | 12 (100.0%) | 0 (0.0%) |
| 25 to 34 Years | 0 (0.0%) | 22 (64.7%) |
| 35 to 44 Years | 0 (0.0%) | 73 (100.0%) |
| 45 to 54 Years | 30 (100.0%) | 42 (100.0%) |
| 55 to 64 Years | 38 (100.0%) | 28 (100.0%) |
| 65 to 74 Years | 0 (0.0%) | 36 (78.3%) |
| 75 Years and over | 40 (100.0%) | 7 (23.3%) |
| Total | 220 (82.1%) | 244 (75.8%) |
Income Below Poverty Among Married-Couple Families in San Ygnacio
The poverty statistics for married-couple families in San Ygnacio show that 11.1% or 10 of the total 90 families live below the poverty line. Families with 1 or 2 children have the highest poverty rate of 17.2%, comprising of 10 families. On the other hand, families with no children have the lowest poverty rate of 0.0%, which includes 0 families.
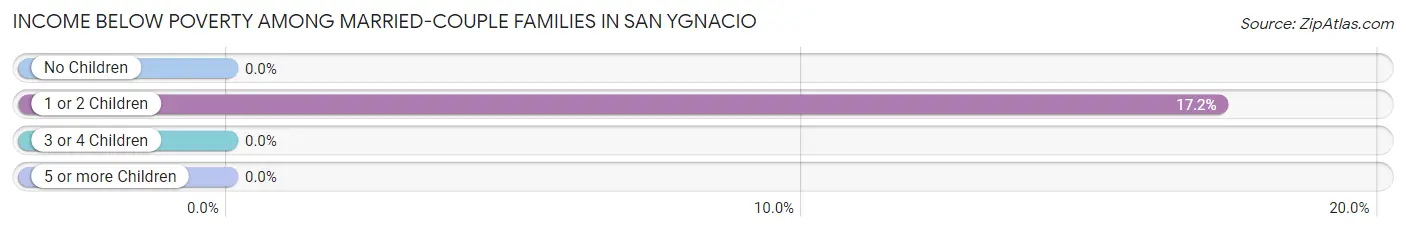
| Children | Above Poverty | Below Poverty |
| No Children | 32 (100.0%) | 0 (0.0%) |
| 1 or 2 Children | 48 (82.8%) | 10 (17.2%) |
| 3 or 4 Children | 0 (0.0%) | 0 (0.0%) |
| 5 or more Children | 0 (0.0%) | 0 (0.0%) |
| Total | 80 (88.9%) | 10 (11.1%) |
Income Below Poverty Among Single-Parent Households in San Ygnacio
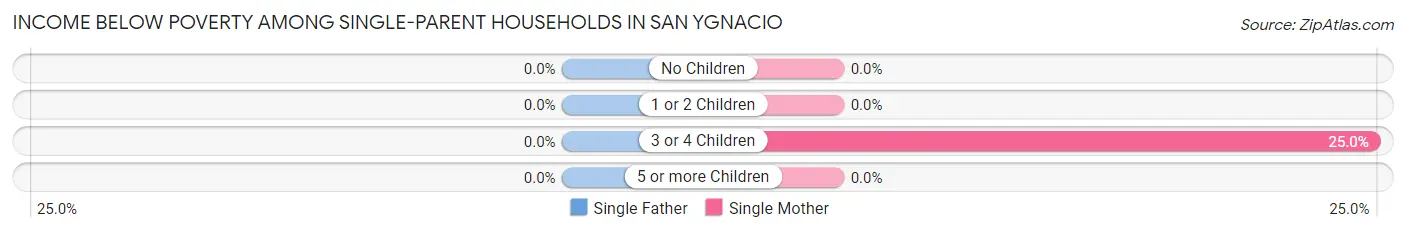
| Children | Single Father | Single Mother |
| No Children | 0 (0.0%) | 0 (0.0%) |
| 1 or 2 Children | 0 (0.0%) | 0 (0.0%) |
| 3 or 4 Children | 0 (0.0%) | 12 (25.0%) |
| 5 or more Children | 0 (0.0%) | 0 (0.0%) |
| Total | 0 (0.0%) | 12 (21.8%) |
Income Below Poverty Among Married-Couple vs Single-Parent Households in San Ygnacio
The poverty data for San Ygnacio shows that 10 of the married-couple family households (11.1%) and 12 of the single-parent households (21.8%) are living below the poverty level. Within the married-couple family households, those with 1 or 2 children have the highest poverty rate, with 10 households (17.2%) falling below the poverty line. Among the single-parent households, those with 3 or 4 children have the highest poverty rate, with 12 household (25.0%) living below poverty.
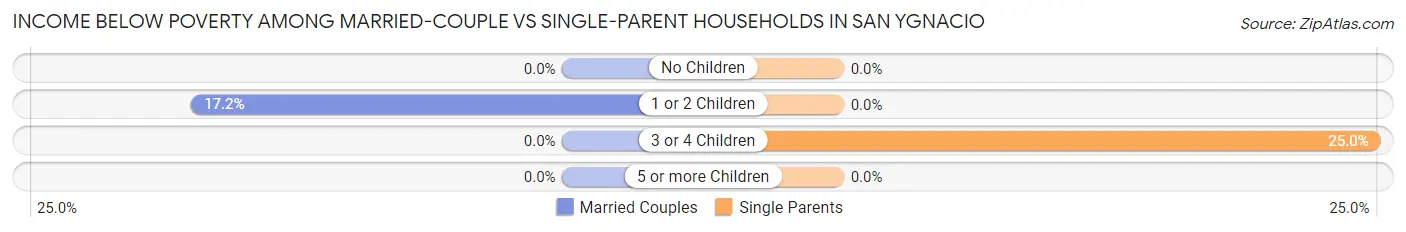
| Children | Married-Couple Families | Single-Parent Households |
| No Children | 0 (0.0%) | 0 (0.0%) |
| 1 or 2 Children | 10 (17.2%) | 0 (0.0%) |
| 3 or 4 Children | 0 (0.0%) | 12 (25.0%) |
| 5 or more Children | 0 (0.0%) | 0 (0.0%) |
| Total | 10 (11.1%) | 12 (21.8%) |
Race in San Ygnacio
The most populous races in San Ygnacio are Hispanic or Latino (590 | 100.0%), Two or more Races (376 | 63.7%), and White / Caucasian (196 | 33.2%).
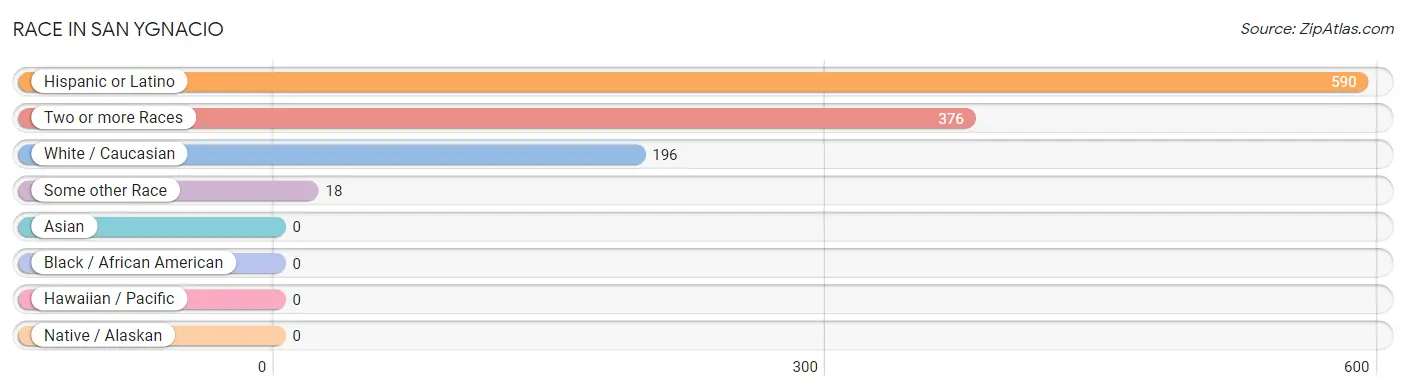
| Race | # Population | % Population |
| Asian | 0 | 0.0% |
| Black / African American | 0 | 0.0% |
| Hawaiian / Pacific | 0 | 0.0% |
| Hispanic or Latino | 590 | 100.0% |
| Native / Alaskan | 0 | 0.0% |
| White / Caucasian | 196 | 33.2% |
| Two or more Races | 376 | 63.7% |
| Some other Race | 18 | 3.0% |
| Total | 590 | 100.0% |
Ancestry in San Ygnacio
The most populous ancestries reported in San Ygnacio are Mexican (590 | 100.0%), and European (20 | 3.4%), together accounting for 103.4% of all San Ygnacio residents.
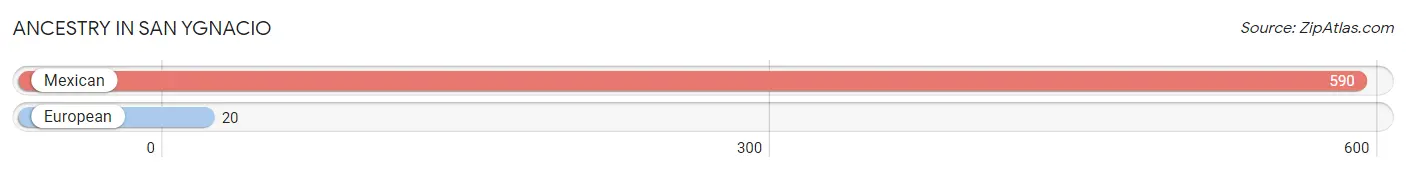
| Ancestry | # Population | % Population |
| European | 20 | 3.4% |
| Mexican | 590 | 100.0% | View All 2 Rows |
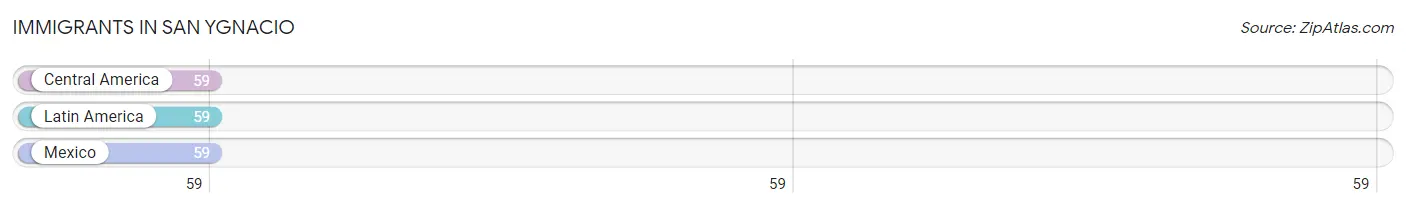
Immigrants in San Ygnacio
The most numerous immigrant groups reported in San Ygnacio came from Central America (59 | 10.0%), Latin America (59 | 10.0%), and Mexico (59 | 10.0%), together accounting for 30.0% of all San Ygnacio residents.
| Immigration Origin | # Population | % Population |
| Central America | 59 | 10.0% |
| Latin America | 59 | 10.0% |
| Mexico | 59 | 10.0% | View All 3 Rows |
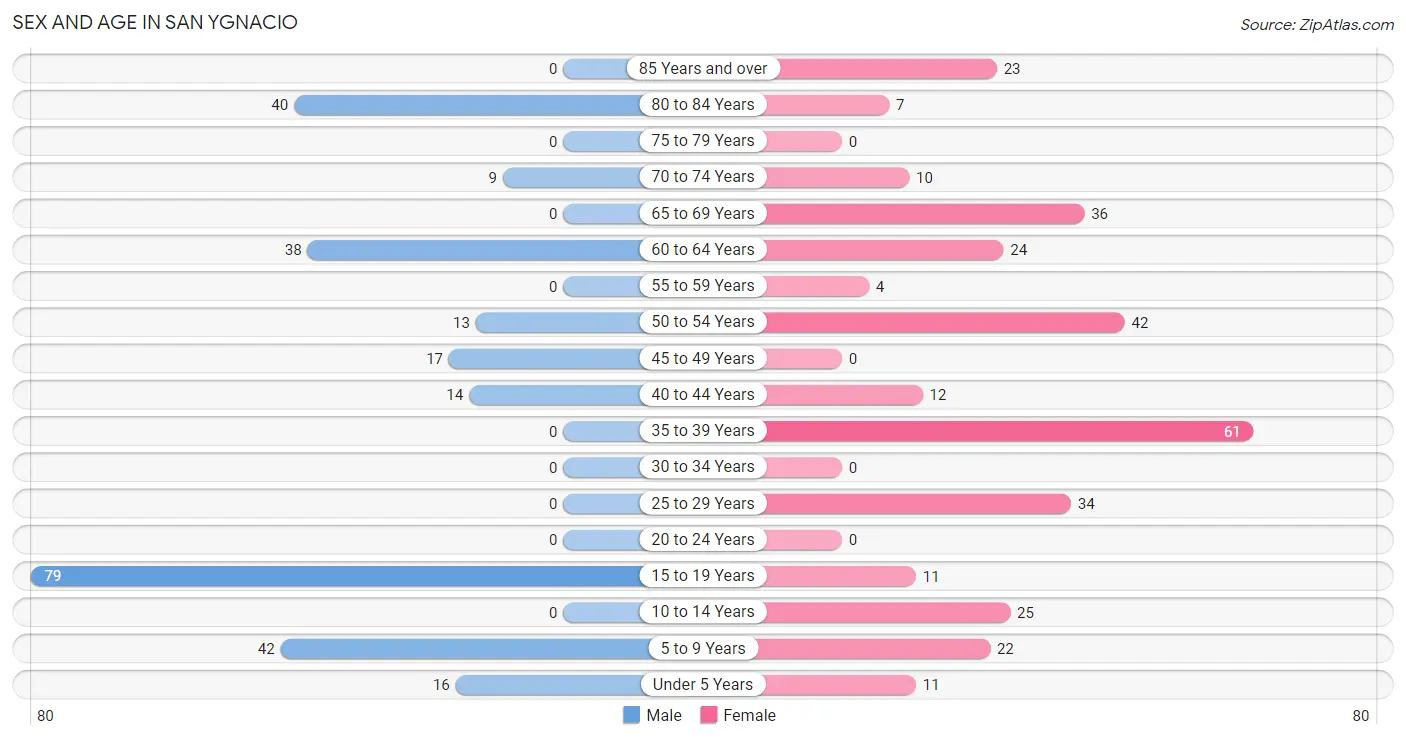
Sex and Age in San Ygnacio
Sex and Age in San Ygnacio
The most populous age groups in San Ygnacio are 15 to 19 Years (79 | 29.5%) for men and 35 to 39 Years (61 | 18.9%) for women.
| Age Bracket | Male | Female |
| Under 5 Years | 16 (6.0%) | 11 (3.4%) |
| 5 to 9 Years | 42 (15.7%) | 22 (6.8%) |
| 10 to 14 Years | 0 (0.0%) | 25 (7.8%) |
| 15 to 19 Years | 79 (29.5%) | 11 (3.4%) |
| 20 to 24 Years | 0 (0.0%) | 0 (0.0%) |
| 25 to 29 Years | 0 (0.0%) | 34 (10.6%) |
| 30 to 34 Years | 0 (0.0%) | 0 (0.0%) |
| 35 to 39 Years | 0 (0.0%) | 61 (18.9%) |
| 40 to 44 Years | 14 (5.2%) | 12 (3.7%) |
| 45 to 49 Years | 17 (6.3%) | 0 (0.0%) |
| 50 to 54 Years | 13 (4.9%) | 42 (13.0%) |
| 55 to 59 Years | 0 (0.0%) | 4 (1.2%) |
| 60 to 64 Years | 38 (14.2%) | 24 (7.4%) |
| 65 to 69 Years | 0 (0.0%) | 36 (11.2%) |
| 70 to 74 Years | 9 (3.4%) | 10 (3.1%) |
| 75 to 79 Years | 0 (0.0%) | 0 (0.0%) |
| 80 to 84 Years | 40 (14.9%) | 7 (2.2%) |
| 85 Years and over | 0 (0.0%) | 23 (7.1%) |
| Total | 268 (100.0%) | 322 (100.0%) |
Families and Households in San Ygnacio
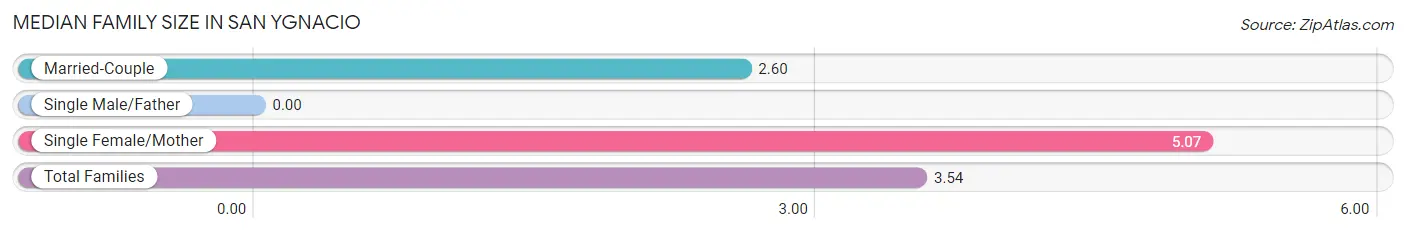
Median Family Size in San Ygnacio
| Family Type | # Families | Family Size |
| Married-Couple | 90 (62.1%) | 2.60 |
| Single Male/Father | 0 (0.0%) | - |
| Single Female/Mother | 55 (37.9%) | 5.07 |
| Total Families | 145 (100.0%) | 3.54 |
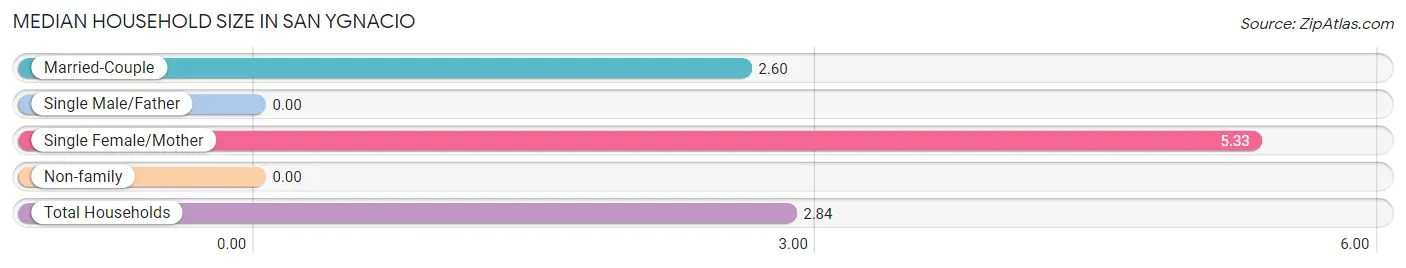
Median Household Size in San Ygnacio
| Household Type | # Households | Household Size |
| Married-Couple | 90 (43.3%) | 2.60 |
| Single Male/Father | 0 (0.0%) | - |
| Single Female/Mother | 55 (26.4%) | 5.33 |
| Non-family | 63 (30.3%) | - |
| Total Households | 208 (100.0%) | 2.84 |
Household Size by Marriage Status in San Ygnacio
Out of a total of 208 households in San Ygnacio, 145 (69.7%) are family households, while 63 (30.3%) are nonfamily households. The most numerous type of family households are 4-person households, comprising 42, and the most common type of nonfamily households are 1-person households, comprising 63.
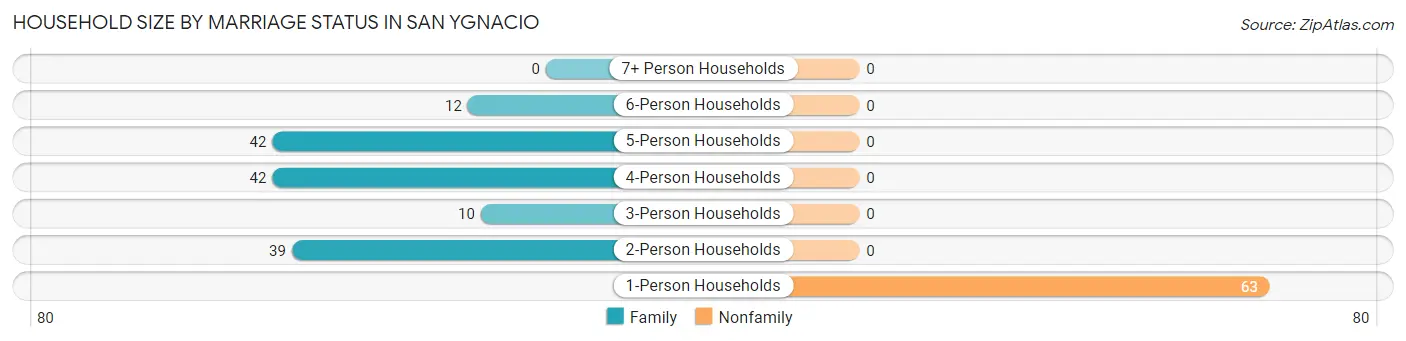
| Household Size | Family Households | Nonfamily Households |
| 1-Person Households | - | 63 (30.3%) |
| 2-Person Households | 39 (18.8%) | 0 (0.0%) |
| 3-Person Households | 10 (4.8%) | 0 (0.0%) |
| 4-Person Households | 42 (20.2%) | 0 (0.0%) |
| 5-Person Households | 42 (20.2%) | 0 (0.0%) |
| 6-Person Households | 12 (5.8%) | 0 (0.0%) |
| 7+ Person Households | 0 (0.0%) | 0 (0.0%) |
| Total | 145 (69.7%) | 63 (30.3%) |
Female Fertility in San Ygnacio
Fertility by Age in San Ygnacio
| Age Bracket | Women with Births | Births / 1,000 Women |
| 15 to 19 years | 0 (0.0%) | 0.0 |
| 20 to 34 years | 0 (0.0%) | 0.0 |
| 35 to 50 years | 0 (0.0%) | 0.0 |
| Total | 0 (0.0%) | 0.0 |
Fertility by Age by Marriage Status in San Ygnacio
| Age Bracket | Married | Unmarried |
| 15 to 19 years | 0 (0.0%) | 0 (0.0%) |
| 20 to 34 years | 0 (0.0%) | 0 (0.0%) |
| 35 to 50 years | 0 (0.0%) | 0 (0.0%) |
| Total | 0 (0.0%) | 0 (0.0%) |
Fertility by Education in San Ygnacio
| Educational Attainment | Women with Births | Births / 1,000 Women |
| Less than High School | 0 (0.0%) | 0.0 |
| High School Diploma | 0 (0.0%) | 0.0 |
| College or Associate's Degree | 0 (0.0%) | 0.0 |
| Bachelor's Degree | 0 (0.0%) | 0.0 |
| Graduate Degree | 0 (0.0%) | 0.0 |
| Total | 0 (0.0%) | 0.0 |
Fertility by Education by Marriage Status in San Ygnacio
| Educational Attainment | Married | Unmarried |
| Less than High School | 0 (0.0%) | 0 (0.0%) |
| High School Diploma | 0 (0.0%) | 0 (0.0%) |
| College or Associate's Degree | 0 (0.0%) | 0 (0.0%) |
| Bachelor's Degree | 0 (0.0%) | 0 (0.0%) |
| Graduate Degree | 0 (0.0%) | 0 (0.0%) |
| Total | 0 (0.0%) | 0 (0.0%) |
Employment Characteristics in San Ygnacio
Employment by Class of Employer in San Ygnacio
Among the 197 employed individuals in San Ygnacio, private company employees (107 | 54.3%), state government employees (56 | 28.4%), and self-employed (not incorporated) (21 | 10.7%) make up the most common classes of employment.
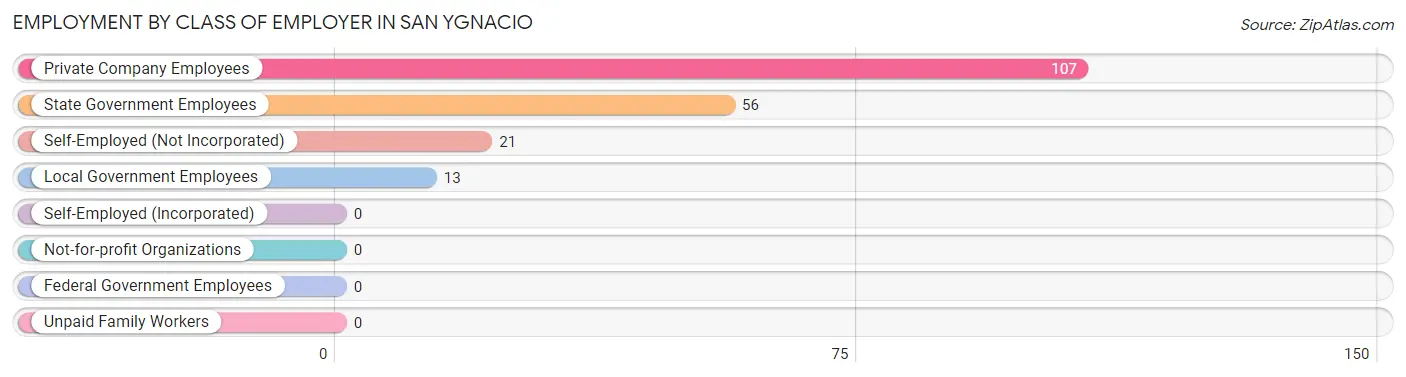
| Employer Class | # Employees | % Employees |
| Private Company Employees | 107 | 54.3% |
| Self-Employed (Incorporated) | 0 | 0.0% |
| Self-Employed (Not Incorporated) | 21 | 10.7% |
| Not-for-profit Organizations | 0 | 0.0% |
| Local Government Employees | 13 | 6.6% |
| State Government Employees | 56 | 28.4% |
| Federal Government Employees | 0 | 0.0% |
| Unpaid Family Workers | 0 | 0.0% |
| Total | 197 | 100.0% |
Employment Status by Age in San Ygnacio
According to the labor force statistics for San Ygnacio, out of the total population over 16 years of age (420), 50.2% or 211 individuals are in the labor force, with 6.6% or 14 of them unemployed. The age group with the highest labor force participation rate is 25 to 29 years, with 100.0% or 34 individuals in the labor force. Within the labor force, the 35 to 44 years age range has the highest percentage of unemployed individuals, with 16.1% or 14 of them being unemployed.
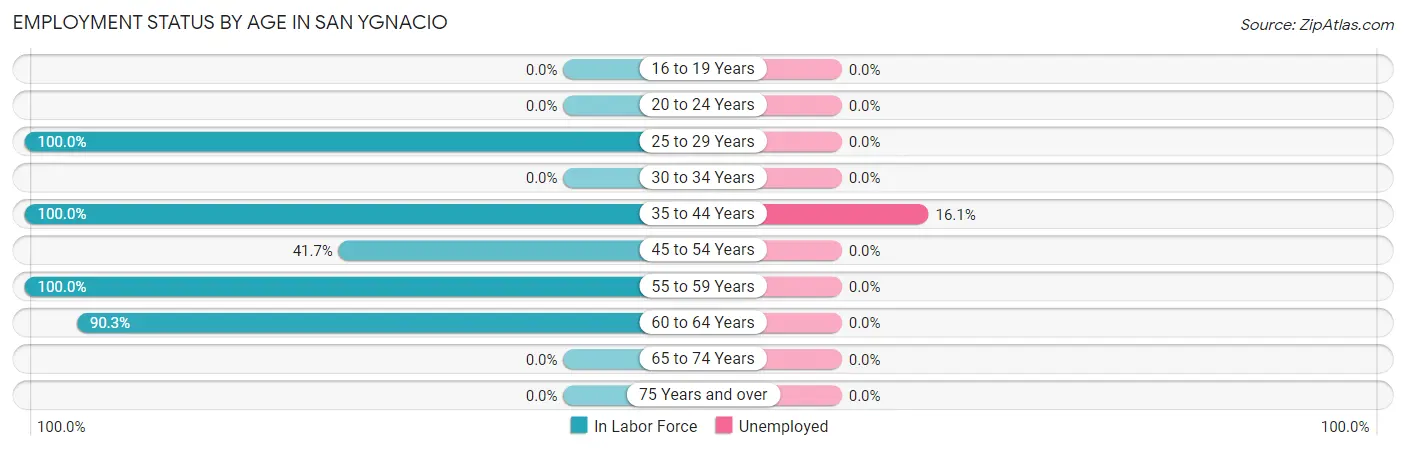
| Age Bracket | In Labor Force | Unemployed |
| 16 to 19 Years | 0 (0.0%) | 0 (0.0%) |
| 20 to 24 Years | 0 (0.0%) | 0 (0.0%) |
| 25 to 29 Years | 34 (100.0%) | 0 (0.0%) |
| 30 to 34 Years | 0 (0.0%) | 0 (0.0%) |
| 35 to 44 Years | 87 (100.0%) | 14 (16.1%) |
| 45 to 54 Years | 30 (41.7%) | 0 (0.0%) |
| 55 to 59 Years | 4 (100.0%) | 0 (0.0%) |
| 60 to 64 Years | 56 (90.3%) | 0 (0.0%) |
| 65 to 74 Years | 0 (0.0%) | 0 (0.0%) |
| 75 Years and over | 0 (0.0%) | 0 (0.0%) |
| Total | 211 (50.2%) | 14 (6.6%) |
Employment Status by Educational Attainment in San Ygnacio
According to labor force statistics for San Ygnacio, 81.5% of individuals (211) out of the total population between 25 and 64 years of age (259) are in the labor force, with 6.6% or 14 of them being unemployed. The group with the highest labor force participation rate are those with the educational attainment of college / associate degree, with 100.0% or 101 individuals in the labor force. Within the labor force, individuals with high school diploma education have the highest percentage of unemployment, with 20.6% or 14 of them being unemployed.
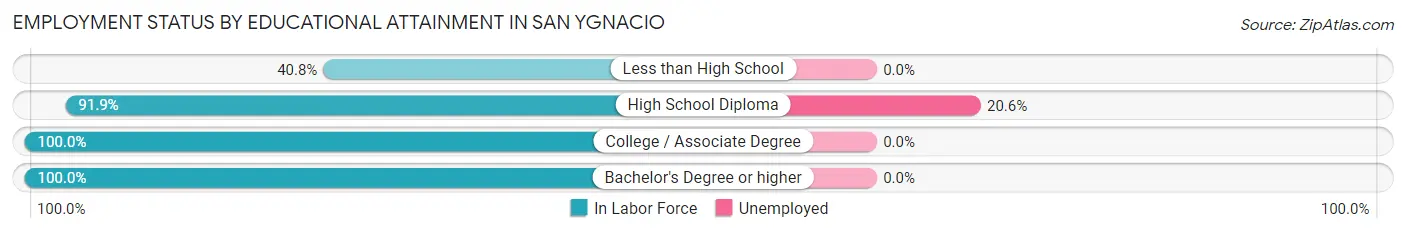
| Educational Attainment | In Labor Force | Unemployed |
| Less than High School | 29 (40.8%) | 0 (0.0%) |
| High School Diploma | 68 (91.9%) | 15 (20.6%) |
| College / Associate Degree | 101 (100.0%) | 0 (0.0%) |
| Bachelor's Degree or higher | 13 (100.0%) | 0 (0.0%) |
| Total | 211 (81.5%) | 17 (6.6%) |
Employment Occupations by Sex in San Ygnacio
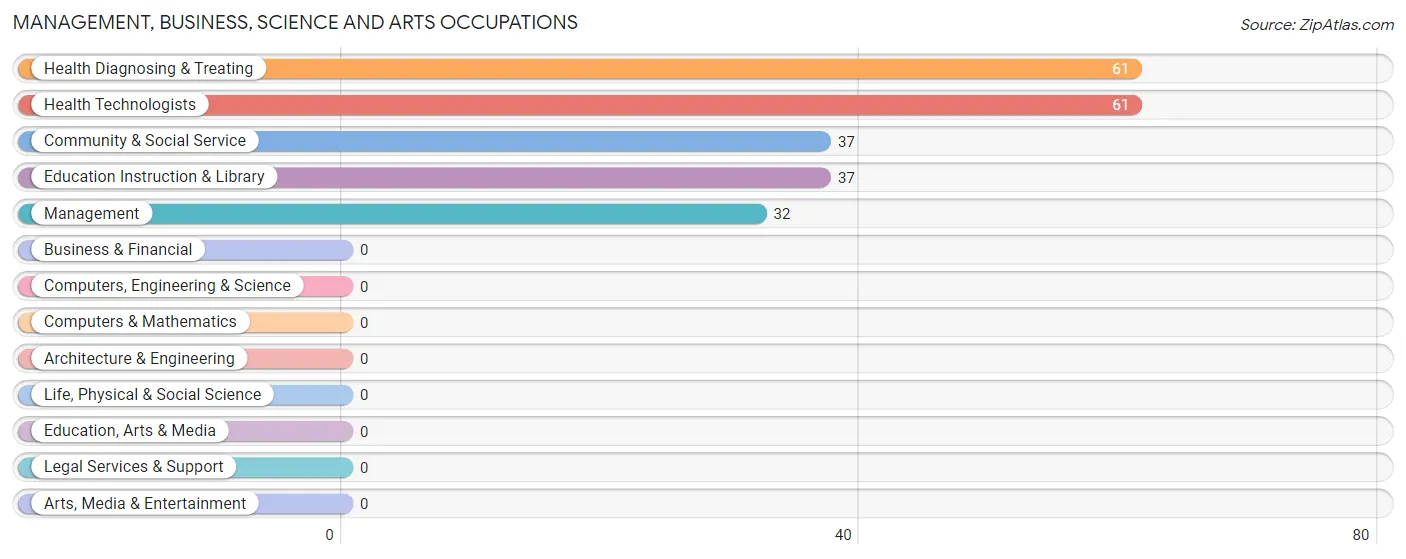
Management, Business, Science and Arts Occupations
The most common Management, Business, Science and Arts occupations in San Ygnacio are Health Diagnosing & Treating (61 | 31.0%), Health Technologists (61 | 31.0%), Community & Social Service (37 | 18.8%), Education Instruction & Library (37 | 18.8%), and Management (32 | 16.2%).
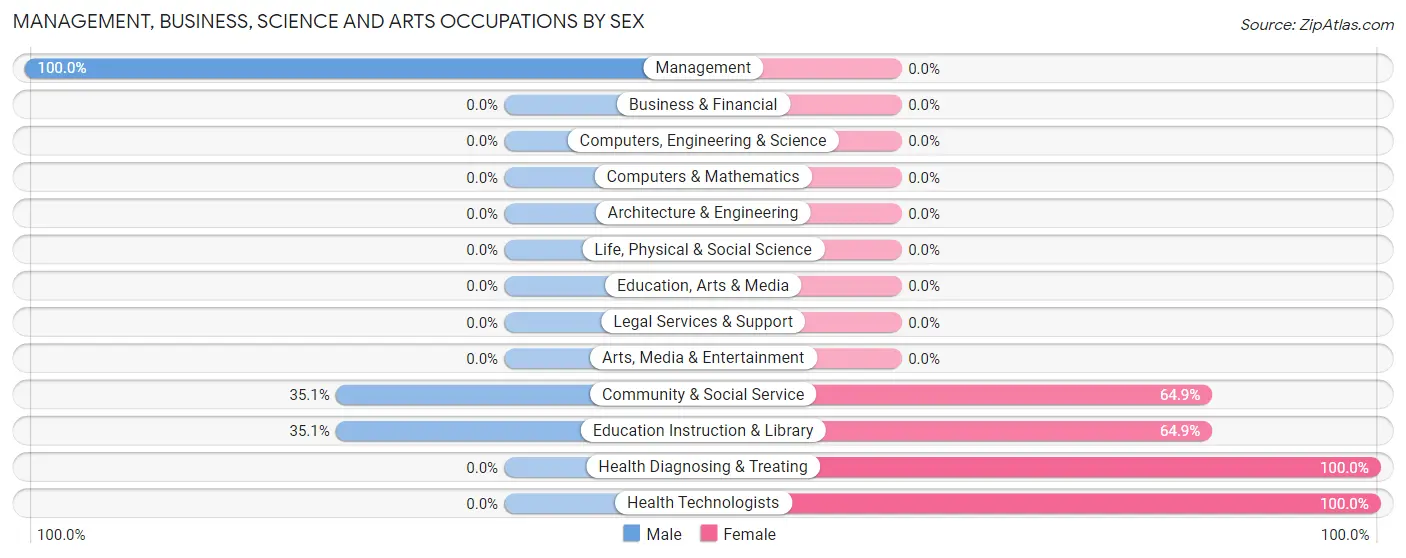
Management, Business, Science and Arts Occupations by Sex
Within the Management, Business, Science and Arts occupations in San Ygnacio, the most male-oriented occupations are Management (100.0%), Community & Social Service (35.1%), and Education Instruction & Library (35.1%), while the most female-oriented occupations are Health Diagnosing & Treating (100.0%), Health Technologists (100.0%), and Community & Social Service (64.9%).
| Occupation | Male | Female |
| Management | 32 (100.0%) | 0 (0.0%) |
| Business & Financial | 0 (0.0%) | 0 (0.0%) |
| Computers, Engineering & Science | 0 (0.0%) | 0 (0.0%) |
| Computers & Mathematics | 0 (0.0%) | 0 (0.0%) |
| Architecture & Engineering | 0 (0.0%) | 0 (0.0%) |
| Life, Physical & Social Science | 0 (0.0%) | 0 (0.0%) |
| Community & Social Service | 13 (35.1%) | 24 (64.9%) |
| Education, Arts & Media | 0 (0.0%) | 0 (0.0%) |
| Legal Services & Support | 0 (0.0%) | 0 (0.0%) |
| Education Instruction & Library | 13 (35.1%) | 24 (64.9%) |
| Arts, Media & Entertainment | 0 (0.0%) | 0 (0.0%) |
| Health Diagnosing & Treating | 0 (0.0%) | 61 (100.0%) |
| Health Technologists | 0 (0.0%) | 61 (100.0%) |
| Total (Category) | 45 (34.6%) | 85 (65.4%) |
| Total (Overall) | 62 (31.5%) | 135 (68.5%) |
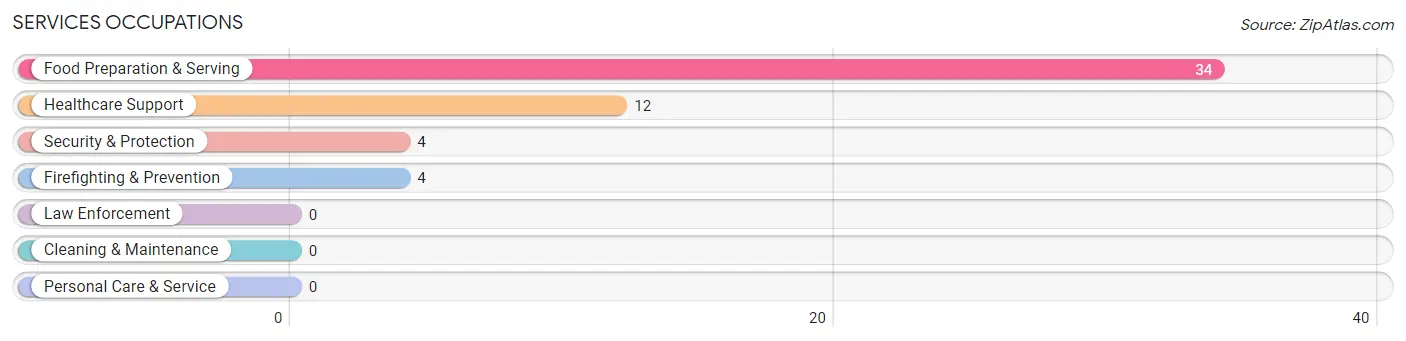
Services Occupations
The most common Services occupations in San Ygnacio are Food Preparation & Serving (34 | 17.3%), Healthcare Support (12 | 6.1%), Security & Protection (4 | 2.0%), and Firefighting & Prevention (4 | 2.0%).
Services Occupations by Sex
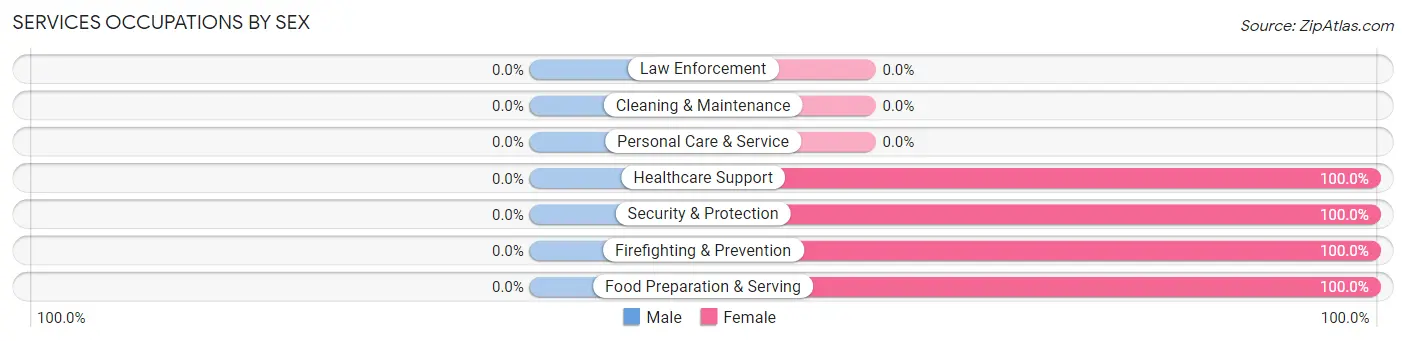
| Occupation | Male | Female |
| Healthcare Support | 0 (0.0%) | 12 (100.0%) |
| Security & Protection | 0 (0.0%) | 4 (100.0%) |
| Firefighting & Prevention | 0 (0.0%) | 4 (100.0%) |
| Law Enforcement | 0 (0.0%) | 0 (0.0%) |
| Food Preparation & Serving | 0 (0.0%) | 34 (100.0%) |
| Cleaning & Maintenance | 0 (0.0%) | 0 (0.0%) |
| Personal Care & Service | 0 (0.0%) | 0 (0.0%) |
| Total (Category) | 0 (0.0%) | 50 (100.0%) |
| Total (Overall) | 62 (31.5%) | 135 (68.5%) |
Sales and Office Occupations
Sales and Office Occupations by Sex
| Occupation | Male | Female |
| Sales & Related | 0 (0.0%) | 0 (0.0%) |
| Office & Administration | 0 (0.0%) | 0 (0.0%) |
| Total (Category) | 0 (0.0%) | 0 (0.0%) |
| Total (Overall) | 62 (31.5%) | 135 (68.5%) |
Natural Resources, Construction and Maintenance Occupations
The most common Natural Resources, Construction and Maintenance occupations in San Ygnacio are , and Farming, Fishing & Forestry (17 | 8.6%).
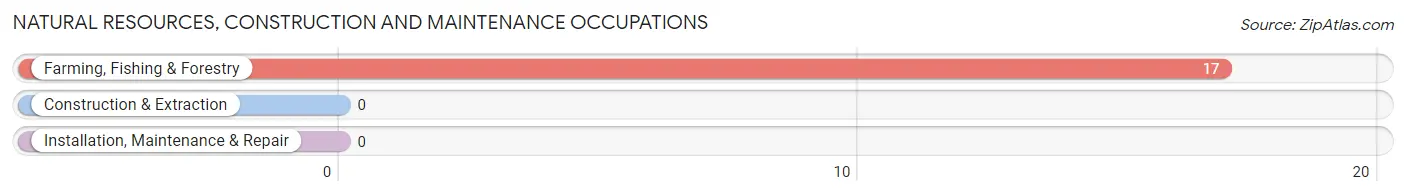
Natural Resources, Construction and Maintenance Occupations by Sex
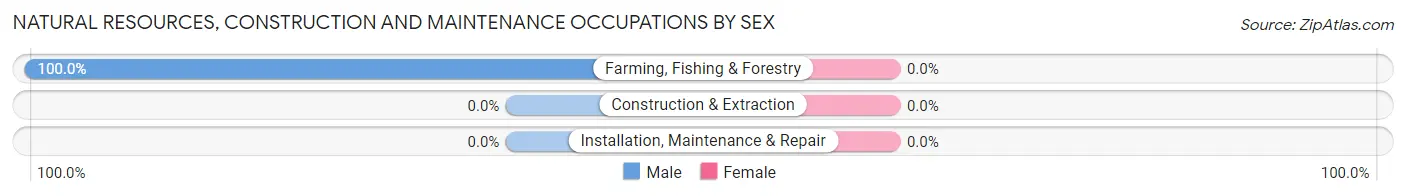
| Occupation | Male | Female |
| Farming, Fishing & Forestry | 17 (100.0%) | 0 (0.0%) |
| Construction & Extraction | 0 (0.0%) | 0 (0.0%) |
| Installation, Maintenance & Repair | 0 (0.0%) | 0 (0.0%) |
| Total (Category) | 17 (100.0%) | 0 (0.0%) |
| Total (Overall) | 62 (31.5%) | 135 (68.5%) |
Production, Transportation and Moving Occupations
Production, Transportation and Moving Occupations by Sex
| Occupation | Male | Female |
| Production | 0 (0.0%) | 0 (0.0%) |
| Transportation | 0 (0.0%) | 0 (0.0%) |
| Material Moving | 0 (0.0%) | 0 (0.0%) |
| Total (Category) | 0 (0.0%) | 0 (0.0%) |
| Total (Overall) | 62 (31.5%) | 135 (68.5%) |
Employment Industries by Sex in San Ygnacio
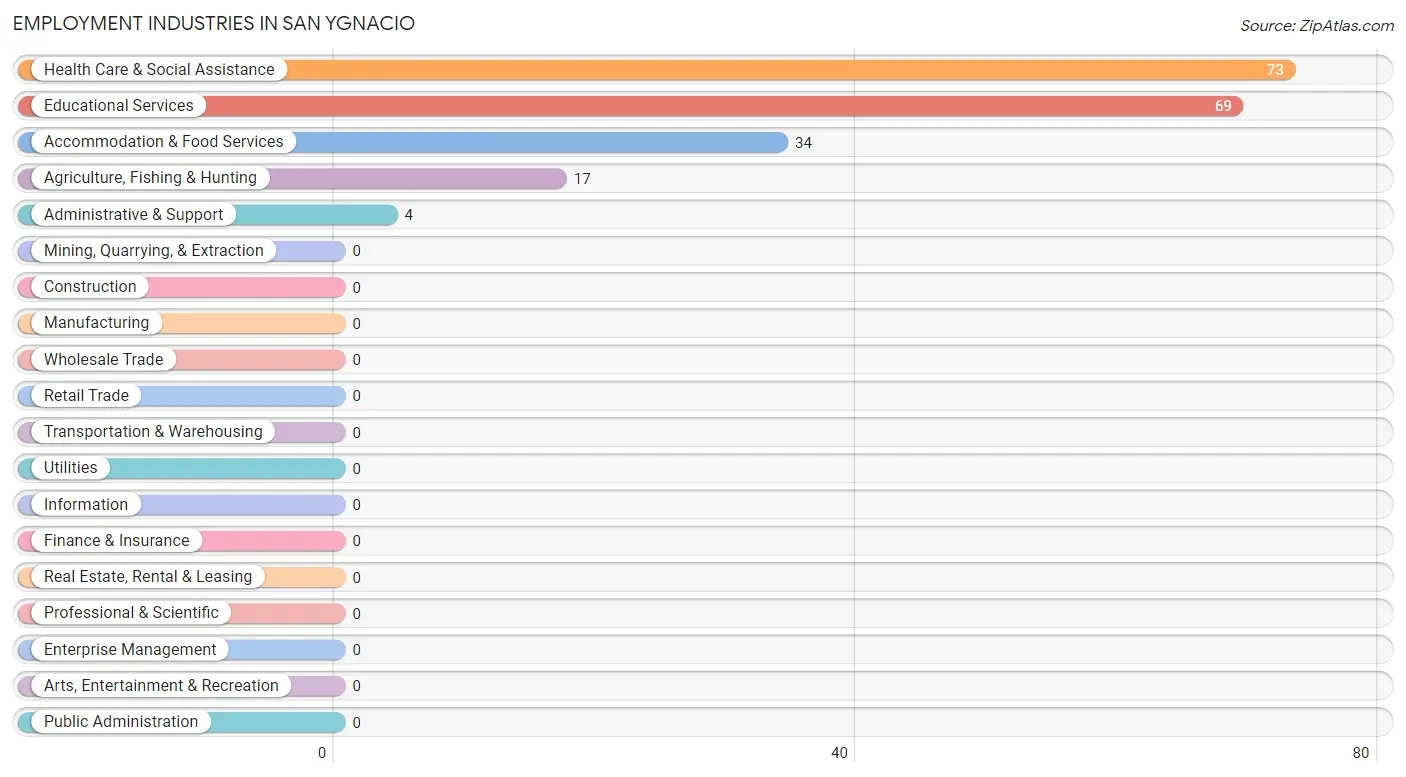
Employment Industries in San Ygnacio
The major employment industries in San Ygnacio include Health Care & Social Assistance (73 | 37.1%), Educational Services (69 | 35.0%), Accommodation & Food Services (34 | 17.3%), Agriculture, Fishing & Hunting (17 | 8.6%), and Administrative & Support (4 | 2.0%).
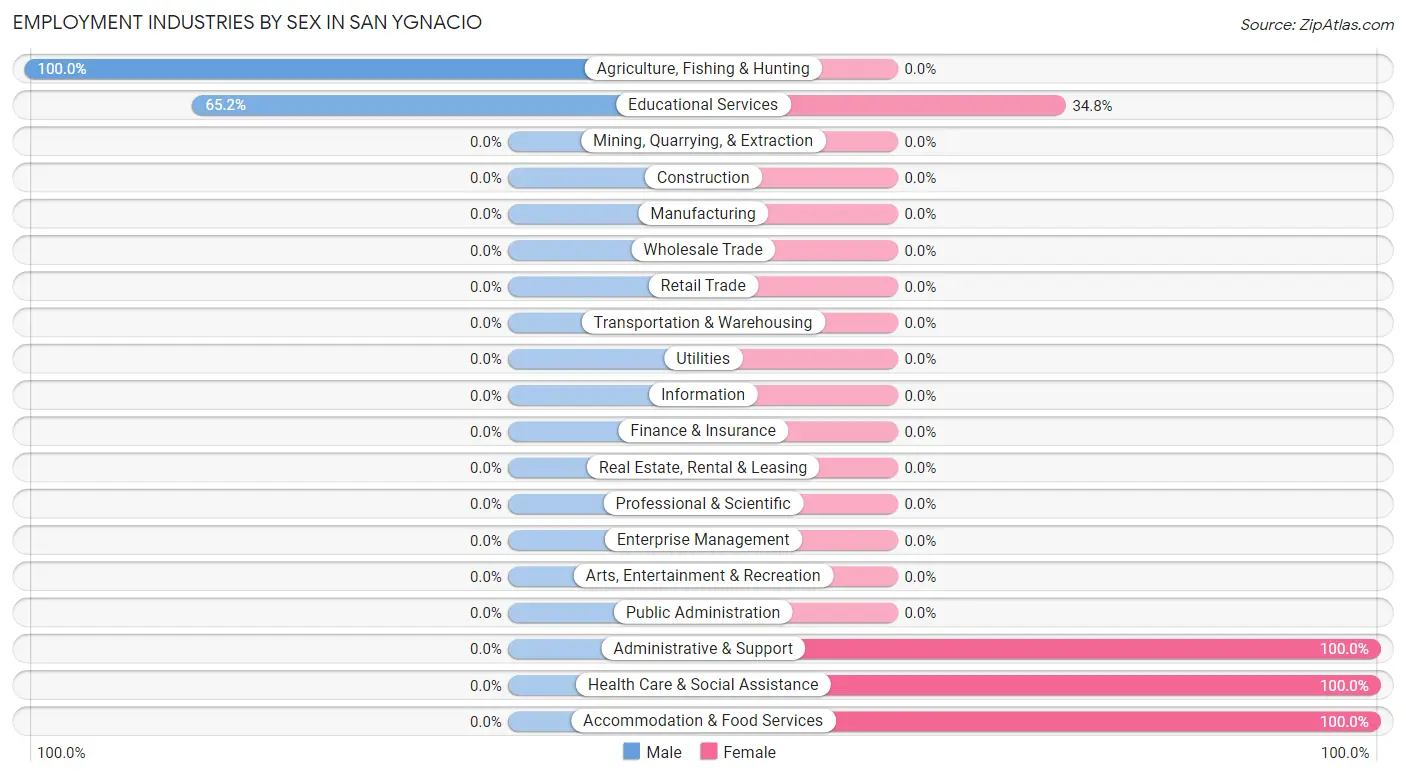
Employment Industries by Sex in San Ygnacio
The San Ygnacio industries that see more men than women are Agriculture, Fishing & Hunting (100.0%), and Educational Services (65.2%), whereas the industries that tend to have a higher number of women are Administrative & Support (100.0%), Health Care & Social Assistance (100.0%), and Accommodation & Food Services (100.0%).
| Industry | Male | Female |
| Agriculture, Fishing & Hunting | 17 (100.0%) | 0 (0.0%) |
| Mining, Quarrying, & Extraction | 0 (0.0%) | 0 (0.0%) |
| Construction | 0 (0.0%) | 0 (0.0%) |
| Manufacturing | 0 (0.0%) | 0 (0.0%) |
| Wholesale Trade | 0 (0.0%) | 0 (0.0%) |
| Retail Trade | 0 (0.0%) | 0 (0.0%) |
| Transportation & Warehousing | 0 (0.0%) | 0 (0.0%) |
| Utilities | 0 (0.0%) | 0 (0.0%) |
| Information | 0 (0.0%) | 0 (0.0%) |
| Finance & Insurance | 0 (0.0%) | 0 (0.0%) |
| Real Estate, Rental & Leasing | 0 (0.0%) | 0 (0.0%) |
| Professional & Scientific | 0 (0.0%) | 0 (0.0%) |
| Enterprise Management | 0 (0.0%) | 0 (0.0%) |
| Administrative & Support | 0 (0.0%) | 4 (100.0%) |
| Educational Services | 45 (65.2%) | 24 (34.8%) |
| Health Care & Social Assistance | 0 (0.0%) | 73 (100.0%) |
| Arts, Entertainment & Recreation | 0 (0.0%) | 0 (0.0%) |
| Accommodation & Food Services | 0 (0.0%) | 34 (100.0%) |
| Public Administration | 0 (0.0%) | 0 (0.0%) |
| Total | 62 (31.5%) | 135 (68.5%) |
Education in San Ygnacio
School Enrollment in San Ygnacio
The most common levels of schooling among the 191 students in San Ygnacio are high school (90 | 47.1%), kindergarten (33 | 17.3%), and elementary school (31 | 16.2%).
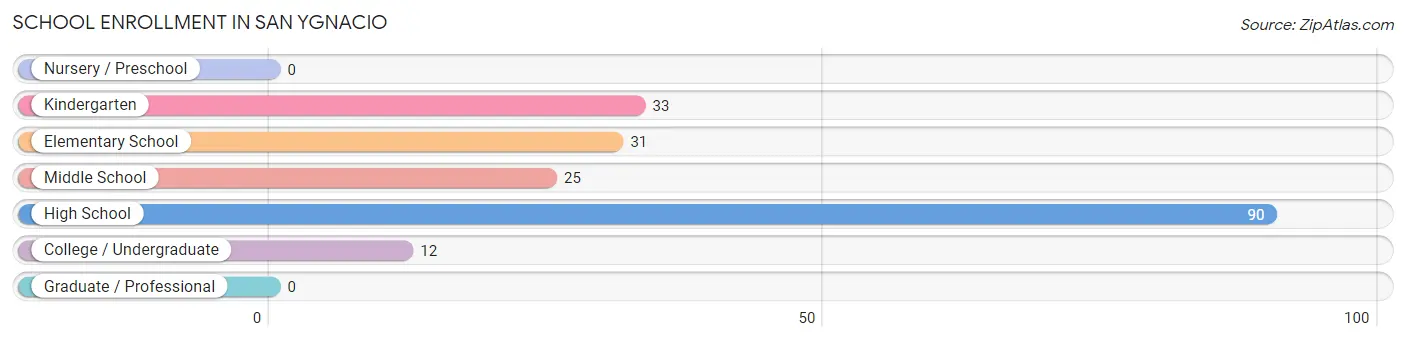
| School Level | # Students | % Students |
| Nursery / Preschool | 0 | 0.0% |
| Kindergarten | 33 | 17.3% |
| Elementary School | 31 | 16.2% |
| Middle School | 25 | 13.1% |
| High School | 90 | 47.1% |
| College / Undergraduate | 12 | 6.3% |
| Graduate / Professional | 0 | 0.0% |
| Total | 191 | 100.0% |
School Enrollment by Age by Funding Source in San Ygnacio
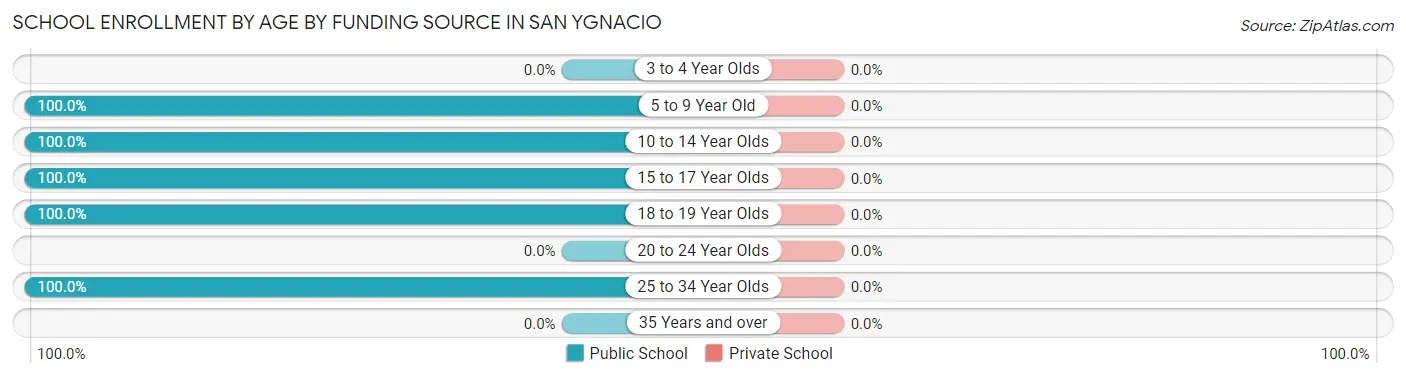
| Age Bracket | Public School | Private School |
| 3 to 4 Year Olds | 0 (0.0%) | 0 (0.0%) |
| 5 to 9 Year Old | 64 (100.0%) | 0 (0.0%) |
| 10 to 14 Year Olds | 25 (100.0%) | 0 (0.0%) |
| 15 to 17 Year Olds | 78 (100.0%) | 0 (0.0%) |
| 18 to 19 Year Olds | 12 (100.0%) | 0 (0.0%) |
| 20 to 24 Year Olds | 0 (0.0%) | 0 (0.0%) |
| 25 to 34 Year Olds | 12 (100.0%) | 0 (0.0%) |
| 35 Years and over | 0 (0.0%) | 0 (0.0%) |
| Total | 191 (100.0%) | 0 (0.0%) |
Educational Attainment by Field of Study in San Ygnacio
, and psychology (13 | 100.0%) are the most common fields of study among 13 individuals in San Ygnacio who have obtained a bachelor's degree or higher.
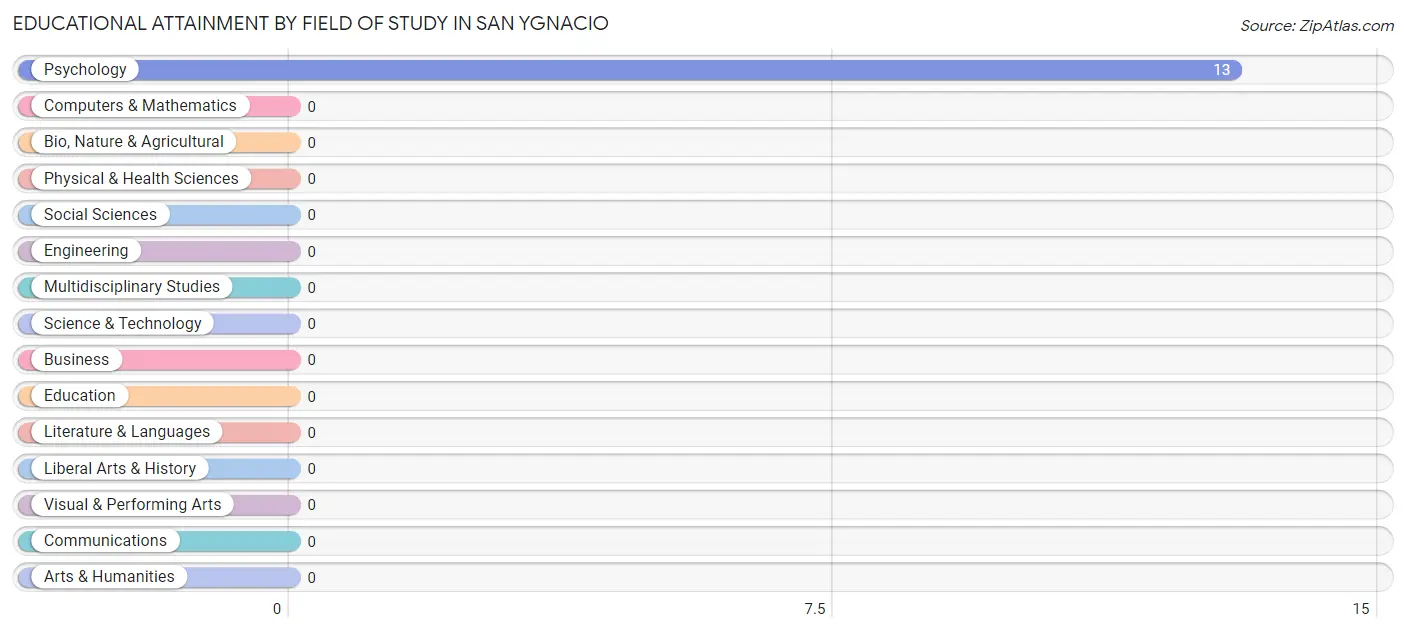
| Field of Study | # Graduates | % Graduates |
| Computers & Mathematics | 0 | 0.0% |
| Bio, Nature & Agricultural | 0 | 0.0% |
| Physical & Health Sciences | 0 | 0.0% |
| Psychology | 13 | 100.0% |
| Social Sciences | 0 | 0.0% |
| Engineering | 0 | 0.0% |
| Multidisciplinary Studies | 0 | 0.0% |
| Science & Technology | 0 | 0.0% |
| Business | 0 | 0.0% |
| Education | 0 | 0.0% |
| Literature & Languages | 0 | 0.0% |
| Liberal Arts & History | 0 | 0.0% |
| Visual & Performing Arts | 0 | 0.0% |
| Communications | 0 | 0.0% |
| Arts & Humanities | 0 | 0.0% |
| Total | 13 | 100.0% |
Transportation & Commute in San Ygnacio
Vehicle Availability by Sex in San Ygnacio
The most prevalent vehicle ownership categories in San Ygnacio are males with 2 vehicles (45, accounting for 72.6%) and females with 2 vehicles (85, making up 33.3%).
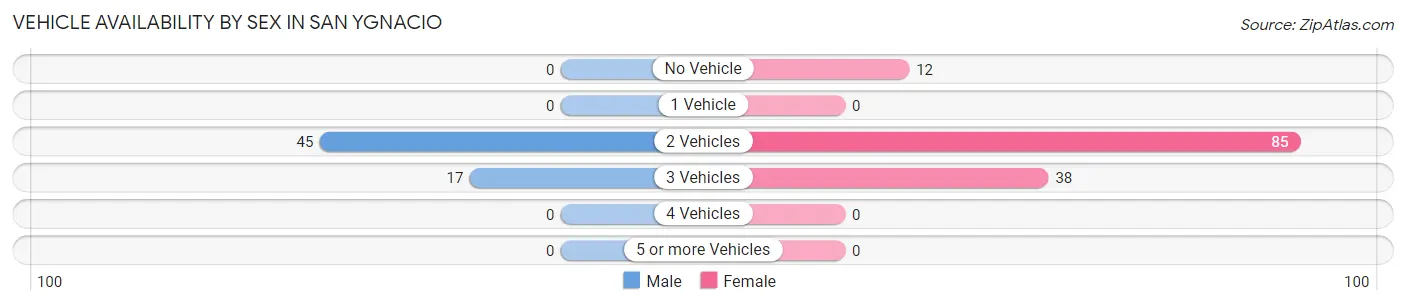
| Vehicles Available | Male | Female |
| No Vehicle | 0 (0.0%) | 12 (8.9%) |
| 1 Vehicle | 0 (0.0%) | 0 (0.0%) |
| 2 Vehicles | 45 (72.6%) | 85 (63.0%) |
| 3 Vehicles | 17 (27.4%) | 38 (28.1%) |
| 4 Vehicles | 0 (0.0%) | 0 (0.0%) |
| 5 or more Vehicles | 0 (0.0%) | 0 (0.0%) |
| Total | 62 (100.0%) | 135 (100.0%) |
Commute Time in San Ygnacio
The most frequently occuring commute durations in San Ygnacio are 5 to 9 minutes (58 commuters, 48.7%), 20 to 24 minutes (32 commuters, 26.9%), and 90 or more minutes (16 commuters, 13.5%).
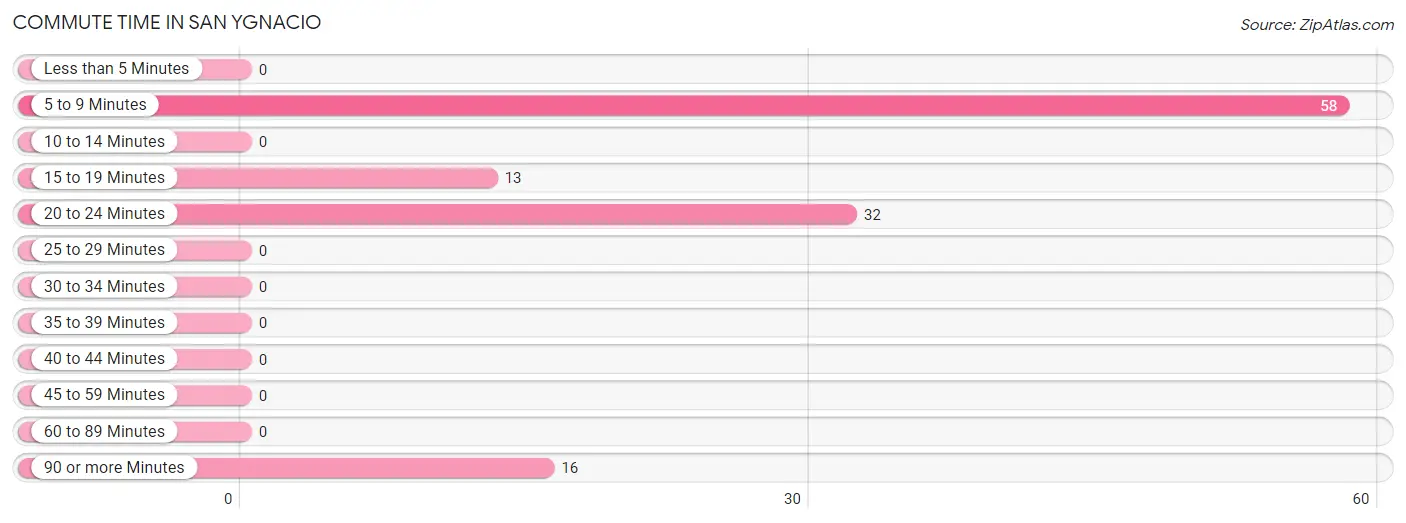
| Commute Time | # Commuters | % Commuters |
| Less than 5 Minutes | 0 | 0.0% |
| 5 to 9 Minutes | 58 | 48.7% |
| 10 to 14 Minutes | 0 | 0.0% |
| 15 to 19 Minutes | 13 | 10.9% |
| 20 to 24 Minutes | 32 | 26.9% |
| 25 to 29 Minutes | 0 | 0.0% |
| 30 to 34 Minutes | 0 | 0.0% |
| 35 to 39 Minutes | 0 | 0.0% |
| 40 to 44 Minutes | 0 | 0.0% |
| 45 to 59 Minutes | 0 | 0.0% |
| 60 to 89 Minutes | 0 | 0.0% |
| 90 or more Minutes | 16 | 13.5% |
Commute Time by Sex in San Ygnacio
The most common commute times in San Ygnacio are 20 to 24 minutes (32 commuters, 71.1%) for males and 5 to 9 minutes (58 commuters, 78.4%) for females.
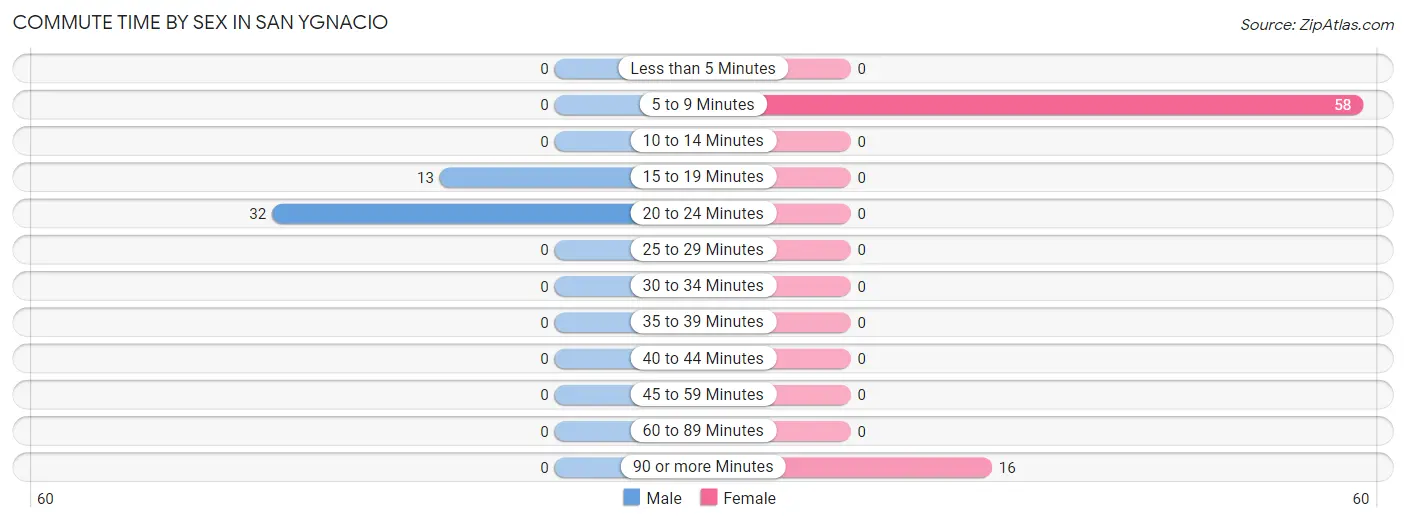
| Commute Time | Male | Female |
| Less than 5 Minutes | 0 (0.0%) | 0 (0.0%) |
| 5 to 9 Minutes | 0 (0.0%) | 58 (78.4%) |
| 10 to 14 Minutes | 0 (0.0%) | 0 (0.0%) |
| 15 to 19 Minutes | 13 (28.9%) | 0 (0.0%) |
| 20 to 24 Minutes | 32 (71.1%) | 0 (0.0%) |
| 25 to 29 Minutes | 0 (0.0%) | 0 (0.0%) |
| 30 to 34 Minutes | 0 (0.0%) | 0 (0.0%) |
| 35 to 39 Minutes | 0 (0.0%) | 0 (0.0%) |
| 40 to 44 Minutes | 0 (0.0%) | 0 (0.0%) |
| 45 to 59 Minutes | 0 (0.0%) | 0 (0.0%) |
| 60 to 89 Minutes | 0 (0.0%) | 0 (0.0%) |
| 90 or more Minutes | 0 (0.0%) | 16 (21.6%) |
Time of Departure to Work by Sex in San Ygnacio
The most frequent times of departure to work in San Ygnacio are 6:30 AM to 6:59 AM (32, 71.1%) for males and 7:00 AM to 7:29 AM (24, 32.4%) for females.
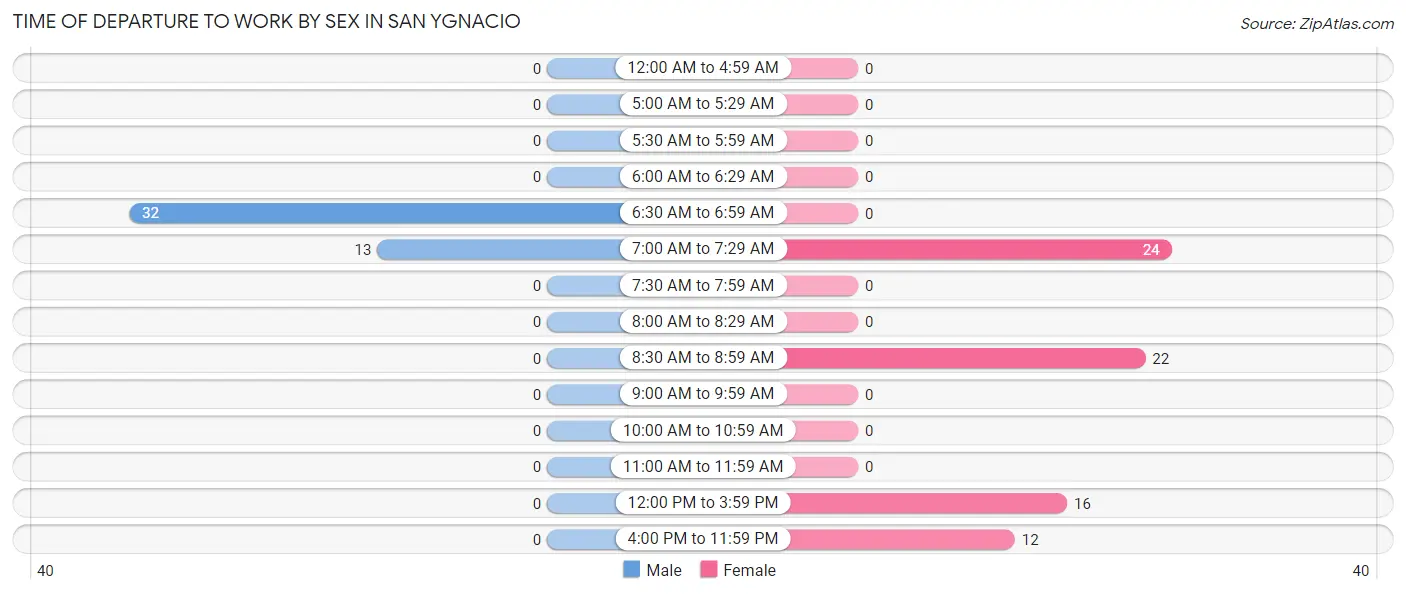
| Time of Departure | Male | Female |
| 12:00 AM to 4:59 AM | 0 (0.0%) | 0 (0.0%) |
| 5:00 AM to 5:29 AM | 0 (0.0%) | 0 (0.0%) |
| 5:30 AM to 5:59 AM | 0 (0.0%) | 0 (0.0%) |
| 6:00 AM to 6:29 AM | 0 (0.0%) | 0 (0.0%) |
| 6:30 AM to 6:59 AM | 32 (71.1%) | 0 (0.0%) |
| 7:00 AM to 7:29 AM | 13 (28.9%) | 24 (32.4%) |
| 7:30 AM to 7:59 AM | 0 (0.0%) | 0 (0.0%) |
| 8:00 AM to 8:29 AM | 0 (0.0%) | 0 (0.0%) |
| 8:30 AM to 8:59 AM | 0 (0.0%) | 22 (29.7%) |
| 9:00 AM to 9:59 AM | 0 (0.0%) | 0 (0.0%) |
| 10:00 AM to 10:59 AM | 0 (0.0%) | 0 (0.0%) |
| 11:00 AM to 11:59 AM | 0 (0.0%) | 0 (0.0%) |
| 12:00 PM to 3:59 PM | 0 (0.0%) | 16 (21.6%) |
| 4:00 PM to 11:59 PM | 0 (0.0%) | 12 (16.2%) |
| Total | 45 (100.0%) | 74 (100.0%) |
Housing Occupancy in San Ygnacio
Occupancy by Ownership in San Ygnacio
Of the total 208 dwellings in San Ygnacio, owner-occupied units account for 208 (100.0%), while renter-occupied units make up 0 (0.0%).
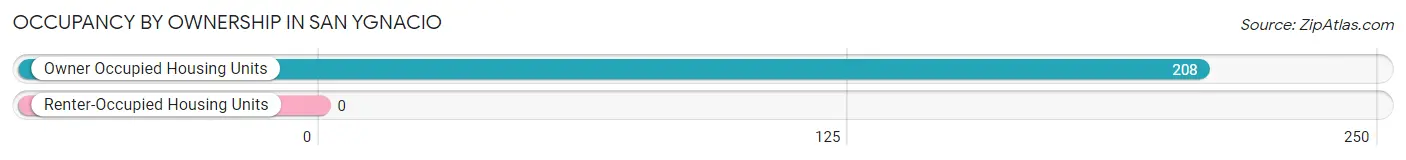
| Occupancy | # Housing Units | % Housing Units |
| Owner Occupied Housing Units | 208 | 100.0% |
| Renter-Occupied Housing Units | 0 | 0.0% |
| Total Occupied Housing Units | 208 | 100.0% |
Occupancy by Household Size in San Ygnacio
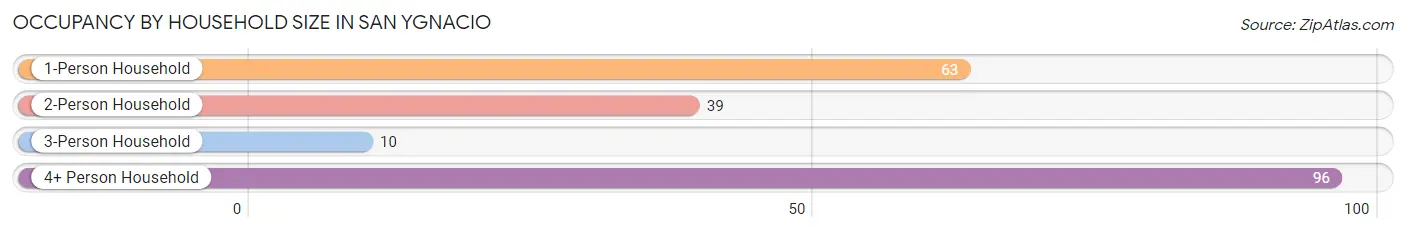
| Household Size | # Housing Units | % Housing Units |
| 1-Person Household | 63 | 30.3% |
| 2-Person Household | 39 | 18.8% |
| 3-Person Household | 10 | 4.8% |
| 4+ Person Household | 96 | 46.2% |
| Total Housing Units | 208 | 100.0% |
Occupancy by Ownership by Household Size in San Ygnacio
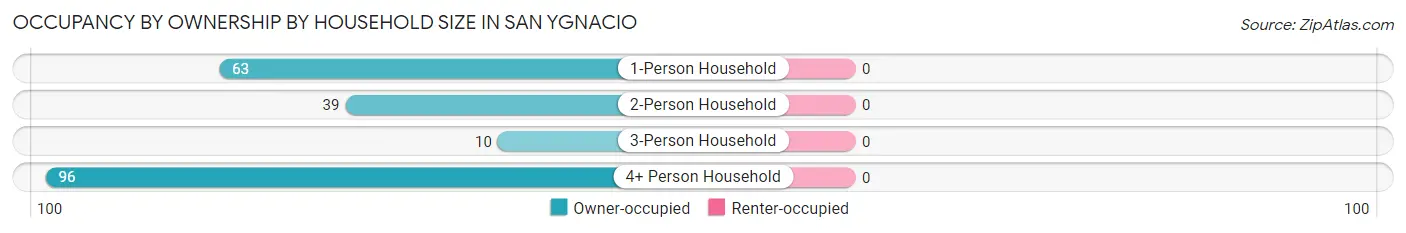
| Household Size | Owner-occupied | Renter-occupied |
| 1-Person Household | 63 (100.0%) | 0 (0.0%) |
| 2-Person Household | 39 (100.0%) | 0 (0.0%) |
| 3-Person Household | 10 (100.0%) | 0 (0.0%) |
| 4+ Person Household | 96 (100.0%) | 0 (0.0%) |
| Total Housing Units | 208 (100.0%) | 0 (0.0%) |
Occupancy by Educational Attainment in San Ygnacio
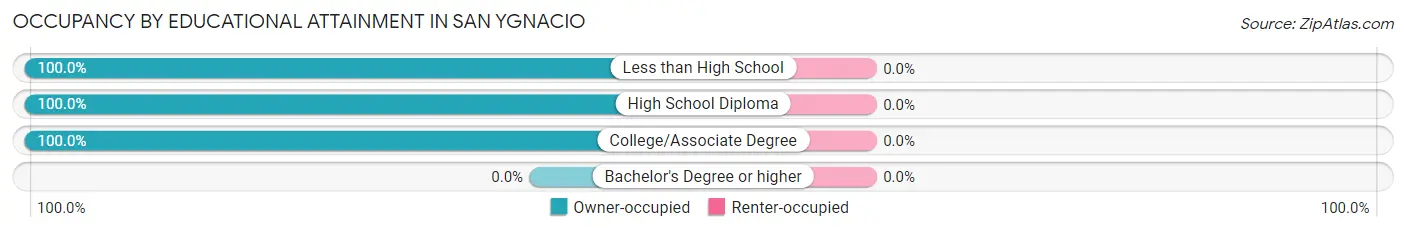
| Household Size | Owner-occupied | Renter-occupied |
| Less than High School | 42 (100.0%) | 0 (0.0%) |
| High School Diploma | 147 (100.0%) | 0 (0.0%) |
| College/Associate Degree | 19 (100.0%) | 0 (0.0%) |
| Bachelor's Degree or higher | 0 (0.0%) | 0 (0.0%) |
Occupancy by Age of Householder in San Ygnacio
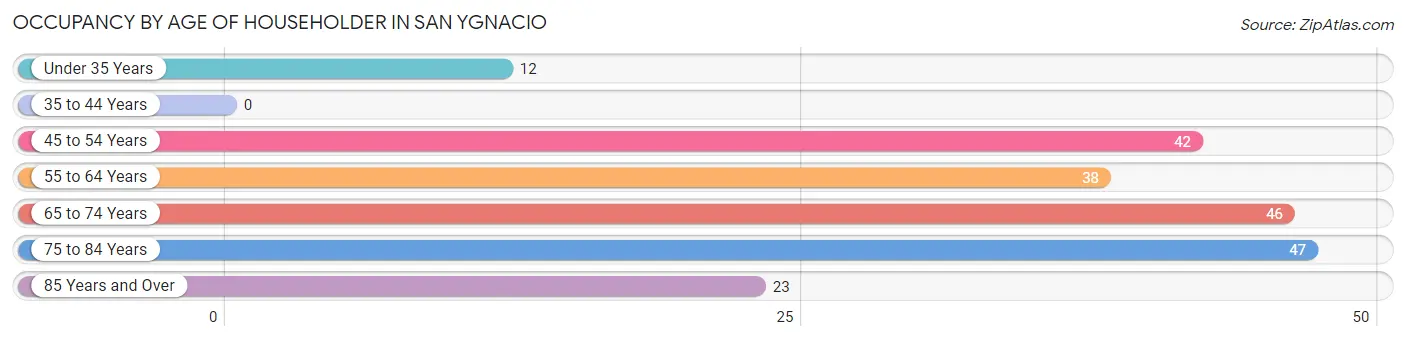
| Age Bracket | # Households | % Households |
| Under 35 Years | 12 | 5.8% |
| 35 to 44 Years | 0 | 0.0% |
| 45 to 54 Years | 42 | 20.2% |
| 55 to 64 Years | 38 | 18.3% |
| 65 to 74 Years | 46 | 22.1% |
| 75 to 84 Years | 47 | 22.6% |
| 85 Years and Over | 23 | 11.1% |
| Total | 208 | 100.0% |
Housing Finances in San Ygnacio
Median Income by Occupancy in San Ygnacio
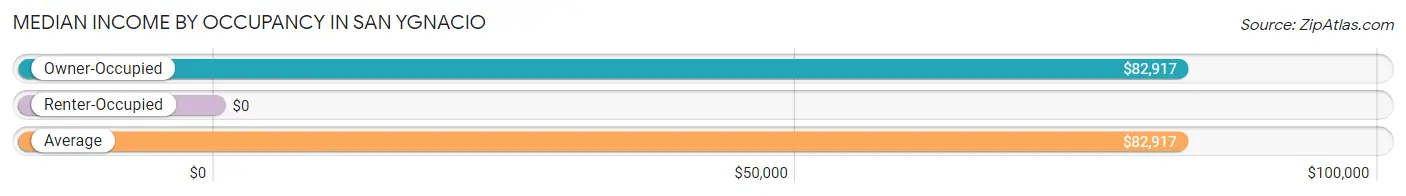
| Occupancy Type | # Households | Median Income |
| Owner-Occupied | 208 (100.0%) | $82,917 |
| Renter-Occupied | 0 (0.0%) | $0 |
| Average | 208 (100.0%) | $82,917 |
Occupancy by Householder Income Bracket in San Ygnacio
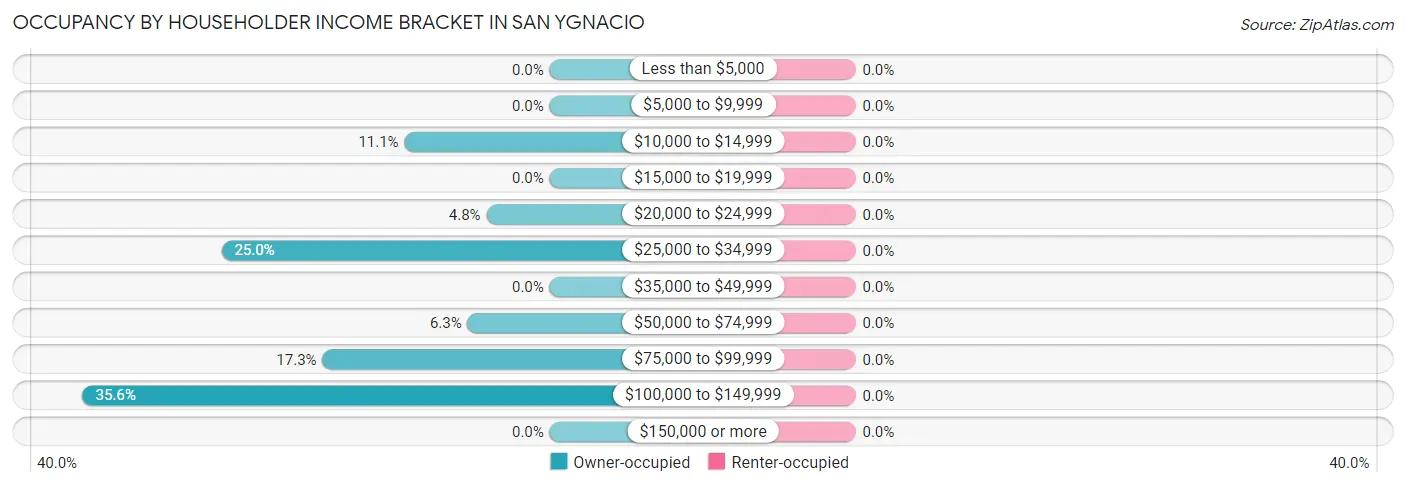
| Income Bracket | Owner-occupied | Renter-occupied |
| Less than $5,000 | 0 (0.0%) | 0 (0.0%) |
| $5,000 to $9,999 | 0 (0.0%) | 0 (0.0%) |
| $10,000 to $14,999 | 23 (11.1%) | 0 (0.0%) |
| $15,000 to $19,999 | 0 (0.0%) | 0 (0.0%) |
| $20,000 to $24,999 | 10 (4.8%) | 0 (0.0%) |
| $25,000 to $34,999 | 52 (25.0%) | 0 (0.0%) |
| $35,000 to $49,999 | 0 (0.0%) | 0 (0.0%) |
| $50,000 to $74,999 | 13 (6.2%) | 0 (0.0%) |
| $75,000 to $99,999 | 36 (17.3%) | 0 (0.0%) |
| $100,000 to $149,999 | 74 (35.6%) | 0 (0.0%) |
| $150,000 or more | 0 (0.0%) | 0 (0.0%) |
| Total | 208 (100.0%) | 0 (0.0%) |
Monthly Housing Cost Tiers in San Ygnacio
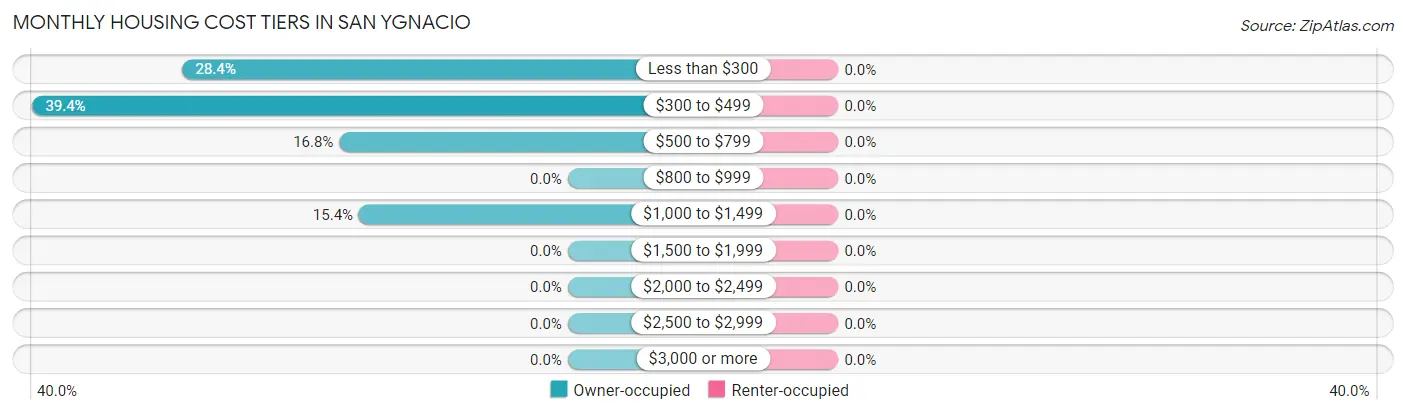
| Monthly Cost | Owner-occupied | Renter-occupied |
| Less than $300 | 59 (28.4%) | 0 (0.0%) |
| $300 to $499 | 82 (39.4%) | 0 (0.0%) |
| $500 to $799 | 35 (16.8%) | 0 (0.0%) |
| $800 to $999 | 0 (0.0%) | 0 (0.0%) |
| $1,000 to $1,499 | 32 (15.4%) | 0 (0.0%) |
| $1,500 to $1,999 | 0 (0.0%) | 0 (0.0%) |
| $2,000 to $2,499 | 0 (0.0%) | 0 (0.0%) |
| $2,500 to $2,999 | 0 (0.0%) | 0 (0.0%) |
| $3,000 or more | 0 (0.0%) | 0 (0.0%) |
| Total | 208 (100.0%) | 0 (0.0%) |
Physical Housing Characteristics in San Ygnacio
Housing Structures in San Ygnacio
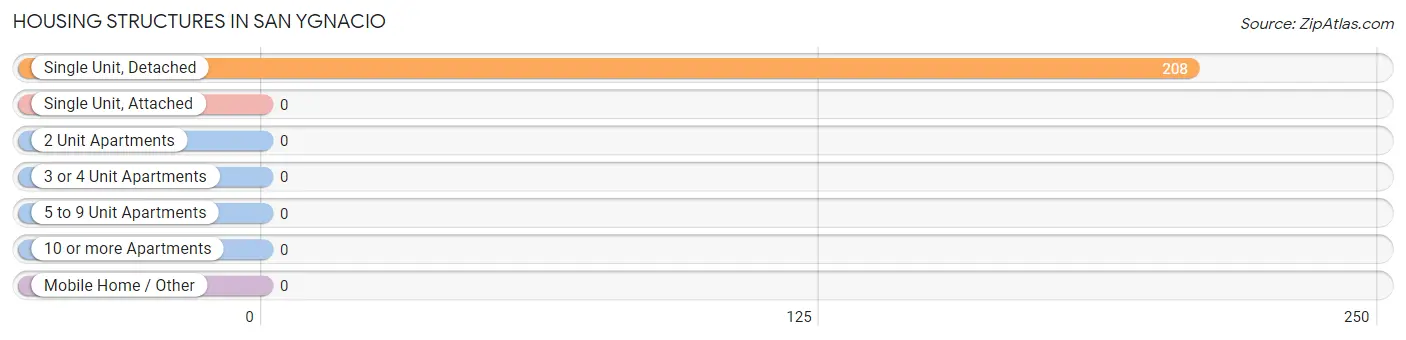
| Structure Type | # Housing Units | % Housing Units |
| Single Unit, Detached | 208 | 100.0% |
| Single Unit, Attached | 0 | 0.0% |
| 2 Unit Apartments | 0 | 0.0% |
| 3 or 4 Unit Apartments | 0 | 0.0% |
| 5 to 9 Unit Apartments | 0 | 0.0% |
| 10 or more Apartments | 0 | 0.0% |
| Mobile Home / Other | 0 | 0.0% |
| Total | 208 | 100.0% |
Housing Structures by Occupancy in San Ygnacio
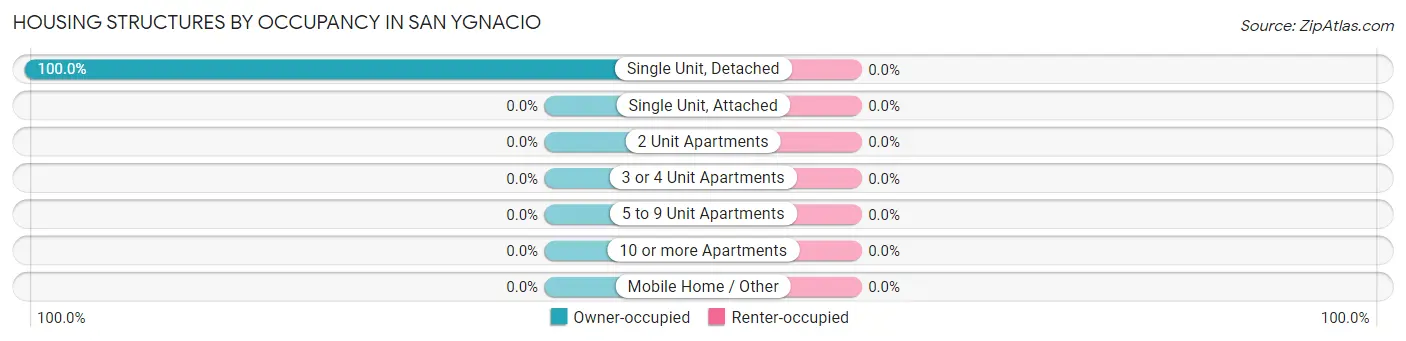
| Structure Type | Owner-occupied | Renter-occupied |
| Single Unit, Detached | 208 (100.0%) | 0 (0.0%) |
| Single Unit, Attached | 0 (0.0%) | 0 (0.0%) |
| 2 Unit Apartments | 0 (0.0%) | 0 (0.0%) |
| 3 or 4 Unit Apartments | 0 (0.0%) | 0 (0.0%) |
| 5 to 9 Unit Apartments | 0 (0.0%) | 0 (0.0%) |
| 10 or more Apartments | 0 (0.0%) | 0 (0.0%) |
| Mobile Home / Other | 0 (0.0%) | 0 (0.0%) |
| Total | 208 (100.0%) | 0 (0.0%) |
Housing Structures by Number of Rooms in San Ygnacio
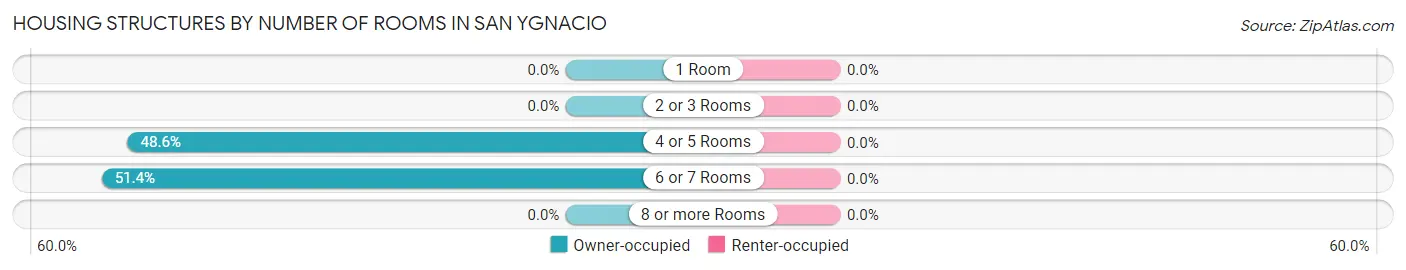
| Number of Rooms | Owner-occupied | Renter-occupied |
| 1 Room | 0 (0.0%) | 0 (0.0%) |
| 2 or 3 Rooms | 0 (0.0%) | 0 (0.0%) |
| 4 or 5 Rooms | 101 (48.6%) | 0 (0.0%) |
| 6 or 7 Rooms | 107 (51.4%) | 0 (0.0%) |
| 8 or more Rooms | 0 (0.0%) | 0 (0.0%) |
| Total | 208 (100.0%) | 0 (0.0%) |
Housing Structure by Heating Type in San Ygnacio
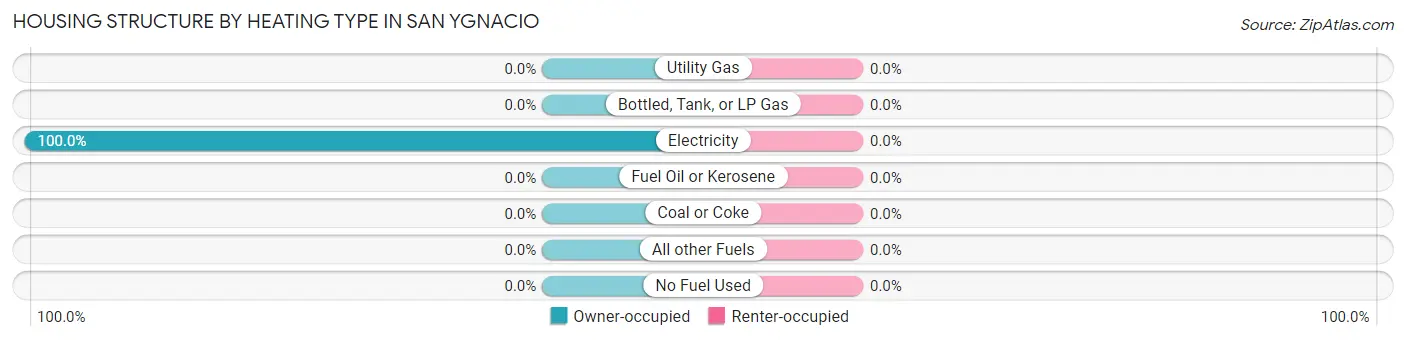
| Heating Type | Owner-occupied | Renter-occupied |
| Utility Gas | 0 (0.0%) | 0 (0.0%) |
| Bottled, Tank, or LP Gas | 0 (0.0%) | 0 (0.0%) |
| Electricity | 208 (100.0%) | 0 (0.0%) |
| Fuel Oil or Kerosene | 0 (0.0%) | 0 (0.0%) |
| Coal or Coke | 0 (0.0%) | 0 (0.0%) |
| All other Fuels | 0 (0.0%) | 0 (0.0%) |
| No Fuel Used | 0 (0.0%) | 0 (0.0%) |
| Total | 208 (100.0%) | 0 (0.0%) |
Household Vehicle Usage in San Ygnacio
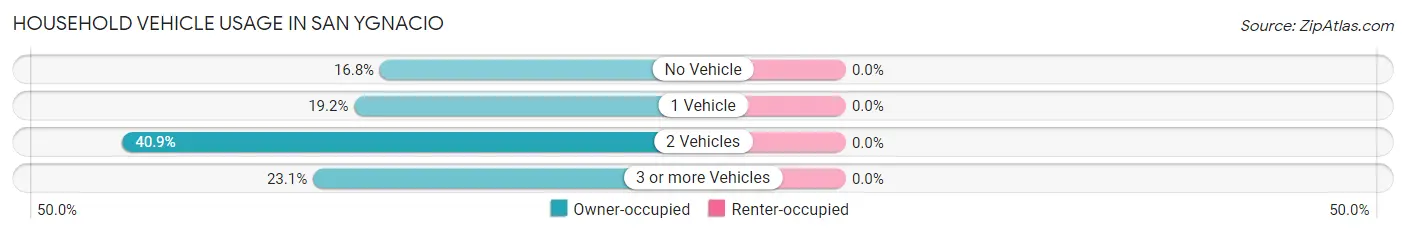
| Vehicles per Household | Owner-occupied | Renter-occupied |
| No Vehicle | 35 (16.8%) | 0 (0.0%) |
| 1 Vehicle | 40 (19.2%) | 0 (0.0%) |
| 2 Vehicles | 85 (40.9%) | 0 (0.0%) |
| 3 or more Vehicles | 48 (23.1%) | 0 (0.0%) |
| Total | 208 (100.0%) | 0 (0.0%) |
Real Estate & Mortgages in San Ygnacio
Real Estate and Mortgage Overview in San Ygnacio
| Characteristic | Without Mortgage | With Mortgage |
| Housing Units | 176 | 32 |
| Median Property Value | $66,700 | $0 |
| Median Household Income | - | - |
| Monthly Housing Costs | $332 | $0 |
| Real Estate Taxes | - | - |
Property Value by Mortgage Status in San Ygnacio
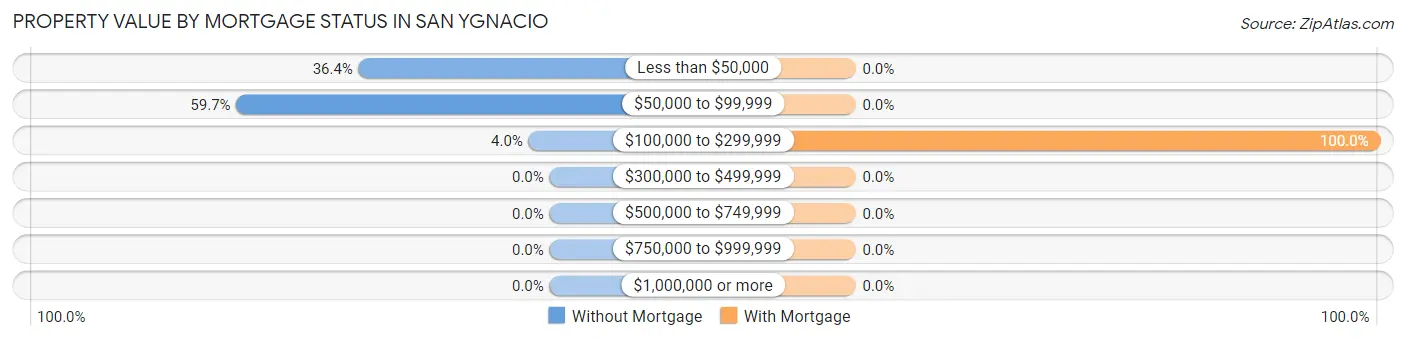
| Property Value | Without Mortgage | With Mortgage |
| Less than $50,000 | 64 (36.4%) | 0 (0.0%) |
| $50,000 to $99,999 | 105 (59.7%) | 0 (0.0%) |
| $100,000 to $299,999 | 7 (4.0%) | 32 (100.0%) |
| $300,000 to $499,999 | 0 (0.0%) | 0 (0.0%) |
| $500,000 to $749,999 | 0 (0.0%) | 0 (0.0%) |
| $750,000 to $999,999 | 0 (0.0%) | 0 (0.0%) |
| $1,000,000 or more | 0 (0.0%) | 0 (0.0%) |
| Total | 176 (100.0%) | 32 (100.0%) |
Household Income by Mortgage Status in San Ygnacio
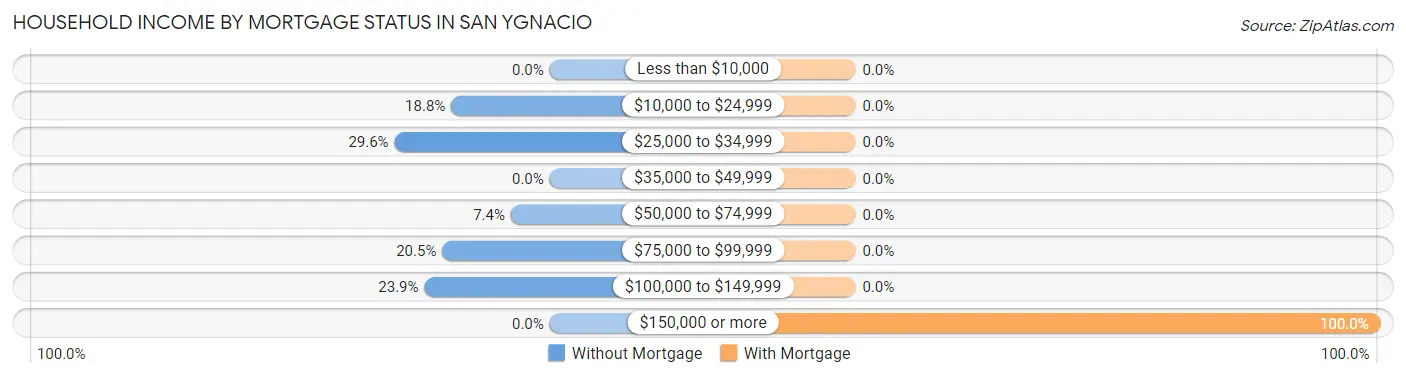
| Household Income | Without Mortgage | With Mortgage |
| Less than $10,000 | 0 (0.0%) | 0 (0.0%) |
| $10,000 to $24,999 | 33 (18.8%) | 0 (0.0%) |
| $25,000 to $34,999 | 52 (29.5%) | 0 (0.0%) |
| $35,000 to $49,999 | 0 (0.0%) | 0 (0.0%) |
| $50,000 to $74,999 | 13 (7.4%) | 0 (0.0%) |
| $75,000 to $99,999 | 36 (20.4%) | 0 (0.0%) |
| $100,000 to $149,999 | 42 (23.9%) | 0 (0.0%) |
| $150,000 or more | 0 (0.0%) | 32 (100.0%) |
| Total | 176 (100.0%) | 32 (100.0%) |
Property Value to Household Income Ratio in San Ygnacio
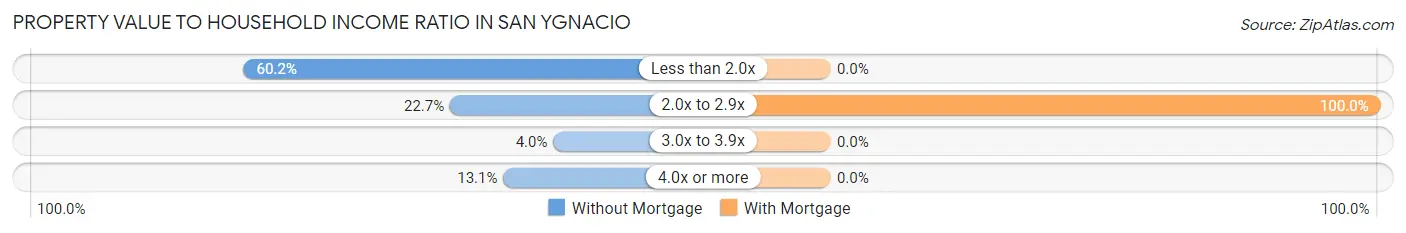
| Value-to-Income Ratio | Without Mortgage | With Mortgage |
| Less than 2.0x | 106 (60.2%) | 0 (0.0%) |
| 2.0x to 2.9x | 40 (22.7%) | 32 (100.0%) |
| 3.0x to 3.9x | 7 (4.0%) | 0 (0.0%) |
| 4.0x or more | 23 (13.1%) | 0 (0.0%) |
| Total | 176 (100.0%) | 32 (100.0%) |
Real Estate Taxes by Mortgage Status in San Ygnacio
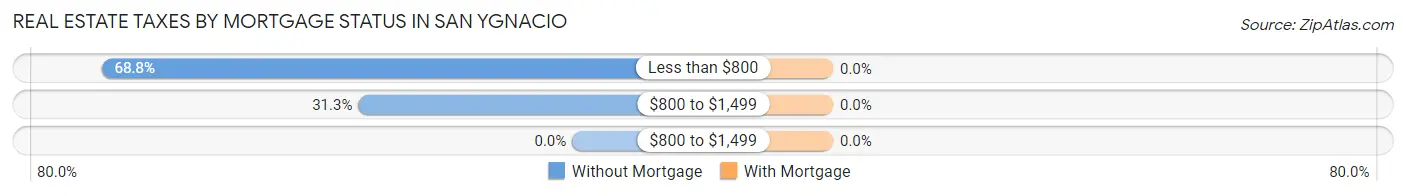
| Property Taxes | Without Mortgage | With Mortgage |
| Less than $800 | 121 (68.8%) | 0 (0.0%) |
| $800 to $1,499 | 55 (31.2%) | 0 (0.0%) |
| $800 to $1,499 | 0 (0.0%) | 0 (0.0%) |
| Total | 176 (100.0%) | 32 (100.0%) |
Health & Disability in San Ygnacio
Health Insurance Coverage by Age in San Ygnacio
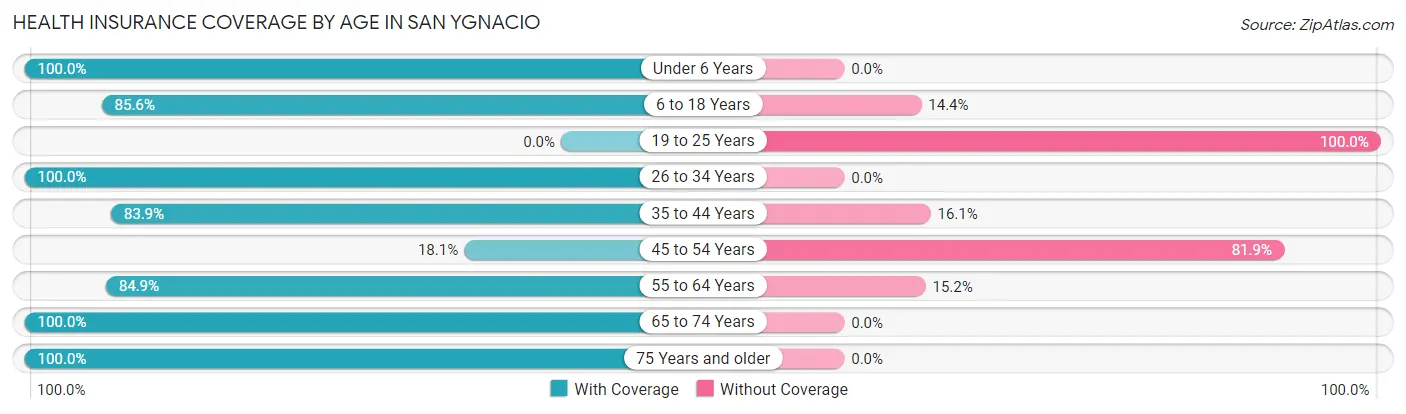
| Age Bracket | With Coverage | Without Coverage |
| Under 6 Years | 27 (100.0%) | 0 (0.0%) |
| 6 to 18 Years | 143 (85.6%) | 24 (14.4%) |
| 19 to 25 Years | 0 (0.0%) | 34 (100.0%) |
| 26 to 34 Years | 12 (100.0%) | 0 (0.0%) |
| 35 to 44 Years | 73 (83.9%) | 14 (16.1%) |
| 45 to 54 Years | 13 (18.1%) | 59 (81.9%) |
| 55 to 64 Years | 56 (84.9%) | 10 (15.1%) |
| 65 to 74 Years | 55 (100.0%) | 0 (0.0%) |
| 75 Years and older | 70 (100.0%) | 0 (0.0%) |
| Total | 449 (76.1%) | 141 (23.9%) |
Health Insurance Coverage by Citizenship Status in San Ygnacio
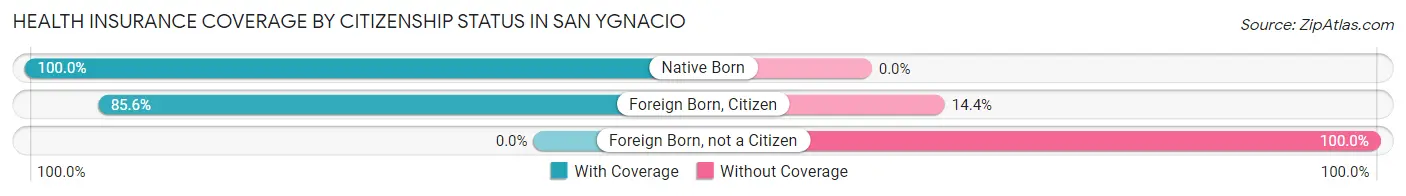
| Citizenship Status | With Coverage | Without Coverage |
| Native Born | 27 (100.0%) | 0 (0.0%) |
| Foreign Born, Citizen | 143 (85.6%) | 24 (14.4%) |
| Foreign Born, not a Citizen | 0 (0.0%) | 34 (100.0%) |
Health Insurance Coverage by Household Income in San Ygnacio
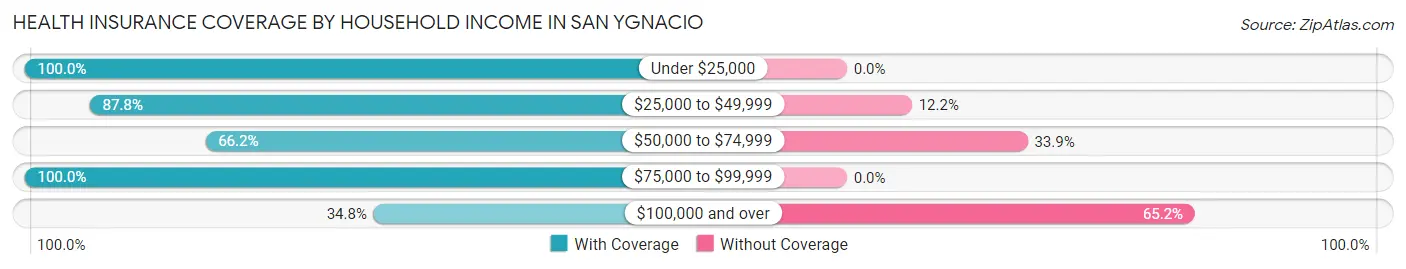
| Household Income | With Coverage | Without Coverage |
| Under $25,000 | 51 (100.0%) | 0 (0.0%) |
| $25,000 to $49,999 | 101 (87.8%) | 14 (12.2%) |
| $50,000 to $74,999 | 43 (66.1%) | 22 (33.9%) |
| $75,000 to $99,999 | 198 (100.0%) | 0 (0.0%) |
| $100,000 and over | 56 (34.8%) | 105 (65.2%) |
Public vs Private Health Insurance Coverage by Age in San Ygnacio
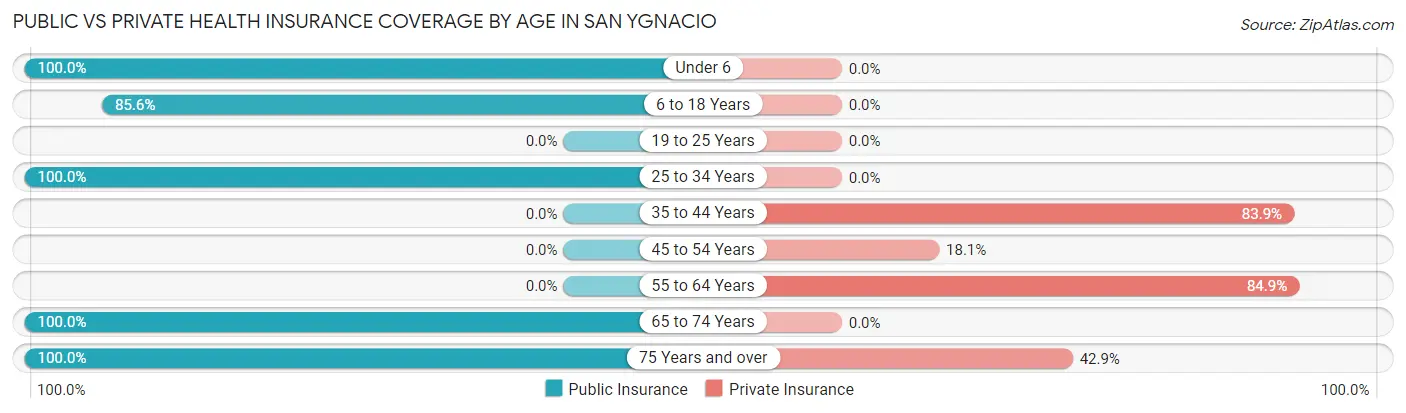
| Age Bracket | Public Insurance | Private Insurance |
| Under 6 | 27 (100.0%) | 0 (0.0%) |
| 6 to 18 Years | 143 (85.6%) | 0 (0.0%) |
| 19 to 25 Years | 0 (0.0%) | 0 (0.0%) |
| 25 to 34 Years | 12 (100.0%) | 0 (0.0%) |
| 35 to 44 Years | 0 (0.0%) | 73 (83.9%) |
| 45 to 54 Years | 0 (0.0%) | 13 (18.1%) |
| 55 to 64 Years | 0 (0.0%) | 56 (84.9%) |
| 65 to 74 Years | 55 (100.0%) | 0 (0.0%) |
| 75 Years and over | 70 (100.0%) | 30 (42.9%) |
| Total | 307 (52.0%) | 172 (29.1%) |
Disability Status by Sex by Age in San Ygnacio
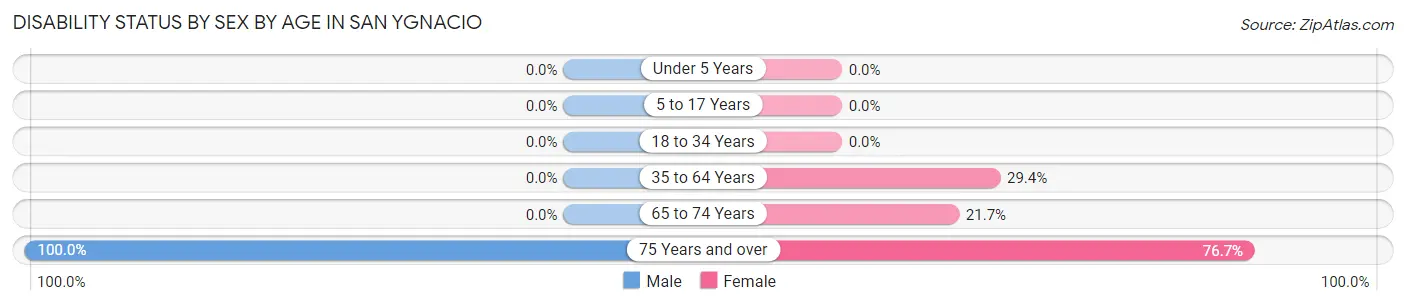
| Age Bracket | Male | Female |
| Under 5 Years | 0 (0.0%) | 0 (0.0%) |
| 5 to 17 Years | 0 (0.0%) | 0 (0.0%) |
| 18 to 34 Years | 0 (0.0%) | 0 (0.0%) |
| 35 to 64 Years | 0 (0.0%) | 42 (29.4%) |
| 65 to 74 Years | 0 (0.0%) | 10 (21.7%) |
| 75 Years and over | 40 (100.0%) | 23 (76.7%) |
Disability Class by Sex by Age in San Ygnacio
Disability Class: Hearing Difficulty
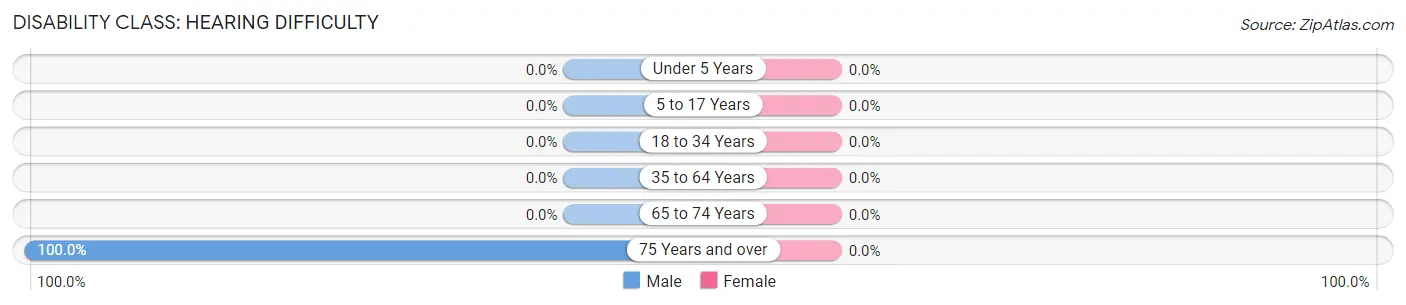
| Age Bracket | Male | Female |
| Under 5 Years | 0 (0.0%) | 0 (0.0%) |
| 5 to 17 Years | 0 (0.0%) | 0 (0.0%) |
| 18 to 34 Years | 0 (0.0%) | 0 (0.0%) |
| 35 to 64 Years | 0 (0.0%) | 0 (0.0%) |
| 65 to 74 Years | 0 (0.0%) | 0 (0.0%) |
| 75 Years and over | 40 (100.0%) | 0 (0.0%) |
Disability Class: Vision Difficulty
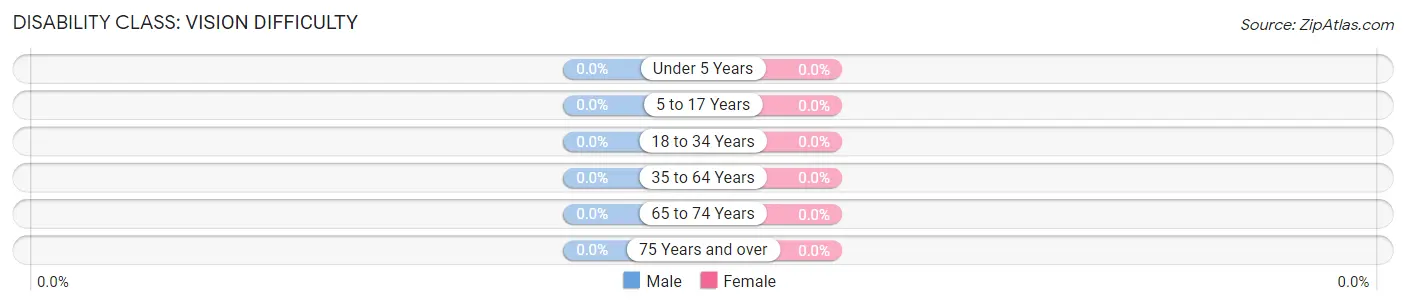
| Age Bracket | Male | Female |
| Under 5 Years | 0 (0.0%) | 0 (0.0%) |
| 5 to 17 Years | 0 (0.0%) | 0 (0.0%) |
| 18 to 34 Years | 0 (0.0%) | 0 (0.0%) |
| 35 to 64 Years | 0 (0.0%) | 0 (0.0%) |
| 65 to 74 Years | 0 (0.0%) | 0 (0.0%) |
| 75 Years and over | 0 (0.0%) | 0 (0.0%) |
Disability Class: Cognitive Difficulty
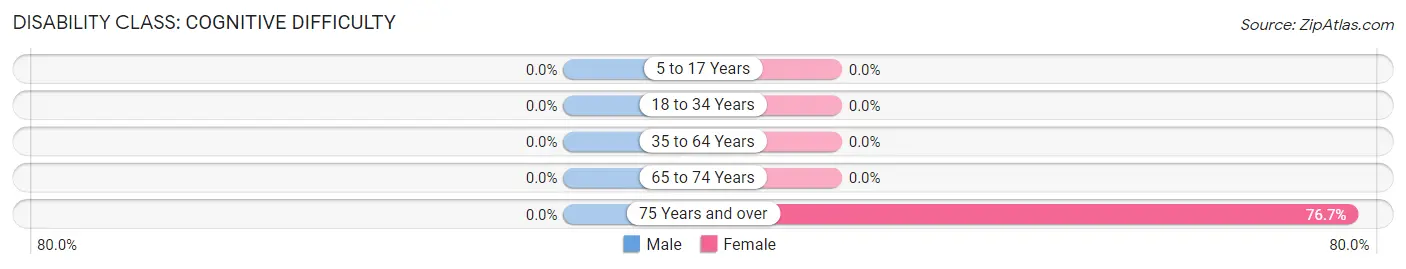
| Age Bracket | Male | Female |
| 5 to 17 Years | 0 (0.0%) | 0 (0.0%) |
| 18 to 34 Years | 0 (0.0%) | 0 (0.0%) |
| 35 to 64 Years | 0 (0.0%) | 0 (0.0%) |
| 65 to 74 Years | 0 (0.0%) | 0 (0.0%) |
| 75 Years and over | 0 (0.0%) | 23 (76.7%) |
Disability Class: Ambulatory Difficulty
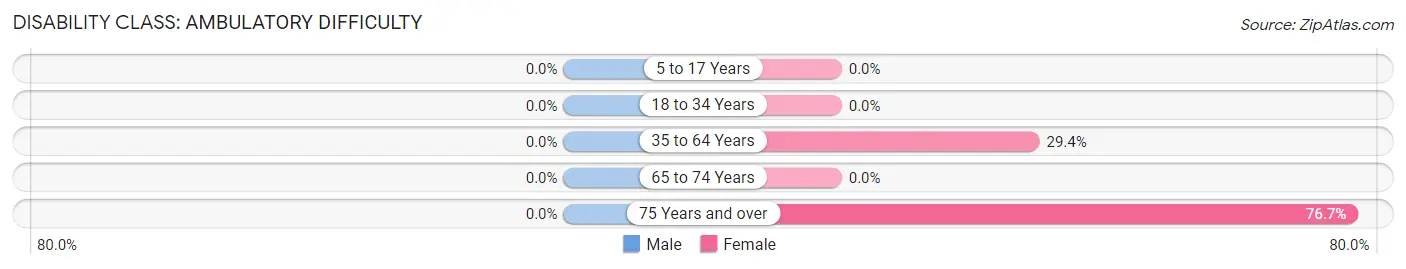
| Age Bracket | Male | Female |
| 5 to 17 Years | 0 (0.0%) | 0 (0.0%) |
| 18 to 34 Years | 0 (0.0%) | 0 (0.0%) |
| 35 to 64 Years | 0 (0.0%) | 42 (29.4%) |
| 65 to 74 Years | 0 (0.0%) | 0 (0.0%) |
| 75 Years and over | 0 (0.0%) | 23 (76.7%) |
Disability Class: Self-Care Difficulty
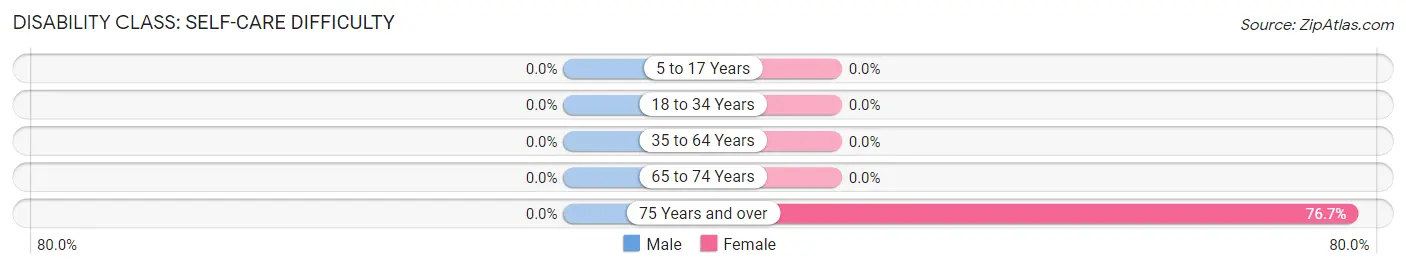
| Age Bracket | Male | Female |
| 5 to 17 Years | 0 (0.0%) | 0 (0.0%) |
| 18 to 34 Years | 0 (0.0%) | 0 (0.0%) |
| 35 to 64 Years | 0 (0.0%) | 0 (0.0%) |
| 65 to 74 Years | 0 (0.0%) | 0 (0.0%) |
| 75 Years and over | 0 (0.0%) | 23 (76.7%) |
Technology Access in San Ygnacio
Computing Device Access in San Ygnacio
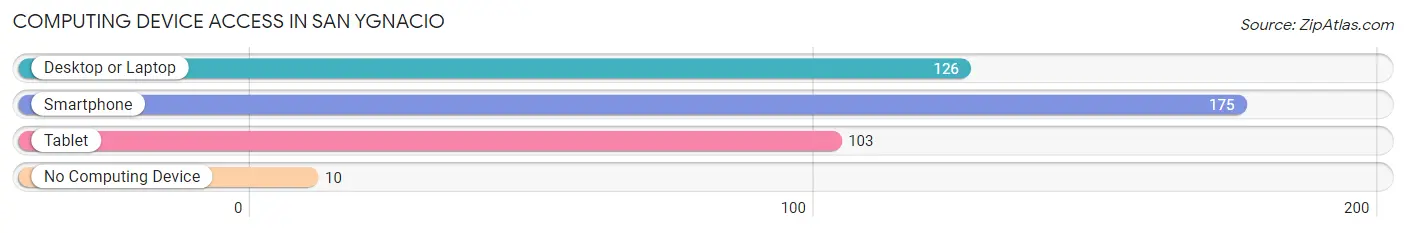
| Device Type | # Households | % Households |
| Desktop or Laptop | 126 | 60.6% |
| Smartphone | 175 | 84.1% |
| Tablet | 103 | 49.5% |
| No Computing Device | 10 | 4.8% |
| Total | 208 | 100.0% |
Internet Access in San Ygnacio
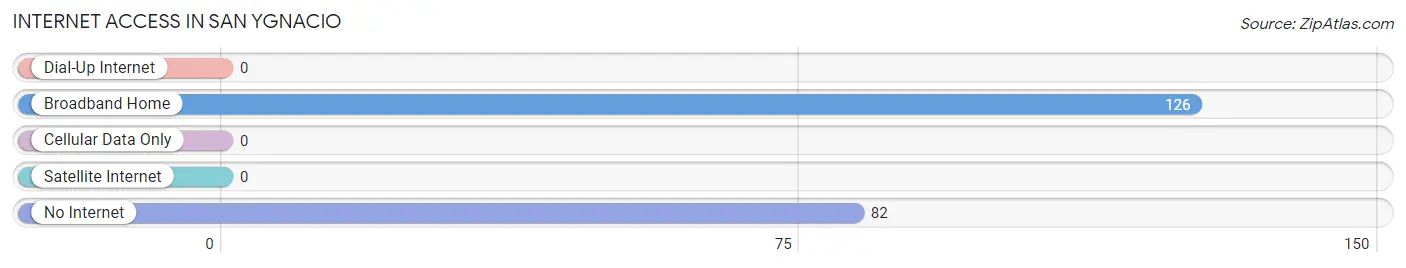
| Internet Type | # Households | % Households |
| Dial-Up Internet | 0 | 0.0% |
| Broadband Home | 126 | 60.6% |
| Cellular Data Only | 0 | 0.0% |
| Satellite Internet | 0 | 0.0% |
| No Internet | 82 | 39.4% |
| Total | 208 | 100.0% |
San Ygnacio Summary
San Ygnacio is a small town located in the state of Texas, in the United States. It is situated in the county of Zapata, and is part of the Laredo Metropolitan Statistical Area. The town has a population of 1,072 people, according to the 2010 census.
History
San Ygnacio was founded in 1834 by a group of Mexican settlers led by Don Ygnacio de la Garza Falcón. The town was named after him, and was originally part of the Mexican state of Coahuila y Tejas. During the Mexican-American War, the town was occupied by American forces in 1846. After the war, San Ygnacio became part of the United States.
In the late 19th century, San Ygnacio was a thriving agricultural community, with a population of over 1,000 people. The town was home to several large ranches, and was a major producer of cotton, corn, and other crops.
In the early 20th century, the town began to decline as the local economy shifted away from agriculture. By the 1950s, the population had dropped to just over 500 people.
Geography
San Ygnacio is located in the Rio Grande Valley, in the southern part of Texas. The town is situated on the banks of the Rio Grande, and is bordered by the Mexican state of Tamaulipas to the south.
The town has a total area of 0.9 square miles, all of which is land. The terrain is mostly flat, with some rolling hills. The climate is semi-arid, with hot summers and mild winters.
Economy
San Ygnacio’s economy is largely based on agriculture. The town is home to several large ranches, and is a major producer of cotton, corn, and other crops.
The town also has a small tourism industry, with visitors coming to explore the town’s historic sites and enjoy the natural beauty of the Rio Grande Valley.
Demographics
As of the 2010 census, San Ygnacio had a population of 1,072 people. The racial makeup of the town was 94.2% Hispanic or Latino, 4.2% White, 0.3% African American, 0.2% Native American, and 0.1% Asian.
The median household income in San Ygnacio was $20,938, and the median family income was $25,000. The per capita income was $9,845. About 28.2% of the population was below the poverty line.
San Ygnacio is served by the Zapata County Independent School District. The town is home to two schools: San Ygnacio Elementary School and San Ygnacio High School.
Common Questions
What is Per Capita Income in San Ygnacio?
Per Capita income in San Ygnacio is $24,594.
What is the Median Family Income in San Ygnacio?
Median Family Income in San Ygnacio is $137,617.
What is the Median Household income in San Ygnacio?
Median Household Income in San Ygnacio is $82,917.
What is Inequality or Gini Index in San Ygnacio?
Inequality or Gini Index in San Ygnacio is 0.36.
What is the Total Population of San Ygnacio?
Total Population of San Ygnacio is 590.
What is the Total Male Population of San Ygnacio?
Total Male Population of San Ygnacio is 268.
What is the Total Female Population of San Ygnacio?
Total Female Population of San Ygnacio is 322.
What is the Ratio of Males per 100 Females in San Ygnacio?
There are 83.23 Males per 100 Females in San Ygnacio.
What is the Ratio of Females per 100 Males in San Ygnacio?
There are 120.15 Females per 100 Males in San Ygnacio.
What is the Median Population Age in San Ygnacio?
Median Population Age in San Ygnacio is 39.9 Years.
What is the Average Family Size in San Ygnacio
Average Family Size in San Ygnacio is 3.5 People.
What is the Average Household Size in San Ygnacio
Average Household Size in San Ygnacio is 2.8 People.
How Large is the Labor Force in San Ygnacio?
There are 211 People in the Labor Forcein in San Ygnacio.
What is the Percentage of People in the Labor Force in San Ygnacio?
50.2% of People are in the Labor Force in San Ygnacio.
What is the Unemployment Rate in San Ygnacio?
Unemployment Rate in San Ygnacio is 6.6%.