Hull, TX Map & Demographics
Hull Map
Hull Overview
$20,164
PER CAPITA INCOME
$31,944
AVG HOUSEHOLD INCOME
0.43
INEQUALITY / GINI INDEX
330
TOTAL POPULATION
91
MALE POPULATION
239
FEMALE POPULATION
38.08
MALES / 100 FEMALES
262.64
FEMALES / 100 MALES
56.2
MEDIAN AGE
2.4
AVG FAMILY SIZE
1.8
AVG HOUSEHOLD SIZE
92
LABOR FORCE [ PEOPLE ]
33.3%
PERCENT IN LABOR FORCE
Hull Zip Codes
Hull Area Codes
Income in Hull
Income Overview in Hull
| Characteristic | Number | Measure |
| Per Capita Income | 330 | $20,164 |
| Median Family Income | 102 | $0 |
| Mean Family Income | 102 | $41,839 |
| Median Household Income | 186 | $31,944 |
| Mean Household Income | 186 | $34,521 |
| Income Deficit | 102 | $0 |
| Wage / Income Gap (%) | 330 | 0.00% |
| Wage / Income Gap ($) | 330 | 100.00¢ per $1 |
| Gini / Inequality Index | 330 | 0.43 |
Earnings by Sex in Hull
| Sex | Number | Average Earnings |
| Male | 0 (0.0%) | $0 |
| Female | 92 (100.0%) | $0 |
| Total | 92 (100.0%) | $0 |
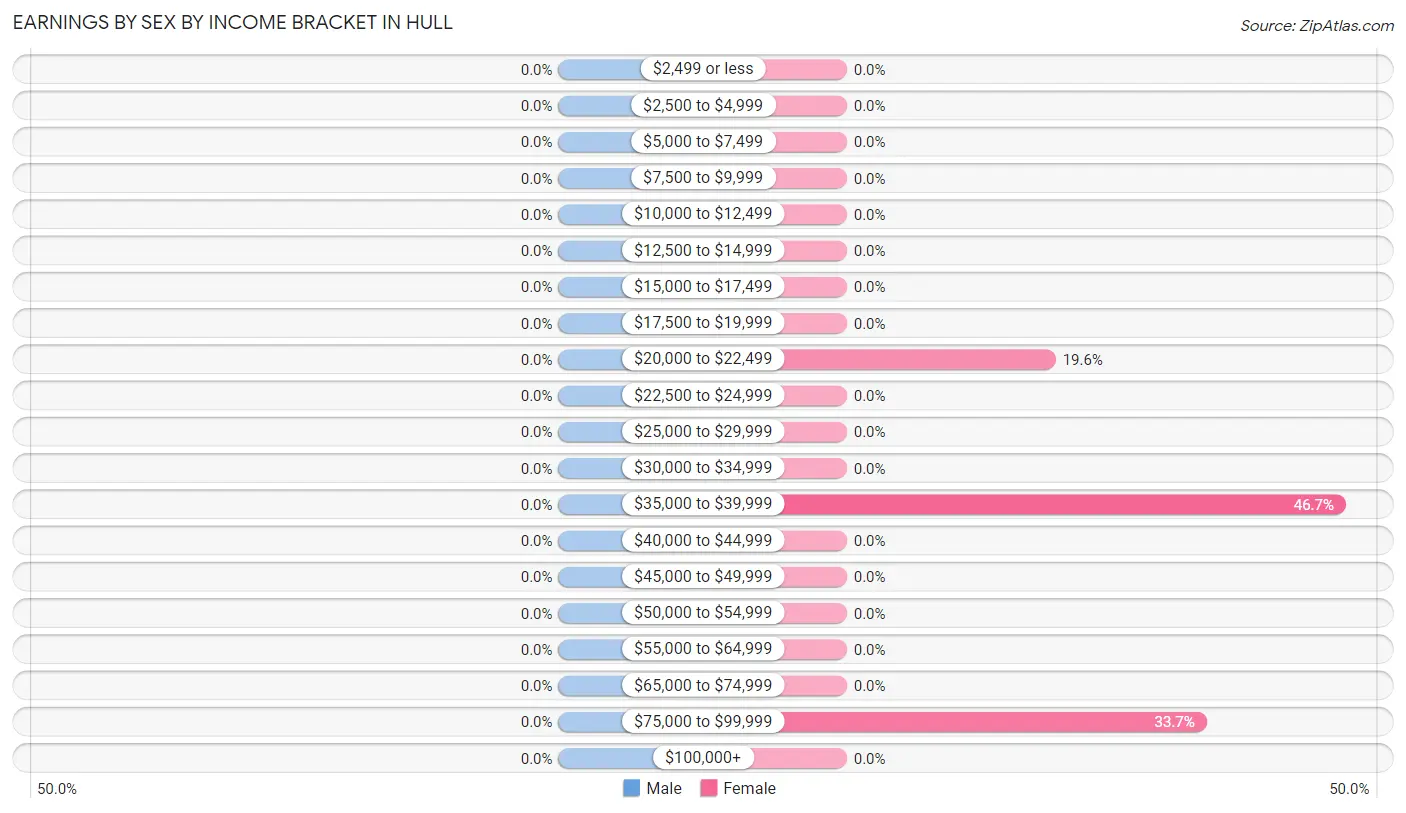
Earnings by Sex by Income Bracket in Hull
| Income | Male | Female |
| $2,499 or less | 0 (0.0%) | 0 (0.0%) |
| $2,500 to $4,999 | 0 (0.0%) | 0 (0.0%) |
| $5,000 to $7,499 | 0 (0.0%) | 0 (0.0%) |
| $7,500 to $9,999 | 0 (0.0%) | 0 (0.0%) |
| $10,000 to $12,499 | 0 (0.0%) | 0 (0.0%) |
| $12,500 to $14,999 | 0 (0.0%) | 0 (0.0%) |
| $15,000 to $17,499 | 0 (0.0%) | 0 (0.0%) |
| $17,500 to $19,999 | 0 (0.0%) | 0 (0.0%) |
| $20,000 to $22,499 | 0 (0.0%) | 18 (19.6%) |
| $22,500 to $24,999 | 0 (0.0%) | 0 (0.0%) |
| $25,000 to $29,999 | 0 (0.0%) | 0 (0.0%) |
| $30,000 to $34,999 | 0 (0.0%) | 0 (0.0%) |
| $35,000 to $39,999 | 0 (0.0%) | 43 (46.7%) |
| $40,000 to $44,999 | 0 (0.0%) | 0 (0.0%) |
| $45,000 to $49,999 | 0 (0.0%) | 0 (0.0%) |
| $50,000 to $54,999 | 0 (0.0%) | 0 (0.0%) |
| $55,000 to $64,999 | 0 (0.0%) | 0 (0.0%) |
| $65,000 to $74,999 | 0 (0.0%) | 0 (0.0%) |
| $75,000 to $99,999 | 0 (0.0%) | 31 (33.7%) |
| $100,000+ | 0 (0.0%) | 0 (0.0%) |
| Total | 0 (0.0%) | 92 (100.0%) |
Earnings by Sex by Educational Attainment in Hull
| Educational Attainment | Male Income | Female Income |
| Less than High School | - | - |
| High School Diploma | - | - |
| College or Associate's Degree | - | - |
| Bachelor's Degree | - | - |
| Graduate Degree | - | - |
| Total | - | - |
Family Income in Hull
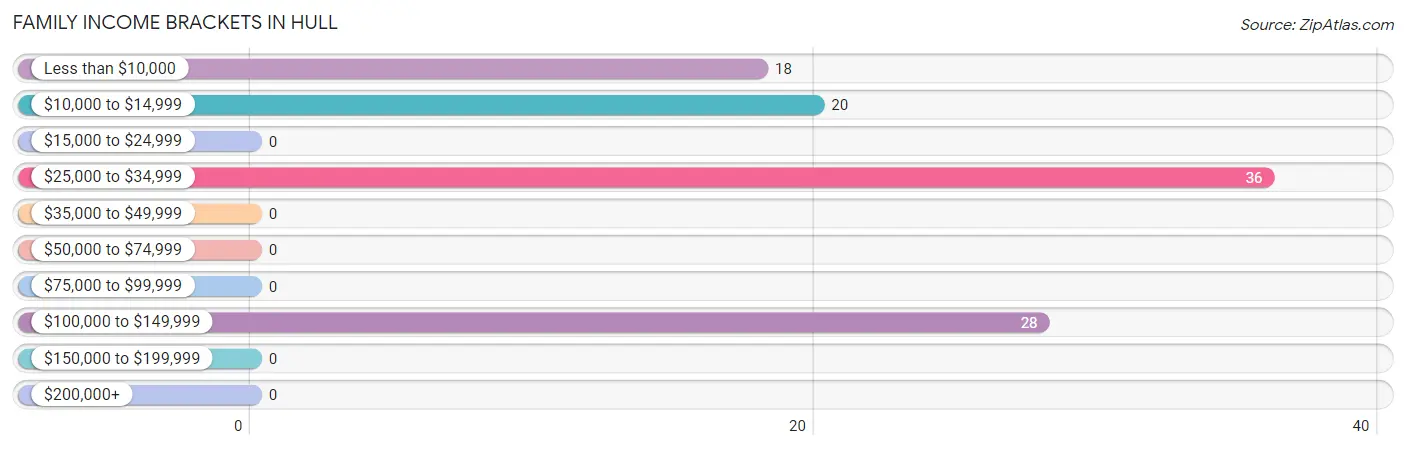
Family Income Brackets in Hull
According to the Hull family income data, there are 36 families falling into the $25,000 to $34,999 income range, which is the most common income bracket and makes up 35.3% of all families.
| Income Bracket | # Families | % Families |
| Less than $10,000 | 18 | 17.6% |
| $10,000 to $14,999 | 20 | 19.6% |
| $15,000 to $24,999 | 0 | 0.0% |
| $25,000 to $34,999 | 36 | 35.3% |
| $35,000 to $49,999 | 0 | 0.0% |
| $50,000 to $74,999 | 0 | 0.0% |
| $75,000 to $99,999 | 0 | 0.0% |
| $100,000 to $149,999 | 28 | 27.5% |
| $150,000 to $199,999 | 0 | 0.0% |
| $200,000+ | 0 | 0.0% |
Family Income by Famaliy Size in Hull
| Income Bracket | # Families | Median Income |
| 2-Person Families | 66 (64.7%) | $0 |
| 3-Person Families | 18 (17.6%) | $0 |
| 4-Person Families | 18 (17.6%) | $0 |
| 5-Person Families | 0 (0.0%) | $0 |
| 6-Person Families | 0 (0.0%) | $0 |
| 7+ Person Families | 0 (0.0%) | $0 |
| Total | 102 (100.0%) | $0 |
Family Income by Number of Earners in Hull
| Number of Earners | # Families | Median Income |
| No Earners | 56 (54.9%) | $0 |
| 1 Earner | 46 (45.1%) | $0 |
| 2 Earners | 0 (0.0%) | $0 |
| 3+ Earners | 0 (0.0%) | $0 |
| Total | 102 (100.0%) | $0 |
Household Income in Hull
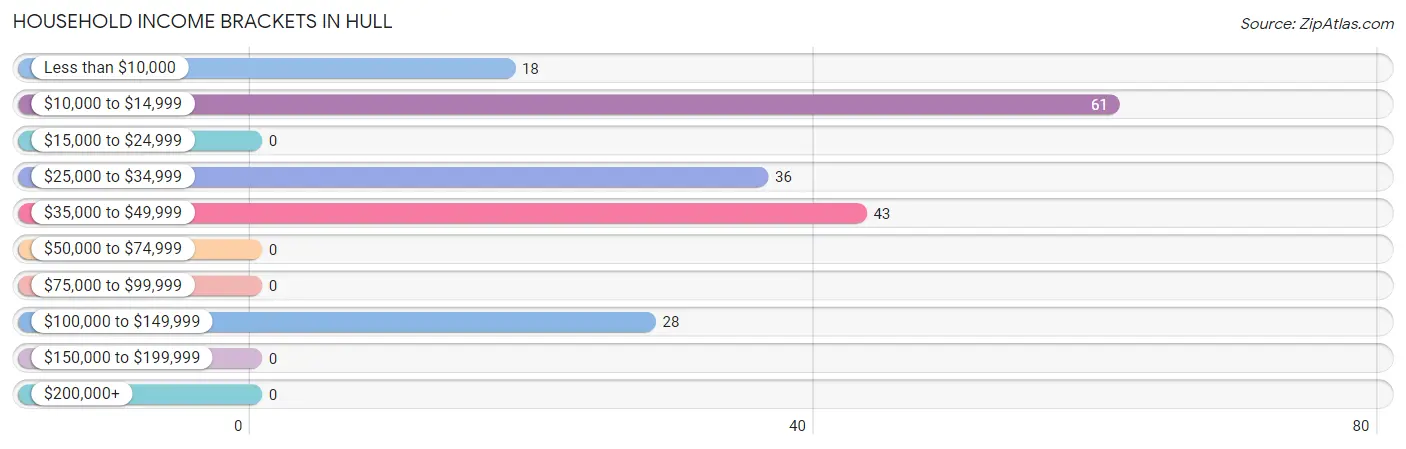
Household Income Brackets in Hull
With 61 households falling in the category, the $10,000 to $14,999 income range is the most frequent in Hull, accounting for 32.8% of all households.
| Income Bracket | # Households | % Households |
| Less than $10,000 | 18 | 9.7% |
| $10,000 to $14,999 | 61 | 32.8% |
| $15,000 to $24,999 | 0 | 0.0% |
| $25,000 to $34,999 | 36 | 19.4% |
| $35,000 to $49,999 | 43 | 23.1% |
| $50,000 to $74,999 | 0 | 0.0% |
| $75,000 to $99,999 | 0 | 0.0% |
| $100,000 to $149,999 | 28 | 15.1% |
| $150,000 to $199,999 | 0 | 0.0% |
| $200,000+ | 0 | 0.0% |
Household Income by Householder Age in Hull
| Income Bracket | # Households | Median Income |
| 15 to 24 Years | 0 (0.0%) | $0 |
| 25 to 44 Years | 18 (9.7%) | $0 |
| 45 to 64 Years | 107 (57.5%) | $0 |
| 65+ Years | 61 (32.8%) | $0 |
| Total | 186 (100.0%) | $31,944 |
Poverty in Hull
Income Below Poverty by Sex and Age in Hull
With 60.4% poverty level for males and 11.7% for females among the residents of Hull, 25 to 34 year old males and 75 year old and over females are the most vulnerable to poverty, with 20 males (100.0%) and 20 females (100.0%) in their respective age groups living below the poverty level.
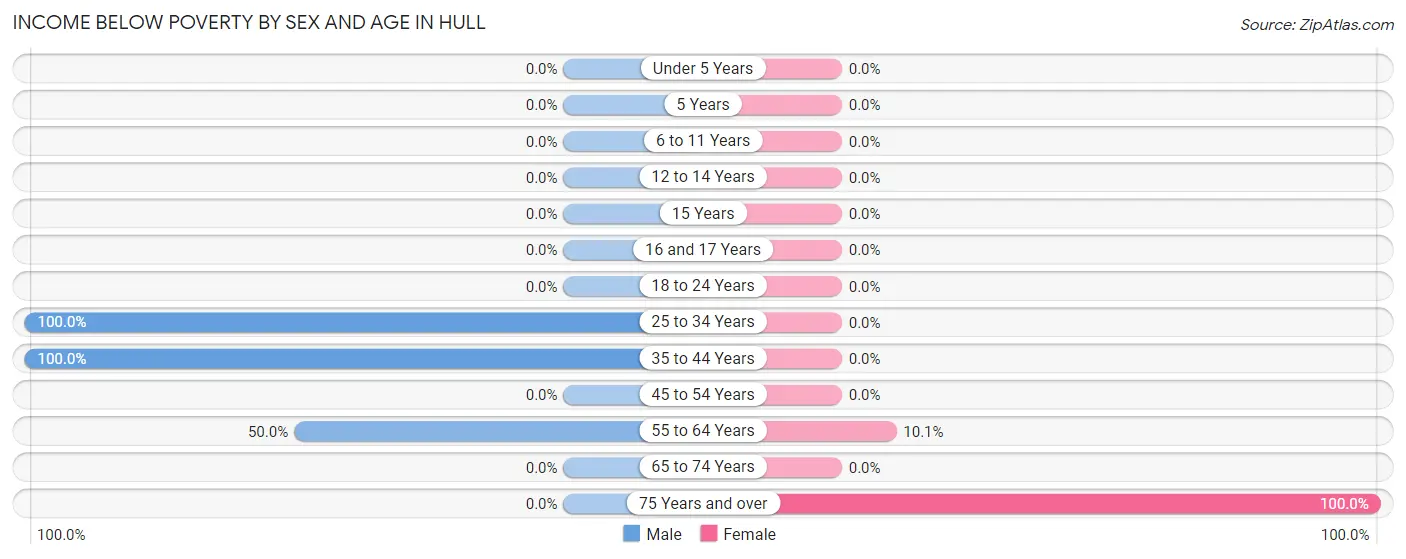
| Age Bracket | Male | Female |
| Under 5 Years | 0 (0.0%) | 0 (0.0%) |
| 5 Years | 0 (0.0%) | 0 (0.0%) |
| 6 to 11 Years | 0 (0.0%) | 0 (0.0%) |
| 12 to 14 Years | 0 (0.0%) | 0 (0.0%) |
| 15 Years | 0 (0.0%) | 0 (0.0%) |
| 16 and 17 Years | 0 (0.0%) | 0 (0.0%) |
| 18 to 24 Years | 0 (0.0%) | 0 (0.0%) |
| 25 to 34 Years | 20 (100.0%) | 0 (0.0%) |
| 35 to 44 Years | 17 (100.0%) | 0 (0.0%) |
| 45 to 54 Years | 0 (0.0%) | 0 (0.0%) |
| 55 to 64 Years | 18 (50.0%) | 8 (10.1%) |
| 65 to 74 Years | 0 (0.0%) | 0 (0.0%) |
| 75 Years and over | 0 (0.0%) | 20 (100.0%) |
| Total | 55 (60.4%) | 28 (11.7%) |
Income Above Poverty by Sex and Age in Hull
According to the poverty statistics in Hull, males aged 6 to 11 years and females aged 5 years are the age groups that are most secure financially, with 100.0% of males and 100.0% of females in these age groups living above the poverty line.
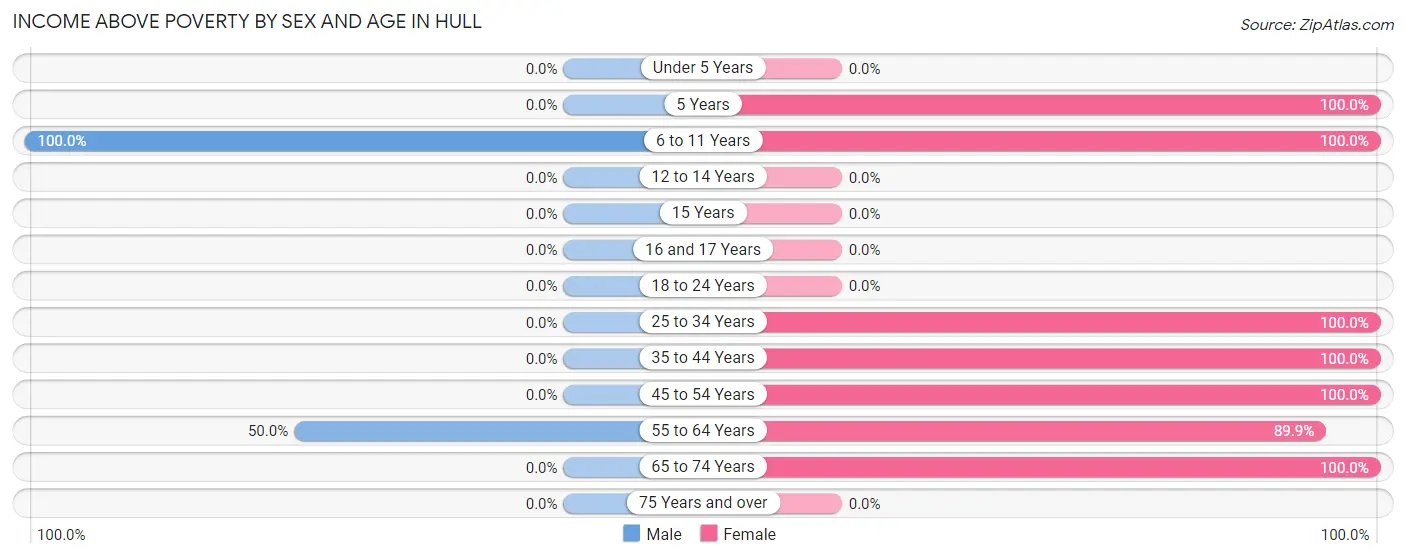
| Age Bracket | Male | Female |
| Under 5 Years | 0 (0.0%) | 0 (0.0%) |
| 5 Years | 0 (0.0%) | 18 (100.0%) |
| 6 to 11 Years | 18 (100.0%) | 18 (100.0%) |
| 12 to 14 Years | 0 (0.0%) | 0 (0.0%) |
| 15 Years | 0 (0.0%) | 0 (0.0%) |
| 16 and 17 Years | 0 (0.0%) | 0 (0.0%) |
| 18 to 24 Years | 0 (0.0%) | 0 (0.0%) |
| 25 to 34 Years | 0 (0.0%) | 18 (100.0%) |
| 35 to 44 Years | 0 (0.0%) | 14 (100.0%) |
| 45 to 54 Years | 0 (0.0%) | 31 (100.0%) |
| 55 to 64 Years | 18 (50.0%) | 71 (89.9%) |
| 65 to 74 Years | 0 (0.0%) | 41 (100.0%) |
| 75 Years and over | 0 (0.0%) | 0 (0.0%) |
| Total | 36 (39.6%) | 211 (88.3%) |
Income Below Poverty Among Married-Couple Families in Hull
The poverty statistics for married-couple families in Hull show that 28.1% or 18 of the total 64 families live below the poverty line. Families with no children have the highest poverty rate of 28.1%, comprising of 18 families. On the other hand, families with no children have the lowest poverty rate of 28.1%, which includes 18 families.
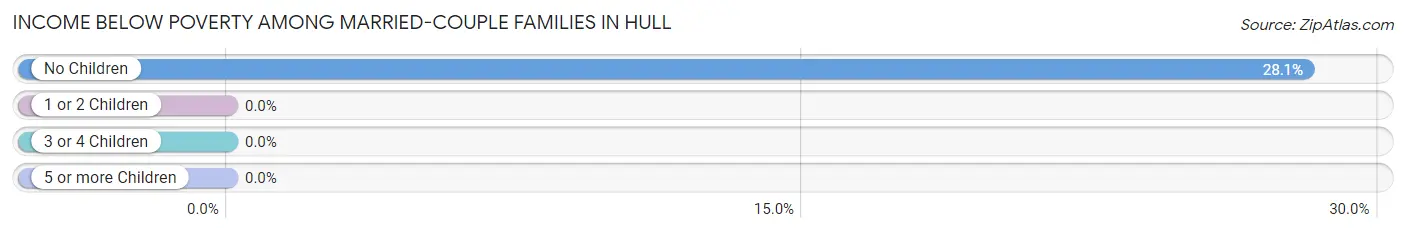
| Children | Above Poverty | Below Poverty |
| No Children | 46 (71.9%) | 18 (28.1%) |
| 1 or 2 Children | 0 (0.0%) | 0 (0.0%) |
| 3 or 4 Children | 0 (0.0%) | 0 (0.0%) |
| 5 or more Children | 0 (0.0%) | 0 (0.0%) |
| Total | 46 (71.9%) | 18 (28.1%) |
Income Below Poverty Among Single-Parent Households in Hull
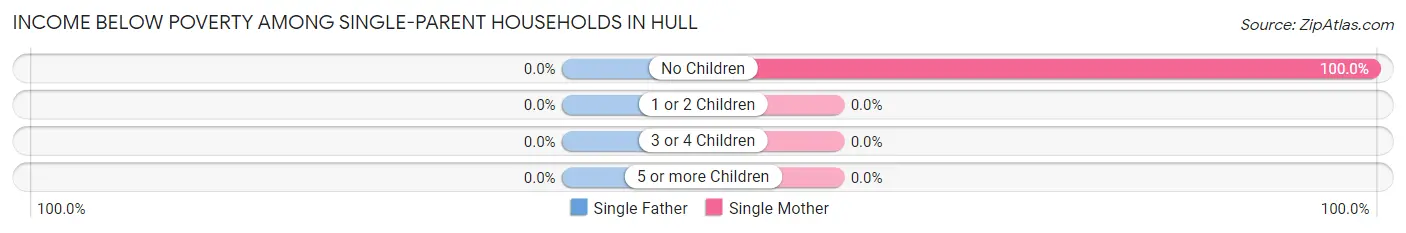
| Children | Single Father | Single Mother |
| No Children | 0 (0.0%) | 20 (100.0%) |
| 1 or 2 Children | 0 (0.0%) | 0 (0.0%) |
| 3 or 4 Children | 0 (0.0%) | 0 (0.0%) |
| 5 or more Children | 0 (0.0%) | 0 (0.0%) |
| Total | 0 (0.0%) | 20 (52.6%) |
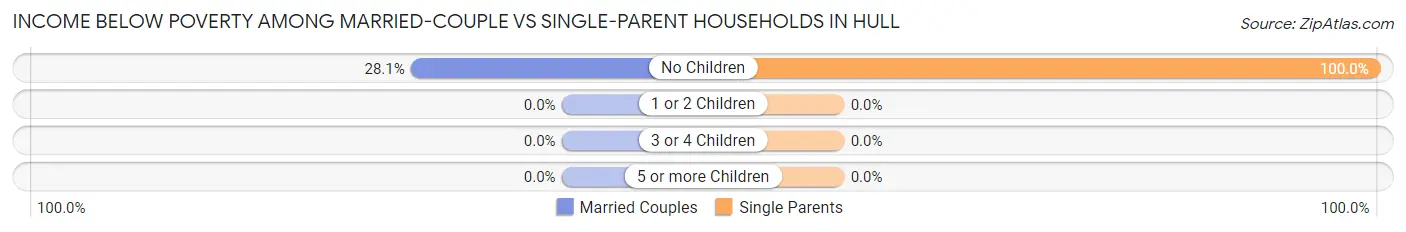
Income Below Poverty Among Married-Couple vs Single-Parent Households in Hull
The poverty data for Hull shows that 18 of the married-couple family households (28.1%) and 20 of the single-parent households (52.6%) are living below the poverty level. Within the married-couple family households, those with no children have the highest poverty rate, with 18 households (28.1%) falling below the poverty line. Among the single-parent households, those with no children have the highest poverty rate, with 20 household (100.0%) living below poverty.
| Children | Married-Couple Families | Single-Parent Households |
| No Children | 18 (28.1%) | 20 (100.0%) |
| 1 or 2 Children | 0 (0.0%) | 0 (0.0%) |
| 3 or 4 Children | 0 (0.0%) | 0 (0.0%) |
| 5 or more Children | 0 (0.0%) | 0 (0.0%) |
| Total | 18 (28.1%) | 20 (52.6%) |
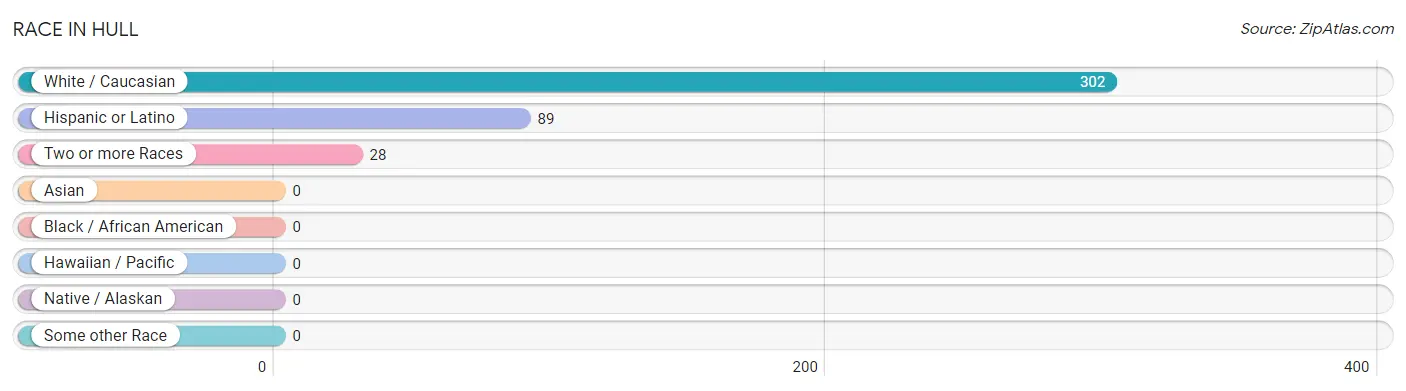
Race in Hull
The most populous races in Hull are White / Caucasian (302 | 91.5%), Hispanic or Latino (89 | 27.0%), and Two or more Races (28 | 8.5%).
| Race | # Population | % Population |
| Asian | 0 | 0.0% |
| Black / African American | 0 | 0.0% |
| Hawaiian / Pacific | 0 | 0.0% |
| Hispanic or Latino | 89 | 27.0% |
| Native / Alaskan | 0 | 0.0% |
| White / Caucasian | 302 | 91.5% |
| Two or more Races | 28 | 8.5% |
| Some other Race | 0 | 0.0% |
| Total | 330 | 100.0% |
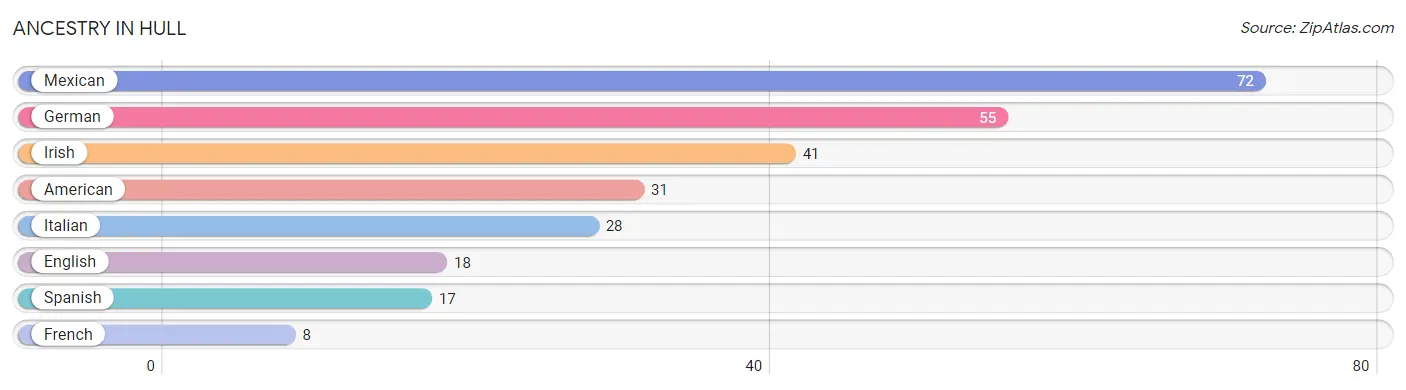
Ancestry in Hull
The most populous ancestries reported in Hull are Mexican (72 | 21.8%), German (55 | 16.7%), Irish (41 | 12.4%), American (31 | 9.4%), and Italian (28 | 8.5%), together accounting for 68.8% of all Hull residents.
| Ancestry | # Population | % Population |
| American | 31 | 9.4% |
| English | 18 | 5.4% |
| French | 8 | 2.4% |
| German | 55 | 16.7% |
| Irish | 41 | 12.4% |
| Italian | 28 | 8.5% |
| Mexican | 72 | 21.8% |
| Spanish | 17 | 5.1% | View All 8 Rows |
Immigrants in Hull

| Immigration Origin | # Population | % Population | View All 0 Rows |
Sex and Age in Hull
Sex and Age in Hull
The most populous age groups in Hull are 30 to 34 Years (20 | 22.0%) for men and 55 to 59 Years (79 | 33.1%) for women.
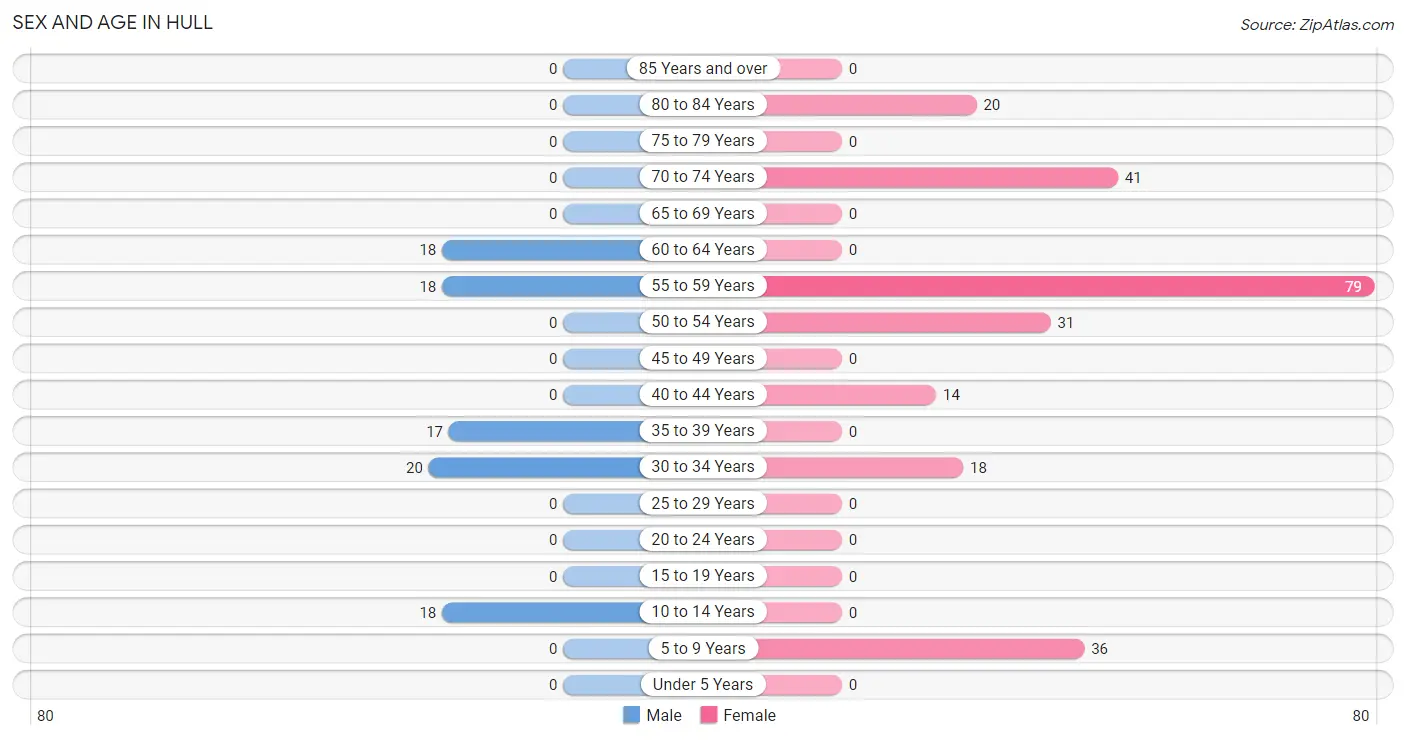
| Age Bracket | Male | Female |
| Under 5 Years | 0 (0.0%) | 0 (0.0%) |
| 5 to 9 Years | 0 (0.0%) | 36 (15.1%) |
| 10 to 14 Years | 18 (19.8%) | 0 (0.0%) |
| 15 to 19 Years | 0 (0.0%) | 0 (0.0%) |
| 20 to 24 Years | 0 (0.0%) | 0 (0.0%) |
| 25 to 29 Years | 0 (0.0%) | 0 (0.0%) |
| 30 to 34 Years | 20 (22.0%) | 18 (7.5%) |
| 35 to 39 Years | 17 (18.7%) | 0 (0.0%) |
| 40 to 44 Years | 0 (0.0%) | 14 (5.9%) |
| 45 to 49 Years | 0 (0.0%) | 0 (0.0%) |
| 50 to 54 Years | 0 (0.0%) | 31 (13.0%) |
| 55 to 59 Years | 18 (19.8%) | 79 (33.1%) |
| 60 to 64 Years | 18 (19.8%) | 0 (0.0%) |
| 65 to 69 Years | 0 (0.0%) | 0 (0.0%) |
| 70 to 74 Years | 0 (0.0%) | 41 (17.2%) |
| 75 to 79 Years | 0 (0.0%) | 0 (0.0%) |
| 80 to 84 Years | 0 (0.0%) | 20 (8.4%) |
| 85 Years and over | 0 (0.0%) | 0 (0.0%) |
| Total | 91 (100.0%) | 239 (100.0%) |
Families and Households in Hull
Median Family Size in Hull
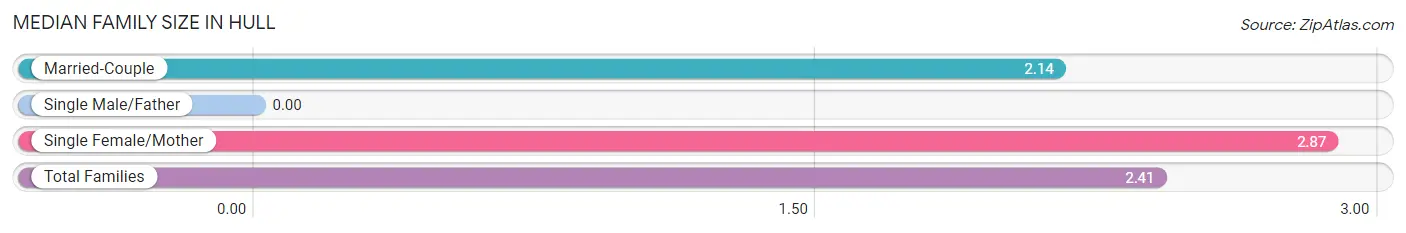
| Family Type | # Families | Family Size |
| Married-Couple | 64 (62.7%) | 2.14 |
| Single Male/Father | 0 (0.0%) | - |
| Single Female/Mother | 38 (37.2%) | 2.87 |
| Total Families | 102 (100.0%) | 2.41 |
Median Household Size in Hull
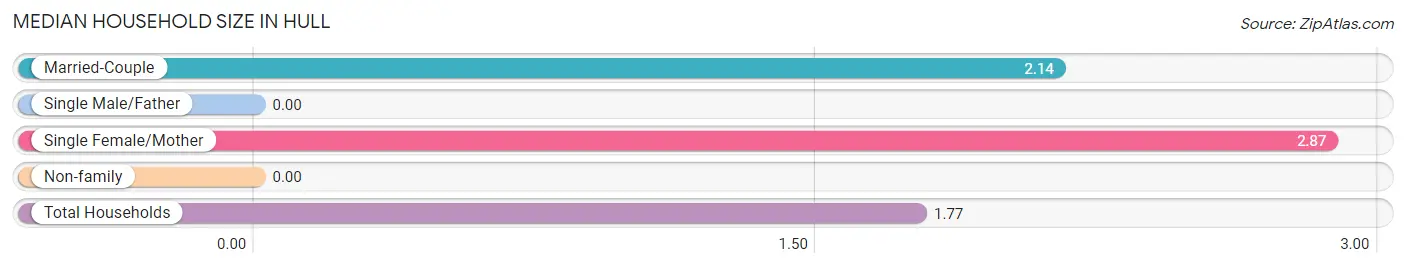
| Household Type | # Households | Household Size |
| Married-Couple | 64 (34.4%) | 2.14 |
| Single Male/Father | 0 (0.0%) | - |
| Single Female/Mother | 38 (20.4%) | 2.87 |
| Non-family | 84 (45.2%) | - |
| Total Households | 186 (100.0%) | 1.77 |
Household Size by Marriage Status in Hull
Out of a total of 186 households in Hull, 102 (54.8%) are family households, while 84 (45.2%) are nonfamily households. The most numerous type of family households are 2-person households, comprising 66, and the most common type of nonfamily households are 1-person households, comprising 84.
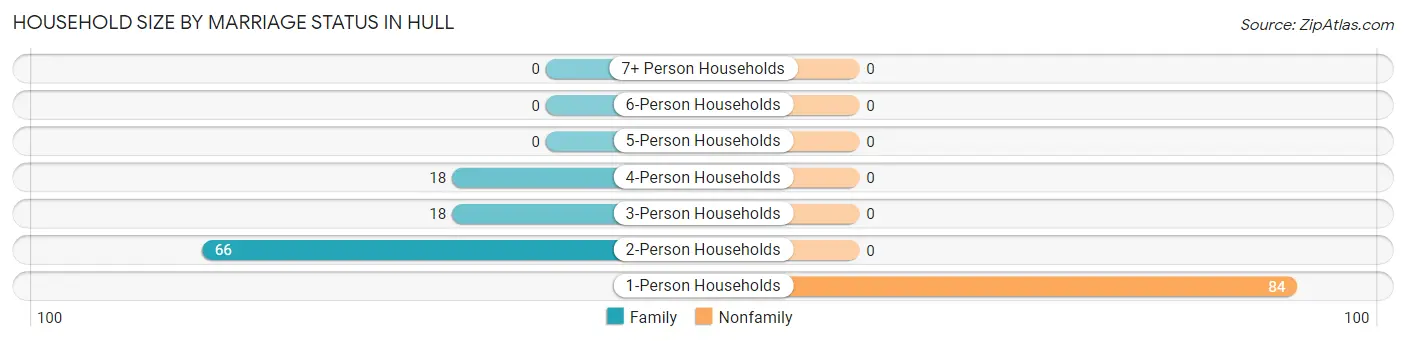
| Household Size | Family Households | Nonfamily Households |
| 1-Person Households | - | 84 (45.2%) |
| 2-Person Households | 66 (35.5%) | 0 (0.0%) |
| 3-Person Households | 18 (9.7%) | 0 (0.0%) |
| 4-Person Households | 18 (9.7%) | 0 (0.0%) |
| 5-Person Households | 0 (0.0%) | 0 (0.0%) |
| 6-Person Households | 0 (0.0%) | 0 (0.0%) |
| 7+ Person Households | 0 (0.0%) | 0 (0.0%) |
| Total | 102 (54.8%) | 84 (45.2%) |
Female Fertility in Hull
Fertility by Age in Hull
| Age Bracket | Women with Births | Births / 1,000 Women |
| 15 to 19 years | 0 (0.0%) | 0.0 |
| 20 to 34 years | 0 (0.0%) | 0.0 |
| 35 to 50 years | 0 (0.0%) | 0.0 |
| Total | 0 (0.0%) | 0.0 |
Fertility by Age by Marriage Status in Hull
| Age Bracket | Married | Unmarried |
| 15 to 19 years | 0 (0.0%) | 0 (0.0%) |
| 20 to 34 years | 0 (0.0%) | 0 (0.0%) |
| 35 to 50 years | 0 (0.0%) | 0 (0.0%) |
| Total | 0 (0.0%) | 0 (0.0%) |
Fertility by Education in Hull
| Educational Attainment | Women with Births | Births / 1,000 Women |
| Less than High School | 0 (0.0%) | 0.0 |
| High School Diploma | 0 (0.0%) | 0.0 |
| College or Associate's Degree | 0 (0.0%) | 0.0 |
| Bachelor's Degree | 0 (0.0%) | 0.0 |
| Graduate Degree | 0 (0.0%) | 0.0 |
| Total | 0 (0.0%) | 0.0 |
Fertility by Education by Marriage Status in Hull
| Educational Attainment | Married | Unmarried |
| Less than High School | 0 (0.0%) | 0 (0.0%) |
| High School Diploma | 0 (0.0%) | 0 (0.0%) |
| College or Associate's Degree | 0 (0.0%) | 0 (0.0%) |
| Bachelor's Degree | 0 (0.0%) | 0 (0.0%) |
| Graduate Degree | 0 (0.0%) | 0 (0.0%) |
| Total | 0 (0.0%) | 0 (0.0%) |
Employment Characteristics in Hull
Employment by Class of Employer in Hull
Among the 92 employed individuals in Hull, private company employees (61 | 66.3%), and state government employees (31 | 33.7%) make up the most common classes of employment.
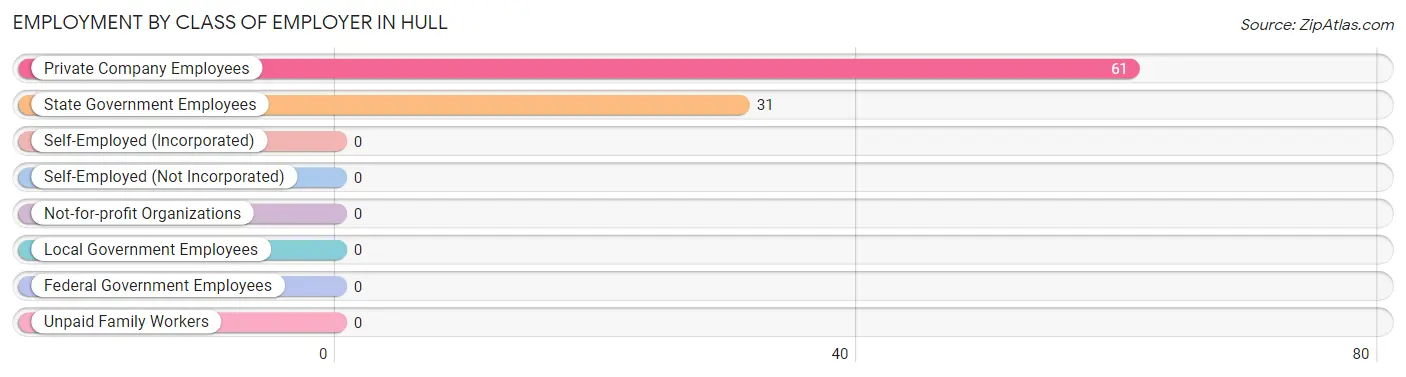
| Employer Class | # Employees | % Employees |
| Private Company Employees | 61 | 66.3% |
| Self-Employed (Incorporated) | 0 | 0.0% |
| Self-Employed (Not Incorporated) | 0 | 0.0% |
| Not-for-profit Organizations | 0 | 0.0% |
| Local Government Employees | 0 | 0.0% |
| State Government Employees | 31 | 33.7% |
| Federal Government Employees | 0 | 0.0% |
| Unpaid Family Workers | 0 | 0.0% |
| Total | 92 | 100.0% |
Employment Status by Age in Hull
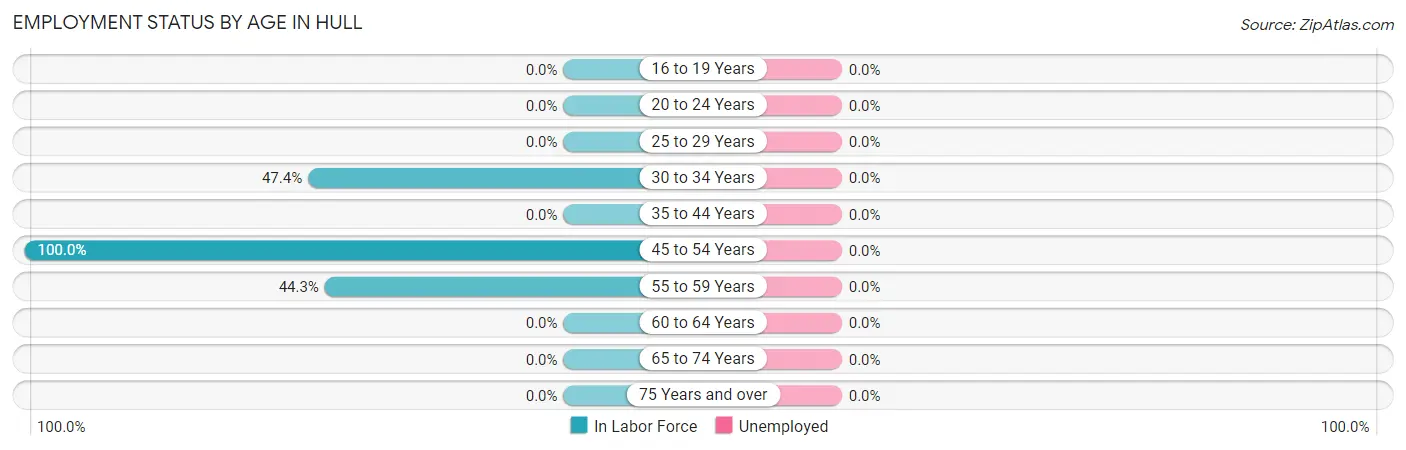
| Age Bracket | In Labor Force | Unemployed |
| 16 to 19 Years | 0 (0.0%) | 0 (0.0%) |
| 20 to 24 Years | 0 (0.0%) | 0 (0.0%) |
| 25 to 29 Years | 0 (0.0%) | 0 (0.0%) |
| 30 to 34 Years | 18 (47.4%) | 0 (0.0%) |
| 35 to 44 Years | 0 (0.0%) | 0 (0.0%) |
| 45 to 54 Years | 31 (100.0%) | 0 (0.0%) |
| 55 to 59 Years | 43 (44.3%) | 0 (0.0%) |
| 60 to 64 Years | 0 (0.0%) | 0 (0.0%) |
| 65 to 74 Years | 0 (0.0%) | 0 (0.0%) |
| 75 Years and over | 0 (0.0%) | 0 (0.0%) |
| Total | 92 (33.3%) | 0 (0.0%) |
Employment Status by Educational Attainment in Hull
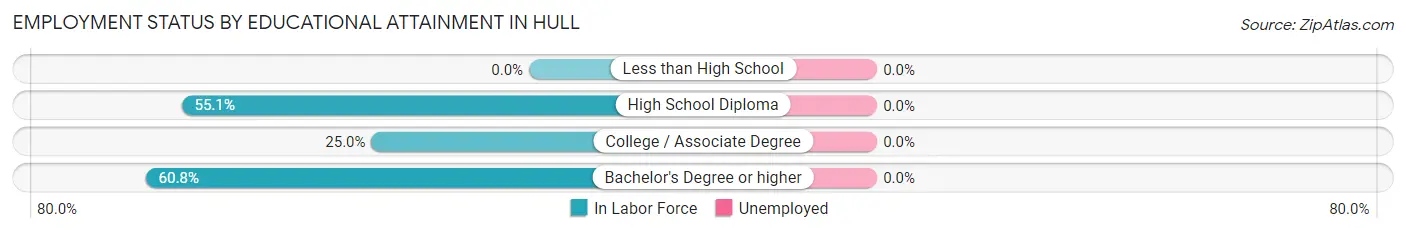
| Educational Attainment | In Labor Force | Unemployed |
| Less than High School | 0 (0.0%) | 0 (0.0%) |
| High School Diploma | 43 (55.1%) | 0 (0.0%) |
| College / Associate Degree | 18 (25.0%) | 0 (0.0%) |
| Bachelor's Degree or higher | 31 (60.8%) | 0 (0.0%) |
| Total | 92 (42.8%) | 0 (0.0%) |
Employment Occupations by Sex in Hull
Management, Business, Science and Arts Occupations
The most common Management, Business, Science and Arts occupations in Hull are Health Diagnosing & Treating (31 | 33.7%), and Health Technologists (31 | 33.7%).
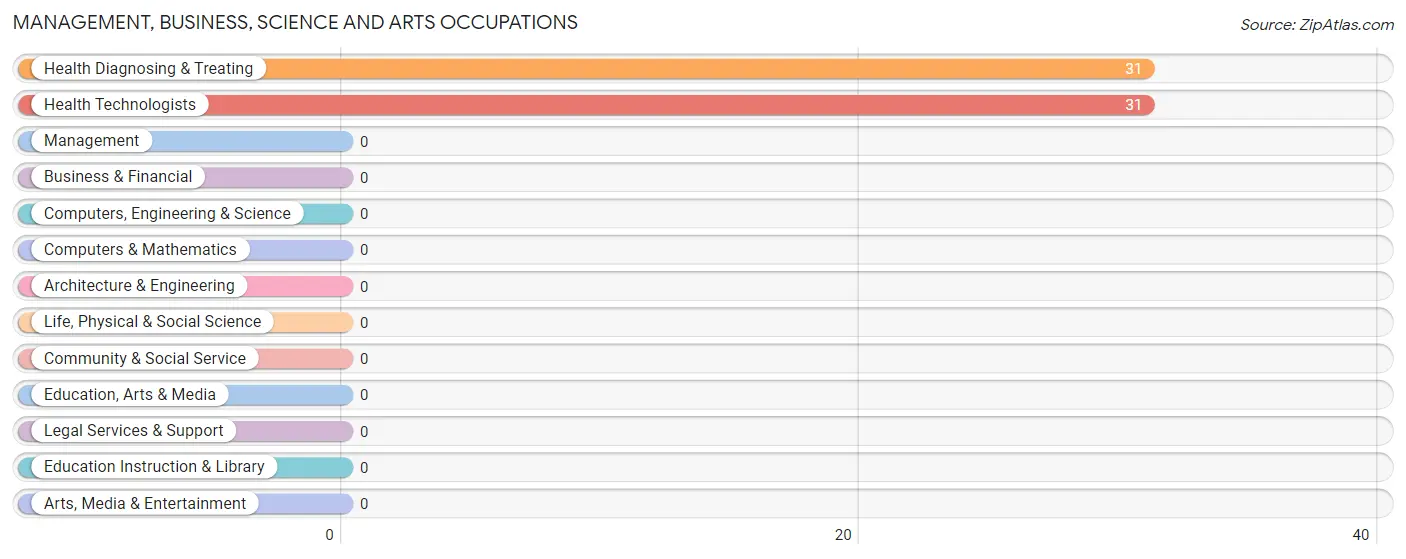
Management, Business, Science and Arts Occupations by Sex
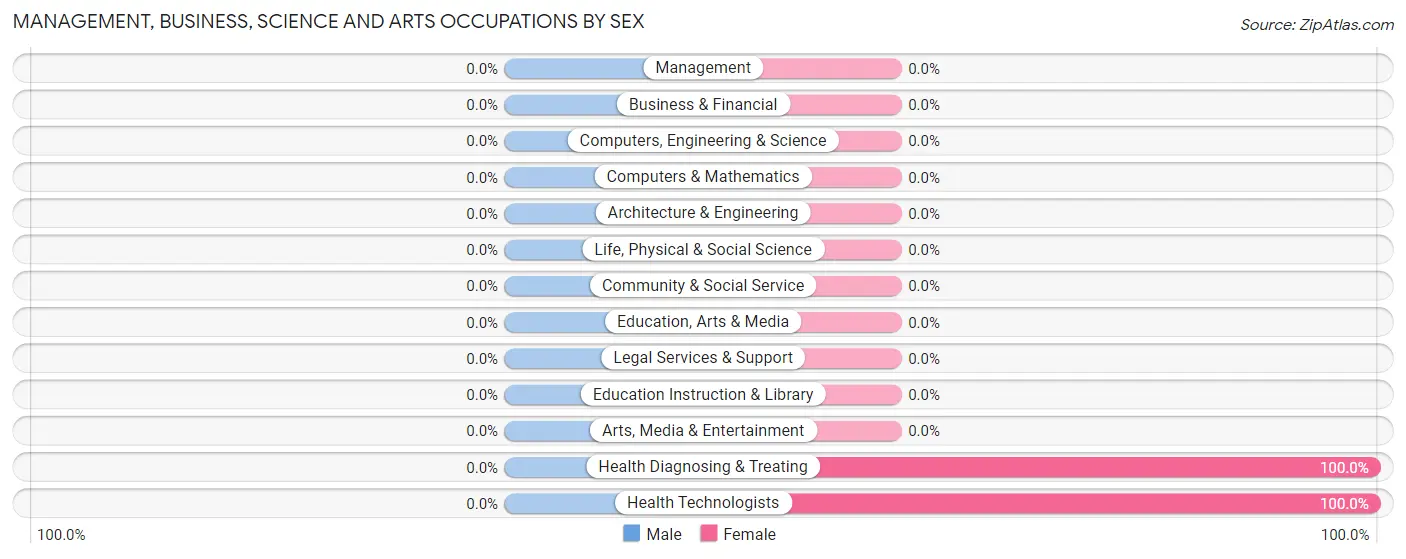
| Occupation | Male | Female |
| Management | 0 (0.0%) | 0 (0.0%) |
| Business & Financial | 0 (0.0%) | 0 (0.0%) |
| Computers, Engineering & Science | 0 (0.0%) | 0 (0.0%) |
| Computers & Mathematics | 0 (0.0%) | 0 (0.0%) |
| Architecture & Engineering | 0 (0.0%) | 0 (0.0%) |
| Life, Physical & Social Science | 0 (0.0%) | 0 (0.0%) |
| Community & Social Service | 0 (0.0%) | 0 (0.0%) |
| Education, Arts & Media | 0 (0.0%) | 0 (0.0%) |
| Legal Services & Support | 0 (0.0%) | 0 (0.0%) |
| Education Instruction & Library | 0 (0.0%) | 0 (0.0%) |
| Arts, Media & Entertainment | 0 (0.0%) | 0 (0.0%) |
| Health Diagnosing & Treating | 0 (0.0%) | 31 (100.0%) |
| Health Technologists | 0 (0.0%) | 31 (100.0%) |
| Total (Category) | 0 (0.0%) | 31 (100.0%) |
| Total (Overall) | 0 (0.0%) | 92 (100.0%) |
Services Occupations
Services Occupations by Sex
| Occupation | Male | Female |
| Healthcare Support | 0 (0.0%) | 0 (0.0%) |
| Security & Protection | 0 (0.0%) | 0 (0.0%) |
| Firefighting & Prevention | 0 (0.0%) | 0 (0.0%) |
| Law Enforcement | 0 (0.0%) | 0 (0.0%) |
| Food Preparation & Serving | 0 (0.0%) | 0 (0.0%) |
| Cleaning & Maintenance | 0 (0.0%) | 0 (0.0%) |
| Personal Care & Service | 0 (0.0%) | 0 (0.0%) |
| Total (Category) | 0 (0.0%) | 0 (0.0%) |
| Total (Overall) | 0 (0.0%) | 92 (100.0%) |
Sales and Office Occupations
The most common Sales and Office occupations in Hull are , and Sales & Related (18 | 19.6%).
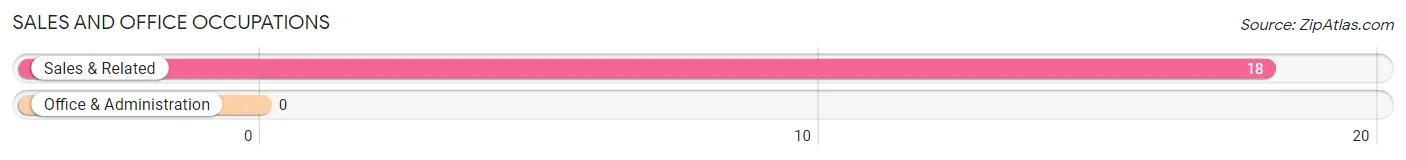
Sales and Office Occupations by Sex
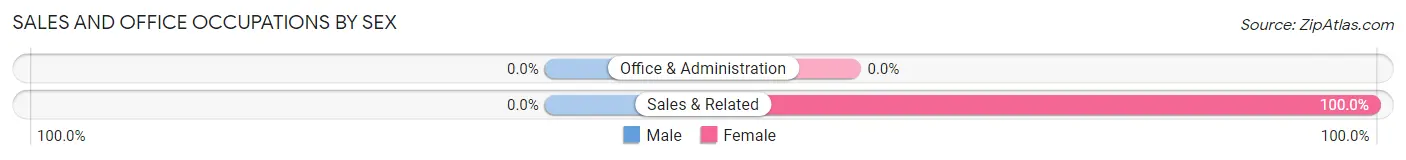
| Occupation | Male | Female |
| Sales & Related | 0 (0.0%) | 18 (100.0%) |
| Office & Administration | 0 (0.0%) | 0 (0.0%) |
| Total (Category) | 0 (0.0%) | 18 (100.0%) |
| Total (Overall) | 0 (0.0%) | 92 (100.0%) |
Natural Resources, Construction and Maintenance Occupations
Natural Resources, Construction and Maintenance Occupations by Sex
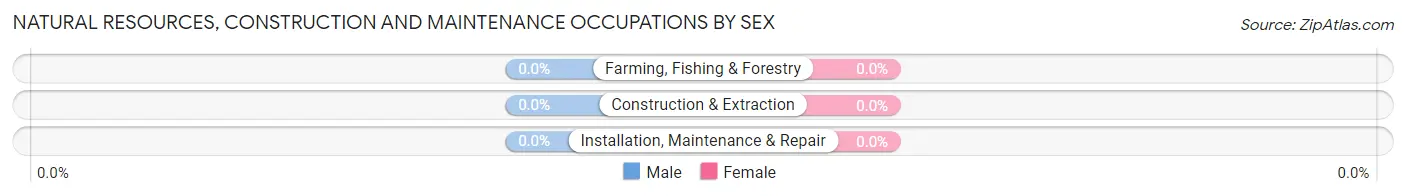
| Occupation | Male | Female |
| Farming, Fishing & Forestry | 0 (0.0%) | 0 (0.0%) |
| Construction & Extraction | 0 (0.0%) | 0 (0.0%) |
| Installation, Maintenance & Repair | 0 (0.0%) | 0 (0.0%) |
| Total (Category) | 0 (0.0%) | 0 (0.0%) |
| Total (Overall) | 0 (0.0%) | 92 (100.0%) |
Production, Transportation and Moving Occupations
The most common Production, Transportation and Moving occupations in Hull are , and Material Moving (43 | 46.7%).
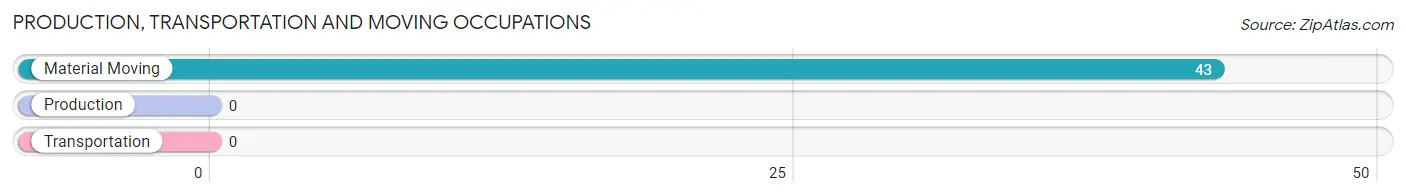
Production, Transportation and Moving Occupations by Sex
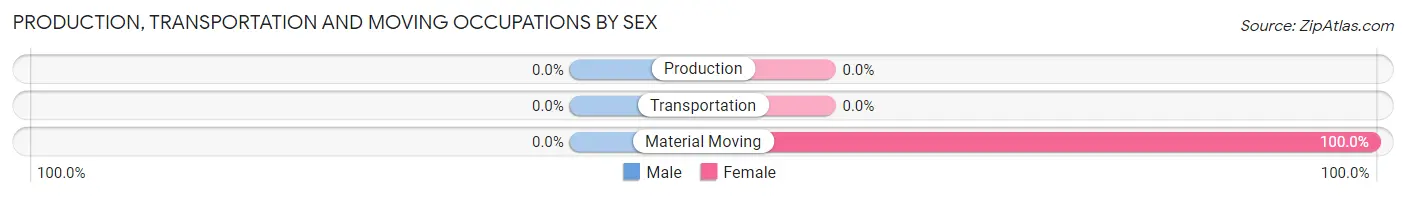
| Occupation | Male | Female |
| Production | 0 (0.0%) | 0 (0.0%) |
| Transportation | 0 (0.0%) | 0 (0.0%) |
| Material Moving | 0 (0.0%) | 43 (100.0%) |
| Total (Category) | 0 (0.0%) | 43 (100.0%) |
| Total (Overall) | 0 (0.0%) | 92 (100.0%) |
Employment Industries by Sex in Hull
Employment Industries in Hull
The major employment industries in Hull include Retail Trade (61 | 66.3%), and Public Administration (31 | 33.7%).
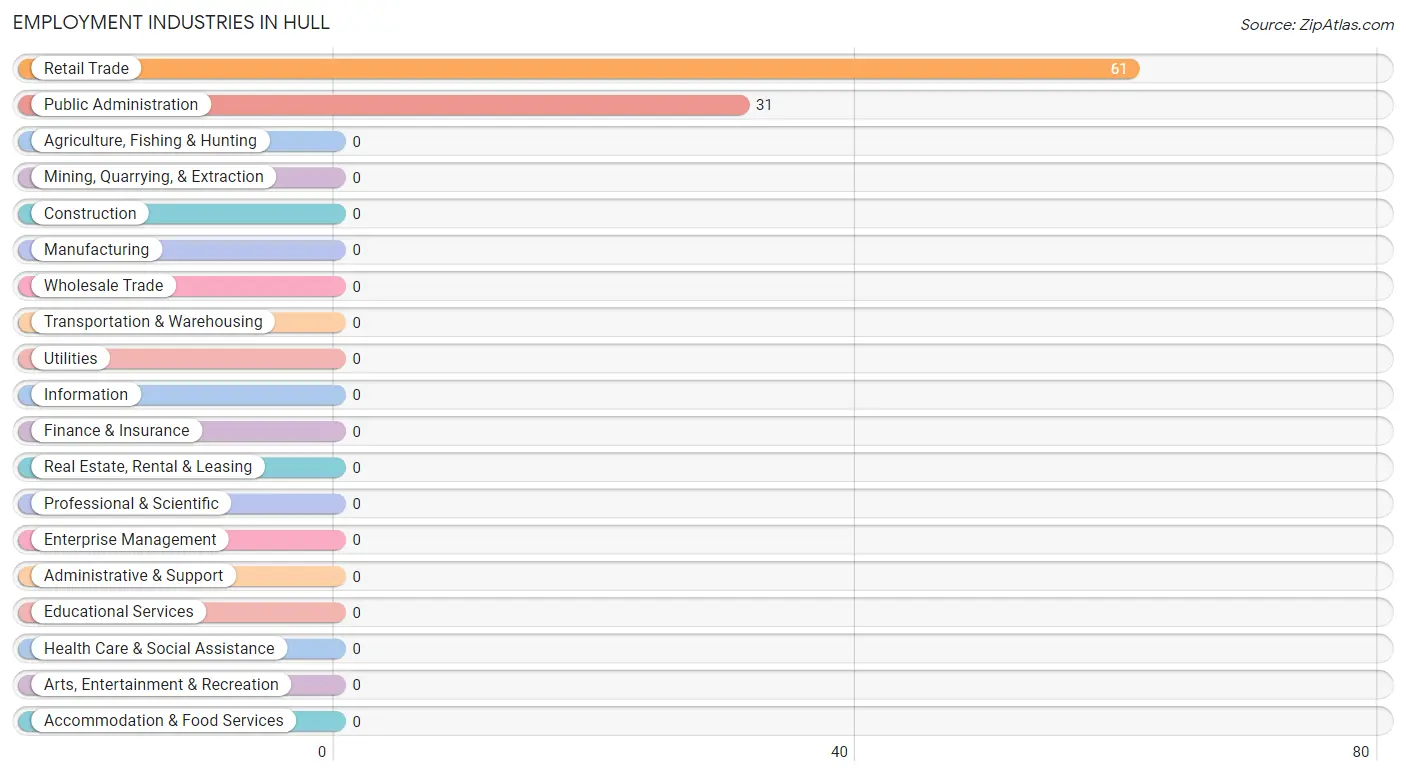
Employment Industries by Sex in Hull
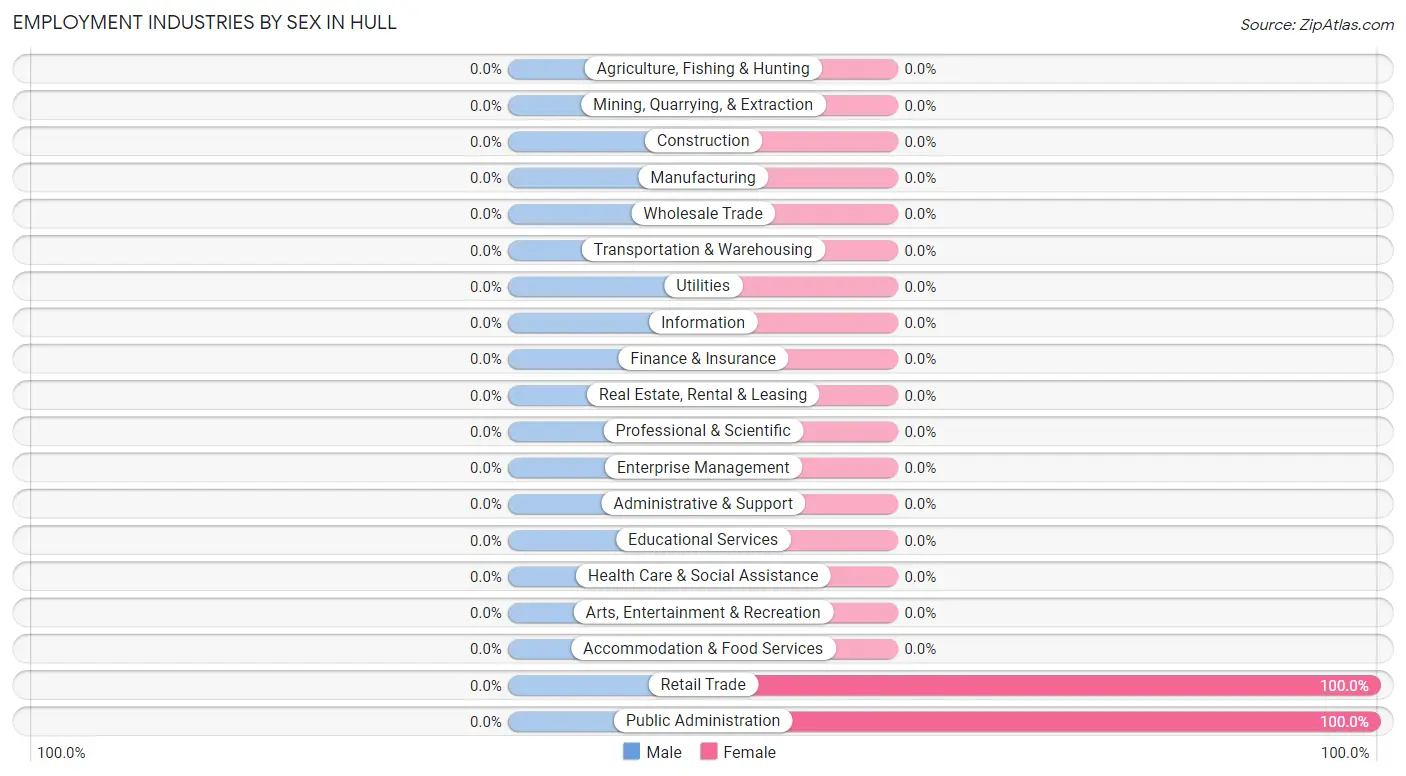
| Industry | Male | Female |
| Agriculture, Fishing & Hunting | 0 (0.0%) | 0 (0.0%) |
| Mining, Quarrying, & Extraction | 0 (0.0%) | 0 (0.0%) |
| Construction | 0 (0.0%) | 0 (0.0%) |
| Manufacturing | 0 (0.0%) | 0 (0.0%) |
| Wholesale Trade | 0 (0.0%) | 0 (0.0%) |
| Retail Trade | 0 (0.0%) | 61 (100.0%) |
| Transportation & Warehousing | 0 (0.0%) | 0 (0.0%) |
| Utilities | 0 (0.0%) | 0 (0.0%) |
| Information | 0 (0.0%) | 0 (0.0%) |
| Finance & Insurance | 0 (0.0%) | 0 (0.0%) |
| Real Estate, Rental & Leasing | 0 (0.0%) | 0 (0.0%) |
| Professional & Scientific | 0 (0.0%) | 0 (0.0%) |
| Enterprise Management | 0 (0.0%) | 0 (0.0%) |
| Administrative & Support | 0 (0.0%) | 0 (0.0%) |
| Educational Services | 0 (0.0%) | 0 (0.0%) |
| Health Care & Social Assistance | 0 (0.0%) | 0 (0.0%) |
| Arts, Entertainment & Recreation | 0 (0.0%) | 0 (0.0%) |
| Accommodation & Food Services | 0 (0.0%) | 0 (0.0%) |
| Public Administration | 0 (0.0%) | 31 (100.0%) |
| Total | 0 (0.0%) | 92 (100.0%) |
Education in Hull
School Enrollment in Hull
The most common levels of schooling among the 54 students in Hull are kindergarten (18 | 33.3%), elementary school (18 | 33.3%), and middle school (18 | 33.3%).
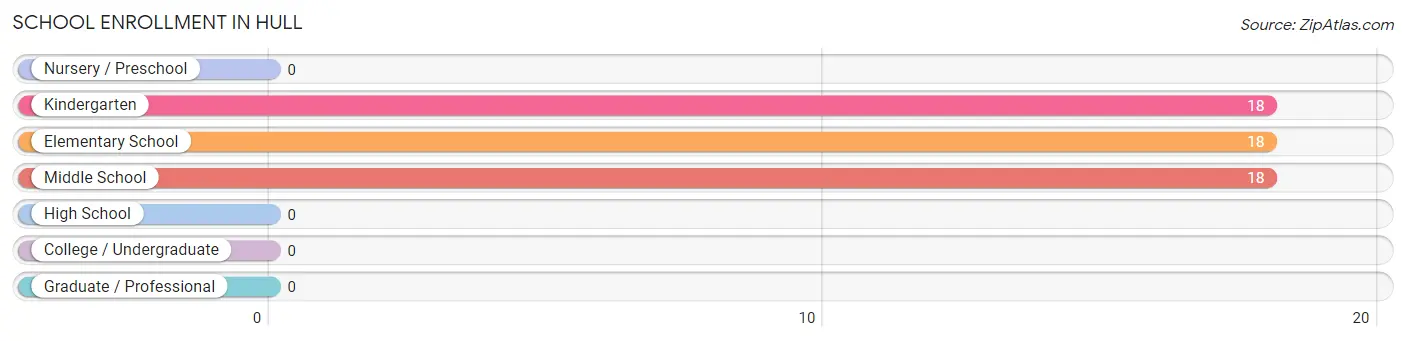
| School Level | # Students | % Students |
| Nursery / Preschool | 0 | 0.0% |
| Kindergarten | 18 | 33.3% |
| Elementary School | 18 | 33.3% |
| Middle School | 18 | 33.3% |
| High School | 0 | 0.0% |
| College / Undergraduate | 0 | 0.0% |
| Graduate / Professional | 0 | 0.0% |
| Total | 54 | 100.0% |
School Enrollment by Age by Funding Source in Hull
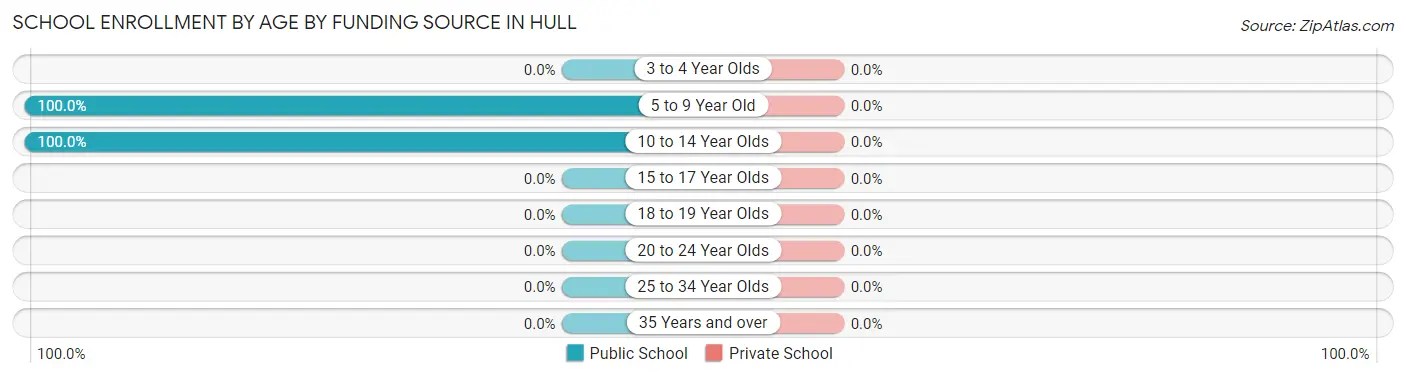
| Age Bracket | Public School | Private School |
| 3 to 4 Year Olds | 0 (0.0%) | 0 (0.0%) |
| 5 to 9 Year Old | 36 (100.0%) | 0 (0.0%) |
| 10 to 14 Year Olds | 18 (100.0%) | 0 (0.0%) |
| 15 to 17 Year Olds | 0 (0.0%) | 0 (0.0%) |
| 18 to 19 Year Olds | 0 (0.0%) | 0 (0.0%) |
| 20 to 24 Year Olds | 0 (0.0%) | 0 (0.0%) |
| 25 to 34 Year Olds | 0 (0.0%) | 0 (0.0%) |
| 35 Years and over | 0 (0.0%) | 0 (0.0%) |
| Total | 54 (100.0%) | 0 (0.0%) |
Educational Attainment by Field of Study in Hull
Science & technology (31 | 43.7%), engineering (20 | 28.2%), and literature & languages (20 | 28.2%) are the most common fields of study among 71 individuals in Hull who have obtained a bachelor's degree or higher.
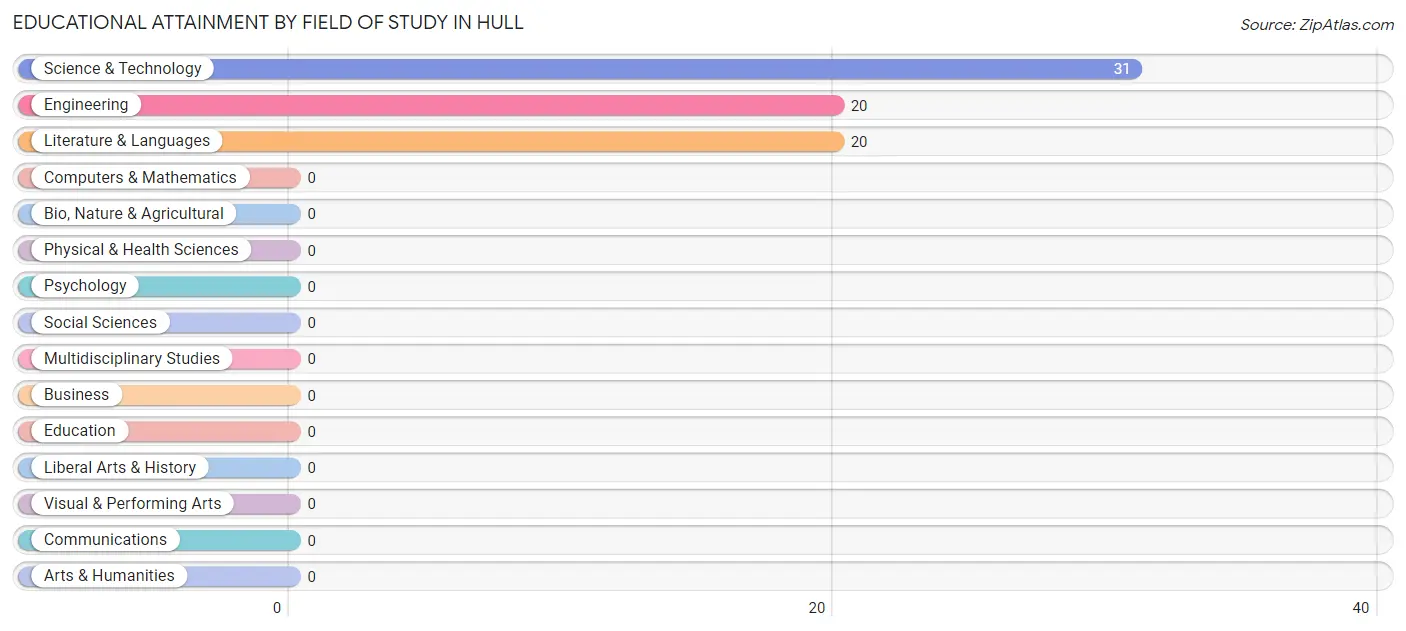
| Field of Study | # Graduates | % Graduates |
| Computers & Mathematics | 0 | 0.0% |
| Bio, Nature & Agricultural | 0 | 0.0% |
| Physical & Health Sciences | 0 | 0.0% |
| Psychology | 0 | 0.0% |
| Social Sciences | 0 | 0.0% |
| Engineering | 20 | 28.2% |
| Multidisciplinary Studies | 0 | 0.0% |
| Science & Technology | 31 | 43.7% |
| Business | 0 | 0.0% |
| Education | 0 | 0.0% |
| Literature & Languages | 20 | 28.2% |
| Liberal Arts & History | 0 | 0.0% |
| Visual & Performing Arts | 0 | 0.0% |
| Communications | 0 | 0.0% |
| Arts & Humanities | 0 | 0.0% |
| Total | 71 | 100.0% |
Transportation & Commute in Hull
Vehicle Availability by Sex in Hull
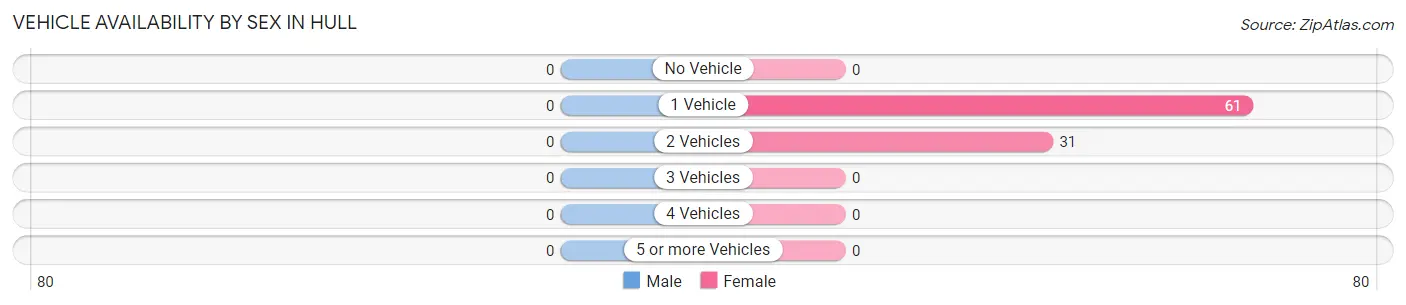
| Vehicles Available | Male | Female |
| No Vehicle | 0 (0.0%) | 0 (0.0%) |
| 1 Vehicle | 0 (0.0%) | 61 (66.3%) |
| 2 Vehicles | 0 (0.0%) | 31 (33.7%) |
| 3 Vehicles | 0 (0.0%) | 0 (0.0%) |
| 4 Vehicles | 0 (0.0%) | 0 (0.0%) |
| 5 or more Vehicles | 0 (0.0%) | 0 (0.0%) |
| Total | 0 (0.0%) | 92 (100.0%) |
Commute Time in Hull
The most frequently occuring commute durations in Hull are 60 to 89 minutes (74 commuters, 80.4%), 10 to 14 minutes (18 commuters, 19.6%), and less than 5 minutes (0 commuters, 0.0%).
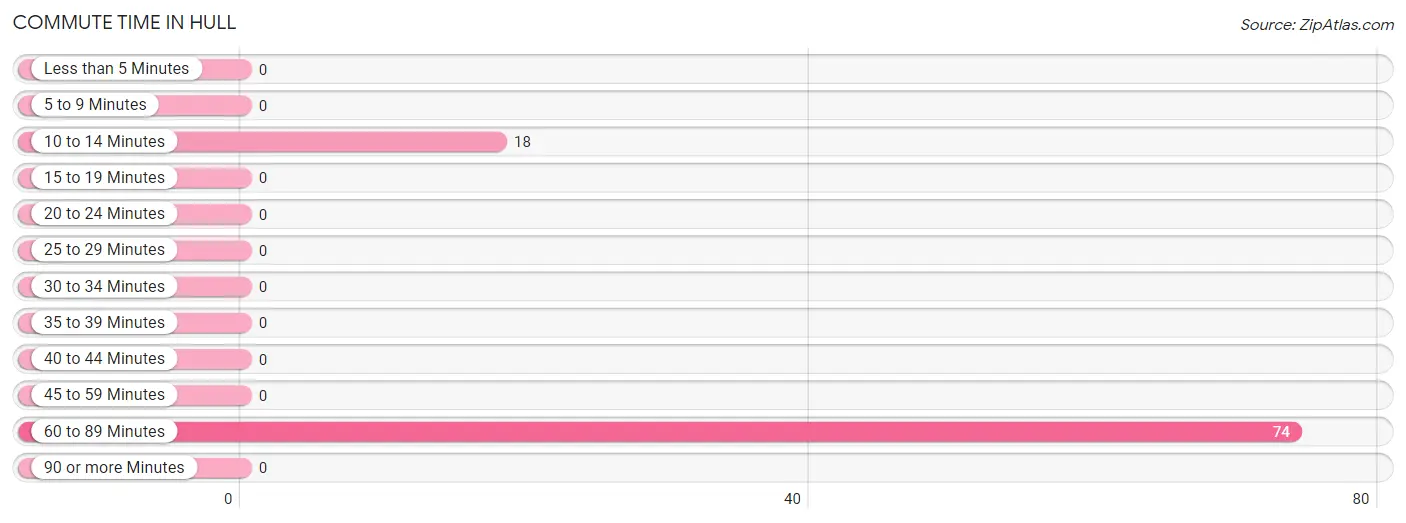
| Commute Time | # Commuters | % Commuters |
| Less than 5 Minutes | 0 | 0.0% |
| 5 to 9 Minutes | 0 | 0.0% |
| 10 to 14 Minutes | 18 | 19.6% |
| 15 to 19 Minutes | 0 | 0.0% |
| 20 to 24 Minutes | 0 | 0.0% |
| 25 to 29 Minutes | 0 | 0.0% |
| 30 to 34 Minutes | 0 | 0.0% |
| 35 to 39 Minutes | 0 | 0.0% |
| 40 to 44 Minutes | 0 | 0.0% |
| 45 to 59 Minutes | 0 | 0.0% |
| 60 to 89 Minutes | 74 | 80.4% |
| 90 or more Minutes | 0 | 0.0% |
Commute Time by Sex in Hull
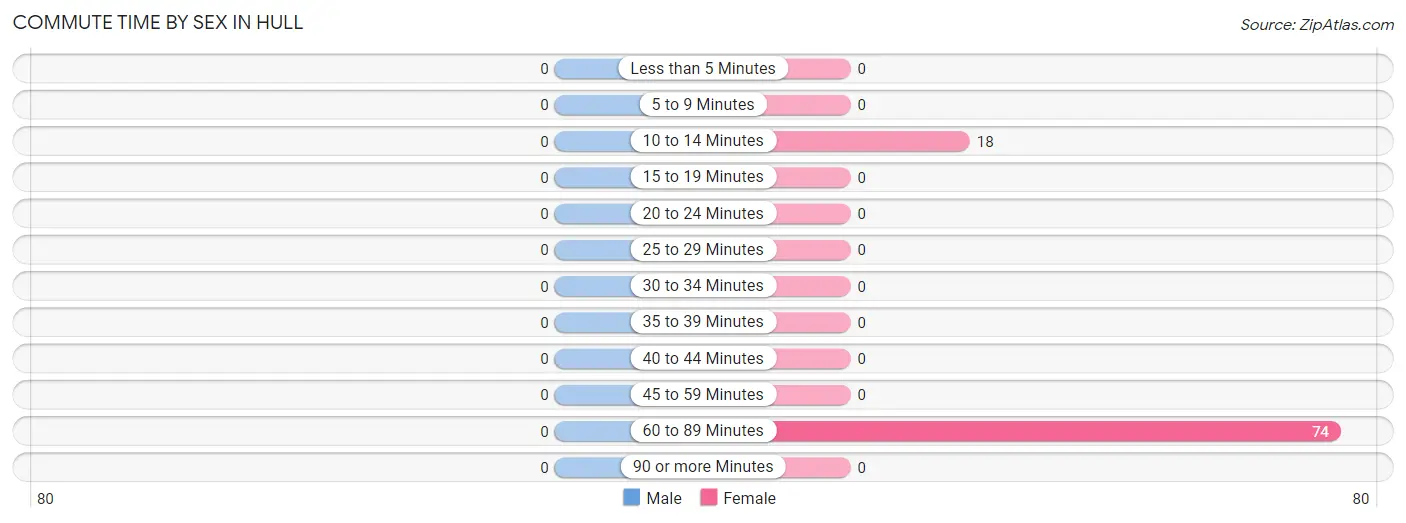
| Commute Time | Male | Female |
| Less than 5 Minutes | 0 (0.0%) | 0 (0.0%) |
| 5 to 9 Minutes | 0 (0.0%) | 0 (0.0%) |
| 10 to 14 Minutes | 0 (0.0%) | 18 (19.6%) |
| 15 to 19 Minutes | 0 (0.0%) | 0 (0.0%) |
| 20 to 24 Minutes | 0 (0.0%) | 0 (0.0%) |
| 25 to 29 Minutes | 0 (0.0%) | 0 (0.0%) |
| 30 to 34 Minutes | 0 (0.0%) | 0 (0.0%) |
| 35 to 39 Minutes | 0 (0.0%) | 0 (0.0%) |
| 40 to 44 Minutes | 0 (0.0%) | 0 (0.0%) |
| 45 to 59 Minutes | 0 (0.0%) | 0 (0.0%) |
| 60 to 89 Minutes | 0 (0.0%) | 74 (80.4%) |
| 90 or more Minutes | 0 (0.0%) | 0 (0.0%) |
Time of Departure to Work by Sex in Hull
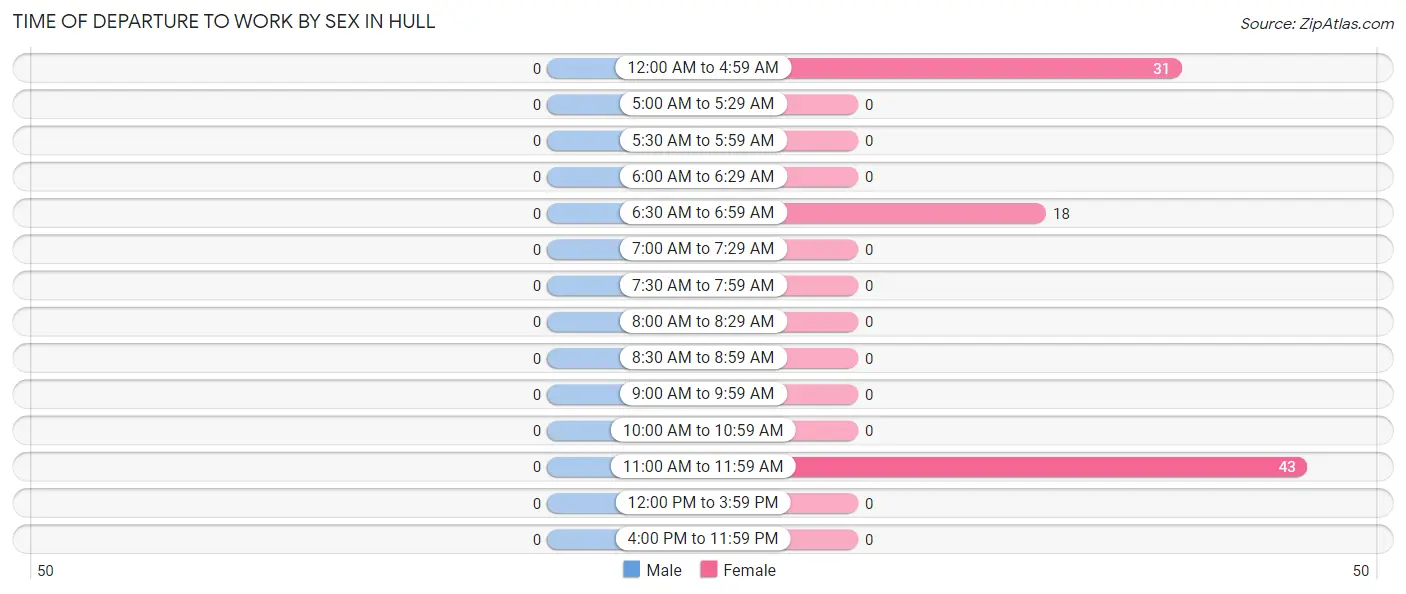
| Time of Departure | Male | Female |
| 12:00 AM to 4:59 AM | 0 (0.0%) | 31 (33.7%) |
| 5:00 AM to 5:29 AM | 0 (0.0%) | 0 (0.0%) |
| 5:30 AM to 5:59 AM | 0 (0.0%) | 0 (0.0%) |
| 6:00 AM to 6:29 AM | 0 (0.0%) | 0 (0.0%) |
| 6:30 AM to 6:59 AM | 0 (0.0%) | 18 (19.6%) |
| 7:00 AM to 7:29 AM | 0 (0.0%) | 0 (0.0%) |
| 7:30 AM to 7:59 AM | 0 (0.0%) | 0 (0.0%) |
| 8:00 AM to 8:29 AM | 0 (0.0%) | 0 (0.0%) |
| 8:30 AM to 8:59 AM | 0 (0.0%) | 0 (0.0%) |
| 9:00 AM to 9:59 AM | 0 (0.0%) | 0 (0.0%) |
| 10:00 AM to 10:59 AM | 0 (0.0%) | 0 (0.0%) |
| 11:00 AM to 11:59 AM | 0 (0.0%) | 43 (46.7%) |
| 12:00 PM to 3:59 PM | 0 (0.0%) | 0 (0.0%) |
| 4:00 PM to 11:59 PM | 0 (0.0%) | 0 (0.0%) |
| Total | 0 (0.0%) | 92 (100.0%) |
Housing Occupancy in Hull
Occupancy by Ownership in Hull
Of the total 186 dwellings in Hull, owner-occupied units account for 150 (80.6%), while renter-occupied units make up 36 (19.4%).
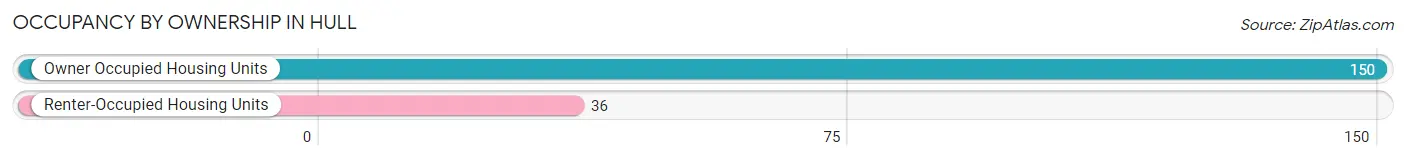
| Occupancy | # Housing Units | % Housing Units |
| Owner Occupied Housing Units | 150 | 80.6% |
| Renter-Occupied Housing Units | 36 | 19.4% |
| Total Occupied Housing Units | 186 | 100.0% |
Occupancy by Household Size in Hull
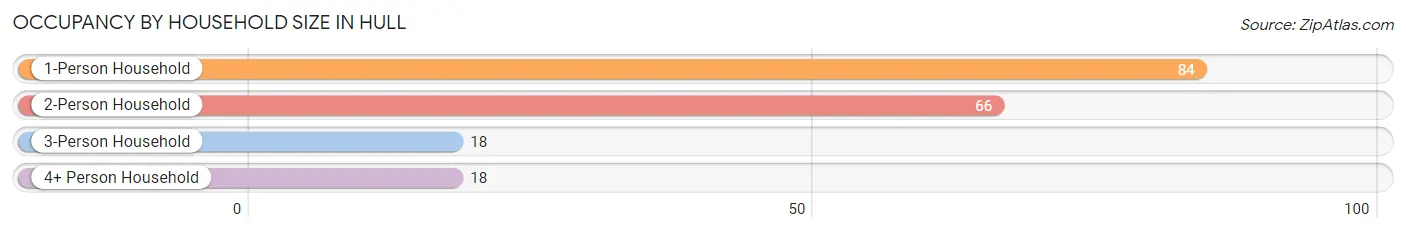
| Household Size | # Housing Units | % Housing Units |
| 1-Person Household | 84 | 45.2% |
| 2-Person Household | 66 | 35.5% |
| 3-Person Household | 18 | 9.7% |
| 4+ Person Household | 18 | 9.7% |
| Total Housing Units | 186 | 100.0% |
Occupancy by Ownership by Household Size in Hull
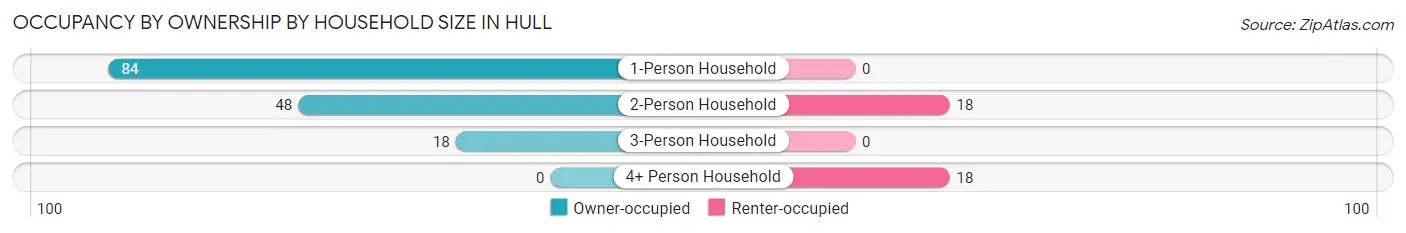
| Household Size | Owner-occupied | Renter-occupied |
| 1-Person Household | 84 (100.0%) | 0 (0.0%) |
| 2-Person Household | 48 (72.7%) | 18 (27.3%) |
| 3-Person Household | 18 (100.0%) | 0 (0.0%) |
| 4+ Person Household | 0 (0.0%) | 18 (100.0%) |
| Total Housing Units | 150 (80.6%) | 36 (19.4%) |
Occupancy by Educational Attainment in Hull
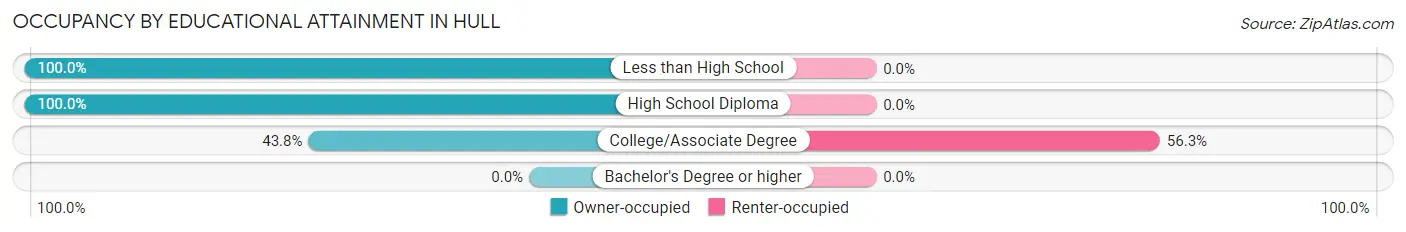
| Household Size | Owner-occupied | Renter-occupied |
| Less than High School | 33 (100.0%) | 0 (0.0%) |
| High School Diploma | 89 (100.0%) | 0 (0.0%) |
| College/Associate Degree | 28 (43.8%) | 36 (56.2%) |
| Bachelor's Degree or higher | 0 (0.0%) | 0 (0.0%) |
Occupancy by Age of Householder in Hull
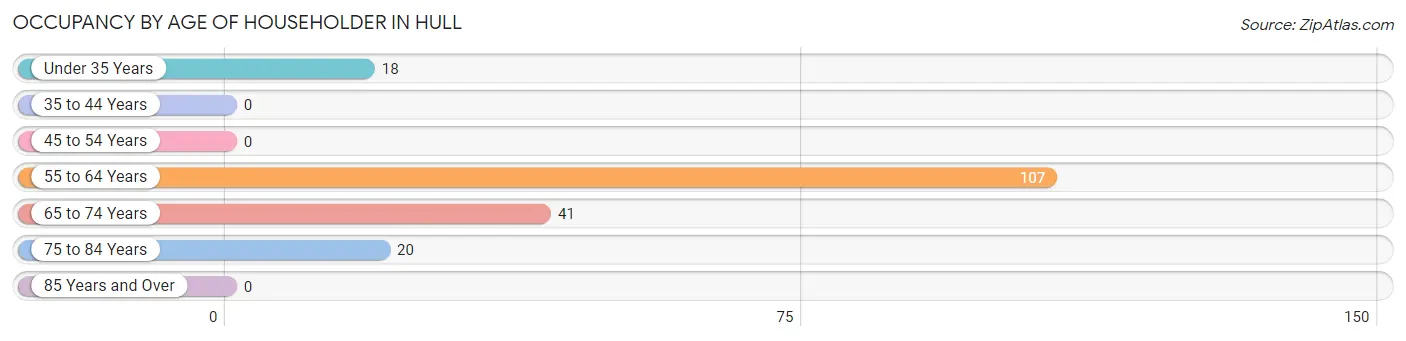
| Age Bracket | # Households | % Households |
| Under 35 Years | 18 | 9.7% |
| 35 to 44 Years | 0 | 0.0% |
| 45 to 54 Years | 0 | 0.0% |
| 55 to 64 Years | 107 | 57.5% |
| 65 to 74 Years | 41 | 22.0% |
| 75 to 84 Years | 20 | 10.7% |
| 85 Years and Over | 0 | 0.0% |
| Total | 186 | 100.0% |
Housing Finances in Hull
Median Income by Occupancy in Hull
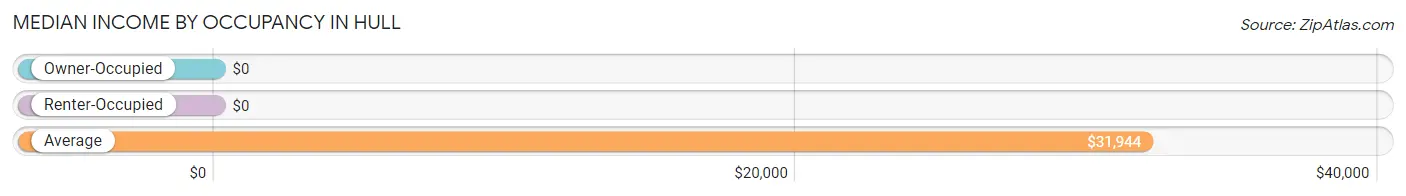
| Occupancy Type | # Households | Median Income |
| Owner-Occupied | 150 (80.6%) | $0 |
| Renter-Occupied | 36 (19.4%) | $0 |
| Average | 186 (100.0%) | $31,944 |
Occupancy by Householder Income Bracket in Hull
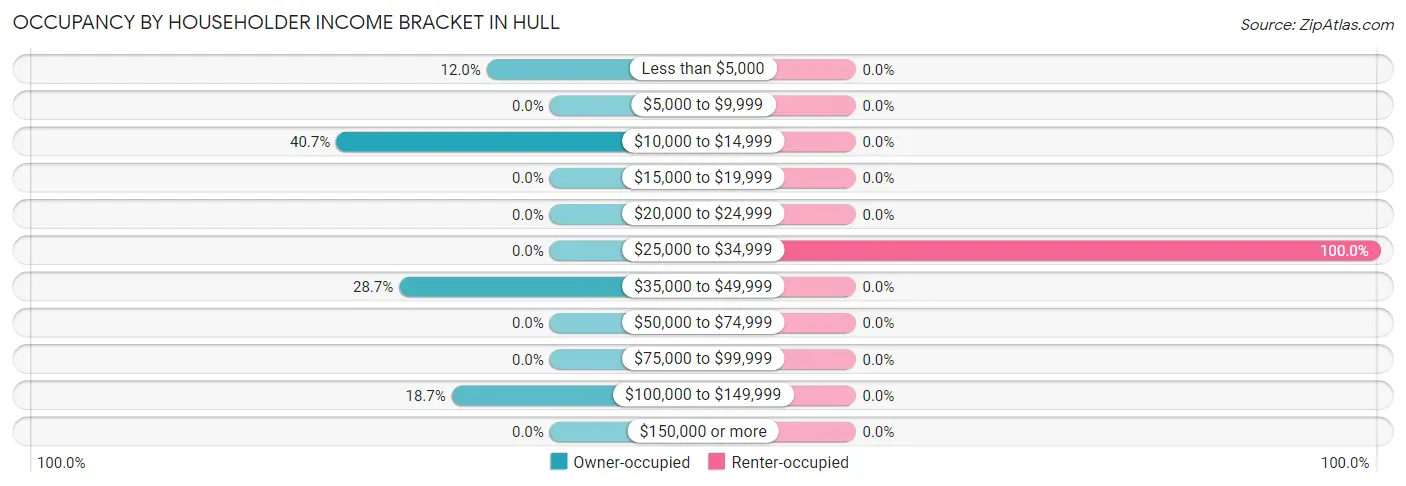
| Income Bracket | Owner-occupied | Renter-occupied |
| Less than $5,000 | 18 (12.0%) | 0 (0.0%) |
| $5,000 to $9,999 | 0 (0.0%) | 0 (0.0%) |
| $10,000 to $14,999 | 61 (40.7%) | 0 (0.0%) |
| $15,000 to $19,999 | 0 (0.0%) | 0 (0.0%) |
| $20,000 to $24,999 | 0 (0.0%) | 0 (0.0%) |
| $25,000 to $34,999 | 0 (0.0%) | 36 (100.0%) |
| $35,000 to $49,999 | 43 (28.7%) | 0 (0.0%) |
| $50,000 to $74,999 | 0 (0.0%) | 0 (0.0%) |
| $75,000 to $99,999 | 0 (0.0%) | 0 (0.0%) |
| $100,000 to $149,999 | 28 (18.7%) | 0 (0.0%) |
| $150,000 or more | 0 (0.0%) | 0 (0.0%) |
| Total | 150 (100.0%) | 36 (100.0%) |
Monthly Housing Cost Tiers in Hull
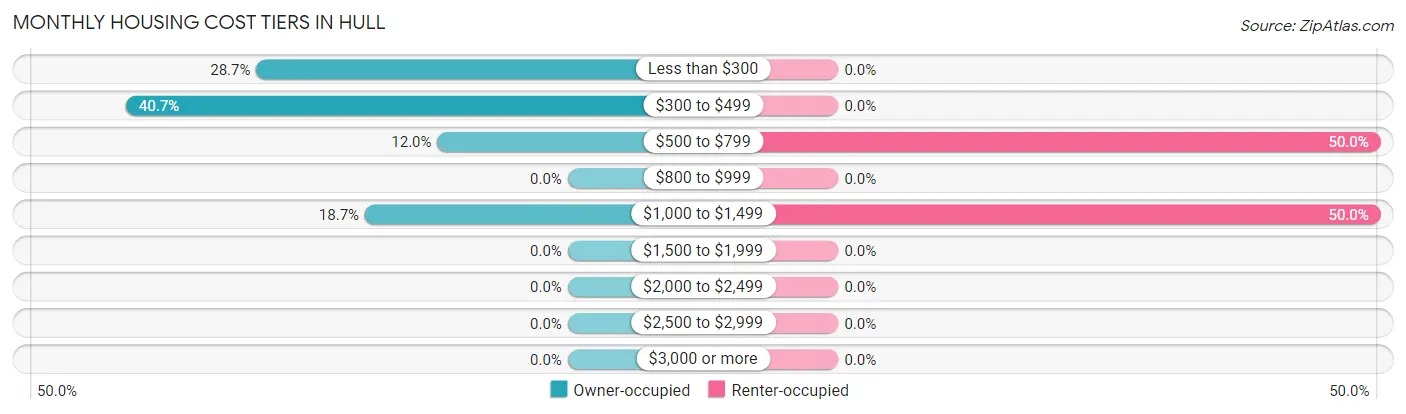
| Monthly Cost | Owner-occupied | Renter-occupied |
| Less than $300 | 43 (28.7%) | 0 (0.0%) |
| $300 to $499 | 61 (40.7%) | 0 (0.0%) |
| $500 to $799 | 18 (12.0%) | 18 (50.0%) |
| $800 to $999 | 0 (0.0%) | 0 (0.0%) |
| $1,000 to $1,499 | 28 (18.7%) | 18 (50.0%) |
| $1,500 to $1,999 | 0 (0.0%) | 0 (0.0%) |
| $2,000 to $2,499 | 0 (0.0%) | 0 (0.0%) |
| $2,500 to $2,999 | 0 (0.0%) | 0 (0.0%) |
| $3,000 or more | 0 (0.0%) | 0 (0.0%) |
| Total | 150 (100.0%) | 36 (100.0%) |
Physical Housing Characteristics in Hull
Housing Structures in Hull
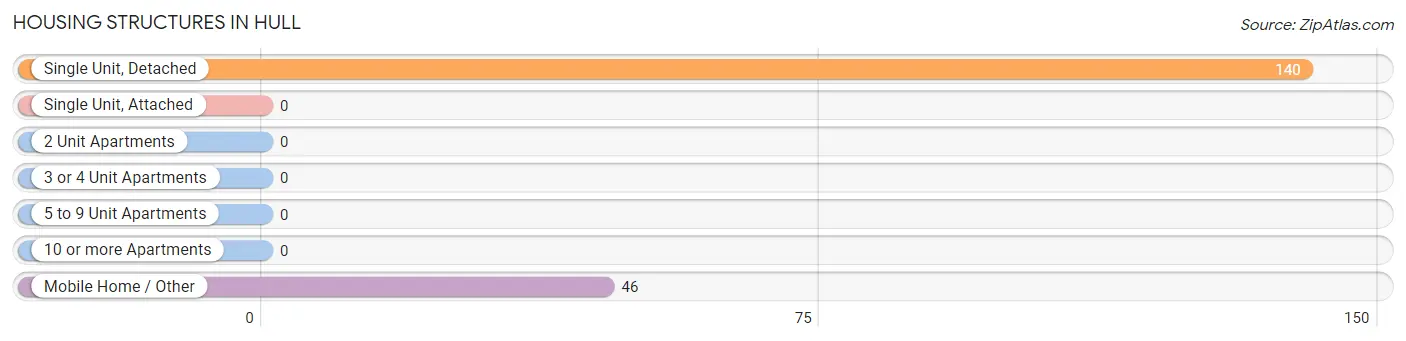
| Structure Type | # Housing Units | % Housing Units |
| Single Unit, Detached | 140 | 75.3% |
| Single Unit, Attached | 0 | 0.0% |
| 2 Unit Apartments | 0 | 0.0% |
| 3 or 4 Unit Apartments | 0 | 0.0% |
| 5 to 9 Unit Apartments | 0 | 0.0% |
| 10 or more Apartments | 0 | 0.0% |
| Mobile Home / Other | 46 | 24.7% |
| Total | 186 | 100.0% |
Housing Structures by Occupancy in Hull
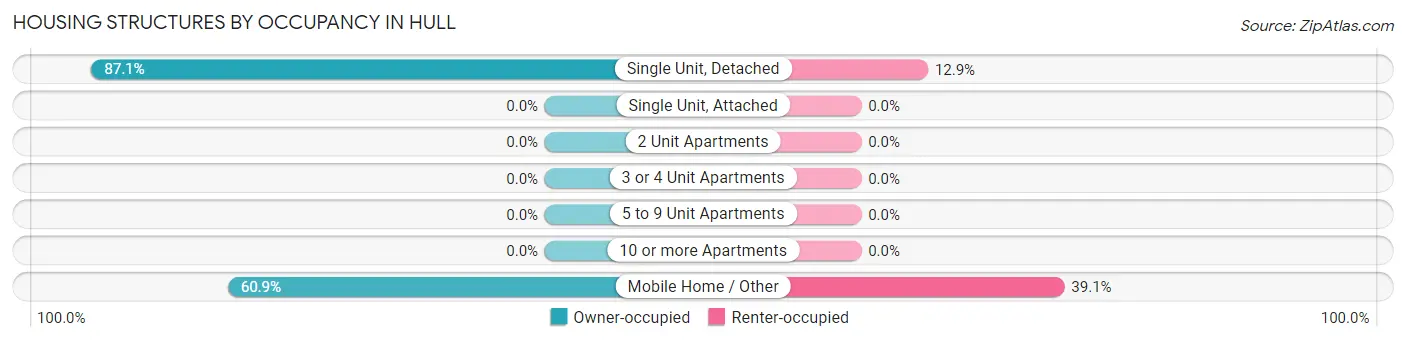
| Structure Type | Owner-occupied | Renter-occupied |
| Single Unit, Detached | 122 (87.1%) | 18 (12.9%) |
| Single Unit, Attached | 0 (0.0%) | 0 (0.0%) |
| 2 Unit Apartments | 0 (0.0%) | 0 (0.0%) |
| 3 or 4 Unit Apartments | 0 (0.0%) | 0 (0.0%) |
| 5 to 9 Unit Apartments | 0 (0.0%) | 0 (0.0%) |
| 10 or more Apartments | 0 (0.0%) | 0 (0.0%) |
| Mobile Home / Other | 28 (60.9%) | 18 (39.1%) |
| Total | 150 (80.6%) | 36 (19.4%) |
Housing Structures by Number of Rooms in Hull
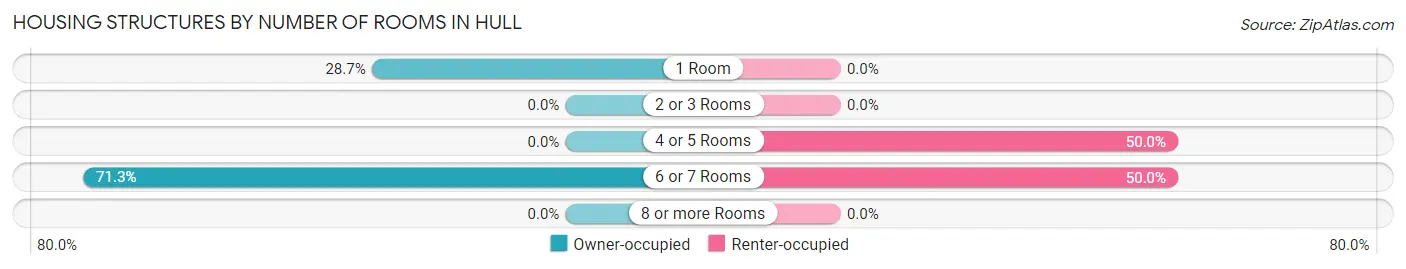
| Number of Rooms | Owner-occupied | Renter-occupied |
| 1 Room | 43 (28.7%) | 0 (0.0%) |
| 2 or 3 Rooms | 0 (0.0%) | 0 (0.0%) |
| 4 or 5 Rooms | 0 (0.0%) | 18 (50.0%) |
| 6 or 7 Rooms | 107 (71.3%) | 18 (50.0%) |
| 8 or more Rooms | 0 (0.0%) | 0 (0.0%) |
| Total | 150 (100.0%) | 36 (100.0%) |
Housing Structure by Heating Type in Hull
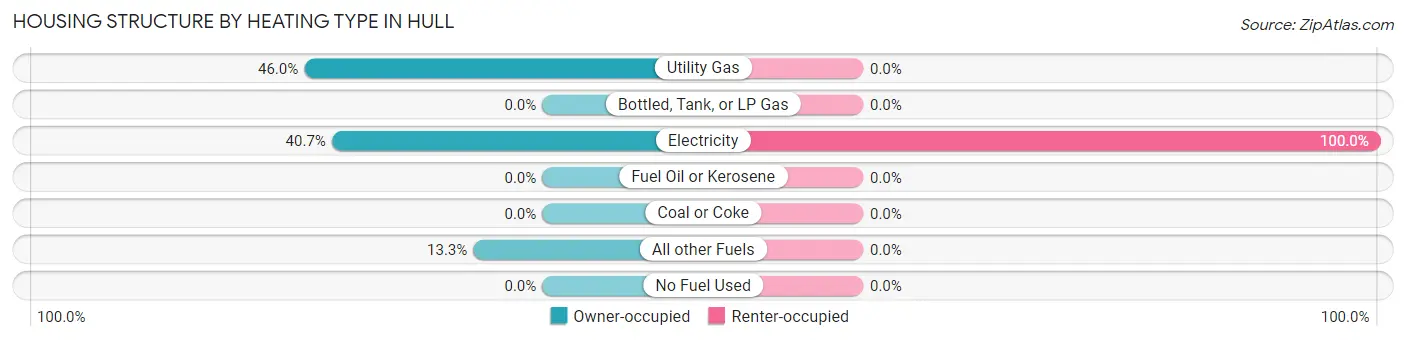
| Heating Type | Owner-occupied | Renter-occupied |
| Utility Gas | 69 (46.0%) | 0 (0.0%) |
| Bottled, Tank, or LP Gas | 0 (0.0%) | 0 (0.0%) |
| Electricity | 61 (40.7%) | 36 (100.0%) |
| Fuel Oil or Kerosene | 0 (0.0%) | 0 (0.0%) |
| Coal or Coke | 0 (0.0%) | 0 (0.0%) |
| All other Fuels | 20 (13.3%) | 0 (0.0%) |
| No Fuel Used | 0 (0.0%) | 0 (0.0%) |
| Total | 150 (100.0%) | 36 (100.0%) |
Household Vehicle Usage in Hull
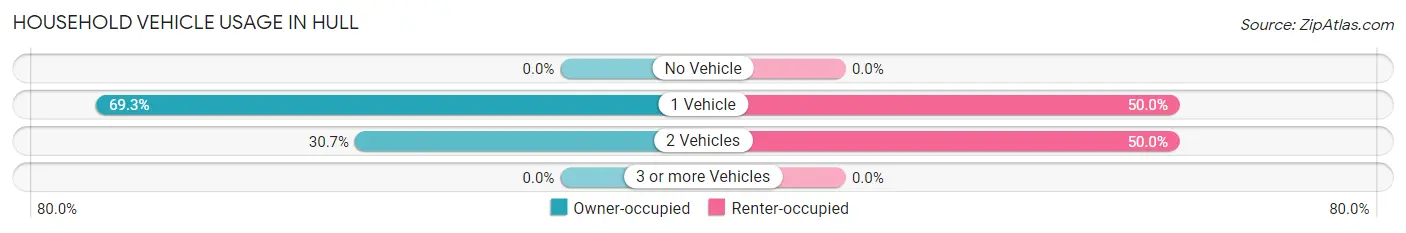
| Vehicles per Household | Owner-occupied | Renter-occupied |
| No Vehicle | 0 (0.0%) | 0 (0.0%) |
| 1 Vehicle | 104 (69.3%) | 18 (50.0%) |
| 2 Vehicles | 46 (30.7%) | 18 (50.0%) |
| 3 or more Vehicles | 0 (0.0%) | 0 (0.0%) |
| Total | 150 (100.0%) | 36 (100.0%) |
Real Estate & Mortgages in Hull
Real Estate and Mortgage Overview in Hull
| Characteristic | Without Mortgage | With Mortgage |
| Housing Units | 122 | 28 |
| Median Property Value | $43,400 | $0 |
| Median Household Income | - | - |
| Monthly Housing Costs | $345 | $0 |
| Real Estate Taxes | $807 | $0 |
Property Value by Mortgage Status in Hull
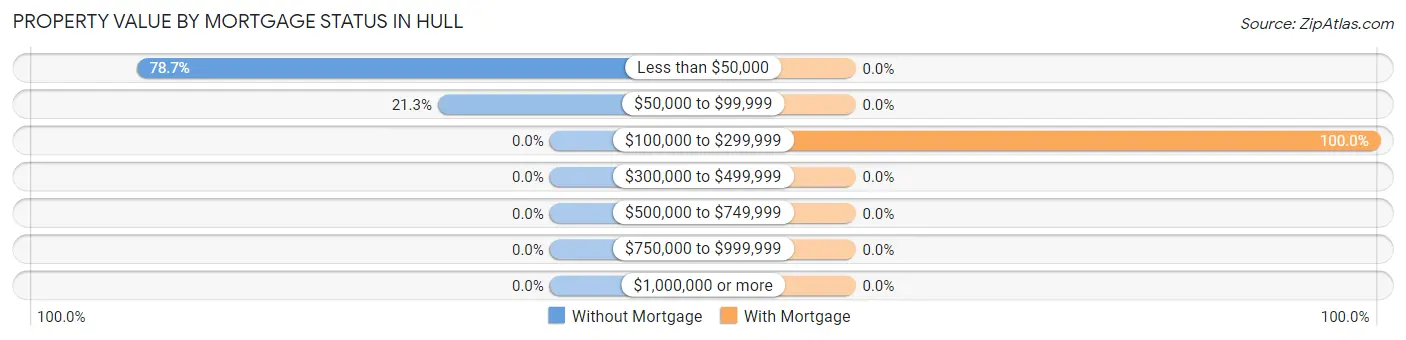
| Property Value | Without Mortgage | With Mortgage |
| Less than $50,000 | 96 (78.7%) | 0 (0.0%) |
| $50,000 to $99,999 | 26 (21.3%) | 0 (0.0%) |
| $100,000 to $299,999 | 0 (0.0%) | 28 (100.0%) |
| $300,000 to $499,999 | 0 (0.0%) | 0 (0.0%) |
| $500,000 to $749,999 | 0 (0.0%) | 0 (0.0%) |
| $750,000 to $999,999 | 0 (0.0%) | 0 (0.0%) |
| $1,000,000 or more | 0 (0.0%) | 0 (0.0%) |
| Total | 122 (100.0%) | 28 (100.0%) |
Household Income by Mortgage Status in Hull
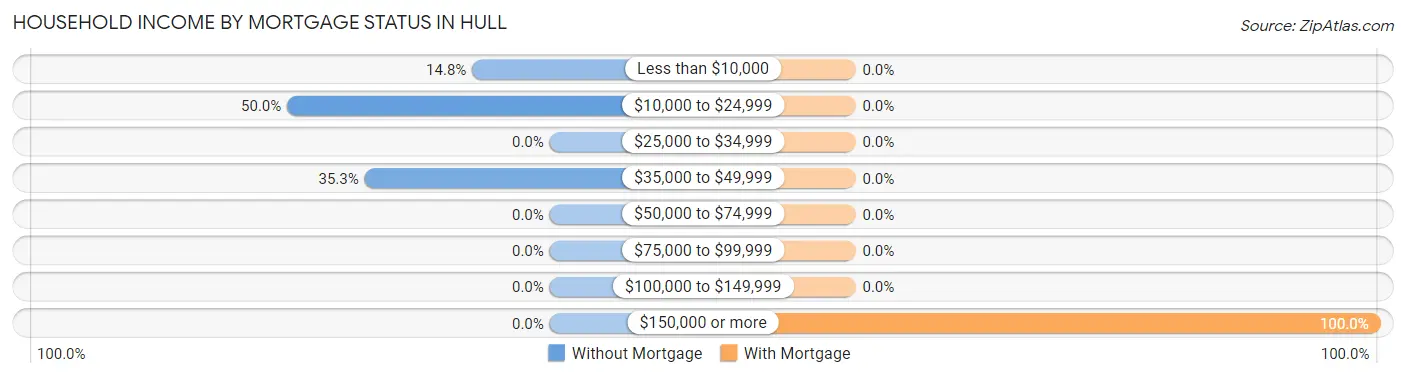
| Household Income | Without Mortgage | With Mortgage |
| Less than $10,000 | 18 (14.7%) | 0 (0.0%) |
| $10,000 to $24,999 | 61 (50.0%) | 0 (0.0%) |
| $25,000 to $34,999 | 0 (0.0%) | 0 (0.0%) |
| $35,000 to $49,999 | 43 (35.2%) | 0 (0.0%) |
| $50,000 to $74,999 | 0 (0.0%) | 0 (0.0%) |
| $75,000 to $99,999 | 0 (0.0%) | 0 (0.0%) |
| $100,000 to $149,999 | 0 (0.0%) | 0 (0.0%) |
| $150,000 or more | 0 (0.0%) | 28 (100.0%) |
| Total | 122 (100.0%) | 28 (100.0%) |
Property Value to Household Income Ratio in Hull
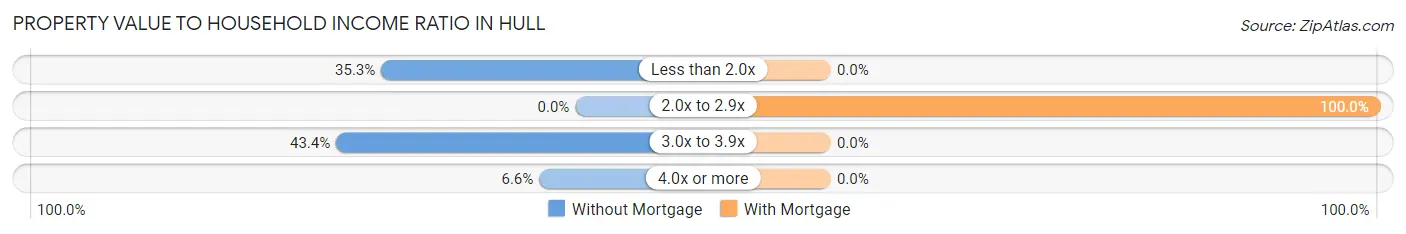
| Value-to-Income Ratio | Without Mortgage | With Mortgage |
| Less than 2.0x | 43 (35.2%) | 0 (0.0%) |
| 2.0x to 2.9x | 0 (0.0%) | 28 (100.0%) |
| 3.0x to 3.9x | 53 (43.4%) | 0 (0.0%) |
| 4.0x or more | 8 (6.6%) | 0 (0.0%) |
| Total | 122 (100.0%) | 28 (100.0%) |
Real Estate Taxes by Mortgage Status in Hull
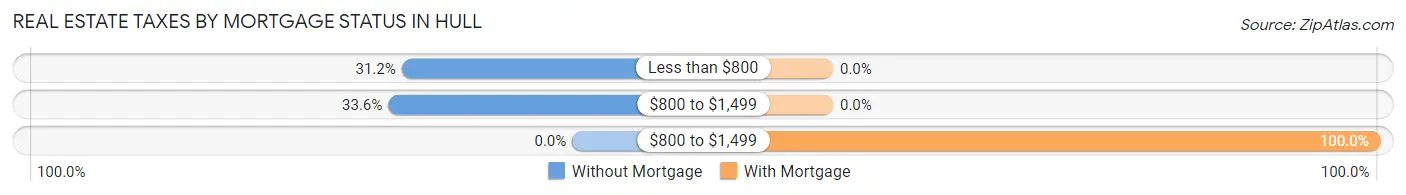
| Property Taxes | Without Mortgage | With Mortgage |
| Less than $800 | 38 (31.1%) | 0 (0.0%) |
| $800 to $1,499 | 41 (33.6%) | 0 (0.0%) |
| $800 to $1,499 | 0 (0.0%) | 28 (100.0%) |
| Total | 122 (100.0%) | 28 (100.0%) |
Health & Disability in Hull
Health Insurance Coverage by Age in Hull
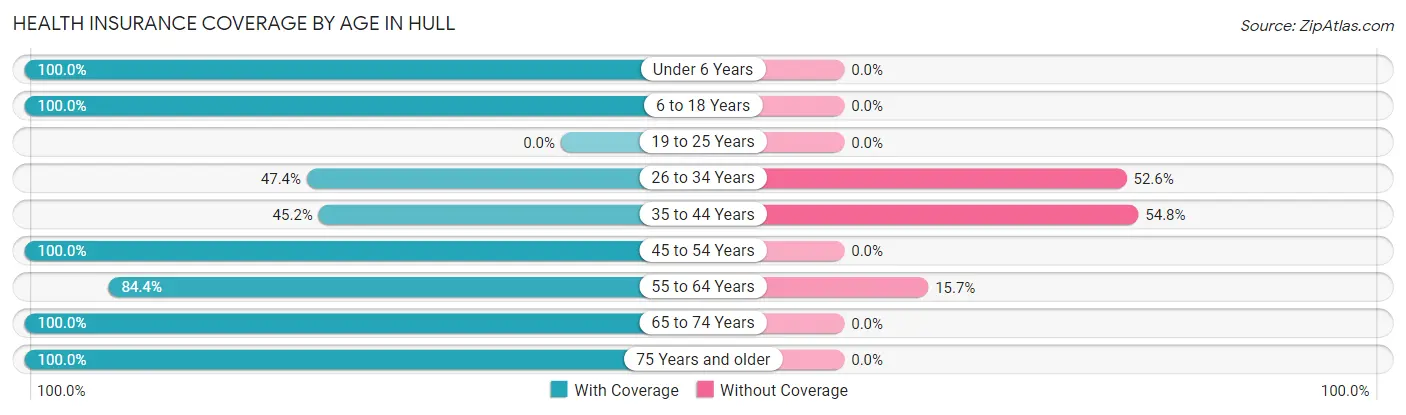
| Age Bracket | With Coverage | Without Coverage |
| Under 6 Years | 18 (100.0%) | 0 (0.0%) |
| 6 to 18 Years | 36 (100.0%) | 0 (0.0%) |
| 19 to 25 Years | 0 (0.0%) | 0 (0.0%) |
| 26 to 34 Years | 18 (47.4%) | 20 (52.6%) |
| 35 to 44 Years | 14 (45.2%) | 17 (54.8%) |
| 45 to 54 Years | 31 (100.0%) | 0 (0.0%) |
| 55 to 64 Years | 97 (84.4%) | 18 (15.7%) |
| 65 to 74 Years | 41 (100.0%) | 0 (0.0%) |
| 75 Years and older | 20 (100.0%) | 0 (0.0%) |
| Total | 275 (83.3%) | 55 (16.7%) |
Health Insurance Coverage by Citizenship Status in Hull
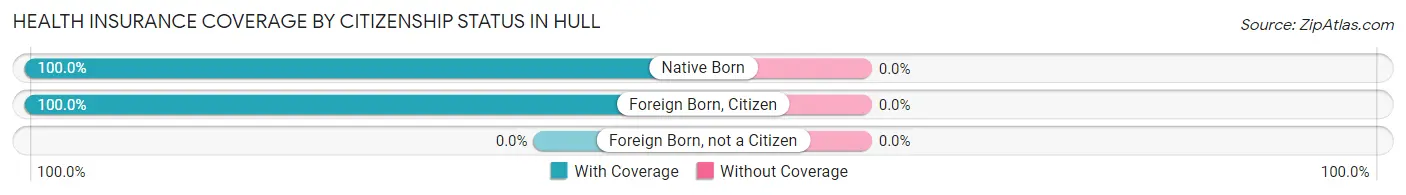
| Citizenship Status | With Coverage | Without Coverage |
| Native Born | 18 (100.0%) | 0 (0.0%) |
| Foreign Born, Citizen | 36 (100.0%) | 0 (0.0%) |
| Foreign Born, not a Citizen | 0 (0.0%) | 0 (0.0%) |
Health Insurance Coverage by Household Income in Hull
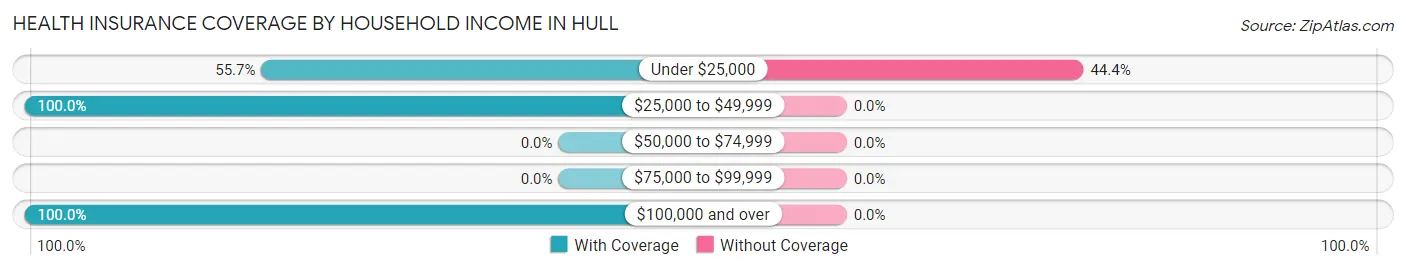
| Household Income | With Coverage | Without Coverage |
| Under $25,000 | 69 (55.6%) | 55 (44.4%) |
| $25,000 to $49,999 | 147 (100.0%) | 0 (0.0%) |
| $50,000 to $74,999 | 0 (0.0%) | 0 (0.0%) |
| $75,000 to $99,999 | 0 (0.0%) | 0 (0.0%) |
| $100,000 and over | 59 (100.0%) | 0 (0.0%) |
Public vs Private Health Insurance Coverage by Age in Hull
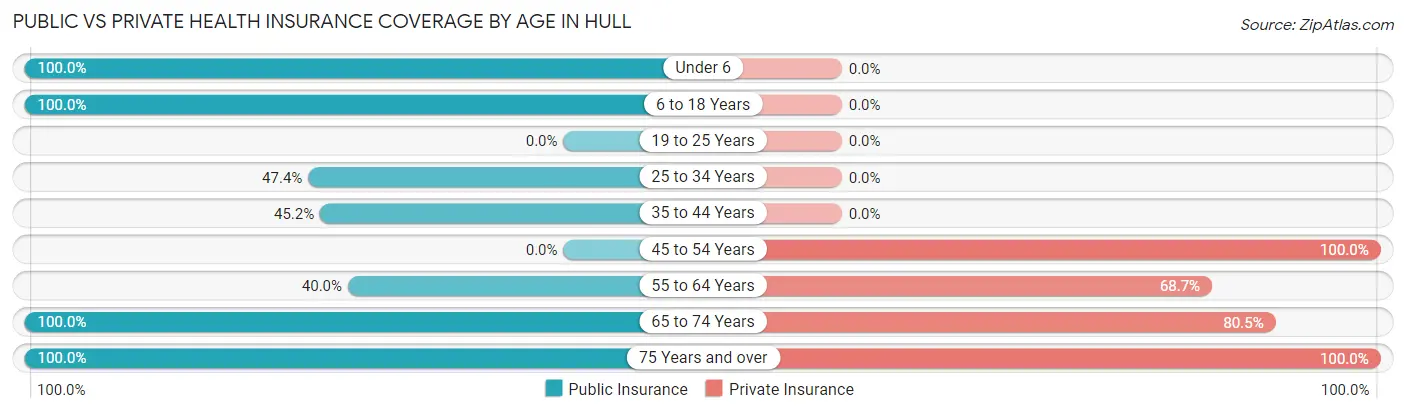
| Age Bracket | Public Insurance | Private Insurance |
| Under 6 | 18 (100.0%) | 0 (0.0%) |
| 6 to 18 Years | 36 (100.0%) | 0 (0.0%) |
| 19 to 25 Years | 0 (0.0%) | 0 (0.0%) |
| 25 to 34 Years | 18 (47.4%) | 0 (0.0%) |
| 35 to 44 Years | 14 (45.2%) | 0 (0.0%) |
| 45 to 54 Years | 0 (0.0%) | 31 (100.0%) |
| 55 to 64 Years | 46 (40.0%) | 79 (68.7%) |
| 65 to 74 Years | 41 (100.0%) | 33 (80.5%) |
| 75 Years and over | 20 (100.0%) | 20 (100.0%) |
| Total | 193 (58.5%) | 163 (49.4%) |
Disability Status by Sex by Age in Hull
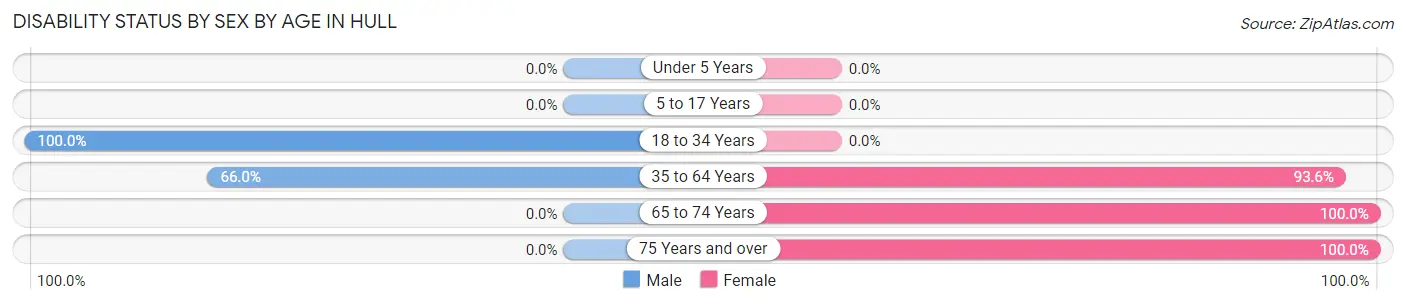
| Age Bracket | Male | Female |
| Under 5 Years | 0 (0.0%) | 0 (0.0%) |
| 5 to 17 Years | 0 (0.0%) | 0 (0.0%) |
| 18 to 34 Years | 20 (100.0%) | 0 (0.0%) |
| 35 to 64 Years | 35 (66.0%) | 116 (93.5%) |
| 65 to 74 Years | 0 (0.0%) | 41 (100.0%) |
| 75 Years and over | 0 (0.0%) | 20 (100.0%) |
Disability Class by Sex by Age in Hull
Disability Class: Hearing Difficulty
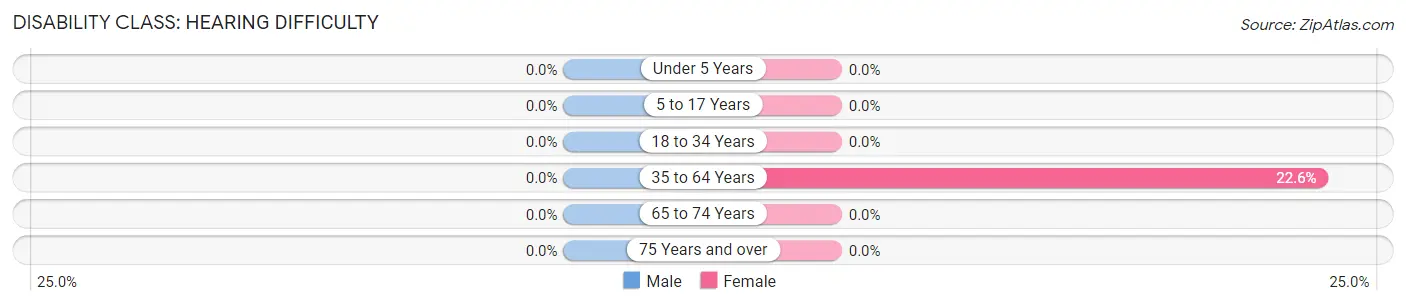
| Age Bracket | Male | Female |
| Under 5 Years | 0 (0.0%) | 0 (0.0%) |
| 5 to 17 Years | 0 (0.0%) | 0 (0.0%) |
| 18 to 34 Years | 0 (0.0%) | 0 (0.0%) |
| 35 to 64 Years | 0 (0.0%) | 28 (22.6%) |
| 65 to 74 Years | 0 (0.0%) | 0 (0.0%) |
| 75 Years and over | 0 (0.0%) | 0 (0.0%) |
Disability Class: Vision Difficulty
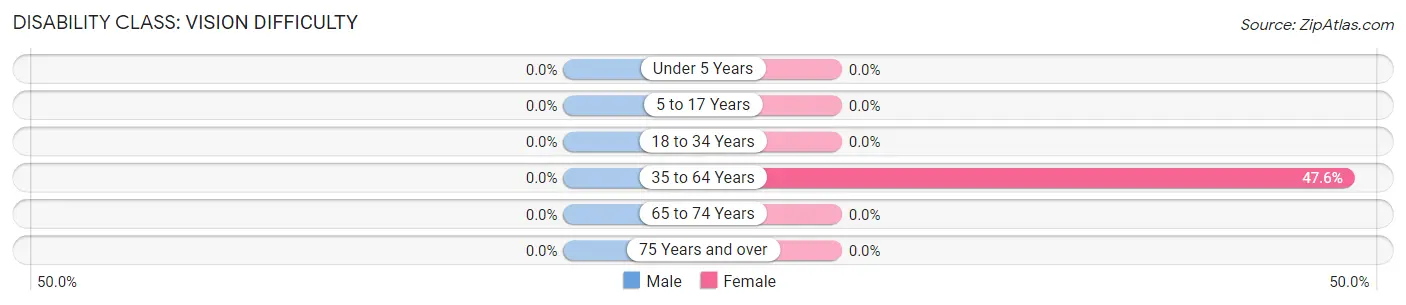
| Age Bracket | Male | Female |
| Under 5 Years | 0 (0.0%) | 0 (0.0%) |
| 5 to 17 Years | 0 (0.0%) | 0 (0.0%) |
| 18 to 34 Years | 0 (0.0%) | 0 (0.0%) |
| 35 to 64 Years | 0 (0.0%) | 59 (47.6%) |
| 65 to 74 Years | 0 (0.0%) | 0 (0.0%) |
| 75 Years and over | 0 (0.0%) | 0 (0.0%) |
Disability Class: Cognitive Difficulty
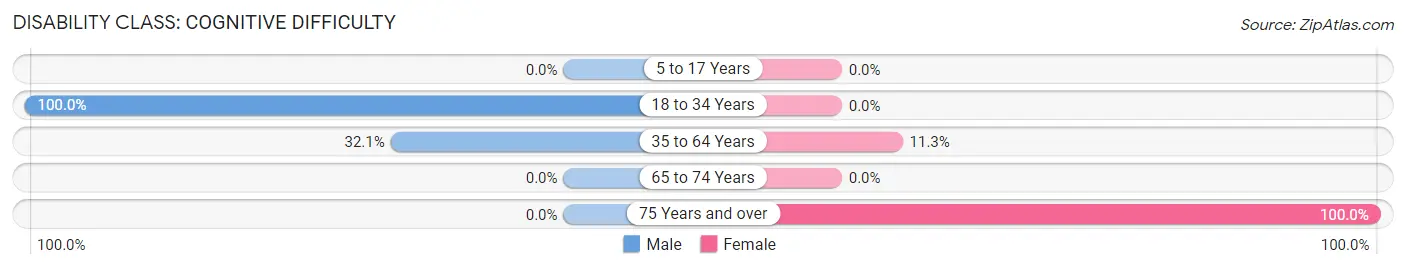
| Age Bracket | Male | Female |
| 5 to 17 Years | 0 (0.0%) | 0 (0.0%) |
| 18 to 34 Years | 20 (100.0%) | 0 (0.0%) |
| 35 to 64 Years | 17 (32.1%) | 14 (11.3%) |
| 65 to 74 Years | 0 (0.0%) | 0 (0.0%) |
| 75 Years and over | 0 (0.0%) | 20 (100.0%) |
Disability Class: Ambulatory Difficulty
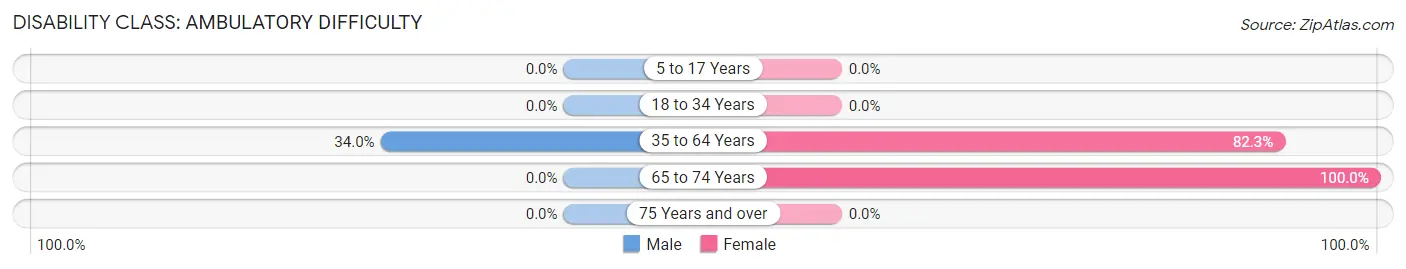
| Age Bracket | Male | Female |
| 5 to 17 Years | 0 (0.0%) | 0 (0.0%) |
| 18 to 34 Years | 0 (0.0%) | 0 (0.0%) |
| 35 to 64 Years | 18 (34.0%) | 102 (82.3%) |
| 65 to 74 Years | 0 (0.0%) | 41 (100.0%) |
| 75 Years and over | 0 (0.0%) | 0 (0.0%) |
Disability Class: Self-Care Difficulty
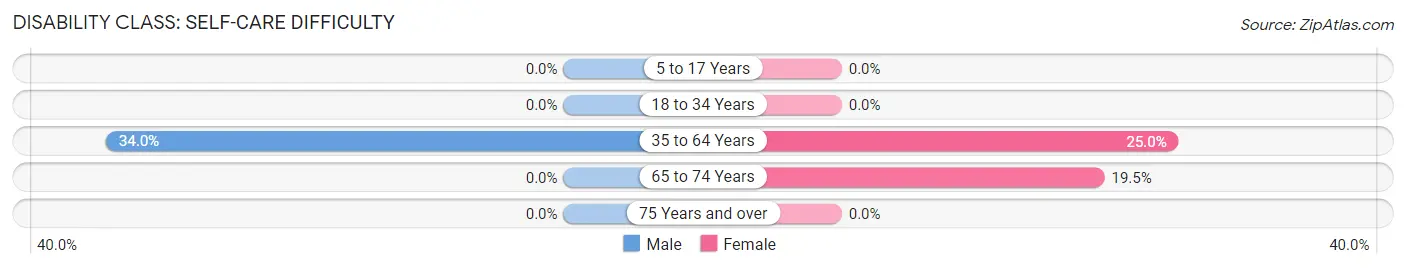
| Age Bracket | Male | Female |
| 5 to 17 Years | 0 (0.0%) | 0 (0.0%) |
| 18 to 34 Years | 0 (0.0%) | 0 (0.0%) |
| 35 to 64 Years | 18 (34.0%) | 31 (25.0%) |
| 65 to 74 Years | 0 (0.0%) | 8 (19.5%) |
| 75 Years and over | 0 (0.0%) | 0 (0.0%) |
Technology Access in Hull
Computing Device Access in Hull
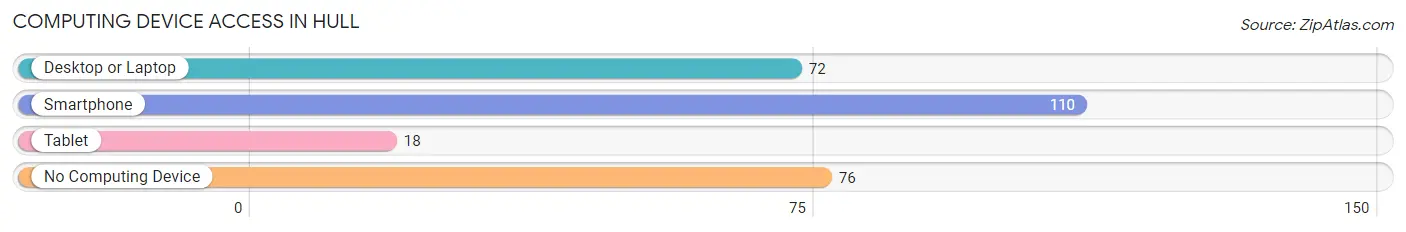
| Device Type | # Households | % Households |
| Desktop or Laptop | 72 | 38.7% |
| Smartphone | 110 | 59.1% |
| Tablet | 18 | 9.7% |
| No Computing Device | 76 | 40.9% |
| Total | 186 | 100.0% |
Internet Access in Hull
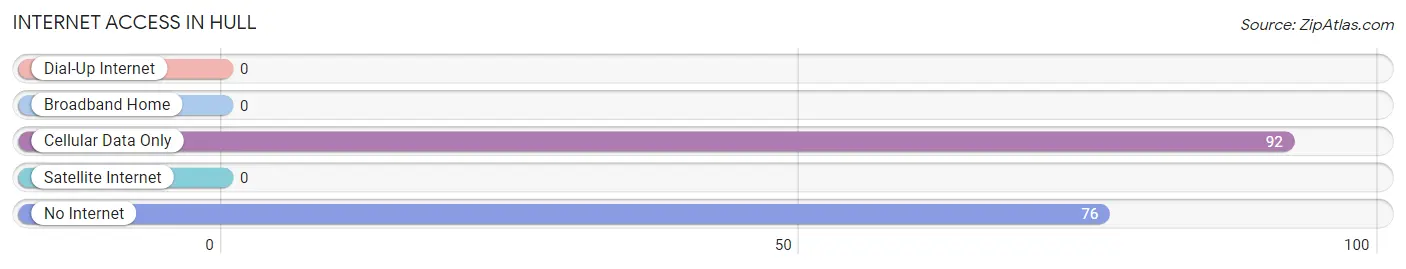
| Internet Type | # Households | % Households |
| Dial-Up Internet | 0 | 0.0% |
| Broadband Home | 0 | 0.0% |
| Cellular Data Only | 92 | 49.5% |
| Satellite Internet | 0 | 0.0% |
| No Internet | 76 | 40.9% |
| Total | 186 | 100.0% |
Hull Summary
Hull is a small town located in the eastern part of Texas, in the county of Liberty. It is situated on the banks of the Trinity River, about 25 miles northeast of Houston. The town was founded in 1837 and was named after the first settler, William Hull. The population of Hull in 2000 was 1,845.
Hull is located in the East Texas Piney Woods region, which is characterized by rolling hills, dense forests, and numerous rivers and streams. The climate is humid subtropical, with hot summers and mild winters. The average annual temperature is around 70 degrees Fahrenheit.
The economy of Hull is largely based on agriculture and timber production. The town is home to several large farms, as well as a number of smaller family-owned farms. The timber industry is also important to the local economy, with several sawmills located in the area. In addition, there are several small businesses in the town, including a grocery store, a hardware store, and a few restaurants.
The demographics of Hull in 2000 were predominantly white, with a small African American population. The median household income was $30,845, and the median home value was $63,000. The town had a high school graduation rate of 79.3%, and the unemployment rate was 4.2%.
Hull is a small town with a rich history and a strong sense of community. It is a great place to live and work, and it offers a variety of recreational activities, including fishing, hunting, and camping. The town is also home to several churches, and it is a popular destination for tourists who want to experience the beauty of the East Texas Piney Woods.
Common Questions
What is Per Capita Income in Hull?
Per Capita income in Hull is $20,164.
What is the Median Household income in Hull?
Median Household Income in Hull is $31,944.
What is Inequality or Gini Index in Hull?
Inequality or Gini Index in Hull is 0.43.
What is the Total Population of Hull?
Total Population of Hull is 330.
What is the Total Male Population of Hull?
Total Male Population of Hull is 91.
What is the Total Female Population of Hull?
Total Female Population of Hull is 239.
What is the Ratio of Males per 100 Females in Hull?
There are 38.08 Males per 100 Females in Hull.
What is the Ratio of Females per 100 Males in Hull?
There are 262.64 Females per 100 Males in Hull.
What is the Median Population Age in Hull?
Median Population Age in Hull is 56.2 Years.
What is the Average Family Size in Hull
Average Family Size in Hull is 2.4 People.
What is the Average Household Size in Hull
Average Household Size in Hull is 1.8 People.
How Large is the Labor Force in Hull?
There are 92 People in the Labor Forcein in Hull.
What is the Percentage of People in the Labor Force in Hull?
33.3% of People are in the Labor Force in Hull.