Zip Codes with the Highest Percentage of Population Employed in Health Diagnosing & Treating in Harlingen, TX
RELATED REPORTS & OPTIONS
Health Diagnosing & Treating
Harlingen
Compare Zip Codes
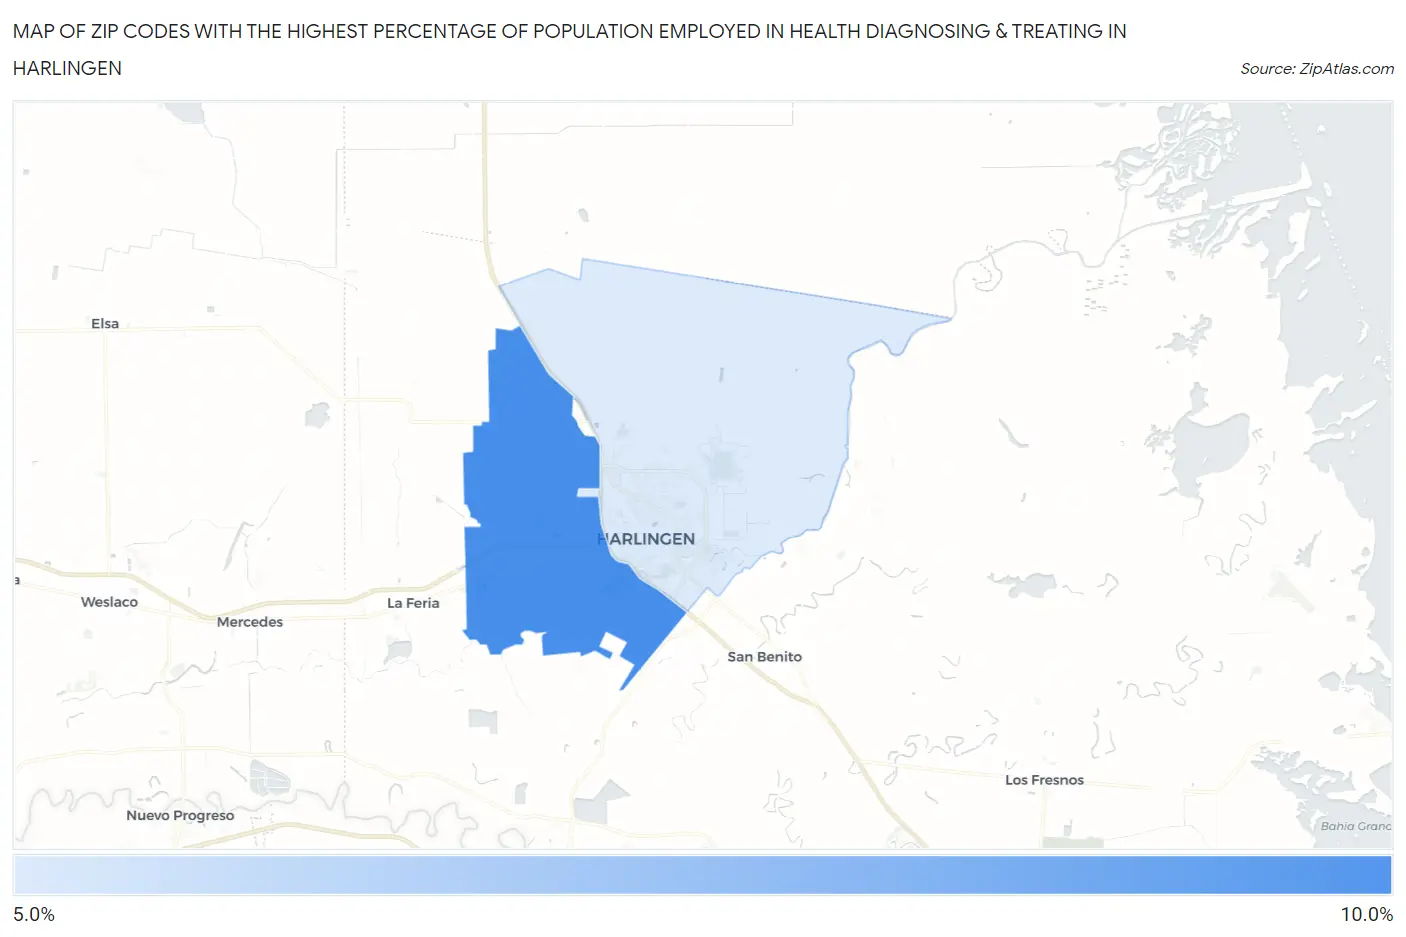
Map of Zip Codes with the Highest Percentage of Population Employed in Health Diagnosing & Treating in Harlingen
5.5%
9.9%
Zip Codes with the Highest Percentage of Population Employed in Health Diagnosing & Treating in Harlingen, TX
| Zip Code | % Employed | vs State | vs National | |
| 1. | 78552 | 9.9% | 5.5%(+4.42)#168 | 6.2%(+3.70)#3,962 |
| 2. | 78550 | 5.5% | 5.5%(-0.048)#717 | 6.2%(-0.774)#15,890 |
1
Common Questions
What are the Top Zip Codes with the Highest Percentage of Population Employed in Health Diagnosing & Treating in Harlingen, TX?
Top Zip Codes with the Highest Percentage of Population Employed in Health Diagnosing & Treating in Harlingen, TX are:
What zip code has the Highest Percentage of Population Employed in Health Diagnosing & Treating in Harlingen, TX?
78552 has the Highest Percentage of Population Employed in Health Diagnosing & Treating in Harlingen, TX with 9.9%.
What is the Percentage of Population Employed in Health Diagnosing & Treating in Harlingen, TX?
Percentage of Population Employed in Health Diagnosing & Treating in Harlingen is 7.3%.
What is the Percentage of Population Employed in Health Diagnosing & Treating in Texas?
Percentage of Population Employed in Health Diagnosing & Treating in Texas is 5.5%.
What is the Percentage of Population Employed in Health Diagnosing & Treating in the United States?
Percentage of Population Employed in Health Diagnosing & Treating in the United States is 6.2%.