Zip Codes with the Highest Percentage of Population Employed in Health Diagnosing & Treating in Brownsville, TX
RELATED REPORTS & OPTIONS
Health Diagnosing & Treating
Brownsville
Compare Zip Codes
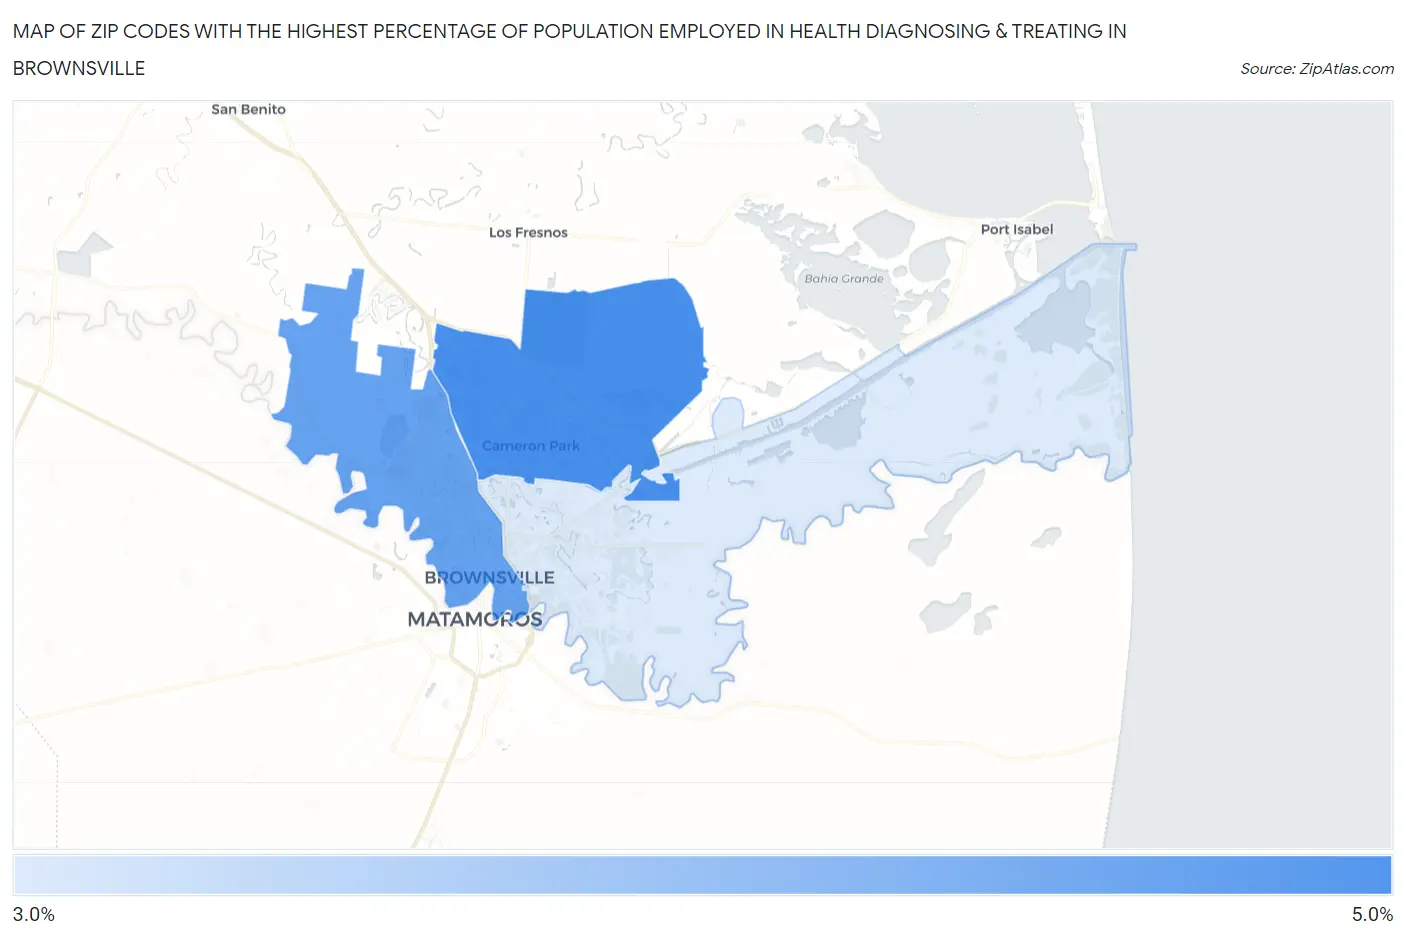
Map of Zip Codes with the Highest Percentage of Population Employed in Health Diagnosing & Treating in Brownsville
3.2%
4.5%
Zip Codes with the Highest Percentage of Population Employed in Health Diagnosing & Treating in Brownsville, TX
| Zip Code | % Employed | vs State | vs National | |
| 1. | 78526 | 4.5% | 5.5%(-0.973)#936 | 6.2%(-1.70)#19,460 |
| 2. | 78520 | 4.3% | 5.5%(-1.25)#988 | 6.2%(-1.98)#20,462 |
| 3. | 78521 | 3.2% | 5.5%(-2.32)#1,247 | 6.2%(-3.05)#23,781 |
1
Common Questions
What are the Top Zip Codes with the Highest Percentage of Population Employed in Health Diagnosing & Treating in Brownsville, TX?
Top Zip Codes with the Highest Percentage of Population Employed in Health Diagnosing & Treating in Brownsville, TX are:
What zip code has the Highest Percentage of Population Employed in Health Diagnosing & Treating in Brownsville, TX?
78526 has the Highest Percentage of Population Employed in Health Diagnosing & Treating in Brownsville, TX with 4.5%.
What is the Percentage of Population Employed in Health Diagnosing & Treating in Brownsville, TX?
Percentage of Population Employed in Health Diagnosing & Treating in Brownsville is 4.1%.
What is the Percentage of Population Employed in Health Diagnosing & Treating in Texas?
Percentage of Population Employed in Health Diagnosing & Treating in Texas is 5.5%.
What is the Percentage of Population Employed in Health Diagnosing & Treating in the United States?
Percentage of Population Employed in Health Diagnosing & Treating in the United States is 6.2%.