Marlin, TX Map & Demographics
Marlin Map
Marlin Overview
$15,920
PER CAPITA INCOME
$62,550
AVG FAMILY INCOME
$31,240
AVG HOUSEHOLD INCOME
$8,361
FAMILY INCOME DEFICIT
0.43
INEQUALITY / GINI INDEX
5,478
TOTAL POPULATION
2,870
MALE POPULATION
2,608
FEMALE POPULATION
110.05
MALES / 100 FEMALES
90.87
FEMALES / 100 MALES
35.7
MEDIAN AGE
4.7
AVG FAMILY SIZE
2.9
AVG HOUSEHOLD SIZE
2,137
LABOR FORCE [ PEOPLE ]
49.9%
PERCENT IN LABOR FORCE
13.9%
UNEMPLOYMENT RATE
Marlin Zip Codes
Marlin Area Codes
Income in Marlin
Income Overview in Marlin
Per Capita Income in Marlin is $15,920, while median incomes of families and households are $62,550 and $31,240 respectively.
| Characteristic | Number | Measure |
| Per Capita Income | 5,478 | $15,920 |
| Median Family Income | 837 | $62,550 |
| Mean Family Income | 837 | $54,862 |
| Median Household Income | 1,658 | $31,240 |
| Mean Household Income | 1,658 | $42,326 |
| Income Deficit | 837 | $8,361 |
| Wage / Income Gap (%) | 5,478 | 0.00% |
| Wage / Income Gap ($) | 5,478 | 100.00¢ per $1 |
| Gini / Inequality Index | 5,478 | 0.43 |
Earnings by Sex in Marlin
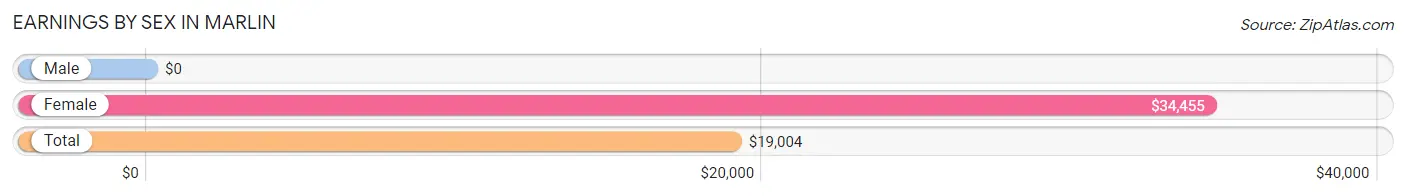
| Sex | Number | Average Earnings |
| Male | 980 (49.6%) | $0 |
| Female | 995 (50.4%) | $34,455 |
| Total | 1,975 (100.0%) | $19,004 |
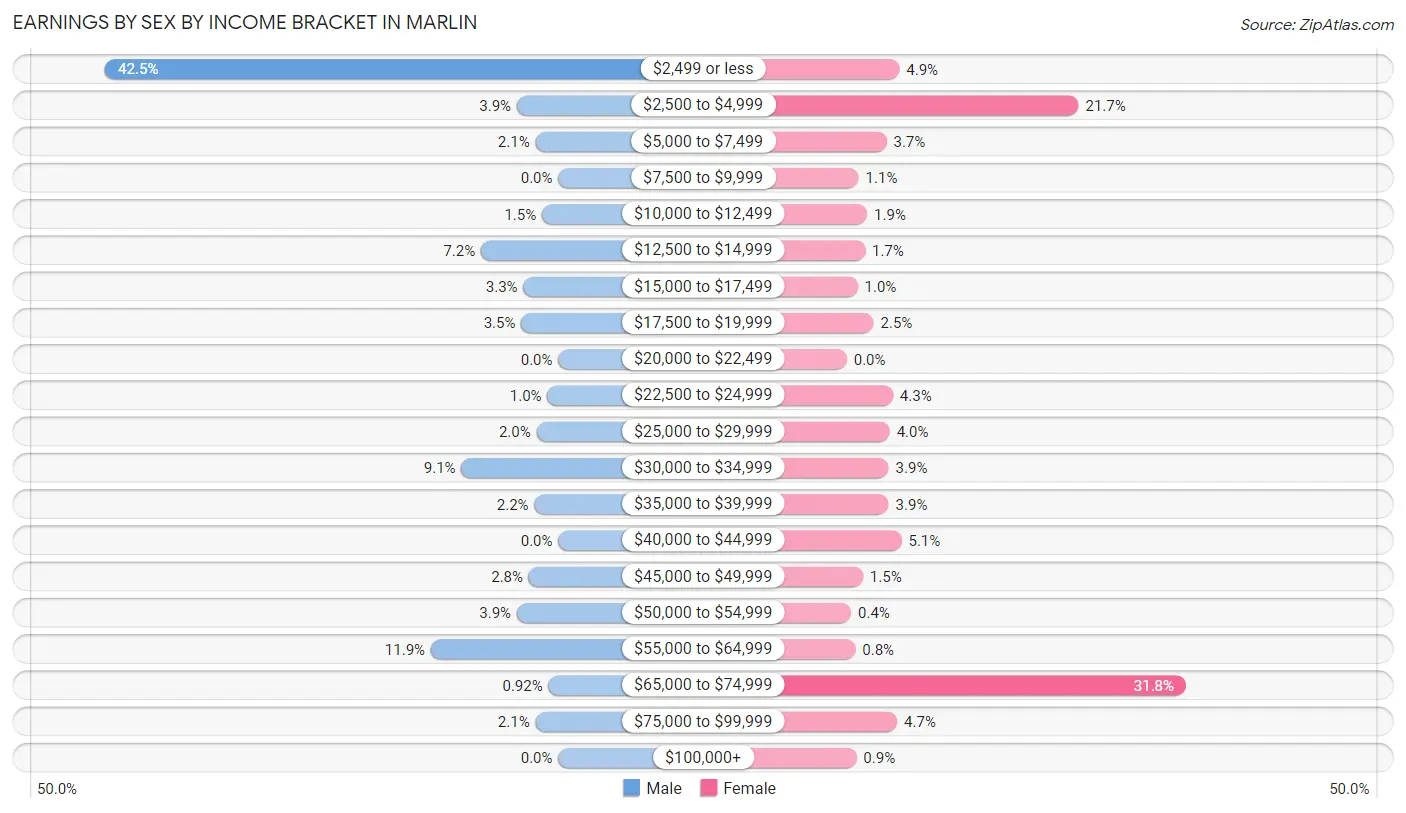
Earnings by Sex by Income Bracket in Marlin
The most common earnings brackets in Marlin are $2,499 or less for men (416 | 42.4%) and $65,000 to $74,999 for women (316 | 31.8%).
| Income | Male | Female |
| $2,499 or less | 416 (42.4%) | 49 (4.9%) |
| $2,500 to $4,999 | 38 (3.9%) | 216 (21.7%) |
| $5,000 to $7,499 | 21 (2.1%) | 37 (3.7%) |
| $7,500 to $9,999 | 0 (0.0%) | 11 (1.1%) |
| $10,000 to $12,499 | 15 (1.5%) | 19 (1.9%) |
| $12,500 to $14,999 | 71 (7.2%) | 17 (1.7%) |
| $15,000 to $17,499 | 32 (3.3%) | 10 (1.0%) |
| $17,500 to $19,999 | 34 (3.5%) | 25 (2.5%) |
| $20,000 to $22,499 | 0 (0.0%) | 0 (0.0%) |
| $22,500 to $24,999 | 10 (1.0%) | 43 (4.3%) |
| $25,000 to $29,999 | 20 (2.0%) | 40 (4.0%) |
| $30,000 to $34,999 | 89 (9.1%) | 39 (3.9%) |
| $35,000 to $39,999 | 22 (2.2%) | 39 (3.9%) |
| $40,000 to $44,999 | 0 (0.0%) | 51 (5.1%) |
| $45,000 to $49,999 | 27 (2.8%) | 15 (1.5%) |
| $50,000 to $54,999 | 38 (3.9%) | 4 (0.4%) |
| $55,000 to $64,999 | 117 (11.9%) | 8 (0.8%) |
| $65,000 to $74,999 | 9 (0.9%) | 316 (31.8%) |
| $75,000 to $99,999 | 21 (2.1%) | 47 (4.7%) |
| $100,000+ | 0 (0.0%) | 9 (0.9%) |
| Total | 980 (100.0%) | 995 (100.0%) |
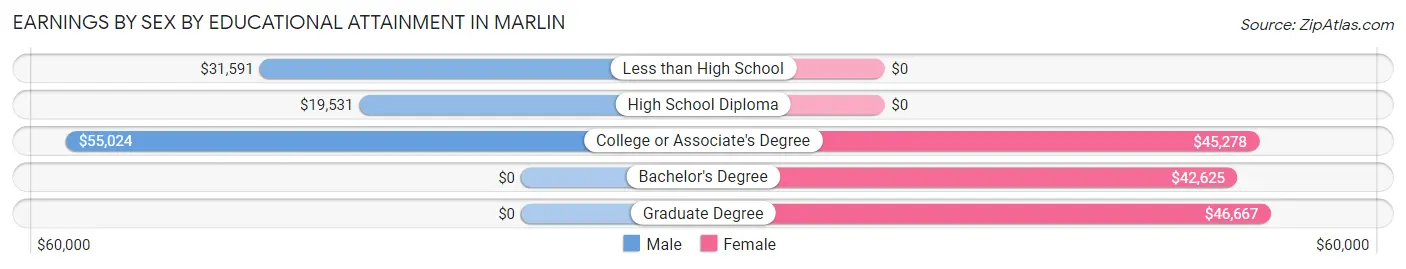
Earnings by Sex by Educational Attainment in Marlin
Average earnings in Marlin are $30,878 for men and $39,702 for women, a difference of 22.2%. Men with an educational attainment of college or associate's degree enjoy the highest average annual earnings of $55,024, while those with high school diploma education earn the least with $19,531. Women with an educational attainment of graduate degree earn the most with the average annual earnings of $46,667, while those with bachelor's degree education have the smallest earnings of $42,625.
| Educational Attainment | Male Income | Female Income |
| Less than High School | $31,591 | $0 |
| High School Diploma | $19,531 | $0 |
| College or Associate's Degree | $55,024 | $45,278 |
| Bachelor's Degree | - | - |
| Graduate Degree | - | - |
| Total | $30,878 | $39,702 |
Family Income in Marlin
Family Income Brackets in Marlin
According to the Marlin family income data, there are 271 families falling into the $50,000 to $74,999 income range, which is the most common income bracket and makes up 32.4% of all families. Conversely, the $150,000 to $199,999 income bracket is the least frequent group with only 1 families (0.1%) belonging to this category.
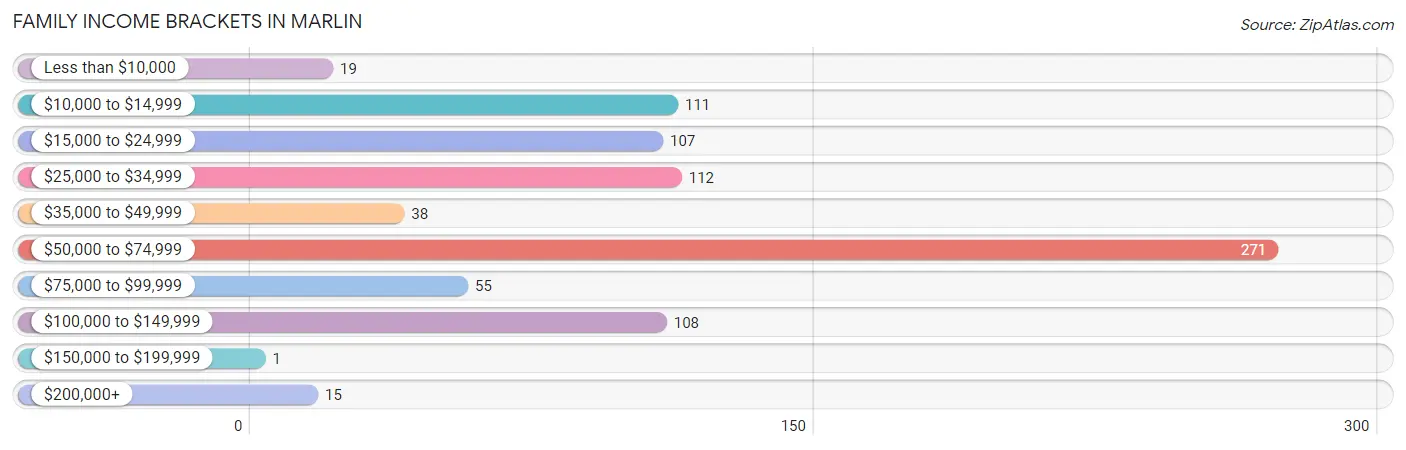
| Income Bracket | # Families | % Families |
| Less than $10,000 | 19 | 2.3% |
| $10,000 to $14,999 | 111 | 13.3% |
| $15,000 to $24,999 | 107 | 12.8% |
| $25,000 to $34,999 | 112 | 13.4% |
| $35,000 to $49,999 | 38 | 4.5% |
| $50,000 to $74,999 | 271 | 32.4% |
| $75,000 to $99,999 | 55 | 6.6% |
| $100,000 to $149,999 | 108 | 12.9% |
| $150,000 to $199,999 | 1 | 0.1% |
| $200,000+ | 15 | 1.8% |
Family Income by Famaliy Size in Marlin
2-person families (402 | 48.0%) account for the highest median family income in Marlin with $30,907 per family, while 2-person families (402 | 48.0%) have the highest median income of $15,454 per family member.
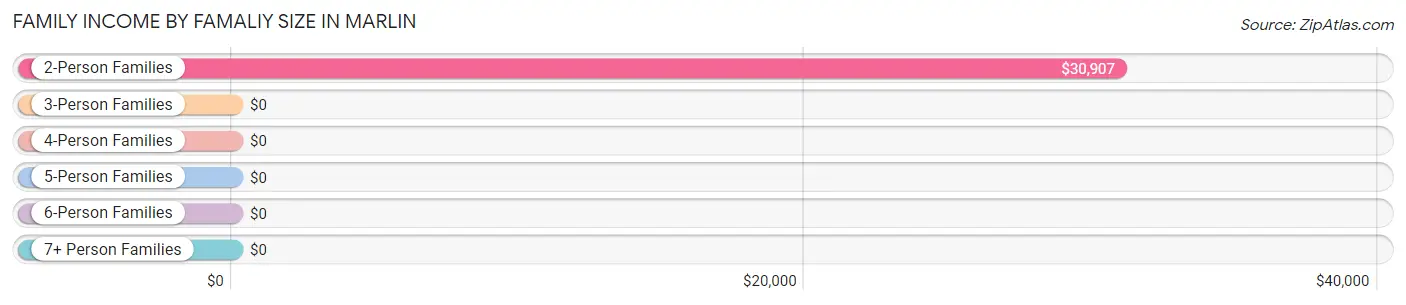
| Income Bracket | # Families | Median Income |
| 2-Person Families | 402 (48.0%) | $30,907 |
| 3-Person Families | 85 (10.2%) | $0 |
| 4-Person Families | 47 (5.6%) | $0 |
| 5-Person Families | 76 (9.1%) | $0 |
| 6-Person Families | 0 (0.0%) | $0 |
| 7+ Person Families | 227 (27.1%) | $0 |
| Total | 837 (100.0%) | $62,550 |
Family Income by Number of Earners in Marlin
The median family income in Marlin is $62,550, with families comprising 1 earner (183) having the highest median family income of $86,023, while families with no earners (314) have the lowest median family income of $15,964, accounting for 21.9% and 37.5% of families, respectively.
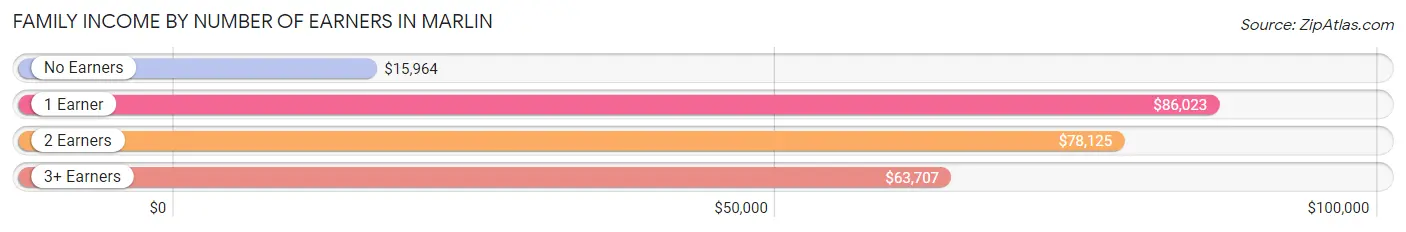
| Number of Earners | # Families | Median Income |
| No Earners | 314 (37.5%) | $15,964 |
| 1 Earner | 183 (21.9%) | $86,023 |
| 2 Earners | 94 (11.2%) | $78,125 |
| 3+ Earners | 246 (29.4%) | $63,707 |
| Total | 837 (100.0%) | $62,550 |
Household Income in Marlin
Household Income Brackets in Marlin
With 414 households falling in the category, the $50,000 to $74,999 income range is the most frequent in Marlin, accounting for 25.0% of all households. In contrast, only 2 households (0.1%) fall into the $150,000 to $199,999 income bracket, making it the least populous group.
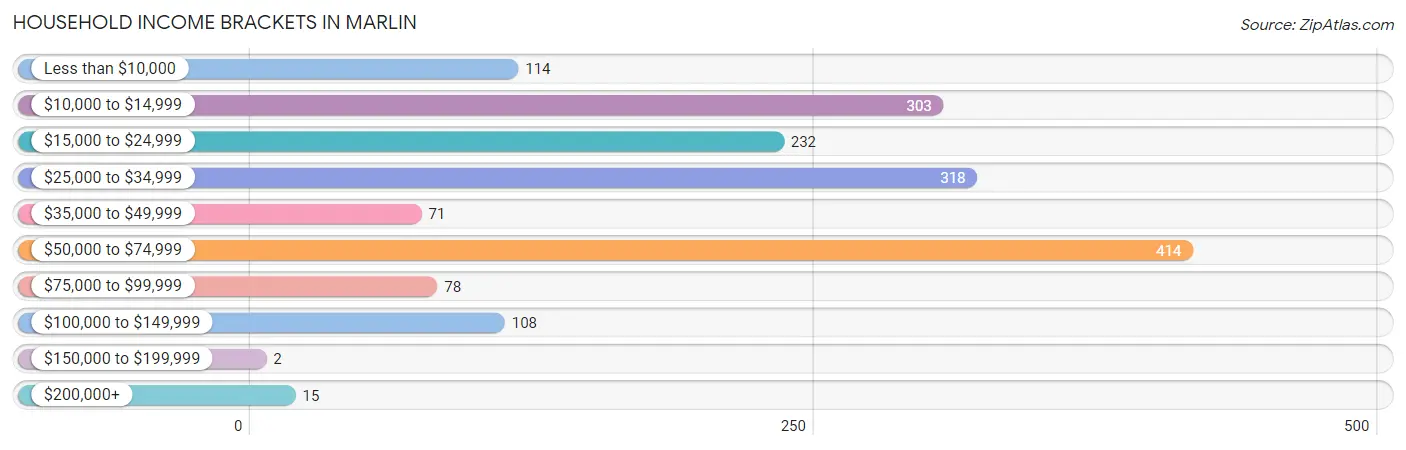
| Income Bracket | # Households | % Households |
| Less than $10,000 | 114 | 6.9% |
| $10,000 to $14,999 | 303 | 18.3% |
| $15,000 to $24,999 | 232 | 14.0% |
| $25,000 to $34,999 | 318 | 19.2% |
| $35,000 to $49,999 | 71 | 4.3% |
| $50,000 to $74,999 | 414 | 25.0% |
| $75,000 to $99,999 | 78 | 4.7% |
| $100,000 to $149,999 | 108 | 6.5% |
| $150,000 to $199,999 | 2 | 0.1% |
| $200,000+ | 15 | 0.9% |
Household Income by Householder Age in Marlin
The median household income in Marlin is $31,240, with the highest median household income of $63,516 found in the 25 to 44 years age bracket for the primary householder. A total of 257 households (15.5%) fall into this category. Meanwhile, the 15 to 24 years age bracket for the primary householder has the lowest median household income of $0, with 52 households (3.1%) in this group.
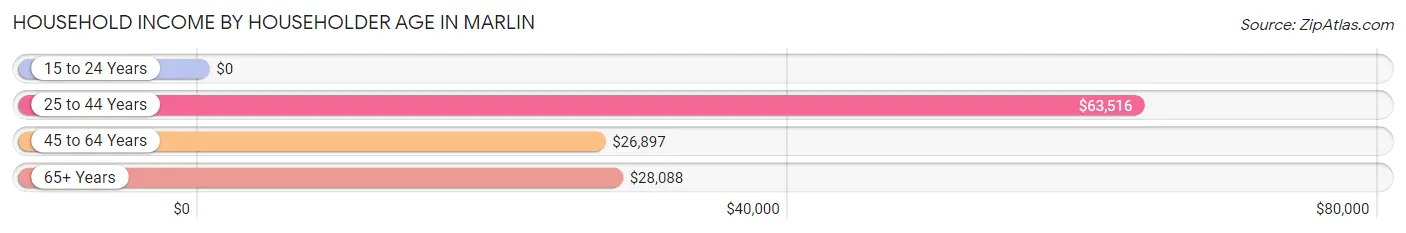
| Income Bracket | # Households | Median Income |
| 15 to 24 Years | 52 (3.1%) | $0 |
| 25 to 44 Years | 257 (15.5%) | $63,516 |
| 45 to 64 Years | 727 (43.9%) | $26,897 |
| 65+ Years | 622 (37.5%) | $28,088 |
| Total | 1,658 (100.0%) | $31,240 |
Poverty in Marlin
Income Below Poverty by Sex and Age in Marlin
With 28.0% poverty level for males and 14.4% for females among the residents of Marlin, 16 and 17 year old males and 75 year old and over females are the most vulnerable to poverty, with 8 males (57.1%) and 75 females (47.2%) in their respective age groups living below the poverty level.
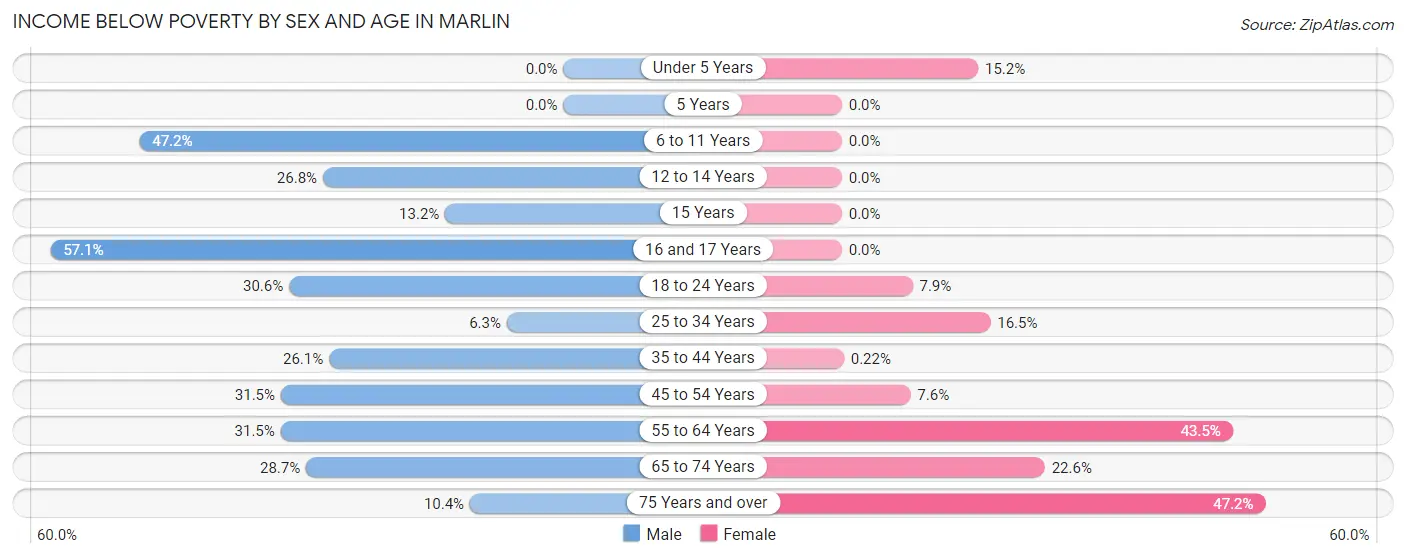
| Age Bracket | Male | Female |
| Under 5 Years | 0 (0.0%) | 22 (15.2%) |
| 5 Years | 0 (0.0%) | 0 (0.0%) |
| 6 to 11 Years | 170 (47.2%) | 0 (0.0%) |
| 12 to 14 Years | 49 (26.8%) | 0 (0.0%) |
| 15 Years | 15 (13.2%) | 0 (0.0%) |
| 16 and 17 Years | 8 (57.1%) | 0 (0.0%) |
| 18 to 24 Years | 194 (30.5%) | 13 (7.9%) |
| 25 to 34 Years | 16 (6.3%) | 21 (16.5%) |
| 35 to 44 Years | 24 (26.1%) | 1 (0.2%) |
| 45 to 54 Years | 95 (31.5%) | 21 (7.6%) |
| 55 to 64 Years | 91 (31.5%) | 101 (43.5%) |
| 65 to 74 Years | 45 (28.7%) | 66 (22.6%) |
| 75 Years and over | 18 (10.4%) | 75 (47.2%) |
| Total | 725 (28.0%) | 320 (14.4%) |
Income Above Poverty by Sex and Age in Marlin
According to the poverty statistics in Marlin, males aged under 5 years and females aged 6 to 11 years are the age groups that are most secure financially, with 100.0% of males and 100.0% of females in these age groups living above the poverty line.
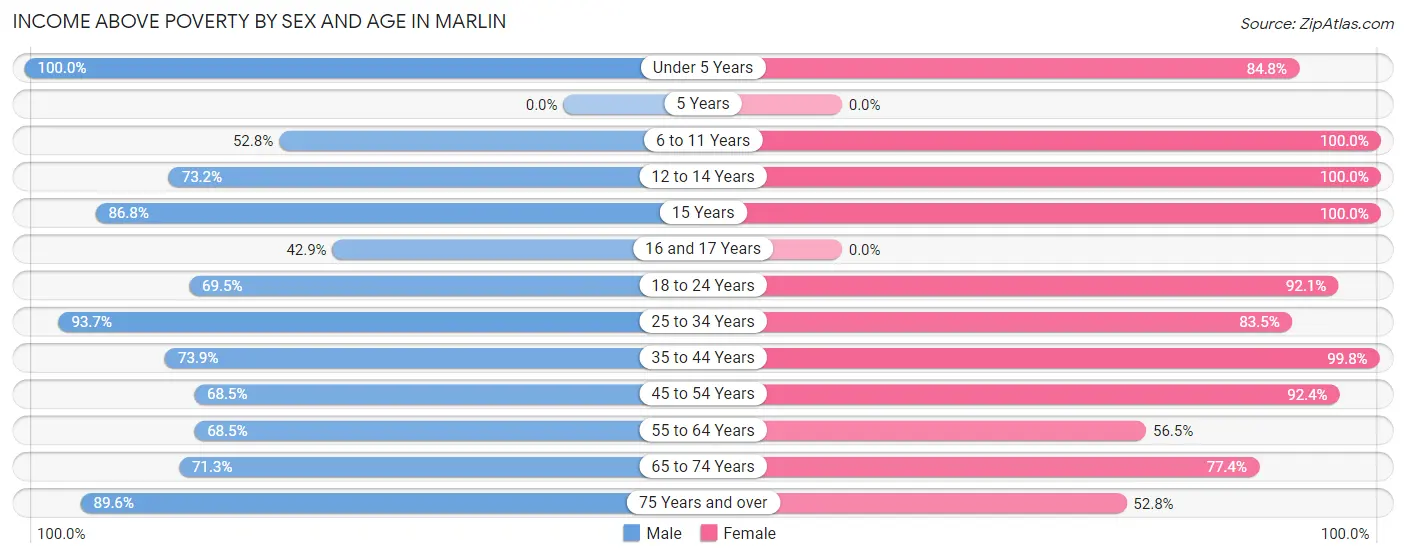
| Age Bracket | Male | Female |
| Under 5 Years | 17 (100.0%) | 123 (84.8%) |
| 5 Years | 0 (0.0%) | 0 (0.0%) |
| 6 to 11 Years | 190 (52.8%) | 174 (100.0%) |
| 12 to 14 Years | 134 (73.2%) | 139 (100.0%) |
| 15 Years | 99 (86.8%) | 64 (100.0%) |
| 16 and 17 Years | 6 (42.9%) | 0 (0.0%) |
| 18 to 24 Years | 441 (69.5%) | 152 (92.1%) |
| 25 to 34 Years | 238 (93.7%) | 106 (83.5%) |
| 35 to 44 Years | 68 (73.9%) | 453 (99.8%) |
| 45 to 54 Years | 207 (68.5%) | 254 (92.4%) |
| 55 to 64 Years | 198 (68.5%) | 131 (56.5%) |
| 65 to 74 Years | 112 (71.3%) | 226 (77.4%) |
| 75 Years and over | 155 (89.6%) | 84 (52.8%) |
| Total | 1,865 (72.0%) | 1,906 (85.6%) |
Income Below Poverty Among Married-Couple Families in Marlin
The poverty statistics for married-couple families in Marlin show that 5.0% or 24 of the total 484 families live below the poverty line. Families with no children have the highest poverty rate of 11.7%, comprising of 24 families. On the other hand, families with 1 or 2 children have the lowest poverty rate of 0.0%, which includes 0 families.
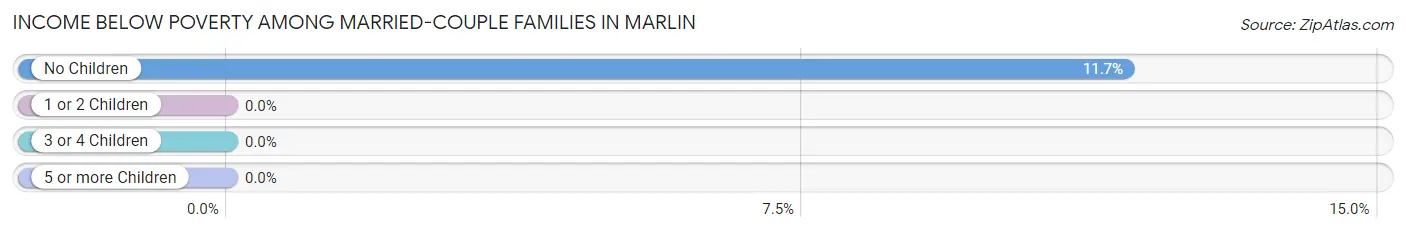
| Children | Above Poverty | Below Poverty |
| No Children | 181 (88.3%) | 24 (11.7%) |
| 1 or 2 Children | 76 (100.0%) | 0 (0.0%) |
| 3 or 4 Children | 0 (0.0%) | 0 (0.0%) |
| 5 or more Children | 203 (100.0%) | 0 (0.0%) |
| Total | 460 (95.0%) | 24 (5.0%) |
Income Below Poverty Among Single-Parent Households in Marlin
According to the poverty data in Marlin, 90.1% or 82 single-father households and 40.8% or 107 single-mother households are living below the poverty line. Among single-father households, those with 3 or 4 children have the highest poverty rate, with 12 households (100.0%) experiencing poverty. Likewise, among single-mother households, those with 3 or 4 children have the highest poverty rate, with 12 households (100.0%) falling below the poverty line.
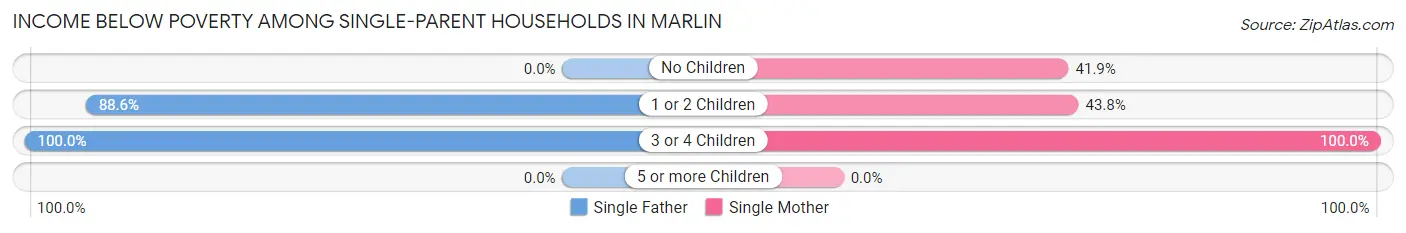
| Children | Single Father | Single Mother |
| No Children | 0 (0.0%) | 88 (41.9%) |
| 1 or 2 Children | 70 (88.6%) | 7 (43.8%) |
| 3 or 4 Children | 12 (100.0%) | 12 (100.0%) |
| 5 or more Children | 0 (0.0%) | 0 (0.0%) |
| Total | 82 (90.1%) | 107 (40.8%) |
Income Below Poverty Among Married-Couple vs Single-Parent Households in Marlin
The poverty data for Marlin shows that 24 of the married-couple family households (5.0%) and 189 of the single-parent households (53.5%) are living below the poverty level. Within the married-couple family households, those with no children have the highest poverty rate, with 24 households (11.7%) falling below the poverty line. Among the single-parent households, those with 3 or 4 children have the highest poverty rate, with 24 household (100.0%) living below poverty.
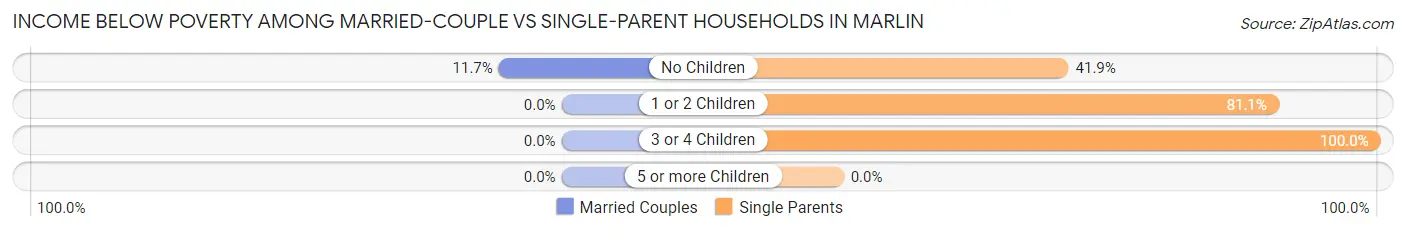
| Children | Married-Couple Families | Single-Parent Households |
| No Children | 24 (11.7%) | 88 (41.9%) |
| 1 or 2 Children | 0 (0.0%) | 77 (81.0%) |
| 3 or 4 Children | 0 (0.0%) | 24 (100.0%) |
| 5 or more Children | 0 (0.0%) | 0 (0.0%) |
| Total | 24 (5.0%) | 189 (53.5%) |
Race in Marlin
The most populous races in Marlin are Black / African American (2,343 | 42.8%), Hispanic or Latino (1,773 | 32.4%), and White / Caucasian (1,373 | 25.1%).
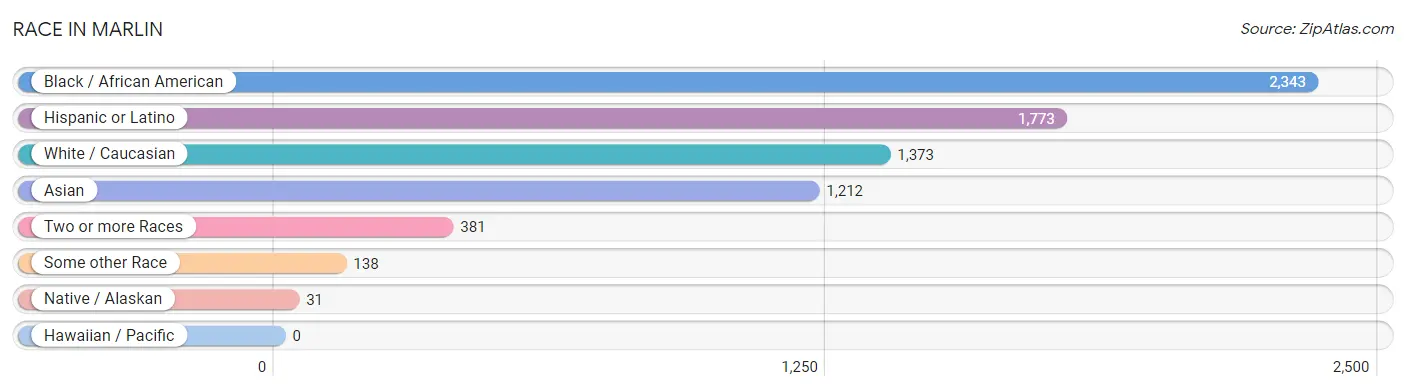
| Race | # Population | % Population |
| Asian | 1,212 | 22.1% |
| Black / African American | 2,343 | 42.8% |
| Hawaiian / Pacific | 0 | 0.0% |
| Hispanic or Latino | 1,773 | 32.4% |
| Native / Alaskan | 31 | 0.6% |
| White / Caucasian | 1,373 | 25.1% |
| Two or more Races | 381 | 7.0% |
| Some other Race | 138 | 2.5% |
| Total | 5,478 | 100.0% |
Ancestry in Marlin
The most populous ancestries reported in Marlin are Mexican (1,762 | 32.2%), Japanese (1,212 | 22.1%), German (228 | 4.2%), English (141 | 2.6%), and Irish (121 | 2.2%), together accounting for 63.2% of all Marlin residents.
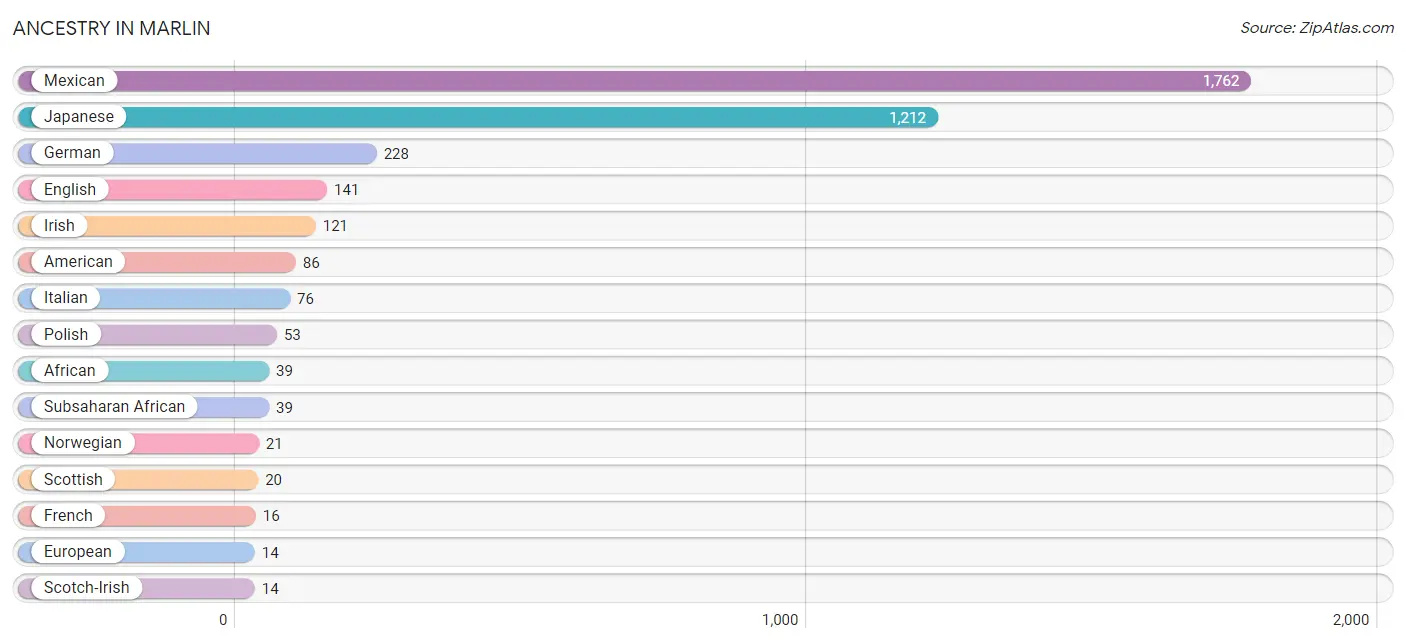
| Ancestry | # Population | % Population |
| African | 39 | 0.7% |
| American | 86 | 1.6% |
| Austrian | 11 | 0.2% |
| Central American | 11 | 0.2% |
| Czech | 12 | 0.2% |
| Czechoslovakian | 8 | 0.2% |
| Danish | 12 | 0.2% |
| Dutch | 12 | 0.2% |
| English | 141 | 2.6% |
| European | 14 | 0.3% |
| French | 16 | 0.3% |
| German | 228 | 4.2% |
| Honduran | 11 | 0.2% |
| Irish | 121 | 2.2% |
| Italian | 76 | 1.4% |
| Japanese | 1,212 | 22.1% |
| Mexican | 1,762 | 32.2% |
| Norwegian | 21 | 0.4% |
| Polish | 53 | 1.0% |
| Russian | 11 | 0.2% |
| Scandinavian | 10 | 0.2% |
| Scotch-Irish | 14 | 0.3% |
| Scottish | 20 | 0.4% |
| Slovak | 7 | 0.1% |
| Subsaharan African | 39 | 0.7% |
| Swedish | 10 | 0.2% |
| Swiss | 12 | 0.2% |
| Ukrainian | 11 | 0.2% | View All 28 Rows |
Immigrants in Marlin
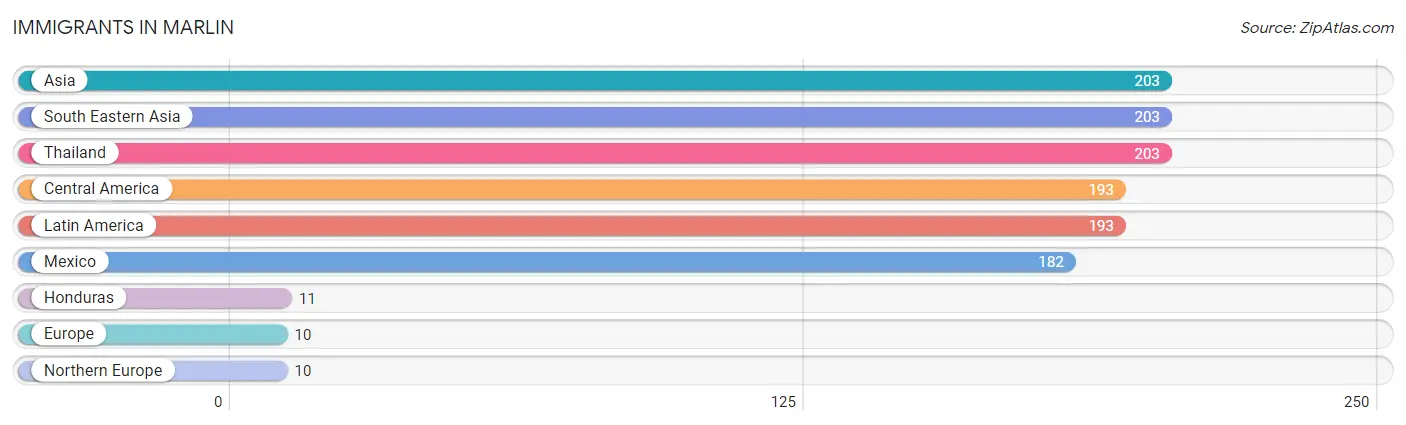
The most numerous immigrant groups reported in Marlin came from Asia (203 | 3.7%), South Eastern Asia (203 | 3.7%), Thailand (203 | 3.7%), Central America (193 | 3.5%), and Latin America (193 | 3.5%), together accounting for 18.2% of all Marlin residents.
| Immigration Origin | # Population | % Population |
| Asia | 203 | 3.7% |
| Central America | 193 | 3.5% |
| Europe | 10 | 0.2% |
| Honduras | 11 | 0.2% |
| Latin America | 193 | 3.5% |
| Mexico | 182 | 3.3% |
| Northern Europe | 10 | 0.2% |
| South Eastern Asia | 203 | 3.7% |
| Thailand | 203 | 3.7% | View All 9 Rows |
Sex and Age in Marlin
Sex and Age in Marlin
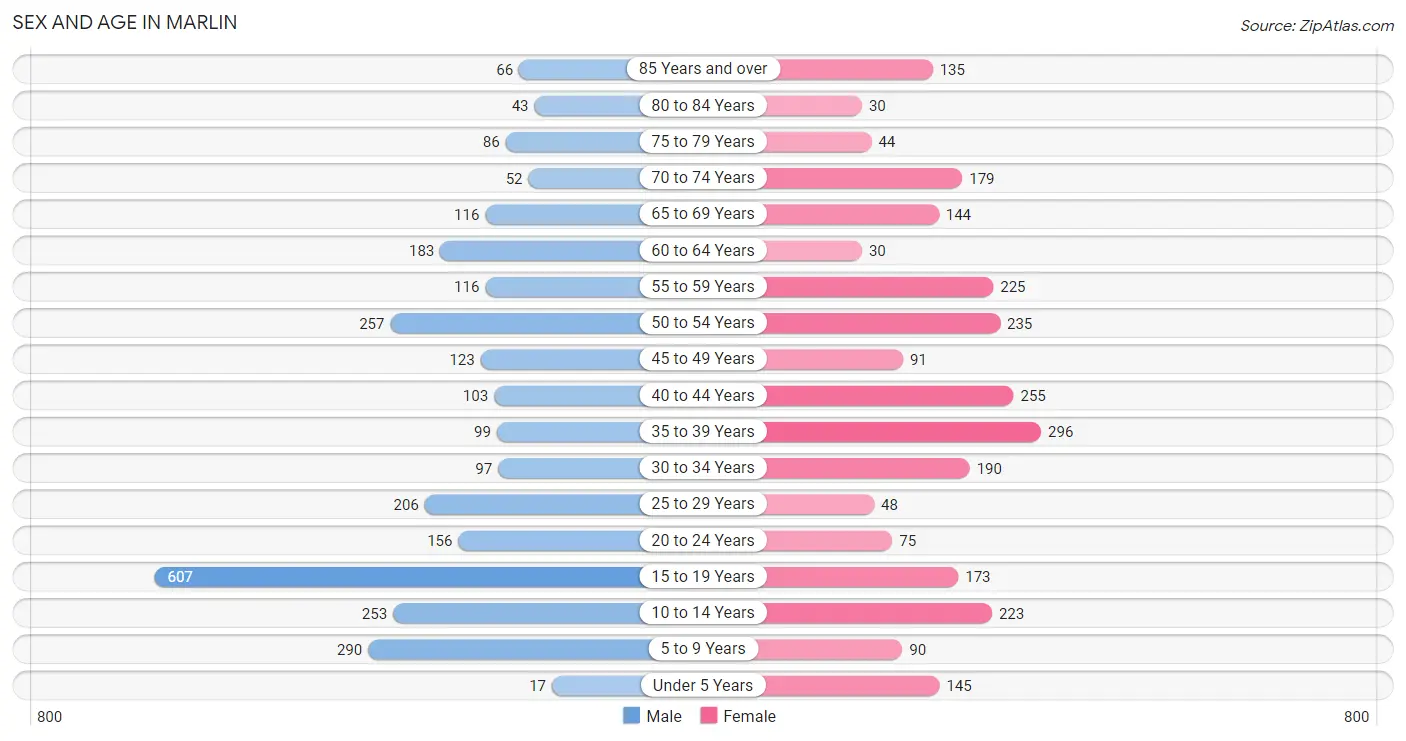
The most populous age groups in Marlin are 15 to 19 Years (607 | 21.1%) for men and 35 to 39 Years (296 | 11.4%) for women.
| Age Bracket | Male | Female |
| Under 5 Years | 17 (0.6%) | 145 (5.6%) |
| 5 to 9 Years | 290 (10.1%) | 90 (3.5%) |
| 10 to 14 Years | 253 (8.8%) | 223 (8.6%) |
| 15 to 19 Years | 607 (21.1%) | 173 (6.6%) |
| 20 to 24 Years | 156 (5.4%) | 75 (2.9%) |
| 25 to 29 Years | 206 (7.2%) | 48 (1.8%) |
| 30 to 34 Years | 97 (3.4%) | 190 (7.3%) |
| 35 to 39 Years | 99 (3.5%) | 296 (11.4%) |
| 40 to 44 Years | 103 (3.6%) | 255 (9.8%) |
| 45 to 49 Years | 123 (4.3%) | 91 (3.5%) |
| 50 to 54 Years | 257 (8.9%) | 235 (9.0%) |
| 55 to 59 Years | 116 (4.0%) | 225 (8.6%) |
| 60 to 64 Years | 183 (6.4%) | 30 (1.1%) |
| 65 to 69 Years | 116 (4.0%) | 144 (5.5%) |
| 70 to 74 Years | 52 (1.8%) | 179 (6.9%) |
| 75 to 79 Years | 86 (3.0%) | 44 (1.7%) |
| 80 to 84 Years | 43 (1.5%) | 30 (1.1%) |
| 85 Years and over | 66 (2.3%) | 135 (5.2%) |
| Total | 2,870 (100.0%) | 2,608 (100.0%) |
Families and Households in Marlin
Median Family Size in Marlin
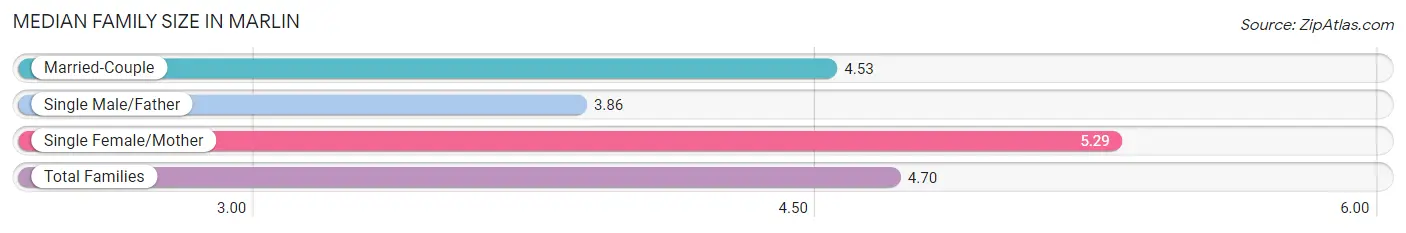
The median family size in Marlin is 4.70 persons per family, with single female/mother families (262 | 31.3%) accounting for the largest median family size of 5.29 persons per family. On the other hand, single male/father families (91 | 10.9%) represent the smallest median family size with 3.86 persons per family.
| Family Type | # Families | Family Size |
| Married-Couple | 484 (57.8%) | 4.53 |
| Single Male/Father | 91 (10.9%) | 3.86 |
| Single Female/Mother | 262 (31.3%) | 5.29 |
| Total Families | 837 (100.0%) | 4.70 |
Median Household Size in Marlin
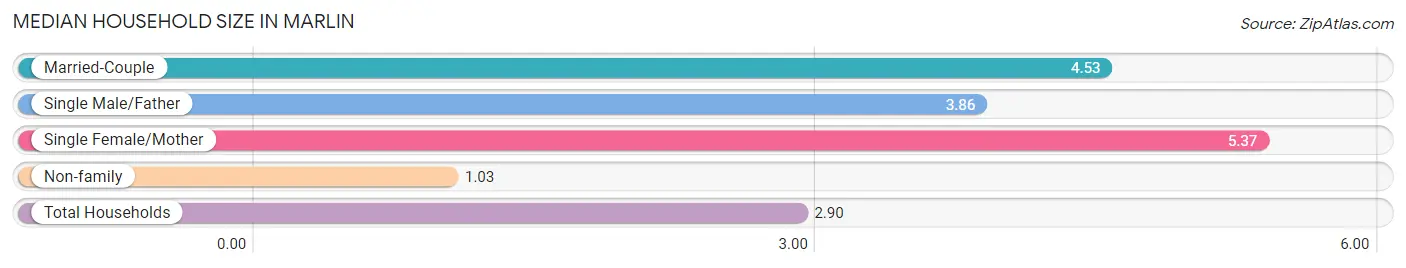
The median household size in Marlin is 2.90 persons per household, with single female/mother households (262 | 15.8%) accounting for the largest median household size of 5.37 persons per household. non-family households (821 | 49.5%) represent the smallest median household size with 1.03 persons per household.
| Household Type | # Households | Household Size |
| Married-Couple | 484 (29.2%) | 4.53 |
| Single Male/Father | 91 (5.5%) | 3.86 |
| Single Female/Mother | 262 (15.8%) | 5.37 |
| Non-family | 821 (49.5%) | 1.03 |
| Total Households | 1,658 (100.0%) | 2.90 |
Household Size by Marriage Status in Marlin
Out of a total of 1,658 households in Marlin, 837 (50.5%) are family households, while 821 (49.5%) are nonfamily households. The most numerous type of family households are 2-person households, comprising 402, and the most common type of nonfamily households are 1-person households, comprising 786.
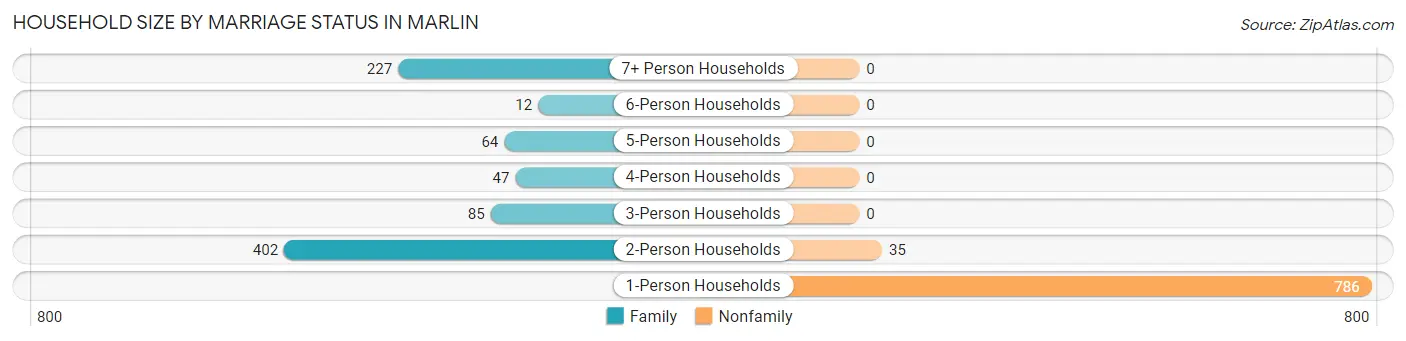
| Household Size | Family Households | Nonfamily Households |
| 1-Person Households | - | 786 (47.4%) |
| 2-Person Households | 402 (24.2%) | 35 (2.1%) |
| 3-Person Households | 85 (5.1%) | 0 (0.0%) |
| 4-Person Households | 47 (2.8%) | 0 (0.0%) |
| 5-Person Households | 64 (3.9%) | 0 (0.0%) |
| 6-Person Households | 12 (0.7%) | 0 (0.0%) |
| 7+ Person Households | 227 (13.7%) | 0 (0.0%) |
| Total | 837 (50.5%) | 821 (49.5%) |
Female Fertility in Marlin
Fertility by Age in Marlin
Average fertility rate in Marlin is 243.0 births per 1,000 women. Women in the age bracket of 35 to 50 years have the highest fertility rate with 302.0 births per 1,000 women. Women in the age bracket of 35 to 50 years acount for 72.2% of all women with births.
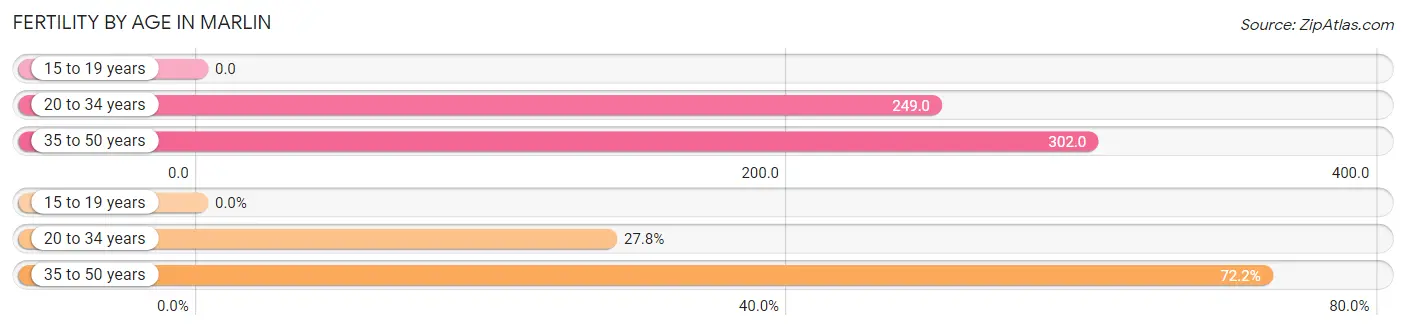
| Age Bracket | Women with Births | Births / 1,000 Women |
| 15 to 19 years | 0 (0.0%) | 0.0 |
| 20 to 34 years | 78 (27.8%) | 249.0 |
| 35 to 50 years | 203 (72.2%) | 302.0 |
| Total | 281 (100.0%) | 243.0 |
Fertility by Age by Marriage Status in Marlin
95.7% of women with births (281) in Marlin are married. The highest percentage of unmarried women with births falls into 20 to 34 years age bracket with 15.4% of them unmarried at the time of birth, while the lowest percentage of unmarried women with births belong to 35 to 50 years age bracket with 0.0% of them unmarried.
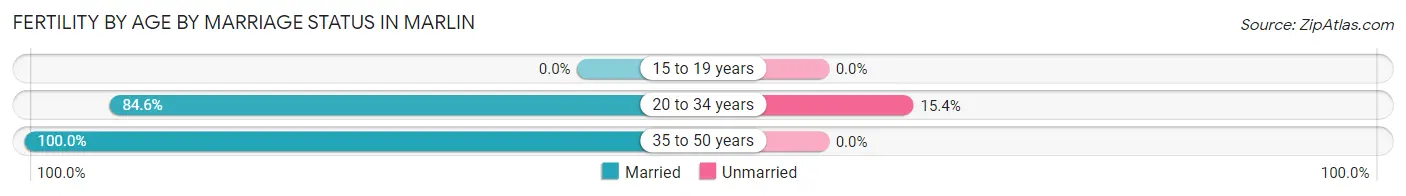
| Age Bracket | Married | Unmarried |
| 15 to 19 years | 0 (0.0%) | 0 (0.0%) |
| 20 to 34 years | 66 (84.6%) | 12 (15.4%) |
| 35 to 50 years | 203 (100.0%) | 0 (0.0%) |
| Total | 269 (95.7%) | 12 (4.3%) |
Fertility by Education in Marlin
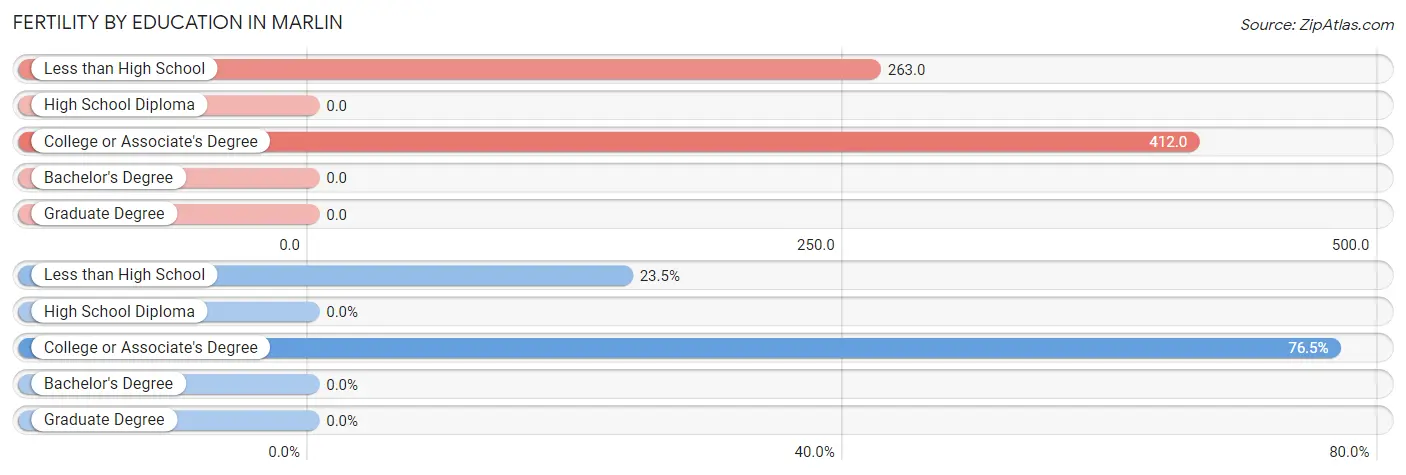
| Educational Attainment | Women with Births | Births / 1,000 Women |
| Less than High School | 66 (23.5%) | 263.0 |
| High School Diploma | 0 (0.0%) | 0.0 |
| College or Associate's Degree | 215 (76.5%) | 412.0 |
| Bachelor's Degree | 0 (0.0%) | 0.0 |
| Graduate Degree | 0 (0.0%) | 0.0 |
| Total | 281 (100.0%) | 243.0 |
Fertility by Education by Marriage Status in Marlin
4.3% of women with births in Marlin are unmarried. Women with the educational attainment of less than high school are most likely to be married with 100.0% of them married at childbirth, while women with the educational attainment of college or associate's degree are least likely to be married with 5.6% of them unmarried at childbirth.
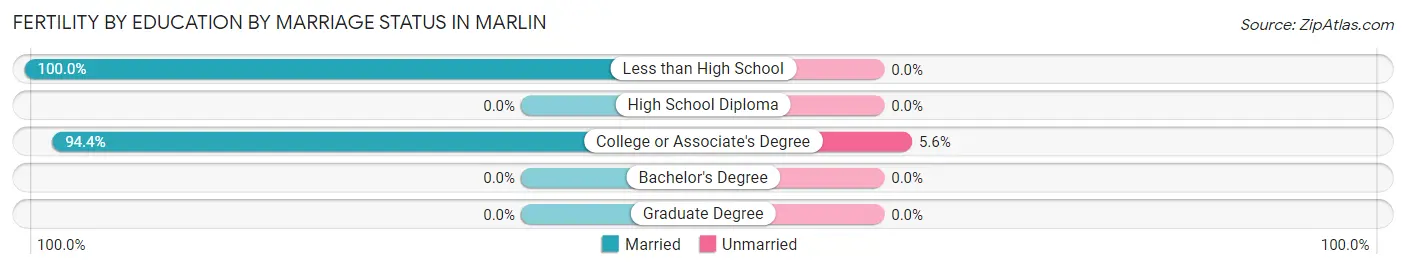
| Educational Attainment | Married | Unmarried |
| Less than High School | 66 (100.0%) | 0 (0.0%) |
| High School Diploma | 0 (0.0%) | 0 (0.0%) |
| College or Associate's Degree | 203 (94.4%) | 12 (5.6%) |
| Bachelor's Degree | 0 (0.0%) | 0 (0.0%) |
| Graduate Degree | 0 (0.0%) | 0 (0.0%) |
| Total | 269 (95.7%) | 12 (4.3%) |
Employment Characteristics in Marlin
Employment by Class of Employer in Marlin
Among the 1,831 employed individuals in Marlin, private company employees (595 | 32.5%), self-employed (not incorporated) (427 | 23.3%), and not-for-profit organizations (427 | 23.3%) make up the most common classes of employment.
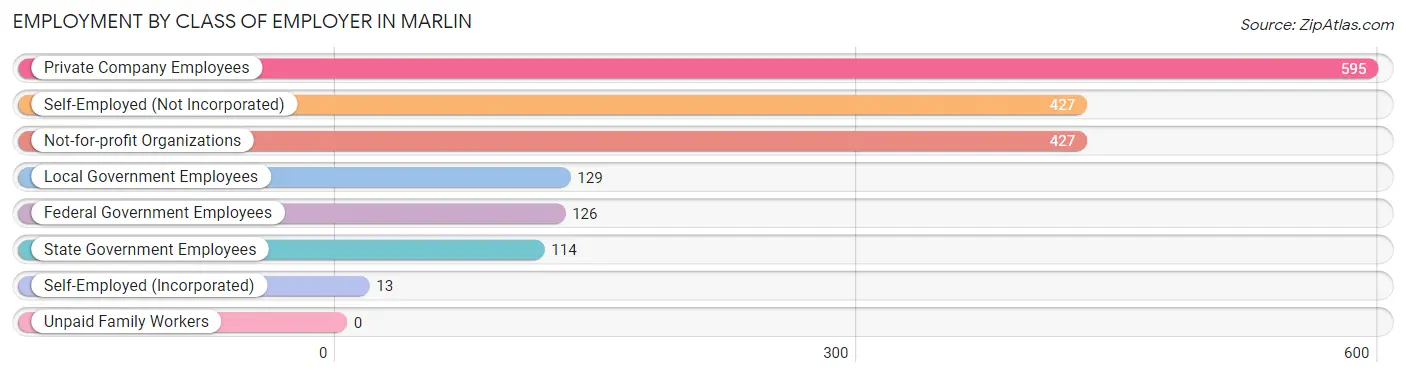
| Employer Class | # Employees | % Employees |
| Private Company Employees | 595 | 32.5% |
| Self-Employed (Incorporated) | 13 | 0.7% |
| Self-Employed (Not Incorporated) | 427 | 23.3% |
| Not-for-profit Organizations | 427 | 23.3% |
| Local Government Employees | 129 | 7.0% |
| State Government Employees | 114 | 6.2% |
| Federal Government Employees | 126 | 6.9% |
| Unpaid Family Workers | 0 | 0.0% |
| Total | 1,831 | 100.0% |
Employment Status by Age in Marlin
According to the labor force statistics for Marlin, out of the total population over 16 years of age (4,282), 49.9% or 2,137 individuals are in the labor force, with 13.9% or 297 of them unemployed. The age group with the highest labor force participation rate is 25 to 29 years, with 77.6% or 197 individuals in the labor force. Within the labor force, the 25 to 29 years age range has the highest percentage of unemployed individuals, with 87.3% or 172 of them being unemployed.
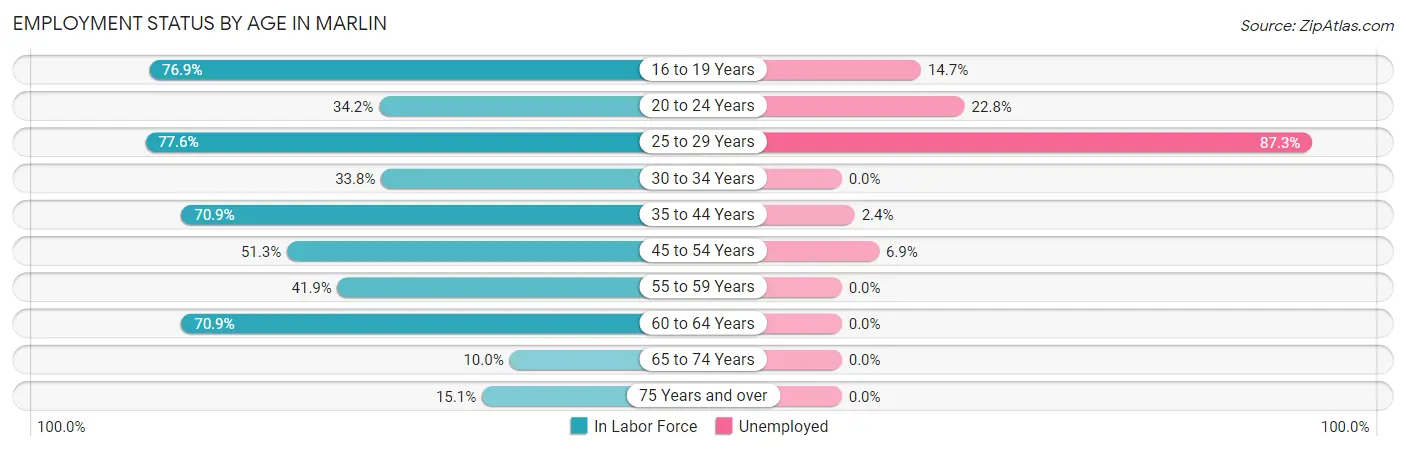
| Age Bracket | In Labor Force | Unemployed |
| 16 to 19 Years | 463 (76.9%) | 68 (14.7%) |
| 20 to 24 Years | 79 (34.2%) | 18 (22.8%) |
| 25 to 29 Years | 197 (77.6%) | 172 (87.3%) |
| 30 to 34 Years | 97 (33.8%) | 0 (0.0%) |
| 35 to 44 Years | 534 (70.9%) | 13 (2.4%) |
| 45 to 54 Years | 362 (51.3%) | 25 (6.9%) |
| 55 to 59 Years | 143 (41.9%) | 0 (0.0%) |
| 60 to 64 Years | 151 (70.9%) | 0 (0.0%) |
| 65 to 74 Years | 49 (10.0%) | 0 (0.0%) |
| 75 Years and over | 61 (15.1%) | 0 (0.0%) |
| Total | 2,137 (49.9%) | 297 (13.9%) |
Employment Status by Educational Attainment in Marlin
According to labor force statistics for Marlin, 58.1% of individuals (1,484) out of the total population between 25 and 64 years of age (2,554) are in the labor force, with 14.2% or 211 of them being unemployed. The group with the highest labor force participation rate are those with the educational attainment of bachelor's degree or higher, with 95.2% or 198 individuals in the labor force. Within the labor force, individuals with bachelor's degree or higher education have the highest percentage of unemployment, with 19.2% or 38 of them being unemployed.
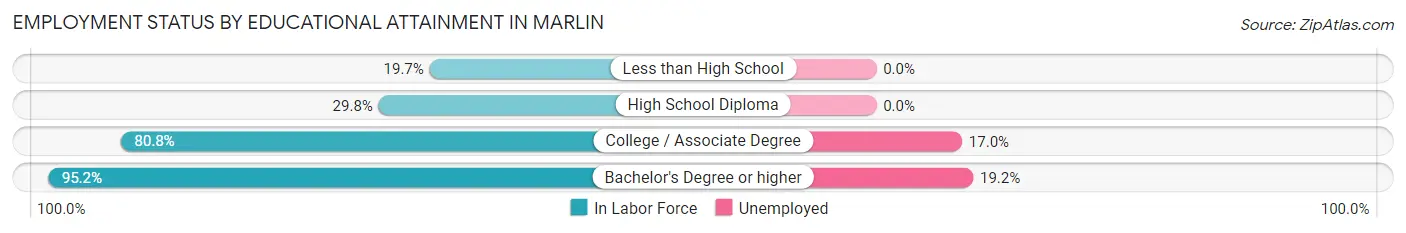
| Educational Attainment | In Labor Force | Unemployed |
| Less than High School | 97 (19.7%) | 0 (0.0%) |
| High School Diploma | 180 (29.8%) | 0 (0.0%) |
| College / Associate Degree | 1,009 (80.8%) | 212 (17.0%) |
| Bachelor's Degree or higher | 198 (95.2%) | 40 (19.2%) |
| Total | 1,484 (58.1%) | 363 (14.2%) |
Employment Occupations by Sex in Marlin
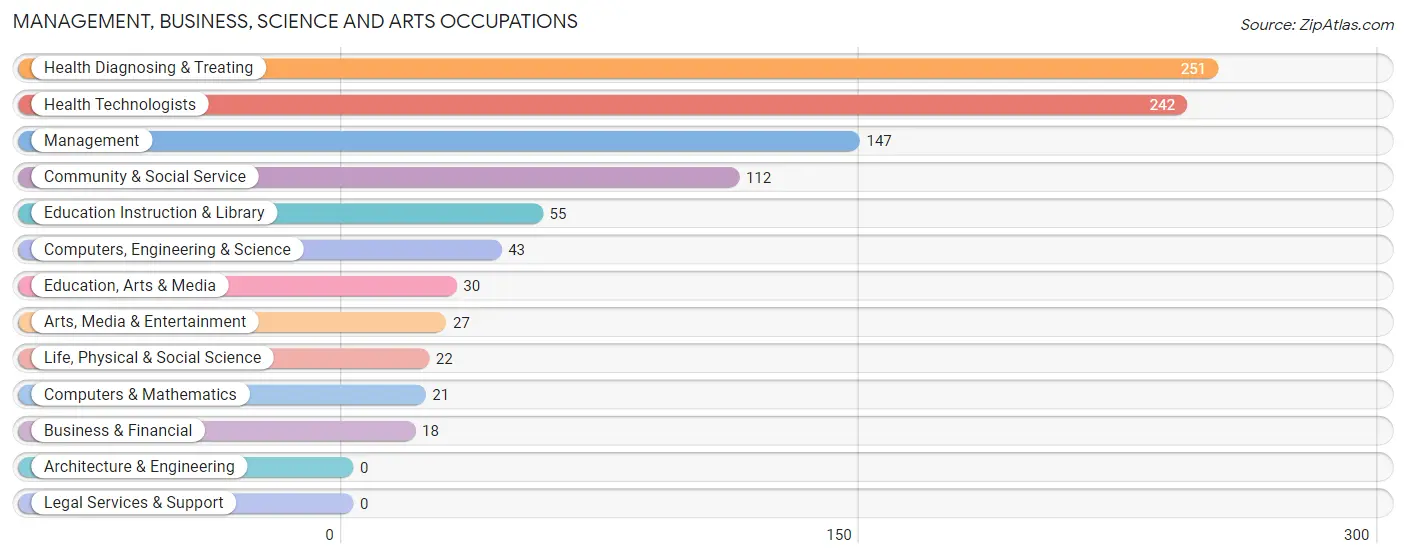
Management, Business, Science and Arts Occupations
The most common Management, Business, Science and Arts occupations in Marlin are Health Diagnosing & Treating (251 | 13.6%), Health Technologists (242 | 13.2%), Management (147 | 8.0%), Community & Social Service (112 | 6.1%), and Education Instruction & Library (55 | 3.0%).
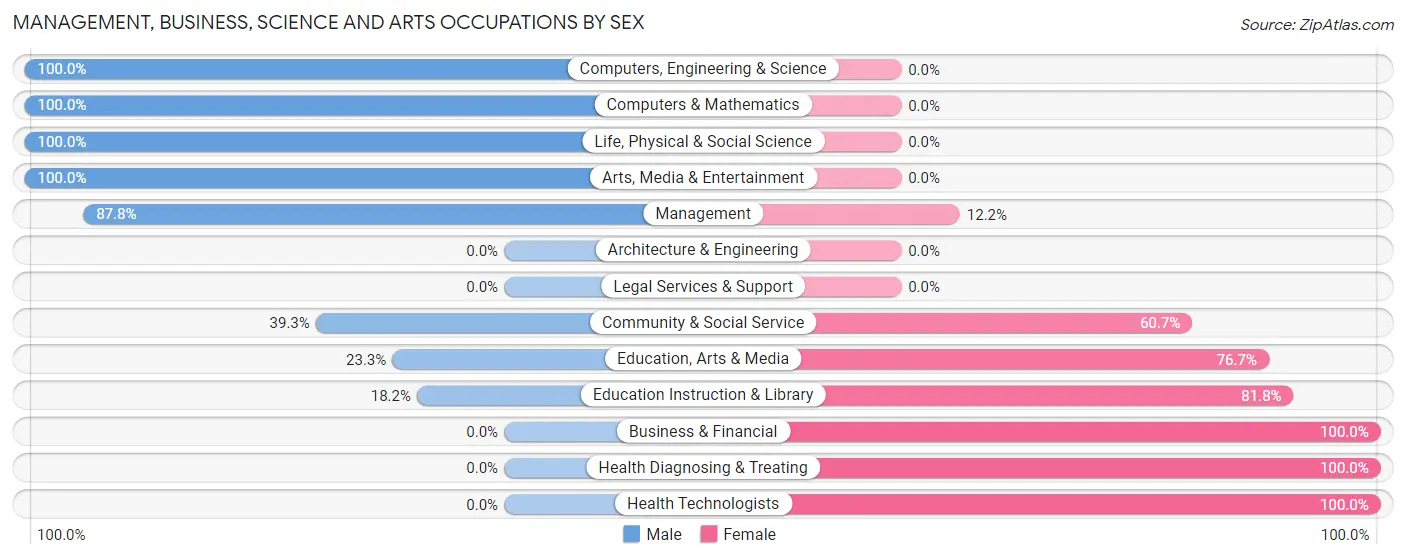
Management, Business, Science and Arts Occupations by Sex
Within the Management, Business, Science and Arts occupations in Marlin, the most male-oriented occupations are Computers, Engineering & Science (100.0%), Computers & Mathematics (100.0%), and Life, Physical & Social Science (100.0%), while the most female-oriented occupations are Business & Financial (100.0%), Health Diagnosing & Treating (100.0%), and Health Technologists (100.0%).
| Occupation | Male | Female |
| Management | 129 (87.8%) | 18 (12.2%) |
| Business & Financial | 0 (0.0%) | 18 (100.0%) |
| Computers, Engineering & Science | 43 (100.0%) | 0 (0.0%) |
| Computers & Mathematics | 21 (100.0%) | 0 (0.0%) |
| Architecture & Engineering | 0 (0.0%) | 0 (0.0%) |
| Life, Physical & Social Science | 22 (100.0%) | 0 (0.0%) |
| Community & Social Service | 44 (39.3%) | 68 (60.7%) |
| Education, Arts & Media | 7 (23.3%) | 23 (76.7%) |
| Legal Services & Support | 0 (0.0%) | 0 (0.0%) |
| Education Instruction & Library | 10 (18.2%) | 45 (81.8%) |
| Arts, Media & Entertainment | 27 (100.0%) | 0 (0.0%) |
| Health Diagnosing & Treating | 0 (0.0%) | 251 (100.0%) |
| Health Technologists | 0 (0.0%) | 242 (100.0%) |
| Total (Category) | 216 (37.8%) | 355 (62.2%) |
| Total (Overall) | 914 (49.7%) | 926 (50.3%) |
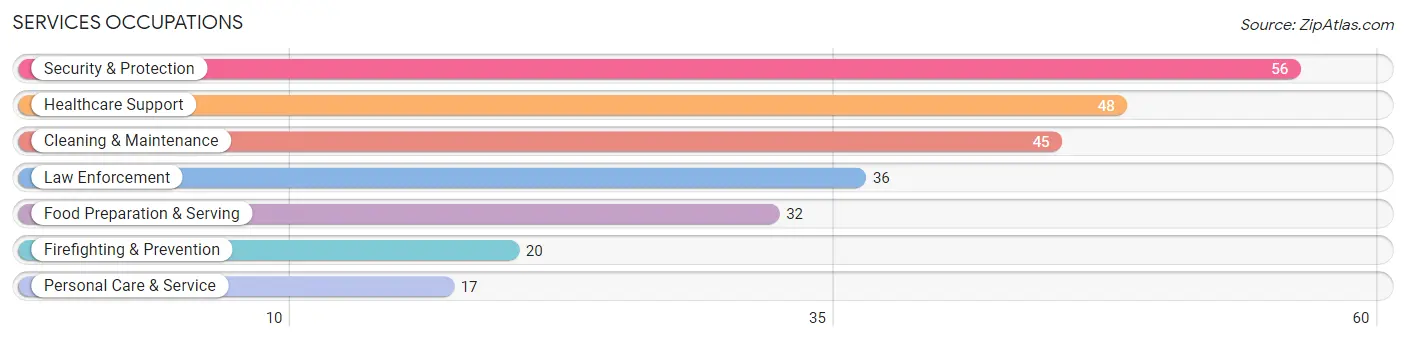
Services Occupations
The most common Services occupations in Marlin are Security & Protection (56 | 3.0%), Healthcare Support (48 | 2.6%), Cleaning & Maintenance (45 | 2.5%), Law Enforcement (36 | 2.0%), and Food Preparation & Serving (32 | 1.7%).
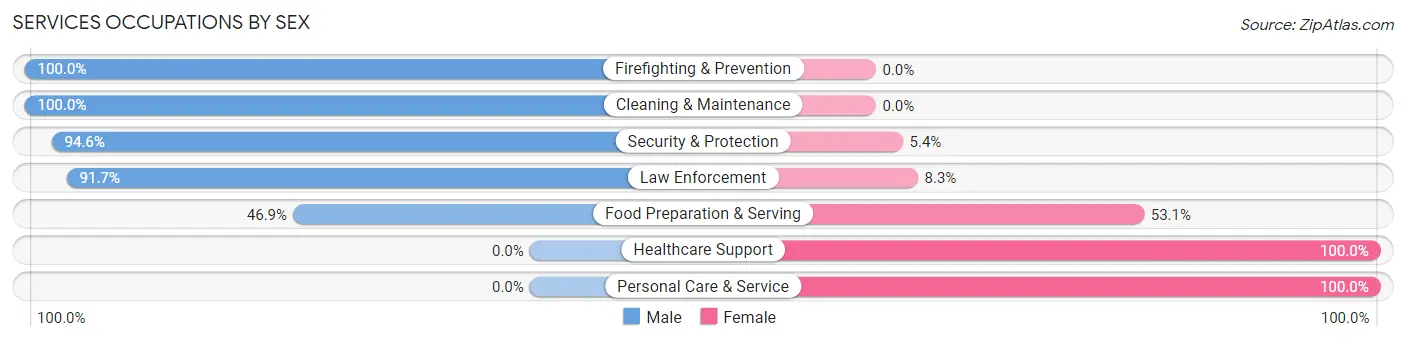
Services Occupations by Sex
Within the Services occupations in Marlin, the most male-oriented occupations are Firefighting & Prevention (100.0%), Cleaning & Maintenance (100.0%), and Security & Protection (94.6%), while the most female-oriented occupations are Healthcare Support (100.0%), Personal Care & Service (100.0%), and Food Preparation & Serving (53.1%).
| Occupation | Male | Female |
| Healthcare Support | 0 (0.0%) | 48 (100.0%) |
| Security & Protection | 53 (94.6%) | 3 (5.4%) |
| Firefighting & Prevention | 20 (100.0%) | 0 (0.0%) |
| Law Enforcement | 33 (91.7%) | 3 (8.3%) |
| Food Preparation & Serving | 15 (46.9%) | 17 (53.1%) |
| Cleaning & Maintenance | 45 (100.0%) | 0 (0.0%) |
| Personal Care & Service | 0 (0.0%) | 17 (100.0%) |
| Total (Category) | 113 (57.1%) | 85 (42.9%) |
| Total (Overall) | 914 (49.7%) | 926 (50.3%) |
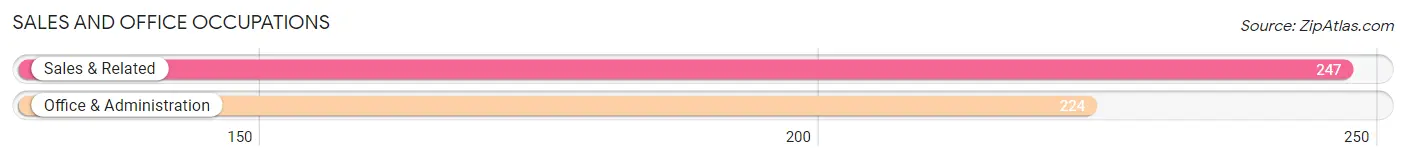
Sales and Office Occupations
The most common Sales and Office occupations in Marlin are Sales & Related (247 | 13.4%), and Office & Administration (224 | 12.2%).
Sales and Office Occupations by Sex
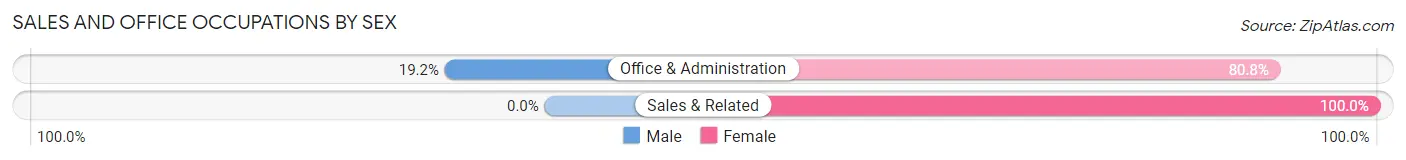
| Occupation | Male | Female |
| Sales & Related | 0 (0.0%) | 247 (100.0%) |
| Office & Administration | 43 (19.2%) | 181 (80.8%) |
| Total (Category) | 43 (9.1%) | 428 (90.9%) |
| Total (Overall) | 914 (49.7%) | 926 (50.3%) |
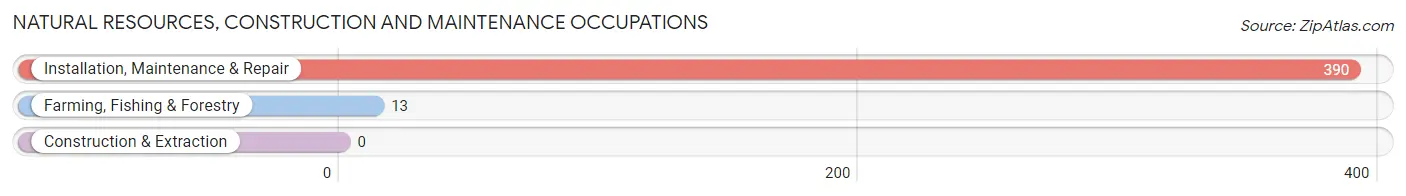
Natural Resources, Construction and Maintenance Occupations
The most common Natural Resources, Construction and Maintenance occupations in Marlin are Installation, Maintenance & Repair (390 | 21.2%), and Farming, Fishing & Forestry (13 | 0.7%).
Natural Resources, Construction and Maintenance Occupations by Sex
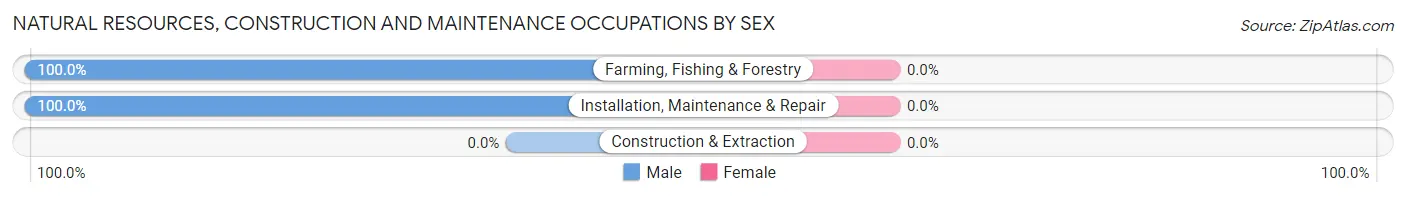
| Occupation | Male | Female |
| Farming, Fishing & Forestry | 13 (100.0%) | 0 (0.0%) |
| Construction & Extraction | 0 (0.0%) | 0 (0.0%) |
| Installation, Maintenance & Repair | 390 (100.0%) | 0 (0.0%) |
| Total (Category) | 403 (100.0%) | 0 (0.0%) |
| Total (Overall) | 914 (49.7%) | 926 (50.3%) |
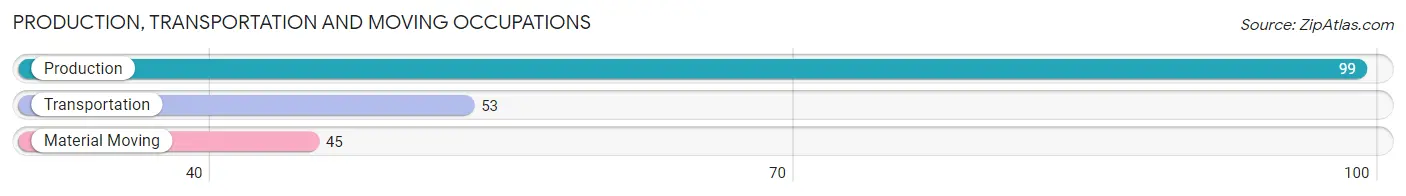
Production, Transportation and Moving Occupations
The most common Production, Transportation and Moving occupations in Marlin are Production (99 | 5.4%), Transportation (53 | 2.9%), and Material Moving (45 | 2.5%).
Production, Transportation and Moving Occupations by Sex
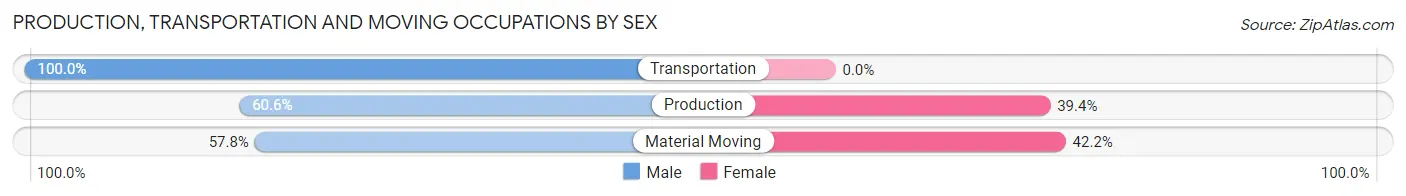
| Occupation | Male | Female |
| Production | 60 (60.6%) | 39 (39.4%) |
| Transportation | 53 (100.0%) | 0 (0.0%) |
| Material Moving | 26 (57.8%) | 19 (42.2%) |
| Total (Category) | 139 (70.6%) | 58 (29.4%) |
| Total (Overall) | 914 (49.7%) | 926 (50.3%) |
Employment Industries by Sex in Marlin
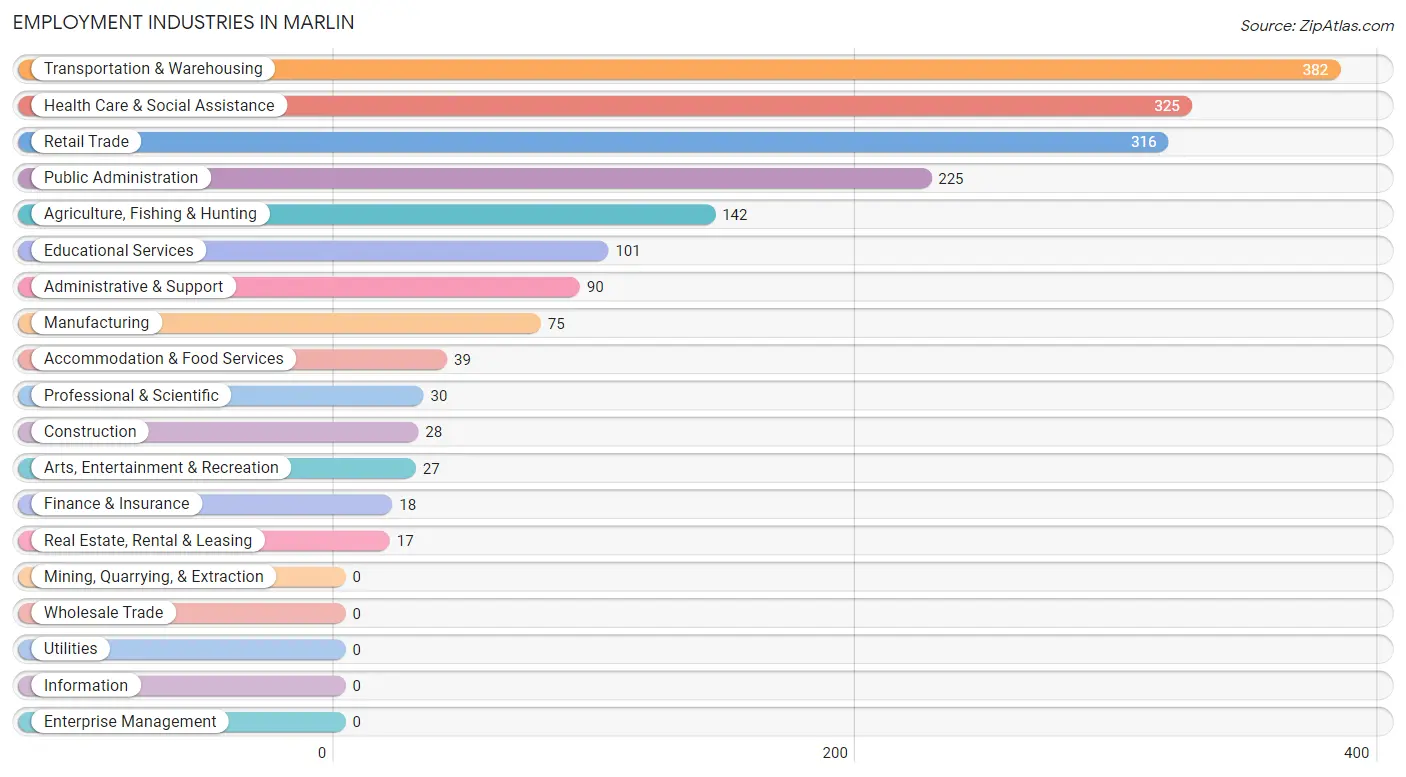
Employment Industries in Marlin
The major employment industries in Marlin include Transportation & Warehousing (382 | 20.8%), Health Care & Social Assistance (325 | 17.7%), Retail Trade (316 | 17.2%), Public Administration (225 | 12.2%), and Agriculture, Fishing & Hunting (142 | 7.7%).
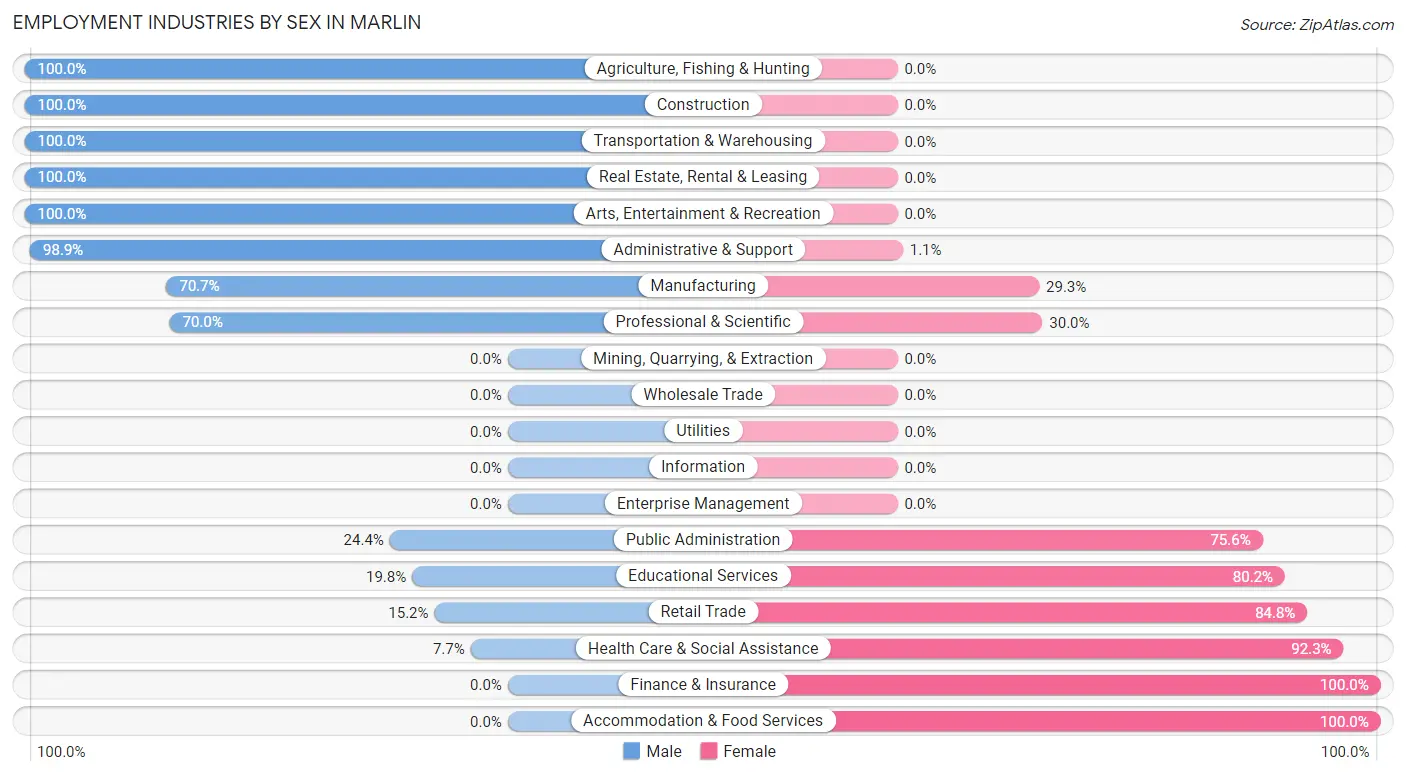
Employment Industries by Sex in Marlin
The Marlin industries that see more men than women are Agriculture, Fishing & Hunting (100.0%), Construction (100.0%), and Transportation & Warehousing (100.0%), whereas the industries that tend to have a higher number of women are Finance & Insurance (100.0%), Accommodation & Food Services (100.0%), and Health Care & Social Assistance (92.3%).
| Industry | Male | Female |
| Agriculture, Fishing & Hunting | 142 (100.0%) | 0 (0.0%) |
| Mining, Quarrying, & Extraction | 0 (0.0%) | 0 (0.0%) |
| Construction | 28 (100.0%) | 0 (0.0%) |
| Manufacturing | 53 (70.7%) | 22 (29.3%) |
| Wholesale Trade | 0 (0.0%) | 0 (0.0%) |
| Retail Trade | 48 (15.2%) | 268 (84.8%) |
| Transportation & Warehousing | 382 (100.0%) | 0 (0.0%) |
| Utilities | 0 (0.0%) | 0 (0.0%) |
| Information | 0 (0.0%) | 0 (0.0%) |
| Finance & Insurance | 0 (0.0%) | 18 (100.0%) |
| Real Estate, Rental & Leasing | 17 (100.0%) | 0 (0.0%) |
| Professional & Scientific | 21 (70.0%) | 9 (30.0%) |
| Enterprise Management | 0 (0.0%) | 0 (0.0%) |
| Administrative & Support | 89 (98.9%) | 1 (1.1%) |
| Educational Services | 20 (19.8%) | 81 (80.2%) |
| Health Care & Social Assistance | 25 (7.7%) | 300 (92.3%) |
| Arts, Entertainment & Recreation | 27 (100.0%) | 0 (0.0%) |
| Accommodation & Food Services | 0 (0.0%) | 39 (100.0%) |
| Public Administration | 55 (24.4%) | 170 (75.6%) |
| Total | 914 (49.7%) | 926 (50.3%) |
Education in Marlin
School Enrollment in Marlin
The most common levels of schooling among the 1,344 students in Marlin are high school (667 | 49.6%), elementary school (242 | 18.0%), and middle school (212 | 15.8%).
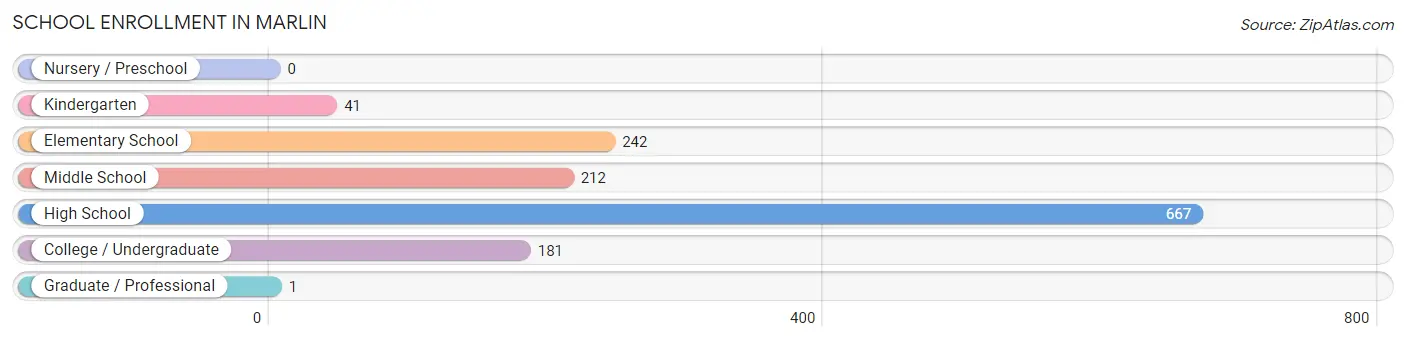
| School Level | # Students | % Students |
| Nursery / Preschool | 0 | 0.0% |
| Kindergarten | 41 | 3.0% |
| Elementary School | 242 | 18.0% |
| Middle School | 212 | 15.8% |
| High School | 667 | 49.6% |
| College / Undergraduate | 181 | 13.5% |
| Graduate / Professional | 1 | 0.1% |
| Total | 1,344 | 100.0% |
School Enrollment by Age by Funding Source in Marlin
Out of a total of 1,344 students who are enrolled in schools in Marlin, 19 (1.4%) attend a private institution, while the remaining 1,325 (98.6%) are enrolled in public schools. The age group of 10 to 14 year olds has the highest likelihood of being enrolled in private schools, with 19 (9.0% in the age bracket) enrolled. Conversely, the age group of 5 to 9 year old has the lowest likelihood of being enrolled in a private school, with 283 (100.0% in the age bracket) attending a public institution.
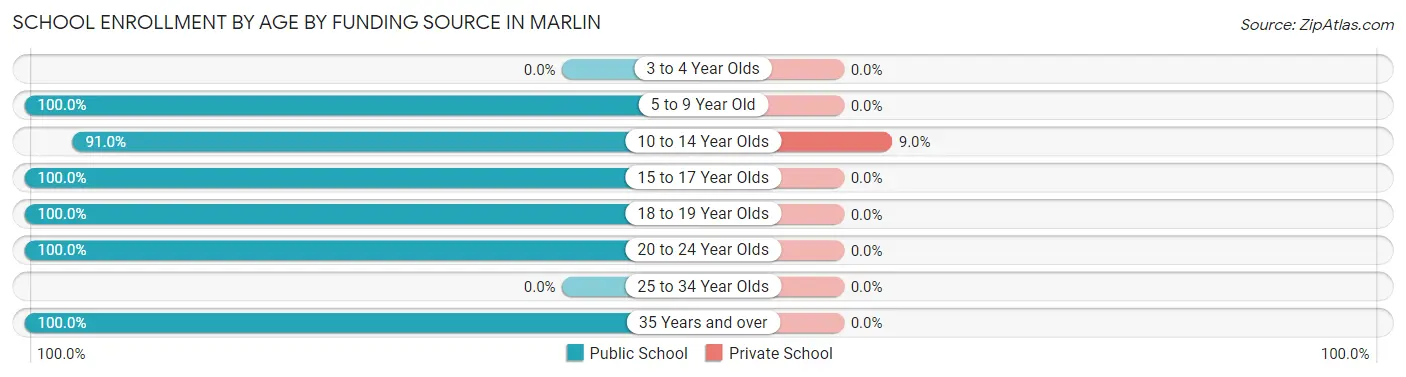
| Age Bracket | Public School | Private School |
| 3 to 4 Year Olds | 0 (0.0%) | 0 (0.0%) |
| 5 to 9 Year Old | 283 (100.0%) | 0 (0.0%) |
| 10 to 14 Year Olds | 193 (91.0%) | 19 (9.0%) |
| 15 to 17 Year Olds | 192 (100.0%) | 0 (0.0%) |
| 18 to 19 Year Olds | 521 (100.0%) | 0 (0.0%) |
| 20 to 24 Year Olds | 18 (100.0%) | 0 (0.0%) |
| 25 to 34 Year Olds | 0 (0.0%) | 0 (0.0%) |
| 35 Years and over | 118 (100.0%) | 0 (0.0%) |
| Total | 1,325 (98.6%) | 19 (1.4%) |
Educational Attainment by Field of Study in Marlin
Business (61 | 21.0%), arts & humanities (60 | 20.7%), education (43 | 14.8%), computers & mathematics (23 | 7.9%), and bio, nature & agricultural (18 | 6.2%) are the most common fields of study among 290 individuals in Marlin who have obtained a bachelor's degree or higher.
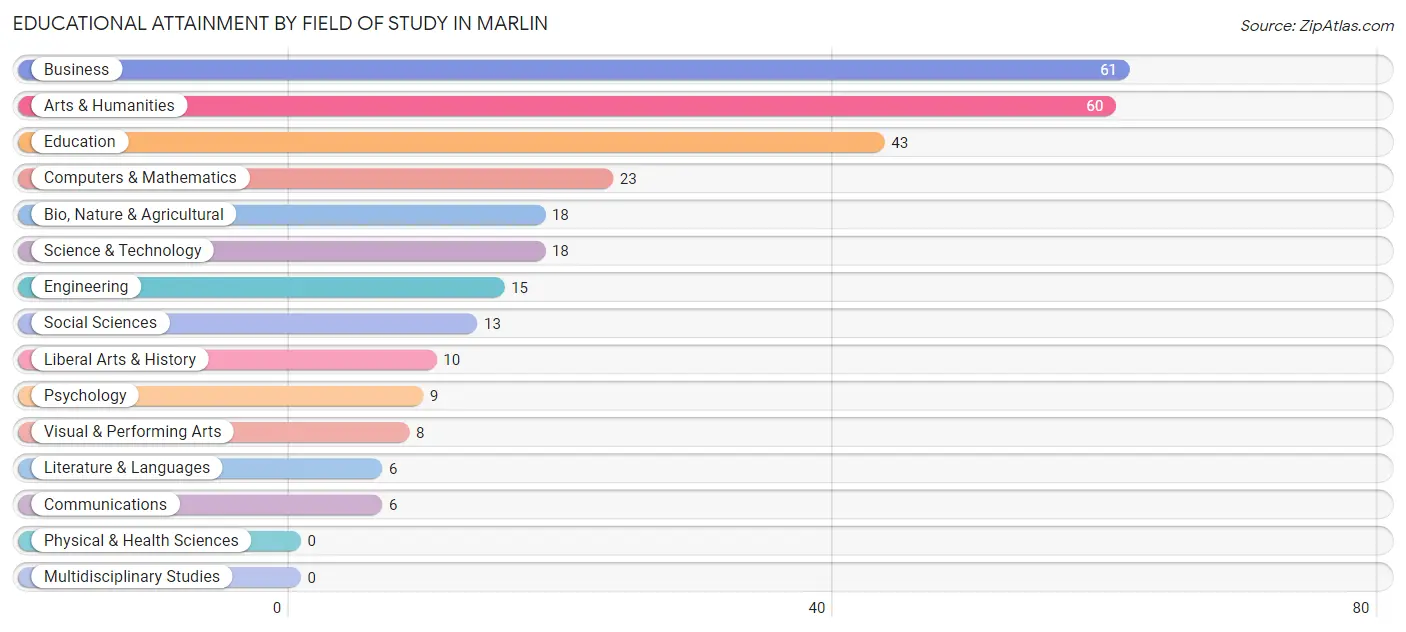
| Field of Study | # Graduates | % Graduates |
| Computers & Mathematics | 23 | 7.9% |
| Bio, Nature & Agricultural | 18 | 6.2% |
| Physical & Health Sciences | 0 | 0.0% |
| Psychology | 9 | 3.1% |
| Social Sciences | 13 | 4.5% |
| Engineering | 15 | 5.2% |
| Multidisciplinary Studies | 0 | 0.0% |
| Science & Technology | 18 | 6.2% |
| Business | 61 | 21.0% |
| Education | 43 | 14.8% |
| Literature & Languages | 6 | 2.1% |
| Liberal Arts & History | 10 | 3.5% |
| Visual & Performing Arts | 8 | 2.8% |
| Communications | 6 | 2.1% |
| Arts & Humanities | 60 | 20.7% |
| Total | 290 | 100.0% |
Transportation & Commute in Marlin
Vehicle Availability by Sex in Marlin
The most prevalent vehicle ownership categories in Marlin are males with 5 or more vehicles (505, accounting for 55.8%) and females with 5 or more vehicles (210, making up 54.5%).
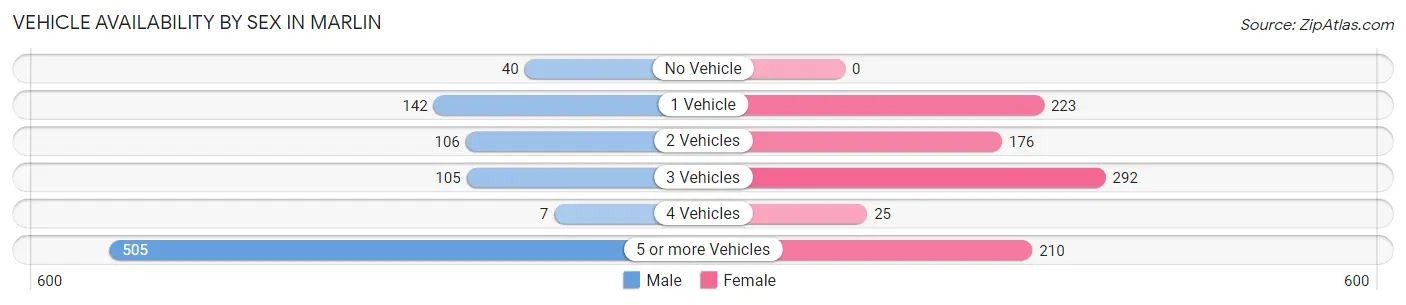
| Vehicles Available | Male | Female |
| No Vehicle | 40 (4.4%) | 0 (0.0%) |
| 1 Vehicle | 142 (15.7%) | 223 (24.1%) |
| 2 Vehicles | 106 (11.7%) | 176 (19.0%) |
| 3 Vehicles | 105 (11.6%) | 292 (31.5%) |
| 4 Vehicles | 7 (0.8%) | 25 (2.7%) |
| 5 or more Vehicles | 505 (55.8%) | 210 (22.7%) |
| Total | 905 (100.0%) | 926 (100.0%) |
Commute Time in Marlin
The most frequently occuring commute durations in Marlin are 5 to 9 minutes (570 commuters, 34.0%), 30 to 34 minutes (351 commuters, 20.9%), and 35 to 39 minutes (230 commuters, 13.7%).
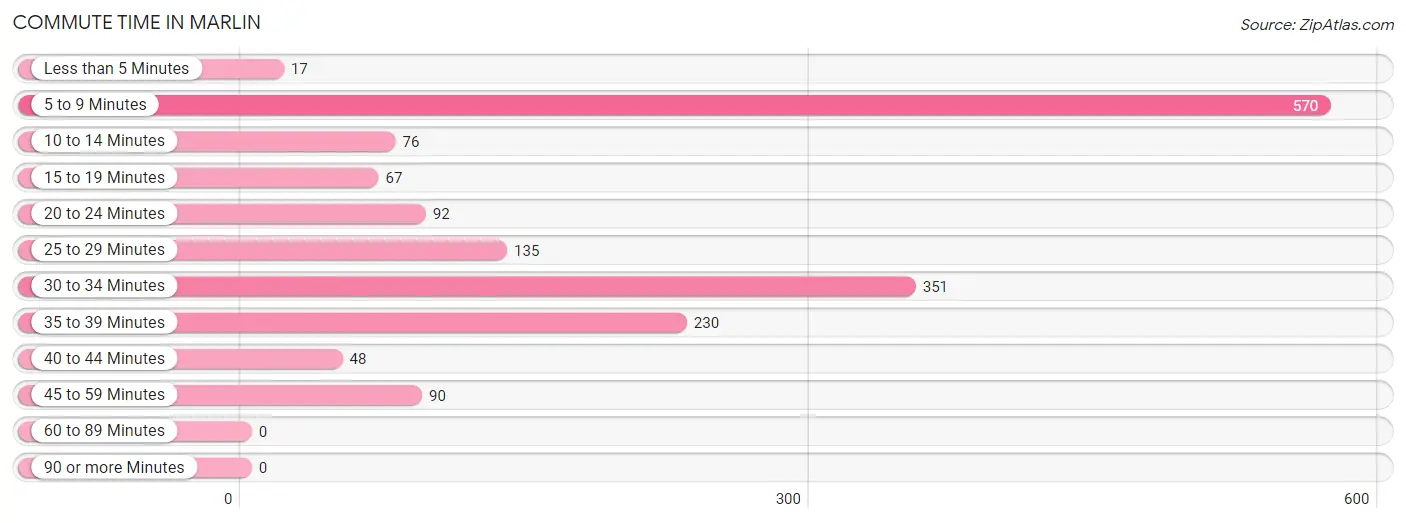
| Commute Time | # Commuters | % Commuters |
| Less than 5 Minutes | 17 | 1.0% |
| 5 to 9 Minutes | 570 | 34.0% |
| 10 to 14 Minutes | 76 | 4.5% |
| 15 to 19 Minutes | 67 | 4.0% |
| 20 to 24 Minutes | 92 | 5.5% |
| 25 to 29 Minutes | 135 | 8.1% |
| 30 to 34 Minutes | 351 | 20.9% |
| 35 to 39 Minutes | 230 | 13.7% |
| 40 to 44 Minutes | 48 | 2.9% |
| 45 to 59 Minutes | 90 | 5.4% |
| 60 to 89 Minutes | 0 | 0.0% |
| 90 or more Minutes | 0 | 0.0% |
Commute Time by Sex in Marlin
The most common commute times in Marlin are 5 to 9 minutes (466 commuters, 54.1%) for males and 30 to 34 minutes (262 commuters, 32.2%) for females.
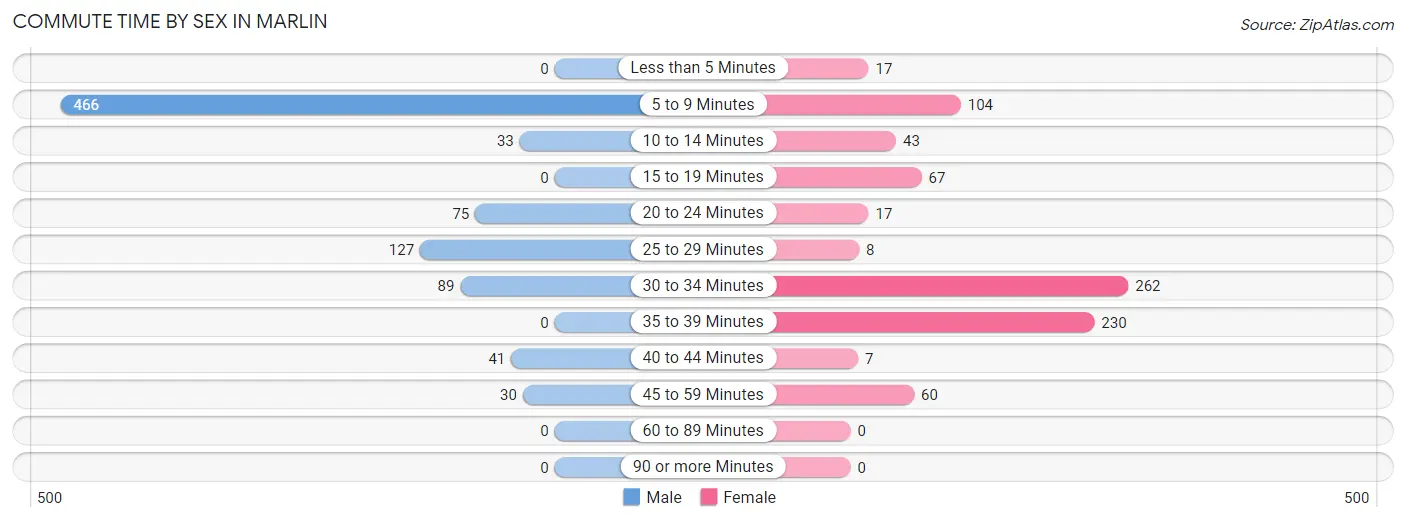
| Commute Time | Male | Female |
| Less than 5 Minutes | 0 (0.0%) | 17 (2.1%) |
| 5 to 9 Minutes | 466 (54.1%) | 104 (12.8%) |
| 10 to 14 Minutes | 33 (3.8%) | 43 (5.3%) |
| 15 to 19 Minutes | 0 (0.0%) | 67 (8.2%) |
| 20 to 24 Minutes | 75 (8.7%) | 17 (2.1%) |
| 25 to 29 Minutes | 127 (14.7%) | 8 (1.0%) |
| 30 to 34 Minutes | 89 (10.3%) | 262 (32.2%) |
| 35 to 39 Minutes | 0 (0.0%) | 230 (28.2%) |
| 40 to 44 Minutes | 41 (4.8%) | 7 (0.9%) |
| 45 to 59 Minutes | 30 (3.5%) | 60 (7.4%) |
| 60 to 89 Minutes | 0 (0.0%) | 0 (0.0%) |
| 90 or more Minutes | 0 (0.0%) | 0 (0.0%) |
Time of Departure to Work by Sex in Marlin
The most frequent times of departure to work in Marlin are 7:00 AM to 7:29 AM (446, 51.8%) for males and 7:00 AM to 7:29 AM (339, 41.6%) for females.
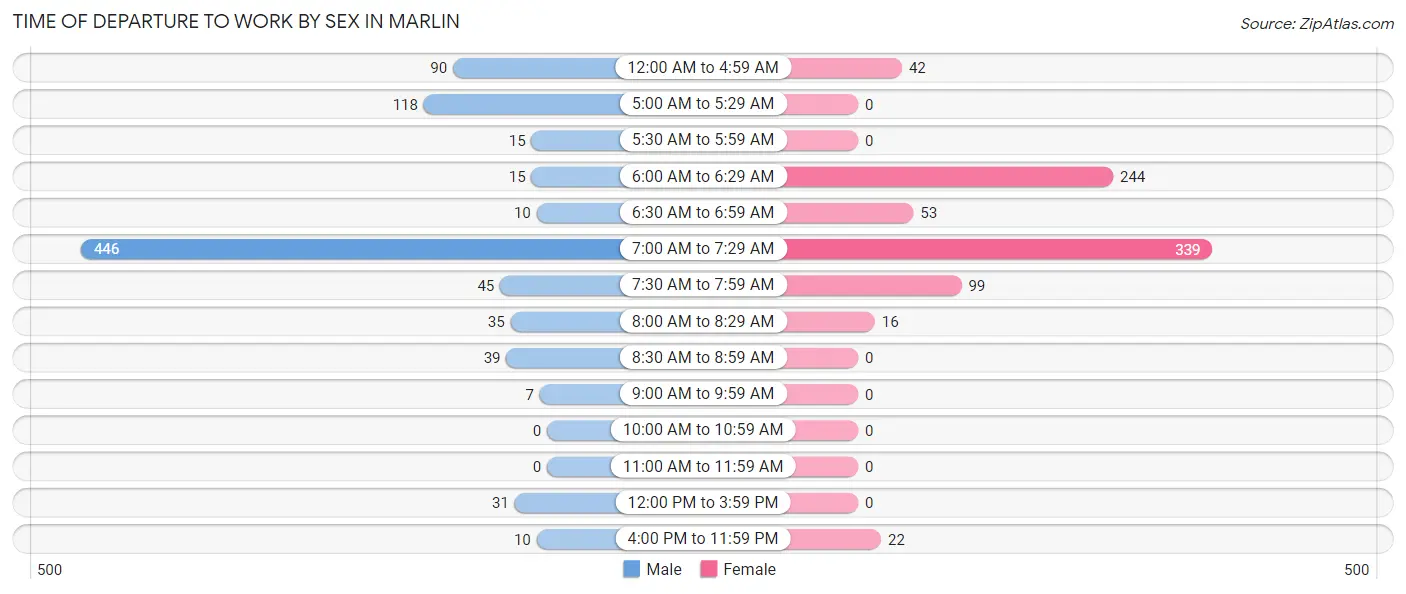
| Time of Departure | Male | Female |
| 12:00 AM to 4:59 AM | 90 (10.4%) | 42 (5.1%) |
| 5:00 AM to 5:29 AM | 118 (13.7%) | 0 (0.0%) |
| 5:30 AM to 5:59 AM | 15 (1.7%) | 0 (0.0%) |
| 6:00 AM to 6:29 AM | 15 (1.7%) | 244 (29.9%) |
| 6:30 AM to 6:59 AM | 10 (1.2%) | 53 (6.5%) |
| 7:00 AM to 7:29 AM | 446 (51.8%) | 339 (41.6%) |
| 7:30 AM to 7:59 AM | 45 (5.2%) | 99 (12.1%) |
| 8:00 AM to 8:29 AM | 35 (4.1%) | 16 (2.0%) |
| 8:30 AM to 8:59 AM | 39 (4.5%) | 0 (0.0%) |
| 9:00 AM to 9:59 AM | 7 (0.8%) | 0 (0.0%) |
| 10:00 AM to 10:59 AM | 0 (0.0%) | 0 (0.0%) |
| 11:00 AM to 11:59 AM | 0 (0.0%) | 0 (0.0%) |
| 12:00 PM to 3:59 PM | 31 (3.6%) | 0 (0.0%) |
| 4:00 PM to 11:59 PM | 10 (1.2%) | 22 (2.7%) |
| Total | 861 (100.0%) | 815 (100.0%) |
Housing Occupancy in Marlin
Occupancy by Ownership in Marlin
Of the total 1,658 dwellings in Marlin, owner-occupied units account for 1,167 (70.4%), while renter-occupied units make up 491 (29.6%).
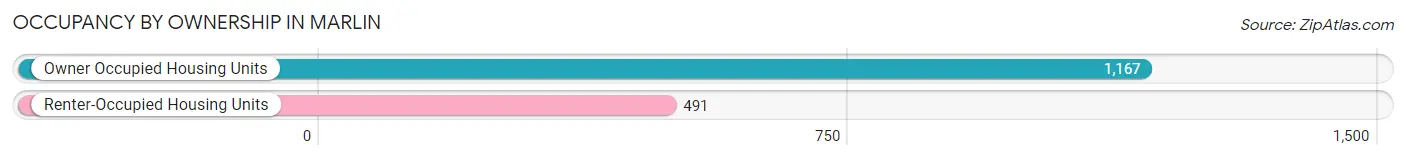
| Occupancy | # Housing Units | % Housing Units |
| Owner Occupied Housing Units | 1,167 | 70.4% |
| Renter-Occupied Housing Units | 491 | 29.6% |
| Total Occupied Housing Units | 1,658 | 100.0% |
Occupancy by Household Size in Marlin
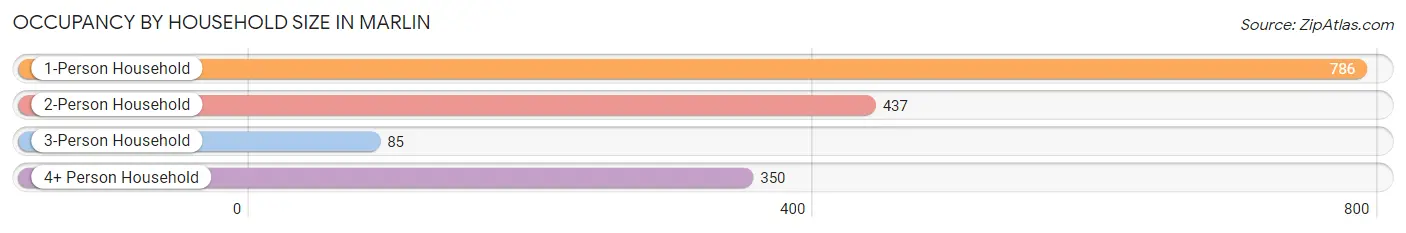
| Household Size | # Housing Units | % Housing Units |
| 1-Person Household | 786 | 47.4% |
| 2-Person Household | 437 | 26.4% |
| 3-Person Household | 85 | 5.1% |
| 4+ Person Household | 350 | 21.1% |
| Total Housing Units | 1,658 | 100.0% |
Occupancy by Ownership by Household Size in Marlin
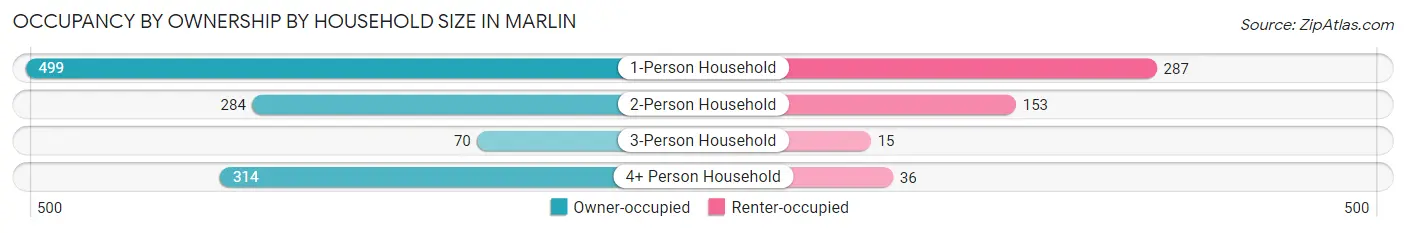
| Household Size | Owner-occupied | Renter-occupied |
| 1-Person Household | 499 (63.5%) | 287 (36.5%) |
| 2-Person Household | 284 (65.0%) | 153 (35.0%) |
| 3-Person Household | 70 (82.4%) | 15 (17.6%) |
| 4+ Person Household | 314 (89.7%) | 36 (10.3%) |
| Total Housing Units | 1,167 (70.4%) | 491 (29.6%) |
Occupancy by Educational Attainment in Marlin
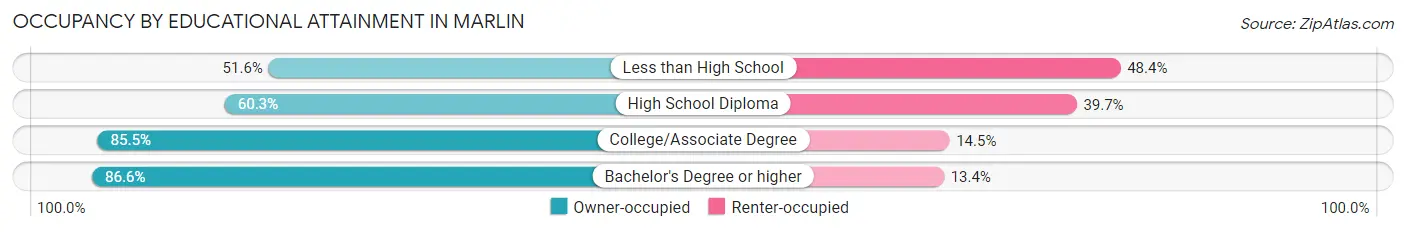
| Household Size | Owner-occupied | Renter-occupied |
| Less than High School | 225 (51.6%) | 211 (48.4%) |
| High School Diploma | 249 (60.3%) | 164 (39.7%) |
| College/Associate Degree | 596 (85.5%) | 101 (14.5%) |
| Bachelor's Degree or higher | 97 (86.6%) | 15 (13.4%) |
Occupancy by Age of Householder in Marlin
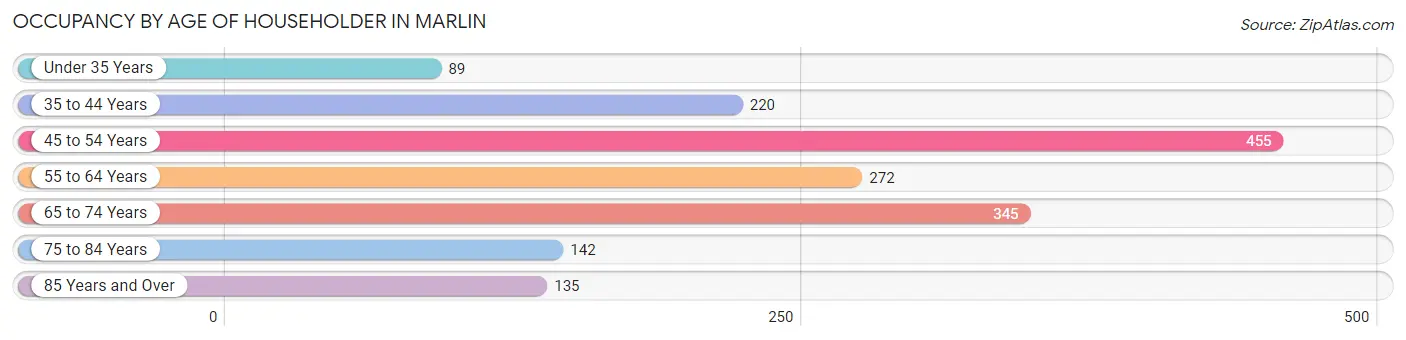
| Age Bracket | # Households | % Households |
| Under 35 Years | 89 | 5.4% |
| 35 to 44 Years | 220 | 13.3% |
| 45 to 54 Years | 455 | 27.4% |
| 55 to 64 Years | 272 | 16.4% |
| 65 to 74 Years | 345 | 20.8% |
| 75 to 84 Years | 142 | 8.6% |
| 85 Years and Over | 135 | 8.1% |
| Total | 1,658 | 100.0% |
Housing Finances in Marlin
Median Income by Occupancy in Marlin
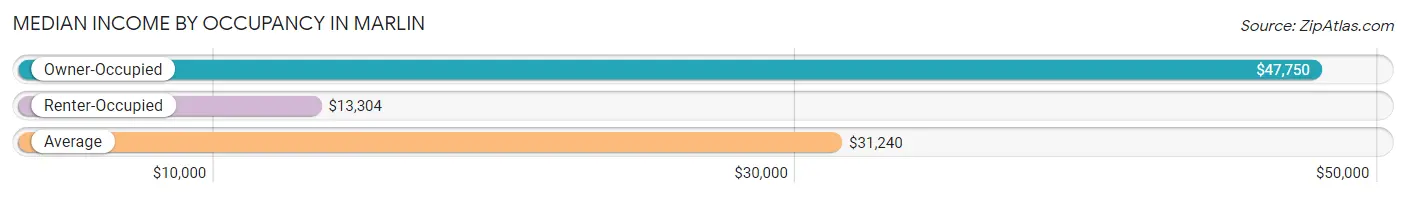
| Occupancy Type | # Households | Median Income |
| Owner-Occupied | 1,167 (70.4%) | $47,750 |
| Renter-Occupied | 491 (29.6%) | $13,304 |
| Average | 1,658 (100.0%) | $31,240 |
Occupancy by Householder Income Bracket in Marlin
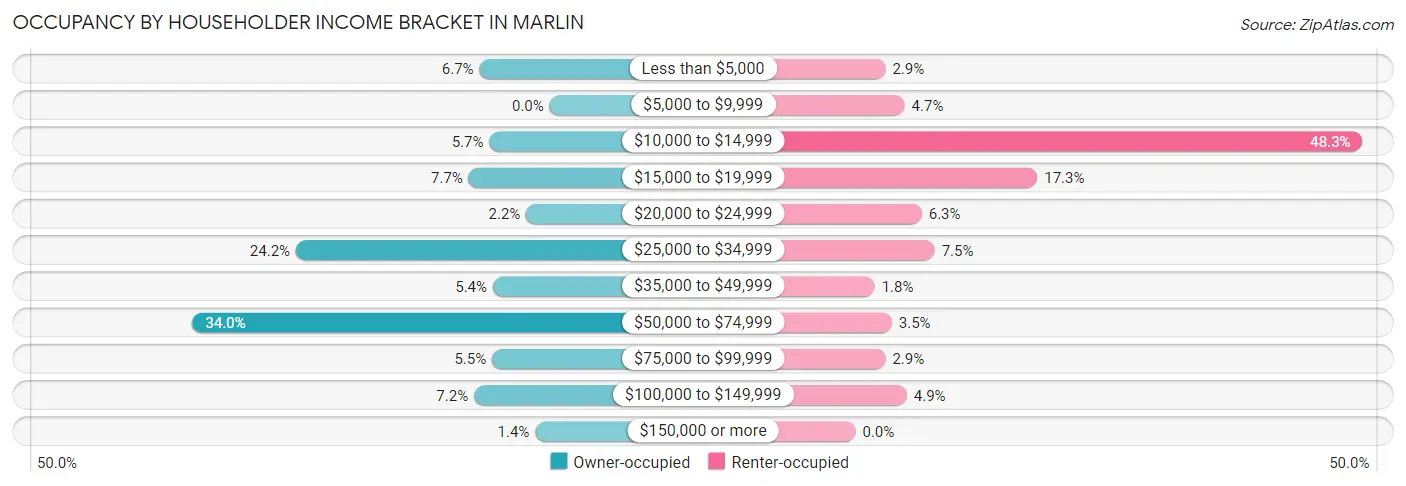
| Income Bracket | Owner-occupied | Renter-occupied |
| Less than $5,000 | 78 (6.7%) | 14 (2.9%) |
| $5,000 to $9,999 | 0 (0.0%) | 23 (4.7%) |
| $10,000 to $14,999 | 67 (5.7%) | 237 (48.3%) |
| $15,000 to $19,999 | 90 (7.7%) | 85 (17.3%) |
| $20,000 to $24,999 | 26 (2.2%) | 31 (6.3%) |
| $25,000 to $34,999 | 282 (24.2%) | 37 (7.5%) |
| $35,000 to $49,999 | 63 (5.4%) | 9 (1.8%) |
| $50,000 to $74,999 | 397 (34.0%) | 17 (3.5%) |
| $75,000 to $99,999 | 64 (5.5%) | 14 (2.9%) |
| $100,000 to $149,999 | 84 (7.2%) | 24 (4.9%) |
| $150,000 or more | 16 (1.4%) | 0 (0.0%) |
| Total | 1,167 (100.0%) | 491 (100.0%) |
Monthly Housing Cost Tiers in Marlin
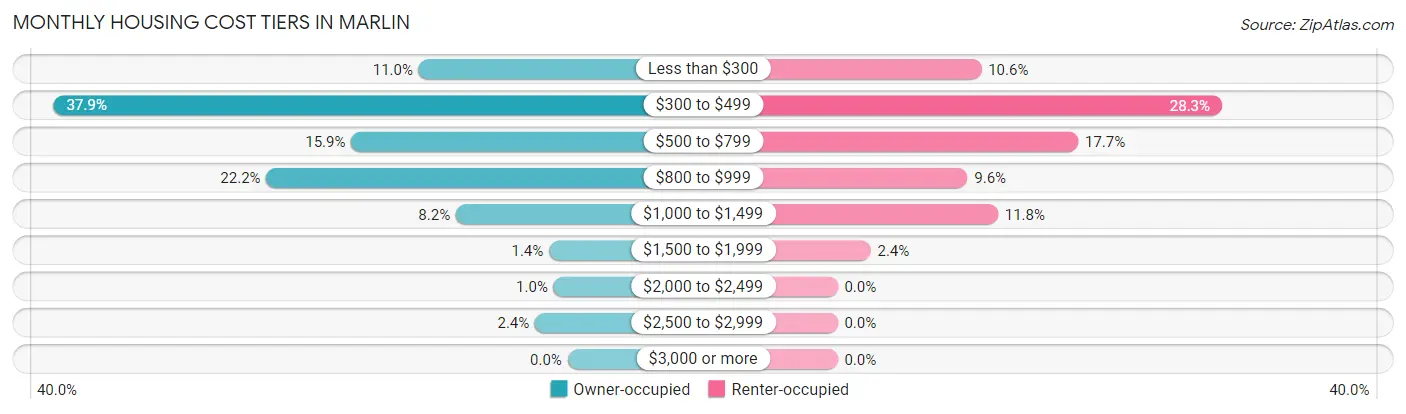
| Monthly Cost | Owner-occupied | Renter-occupied |
| Less than $300 | 128 (11.0%) | 52 (10.6%) |
| $300 to $499 | 442 (37.9%) | 139 (28.3%) |
| $500 to $799 | 186 (15.9%) | 87 (17.7%) |
| $800 to $999 | 259 (22.2%) | 47 (9.6%) |
| $1,000 to $1,499 | 96 (8.2%) | 58 (11.8%) |
| $1,500 to $1,999 | 16 (1.4%) | 12 (2.4%) |
| $2,000 to $2,499 | 12 (1.0%) | 0 (0.0%) |
| $2,500 to $2,999 | 28 (2.4%) | 0 (0.0%) |
| $3,000 or more | 0 (0.0%) | 0 (0.0%) |
| Total | 1,167 (100.0%) | 491 (100.0%) |
Physical Housing Characteristics in Marlin
Housing Structures in Marlin
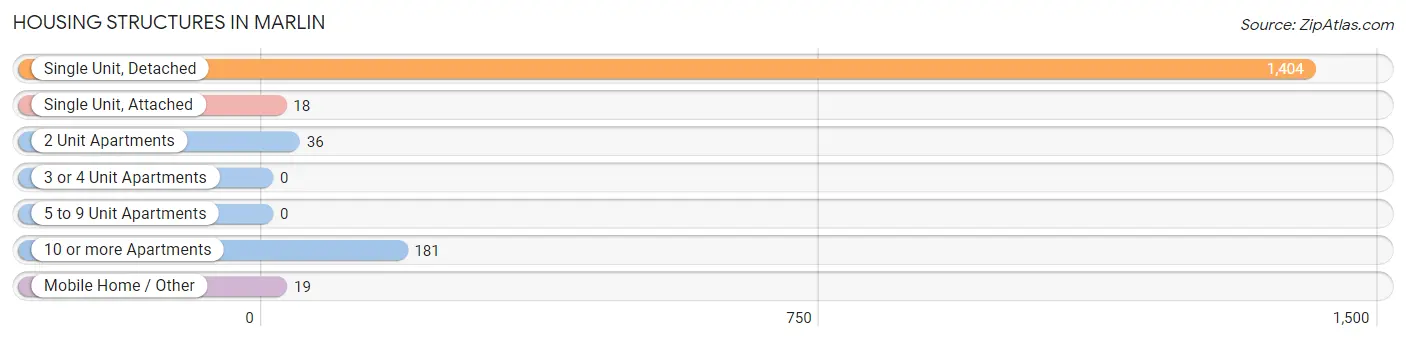
| Structure Type | # Housing Units | % Housing Units |
| Single Unit, Detached | 1,404 | 84.7% |
| Single Unit, Attached | 18 | 1.1% |
| 2 Unit Apartments | 36 | 2.2% |
| 3 or 4 Unit Apartments | 0 | 0.0% |
| 5 to 9 Unit Apartments | 0 | 0.0% |
| 10 or more Apartments | 181 | 10.9% |
| Mobile Home / Other | 19 | 1.1% |
| Total | 1,658 | 100.0% |
Housing Structures by Occupancy in Marlin
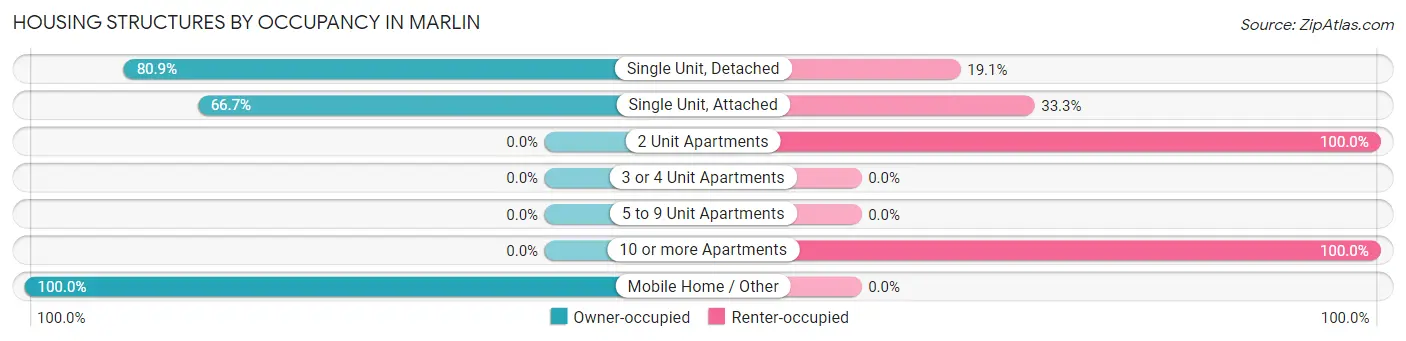
| Structure Type | Owner-occupied | Renter-occupied |
| Single Unit, Detached | 1,136 (80.9%) | 268 (19.1%) |
| Single Unit, Attached | 12 (66.7%) | 6 (33.3%) |
| 2 Unit Apartments | 0 (0.0%) | 36 (100.0%) |
| 3 or 4 Unit Apartments | 0 (0.0%) | 0 (0.0%) |
| 5 to 9 Unit Apartments | 0 (0.0%) | 0 (0.0%) |
| 10 or more Apartments | 0 (0.0%) | 181 (100.0%) |
| Mobile Home / Other | 19 (100.0%) | 0 (0.0%) |
| Total | 1,167 (70.4%) | 491 (29.6%) |
Housing Structures by Number of Rooms in Marlin
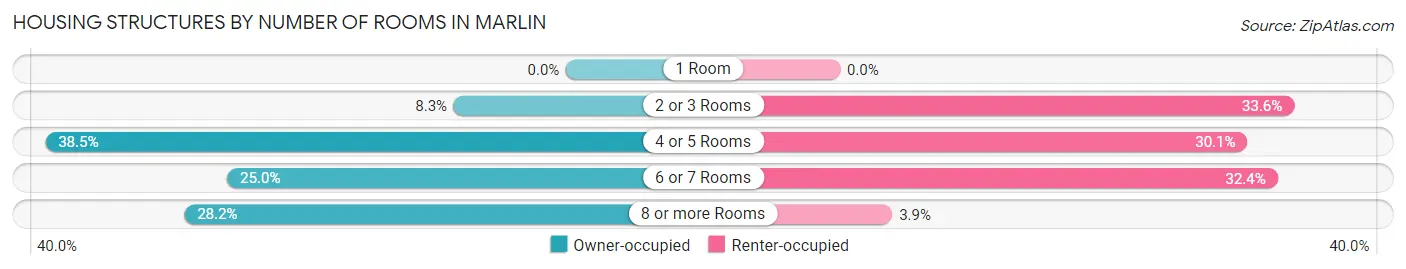
| Number of Rooms | Owner-occupied | Renter-occupied |
| 1 Room | 0 (0.0%) | 0 (0.0%) |
| 2 or 3 Rooms | 97 (8.3%) | 165 (33.6%) |
| 4 or 5 Rooms | 449 (38.5%) | 148 (30.1%) |
| 6 or 7 Rooms | 292 (25.0%) | 159 (32.4%) |
| 8 or more Rooms | 329 (28.2%) | 19 (3.9%) |
| Total | 1,167 (100.0%) | 491 (100.0%) |
Housing Structure by Heating Type in Marlin
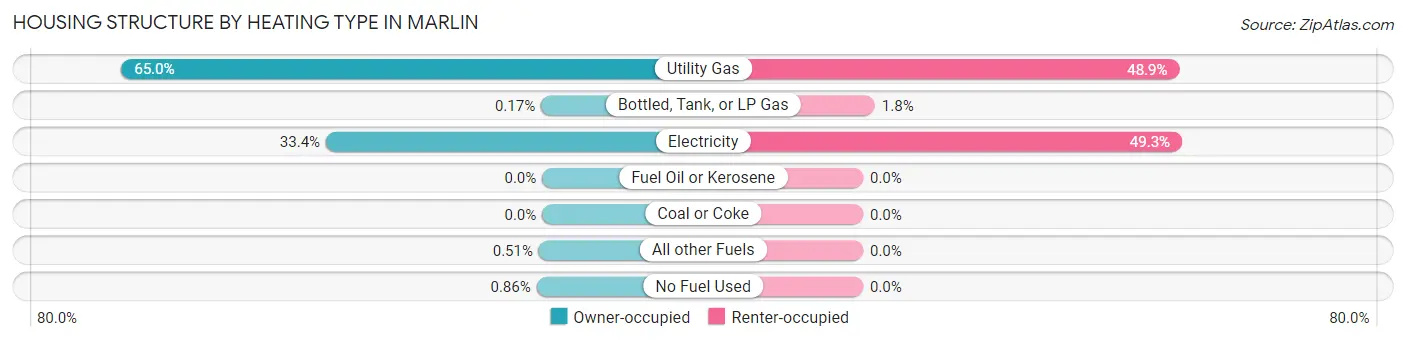
| Heating Type | Owner-occupied | Renter-occupied |
| Utility Gas | 759 (65.0%) | 240 (48.9%) |
| Bottled, Tank, or LP Gas | 2 (0.2%) | 9 (1.8%) |
| Electricity | 390 (33.4%) | 242 (49.3%) |
| Fuel Oil or Kerosene | 0 (0.0%) | 0 (0.0%) |
| Coal or Coke | 0 (0.0%) | 0 (0.0%) |
| All other Fuels | 6 (0.5%) | 0 (0.0%) |
| No Fuel Used | 10 (0.9%) | 0 (0.0%) |
| Total | 1,167 (100.0%) | 491 (100.0%) |
Household Vehicle Usage in Marlin
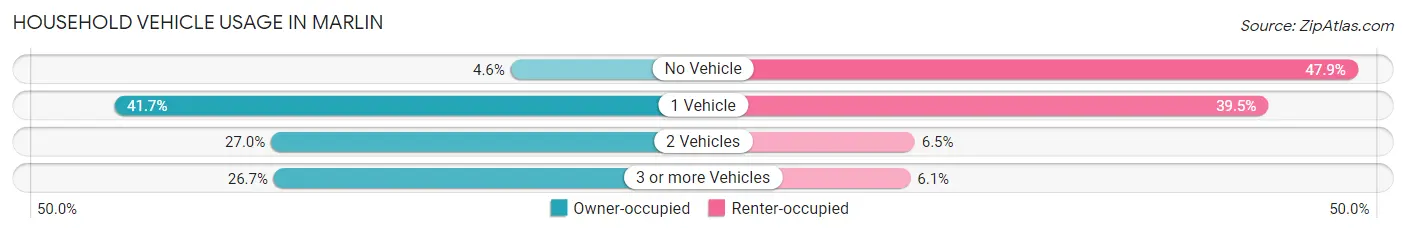
| Vehicles per Household | Owner-occupied | Renter-occupied |
| No Vehicle | 54 (4.6%) | 235 (47.9%) |
| 1 Vehicle | 486 (41.6%) | 194 (39.5%) |
| 2 Vehicles | 315 (27.0%) | 32 (6.5%) |
| 3 or more Vehicles | 312 (26.7%) | 30 (6.1%) |
| Total | 1,167 (100.0%) | 491 (100.0%) |
Real Estate & Mortgages in Marlin
Real Estate and Mortgage Overview in Marlin
| Characteristic | Without Mortgage | With Mortgage |
| Housing Units | 753 | 414 |
| Median Property Value | $84,200 | $74,700 |
| Median Household Income | - | - |
| Monthly Housing Costs | $442 | $0 |
| Real Estate Taxes | $1,240 | $0 |
Property Value by Mortgage Status in Marlin
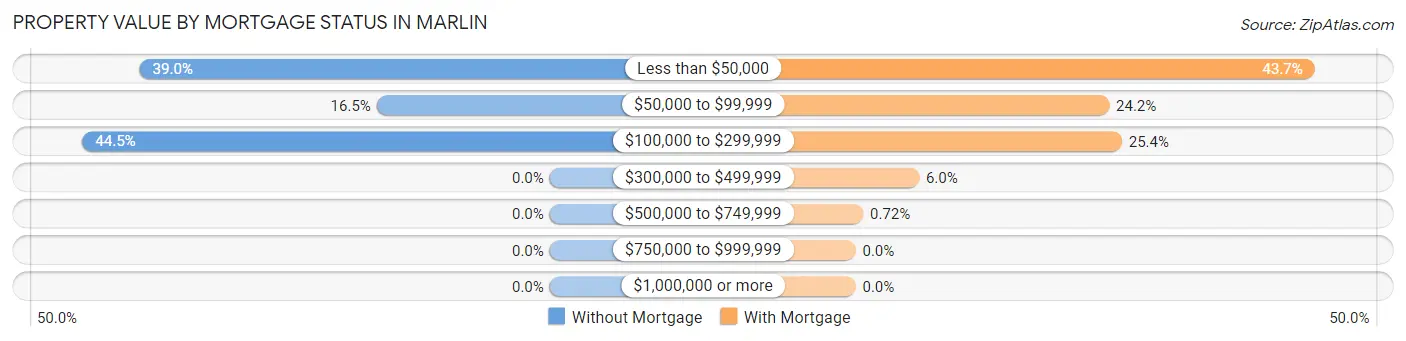
| Property Value | Without Mortgage | With Mortgage |
| Less than $50,000 | 294 (39.0%) | 181 (43.7%) |
| $50,000 to $99,999 | 124 (16.5%) | 100 (24.1%) |
| $100,000 to $299,999 | 335 (44.5%) | 105 (25.4%) |
| $300,000 to $499,999 | 0 (0.0%) | 25 (6.0%) |
| $500,000 to $749,999 | 0 (0.0%) | 3 (0.7%) |
| $750,000 to $999,999 | 0 (0.0%) | 0 (0.0%) |
| $1,000,000 or more | 0 (0.0%) | 0 (0.0%) |
| Total | 753 (100.0%) | 414 (100.0%) |
Household Income by Mortgage Status in Marlin
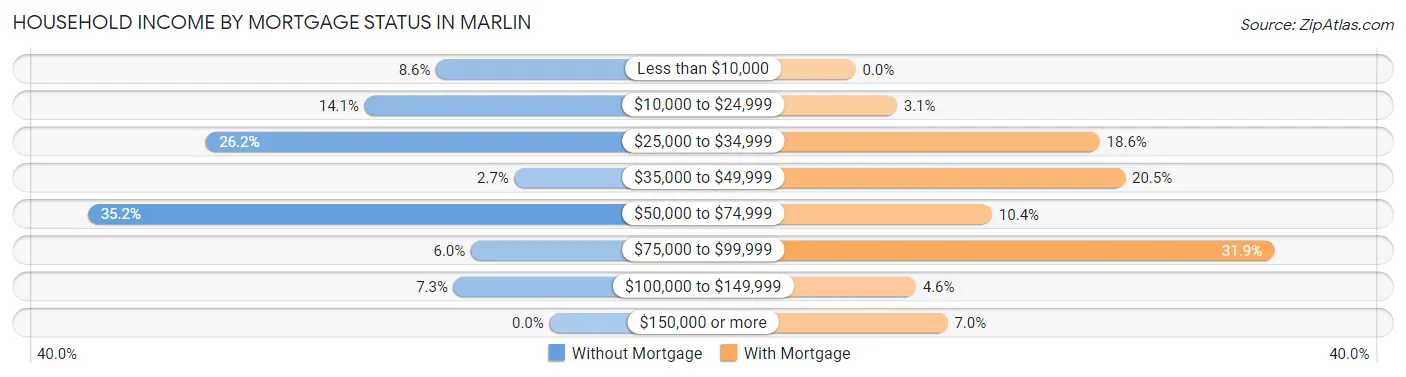
| Household Income | Without Mortgage | With Mortgage |
| Less than $10,000 | 65 (8.6%) | 0 (0.0%) |
| $10,000 to $24,999 | 106 (14.1%) | 13 (3.1%) |
| $25,000 to $34,999 | 197 (26.2%) | 77 (18.6%) |
| $35,000 to $49,999 | 20 (2.7%) | 85 (20.5%) |
| $50,000 to $74,999 | 265 (35.2%) | 43 (10.4%) |
| $75,000 to $99,999 | 45 (6.0%) | 132 (31.9%) |
| $100,000 to $149,999 | 55 (7.3%) | 19 (4.6%) |
| $150,000 or more | 0 (0.0%) | 29 (7.0%) |
| Total | 753 (100.0%) | 414 (100.0%) |
Property Value to Household Income Ratio in Marlin
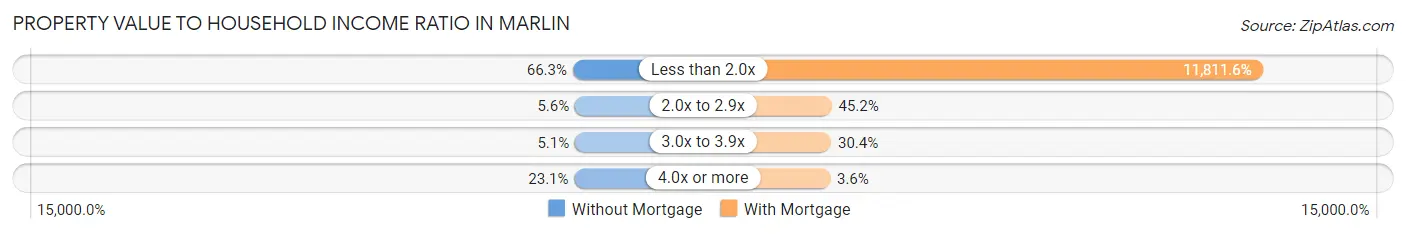
| Value-to-Income Ratio | Without Mortgage | With Mortgage |
| Less than 2.0x | 499 (66.3%) | 48,900 (11,811.6%) |
| 2.0x to 2.9x | 42 (5.6%) | 187 (45.2%) |
| 3.0x to 3.9x | 38 (5.1%) | 126 (30.4%) |
| 4.0x or more | 174 (23.1%) | 15 (3.6%) |
| Total | 753 (100.0%) | 414 (100.0%) |
Real Estate Taxes by Mortgage Status in Marlin
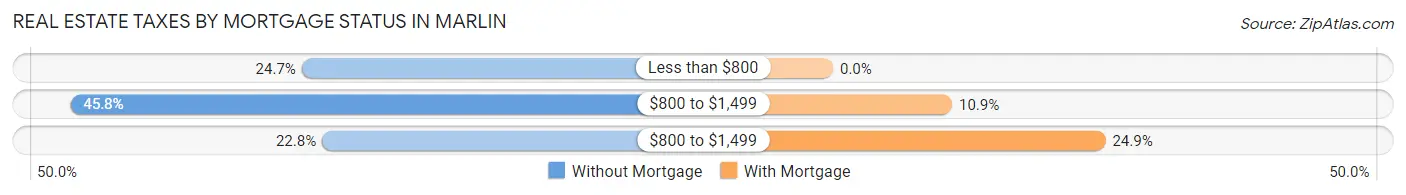
| Property Taxes | Without Mortgage | With Mortgage |
| Less than $800 | 186 (24.7%) | 0 (0.0%) |
| $800 to $1,499 | 345 (45.8%) | 45 (10.9%) |
| $800 to $1,499 | 172 (22.8%) | 103 (24.9%) |
| Total | 753 (100.0%) | 414 (100.0%) |
Health & Disability in Marlin
Health Insurance Coverage by Age in Marlin
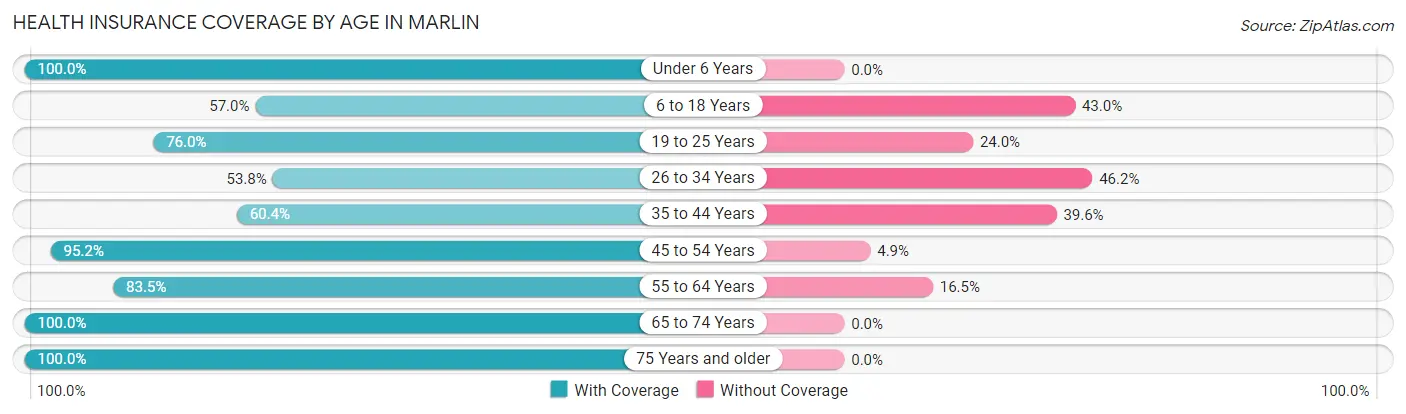
| Age Bracket | With Coverage | Without Coverage |
| Under 6 Years | 162 (100.0%) | 0 (0.0%) |
| 6 to 18 Years | 861 (57.0%) | 650 (43.0%) |
| 19 to 25 Years | 263 (76.0%) | 83 (24.0%) |
| 26 to 34 Years | 200 (53.8%) | 172 (46.2%) |
| 35 to 44 Years | 330 (60.4%) | 216 (39.6%) |
| 45 to 54 Years | 549 (95.2%) | 28 (4.9%) |
| 55 to 64 Years | 435 (83.5%) | 86 (16.5%) |
| 65 to 74 Years | 449 (100.0%) | 0 (0.0%) |
| 75 Years and older | 332 (100.0%) | 0 (0.0%) |
| Total | 3,581 (74.4%) | 1,235 (25.6%) |
Health Insurance Coverage by Citizenship Status in Marlin
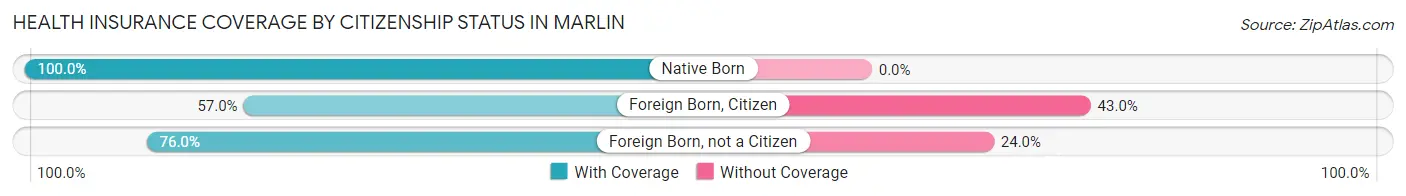
| Citizenship Status | With Coverage | Without Coverage |
| Native Born | 162 (100.0%) | 0 (0.0%) |
| Foreign Born, Citizen | 861 (57.0%) | 650 (43.0%) |
| Foreign Born, not a Citizen | 263 (76.0%) | 83 (24.0%) |
Health Insurance Coverage by Household Income in Marlin
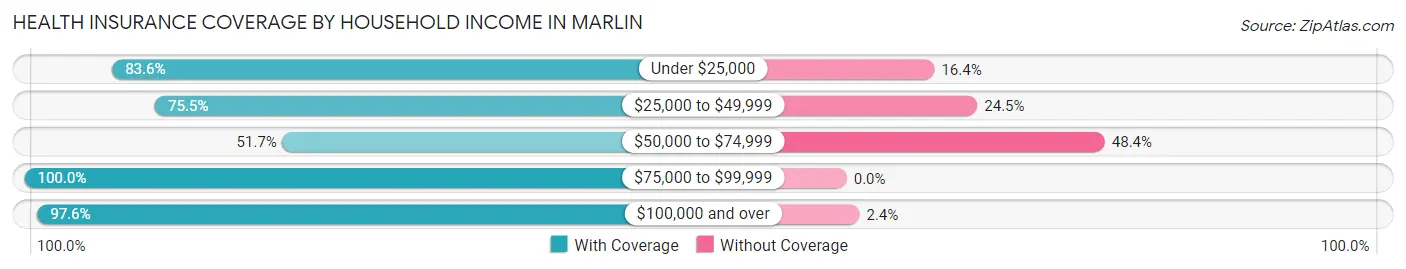
| Household Income | With Coverage | Without Coverage |
| Under $25,000 | 1,012 (83.6%) | 199 (16.4%) |
| $25,000 to $49,999 | 590 (75.5%) | 191 (24.5%) |
| $50,000 to $74,999 | 878 (51.6%) | 822 (48.3%) |
| $75,000 to $99,999 | 190 (100.0%) | 0 (0.0%) |
| $100,000 and over | 897 (97.6%) | 22 (2.4%) |
Public vs Private Health Insurance Coverage by Age in Marlin
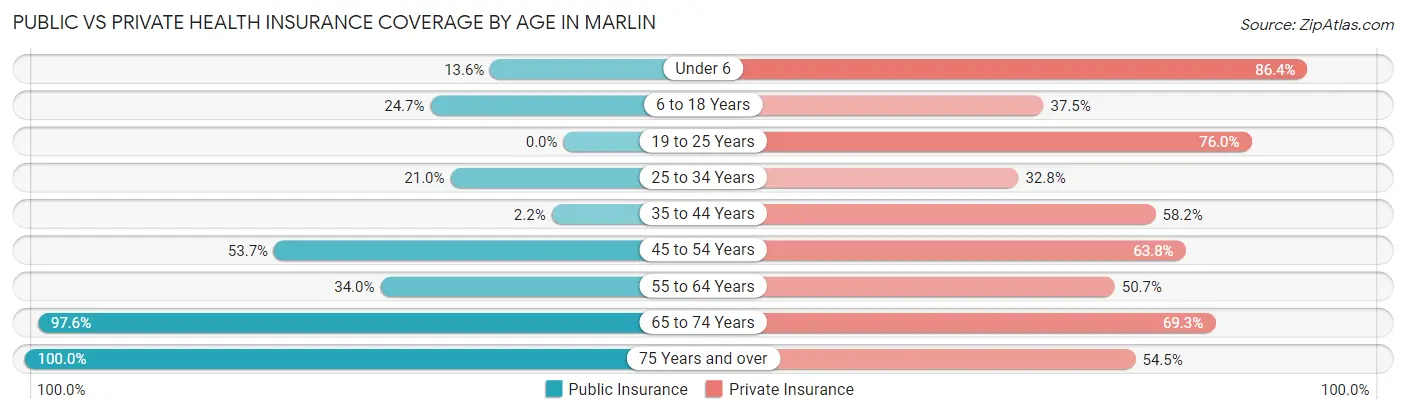
| Age Bracket | Public Insurance | Private Insurance |
| Under 6 | 22 (13.6%) | 140 (86.4%) |
| 6 to 18 Years | 373 (24.7%) | 566 (37.5%) |
| 19 to 25 Years | 0 (0.0%) | 263 (76.0%) |
| 25 to 34 Years | 78 (21.0%) | 122 (32.8%) |
| 35 to 44 Years | 12 (2.2%) | 318 (58.2%) |
| 45 to 54 Years | 310 (53.7%) | 368 (63.8%) |
| 55 to 64 Years | 177 (34.0%) | 264 (50.7%) |
| 65 to 74 Years | 438 (97.6%) | 311 (69.3%) |
| 75 Years and over | 332 (100.0%) | 181 (54.5%) |
| Total | 1,742 (36.2%) | 2,533 (52.6%) |
Disability Status by Sex by Age in Marlin
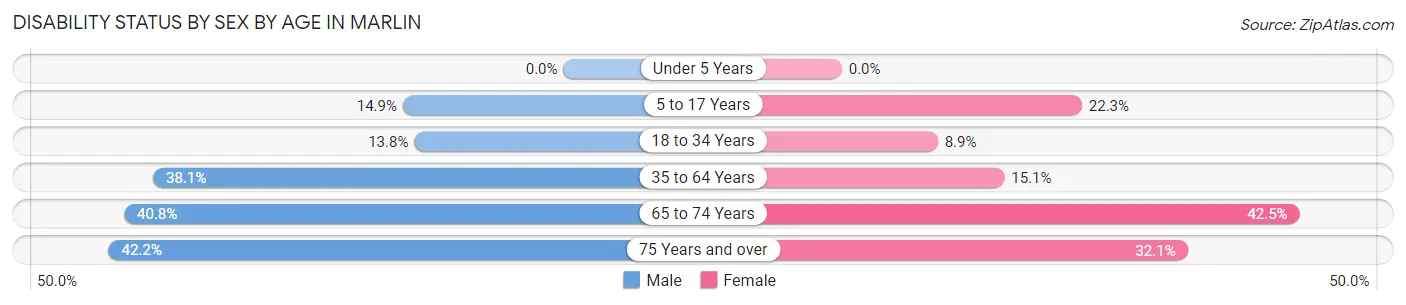
| Age Bracket | Male | Female |
| Under 5 Years | 0 (0.0%) | 0 (0.0%) |
| 5 to 17 Years | 100 (14.9%) | 84 (22.3%) |
| 18 to 34 Years | 123 (13.8%) | 26 (8.9%) |
| 35 to 64 Years | 260 (38.1%) | 145 (15.1%) |
| 65 to 74 Years | 64 (40.8%) | 124 (42.5%) |
| 75 Years and over | 73 (42.2%) | 51 (32.1%) |
Disability Class by Sex by Age in Marlin
Disability Class: Hearing Difficulty
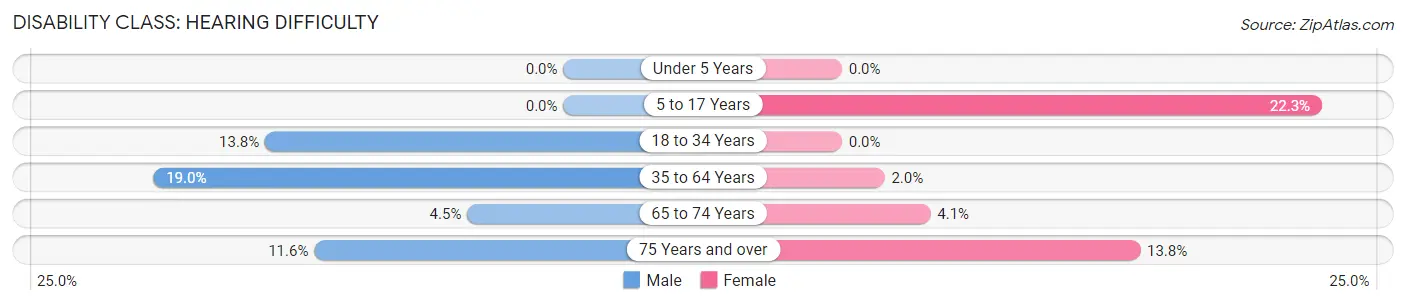
| Age Bracket | Male | Female |
| Under 5 Years | 0 (0.0%) | 0 (0.0%) |
| 5 to 17 Years | 0 (0.0%) | 84 (22.3%) |
| 18 to 34 Years | 123 (13.8%) | 0 (0.0%) |
| 35 to 64 Years | 130 (19.0%) | 19 (2.0%) |
| 65 to 74 Years | 7 (4.5%) | 12 (4.1%) |
| 75 Years and over | 20 (11.6%) | 22 (13.8%) |
Disability Class: Vision Difficulty
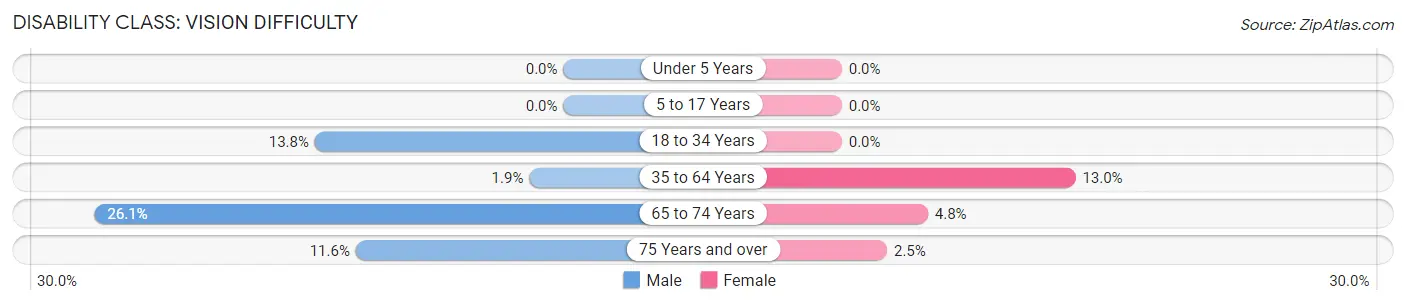
| Age Bracket | Male | Female |
| Under 5 Years | 0 (0.0%) | 0 (0.0%) |
| 5 to 17 Years | 0 (0.0%) | 0 (0.0%) |
| 18 to 34 Years | 123 (13.8%) | 0 (0.0%) |
| 35 to 64 Years | 13 (1.9%) | 125 (13.0%) |
| 65 to 74 Years | 41 (26.1%) | 14 (4.8%) |
| 75 Years and over | 20 (11.6%) | 4 (2.5%) |
Disability Class: Cognitive Difficulty
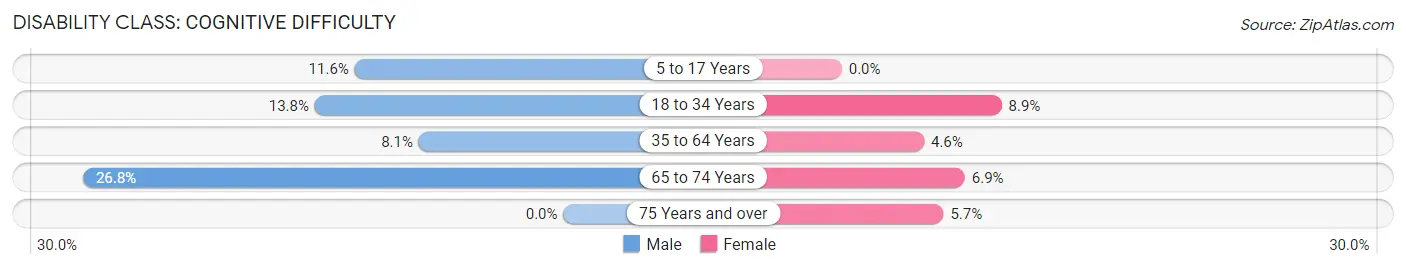
| Age Bracket | Male | Female |
| 5 to 17 Years | 78 (11.6%) | 0 (0.0%) |
| 18 to 34 Years | 123 (13.8%) | 26 (8.9%) |
| 35 to 64 Years | 55 (8.1%) | 44 (4.6%) |
| 65 to 74 Years | 42 (26.8%) | 20 (6.9%) |
| 75 Years and over | 0 (0.0%) | 9 (5.7%) |
Disability Class: Ambulatory Difficulty
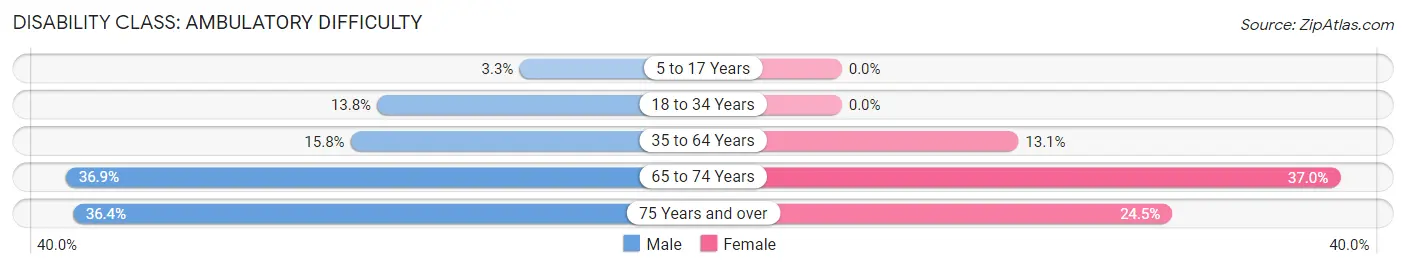
| Age Bracket | Male | Female |
| 5 to 17 Years | 22 (3.3%) | 0 (0.0%) |
| 18 to 34 Years | 123 (13.8%) | 0 (0.0%) |
| 35 to 64 Years | 108 (15.8%) | 126 (13.1%) |
| 65 to 74 Years | 58 (36.9%) | 108 (37.0%) |
| 75 Years and over | 63 (36.4%) | 39 (24.5%) |
Disability Class: Self-Care Difficulty
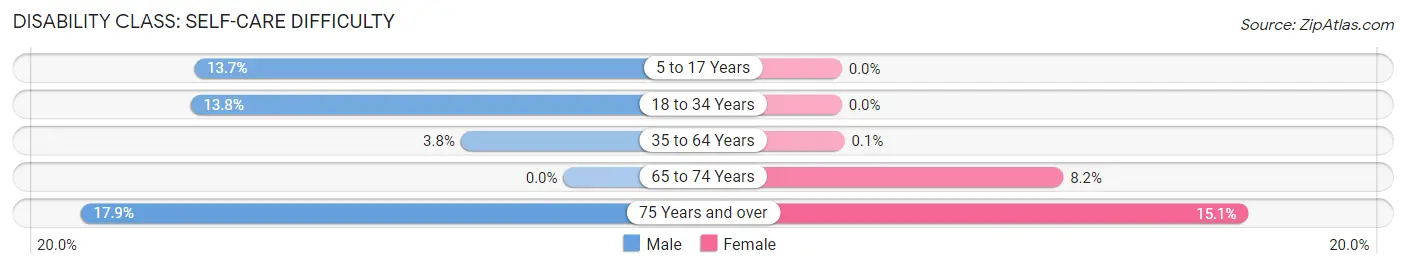
| Age Bracket | Male | Female |
| 5 to 17 Years | 92 (13.7%) | 0 (0.0%) |
| 18 to 34 Years | 123 (13.8%) | 0 (0.0%) |
| 35 to 64 Years | 26 (3.8%) | 1 (0.1%) |
| 65 to 74 Years | 0 (0.0%) | 24 (8.2%) |
| 75 Years and over | 31 (17.9%) | 24 (15.1%) |
Technology Access in Marlin
Computing Device Access in Marlin
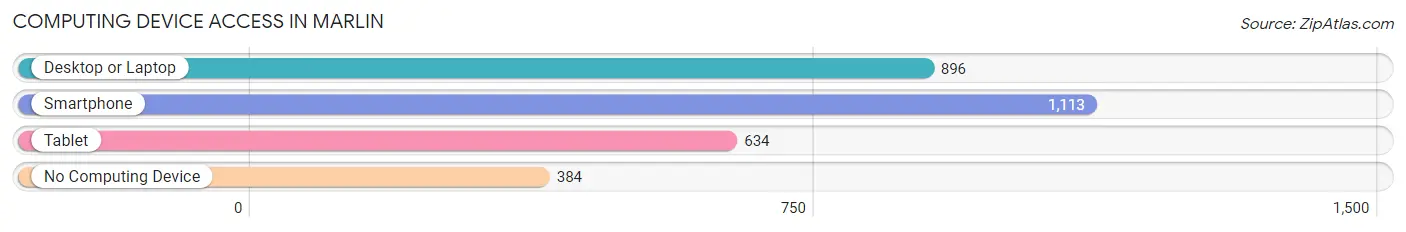
| Device Type | # Households | % Households |
| Desktop or Laptop | 896 | 54.0% |
| Smartphone | 1,113 | 67.1% |
| Tablet | 634 | 38.2% |
| No Computing Device | 384 | 23.2% |
| Total | 1,658 | 100.0% |
Internet Access in Marlin
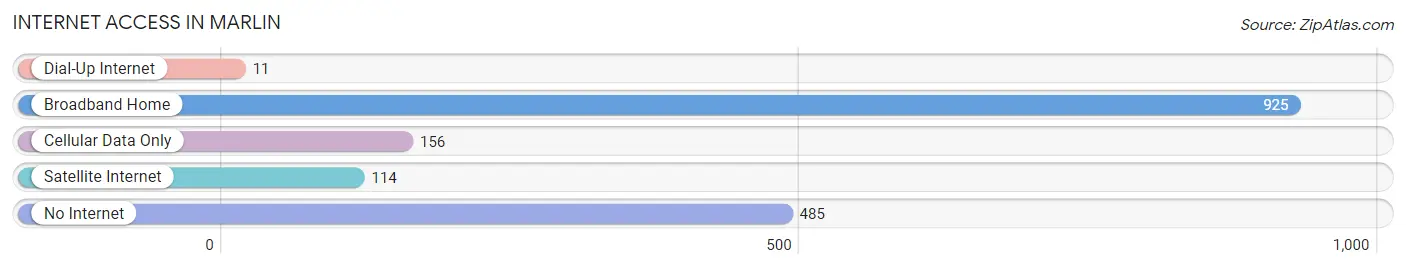
| Internet Type | # Households | % Households |
| Dial-Up Internet | 11 | 0.7% |
| Broadband Home | 925 | 55.8% |
| Cellular Data Only | 156 | 9.4% |
| Satellite Internet | 114 | 6.9% |
| No Internet | 485 | 29.2% |
| Total | 1,658 | 100.0% |
Marlin Summary
Marlin, Texas is a small city located in Falls County, Texas, United States. It is situated on the Brazos River, approximately 90 miles south of Dallas and 70 miles north of Austin. The population of Marlin was 6,628 at the 2010 census, making it the largest city in Falls County.
History
Marlin was founded in 1851 by settlers from Missouri, who named the town after a nearby creek. The town was incorporated in 1867 and quickly became a center of commerce and industry. The first railroad line to reach Marlin was the Houston and Texas Central Railway in 1871. This line connected Marlin to Houston and other major cities in Texas.
The town experienced a period of rapid growth in the late 19th century, with the population increasing from 1,000 in 1880 to over 5,000 by 1900. This growth was largely due to the booming cotton industry, which was the main source of income for many of the town’s residents.
In the early 20th century, Marlin was a major center for the oil and gas industry. The town was home to several oil refineries and was the site of the first oil well in Texas. The oil industry brought a great deal of wealth to the town, and many of the town’s residents became wealthy as a result.
Geography
Marlin is located in central Texas, approximately 90 miles south of Dallas and 70 miles north of Austin. The city is situated on the Brazos River, which provides a natural border between Marlin and the neighboring towns of Rosebud and Lott.
The city has a total area of 4.2 square miles, all of which is land. The terrain is mostly flat, with some rolling hills in the surrounding area. The climate is hot and humid in the summer months, with temperatures reaching up to 100 degrees Fahrenheit. Winters are mild, with temperatures rarely dropping below freezing.
Economy
Marlin’s economy is largely based on agriculture and manufacturing. The city is home to several large cotton farms, as well as several factories that produce a variety of products, including furniture, clothing, and electronics.
The city is also home to several oil and gas companies, which provide jobs for many of the town’s residents. The city is also home to several retail stores, restaurants, and other businesses.
Demographics
As of the 2010 census, the population of Marlin was 6,628. The racial makeup of the city was 63.3% White, 28.2% African American, 0.4% Native American, 0.3% Asian, 0.1% Pacific Islander, 6.2% from other races, and 1.5% from two or more races. Hispanic or Latino of any race were 15.2% of the population.
The median income for a household in Marlin was $30,938, and the median income for a family was $37,813. The per capita income for the city was $15,945. About 19.2% of families and 22.7% of the population were below the poverty line, including 33.2% of those under age 18 and 16.2% of those age 65 or over.
Marlin is a small city with a rich history and a diverse economy. The city is home to a variety of businesses, from cotton farms to oil refineries, and provides jobs for many of its residents. The city is also home to a diverse population, with a variety of racial and ethnic backgrounds. Marlin is a great place to live and work, and is a great example of the diversity and culture of Texas.
Common Questions
What is Per Capita Income in Marlin?
Per Capita income in Marlin is $15,920.
What is the Median Family Income in Marlin?
Median Family Income in Marlin is $62,550.
What is the Median Household income in Marlin?
Median Household Income in Marlin is $31,240.
What is Family Income Deficit in Marlin?
Family Income Deficit in Marlin is $8,361.
Families that are below poverty line in Marlin earn $8,361 less on average than the poverty threshold level.
What is Inequality or Gini Index in Marlin?
Inequality or Gini Index in Marlin is 0.43.
What is the Total Population of Marlin?
Total Population of Marlin is 5,478.
What is the Total Male Population of Marlin?
Total Male Population of Marlin is 2,870.
What is the Total Female Population of Marlin?
Total Female Population of Marlin is 2,608.
What is the Ratio of Males per 100 Females in Marlin?
There are 110.05 Males per 100 Females in Marlin.
What is the Ratio of Females per 100 Males in Marlin?
There are 90.87 Females per 100 Males in Marlin.
What is the Median Population Age in Marlin?
Median Population Age in Marlin is 35.7 Years.
What is the Average Family Size in Marlin
Average Family Size in Marlin is 4.7 People.
What is the Average Household Size in Marlin
Average Household Size in Marlin is 2.9 People.
How Large is the Labor Force in Marlin?
There are 2,137 People in the Labor Forcein in Marlin.
What is the Percentage of People in the Labor Force in Marlin?
49.9% of People are in the Labor Force in Marlin.
What is the Unemployment Rate in Marlin?
Unemployment Rate in Marlin is 13.9%.