Zip Codes with the Highest Percentage of Population Employed in Health Diagnosing & Treating in Dallas, TX
RELATED REPORTS & OPTIONS
Health Diagnosing & Treating
Dallas
Compare Zip Codes
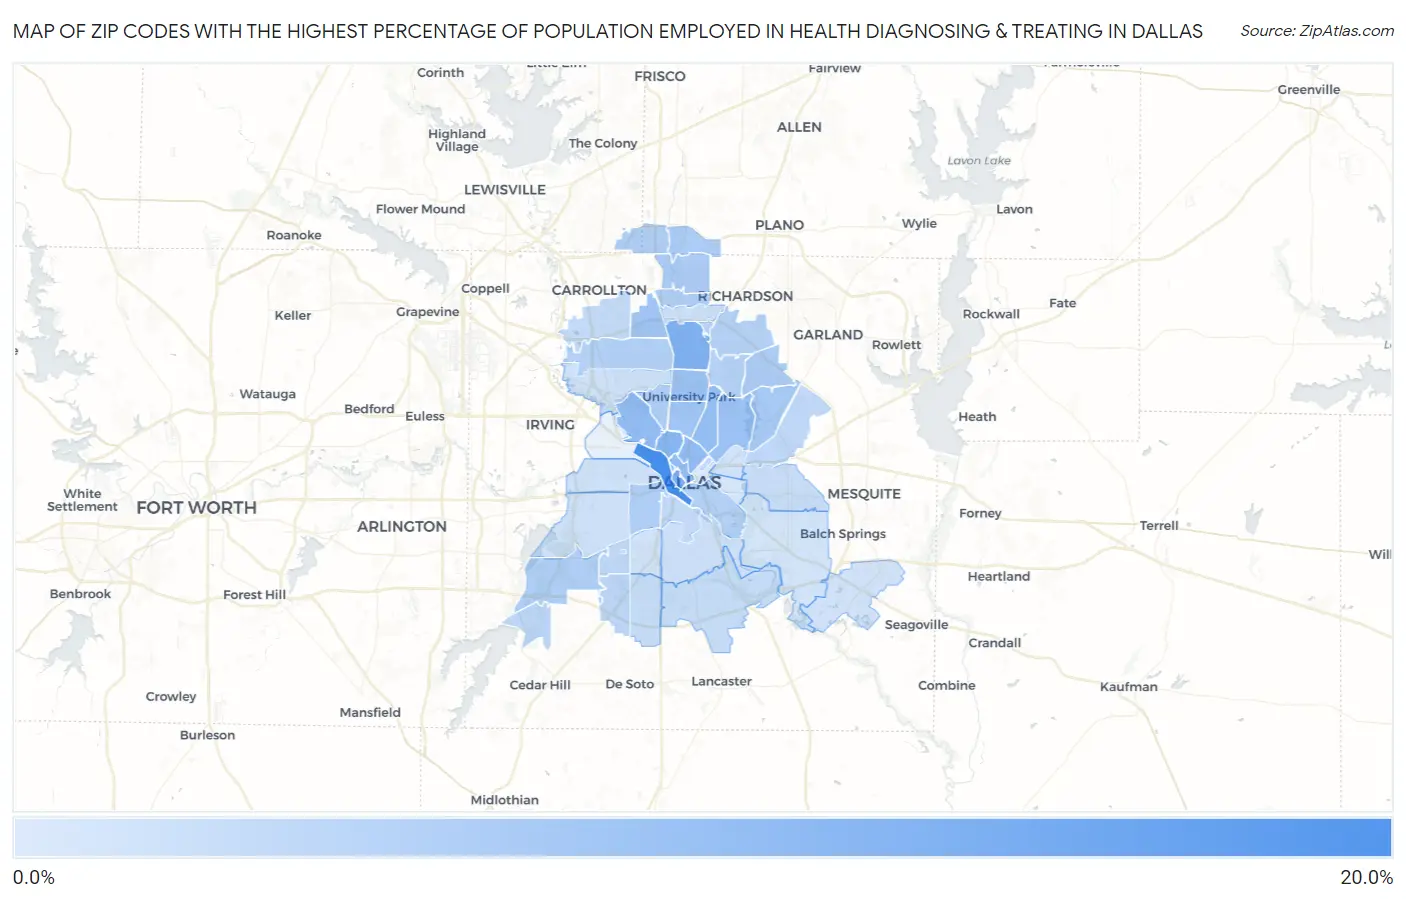
Map of Zip Codes with the Highest Percentage of Population Employed in Health Diagnosing & Treating in Dallas
0.95%
16.8%
Zip Codes with the Highest Percentage of Population Employed in Health Diagnosing & Treating in Dallas, TX
| Zip Code | % Employed | vs State | vs National | |
| 1. | 75207 | 16.8% | 5.5%(+11.3)#42 | 6.2%(+10.6)#844 |
| 2. | 75202 | 11.3% | 5.5%(+5.78)#111 | 6.2%(+5.05)#2,664 |
| 3. | 75230 | 10.5% | 5.5%(+5.03)#138 | 6.2%(+4.30)#3,266 |
| 4. | 75219 | 9.8% | 5.5%(+4.28)#172 | 6.2%(+3.55)#4,113 |
| 5. | 75204 | 8.6% | 5.5%(+3.09)#249 | 6.2%(+2.36)#6,123 |
| 6. | 75201 | 8.5% | 5.5%(+2.96)#261 | 6.2%(+2.23)#6,391 |
| 7. | 75235 | 8.4% | 5.5%(+2.89)#265 | 6.2%(+2.16)#6,512 |
| 8. | 75206 | 8.1% | 5.5%(+2.58)#305 | 6.2%(+1.85)#7,253 |
| 9. | 75214 | 7.8% | 5.5%(+2.24)#349 | 6.2%(+1.52)#8,095 |
| 10. | 75225 | 7.4% | 5.5%(+1.86)#394 | 6.2%(+1.13)#9,175 |
| 11. | 75244 | 7.1% | 5.5%(+1.60)#428 | 6.2%(+0.873)#9,974 |
| 12. | 75205 | 7.1% | 5.5%(+1.54)#436 | 6.2%(+0.817)#10,159 |
| 13. | 75218 | 6.4% | 5.5%(+0.840)#531 | 6.2%(+0.114)#12,538 |
| 14. | 75238 | 5.9% | 5.5%(+0.372)#617 | 6.2%(-0.354)#14,254 |
| 15. | 75248 | 5.8% | 5.5%(+0.240)#643 | 6.2%(-0.487)#14,758 |
| 16. | 75252 | 5.7% | 5.5%(+0.213)#650 | 6.2%(-0.513)#14,868 |
| 17. | 75209 | 5.5% | 5.5%(-0.010)#708 | 6.2%(-0.736)#15,745 |
| 18. | 75254 | 5.4% | 5.5%(-0.070)#724 | 6.2%(-0.797)#15,976 |
| 19. | 75287 | 5.4% | 5.5%(-0.095)#731 | 6.2%(-0.821)#16,077 |
| 20. | 75208 | 5.4% | 5.5%(-0.097)#732 | 6.2%(-0.823)#16,086 |
| 21. | 75236 | 5.3% | 5.5%(-0.232)#763 | 6.2%(-0.958)#16,603 |
| 22. | 75229 | 5.2% | 5.5%(-0.362)#789 | 6.2%(-1.09)#17,093 |
| 23. | 75215 | 5.1% | 5.5%(-0.444)#807 | 6.2%(-1.17)#17,407 |
| 24. | 75231 | 4.8% | 5.5%(-0.691)#861 | 6.2%(-1.42)#18,380 |
| 25. | 75243 | 4.8% | 5.5%(-0.727)#875 | 6.2%(-1.45)#18,529 |
| 26. | 75251 | 4.3% | 5.5%(-1.21)#981 | 6.2%(-1.94)#20,328 |
| 27. | 75249 | 4.3% | 5.5%(-1.25)#986 | 6.2%(-1.97)#20,441 |
| 28. | 75237 | 4.2% | 5.5%(-1.36)#1,025 | 6.2%(-2.09)#20,873 |
| 29. | 75228 | 4.0% | 5.5%(-1.51)#1,063 | 6.2%(-2.23)#21,340 |
| 30. | 75233 | 3.9% | 5.5%(-1.66)#1,101 | 6.2%(-2.38)#21,815 |
| 31. | 75203 | 3.7% | 5.5%(-1.77)#1,123 | 6.2%(-2.50)#22,152 |
| 32. | 75246 | 3.5% | 5.5%(-2.00)#1,175 | 6.2%(-2.73)#22,879 |
| 33. | 75234 | 3.4% | 5.5%(-2.08)#1,190 | 6.2%(-2.81)#23,085 |
| 34. | 75241 | 3.3% | 5.5%(-2.27)#1,235 | 6.2%(-2.99)#23,636 |
| 35. | 75232 | 3.2% | 5.5%(-2.33)#1,250 | 6.2%(-3.05)#23,809 |
| 36. | 75227 | 3.1% | 5.5%(-2.40)#1,272 | 6.2%(-3.13)#24,013 |
| 37. | 75216 | 2.6% | 5.5%(-2.89)#1,359 | 6.2%(-3.62)#25,195 |
| 38. | 75240 | 2.6% | 5.5%(-2.96)#1,375 | 6.2%(-3.69)#25,394 |
| 39. | 75220 | 2.3% | 5.5%(-3.22)#1,418 | 6.2%(-3.94)#25,924 |
| 40. | 75212 | 2.3% | 5.5%(-3.23)#1,420 | 6.2%(-3.96)#25,953 |
| 41. | 75211 | 2.2% | 5.5%(-3.27)#1,424 | 6.2%(-4.00)#26,010 |
| 42. | 75223 | 2.0% | 5.5%(-3.51)#1,462 | 6.2%(-4.24)#26,445 |
| 43. | 75253 | 2.0% | 5.5%(-3.53)#1,469 | 6.2%(-4.25)#26,474 |
| 44. | 75224 | 2.0% | 5.5%(-3.54)#1,471 | 6.2%(-4.27)#26,495 |
| 45. | 75217 | 1.9% | 5.5%(-3.62)#1,488 | 6.2%(-4.34)#26,633 |
| 46. | 75210 | 1.6% | 5.5%(-3.88)#1,536 | 6.2%(-4.61)#27,025 |
| 47. | 75226 | 0.95% | 5.5%(-4.57)#1,603 | 6.2%(-5.30)#27,912 |
1
Common Questions
What are the Top 10 Zip Codes with the Highest Percentage of Population Employed in Health Diagnosing & Treating in Dallas, TX?
Top 10 Zip Codes with the Highest Percentage of Population Employed in Health Diagnosing & Treating in Dallas, TX are:
What zip code has the Highest Percentage of Population Employed in Health Diagnosing & Treating in Dallas, TX?
75207 has the Highest Percentage of Population Employed in Health Diagnosing & Treating in Dallas, TX with 16.8%.
What is the Percentage of Population Employed in Health Diagnosing & Treating in Dallas, TX?
Percentage of Population Employed in Health Diagnosing & Treating in Dallas is 5.0%.
What is the Percentage of Population Employed in Health Diagnosing & Treating in Texas?
Percentage of Population Employed in Health Diagnosing & Treating in Texas is 5.5%.
What is the Percentage of Population Employed in Health Diagnosing & Treating in the United States?
Percentage of Population Employed in Health Diagnosing & Treating in the United States is 6.2%.