Dickens, TX Map & Demographics
Dickens Map
Dickens Overview
$29,497
PER CAPITA INCOME
$39,583
AVG FAMILY INCOME
$40,875
AVG HOUSEHOLD INCOME
0.43
INEQUALITY / GINI INDEX
197
TOTAL POPULATION
88
MALE POPULATION
109
FEMALE POPULATION
80.73
MALES / 100 FEMALES
123.86
FEMALES / 100 MALES
55.5
MEDIAN AGE
2.4
AVG FAMILY SIZE
1.9
AVG HOUSEHOLD SIZE
68
LABOR FORCE [ PEOPLE ]
37.4%
PERCENT IN LABOR FORCE
Dickens Zip Codes
Dickens Area Codes
Income in Dickens
Income Overview in Dickens
Per Capita Income in Dickens is $29,497, while median incomes of families and households are $39,583 and $40,875 respectively.
| Characteristic | Number | Measure |
| Per Capita Income | 197 | $29,497 |
| Median Family Income | 50 | $39,583 |
| Mean Family Income | 50 | $60,580 |
| Median Household Income | 91 | $40,875 |
| Mean Household Income | 91 | $59,976 |
| Income Deficit | 50 | $0 |
| Wage / Income Gap (%) | 197 | 0.00% |
| Wage / Income Gap ($) | 197 | 100.00¢ per $1 |
| Gini / Inequality Index | 197 | 0.43 |
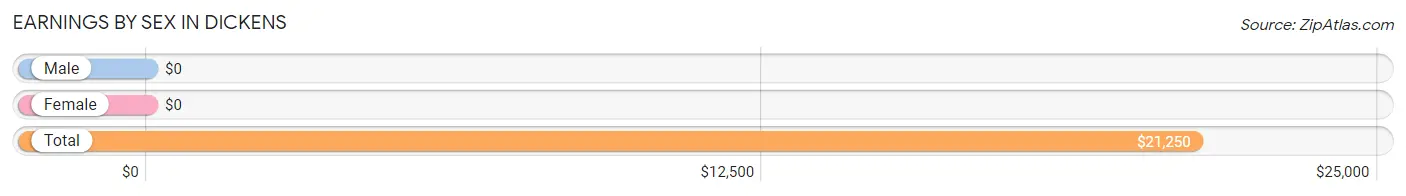
Earnings by Sex in Dickens
| Sex | Number | Average Earnings |
| Male | 53 (52.0%) | $0 |
| Female | 49 (48.0%) | $0 |
| Total | 102 (100.0%) | $21,250 |
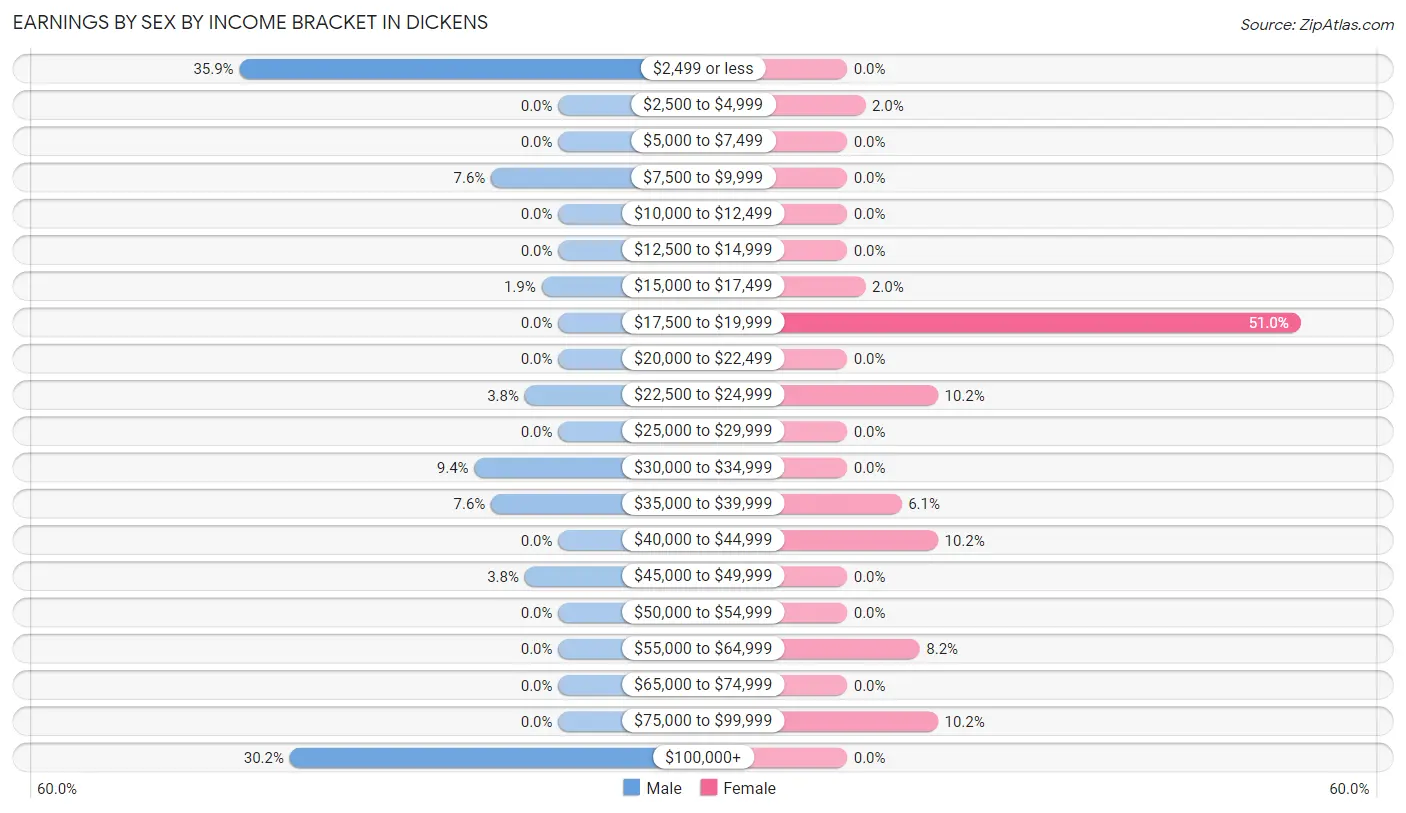
Earnings by Sex by Income Bracket in Dickens
The most common earnings brackets in Dickens are $2,499 or less for men (19 | 35.8%) and $17,500 to $19,999 for women (25 | 51.0%).
| Income | Male | Female |
| $2,499 or less | 19 (35.8%) | 0 (0.0%) |
| $2,500 to $4,999 | 0 (0.0%) | 1 (2.0%) |
| $5,000 to $7,499 | 0 (0.0%) | 0 (0.0%) |
| $7,500 to $9,999 | 4 (7.5%) | 0 (0.0%) |
| $10,000 to $12,499 | 0 (0.0%) | 0 (0.0%) |
| $12,500 to $14,999 | 0 (0.0%) | 0 (0.0%) |
| $15,000 to $17,499 | 1 (1.9%) | 1 (2.0%) |
| $17,500 to $19,999 | 0 (0.0%) | 25 (51.0%) |
| $20,000 to $22,499 | 0 (0.0%) | 0 (0.0%) |
| $22,500 to $24,999 | 2 (3.8%) | 5 (10.2%) |
| $25,000 to $29,999 | 0 (0.0%) | 0 (0.0%) |
| $30,000 to $34,999 | 5 (9.4%) | 0 (0.0%) |
| $35,000 to $39,999 | 4 (7.5%) | 3 (6.1%) |
| $40,000 to $44,999 | 0 (0.0%) | 5 (10.2%) |
| $45,000 to $49,999 | 2 (3.8%) | 0 (0.0%) |
| $50,000 to $54,999 | 0 (0.0%) | 0 (0.0%) |
| $55,000 to $64,999 | 0 (0.0%) | 4 (8.2%) |
| $65,000 to $74,999 | 0 (0.0%) | 0 (0.0%) |
| $75,000 to $99,999 | 0 (0.0%) | 5 (10.2%) |
| $100,000+ | 16 (30.2%) | 0 (0.0%) |
| Total | 53 (100.0%) | 49 (100.0%) |
Earnings by Sex by Educational Attainment in Dickens
| Educational Attainment | Male Income | Female Income |
| Less than High School | - | - |
| High School Diploma | - | - |
| College or Associate's Degree | - | - |
| Bachelor's Degree | - | - |
| Graduate Degree | - | - |
| Total | - | - |
Family Income in Dickens
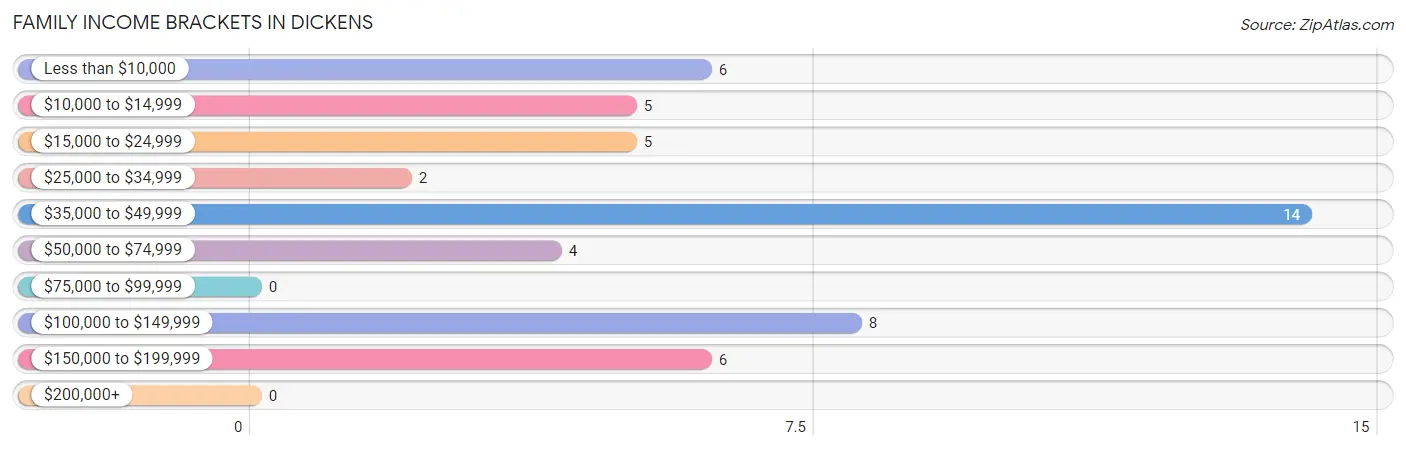
Family Income Brackets in Dickens
According to the Dickens family income data, there are 14 families falling into the $35,000 to $49,999 income range, which is the most common income bracket and makes up 28.0% of all families.
| Income Bracket | # Families | % Families |
| Less than $10,000 | 6 | 12.0% |
| $10,000 to $14,999 | 5 | 10.0% |
| $15,000 to $24,999 | 5 | 10.0% |
| $25,000 to $34,999 | 2 | 4.0% |
| $35,000 to $49,999 | 14 | 28.0% |
| $50,000 to $74,999 | 4 | 8.0% |
| $75,000 to $99,999 | 0 | 0.0% |
| $100,000 to $149,999 | 8 | 16.0% |
| $150,000 to $199,999 | 6 | 12.0% |
| $200,000+ | 0 | 0.0% |
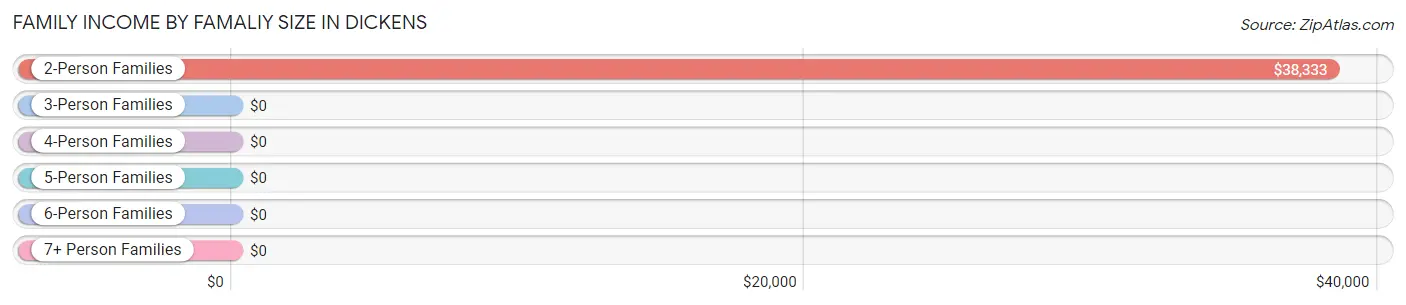
Family Income by Famaliy Size in Dickens
2-person families (40 | 80.0%) account for the highest median family income in Dickens with $38,333 per family, while 2-person families (40 | 80.0%) have the highest median income of $19,166 per family member.
| Income Bracket | # Families | Median Income |
| 2-Person Families | 40 (80.0%) | $38,333 |
| 3-Person Families | 7 (14.0%) | $0 |
| 4-Person Families | 0 (0.0%) | $0 |
| 5-Person Families | 3 (6.0%) | $0 |
| 6-Person Families | 0 (0.0%) | $0 |
| 7+ Person Families | 0 (0.0%) | $0 |
| Total | 50 (100.0%) | $39,583 |
Family Income by Number of Earners in Dickens
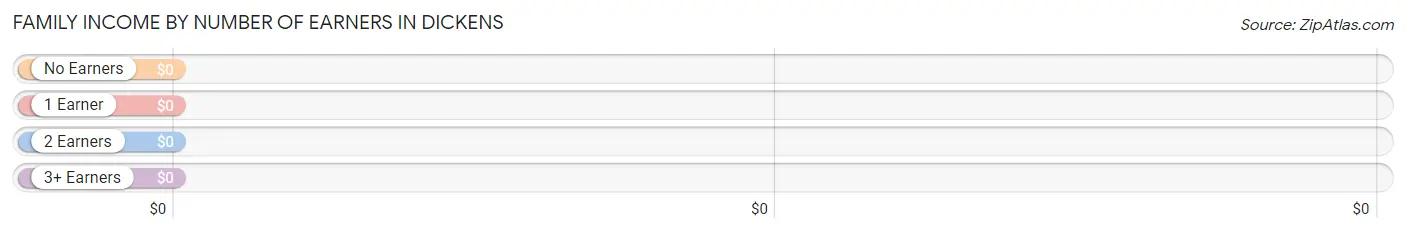
| Number of Earners | # Families | Median Income |
| No Earners | 24 (48.0%) | $0 |
| 1 Earner | 17 (34.0%) | $0 |
| 2 Earners | 6 (12.0%) | $0 |
| 3+ Earners | 3 (6.0%) | $0 |
| Total | 50 (100.0%) | $39,583 |
Household Income in Dickens
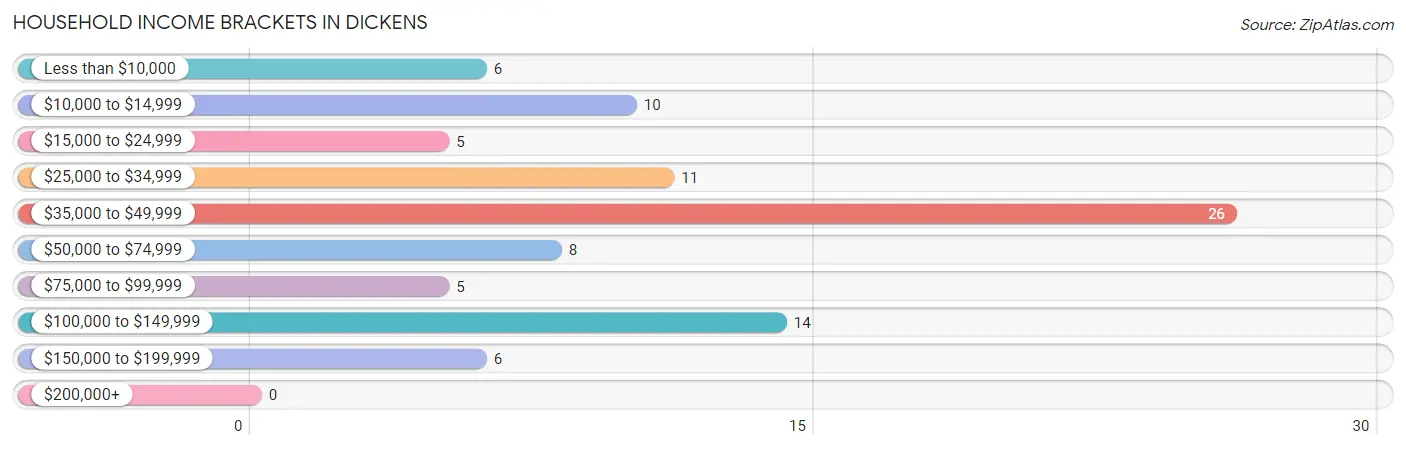
Household Income Brackets in Dickens
With 26 households falling in the category, the $35,000 to $49,999 income range is the most frequent in Dickens, accounting for 28.6% of all households.
| Income Bracket | # Households | % Households |
| Less than $10,000 | 6 | 6.6% |
| $10,000 to $14,999 | 10 | 11.0% |
| $15,000 to $24,999 | 5 | 5.5% |
| $25,000 to $34,999 | 11 | 12.1% |
| $35,000 to $49,999 | 26 | 28.6% |
| $50,000 to $74,999 | 8 | 8.8% |
| $75,000 to $99,999 | 5 | 5.5% |
| $100,000 to $149,999 | 14 | 15.4% |
| $150,000 to $199,999 | 6 | 6.6% |
| $200,000+ | 0 | 0.0% |
Household Income by Householder Age in Dickens
The median household income in Dickens is $40,875, with the highest median household income of $41,000 found in the 45 to 64 years age bracket for the primary householder. A total of 62 households (68.1%) fall into this category.
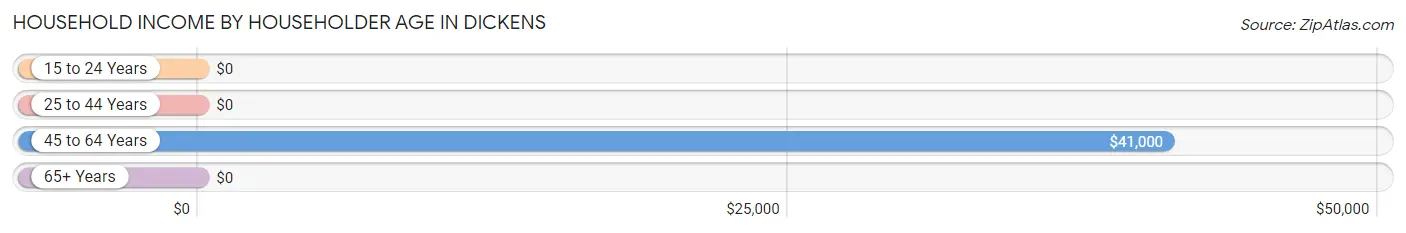
| Income Bracket | # Households | Median Income |
| 15 to 24 Years | 0 (0.0%) | $0 |
| 25 to 44 Years | 5 (5.5%) | $0 |
| 45 to 64 Years | 62 (68.1%) | $41,000 |
| 65+ Years | 24 (26.4%) | $0 |
| Total | 91 (100.0%) | $40,875 |
Poverty in Dickens
Income Below Poverty by Sex and Age in Dickens
With 19.3% poverty level for males and 29.5% for females among the residents of Dickens, 12 to 14 year old males and 75 year old and over females are the most vulnerable to poverty, with 3 males (100.0%) and 4 females (66.7%) in their respective age groups living below the poverty level.
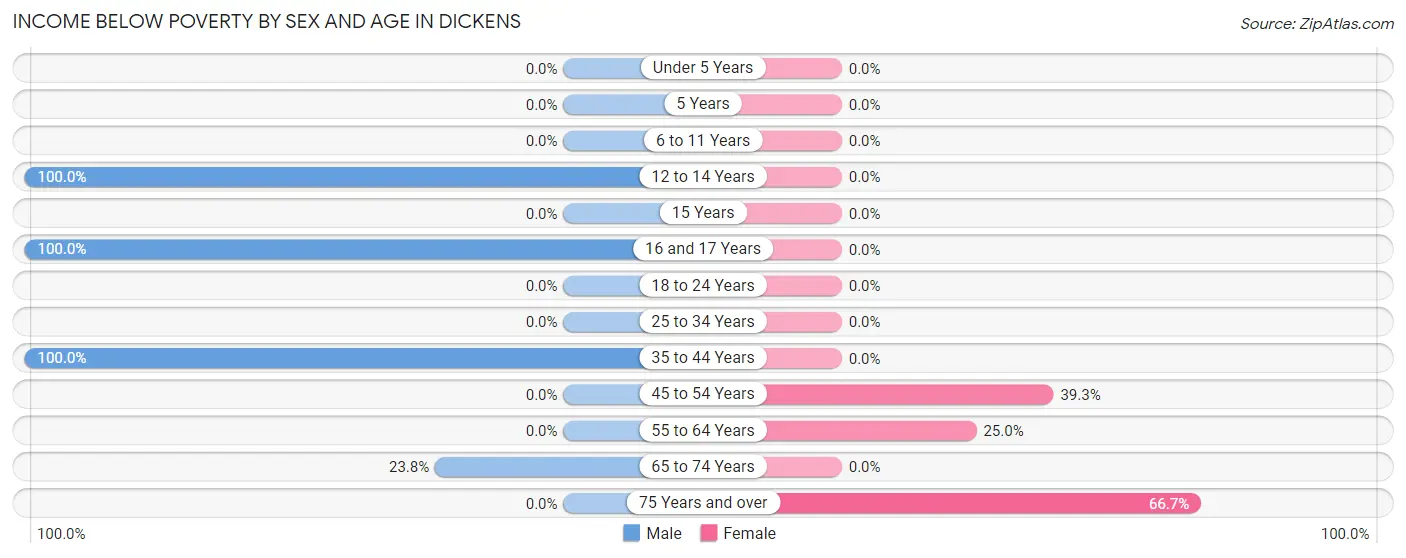
| Age Bracket | Male | Female |
| Under 5 Years | 0 (0.0%) | 0 (0.0%) |
| 5 Years | 0 (0.0%) | 0 (0.0%) |
| 6 to 11 Years | 0 (0.0%) | 0 (0.0%) |
| 12 to 14 Years | 3 (100.0%) | 0 (0.0%) |
| 15 Years | 0 (0.0%) | 0 (0.0%) |
| 16 and 17 Years | 4 (100.0%) | 0 (0.0%) |
| 18 to 24 Years | 0 (0.0%) | 0 (0.0%) |
| 25 to 34 Years | 0 (0.0%) | 0 (0.0%) |
| 35 to 44 Years | 5 (100.0%) | 0 (0.0%) |
| 45 to 54 Years | 0 (0.0%) | 11 (39.3%) |
| 55 to 64 Years | 0 (0.0%) | 8 (25.0%) |
| 65 to 74 Years | 5 (23.8%) | 0 (0.0%) |
| 75 Years and over | 0 (0.0%) | 4 (66.7%) |
| Total | 17 (19.3%) | 23 (29.5%) |
Income Above Poverty by Sex and Age in Dickens
According to the poverty statistics in Dickens, males aged 25 to 34 years and females aged under 5 years are the age groups that are most secure financially, with 100.0% of males and 100.0% of females in these age groups living above the poverty line.
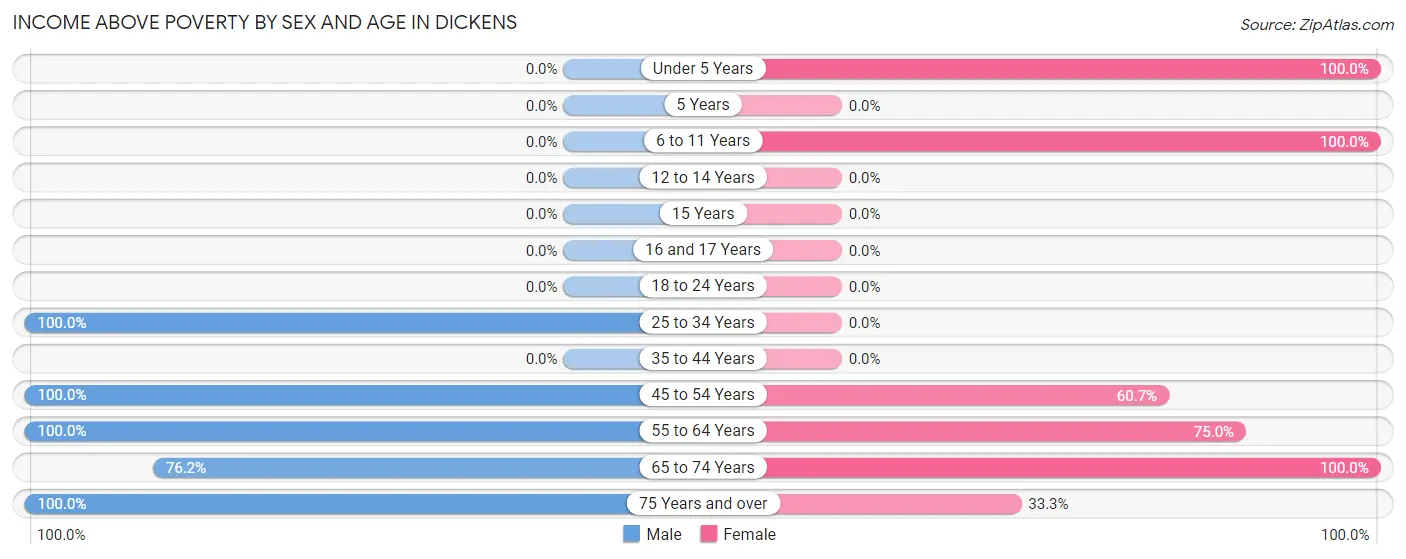
| Age Bracket | Male | Female |
| Under 5 Years | 0 (0.0%) | 2 (100.0%) |
| 5 Years | 0 (0.0%) | 0 (0.0%) |
| 6 to 11 Years | 0 (0.0%) | 3 (100.0%) |
| 12 to 14 Years | 0 (0.0%) | 0 (0.0%) |
| 15 Years | 0 (0.0%) | 0 (0.0%) |
| 16 and 17 Years | 0 (0.0%) | 0 (0.0%) |
| 18 to 24 Years | 0 (0.0%) | 0 (0.0%) |
| 25 to 34 Years | 13 (100.0%) | 0 (0.0%) |
| 35 to 44 Years | 0 (0.0%) | 0 (0.0%) |
| 45 to 54 Years | 7 (100.0%) | 17 (60.7%) |
| 55 to 64 Years | 31 (100.0%) | 24 (75.0%) |
| 65 to 74 Years | 16 (76.2%) | 7 (100.0%) |
| 75 Years and over | 4 (100.0%) | 2 (33.3%) |
| Total | 71 (80.7%) | 55 (70.5%) |
Income Below Poverty Among Married-Couple Families in Dickens
The poverty statistics for married-couple families in Dickens show that 15.8% or 6 of the total 38 families live below the poverty line. Families with no children have the highest poverty rate of 18.2%, comprising of 6 families. On the other hand, families with 1 or 2 children have the lowest poverty rate of 0.0%, which includes 0 families.
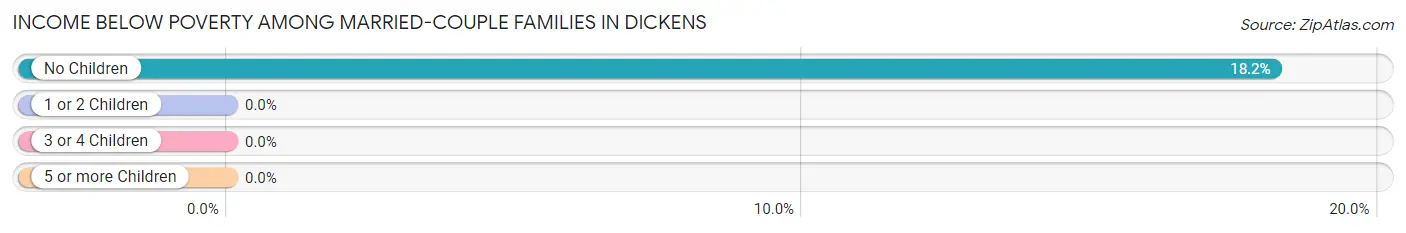
| Children | Above Poverty | Below Poverty |
| No Children | 27 (81.8%) | 6 (18.2%) |
| 1 or 2 Children | 5 (100.0%) | 0 (0.0%) |
| 3 or 4 Children | 0 (0.0%) | 0 (0.0%) |
| 5 or more Children | 0 (0.0%) | 0 (0.0%) |
| Total | 32 (84.2%) | 6 (15.8%) |
Income Below Poverty Among Single-Parent Households in Dickens
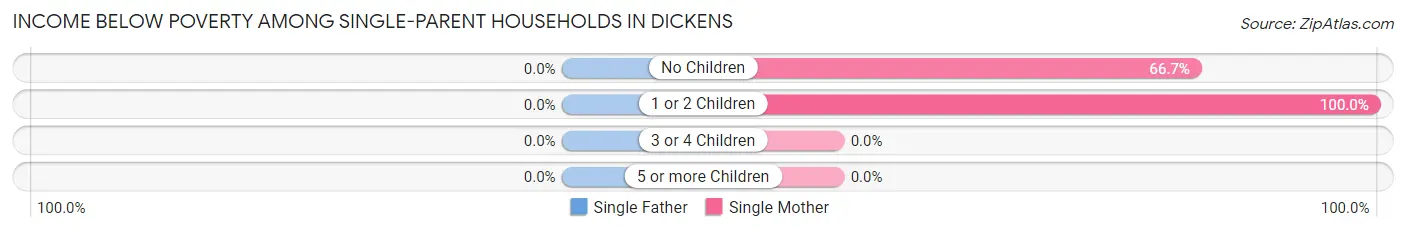
| Children | Single Father | Single Mother |
| No Children | 0 (0.0%) | 4 (66.7%) |
| 1 or 2 Children | 0 (0.0%) | 6 (100.0%) |
| 3 or 4 Children | 0 (0.0%) | 0 (0.0%) |
| 5 or more Children | 0 (0.0%) | 0 (0.0%) |
| Total | 0 (0.0%) | 10 (83.3%) |
Income Below Poverty Among Married-Couple vs Single-Parent Households in Dickens
The poverty data for Dickens shows that 6 of the married-couple family households (15.8%) and 10 of the single-parent households (83.3%) are living below the poverty level. Within the married-couple family households, those with no children have the highest poverty rate, with 6 households (18.2%) falling below the poverty line. Among the single-parent households, those with 1 or 2 children have the highest poverty rate, with 6 household (100.0%) living below poverty.
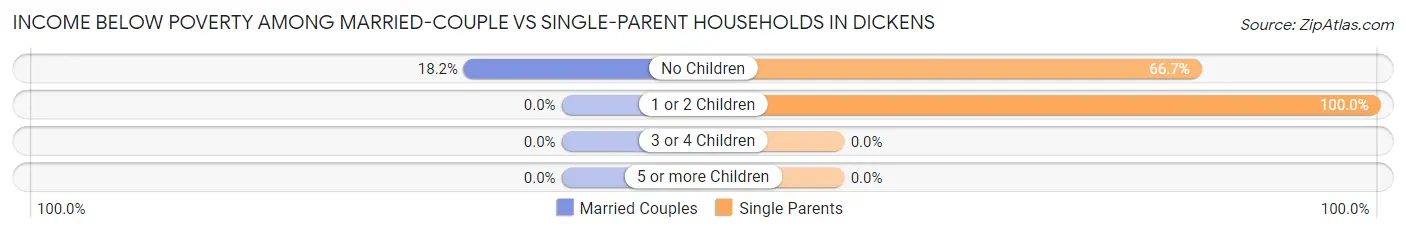
| Children | Married-Couple Families | Single-Parent Households |
| No Children | 6 (18.2%) | 4 (66.7%) |
| 1 or 2 Children | 0 (0.0%) | 6 (100.0%) |
| 3 or 4 Children | 0 (0.0%) | 0 (0.0%) |
| 5 or more Children | 0 (0.0%) | 0 (0.0%) |
| Total | 6 (15.8%) | 10 (83.3%) |
Race in Dickens
The most populous races in Dickens are White / Caucasian (153 | 77.7%), Hispanic or Latino (48 | 24.4%), and Black / African American (24 | 12.2%).
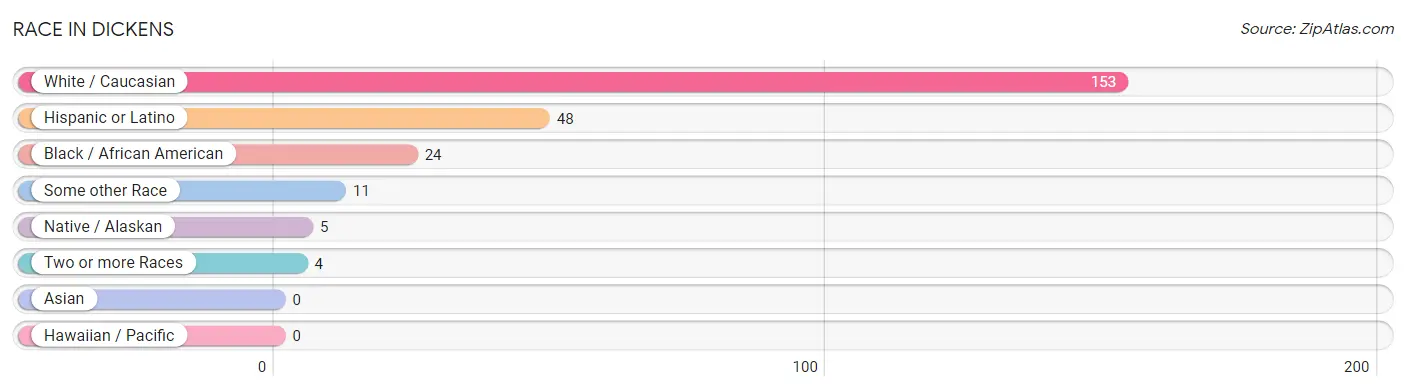
| Race | # Population | % Population |
| Asian | 0 | 0.0% |
| Black / African American | 24 | 12.2% |
| Hawaiian / Pacific | 0 | 0.0% |
| Hispanic or Latino | 48 | 24.4% |
| Native / Alaskan | 5 | 2.5% |
| White / Caucasian | 153 | 77.7% |
| Two or more Races | 4 | 2.0% |
| Some other Race | 11 | 5.6% |
| Total | 197 | 100.0% |
Ancestry in Dickens
The most populous ancestries reported in Dickens are Mexican (44 | 22.3%), Irish (37 | 18.8%), German (12 | 6.1%), English (11 | 5.6%), and Greek (5 | 2.5%), together accounting for 55.3% of all Dickens residents.
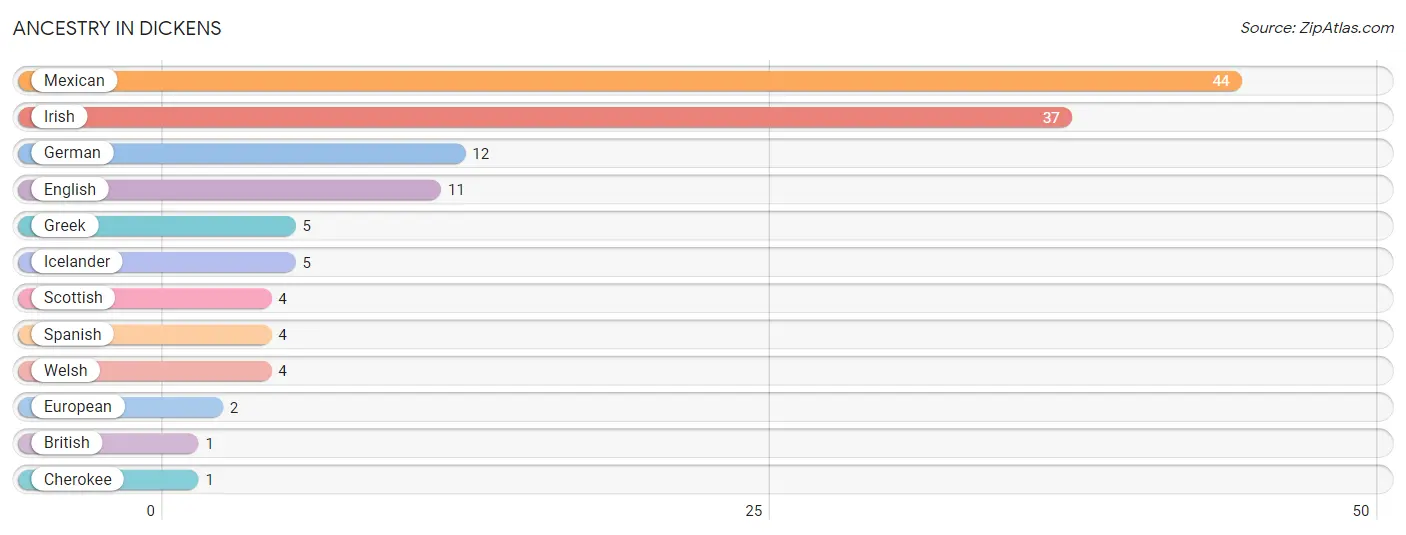
| Ancestry | # Population | % Population |
| British | 1 | 0.5% |
| Cherokee | 1 | 0.5% |
| English | 11 | 5.6% |
| European | 2 | 1.0% |
| German | 12 | 6.1% |
| Greek | 5 | 2.5% |
| Icelander | 5 | 2.5% |
| Irish | 37 | 18.8% |
| Mexican | 44 | 22.3% |
| Scottish | 4 | 2.0% |
| Spanish | 4 | 2.0% |
| Welsh | 4 | 2.0% | View All 12 Rows |
Immigrants in Dickens
The most numerous immigrant groups reported in Dickens came from Central America (4 | 2.0%), Latin America (4 | 2.0%), and Mexico (4 | 2.0%), together accounting for 6.1% of all Dickens residents.
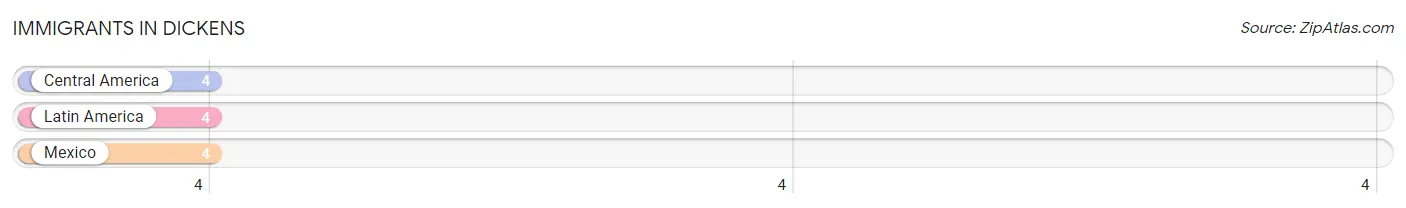
| Immigration Origin | # Population | % Population |
| Central America | 4 | 2.0% |
| Latin America | 4 | 2.0% |
| Mexico | 4 | 2.0% | View All 3 Rows |
Sex and Age in Dickens
Sex and Age in Dickens
The most populous age groups in Dickens are 60 to 64 Years (29 | 33.0%) for men and 35 to 39 Years (24 | 22.0%) for women.
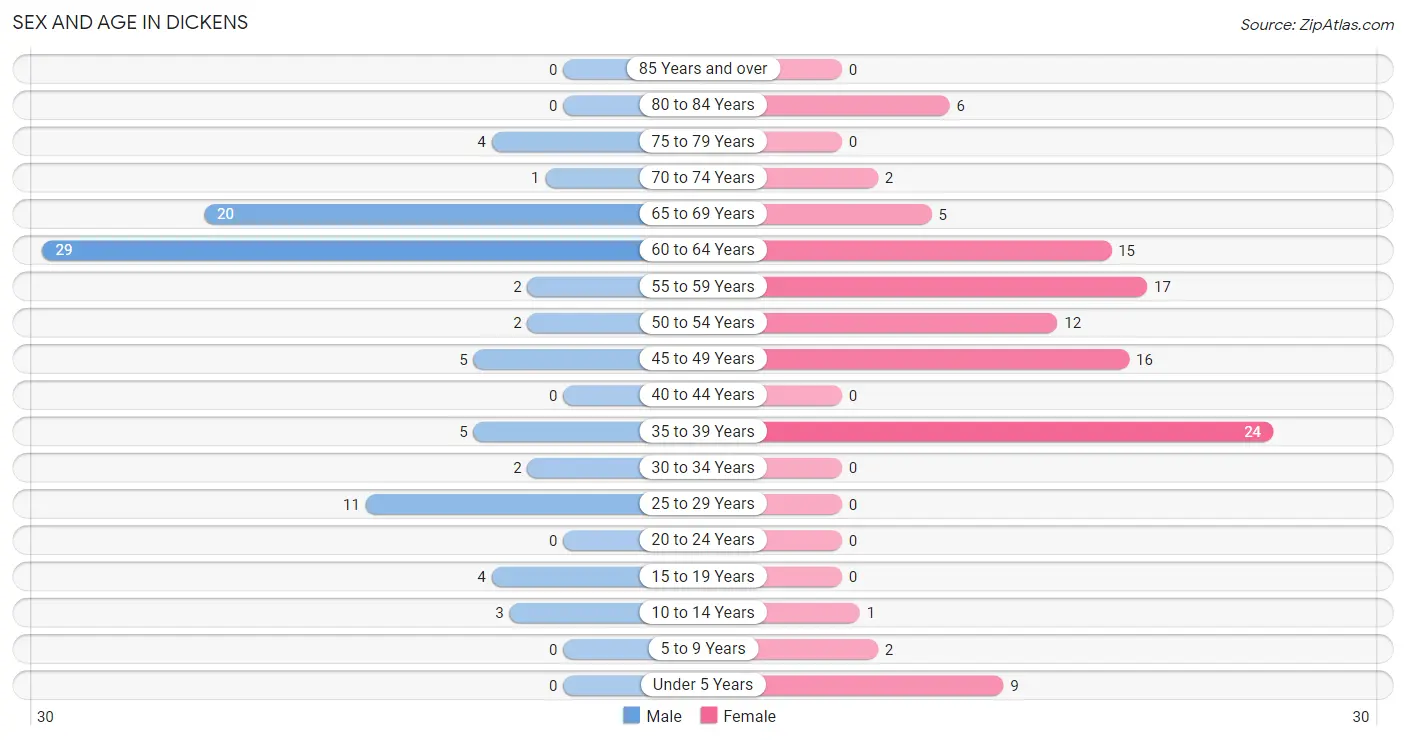
| Age Bracket | Male | Female |
| Under 5 Years | 0 (0.0%) | 9 (8.3%) |
| 5 to 9 Years | 0 (0.0%) | 2 (1.8%) |
| 10 to 14 Years | 3 (3.4%) | 1 (0.9%) |
| 15 to 19 Years | 4 (4.5%) | 0 (0.0%) |
| 20 to 24 Years | 0 (0.0%) | 0 (0.0%) |
| 25 to 29 Years | 11 (12.5%) | 0 (0.0%) |
| 30 to 34 Years | 2 (2.3%) | 0 (0.0%) |
| 35 to 39 Years | 5 (5.7%) | 24 (22.0%) |
| 40 to 44 Years | 0 (0.0%) | 0 (0.0%) |
| 45 to 49 Years | 5 (5.7%) | 16 (14.7%) |
| 50 to 54 Years | 2 (2.3%) | 12 (11.0%) |
| 55 to 59 Years | 2 (2.3%) | 17 (15.6%) |
| 60 to 64 Years | 29 (33.0%) | 15 (13.8%) |
| 65 to 69 Years | 20 (22.7%) | 5 (4.6%) |
| 70 to 74 Years | 1 (1.1%) | 2 (1.8%) |
| 75 to 79 Years | 4 (4.5%) | 0 (0.0%) |
| 80 to 84 Years | 0 (0.0%) | 6 (5.5%) |
| 85 Years and over | 0 (0.0%) | 0 (0.0%) |
| Total | 88 (100.0%) | 109 (100.0%) |
Families and Households in Dickens
Median Family Size in Dickens
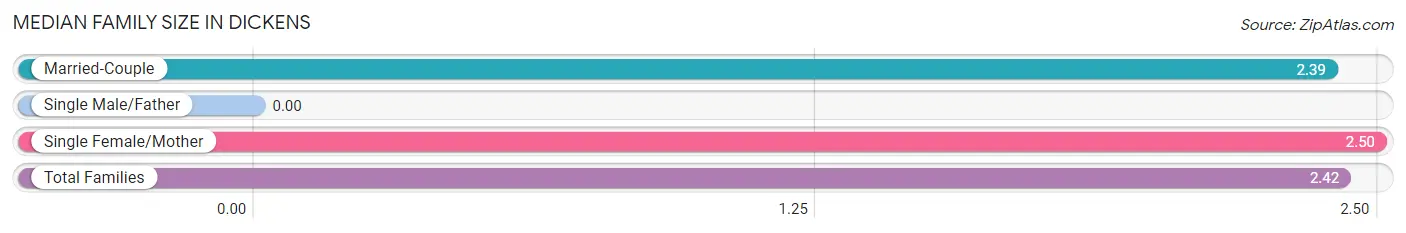
| Family Type | # Families | Family Size |
| Married-Couple | 38 (76.0%) | 2.39 |
| Single Male/Father | 0 (0.0%) | - |
| Single Female/Mother | 12 (24.0%) | 2.50 |
| Total Families | 50 (100.0%) | 2.42 |
Median Household Size in Dickens
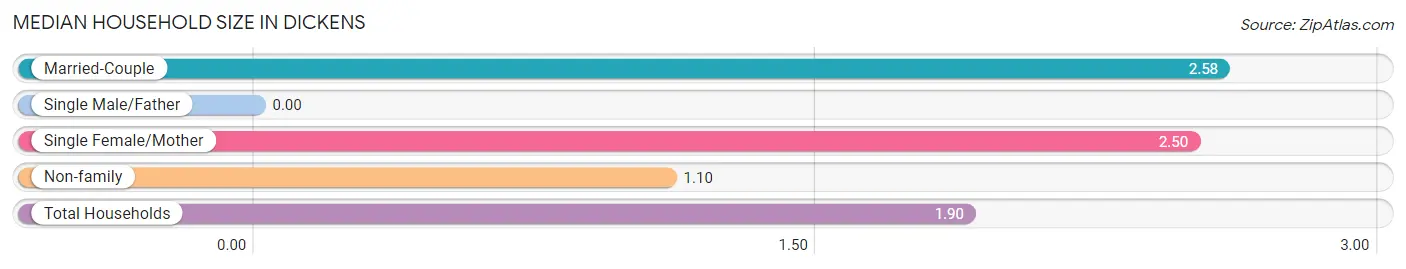
| Household Type | # Households | Household Size |
| Married-Couple | 38 (41.8%) | 2.58 |
| Single Male/Father | 0 (0.0%) | - |
| Single Female/Mother | 12 (13.2%) | 2.50 |
| Non-family | 41 (45.1%) | 1.10 |
| Total Households | 91 (100.0%) | 1.90 |
Household Size by Marriage Status in Dickens
Out of a total of 91 households in Dickens, 50 (54.9%) are family households, while 41 (45.1%) are nonfamily households. The most numerous type of family households are 2-person households, comprising 35, and the most common type of nonfamily households are 1-person households, comprising 35.
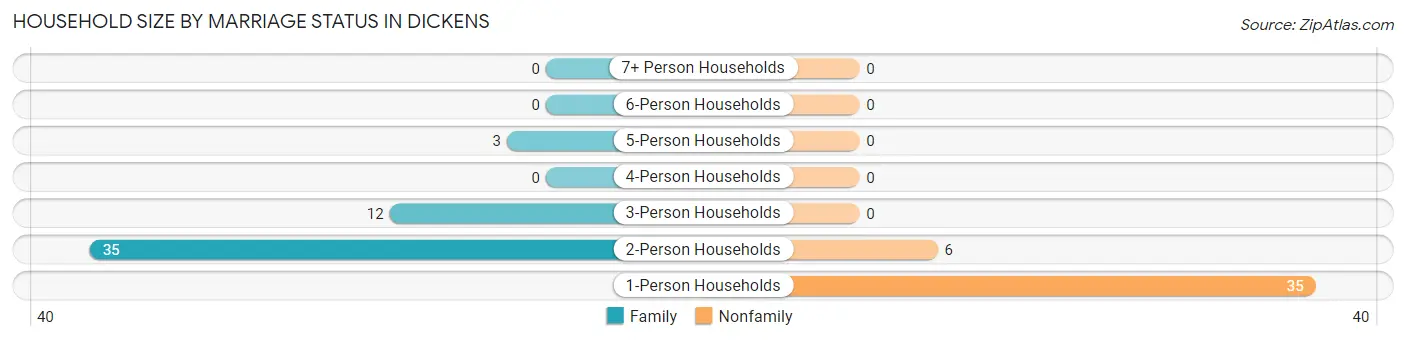
| Household Size | Family Households | Nonfamily Households |
| 1-Person Households | - | 35 (38.5%) |
| 2-Person Households | 35 (38.5%) | 6 (6.6%) |
| 3-Person Households | 12 (13.2%) | 0 (0.0%) |
| 4-Person Households | 0 (0.0%) | 0 (0.0%) |
| 5-Person Households | 3 (3.3%) | 0 (0.0%) |
| 6-Person Households | 0 (0.0%) | 0 (0.0%) |
| 7+ Person Households | 0 (0.0%) | 0 (0.0%) |
| Total | 50 (54.9%) | 41 (45.1%) |
Female Fertility in Dickens
Fertility by Age in Dickens
| Age Bracket | Women with Births | Births / 1,000 Women |
| 15 to 19 years | 0 (0.0%) | 0.0 |
| 20 to 34 years | 0 (0.0%) | 0.0 |
| 35 to 50 years | 0 (0.0%) | 0.0 |
| Total | 0 (0.0%) | 0.0 |
Fertility by Age by Marriage Status in Dickens
| Age Bracket | Married | Unmarried |
| 15 to 19 years | 0 (0.0%) | 0 (0.0%) |
| 20 to 34 years | 0 (0.0%) | 0 (0.0%) |
| 35 to 50 years | 0 (0.0%) | 0 (0.0%) |
| Total | 0 (0.0%) | 0 (0.0%) |
Fertility by Education in Dickens
| Educational Attainment | Women with Births | Births / 1,000 Women |
| Less than High School | 0 (0.0%) | 0.0 |
| High School Diploma | 0 (0.0%) | 0.0 |
| College or Associate's Degree | 0 (0.0%) | 0.0 |
| Bachelor's Degree | 0 (0.0%) | 0.0 |
| Graduate Degree | 0 (0.0%) | 0.0 |
| Total | 0 (0.0%) | 0.0 |
Fertility by Education by Marriage Status in Dickens
| Educational Attainment | Married | Unmarried |
| Less than High School | 0 (0.0%) | 0 (0.0%) |
| High School Diploma | 0 (0.0%) | 0 (0.0%) |
| College or Associate's Degree | 0 (0.0%) | 0 (0.0%) |
| Bachelor's Degree | 0 (0.0%) | 0 (0.0%) |
| Graduate Degree | 0 (0.0%) | 0 (0.0%) |
| Total | 0 (0.0%) | 0 (0.0%) |
Employment Characteristics in Dickens
Employment by Class of Employer in Dickens
Among the 68 employed individuals in Dickens, private company employees (47 | 69.1%), local government employees (13 | 19.1%), and self-employed (not incorporated) (4 | 5.9%) make up the most common classes of employment.
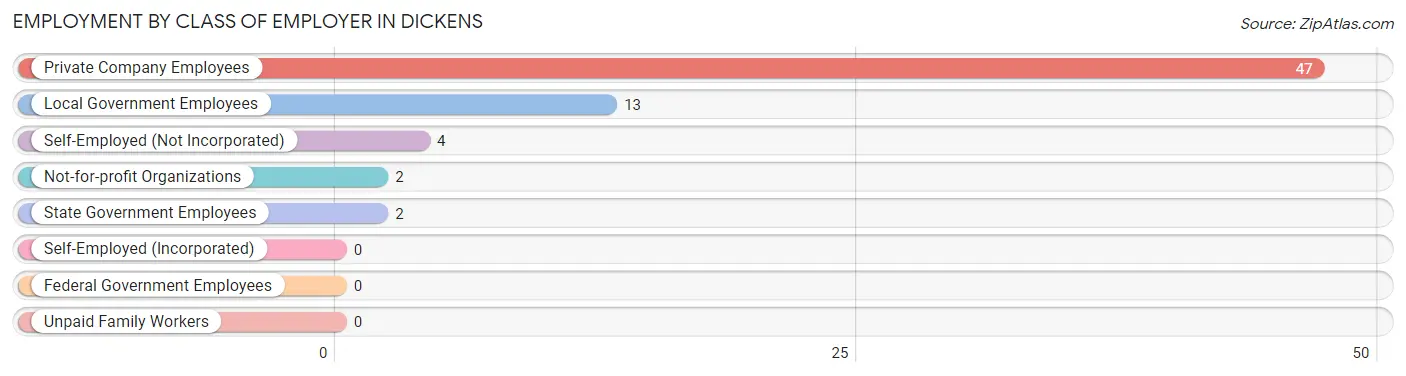
| Employer Class | # Employees | % Employees |
| Private Company Employees | 47 | 69.1% |
| Self-Employed (Incorporated) | 0 | 0.0% |
| Self-Employed (Not Incorporated) | 4 | 5.9% |
| Not-for-profit Organizations | 2 | 2.9% |
| Local Government Employees | 13 | 19.1% |
| State Government Employees | 2 | 2.9% |
| Federal Government Employees | 0 | 0.0% |
| Unpaid Family Workers | 0 | 0.0% |
| Total | 68 | 100.0% |
Employment Status by Age in Dickens
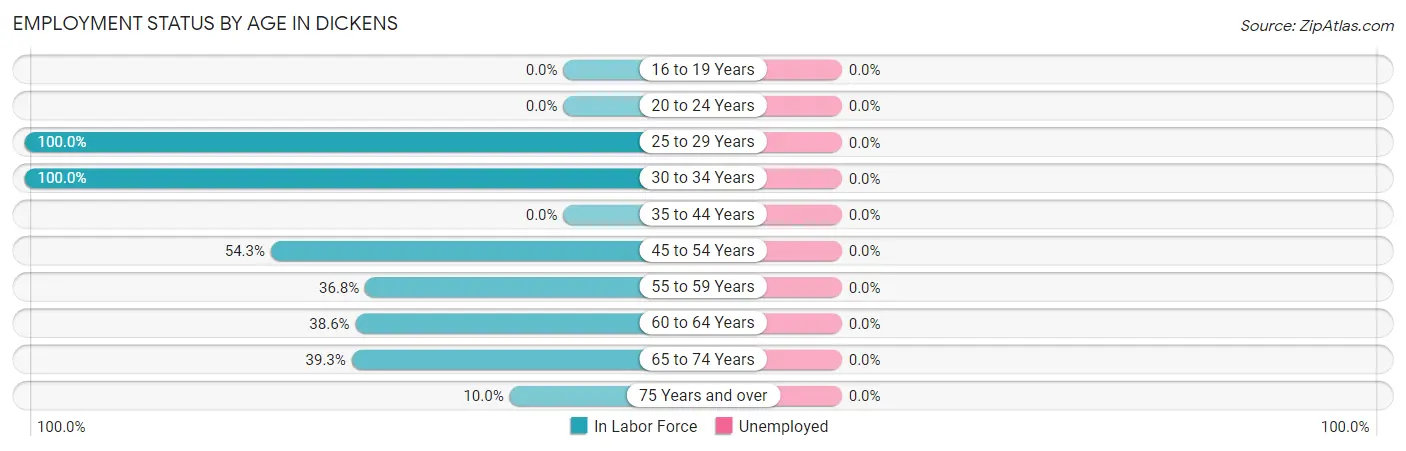
| Age Bracket | In Labor Force | Unemployed |
| 16 to 19 Years | 0 (0.0%) | 0 (0.0%) |
| 20 to 24 Years | 0 (0.0%) | 0 (0.0%) |
| 25 to 29 Years | 11 (100.0%) | 0 (0.0%) |
| 30 to 34 Years | 2 (100.0%) | 0 (0.0%) |
| 35 to 44 Years | 0 (0.0%) | 0 (0.0%) |
| 45 to 54 Years | 19 (54.3%) | 0 (0.0%) |
| 55 to 59 Years | 7 (36.8%) | 0 (0.0%) |
| 60 to 64 Years | 17 (38.6%) | 0 (0.0%) |
| 65 to 74 Years | 11 (39.3%) | 0 (0.0%) |
| 75 Years and over | 1 (10.0%) | 0 (0.0%) |
| Total | 68 (37.4%) | 0 (0.0%) |
Employment Status by Educational Attainment in Dickens
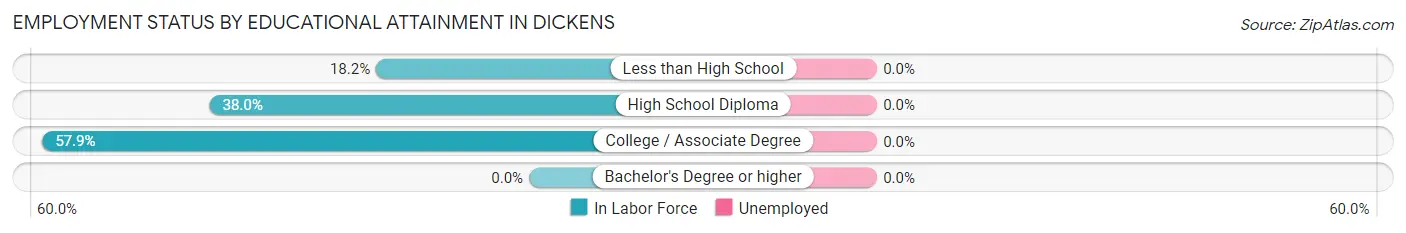
| Educational Attainment | In Labor Force | Unemployed |
| Less than High School | 4 (18.2%) | 0 (0.0%) |
| High School Diploma | 30 (38.0%) | 0 (0.0%) |
| College / Associate Degree | 22 (57.9%) | 0 (0.0%) |
| Bachelor's Degree or higher | 0 (0.0%) | 0 (0.0%) |
| Total | 56 (40.0%) | 0 (0.0%) |
Employment Occupations by Sex in Dickens
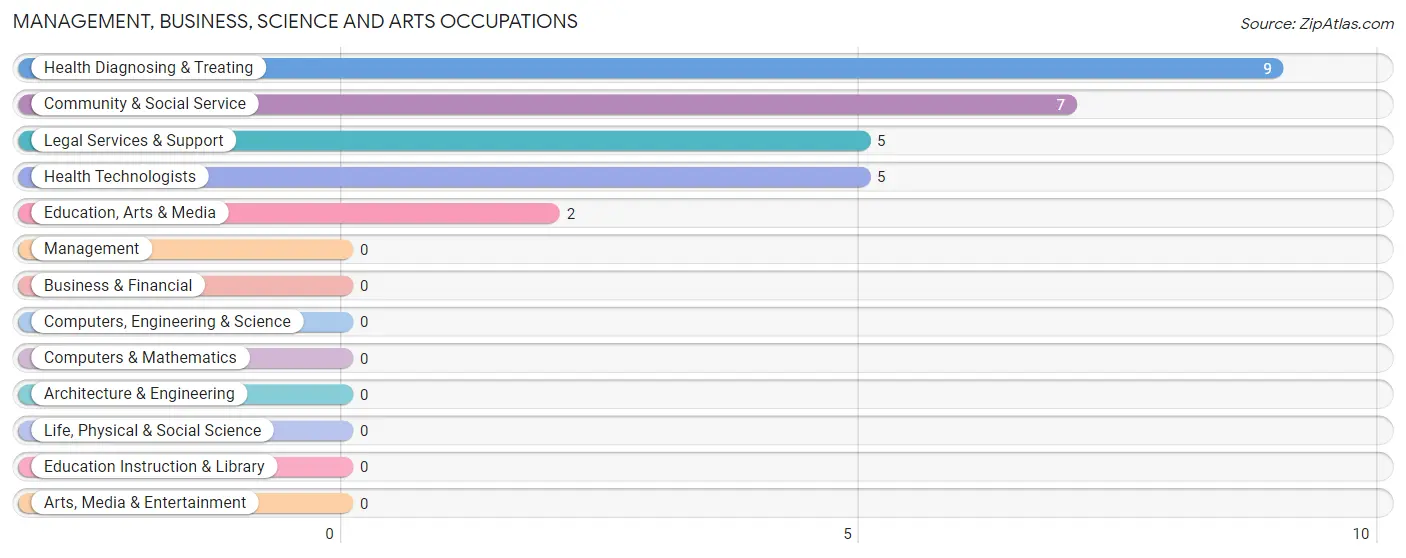
Management, Business, Science and Arts Occupations
The most common Management, Business, Science and Arts occupations in Dickens are Health Diagnosing & Treating (9 | 13.2%), Community & Social Service (7 | 10.3%), Legal Services & Support (5 | 7.3%), Health Technologists (5 | 7.3%), and Education, Arts & Media (2 | 2.9%).
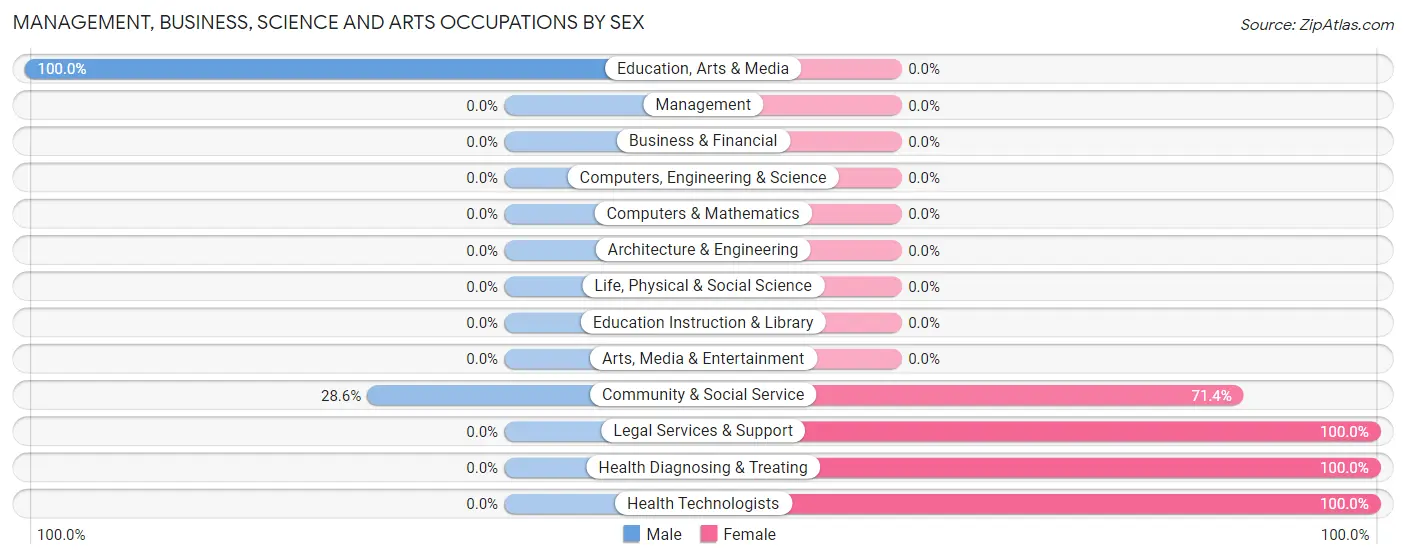
Management, Business, Science and Arts Occupations by Sex
Within the Management, Business, Science and Arts occupations in Dickens, the most male-oriented occupations are Education, Arts & Media (100.0%), and Community & Social Service (28.6%), while the most female-oriented occupations are Legal Services & Support (100.0%), Health Diagnosing & Treating (100.0%), and Health Technologists (100.0%).
| Occupation | Male | Female |
| Management | 0 (0.0%) | 0 (0.0%) |
| Business & Financial | 0 (0.0%) | 0 (0.0%) |
| Computers, Engineering & Science | 0 (0.0%) | 0 (0.0%) |
| Computers & Mathematics | 0 (0.0%) | 0 (0.0%) |
| Architecture & Engineering | 0 (0.0%) | 0 (0.0%) |
| Life, Physical & Social Science | 0 (0.0%) | 0 (0.0%) |
| Community & Social Service | 2 (28.6%) | 5 (71.4%) |
| Education, Arts & Media | 2 (100.0%) | 0 (0.0%) |
| Legal Services & Support | 0 (0.0%) | 5 (100.0%) |
| Education Instruction & Library | 0 (0.0%) | 0 (0.0%) |
| Arts, Media & Entertainment | 0 (0.0%) | 0 (0.0%) |
| Health Diagnosing & Treating | 0 (0.0%) | 9 (100.0%) |
| Health Technologists | 0 (0.0%) | 5 (100.0%) |
| Total (Category) | 2 (12.5%) | 14 (87.5%) |
| Total (Overall) | 45 (66.2%) | 23 (33.8%) |
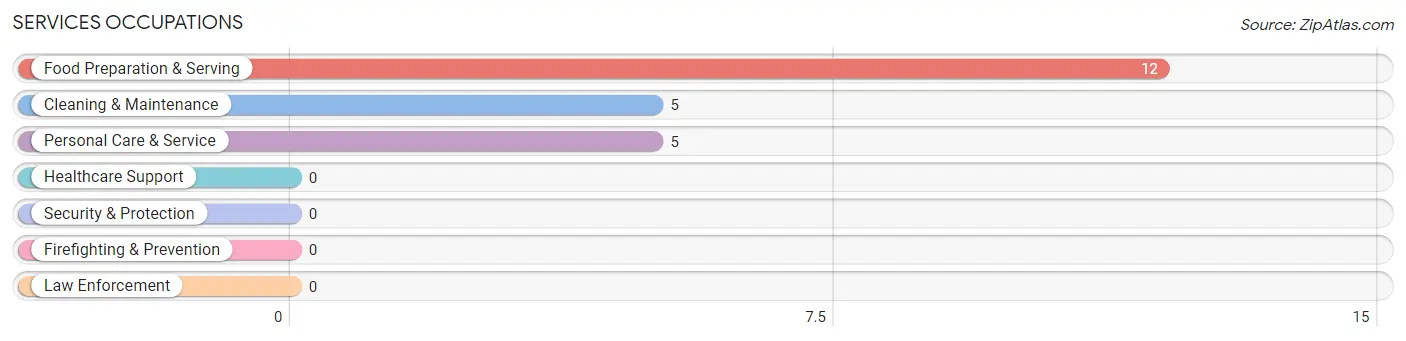
Services Occupations
The most common Services occupations in Dickens are Food Preparation & Serving (12 | 17.6%), Cleaning & Maintenance (5 | 7.3%), and Personal Care & Service (5 | 7.3%).
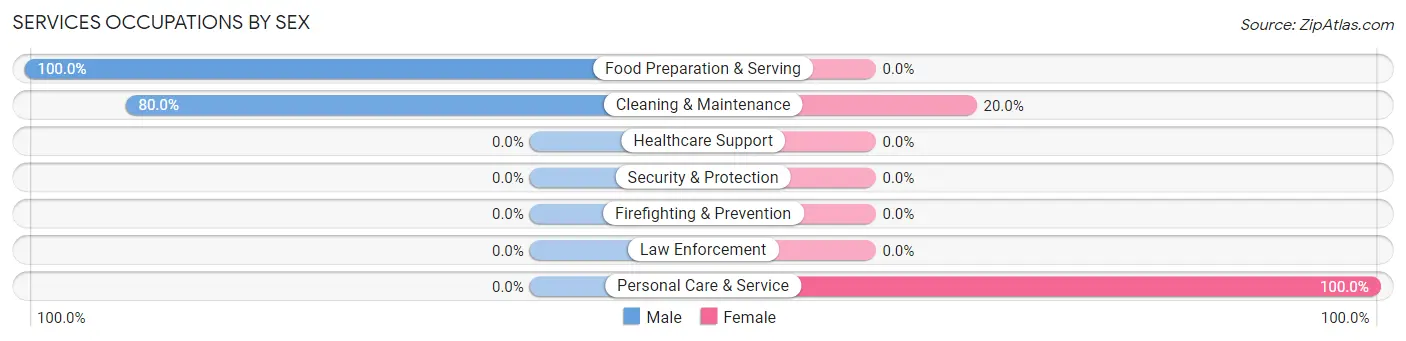
Services Occupations by Sex
Within the Services occupations in Dickens, the most male-oriented occupations are Food Preparation & Serving (100.0%), and Cleaning & Maintenance (80.0%), while the most female-oriented occupations are Personal Care & Service (100.0%), and Cleaning & Maintenance (20.0%).
| Occupation | Male | Female |
| Healthcare Support | 0 (0.0%) | 0 (0.0%) |
| Security & Protection | 0 (0.0%) | 0 (0.0%) |
| Firefighting & Prevention | 0 (0.0%) | 0 (0.0%) |
| Law Enforcement | 0 (0.0%) | 0 (0.0%) |
| Food Preparation & Serving | 12 (100.0%) | 0 (0.0%) |
| Cleaning & Maintenance | 4 (80.0%) | 1 (20.0%) |
| Personal Care & Service | 0 (0.0%) | 5 (100.0%) |
| Total (Category) | 16 (72.7%) | 6 (27.3%) |
| Total (Overall) | 45 (66.2%) | 23 (33.8%) |
Sales and Office Occupations
The most common Sales and Office occupations in Dickens are , and Office & Administration (3 | 4.4%).
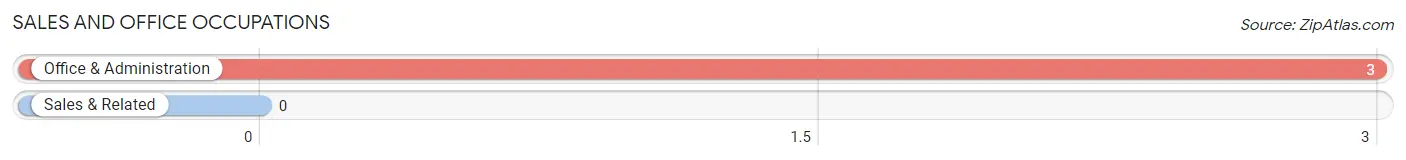
Sales and Office Occupations by Sex
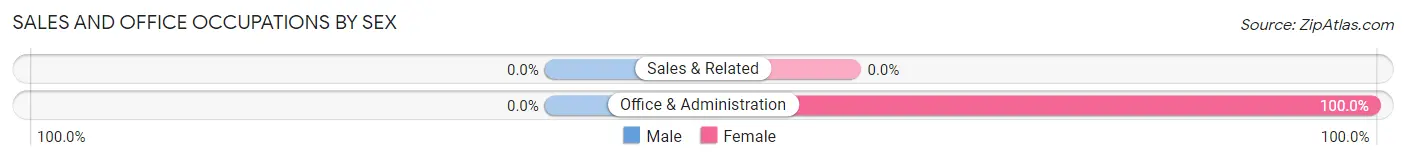
| Occupation | Male | Female |
| Sales & Related | 0 (0.0%) | 0 (0.0%) |
| Office & Administration | 0 (0.0%) | 3 (100.0%) |
| Total (Category) | 0 (0.0%) | 3 (100.0%) |
| Total (Overall) | 45 (66.2%) | 23 (33.8%) |
Natural Resources, Construction and Maintenance Occupations
The most common Natural Resources, Construction and Maintenance occupations in Dickens are , and Construction & Extraction (14 | 20.6%).
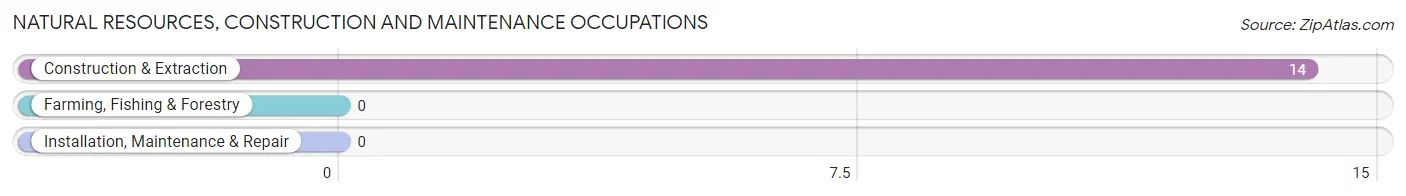
Natural Resources, Construction and Maintenance Occupations by Sex
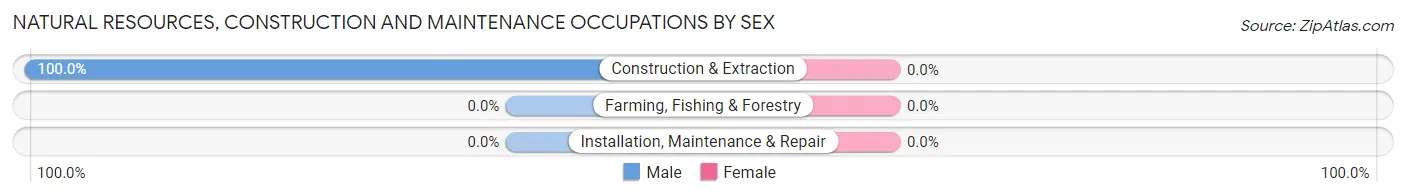
| Occupation | Male | Female |
| Farming, Fishing & Forestry | 0 (0.0%) | 0 (0.0%) |
| Construction & Extraction | 14 (100.0%) | 0 (0.0%) |
| Installation, Maintenance & Repair | 0 (0.0%) | 0 (0.0%) |
| Total (Category) | 14 (100.0%) | 0 (0.0%) |
| Total (Overall) | 45 (66.2%) | 23 (33.8%) |
Production, Transportation and Moving Occupations
The most common Production, Transportation and Moving occupations in Dickens are , and Transportation (13 | 19.1%).
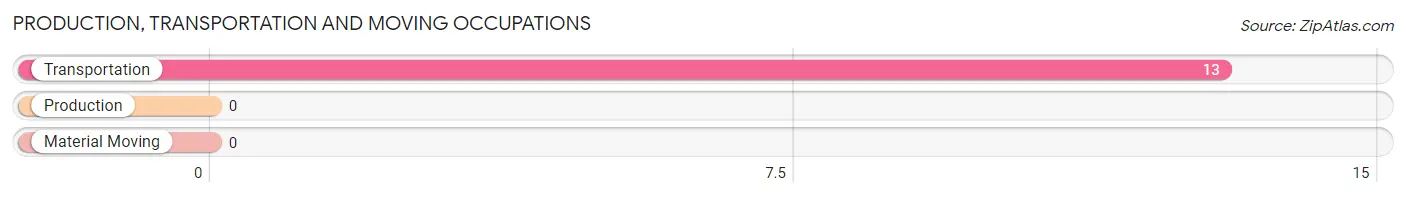
Production, Transportation and Moving Occupations by Sex
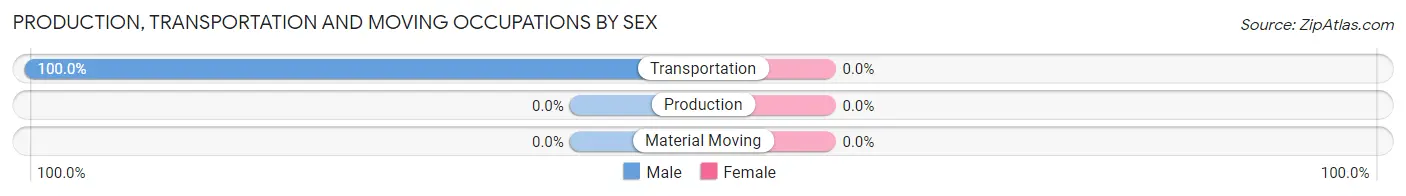
| Occupation | Male | Female |
| Production | 0 (0.0%) | 0 (0.0%) |
| Transportation | 13 (100.0%) | 0 (0.0%) |
| Material Moving | 0 (0.0%) | 0 (0.0%) |
| Total (Category) | 13 (100.0%) | 0 (0.0%) |
| Total (Overall) | 45 (66.2%) | 23 (33.8%) |
Employment Industries by Sex in Dickens
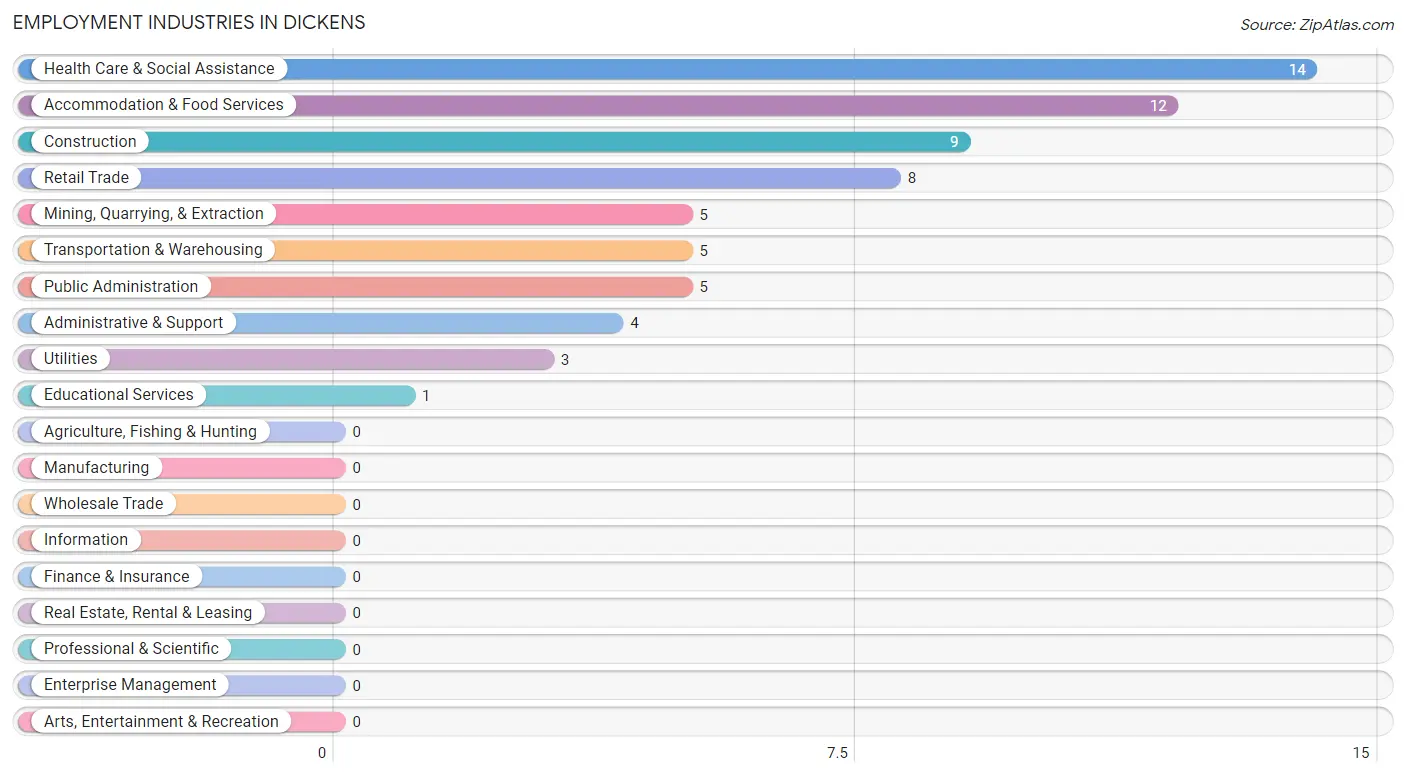
Employment Industries in Dickens
The major employment industries in Dickens include Health Care & Social Assistance (14 | 20.6%), Accommodation & Food Services (12 | 17.6%), Construction (9 | 13.2%), Retail Trade (8 | 11.8%), and Mining, Quarrying, & Extraction (5 | 7.3%).
Employment Industries by Sex in Dickens
The Dickens industries that see more men than women are Mining, Quarrying, & Extraction (100.0%), Construction (100.0%), and Retail Trade (100.0%), whereas the industries that tend to have a higher number of women are Utilities (100.0%), Educational Services (100.0%), and Health Care & Social Assistance (100.0%).
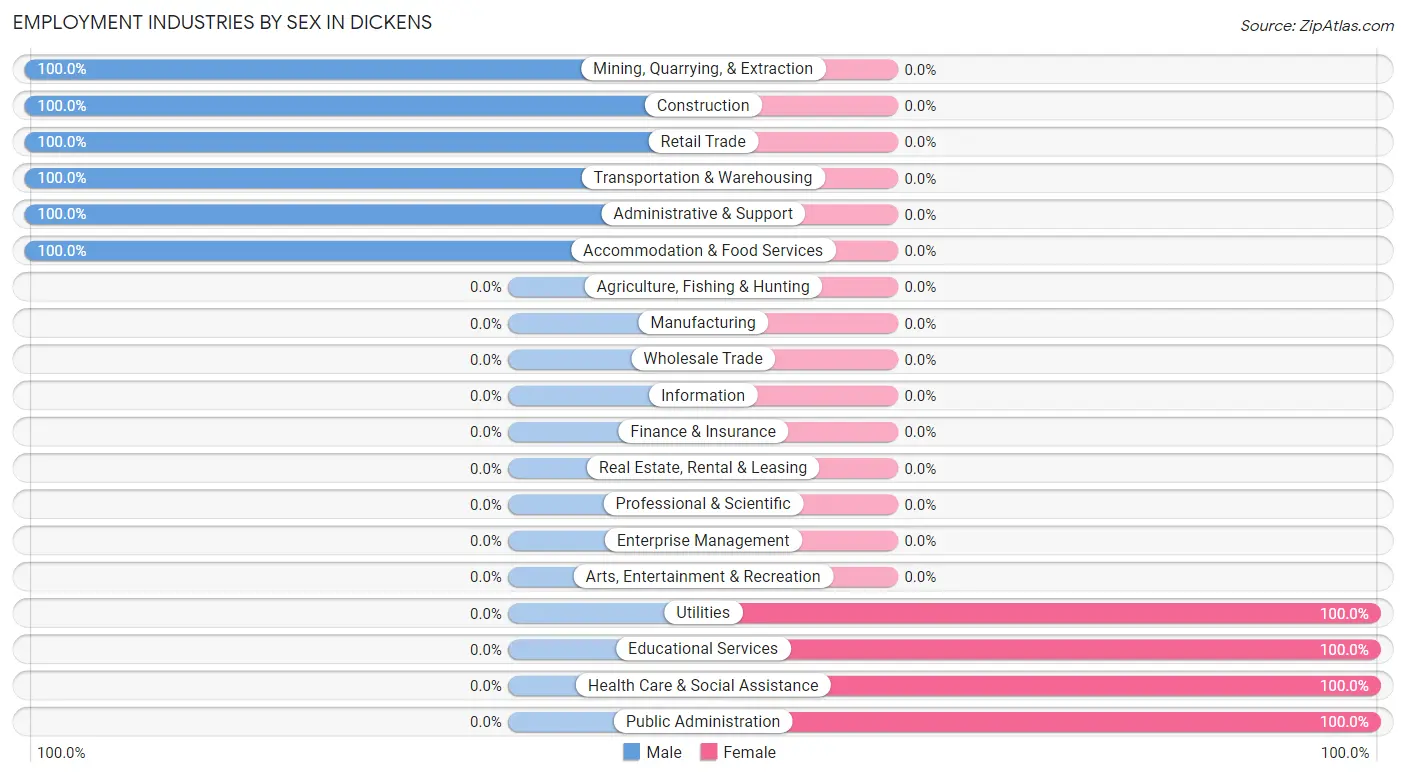
| Industry | Male | Female |
| Agriculture, Fishing & Hunting | 0 (0.0%) | 0 (0.0%) |
| Mining, Quarrying, & Extraction | 5 (100.0%) | 0 (0.0%) |
| Construction | 9 (100.0%) | 0 (0.0%) |
| Manufacturing | 0 (0.0%) | 0 (0.0%) |
| Wholesale Trade | 0 (0.0%) | 0 (0.0%) |
| Retail Trade | 8 (100.0%) | 0 (0.0%) |
| Transportation & Warehousing | 5 (100.0%) | 0 (0.0%) |
| Utilities | 0 (0.0%) | 3 (100.0%) |
| Information | 0 (0.0%) | 0 (0.0%) |
| Finance & Insurance | 0 (0.0%) | 0 (0.0%) |
| Real Estate, Rental & Leasing | 0 (0.0%) | 0 (0.0%) |
| Professional & Scientific | 0 (0.0%) | 0 (0.0%) |
| Enterprise Management | 0 (0.0%) | 0 (0.0%) |
| Administrative & Support | 4 (100.0%) | 0 (0.0%) |
| Educational Services | 0 (0.0%) | 1 (100.0%) |
| Health Care & Social Assistance | 0 (0.0%) | 14 (100.0%) |
| Arts, Entertainment & Recreation | 0 (0.0%) | 0 (0.0%) |
| Accommodation & Food Services | 12 (100.0%) | 0 (0.0%) |
| Public Administration | 0 (0.0%) | 5 (100.0%) |
| Total | 45 (66.2%) | 23 (33.8%) |
Education in Dickens
School Enrollment in Dickens
The most common levels of schooling among the 10 students in Dickens are middle school (4 | 40.0%), high school (4 | 40.0%), and elementary school (2 | 20.0%).
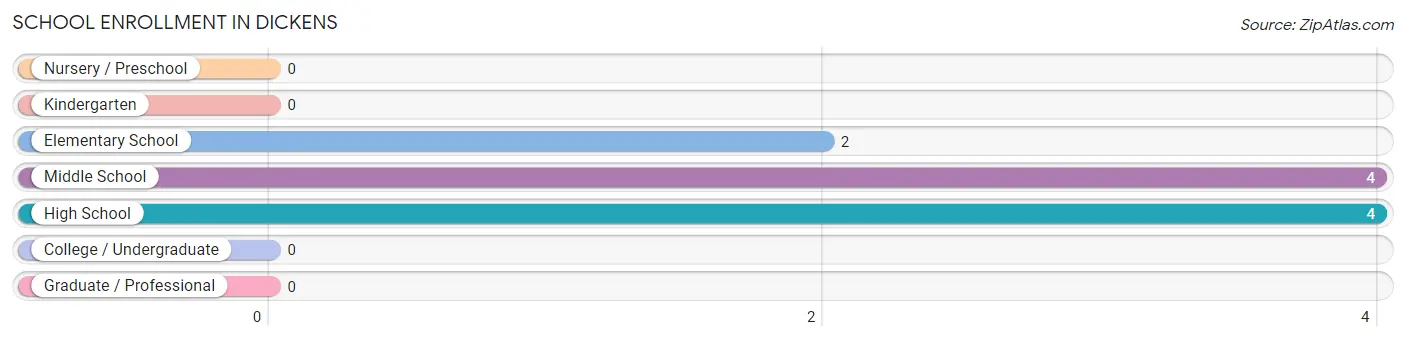
| School Level | # Students | % Students |
| Nursery / Preschool | 0 | 0.0% |
| Kindergarten | 0 | 0.0% |
| Elementary School | 2 | 20.0% |
| Middle School | 4 | 40.0% |
| High School | 4 | 40.0% |
| College / Undergraduate | 0 | 0.0% |
| Graduate / Professional | 0 | 0.0% |
| Total | 10 | 100.0% |
School Enrollment by Age by Funding Source in Dickens
Out of a total of 10 students who are enrolled in schools in Dickens, 3 (30.0%) attend a private institution, while the remaining 7 (70.0%) are enrolled in public schools. The age group of 10 to 14 year olds has the highest likelihood of being enrolled in private schools, with 3 (75.0% in the age bracket) enrolled. Conversely, the age group of 5 to 9 year old has the lowest likelihood of being enrolled in a private school, with 2 (100.0% in the age bracket) attending a public institution.
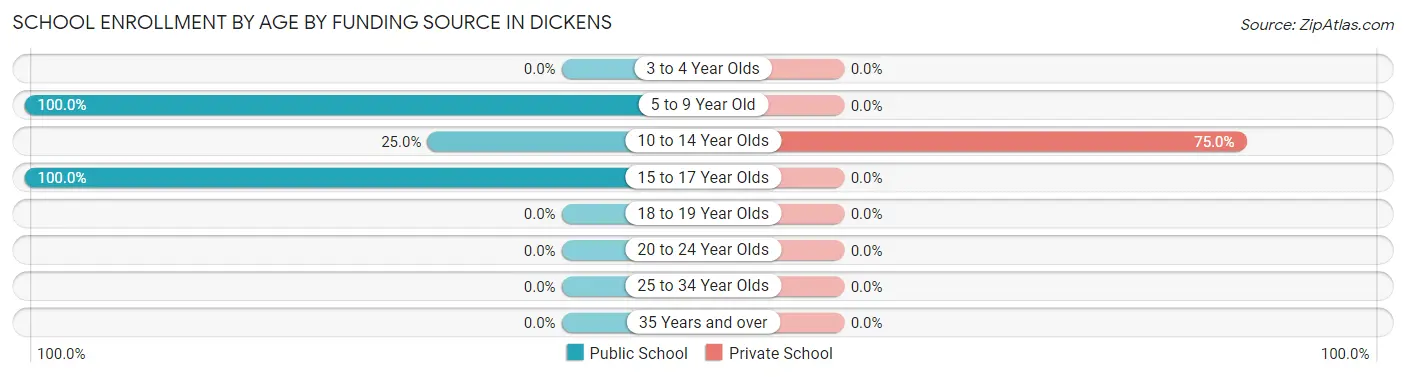
| Age Bracket | Public School | Private School |
| 3 to 4 Year Olds | 0 (0.0%) | 0 (0.0%) |
| 5 to 9 Year Old | 2 (100.0%) | 0 (0.0%) |
| 10 to 14 Year Olds | 1 (25.0%) | 3 (75.0%) |
| 15 to 17 Year Olds | 4 (100.0%) | 0 (0.0%) |
| 18 to 19 Year Olds | 0 (0.0%) | 0 (0.0%) |
| 20 to 24 Year Olds | 0 (0.0%) | 0 (0.0%) |
| 25 to 34 Year Olds | 0 (0.0%) | 0 (0.0%) |
| 35 Years and over | 0 (0.0%) | 0 (0.0%) |
| Total | 7 (70.0%) | 3 (30.0%) |
Educational Attainment by Field of Study in Dickens
Bio, nature & agricultural (4 | 66.7%), engineering (1 | 16.7%), and science & technology (1 | 16.7%) are the most common fields of study among 6 individuals in Dickens who have obtained a bachelor's degree or higher.
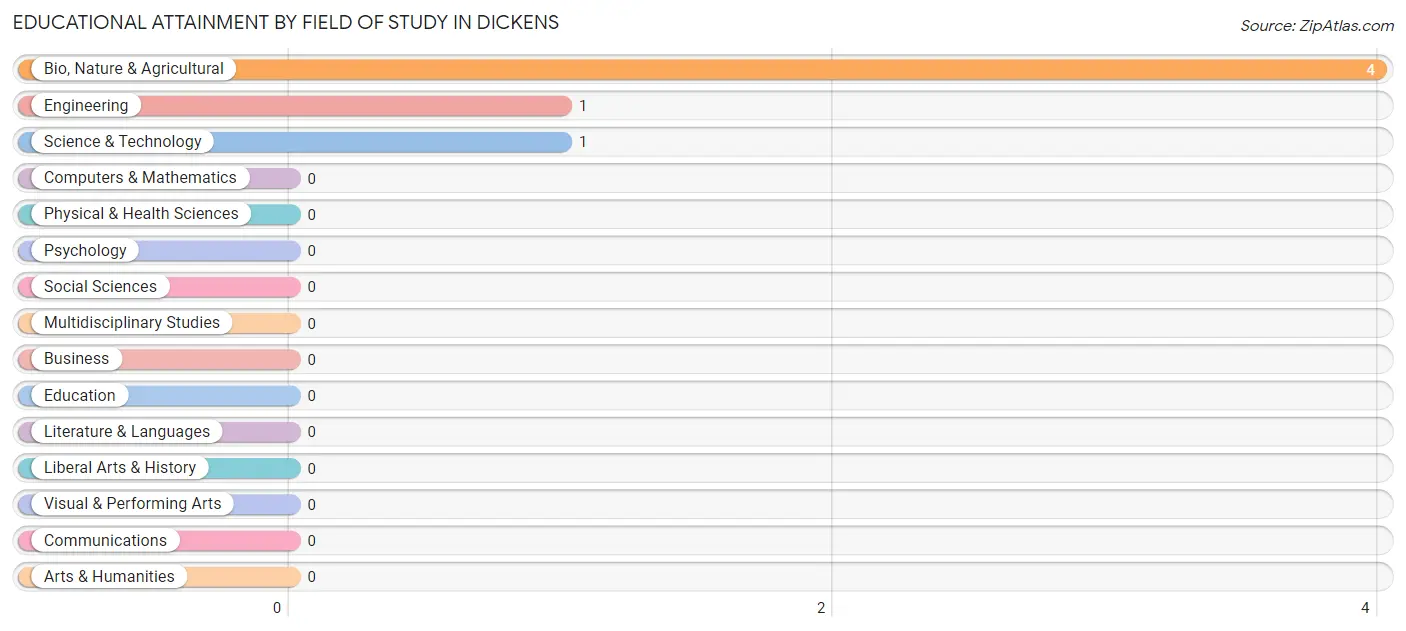
| Field of Study | # Graduates | % Graduates |
| Computers & Mathematics | 0 | 0.0% |
| Bio, Nature & Agricultural | 4 | 66.7% |
| Physical & Health Sciences | 0 | 0.0% |
| Psychology | 0 | 0.0% |
| Social Sciences | 0 | 0.0% |
| Engineering | 1 | 16.7% |
| Multidisciplinary Studies | 0 | 0.0% |
| Science & Technology | 1 | 16.7% |
| Business | 0 | 0.0% |
| Education | 0 | 0.0% |
| Literature & Languages | 0 | 0.0% |
| Liberal Arts & History | 0 | 0.0% |
| Visual & Performing Arts | 0 | 0.0% |
| Communications | 0 | 0.0% |
| Arts & Humanities | 0 | 0.0% |
| Total | 6 | 100.0% |
Transportation & Commute in Dickens
Vehicle Availability by Sex in Dickens
The most prevalent vehicle ownership categories in Dickens are males with 2 vehicles (24, accounting for 53.3%) and females with 2 vehicles (0, making up 104.4%).
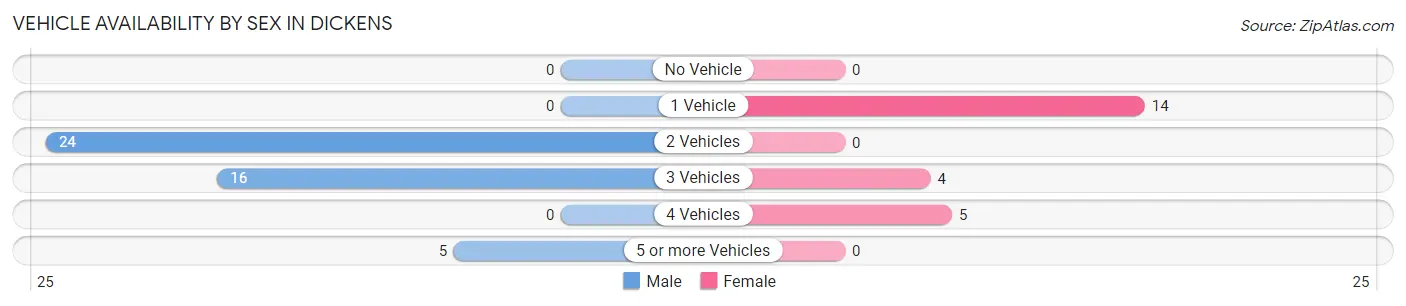
| Vehicles Available | Male | Female |
| No Vehicle | 0 (0.0%) | 0 (0.0%) |
| 1 Vehicle | 0 (0.0%) | 14 (60.9%) |
| 2 Vehicles | 24 (53.3%) | 0 (0.0%) |
| 3 Vehicles | 16 (35.6%) | 4 (17.4%) |
| 4 Vehicles | 0 (0.0%) | 5 (21.7%) |
| 5 or more Vehicles | 5 (11.1%) | 0 (0.0%) |
| Total | 45 (100.0%) | 23 (100.0%) |
Commute Time in Dickens
The most frequently occuring commute durations in Dickens are 90 or more minutes (25 commuters, 36.8%), 5 to 9 minutes (15 commuters, 22.1%), and less than 5 minutes (11 commuters, 16.2%).
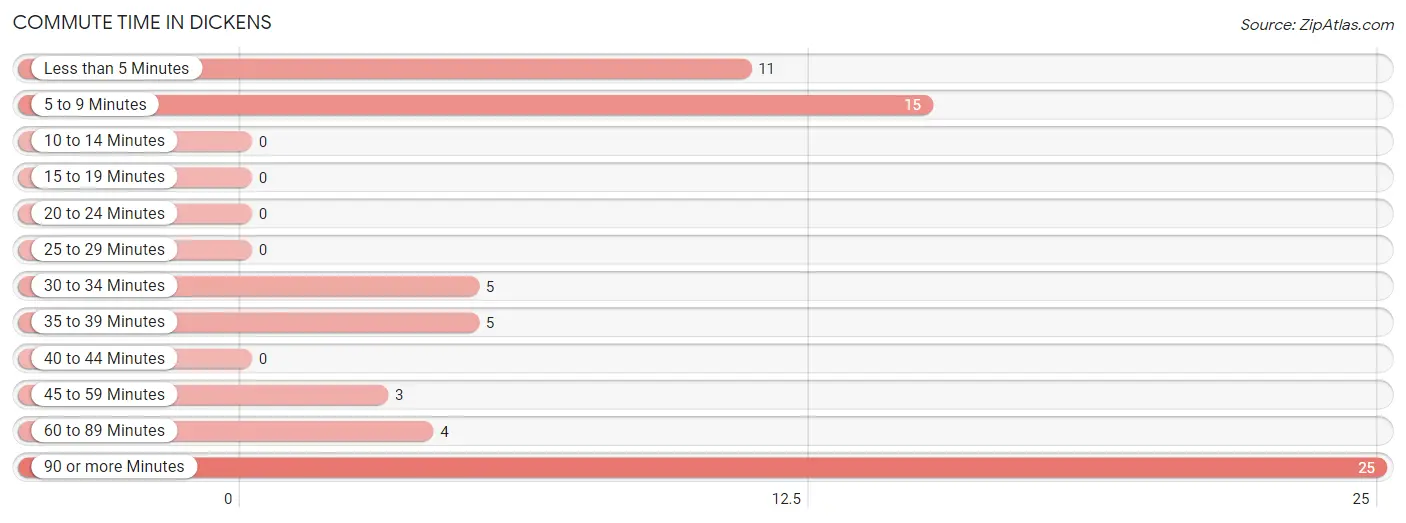
| Commute Time | # Commuters | % Commuters |
| Less than 5 Minutes | 11 | 16.2% |
| 5 to 9 Minutes | 15 | 22.1% |
| 10 to 14 Minutes | 0 | 0.0% |
| 15 to 19 Minutes | 0 | 0.0% |
| 20 to 24 Minutes | 0 | 0.0% |
| 25 to 29 Minutes | 0 | 0.0% |
| 30 to 34 Minutes | 5 | 7.3% |
| 35 to 39 Minutes | 5 | 7.3% |
| 40 to 44 Minutes | 0 | 0.0% |
| 45 to 59 Minutes | 3 | 4.4% |
| 60 to 89 Minutes | 4 | 5.9% |
| 90 or more Minutes | 25 | 36.8% |
Commute Time by Sex in Dickens
The most common commute times in Dickens are 90 or more minutes (25 commuters, 55.6%) for males and less than 5 minutes (9 commuters, 39.1%) for females.
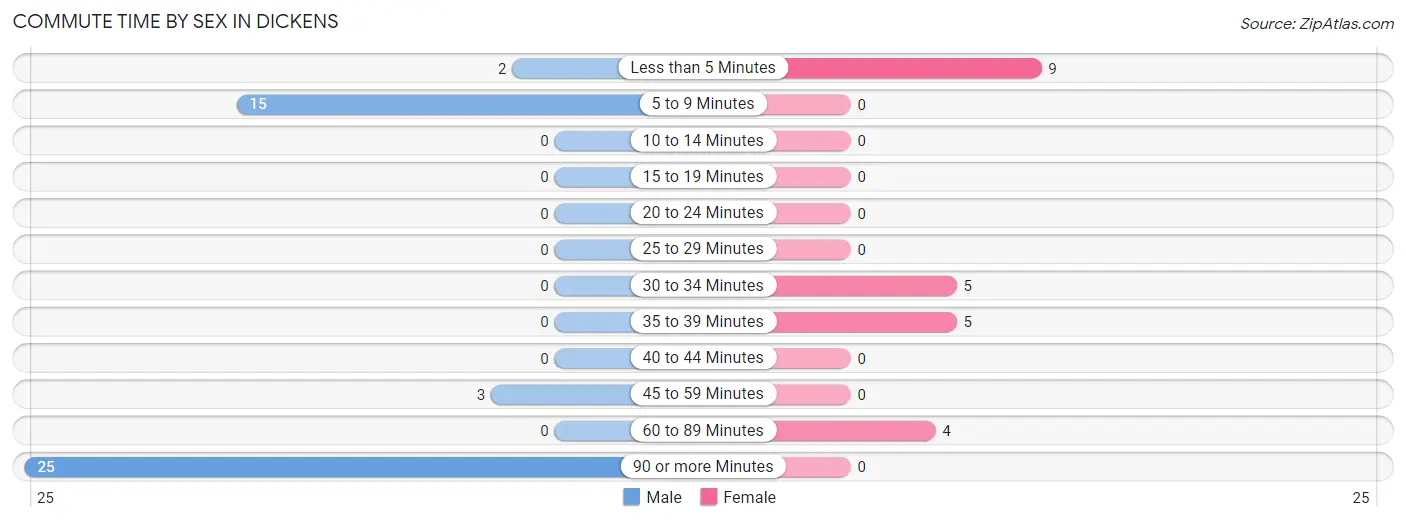
| Commute Time | Male | Female |
| Less than 5 Minutes | 2 (4.4%) | 9 (39.1%) |
| 5 to 9 Minutes | 15 (33.3%) | 0 (0.0%) |
| 10 to 14 Minutes | 0 (0.0%) | 0 (0.0%) |
| 15 to 19 Minutes | 0 (0.0%) | 0 (0.0%) |
| 20 to 24 Minutes | 0 (0.0%) | 0 (0.0%) |
| 25 to 29 Minutes | 0 (0.0%) | 0 (0.0%) |
| 30 to 34 Minutes | 0 (0.0%) | 5 (21.7%) |
| 35 to 39 Minutes | 0 (0.0%) | 5 (21.7%) |
| 40 to 44 Minutes | 0 (0.0%) | 0 (0.0%) |
| 45 to 59 Minutes | 3 (6.7%) | 0 (0.0%) |
| 60 to 89 Minutes | 0 (0.0%) | 4 (17.4%) |
| 90 or more Minutes | 25 (55.6%) | 0 (0.0%) |
Time of Departure to Work by Sex in Dickens
The most frequent times of departure to work in Dickens are 12:00 PM to 3:59 PM (26, 57.8%) for males and 7:30 AM to 7:59 AM (9, 39.1%) for females.
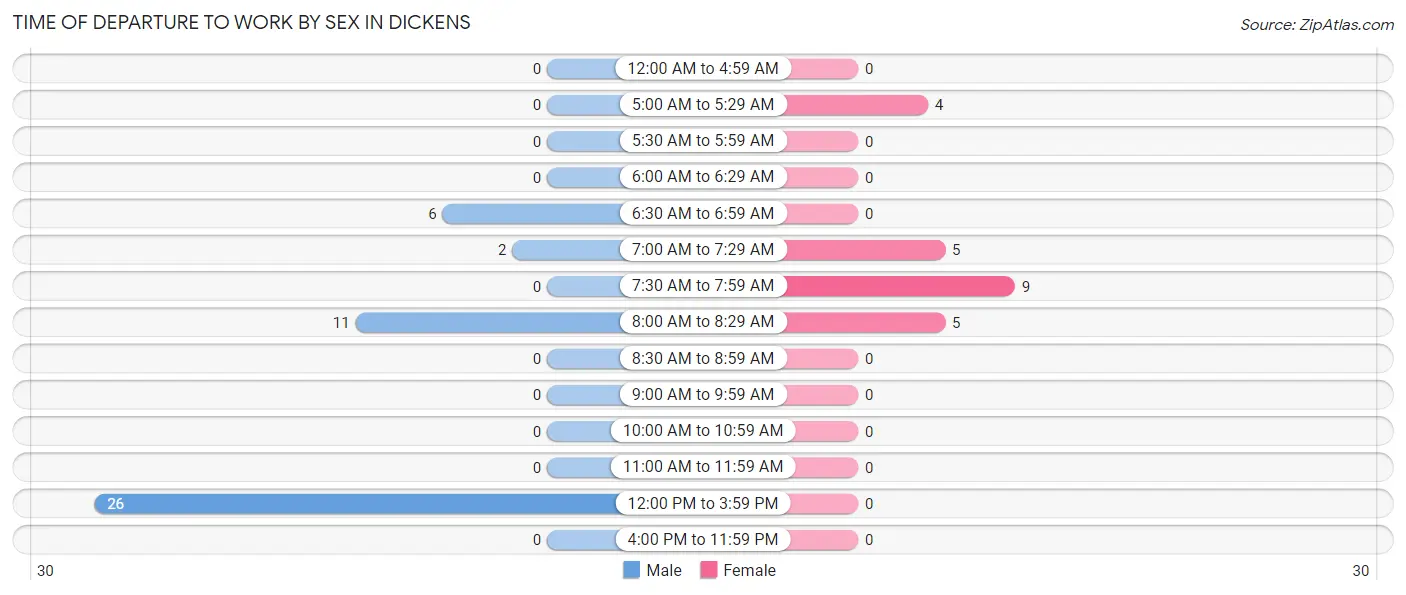
| Time of Departure | Male | Female |
| 12:00 AM to 4:59 AM | 0 (0.0%) | 0 (0.0%) |
| 5:00 AM to 5:29 AM | 0 (0.0%) | 4 (17.4%) |
| 5:30 AM to 5:59 AM | 0 (0.0%) | 0 (0.0%) |
| 6:00 AM to 6:29 AM | 0 (0.0%) | 0 (0.0%) |
| 6:30 AM to 6:59 AM | 6 (13.3%) | 0 (0.0%) |
| 7:00 AM to 7:29 AM | 2 (4.4%) | 5 (21.7%) |
| 7:30 AM to 7:59 AM | 0 (0.0%) | 9 (39.1%) |
| 8:00 AM to 8:29 AM | 11 (24.4%) | 5 (21.7%) |
| 8:30 AM to 8:59 AM | 0 (0.0%) | 0 (0.0%) |
| 9:00 AM to 9:59 AM | 0 (0.0%) | 0 (0.0%) |
| 10:00 AM to 10:59 AM | 0 (0.0%) | 0 (0.0%) |
| 11:00 AM to 11:59 AM | 0 (0.0%) | 0 (0.0%) |
| 12:00 PM to 3:59 PM | 26 (57.8%) | 0 (0.0%) |
| 4:00 PM to 11:59 PM | 0 (0.0%) | 0 (0.0%) |
| Total | 45 (100.0%) | 23 (100.0%) |
Housing Occupancy in Dickens
Occupancy by Ownership in Dickens
Of the total 91 dwellings in Dickens, owner-occupied units account for 84 (92.3%), while renter-occupied units make up 7 (7.7%).
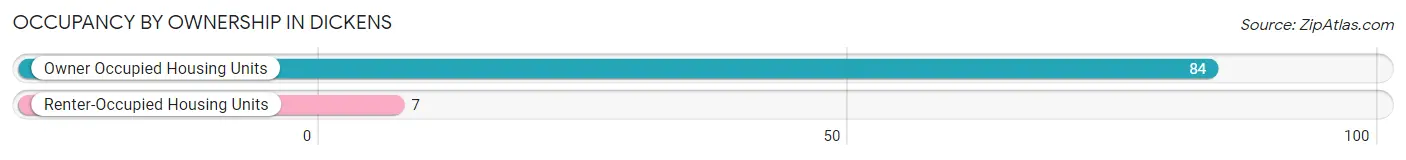
| Occupancy | # Housing Units | % Housing Units |
| Owner Occupied Housing Units | 84 | 92.3% |
| Renter-Occupied Housing Units | 7 | 7.7% |
| Total Occupied Housing Units | 91 | 100.0% |
Occupancy by Household Size in Dickens
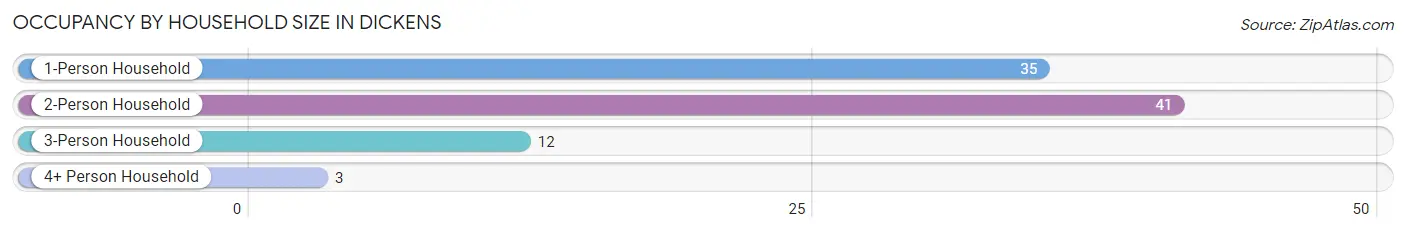
| Household Size | # Housing Units | % Housing Units |
| 1-Person Household | 35 | 38.5% |
| 2-Person Household | 41 | 45.1% |
| 3-Person Household | 12 | 13.2% |
| 4+ Person Household | 3 | 3.3% |
| Total Housing Units | 91 | 100.0% |
Occupancy by Ownership by Household Size in Dickens
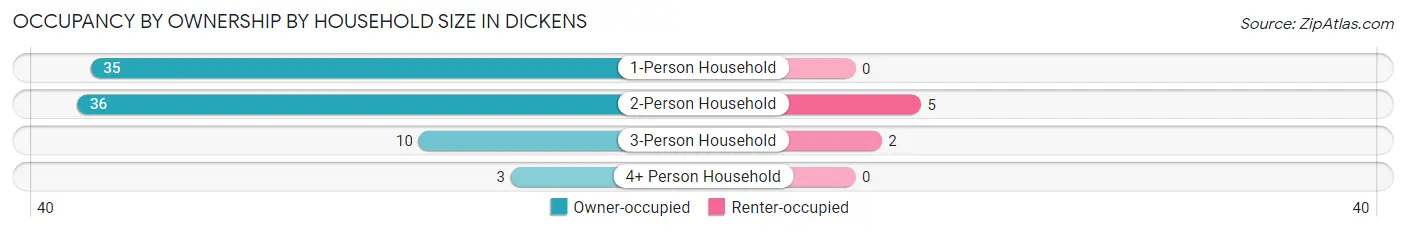
| Household Size | Owner-occupied | Renter-occupied |
| 1-Person Household | 35 (100.0%) | 0 (0.0%) |
| 2-Person Household | 36 (87.8%) | 5 (12.2%) |
| 3-Person Household | 10 (83.3%) | 2 (16.7%) |
| 4+ Person Household | 3 (100.0%) | 0 (0.0%) |
| Total Housing Units | 84 (92.3%) | 7 (7.7%) |
Occupancy by Educational Attainment in Dickens
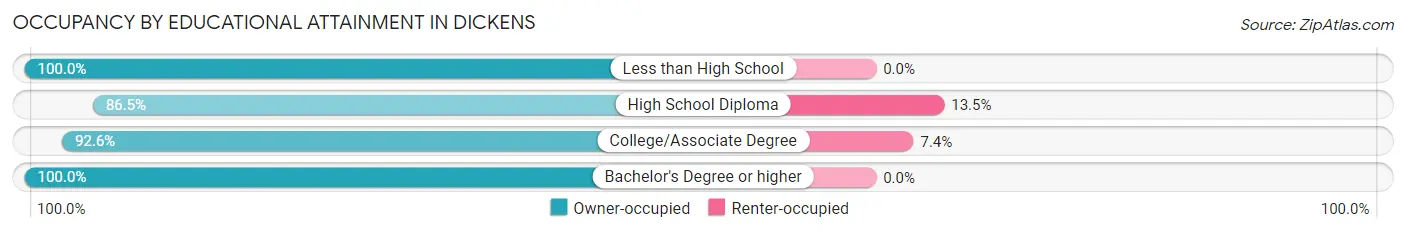
| Household Size | Owner-occupied | Renter-occupied |
| Less than High School | 26 (100.0%) | 0 (0.0%) |
| High School Diploma | 32 (86.5%) | 5 (13.5%) |
| College/Associate Degree | 25 (92.6%) | 2 (7.4%) |
| Bachelor's Degree or higher | 1 (100.0%) | 0 (0.0%) |
Occupancy by Age of Householder in Dickens
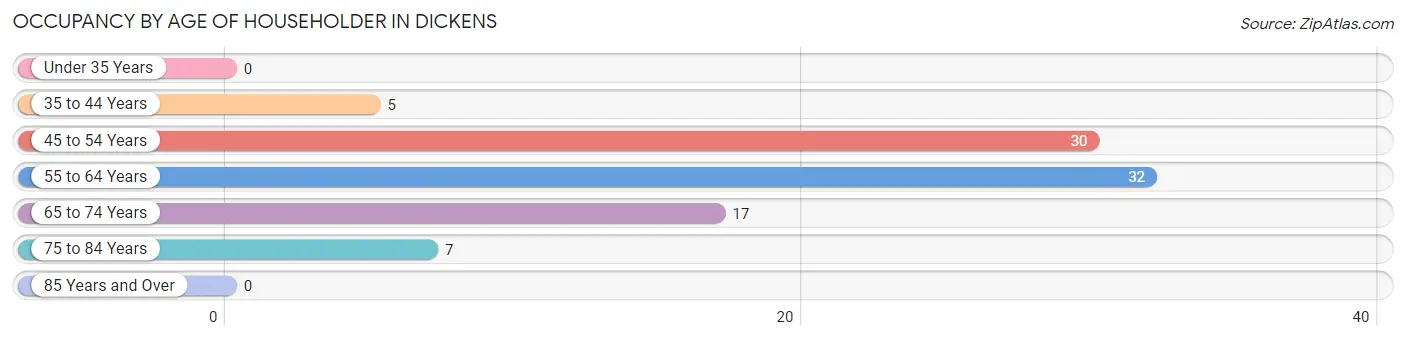
| Age Bracket | # Households | % Households |
| Under 35 Years | 0 | 0.0% |
| 35 to 44 Years | 5 | 5.5% |
| 45 to 54 Years | 30 | 33.0% |
| 55 to 64 Years | 32 | 35.2% |
| 65 to 74 Years | 17 | 18.7% |
| 75 to 84 Years | 7 | 7.7% |
| 85 Years and Over | 0 | 0.0% |
| Total | 91 | 100.0% |
Housing Finances in Dickens
Median Income by Occupancy in Dickens
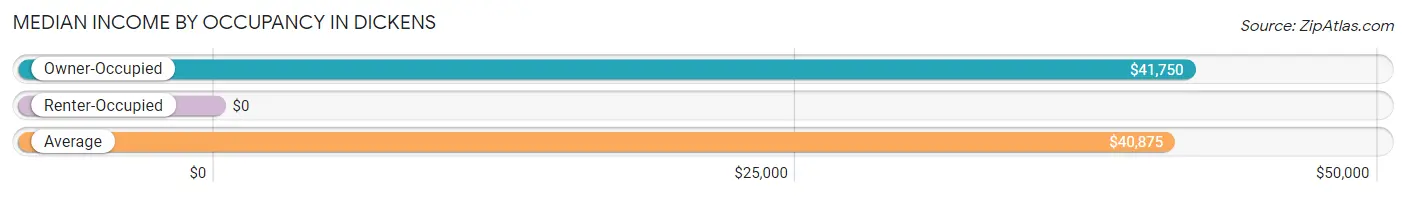
| Occupancy Type | # Households | Median Income |
| Owner-Occupied | 84 (92.3%) | $41,750 |
| Renter-Occupied | 7 (7.7%) | $0 |
| Average | 91 (100.0%) | $40,875 |
Occupancy by Householder Income Bracket in Dickens
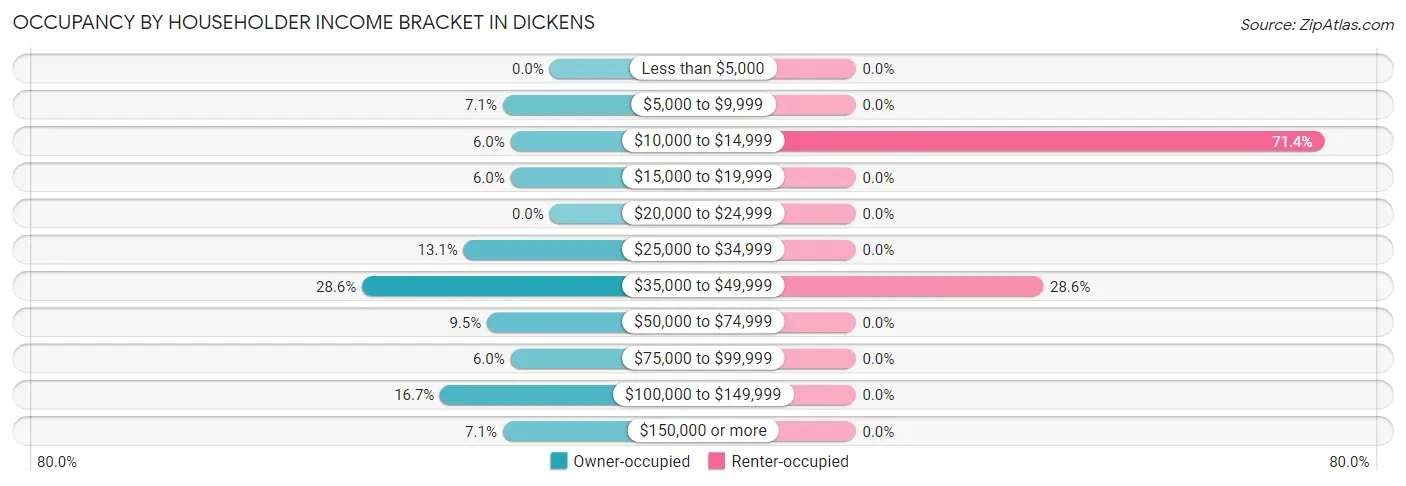
| Income Bracket | Owner-occupied | Renter-occupied |
| Less than $5,000 | 0 (0.0%) | 0 (0.0%) |
| $5,000 to $9,999 | 6 (7.1%) | 0 (0.0%) |
| $10,000 to $14,999 | 5 (5.9%) | 5 (71.4%) |
| $15,000 to $19,999 | 5 (5.9%) | 0 (0.0%) |
| $20,000 to $24,999 | 0 (0.0%) | 0 (0.0%) |
| $25,000 to $34,999 | 11 (13.1%) | 0 (0.0%) |
| $35,000 to $49,999 | 24 (28.6%) | 2 (28.6%) |
| $50,000 to $74,999 | 8 (9.5%) | 0 (0.0%) |
| $75,000 to $99,999 | 5 (5.9%) | 0 (0.0%) |
| $100,000 to $149,999 | 14 (16.7%) | 0 (0.0%) |
| $150,000 or more | 6 (7.1%) | 0 (0.0%) |
| Total | 84 (100.0%) | 7 (100.0%) |
Monthly Housing Cost Tiers in Dickens
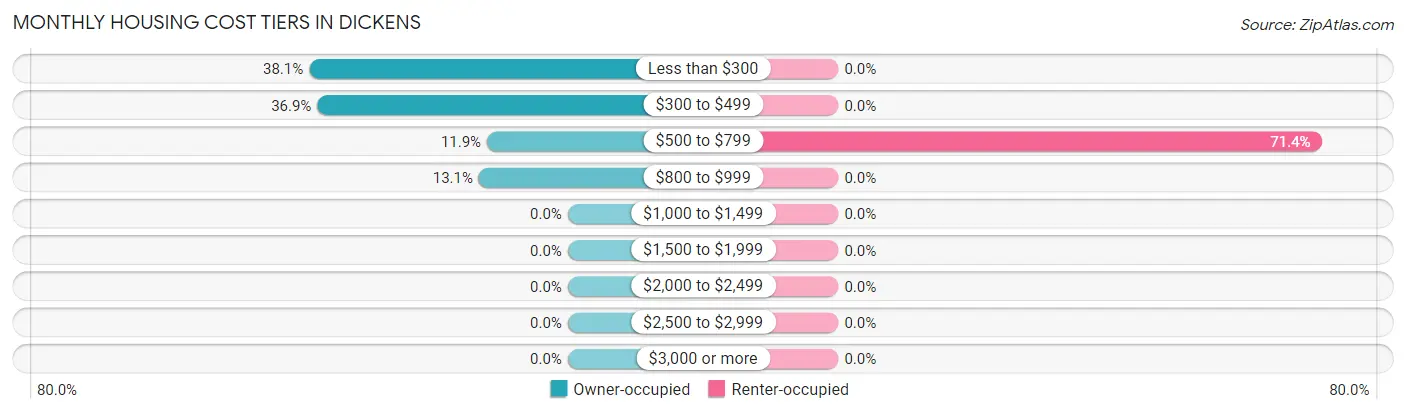
| Monthly Cost | Owner-occupied | Renter-occupied |
| Less than $300 | 32 (38.1%) | 0 (0.0%) |
| $300 to $499 | 31 (36.9%) | 0 (0.0%) |
| $500 to $799 | 10 (11.9%) | 5 (71.4%) |
| $800 to $999 | 11 (13.1%) | 0 (0.0%) |
| $1,000 to $1,499 | 0 (0.0%) | 0 (0.0%) |
| $1,500 to $1,999 | 0 (0.0%) | 0 (0.0%) |
| $2,000 to $2,499 | 0 (0.0%) | 0 (0.0%) |
| $2,500 to $2,999 | 0 (0.0%) | 0 (0.0%) |
| $3,000 or more | 0 (0.0%) | 0 (0.0%) |
| Total | 84 (100.0%) | 7 (100.0%) |
Physical Housing Characteristics in Dickens
Housing Structures in Dickens
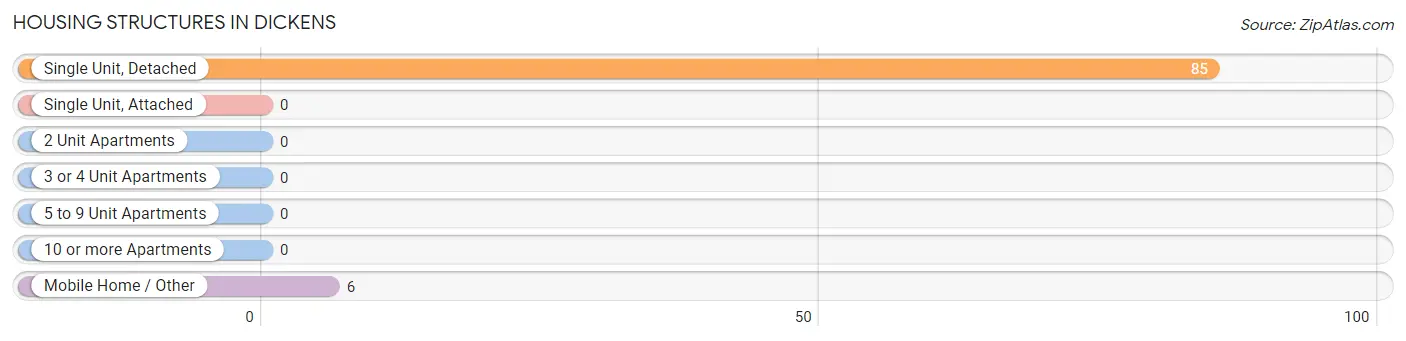
| Structure Type | # Housing Units | % Housing Units |
| Single Unit, Detached | 85 | 93.4% |
| Single Unit, Attached | 0 | 0.0% |
| 2 Unit Apartments | 0 | 0.0% |
| 3 or 4 Unit Apartments | 0 | 0.0% |
| 5 to 9 Unit Apartments | 0 | 0.0% |
| 10 or more Apartments | 0 | 0.0% |
| Mobile Home / Other | 6 | 6.6% |
| Total | 91 | 100.0% |
Housing Structures by Occupancy in Dickens
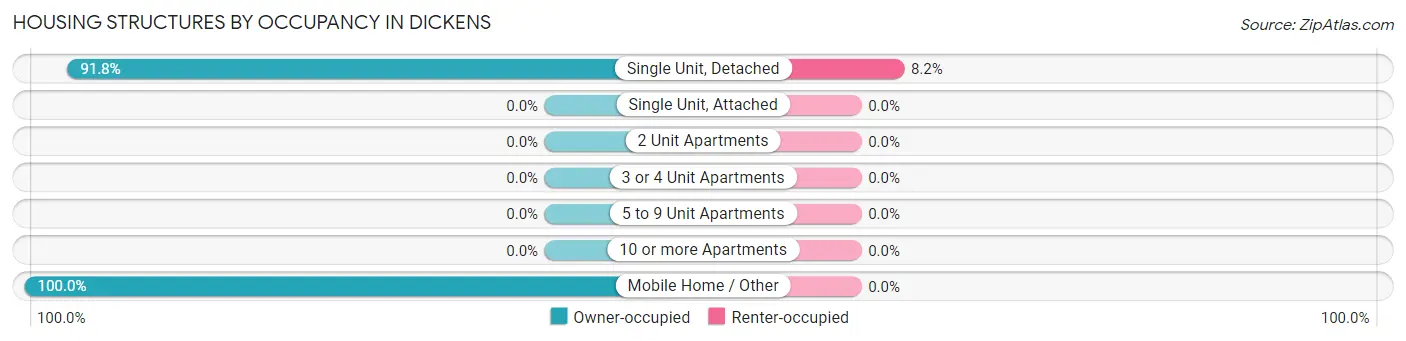
| Structure Type | Owner-occupied | Renter-occupied |
| Single Unit, Detached | 78 (91.8%) | 7 (8.2%) |
| Single Unit, Attached | 0 (0.0%) | 0 (0.0%) |
| 2 Unit Apartments | 0 (0.0%) | 0 (0.0%) |
| 3 or 4 Unit Apartments | 0 (0.0%) | 0 (0.0%) |
| 5 to 9 Unit Apartments | 0 (0.0%) | 0 (0.0%) |
| 10 or more Apartments | 0 (0.0%) | 0 (0.0%) |
| Mobile Home / Other | 6 (100.0%) | 0 (0.0%) |
| Total | 84 (92.3%) | 7 (7.7%) |
Housing Structures by Number of Rooms in Dickens
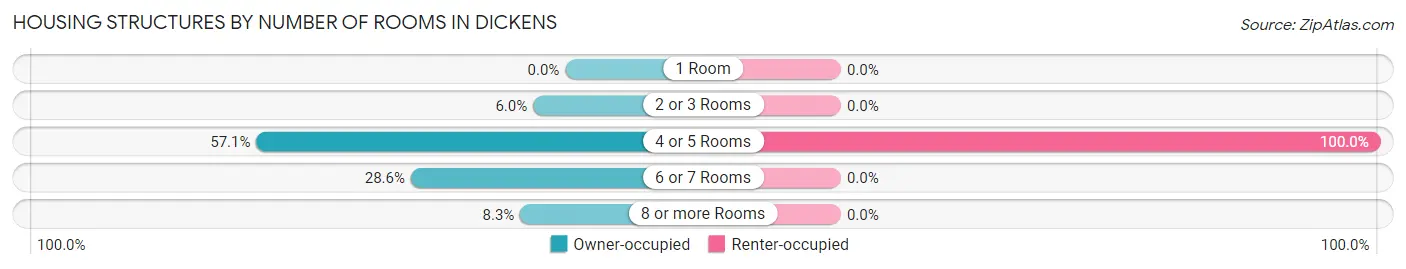
| Number of Rooms | Owner-occupied | Renter-occupied |
| 1 Room | 0 (0.0%) | 0 (0.0%) |
| 2 or 3 Rooms | 5 (5.9%) | 0 (0.0%) |
| 4 or 5 Rooms | 48 (57.1%) | 7 (100.0%) |
| 6 or 7 Rooms | 24 (28.6%) | 0 (0.0%) |
| 8 or more Rooms | 7 (8.3%) | 0 (0.0%) |
| Total | 84 (100.0%) | 7 (100.0%) |
Housing Structure by Heating Type in Dickens
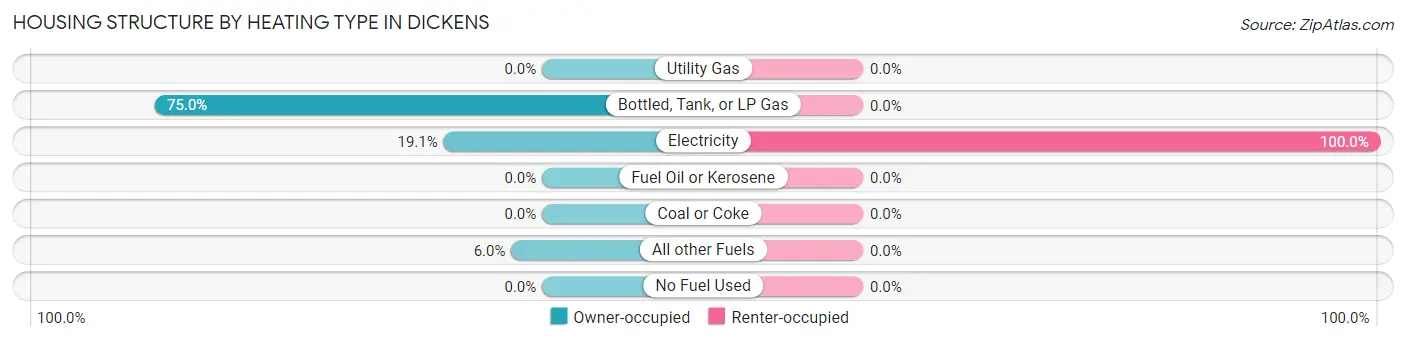
| Heating Type | Owner-occupied | Renter-occupied |
| Utility Gas | 0 (0.0%) | 0 (0.0%) |
| Bottled, Tank, or LP Gas | 63 (75.0%) | 0 (0.0%) |
| Electricity | 16 (19.1%) | 7 (100.0%) |
| Fuel Oil or Kerosene | 0 (0.0%) | 0 (0.0%) |
| Coal or Coke | 0 (0.0%) | 0 (0.0%) |
| All other Fuels | 5 (5.9%) | 0 (0.0%) |
| No Fuel Used | 0 (0.0%) | 0 (0.0%) |
| Total | 84 (100.0%) | 7 (100.0%) |
Household Vehicle Usage in Dickens
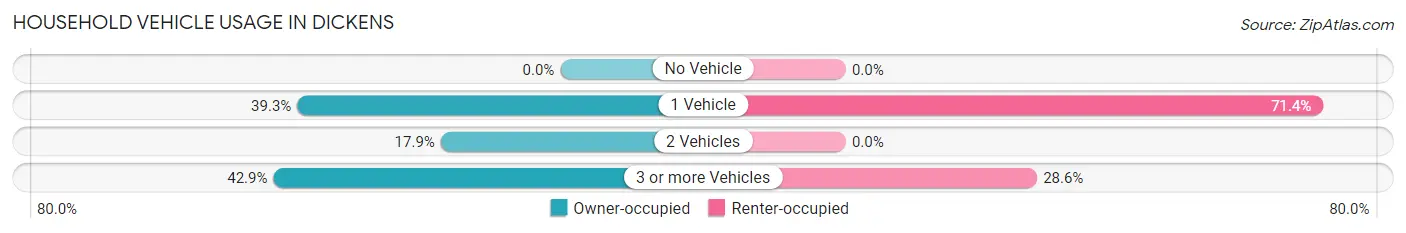
| Vehicles per Household | Owner-occupied | Renter-occupied |
| No Vehicle | 0 (0.0%) | 0 (0.0%) |
| 1 Vehicle | 33 (39.3%) | 5 (71.4%) |
| 2 Vehicles | 15 (17.9%) | 0 (0.0%) |
| 3 or more Vehicles | 36 (42.9%) | 2 (28.6%) |
| Total | 84 (100.0%) | 7 (100.0%) |
Real Estate & Mortgages in Dickens
Real Estate and Mortgage Overview in Dickens
| Characteristic | Without Mortgage | With Mortgage |
| Housing Units | 83 | 1 |
| Median Property Value | $25,400 | $0 |
| Median Household Income | $41,875 | $0 |
| Monthly Housing Costs | $334 | $0 |
| Real Estate Taxes | $300 | $0 |
Property Value by Mortgage Status in Dickens
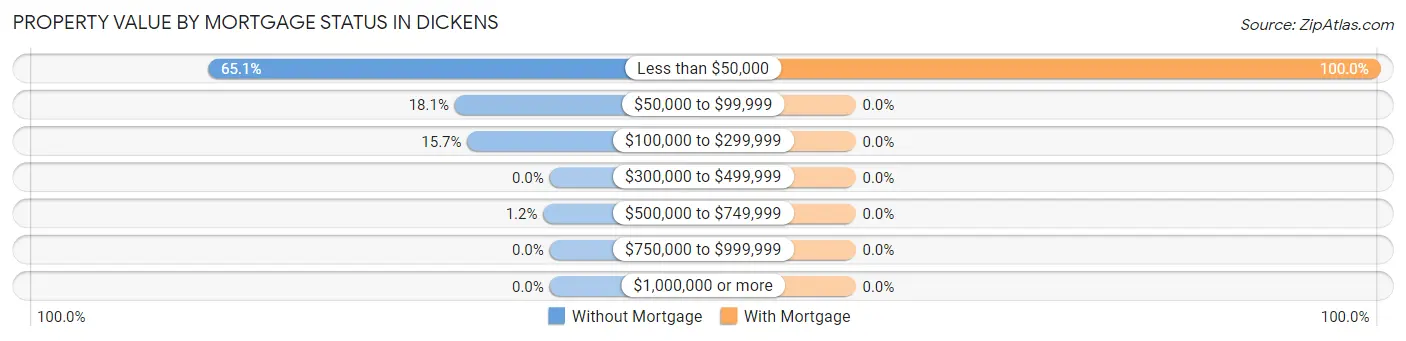
| Property Value | Without Mortgage | With Mortgage |
| Less than $50,000 | 54 (65.1%) | 1 (100.0%) |
| $50,000 to $99,999 | 15 (18.1%) | 0 (0.0%) |
| $100,000 to $299,999 | 13 (15.7%) | 0 (0.0%) |
| $300,000 to $499,999 | 0 (0.0%) | 0 (0.0%) |
| $500,000 to $749,999 | 1 (1.2%) | 0 (0.0%) |
| $750,000 to $999,999 | 0 (0.0%) | 0 (0.0%) |
| $1,000,000 or more | 0 (0.0%) | 0 (0.0%) |
| Total | 83 (100.0%) | 1 (100.0%) |
Household Income by Mortgage Status in Dickens
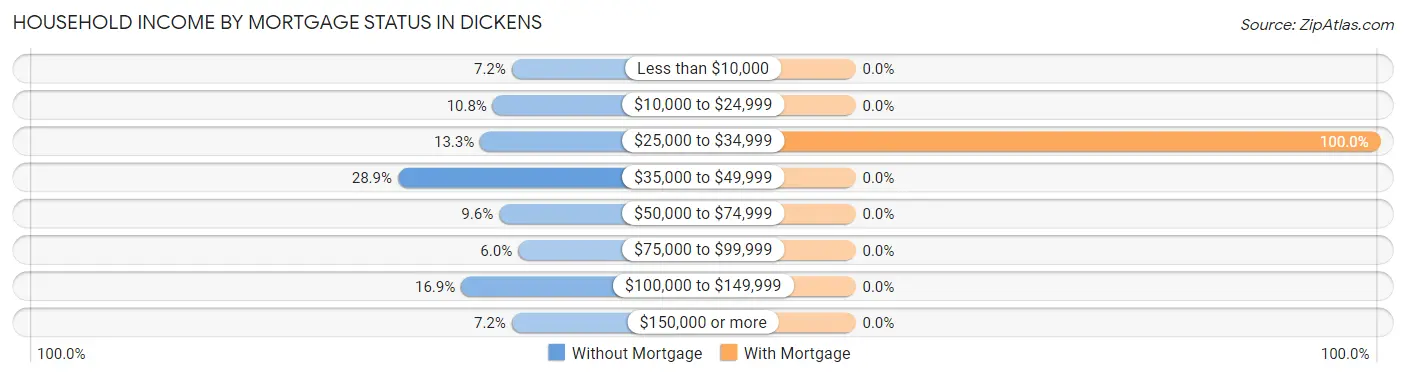
| Household Income | Without Mortgage | With Mortgage |
| Less than $10,000 | 6 (7.2%) | 0 (0.0%) |
| $10,000 to $24,999 | 9 (10.8%) | 0 (0.0%) |
| $25,000 to $34,999 | 11 (13.3%) | 1 (100.0%) |
| $35,000 to $49,999 | 24 (28.9%) | 0 (0.0%) |
| $50,000 to $74,999 | 8 (9.6%) | 0 (0.0%) |
| $75,000 to $99,999 | 5 (6.0%) | 0 (0.0%) |
| $100,000 to $149,999 | 14 (16.9%) | 0 (0.0%) |
| $150,000 or more | 6 (7.2%) | 0 (0.0%) |
| Total | 83 (100.0%) | 1 (100.0%) |
Property Value to Household Income Ratio in Dickens
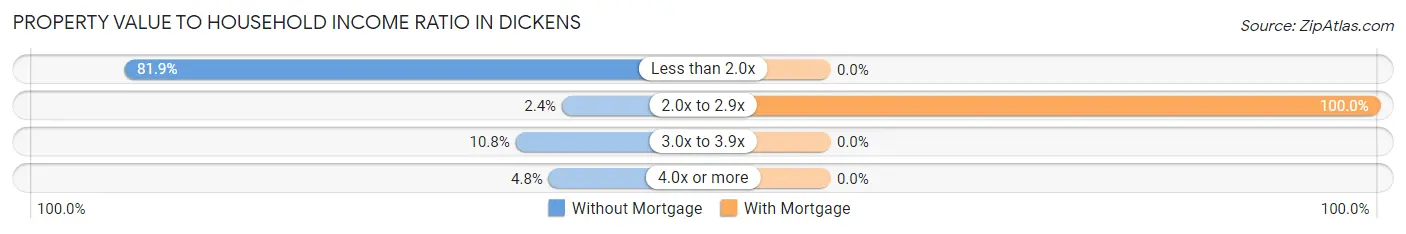
| Value-to-Income Ratio | Without Mortgage | With Mortgage |
| Less than 2.0x | 68 (81.9%) | 0 (0.0%) |
| 2.0x to 2.9x | 2 (2.4%) | 1 (100.0%) |
| 3.0x to 3.9x | 9 (10.8%) | 0 (0.0%) |
| 4.0x or more | 4 (4.8%) | 0 (0.0%) |
| Total | 83 (100.0%) | 1 (100.0%) |
Real Estate Taxes by Mortgage Status in Dickens
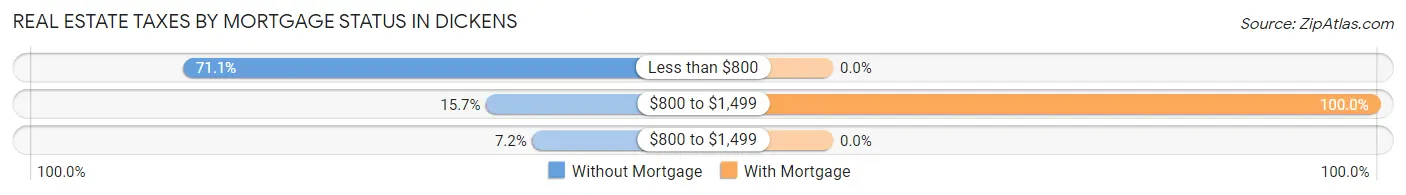
| Property Taxes | Without Mortgage | With Mortgage |
| Less than $800 | 59 (71.1%) | 0 (0.0%) |
| $800 to $1,499 | 13 (15.7%) | 1 (100.0%) |
| $800 to $1,499 | 6 (7.2%) | 0 (0.0%) |
| Total | 83 (100.0%) | 1 (100.0%) |
Health & Disability in Dickens
Health Insurance Coverage by Age in Dickens
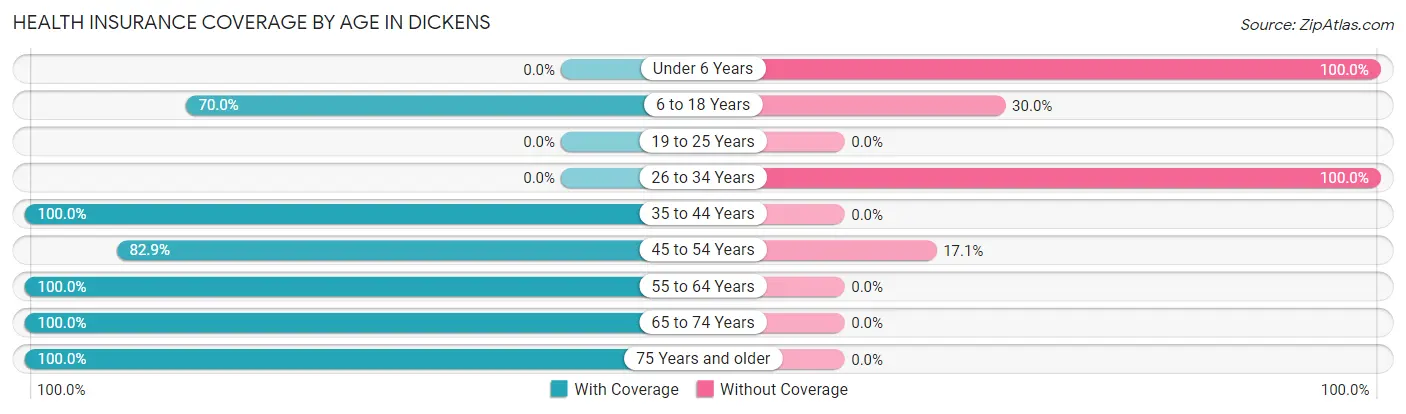
| Age Bracket | With Coverage | Without Coverage |
| Under 6 Years | 0 (0.0%) | 9 (100.0%) |
| 6 to 18 Years | 7 (70.0%) | 3 (30.0%) |
| 19 to 25 Years | 0 (0.0%) | 0 (0.0%) |
| 26 to 34 Years | 0 (0.0%) | 13 (100.0%) |
| 35 to 44 Years | 5 (100.0%) | 0 (0.0%) |
| 45 to 54 Years | 29 (82.9%) | 6 (17.1%) |
| 55 to 64 Years | 63 (100.0%) | 0 (0.0%) |
| 65 to 74 Years | 28 (100.0%) | 0 (0.0%) |
| 75 Years and older | 10 (100.0%) | 0 (0.0%) |
| Total | 142 (82.1%) | 31 (17.9%) |
Health Insurance Coverage by Citizenship Status in Dickens
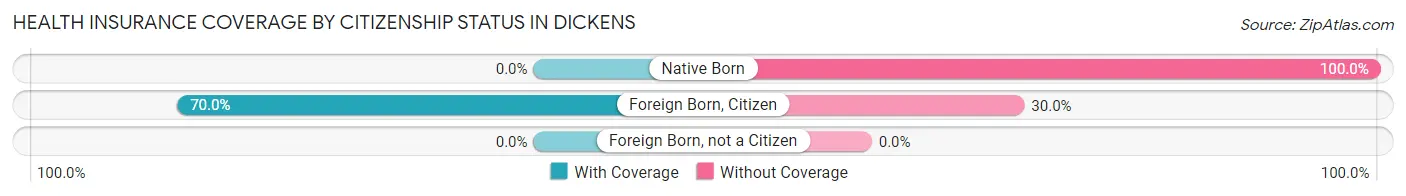
| Citizenship Status | With Coverage | Without Coverage |
| Native Born | 0 (0.0%) | 9 (100.0%) |
| Foreign Born, Citizen | 7 (70.0%) | 3 (30.0%) |
| Foreign Born, not a Citizen | 0 (0.0%) | 0 (0.0%) |
Health Insurance Coverage by Household Income in Dickens
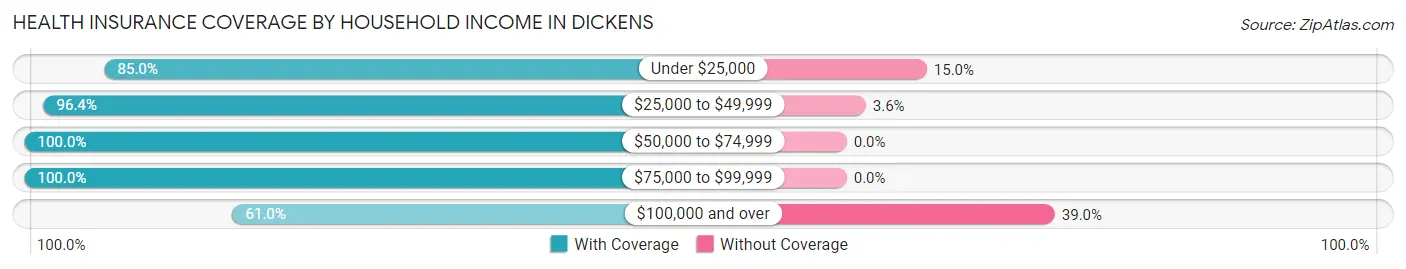
| Household Income | With Coverage | Without Coverage |
| Under $25,000 | 34 (85.0%) | 6 (15.0%) |
| $25,000 to $49,999 | 54 (96.4%) | 2 (3.6%) |
| $50,000 to $74,999 | 13 (100.0%) | 0 (0.0%) |
| $75,000 to $99,999 | 5 (100.0%) | 0 (0.0%) |
| $100,000 and over | 36 (61.0%) | 23 (39.0%) |
Public vs Private Health Insurance Coverage by Age in Dickens
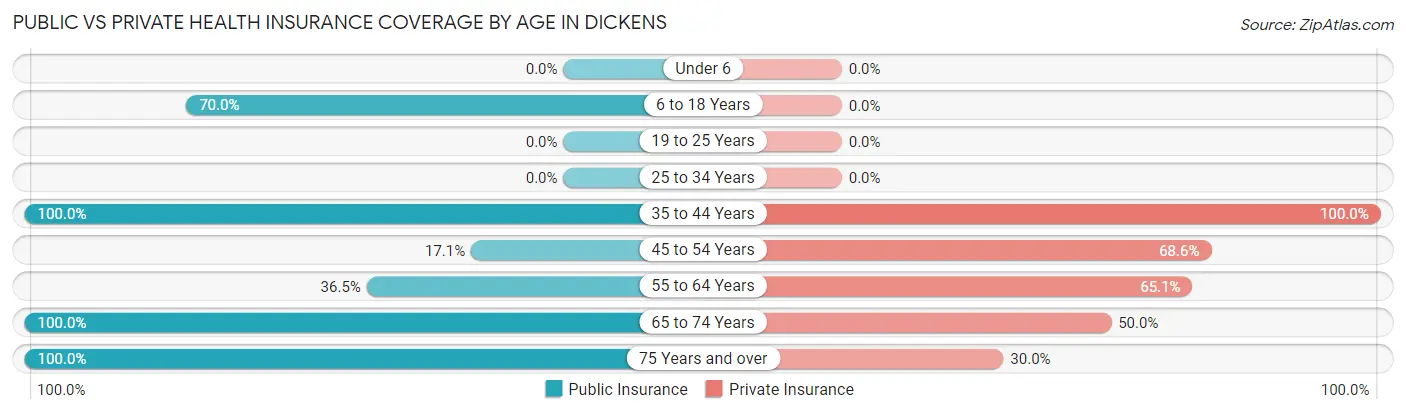
| Age Bracket | Public Insurance | Private Insurance |
| Under 6 | 0 (0.0%) | 0 (0.0%) |
| 6 to 18 Years | 7 (70.0%) | 0 (0.0%) |
| 19 to 25 Years | 0 (0.0%) | 0 (0.0%) |
| 25 to 34 Years | 0 (0.0%) | 0 (0.0%) |
| 35 to 44 Years | 5 (100.0%) | 5 (100.0%) |
| 45 to 54 Years | 6 (17.1%) | 24 (68.6%) |
| 55 to 64 Years | 23 (36.5%) | 41 (65.1%) |
| 65 to 74 Years | 28 (100.0%) | 14 (50.0%) |
| 75 Years and over | 10 (100.0%) | 3 (30.0%) |
| Total | 79 (45.7%) | 87 (50.3%) |
Disability Status by Sex by Age in Dickens
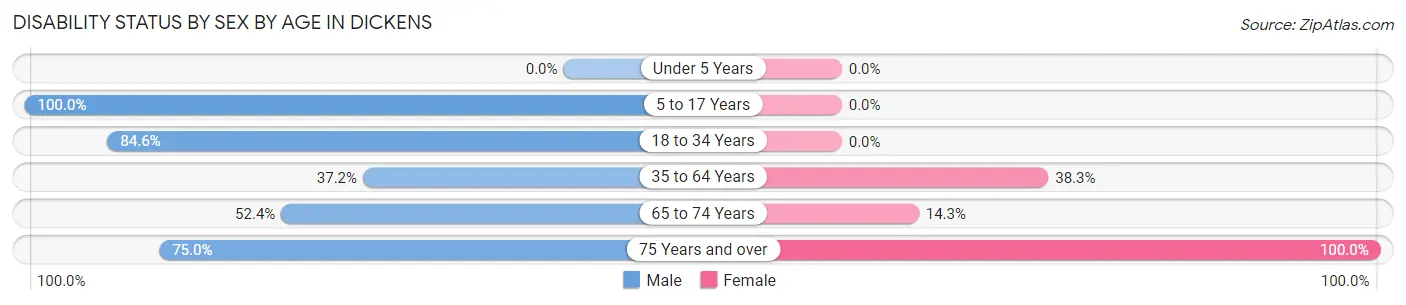
| Age Bracket | Male | Female |
| Under 5 Years | 0 (0.0%) | 0 (0.0%) |
| 5 to 17 Years | 7 (100.0%) | 0 (0.0%) |
| 18 to 34 Years | 11 (84.6%) | 0 (0.0%) |
| 35 to 64 Years | 16 (37.2%) | 23 (38.3%) |
| 65 to 74 Years | 11 (52.4%) | 1 (14.3%) |
| 75 Years and over | 3 (75.0%) | 6 (100.0%) |
Disability Class by Sex by Age in Dickens
Disability Class: Hearing Difficulty
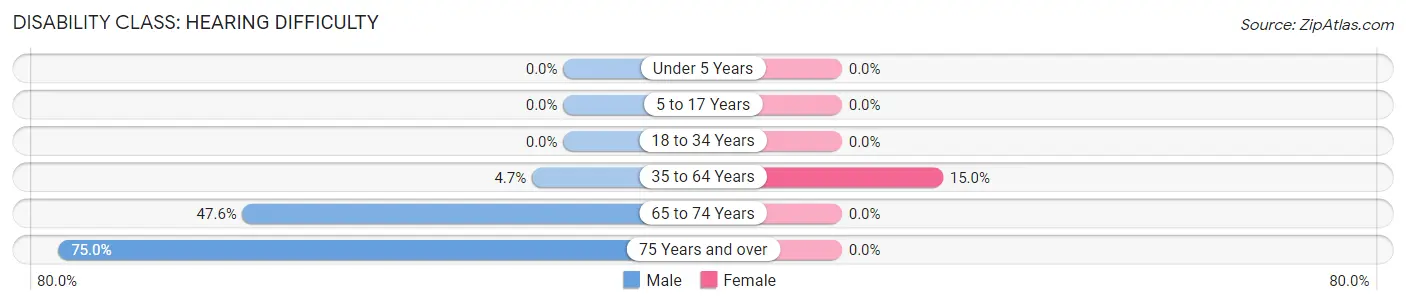
| Age Bracket | Male | Female |
| Under 5 Years | 0 (0.0%) | 0 (0.0%) |
| 5 to 17 Years | 0 (0.0%) | 0 (0.0%) |
| 18 to 34 Years | 0 (0.0%) | 0 (0.0%) |
| 35 to 64 Years | 2 (4.6%) | 9 (15.0%) |
| 65 to 74 Years | 10 (47.6%) | 0 (0.0%) |
| 75 Years and over | 3 (75.0%) | 0 (0.0%) |
Disability Class: Vision Difficulty
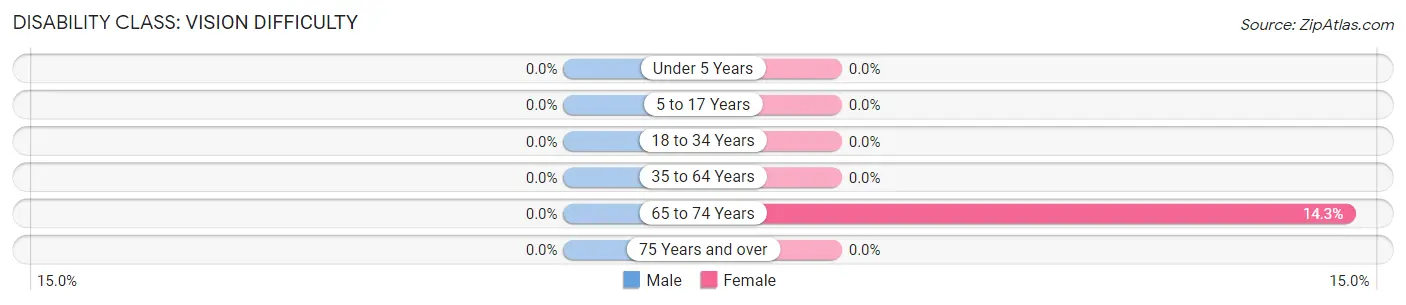
| Age Bracket | Male | Female |
| Under 5 Years | 0 (0.0%) | 0 (0.0%) |
| 5 to 17 Years | 0 (0.0%) | 0 (0.0%) |
| 18 to 34 Years | 0 (0.0%) | 0 (0.0%) |
| 35 to 64 Years | 0 (0.0%) | 0 (0.0%) |
| 65 to 74 Years | 0 (0.0%) | 1 (14.3%) |
| 75 Years and over | 0 (0.0%) | 0 (0.0%) |
Disability Class: Cognitive Difficulty
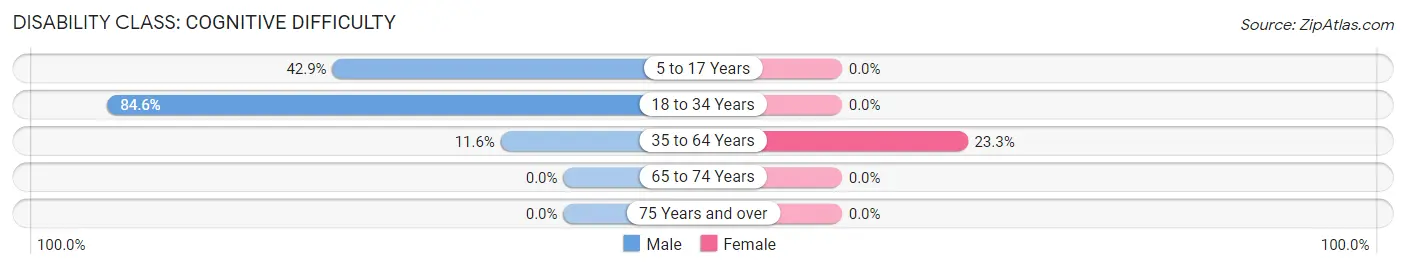
| Age Bracket | Male | Female |
| 5 to 17 Years | 3 (42.9%) | 0 (0.0%) |
| 18 to 34 Years | 11 (84.6%) | 0 (0.0%) |
| 35 to 64 Years | 5 (11.6%) | 14 (23.3%) |
| 65 to 74 Years | 0 (0.0%) | 0 (0.0%) |
| 75 Years and over | 0 (0.0%) | 0 (0.0%) |
Disability Class: Ambulatory Difficulty
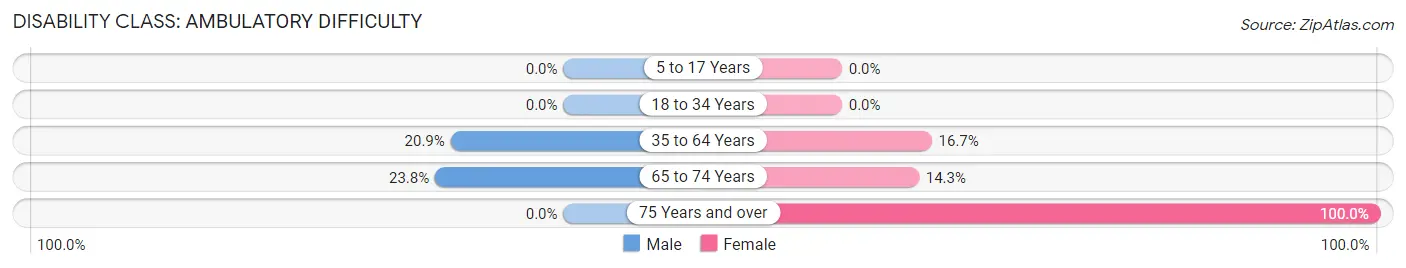
| Age Bracket | Male | Female |
| 5 to 17 Years | 0 (0.0%) | 0 (0.0%) |
| 18 to 34 Years | 0 (0.0%) | 0 (0.0%) |
| 35 to 64 Years | 9 (20.9%) | 10 (16.7%) |
| 65 to 74 Years | 5 (23.8%) | 1 (14.3%) |
| 75 Years and over | 0 (0.0%) | 6 (100.0%) |
Disability Class: Self-Care Difficulty
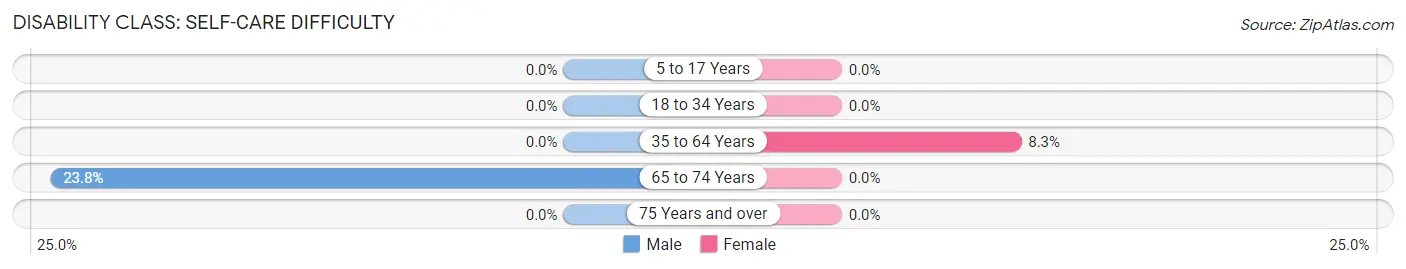
| Age Bracket | Male | Female |
| 5 to 17 Years | 0 (0.0%) | 0 (0.0%) |
| 18 to 34 Years | 0 (0.0%) | 0 (0.0%) |
| 35 to 64 Years | 0 (0.0%) | 5 (8.3%) |
| 65 to 74 Years | 5 (23.8%) | 0 (0.0%) |
| 75 Years and over | 0 (0.0%) | 0 (0.0%) |
Technology Access in Dickens
Computing Device Access in Dickens
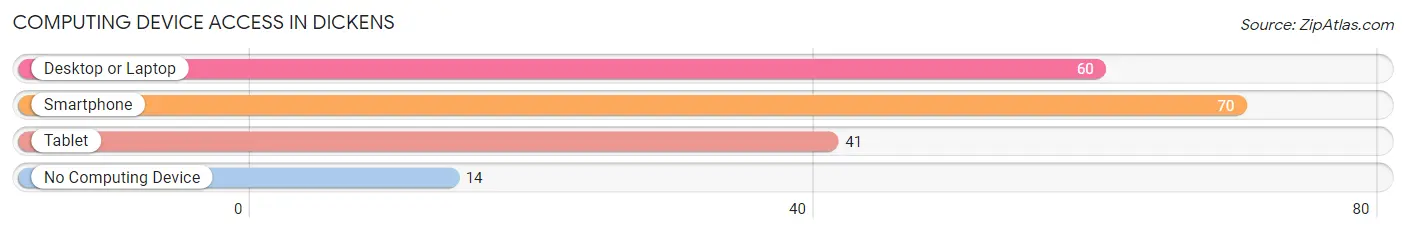
| Device Type | # Households | % Households |
| Desktop or Laptop | 60 | 65.9% |
| Smartphone | 70 | 76.9% |
| Tablet | 41 | 45.1% |
| No Computing Device | 14 | 15.4% |
| Total | 91 | 100.0% |
Internet Access in Dickens
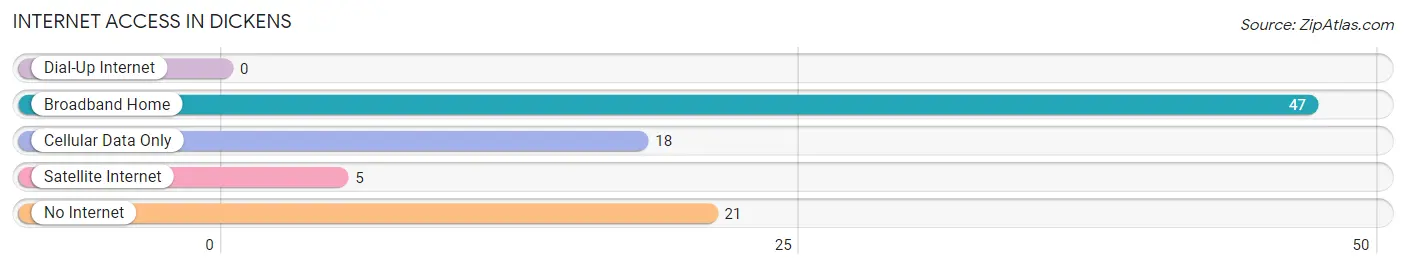
| Internet Type | # Households | % Households |
| Dial-Up Internet | 0 | 0.0% |
| Broadband Home | 47 | 51.6% |
| Cellular Data Only | 18 | 19.8% |
| Satellite Internet | 5 | 5.5% |
| No Internet | 21 | 23.1% |
| Total | 91 | 100.0% |
Dickens Summary
Dickens, Texas is a small town located in the Texas Panhandle, in Dickens County. It is situated on the western edge of the county, near the border with New Mexico. The town was founded in 1891 and named after J. Dickens, a local rancher. As of the 2010 census, the population of Dickens was 1,149.
Geography
Dickens is located at 34°25'25" North, 100°45'45" West (34.423, -100.7625). It is situated at an elevation of 2,845 feet (867 m). The town is located in the High Plains region of the Texas Panhandle, and is surrounded by flat, open terrain. The nearest major city is Lubbock, which is located about 100 miles (160 km) to the east.
Climate
Dickens has a semi-arid climate, with hot summers and cold winters. The average annual temperature is 64°F (18°C), and the average annual precipitation is 19.5 inches (495 mm). The hottest month is July, with an average high temperature of 92°F (33°C), and the coldest month is January, with an average low temperature of 24°F (-4°C).
Economy
The economy of Dickens is largely based on agriculture. The town is home to several large farms and ranches, which produce a variety of crops, including wheat, corn, sorghum, and cotton. The town also has a small manufacturing sector, which produces a variety of products, including furniture, clothing, and food products.
Demographics
As of the 2010 census, the population of Dickens was 1,149. The racial makeup of the town was 94.2% White, 0.2% African American, 0.7% Native American, 0.2% Asian, 0.1% Pacific Islander, 3.2% from other races, and 1.6% from two or more races. Hispanic or Latino of any race were 6.2% of the population.
The median income for a household in the town was $30,938, and the median income for a family was $36,250. Males had a median income of $27,500 versus $20,000 for females. The per capita income for the town was $14,945. About 14.2% of families and 17.2% of the population were below the poverty line, including 22.2% of those under age 18 and 11.2% of those age 65 or over.
Education
Dickens is served by the Dickens Independent School District, which includes one elementary school, one middle school, and one high school. The town is also home to a branch of South Plains College, which offers a variety of associate degree and certificate programs.
Conclusion
Dickens, Texas is a small town located in the Texas Panhandle, in Dickens County. It is situated on the western edge of the county, near the border with New Mexico. The town was founded in 1891 and named after J. Dickens, a local rancher. As of the 2010 census, the population of Dickens was 1,149. The economy of Dickens is largely based on agriculture, and the town is home to several large farms and ranches. The racial makeup of the town was 94.2% White, 0.2% African American, 0.7% Native American, 0.2% Asian, 0.1% Pacific Islander, 3.2% from other races, and 1.6% from two or more races. The town is served by the Dickens Independent School District, which includes one elementary school, one middle school, and one high school. It is also home to a branch of South Plains College, which offers a variety of associate degree and certificate programs.
Common Questions
What is Per Capita Income in Dickens?
Per Capita income in Dickens is $29,497.
What is the Median Family Income in Dickens?
Median Family Income in Dickens is $39,583.
What is the Median Household income in Dickens?
Median Household Income in Dickens is $40,875.
What is Inequality or Gini Index in Dickens?
Inequality or Gini Index in Dickens is 0.43.
What is the Total Population of Dickens?
Total Population of Dickens is 197.
What is the Total Male Population of Dickens?
Total Male Population of Dickens is 88.
What is the Total Female Population of Dickens?
Total Female Population of Dickens is 109.
What is the Ratio of Males per 100 Females in Dickens?
There are 80.73 Males per 100 Females in Dickens.
What is the Ratio of Females per 100 Males in Dickens?
There are 123.86 Females per 100 Males in Dickens.
What is the Median Population Age in Dickens?
Median Population Age in Dickens is 55.5 Years.
What is the Average Family Size in Dickens
Average Family Size in Dickens is 2.4 People.
What is the Average Household Size in Dickens
Average Household Size in Dickens is 1.9 People.
How Large is the Labor Force in Dickens?
There are 68 People in the Labor Forcein in Dickens.
What is the Percentage of People in the Labor Force in Dickens?
37.4% of People are in the Labor Force in Dickens.