Fort Davis, TX Map & Demographics
Fort Davis Map
Fort Davis Overview
$43,847
PER CAPITA INCOME
0.59
INEQUALITY / GINI INDEX
924
TOTAL POPULATION
570
MALE POPULATION
354
FEMALE POPULATION
161.02
MALES / 100 FEMALES
62.11
FEMALES / 100 MALES
49.4
MEDIAN AGE
2.8
AVG FAMILY SIZE
1.8
AVG HOUSEHOLD SIZE
412
LABOR FORCE [ PEOPLE ]
56.6%
PERCENT IN LABOR FORCE
Fort Davis Zip Codes
Fort Davis Area Codes
Income in Fort Davis
Income Overview in Fort Davis
| Characteristic | Number | Measure |
| Per Capita Income | 924 | $43,847 |
| Median Family Income | 183 | $0 |
| Mean Family Income | 183 | $74,780 |
| Median Household Income | 505 | $0 |
| Mean Household Income | 505 | $81,208 |
| Income Deficit | 183 | $0 |
| Wage / Income Gap (%) | 924 | 0.00% |
| Wage / Income Gap ($) | 924 | 100.00¢ per $1 |
| Gini / Inequality Index | 924 | 0.59 |
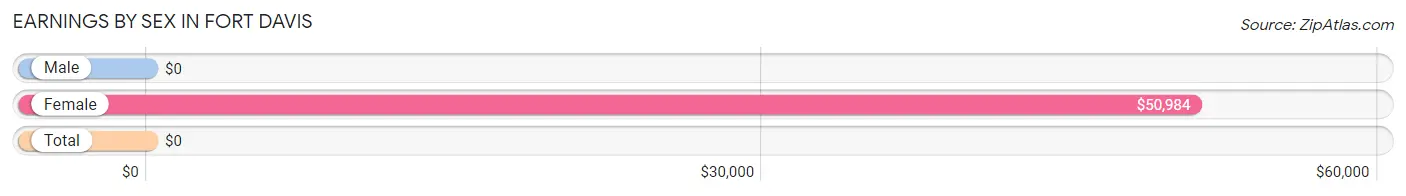
Earnings by Sex in Fort Davis
| Sex | Number | Average Earnings |
| Male | 320 (56.7%) | $0 |
| Female | 244 (43.3%) | $50,984 |
| Total | 564 (100.0%) | $0 |
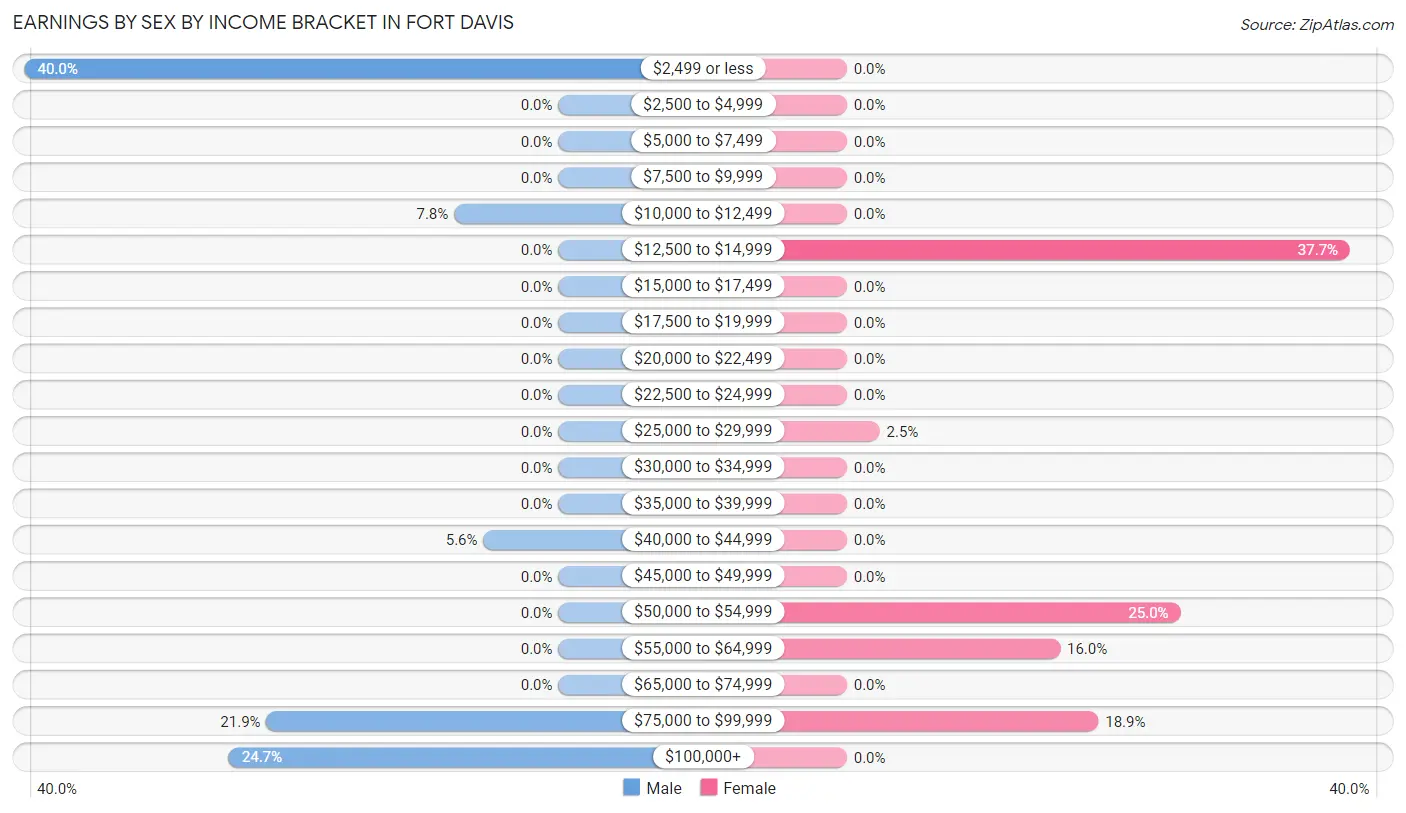
Earnings by Sex by Income Bracket in Fort Davis
The most common earnings brackets in Fort Davis are $2,499 or less for men (128 | 40.0%) and $12,500 to $14,999 for women (92 | 37.7%).
| Income | Male | Female |
| $2,499 or less | 128 (40.0%) | 0 (0.0%) |
| $2,500 to $4,999 | 0 (0.0%) | 0 (0.0%) |
| $5,000 to $7,499 | 0 (0.0%) | 0 (0.0%) |
| $7,500 to $9,999 | 0 (0.0%) | 0 (0.0%) |
| $10,000 to $12,499 | 25 (7.8%) | 0 (0.0%) |
| $12,500 to $14,999 | 0 (0.0%) | 92 (37.7%) |
| $15,000 to $17,499 | 0 (0.0%) | 0 (0.0%) |
| $17,500 to $19,999 | 0 (0.0%) | 0 (0.0%) |
| $20,000 to $22,499 | 0 (0.0%) | 0 (0.0%) |
| $22,500 to $24,999 | 0 (0.0%) | 0 (0.0%) |
| $25,000 to $29,999 | 0 (0.0%) | 6 (2.5%) |
| $30,000 to $34,999 | 0 (0.0%) | 0 (0.0%) |
| $35,000 to $39,999 | 0 (0.0%) | 0 (0.0%) |
| $40,000 to $44,999 | 18 (5.6%) | 0 (0.0%) |
| $45,000 to $49,999 | 0 (0.0%) | 0 (0.0%) |
| $50,000 to $54,999 | 0 (0.0%) | 61 (25.0%) |
| $55,000 to $64,999 | 0 (0.0%) | 39 (16.0%) |
| $65,000 to $74,999 | 0 (0.0%) | 0 (0.0%) |
| $75,000 to $99,999 | 70 (21.9%) | 46 (18.9%) |
| $100,000+ | 79 (24.7%) | 0 (0.0%) |
| Total | 320 (100.0%) | 244 (100.0%) |
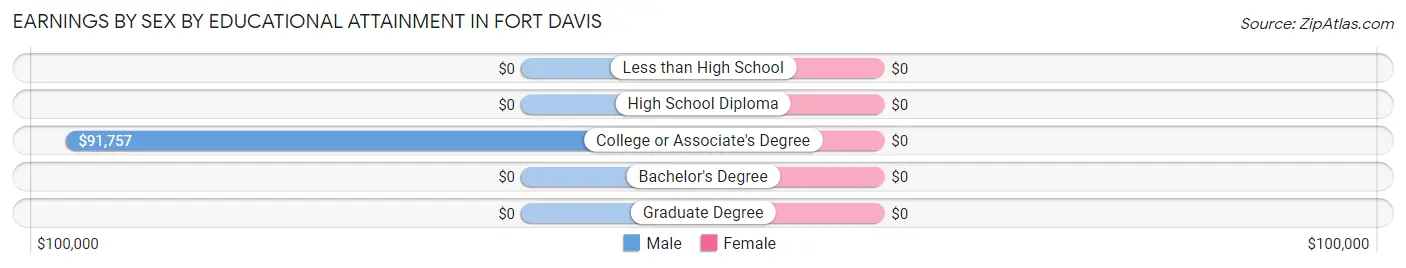
Earnings by Sex by Educational Attainment in Fort Davis
| Educational Attainment | Male Income | Female Income |
| Less than High School | - | - |
| High School Diploma | - | - |
| College or Associate's Degree | $91,757 | $0 |
| Bachelor's Degree | - | - |
| Graduate Degree | - | - |
| Total | - | - |
Family Income in Fort Davis
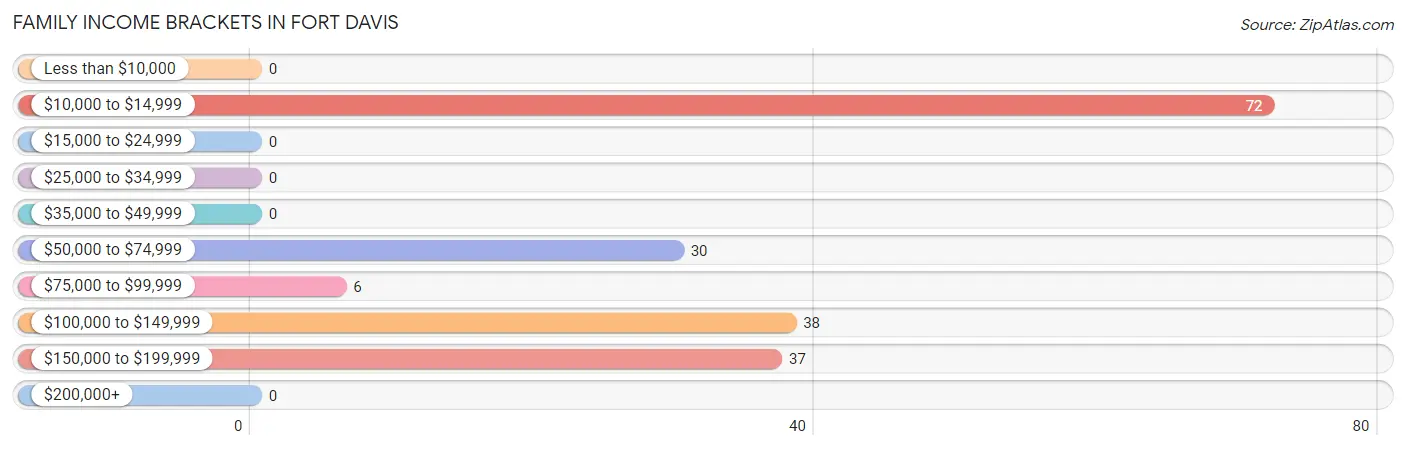
Family Income Brackets in Fort Davis
According to the Fort Davis family income data, there are 72 families falling into the $10,000 to $14,999 income range, which is the most common income bracket and makes up 39.3% of all families.
| Income Bracket | # Families | % Families |
| Less than $10,000 | 0 | 0.0% |
| $10,000 to $14,999 | 72 | 39.3% |
| $15,000 to $24,999 | 0 | 0.0% |
| $25,000 to $34,999 | 0 | 0.0% |
| $35,000 to $49,999 | 0 | 0.0% |
| $50,000 to $74,999 | 30 | 16.4% |
| $75,000 to $99,999 | 6 | 3.3% |
| $100,000 to $149,999 | 38 | 20.8% |
| $150,000 to $199,999 | 37 | 20.2% |
| $200,000+ | 0 | 0.0% |
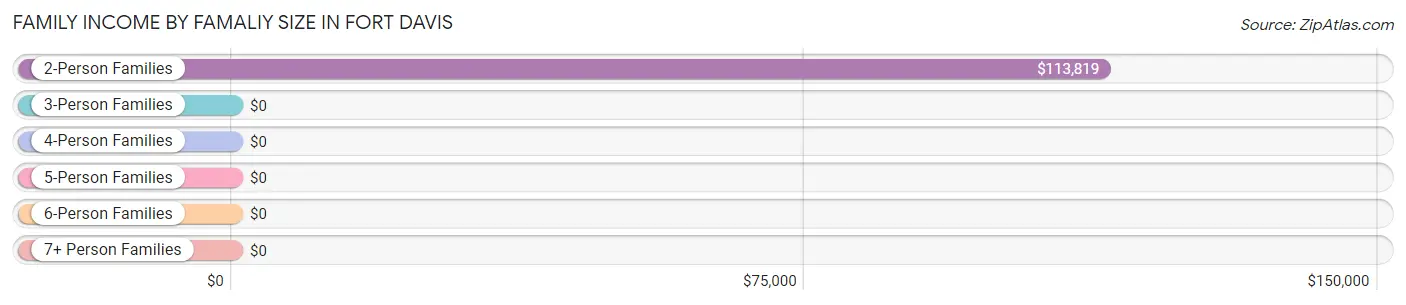
Family Income by Famaliy Size in Fort Davis
2-person families (91 | 49.7%) account for the highest median family income in Fort Davis with $113,819 per family, while 2-person families (91 | 49.7%) have the highest median income of $56,910 per family member.
| Income Bracket | # Families | Median Income |
| 2-Person Families | 91 (49.7%) | $113,819 |
| 3-Person Families | 0 (0.0%) | $0 |
| 4-Person Families | 0 (0.0%) | $0 |
| 5-Person Families | 92 (50.3%) | $0 |
| 6-Person Families | 0 (0.0%) | $0 |
| 7+ Person Families | 0 (0.0%) | $0 |
| Total | 183 (100.0%) | $0 |
Family Income by Number of Earners in Fort Davis
| Number of Earners | # Families | Median Income |
| No Earners | 30 (16.4%) | $0 |
| 1 Earner | 96 (52.5%) | $0 |
| 2 Earners | 57 (31.1%) | $0 |
| 3+ Earners | 0 (0.0%) | $0 |
| Total | 183 (100.0%) | $0 |
Household Income in Fort Davis
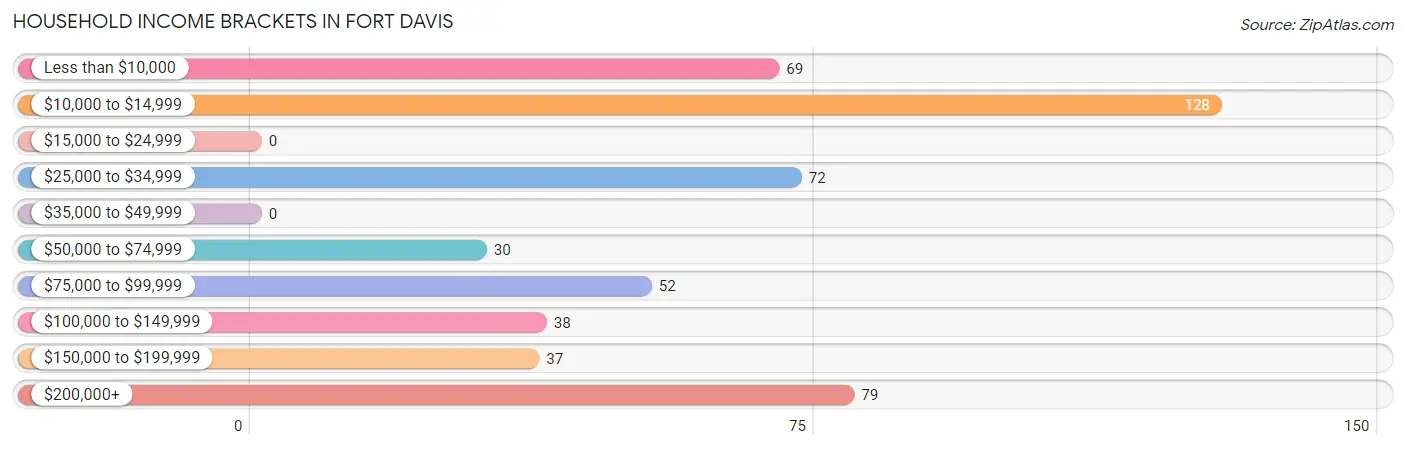
Household Income Brackets in Fort Davis
With 128 households falling in the category, the $10,000 to $14,999 income range is the most frequent in Fort Davis, accounting for 25.4% of all households.
| Income Bracket | # Households | % Households |
| Less than $10,000 | 69 | 13.7% |
| $10,000 to $14,999 | 128 | 25.3% |
| $15,000 to $24,999 | 0 | 0.0% |
| $25,000 to $34,999 | 72 | 14.3% |
| $35,000 to $49,999 | 0 | 0.0% |
| $50,000 to $74,999 | 30 | 5.9% |
| $75,000 to $99,999 | 52 | 10.3% |
| $100,000 to $149,999 | 38 | 7.5% |
| $150,000 to $199,999 | 37 | 7.3% |
| $200,000+ | 79 | 15.6% |
Household Income by Householder Age in Fort Davis
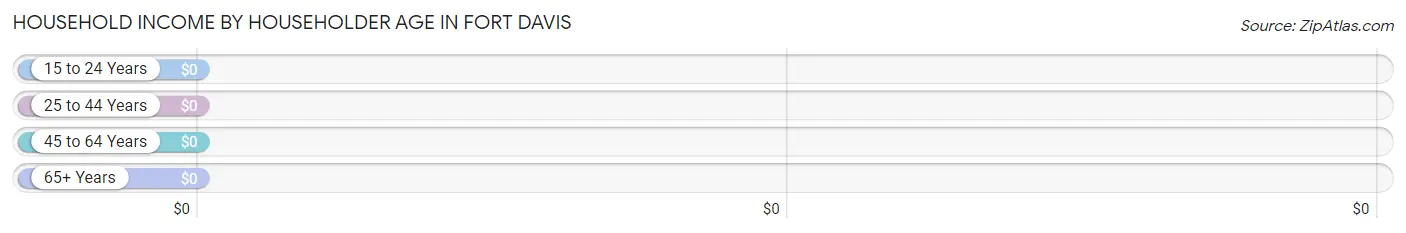
| Income Bracket | # Households | Median Income |
| 15 to 24 Years | 0 (0.0%) | $0 |
| 25 to 44 Years | 92 (18.2%) | $0 |
| 45 to 64 Years | 231 (45.7%) | $0 |
| 65+ Years | 182 (36.0%) | $0 |
| Total | 505 (100.0%) | $0 |
Poverty in Fort Davis
Income Below Poverty by Sex and Age in Fort Davis
With 59.1% poverty level for males and 20.3% for females among the residents of Fort Davis, 12 to 14 year old males and 35 to 44 year old females are the most vulnerable to poverty, with 80 males (100.0%) and 72 females (100.0%) in their respective age groups living below the poverty level.
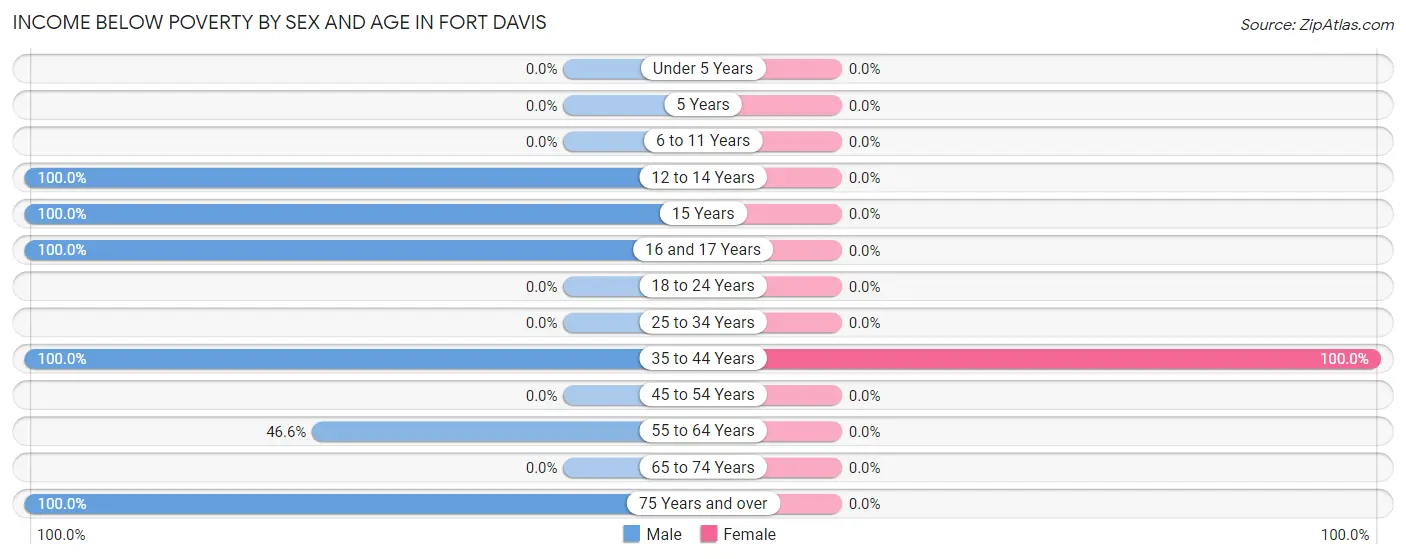
| Age Bracket | Male | Female |
| Under 5 Years | 0 (0.0%) | 0 (0.0%) |
| 5 Years | 0 (0.0%) | 0 (0.0%) |
| 6 to 11 Years | 0 (0.0%) | 0 (0.0%) |
| 12 to 14 Years | 80 (100.0%) | 0 (0.0%) |
| 15 Years | 17 (100.0%) | 0 (0.0%) |
| 16 and 17 Years | 18 (100.0%) | 0 (0.0%) |
| 18 to 24 Years | 0 (0.0%) | 0 (0.0%) |
| 25 to 34 Years | 0 (0.0%) | 0 (0.0%) |
| 35 to 44 Years | 25 (100.0%) | 72 (100.0%) |
| 45 to 54 Years | 0 (0.0%) | 0 (0.0%) |
| 55 to 64 Years | 69 (46.6%) | 0 (0.0%) |
| 65 to 74 Years | 0 (0.0%) | 0 (0.0%) |
| 75 Years and over | 128 (100.0%) | 0 (0.0%) |
| Total | 337 (59.1%) | 72 (20.3%) |
Income Above Poverty by Sex and Age in Fort Davis
According to the poverty statistics in Fort Davis, males aged under 5 years and females aged under 5 years are the age groups that are most secure financially, with 100.0% of males and 100.0% of females in these age groups living above the poverty line.
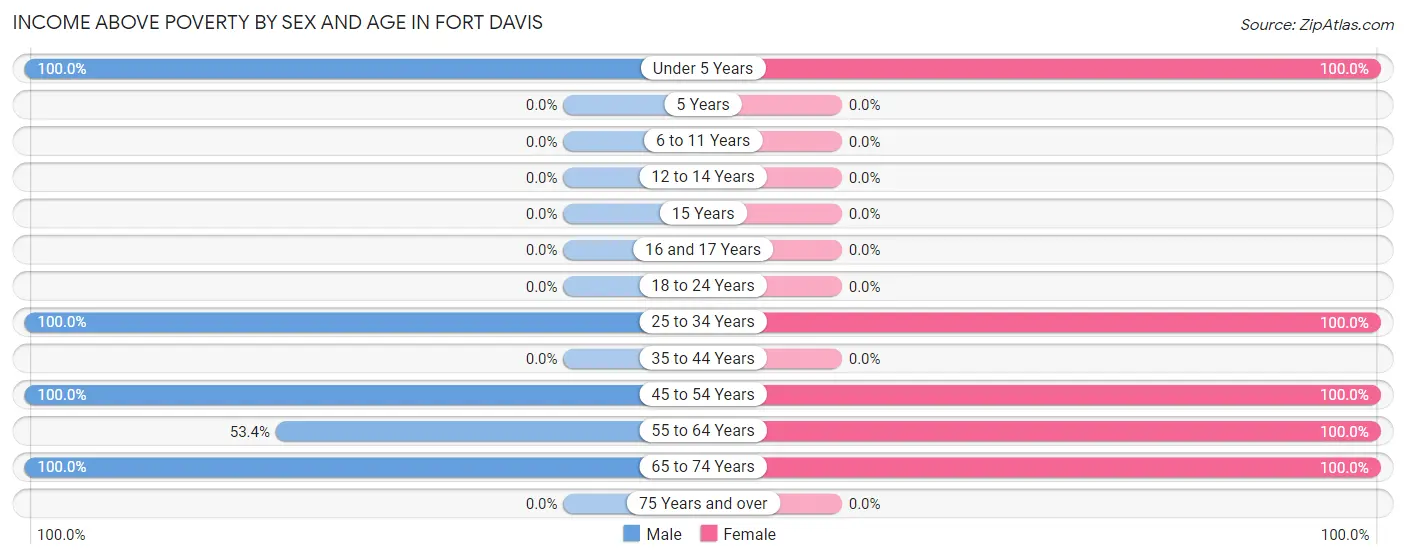
| Age Bracket | Male | Female |
| Under 5 Years | 33 (100.0%) | 66 (100.0%) |
| 5 Years | 0 (0.0%) | 0 (0.0%) |
| 6 to 11 Years | 0 (0.0%) | 0 (0.0%) |
| 12 to 14 Years | 0 (0.0%) | 0 (0.0%) |
| 15 Years | 0 (0.0%) | 0 (0.0%) |
| 16 and 17 Years | 0 (0.0%) | 0 (0.0%) |
| 18 to 24 Years | 0 (0.0%) | 0 (0.0%) |
| 25 to 34 Years | 33 (100.0%) | 20 (100.0%) |
| 35 to 44 Years | 0 (0.0%) | 0 (0.0%) |
| 45 to 54 Years | 37 (100.0%) | 85 (100.0%) |
| 55 to 64 Years | 79 (53.4%) | 61 (100.0%) |
| 65 to 74 Years | 51 (100.0%) | 50 (100.0%) |
| 75 Years and over | 0 (0.0%) | 0 (0.0%) |
| Total | 233 (40.9%) | 282 (79.7%) |
Income Below Poverty Among Married-Couple Families in Fort Davis
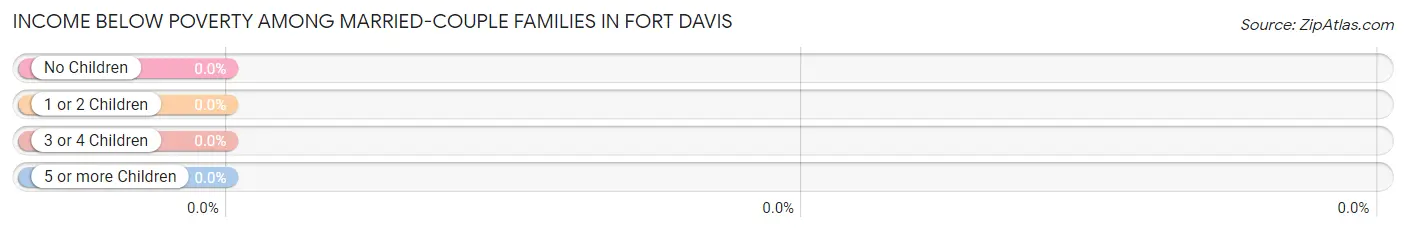
| Children | Above Poverty | Below Poverty |
| No Children | 91 (100.0%) | 0 (0.0%) |
| 1 or 2 Children | 0 (0.0%) | 0 (0.0%) |
| 3 or 4 Children | 20 (100.0%) | 0 (0.0%) |
| 5 or more Children | 0 (0.0%) | 0 (0.0%) |
| Total | 111 (100.0%) | 0 (0.0%) |
Income Below Poverty Among Single-Parent Households in Fort Davis
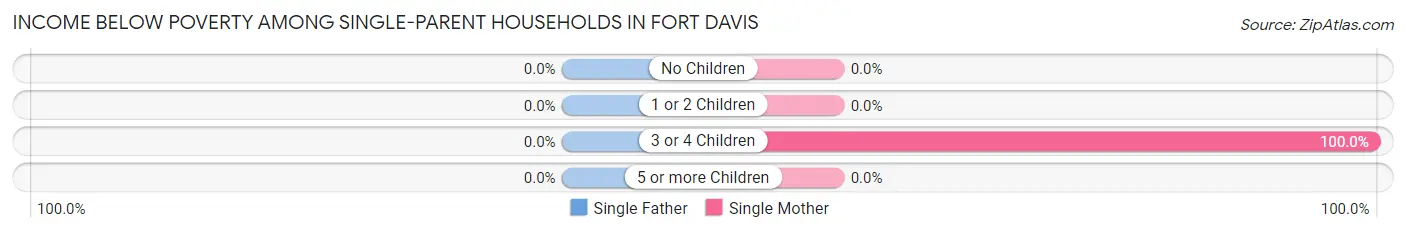
| Children | Single Father | Single Mother |
| No Children | 0 (0.0%) | 0 (0.0%) |
| 1 or 2 Children | 0 (0.0%) | 0 (0.0%) |
| 3 or 4 Children | 0 (0.0%) | 72 (100.0%) |
| 5 or more Children | 0 (0.0%) | 0 (0.0%) |
| Total | 0 (0.0%) | 72 (100.0%) |
Income Below Poverty Among Married-Couple vs Single-Parent Households in Fort Davis
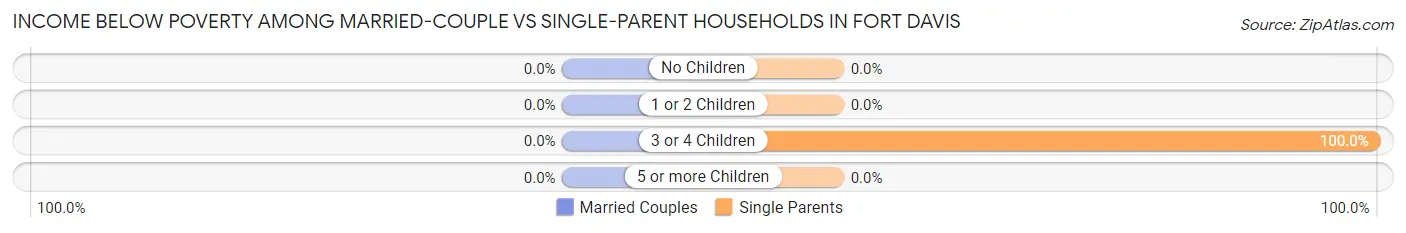
| Children | Married-Couple Families | Single-Parent Households |
| No Children | 0 (0.0%) | 0 (0.0%) |
| 1 or 2 Children | 0 (0.0%) | 0 (0.0%) |
| 3 or 4 Children | 0 (0.0%) | 72 (100.0%) |
| 5 or more Children | 0 (0.0%) | 0 (0.0%) |
| Total | 0 (0.0%) | 72 (100.0%) |
Race in Fort Davis
The most populous races in Fort Davis are White / Caucasian (757 | 81.9%), Hispanic or Latino (227 | 24.6%), and Two or more Races (167 | 18.1%).
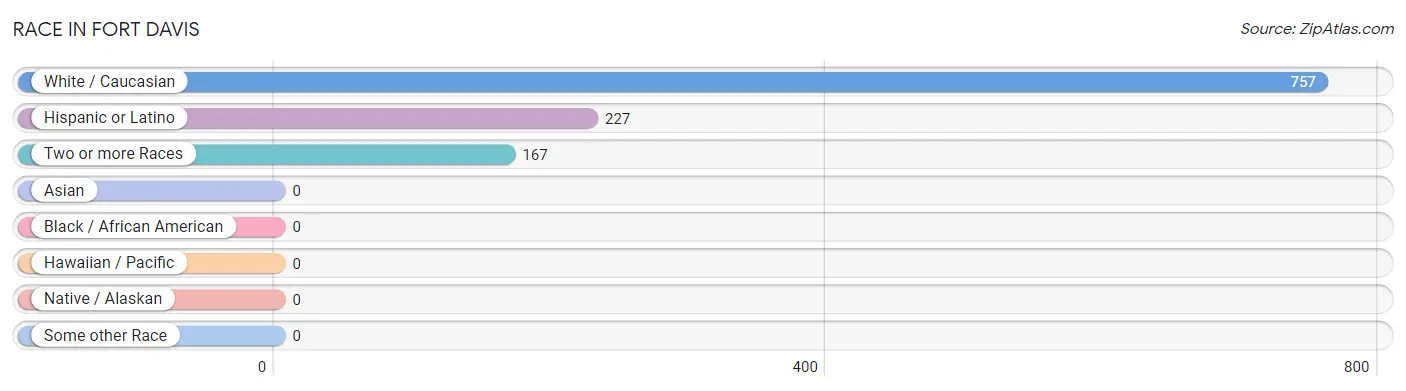
| Race | # Population | % Population |
| Asian | 0 | 0.0% |
| Black / African American | 0 | 0.0% |
| Hawaiian / Pacific | 0 | 0.0% |
| Hispanic or Latino | 227 | 24.6% |
| Native / Alaskan | 0 | 0.0% |
| White / Caucasian | 757 | 81.9% |
| Two or more Races | 167 | 18.1% |
| Some other Race | 0 | 0.0% |
| Total | 924 | 100.0% |
Ancestry in Fort Davis
The most populous ancestries reported in Fort Davis are Mexican (227 | 24.6%), English (222 | 24.0%), Irish (79 | 8.6%), Scotch-Irish (61 | 6.6%), and Apache (39 | 4.2%), together accounting for 68.0% of all Fort Davis residents.
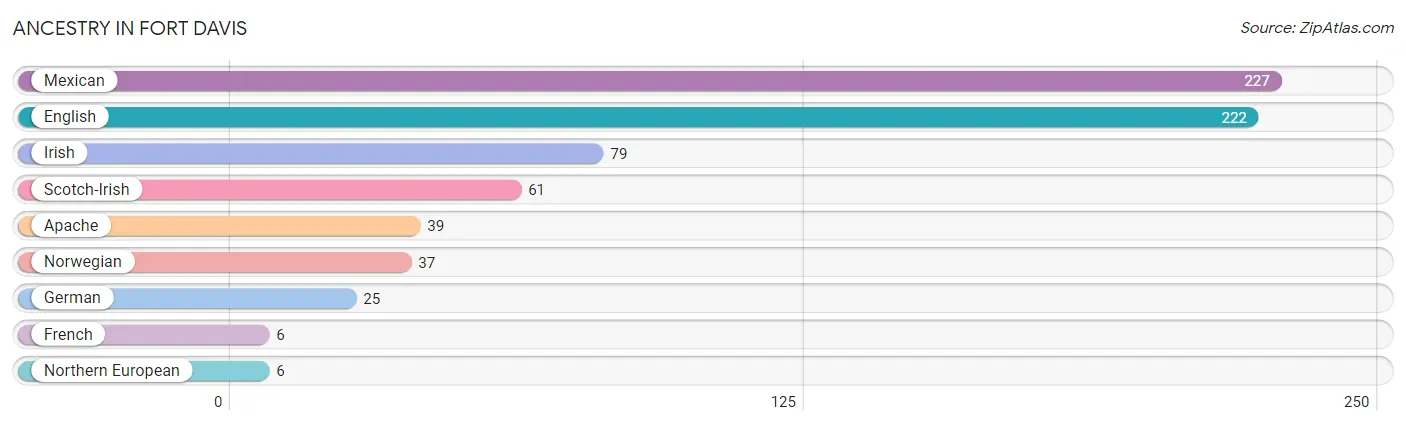
| Ancestry | # Population | % Population |
| Apache | 39 | 4.2% |
| English | 222 | 24.0% |
| French | 6 | 0.6% |
| German | 25 | 2.7% |
| Irish | 79 | 8.6% |
| Mexican | 227 | 24.6% |
| Northern European | 6 | 0.6% |
| Norwegian | 37 | 4.0% |
| Scotch-Irish | 61 | 6.6% | View All 9 Rows |
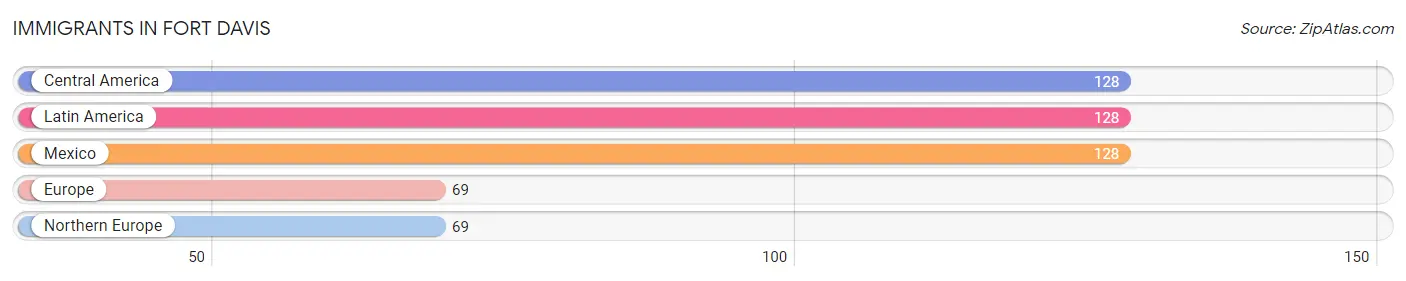
Immigrants in Fort Davis
The most numerous immigrant groups reported in Fort Davis came from Central America (128 | 13.9%), Latin America (128 | 13.9%), Mexico (128 | 13.9%), Europe (69 | 7.5%), and Northern Europe (69 | 7.5%), together accounting for 56.5% of all Fort Davis residents.
| Immigration Origin | # Population | % Population |
| Central America | 128 | 13.9% |
| Europe | 69 | 7.5% |
| Latin America | 128 | 13.9% |
| Mexico | 128 | 13.9% |
| Northern Europe | 69 | 7.5% | View All 5 Rows |
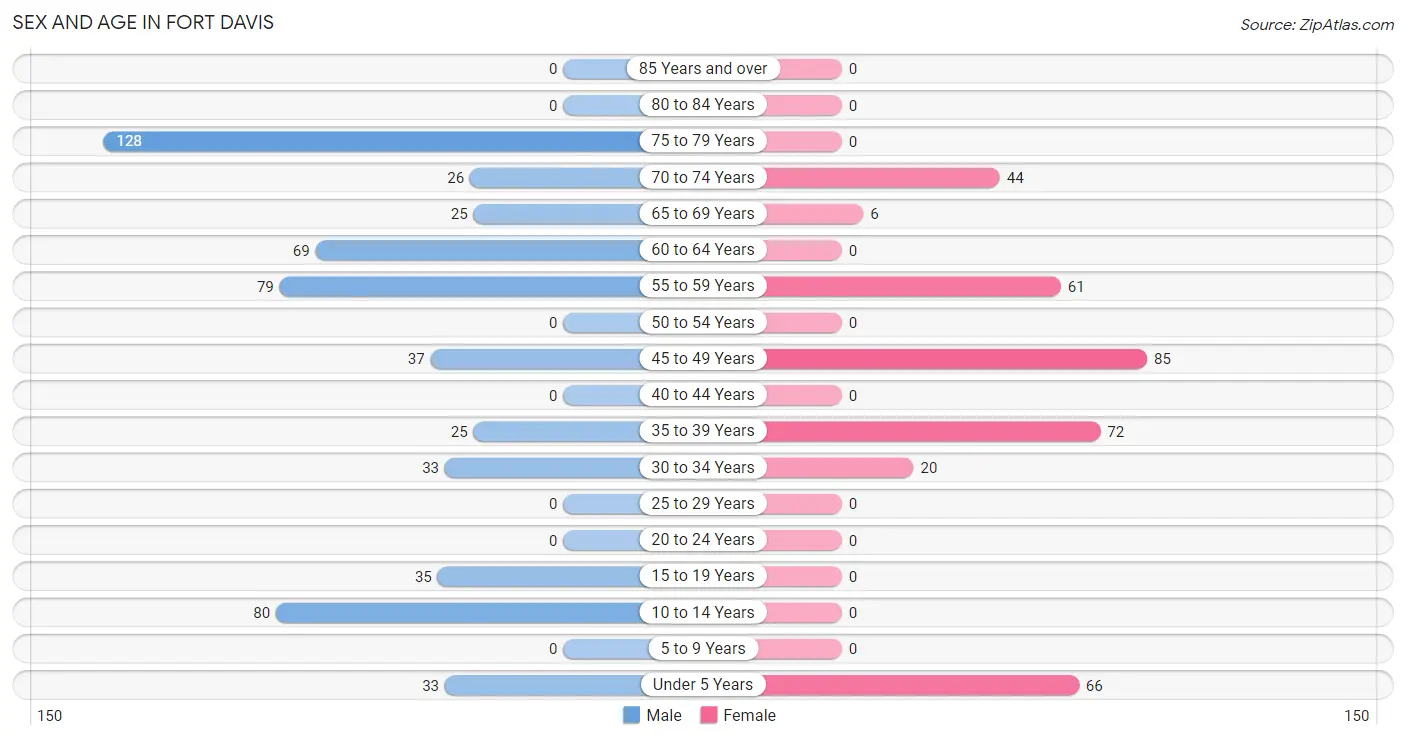
Sex and Age in Fort Davis
Sex and Age in Fort Davis
The most populous age groups in Fort Davis are 75 to 79 Years (128 | 22.5%) for men and 45 to 49 Years (85 | 24.0%) for women.
| Age Bracket | Male | Female |
| Under 5 Years | 33 (5.8%) | 66 (18.6%) |
| 5 to 9 Years | 0 (0.0%) | 0 (0.0%) |
| 10 to 14 Years | 80 (14.0%) | 0 (0.0%) |
| 15 to 19 Years | 35 (6.1%) | 0 (0.0%) |
| 20 to 24 Years | 0 (0.0%) | 0 (0.0%) |
| 25 to 29 Years | 0 (0.0%) | 0 (0.0%) |
| 30 to 34 Years | 33 (5.8%) | 20 (5.7%) |
| 35 to 39 Years | 25 (4.4%) | 72 (20.3%) |
| 40 to 44 Years | 0 (0.0%) | 0 (0.0%) |
| 45 to 49 Years | 37 (6.5%) | 85 (24.0%) |
| 50 to 54 Years | 0 (0.0%) | 0 (0.0%) |
| 55 to 59 Years | 79 (13.9%) | 61 (17.2%) |
| 60 to 64 Years | 69 (12.1%) | 0 (0.0%) |
| 65 to 69 Years | 25 (4.4%) | 6 (1.7%) |
| 70 to 74 Years | 26 (4.6%) | 44 (12.4%) |
| 75 to 79 Years | 128 (22.5%) | 0 (0.0%) |
| 80 to 84 Years | 0 (0.0%) | 0 (0.0%) |
| 85 Years and over | 0 (0.0%) | 0 (0.0%) |
| Total | 570 (100.0%) | 354 (100.0%) |
Families and Households in Fort Davis
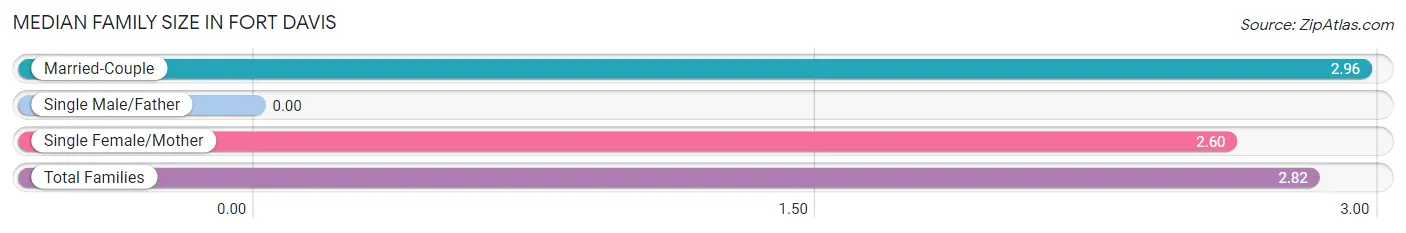
Median Family Size in Fort Davis
| Family Type | # Families | Family Size |
| Married-Couple | 111 (60.7%) | 2.96 |
| Single Male/Father | 0 (0.0%) | - |
| Single Female/Mother | 72 (39.3%) | 2.60 |
| Total Families | 183 (100.0%) | 2.82 |
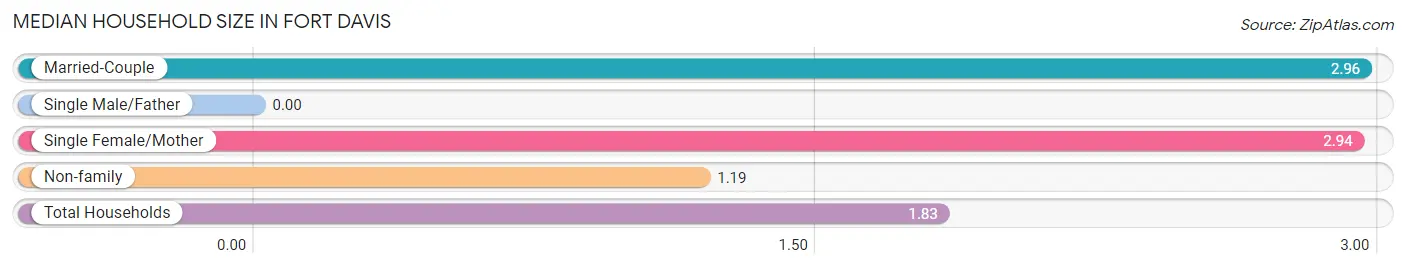
Median Household Size in Fort Davis
| Household Type | # Households | Household Size |
| Married-Couple | 111 (22.0%) | 2.96 |
| Single Male/Father | 0 (0.0%) | - |
| Single Female/Mother | 72 (14.3%) | 2.94 |
| Non-family | 322 (63.8%) | 1.19 |
| Total Households | 505 (100.0%) | 1.83 |
Household Size by Marriage Status in Fort Davis
Out of a total of 505 households in Fort Davis, 183 (36.2%) are family households, while 322 (63.8%) are nonfamily households. The most numerous type of family households are 2-person households, comprising 91, and the most common type of nonfamily households are 1-person households, comprising 243.
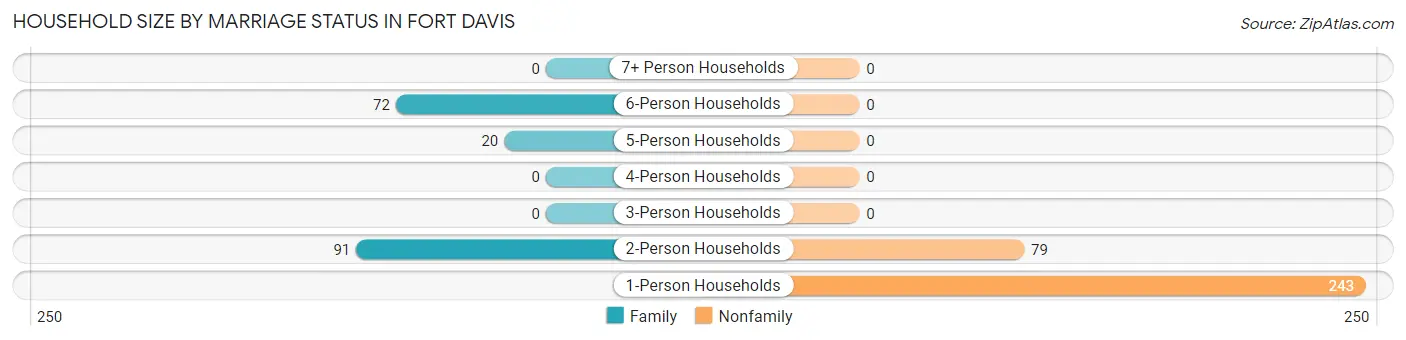
| Household Size | Family Households | Nonfamily Households |
| 1-Person Households | - | 243 (48.1%) |
| 2-Person Households | 91 (18.0%) | 79 (15.6%) |
| 3-Person Households | 0 (0.0%) | 0 (0.0%) |
| 4-Person Households | 0 (0.0%) | 0 (0.0%) |
| 5-Person Households | 20 (4.0%) | 0 (0.0%) |
| 6-Person Households | 72 (14.3%) | 0 (0.0%) |
| 7+ Person Households | 0 (0.0%) | 0 (0.0%) |
| Total | 183 (36.2%) | 322 (63.8%) |
Female Fertility in Fort Davis
Fertility by Age in Fort Davis
Average fertility rate in Fort Davis is 113.0 births per 1,000 women. Women in the age bracket of 20 to 34 years have the highest fertility rate with 1,000.0 births per 1,000 women. Women in the age bracket of 20 to 34 years acount for 100.0% of all women with births.
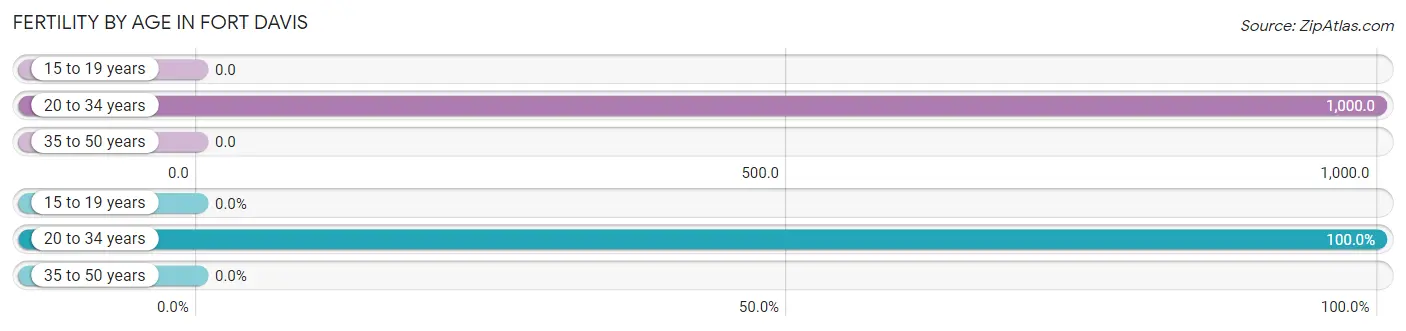
| Age Bracket | Women with Births | Births / 1,000 Women |
| 15 to 19 years | 0 (0.0%) | 0.0 |
| 20 to 34 years | 20 (100.0%) | 1,000.0 |
| 35 to 50 years | 0 (0.0%) | 0.0 |
| Total | 20 (100.0%) | 113.0 |
Fertility by Age by Marriage Status in Fort Davis
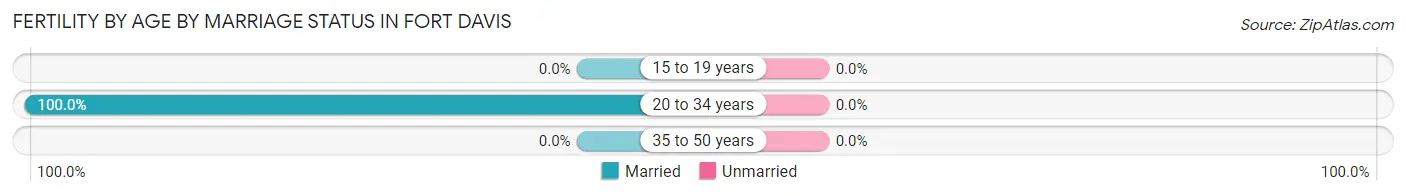
| Age Bracket | Married | Unmarried |
| 15 to 19 years | 0 (0.0%) | 0 (0.0%) |
| 20 to 34 years | 20 (100.0%) | 0 (0.0%) |
| 35 to 50 years | 0 (0.0%) | 0 (0.0%) |
| Total | 20 (100.0%) | 0 (0.0%) |
Fertility by Education in Fort Davis
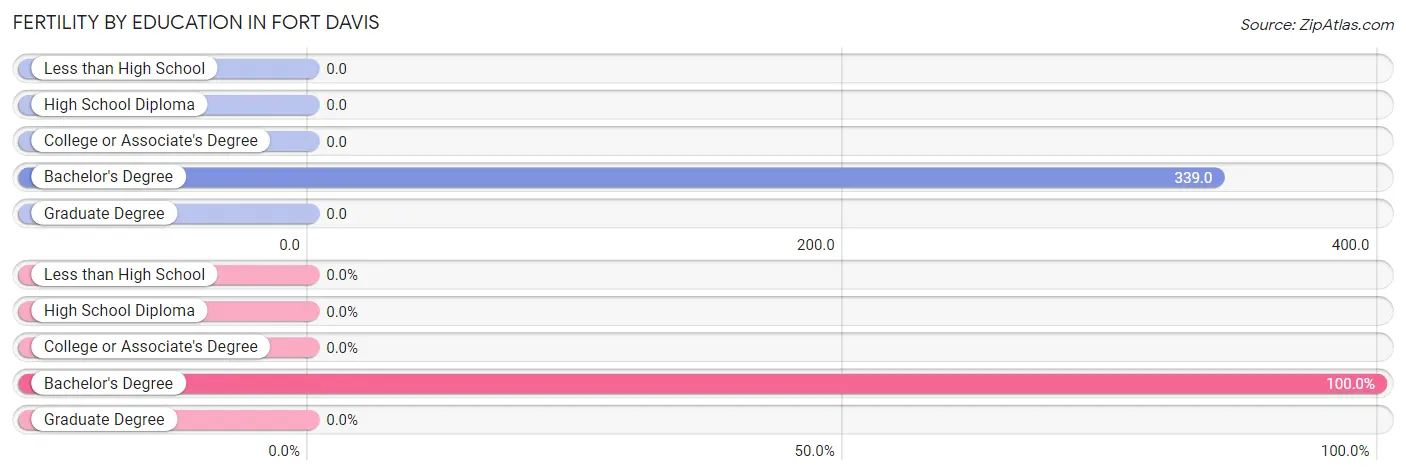
| Educational Attainment | Women with Births | Births / 1,000 Women |
| Less than High School | 0 (0.0%) | 0.0 |
| High School Diploma | 0 (0.0%) | 0.0 |
| College or Associate's Degree | 0 (0.0%) | 0.0 |
| Bachelor's Degree | 20 (100.0%) | 339.0 |
| Graduate Degree | 0 (0.0%) | 0.0 |
| Total | 20 (100.0%) | 113.0 |
Fertility by Education by Marriage Status in Fort Davis
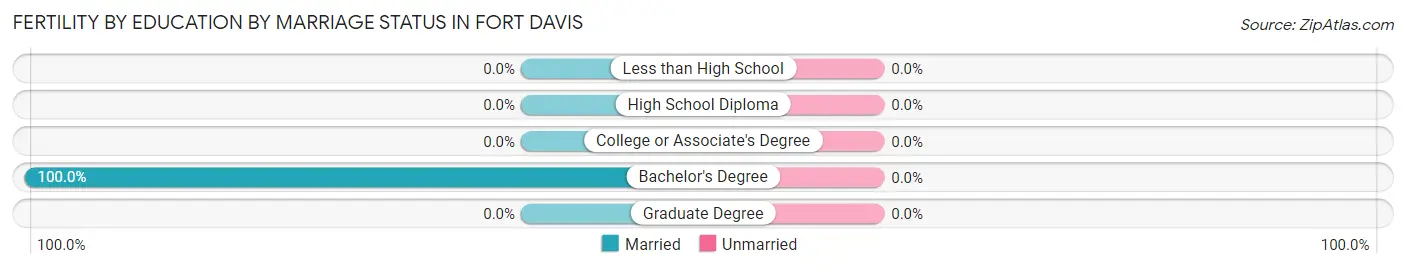
| Educational Attainment | Married | Unmarried |
| Less than High School | 0 (0.0%) | 0 (0.0%) |
| High School Diploma | 0 (0.0%) | 0 (0.0%) |
| College or Associate's Degree | 0 (0.0%) | 0 (0.0%) |
| Bachelor's Degree | 20 (100.0%) | 0 (0.0%) |
| Graduate Degree | 0 (0.0%) | 0 (0.0%) |
| Total | 20 (100.0%) | 0 (0.0%) |
Employment Characteristics in Fort Davis
Employment by Class of Employer in Fort Davis
Among the 387 employed individuals in Fort Davis, private company employees (348 | 89.9%), and local government employees (39 | 10.1%) make up the most common classes of employment.
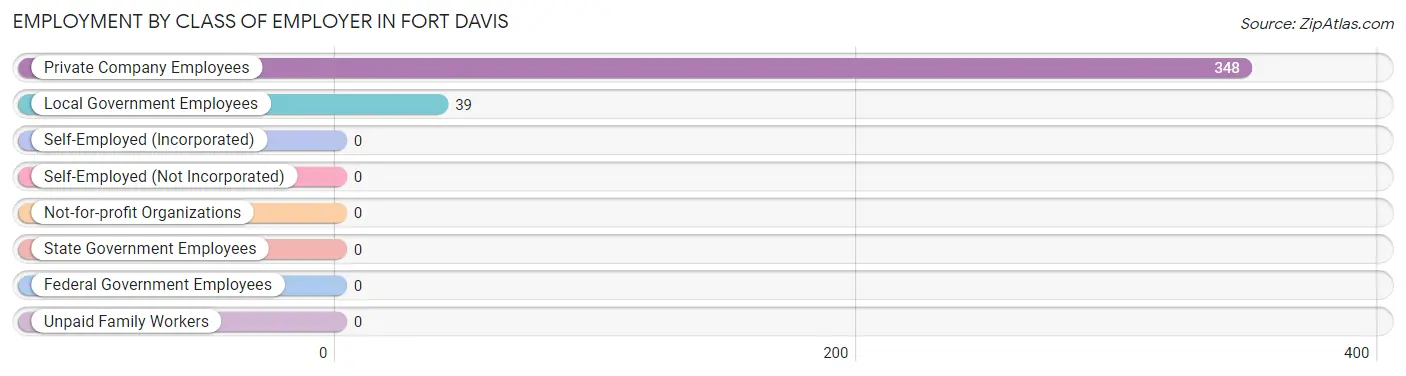
| Employer Class | # Employees | % Employees |
| Private Company Employees | 348 | 89.9% |
| Self-Employed (Incorporated) | 0 | 0.0% |
| Self-Employed (Not Incorporated) | 0 | 0.0% |
| Not-for-profit Organizations | 0 | 0.0% |
| Local Government Employees | 39 | 10.1% |
| State Government Employees | 0 | 0.0% |
| Federal Government Employees | 0 | 0.0% |
| Unpaid Family Workers | 0 | 0.0% |
| Total | 387 | 100.0% |
Employment Status by Age in Fort Davis
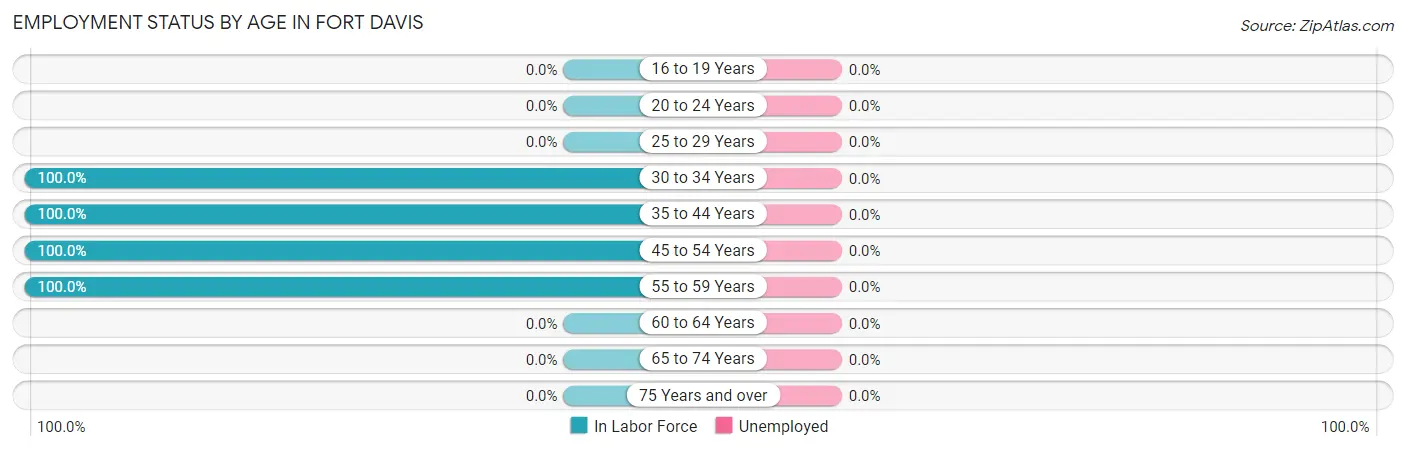
| Age Bracket | In Labor Force | Unemployed |
| 16 to 19 Years | 0 (0.0%) | 0 (0.0%) |
| 20 to 24 Years | 0 (0.0%) | 0 (0.0%) |
| 25 to 29 Years | 0 (0.0%) | 0 (0.0%) |
| 30 to 34 Years | 53 (100.0%) | 0 (0.0%) |
| 35 to 44 Years | 97 (100.0%) | 0 (0.0%) |
| 45 to 54 Years | 122 (100.0%) | 0 (0.0%) |
| 55 to 59 Years | 140 (100.0%) | 0 (0.0%) |
| 60 to 64 Years | 0 (0.0%) | 0 (0.0%) |
| 65 to 74 Years | 0 (0.0%) | 0 (0.0%) |
| 75 Years and over | 0 (0.0%) | 0 (0.0%) |
| Total | 412 (56.6%) | 0 (0.0%) |
Employment Status by Educational Attainment in Fort Davis
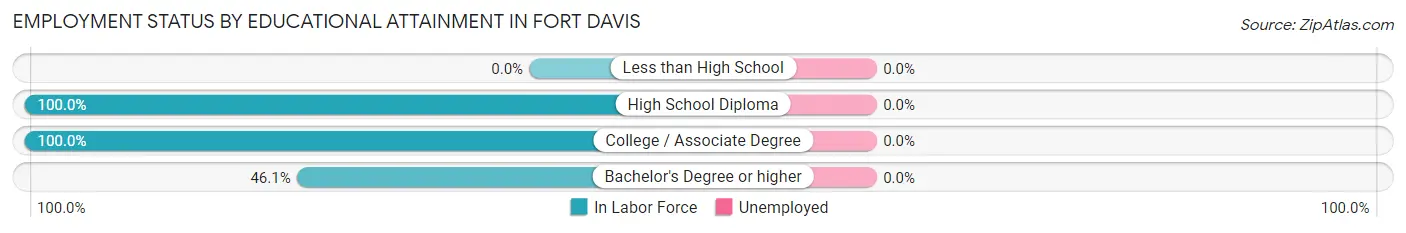
| Educational Attainment | In Labor Force | Unemployed |
| Less than High School | 0 (0.0%) | 0 (0.0%) |
| High School Diploma | 150 (100.0%) | 0 (0.0%) |
| College / Associate Degree | 203 (100.0%) | 0 (0.0%) |
| Bachelor's Degree or higher | 59 (46.1%) | 0 (0.0%) |
| Total | 412 (85.7%) | 0 (0.0%) |
Employment Occupations by Sex in Fort Davis
Management, Business, Science and Arts Occupations
The most common Management, Business, Science and Arts occupations in Fort Davis are Health Diagnosing & Treating (61 | 14.8%), Community & Social Service (39 | 9.5%), Education Instruction & Library (39 | 9.5%), and Management (37 | 9.0%).
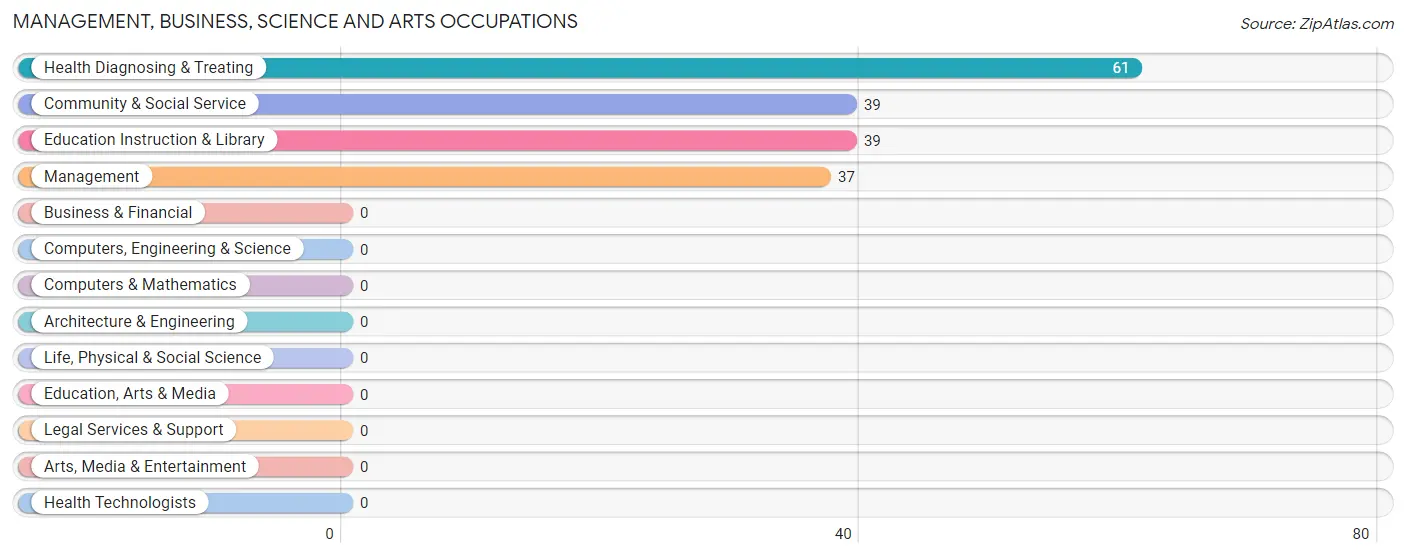
Management, Business, Science and Arts Occupations by Sex
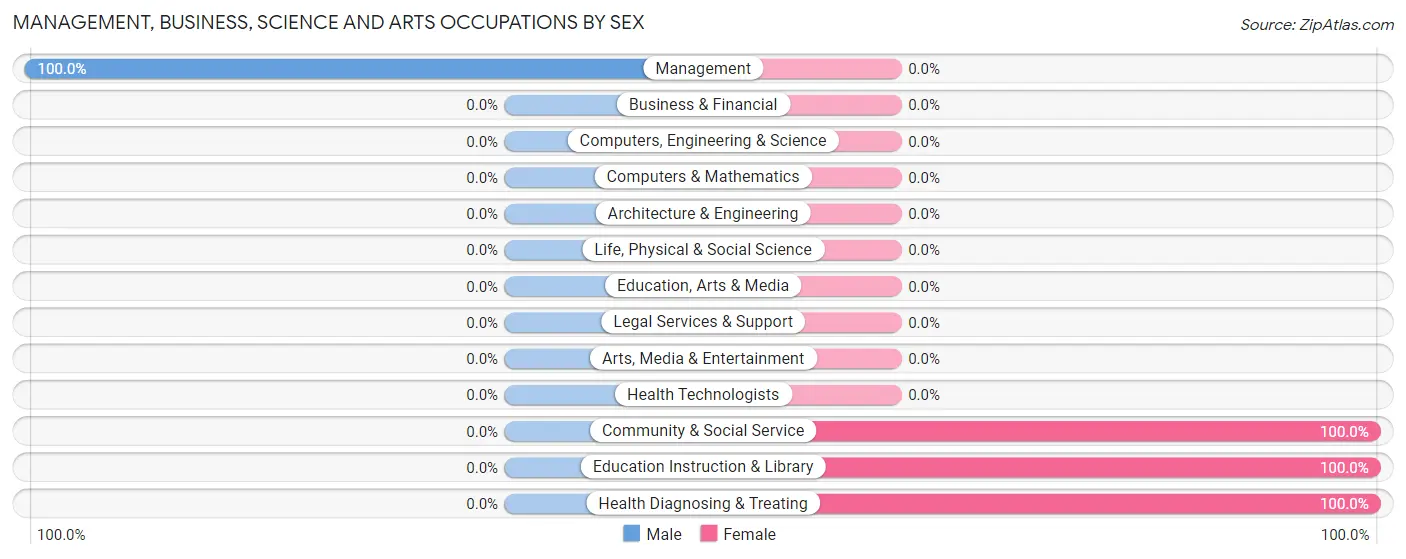
| Occupation | Male | Female |
| Management | 37 (100.0%) | 0 (0.0%) |
| Business & Financial | 0 (0.0%) | 0 (0.0%) |
| Computers, Engineering & Science | 0 (0.0%) | 0 (0.0%) |
| Computers & Mathematics | 0 (0.0%) | 0 (0.0%) |
| Architecture & Engineering | 0 (0.0%) | 0 (0.0%) |
| Life, Physical & Social Science | 0 (0.0%) | 0 (0.0%) |
| Community & Social Service | 0 (0.0%) | 39 (100.0%) |
| Education, Arts & Media | 0 (0.0%) | 0 (0.0%) |
| Legal Services & Support | 0 (0.0%) | 0 (0.0%) |
| Education Instruction & Library | 0 (0.0%) | 39 (100.0%) |
| Arts, Media & Entertainment | 0 (0.0%) | 0 (0.0%) |
| Health Diagnosing & Treating | 0 (0.0%) | 61 (100.0%) |
| Health Technologists | 0 (0.0%) | 0 (0.0%) |
| Total (Category) | 37 (27.0%) | 100 (73.0%) |
| Total (Overall) | 174 (42.2%) | 238 (57.8%) |
Services Occupations
The most common Services occupations in Fort Davis are Cleaning & Maintenance (72 | 17.5%), and Food Preparation & Serving (25 | 6.1%).
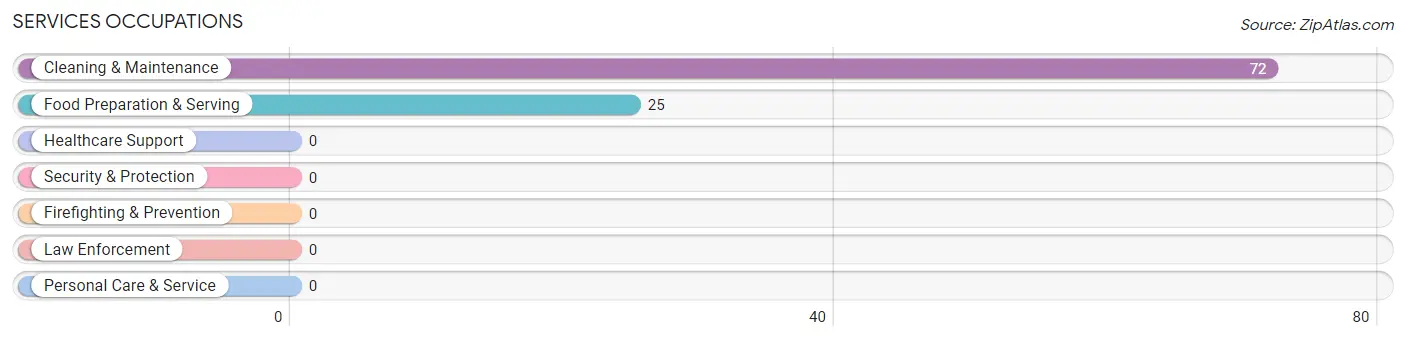
Services Occupations by Sex
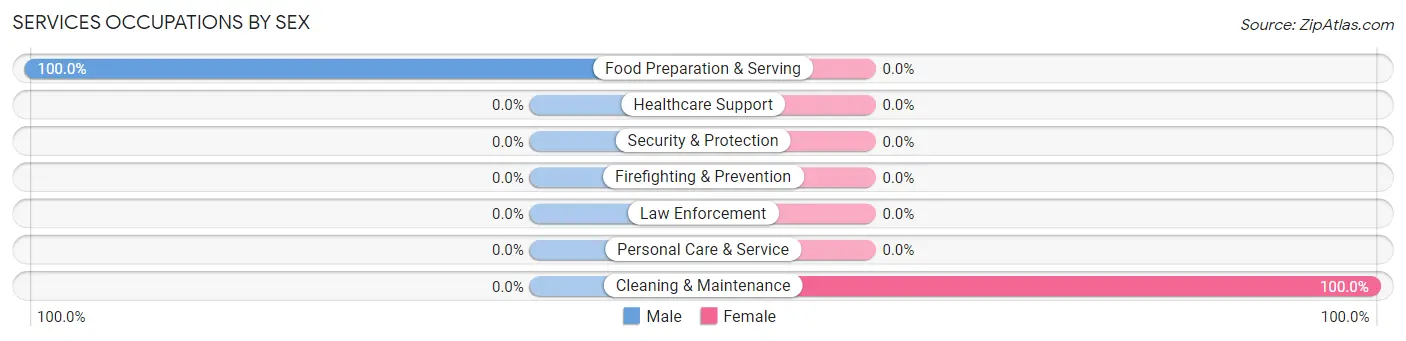
| Occupation | Male | Female |
| Healthcare Support | 0 (0.0%) | 0 (0.0%) |
| Security & Protection | 0 (0.0%) | 0 (0.0%) |
| Firefighting & Prevention | 0 (0.0%) | 0 (0.0%) |
| Law Enforcement | 0 (0.0%) | 0 (0.0%) |
| Food Preparation & Serving | 25 (100.0%) | 0 (0.0%) |
| Cleaning & Maintenance | 0 (0.0%) | 72 (100.0%) |
| Personal Care & Service | 0 (0.0%) | 0 (0.0%) |
| Total (Category) | 25 (25.8%) | 72 (74.2%) |
| Total (Overall) | 174 (42.2%) | 238 (57.8%) |
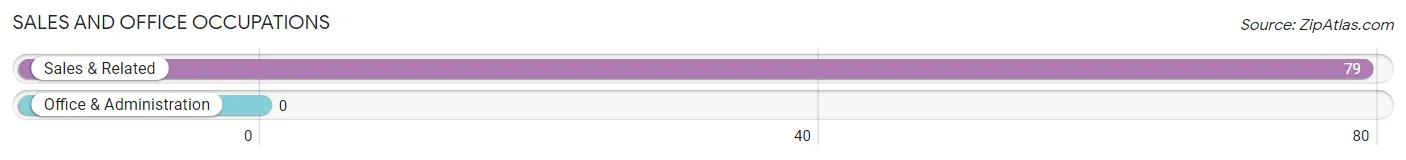
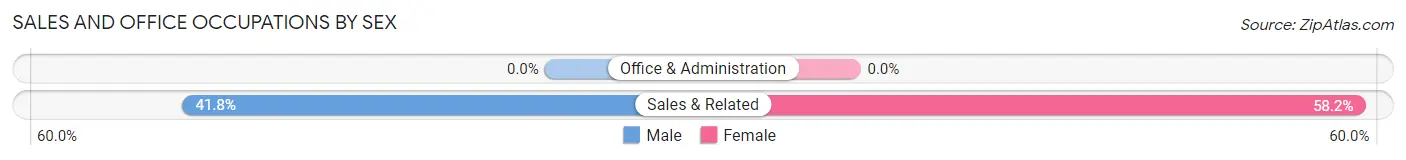
Sales and Office Occupations
The most common Sales and Office occupations in Fort Davis are , and Sales & Related (79 | 19.2%).
Sales and Office Occupations by Sex
| Occupation | Male | Female |
| Sales & Related | 33 (41.8%) | 46 (58.2%) |
| Office & Administration | 0 (0.0%) | 0 (0.0%) |
| Total (Category) | 33 (41.8%) | 46 (58.2%) |
| Total (Overall) | 174 (42.2%) | 238 (57.8%) |
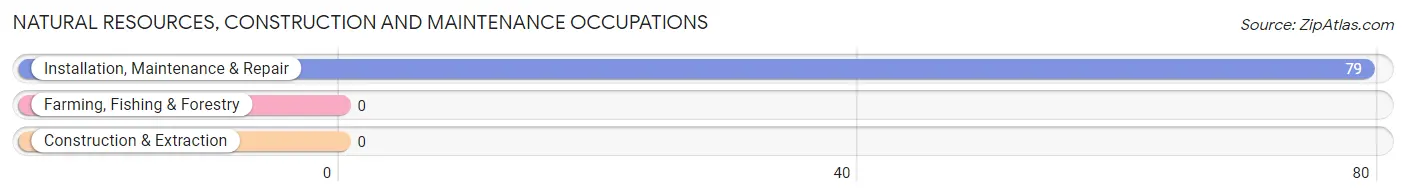
Natural Resources, Construction and Maintenance Occupations
The most common Natural Resources, Construction and Maintenance occupations in Fort Davis are , and Installation, Maintenance & Repair (79 | 19.2%).
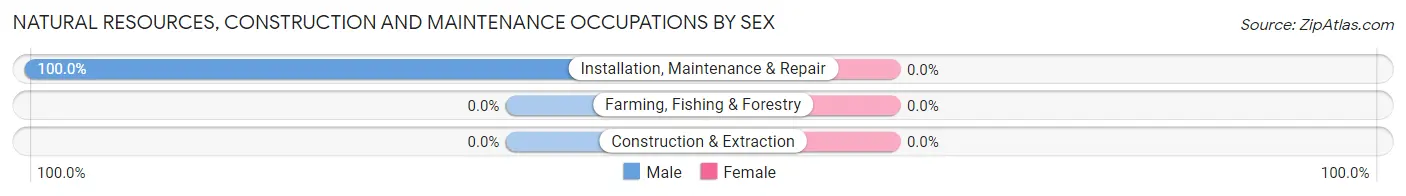
Natural Resources, Construction and Maintenance Occupations by Sex
| Occupation | Male | Female |
| Farming, Fishing & Forestry | 0 (0.0%) | 0 (0.0%) |
| Construction & Extraction | 0 (0.0%) | 0 (0.0%) |
| Installation, Maintenance & Repair | 79 (100.0%) | 0 (0.0%) |
| Total (Category) | 79 (100.0%) | 0 (0.0%) |
| Total (Overall) | 174 (42.2%) | 238 (57.8%) |
Production, Transportation and Moving Occupations
The most common Production, Transportation and Moving occupations in Fort Davis are , and Transportation (20 | 4.9%).
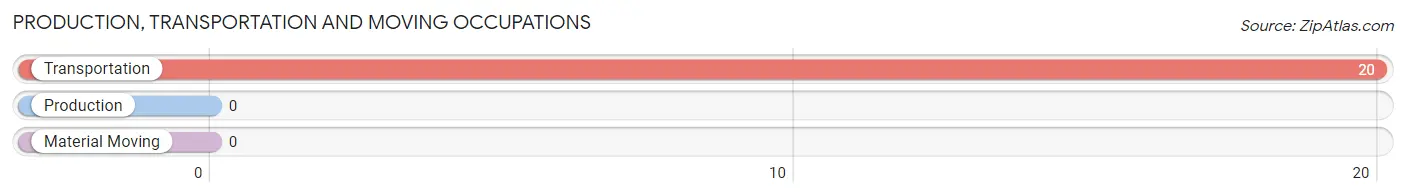
Production, Transportation and Moving Occupations by Sex
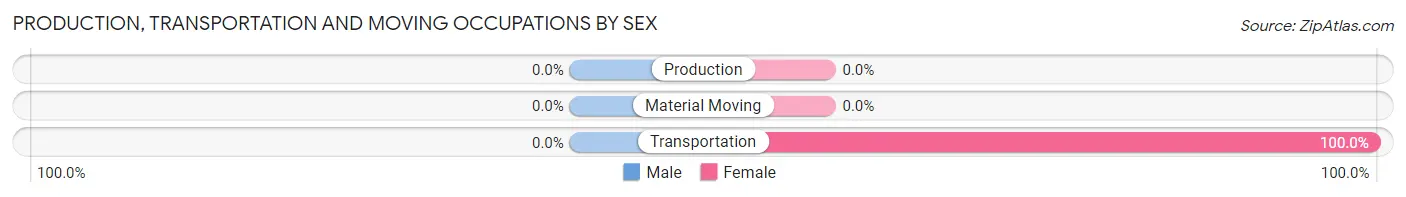
| Occupation | Male | Female |
| Production | 0 (0.0%) | 0 (0.0%) |
| Transportation | 0 (0.0%) | 20 (100.0%) |
| Material Moving | 0 (0.0%) | 0 (0.0%) |
| Total (Category) | 0 (0.0%) | 20 (100.0%) |
| Total (Overall) | 174 (42.2%) | 238 (57.8%) |
Employment Industries by Sex in Fort Davis
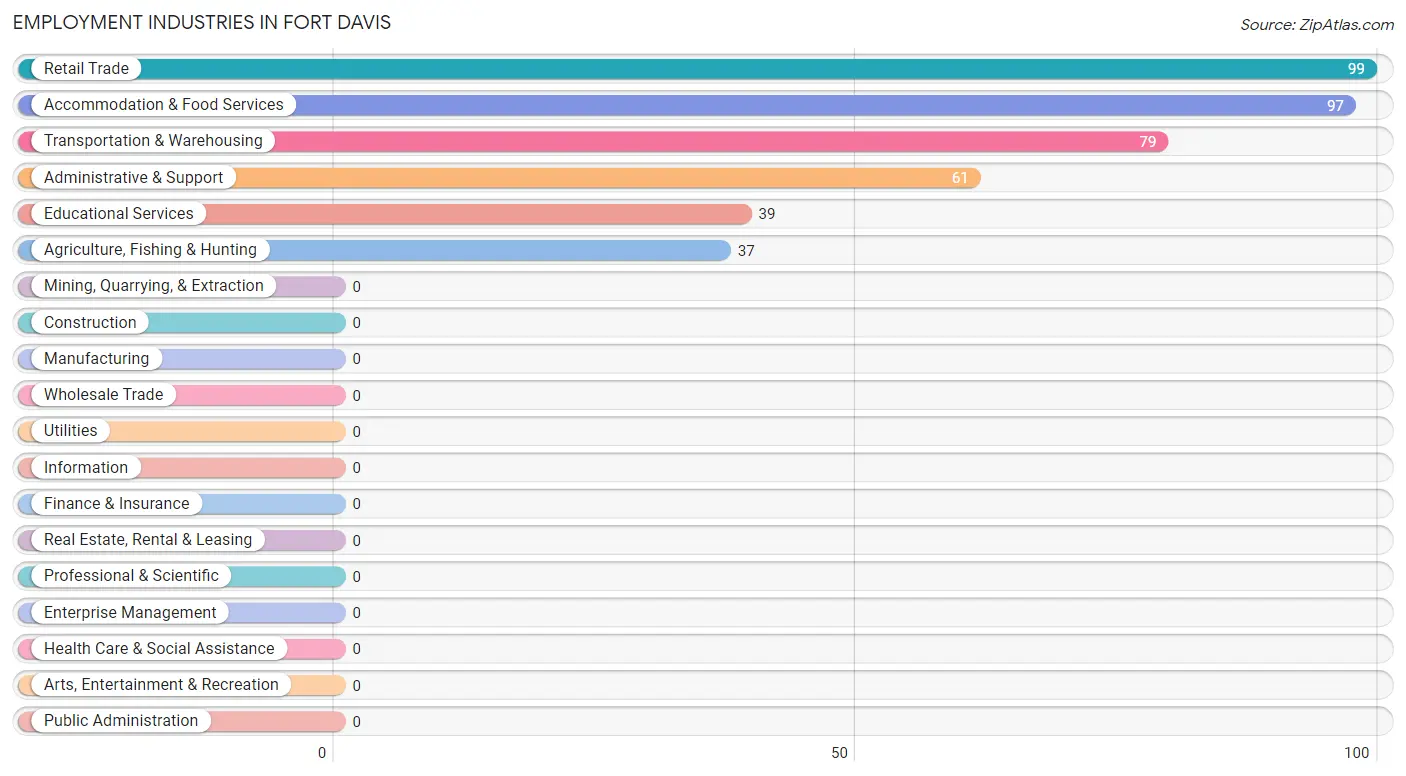
Employment Industries in Fort Davis
The major employment industries in Fort Davis include Retail Trade (99 | 24.0%), Accommodation & Food Services (97 | 23.5%), Transportation & Warehousing (79 | 19.2%), Administrative & Support (61 | 14.8%), and Educational Services (39 | 9.5%).
Employment Industries by Sex in Fort Davis
The Fort Davis industries that see more men than women are Agriculture, Fishing & Hunting (100.0%), Transportation & Warehousing (100.0%), and Retail Trade (33.3%), whereas the industries that tend to have a higher number of women are Administrative & Support (100.0%), Educational Services (100.0%), and Accommodation & Food Services (74.2%).
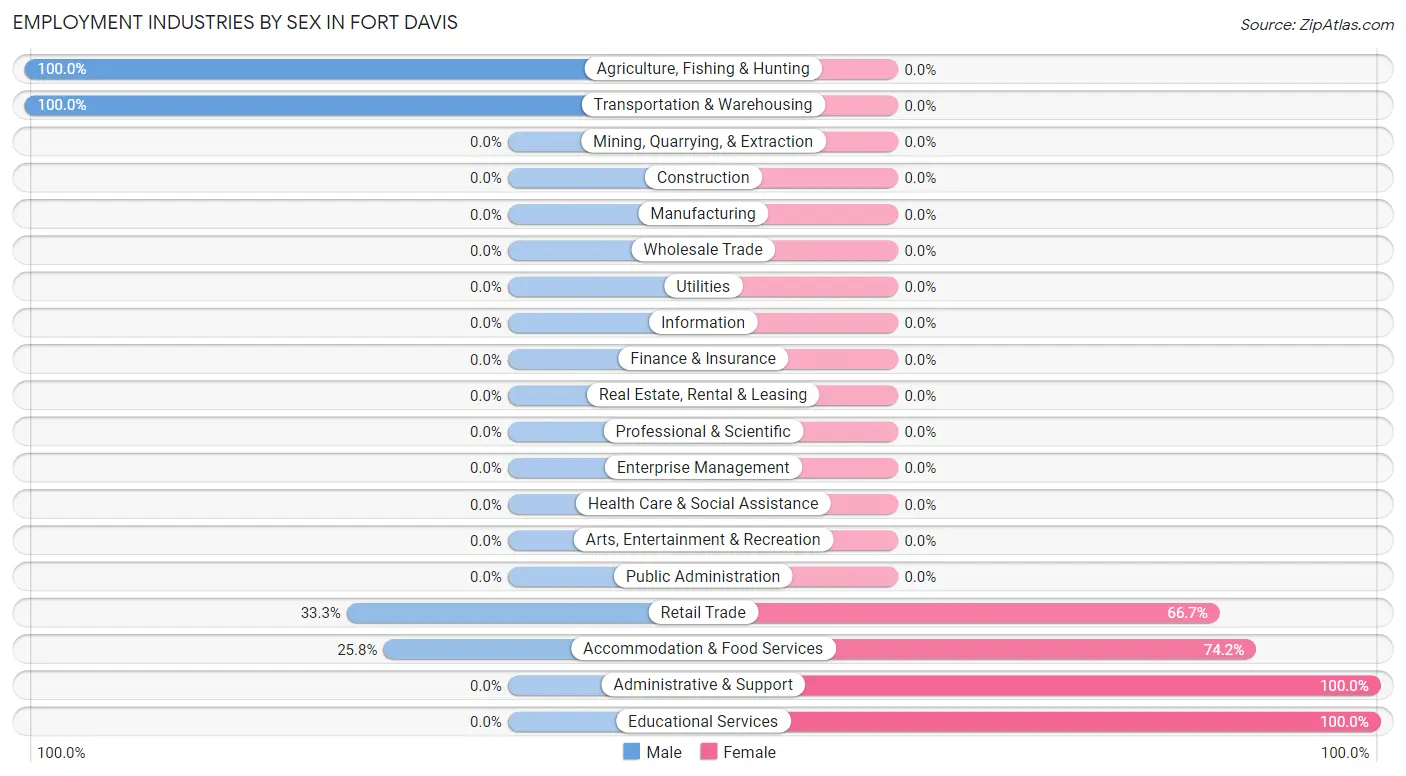
| Industry | Male | Female |
| Agriculture, Fishing & Hunting | 37 (100.0%) | 0 (0.0%) |
| Mining, Quarrying, & Extraction | 0 (0.0%) | 0 (0.0%) |
| Construction | 0 (0.0%) | 0 (0.0%) |
| Manufacturing | 0 (0.0%) | 0 (0.0%) |
| Wholesale Trade | 0 (0.0%) | 0 (0.0%) |
| Retail Trade | 33 (33.3%) | 66 (66.7%) |
| Transportation & Warehousing | 79 (100.0%) | 0 (0.0%) |
| Utilities | 0 (0.0%) | 0 (0.0%) |
| Information | 0 (0.0%) | 0 (0.0%) |
| Finance & Insurance | 0 (0.0%) | 0 (0.0%) |
| Real Estate, Rental & Leasing | 0 (0.0%) | 0 (0.0%) |
| Professional & Scientific | 0 (0.0%) | 0 (0.0%) |
| Enterprise Management | 0 (0.0%) | 0 (0.0%) |
| Administrative & Support | 0 (0.0%) | 61 (100.0%) |
| Educational Services | 0 (0.0%) | 39 (100.0%) |
| Health Care & Social Assistance | 0 (0.0%) | 0 (0.0%) |
| Arts, Entertainment & Recreation | 0 (0.0%) | 0 (0.0%) |
| Accommodation & Food Services | 25 (25.8%) | 72 (74.2%) |
| Public Administration | 0 (0.0%) | 0 (0.0%) |
| Total | 174 (42.2%) | 238 (57.8%) |
Education in Fort Davis
School Enrollment in Fort Davis
The most common levels of schooling among the 148 students in Fort Davis are high school (78 | 52.7%), middle school (37 | 25.0%), and nursery / preschool (33 | 22.3%).
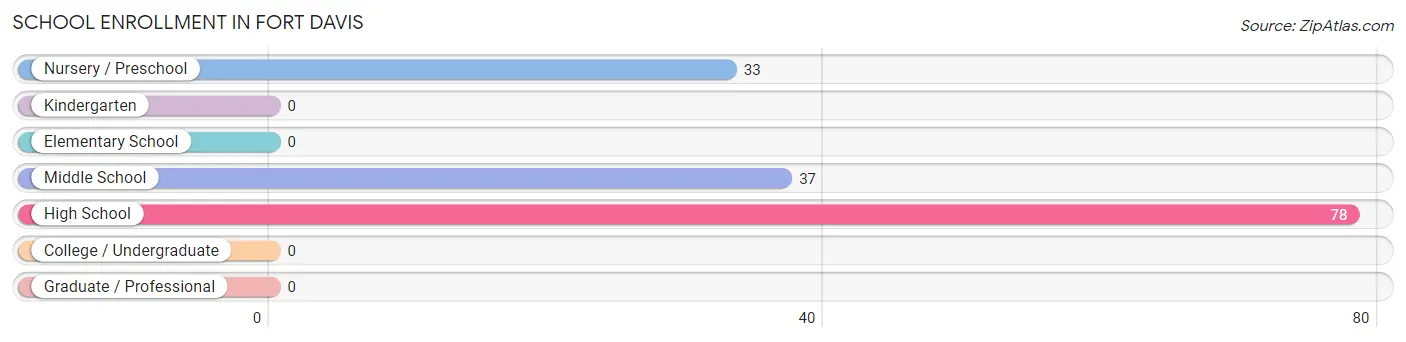
| School Level | # Students | % Students |
| Nursery / Preschool | 33 | 22.3% |
| Kindergarten | 0 | 0.0% |
| Elementary School | 0 | 0.0% |
| Middle School | 37 | 25.0% |
| High School | 78 | 52.7% |
| College / Undergraduate | 0 | 0.0% |
| Graduate / Professional | 0 | 0.0% |
| Total | 148 | 100.0% |
School Enrollment by Age by Funding Source in Fort Davis
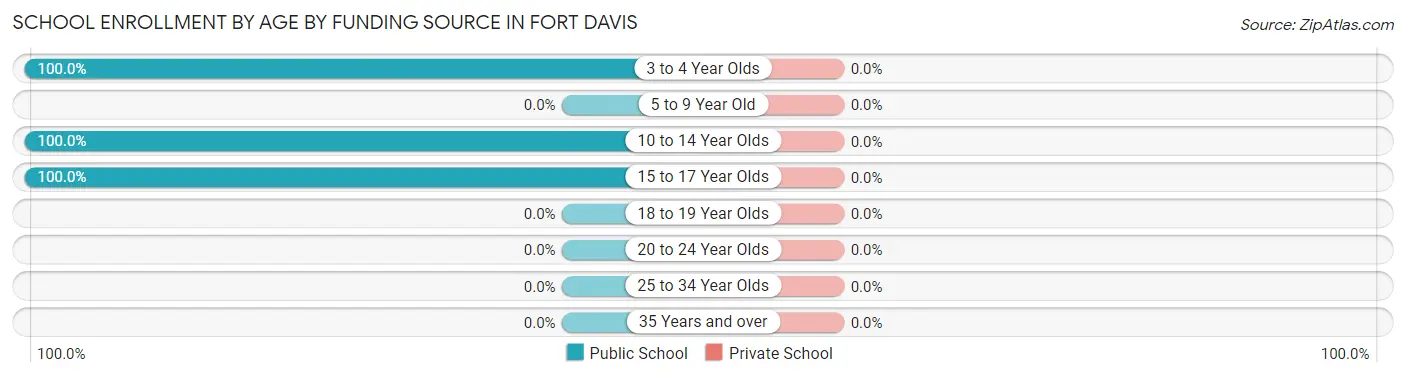
| Age Bracket | Public School | Private School |
| 3 to 4 Year Olds | 33 (100.0%) | 0 (0.0%) |
| 5 to 9 Year Old | 0 (0.0%) | 0 (0.0%) |
| 10 to 14 Year Olds | 80 (100.0%) | 0 (0.0%) |
| 15 to 17 Year Olds | 35 (100.0%) | 0 (0.0%) |
| 18 to 19 Year Olds | 0 (0.0%) | 0 (0.0%) |
| 20 to 24 Year Olds | 0 (0.0%) | 0 (0.0%) |
| 25 to 34 Year Olds | 0 (0.0%) | 0 (0.0%) |
| 35 Years and over | 0 (0.0%) | 0 (0.0%) |
| Total | 148 (100.0%) | 0 (0.0%) |
Educational Attainment by Field of Study in Fort Davis
Engineering (69 | 53.9%), business (39 | 30.5%), and bio, nature & agricultural (20 | 15.6%) are the most common fields of study among 128 individuals in Fort Davis who have obtained a bachelor's degree or higher.
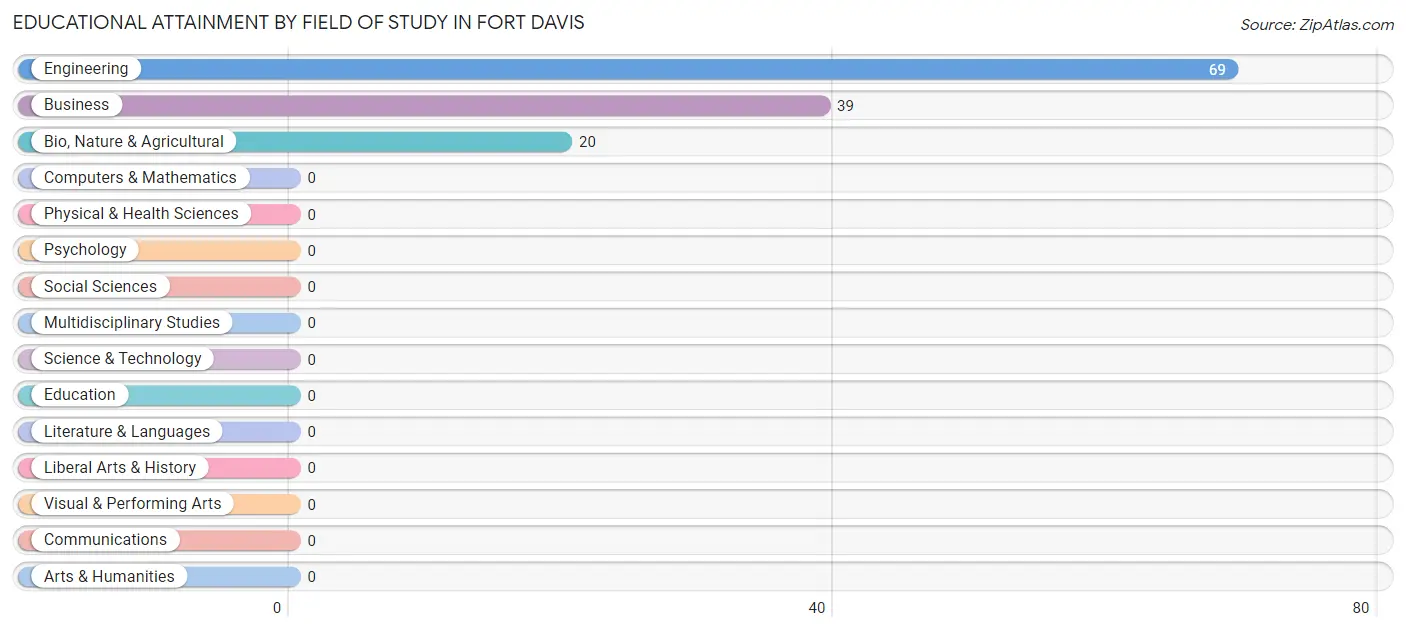
| Field of Study | # Graduates | % Graduates |
| Computers & Mathematics | 0 | 0.0% |
| Bio, Nature & Agricultural | 20 | 15.6% |
| Physical & Health Sciences | 0 | 0.0% |
| Psychology | 0 | 0.0% |
| Social Sciences | 0 | 0.0% |
| Engineering | 69 | 53.9% |
| Multidisciplinary Studies | 0 | 0.0% |
| Science & Technology | 0 | 0.0% |
| Business | 39 | 30.5% |
| Education | 0 | 0.0% |
| Literature & Languages | 0 | 0.0% |
| Liberal Arts & History | 0 | 0.0% |
| Visual & Performing Arts | 0 | 0.0% |
| Communications | 0 | 0.0% |
| Arts & Humanities | 0 | 0.0% |
| Total | 128 | 100.0% |
Transportation & Commute in Fort Davis
Vehicle Availability by Sex in Fort Davis
The most prevalent vehicle ownership categories in Fort Davis are males with 3 vehicles (149, accounting for 100.0%) and females with 3 vehicles (120, making up 62.6%).
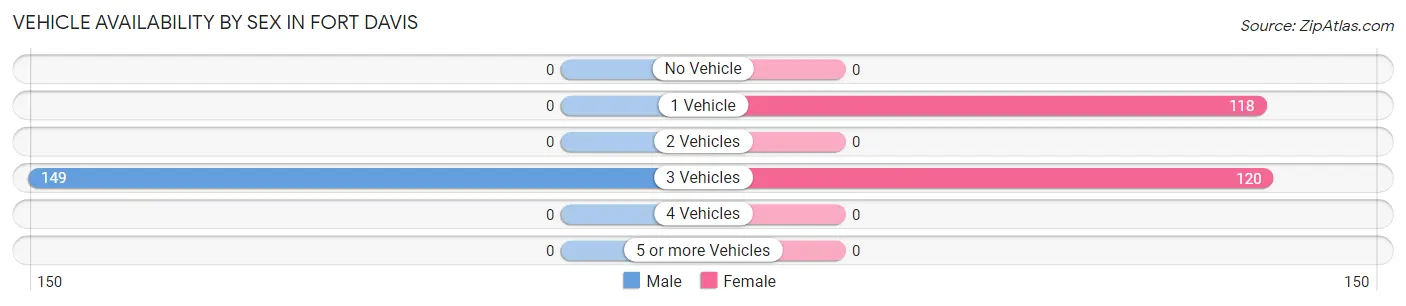
| Vehicles Available | Male | Female |
| No Vehicle | 0 (0.0%) | 0 (0.0%) |
| 1 Vehicle | 0 (0.0%) | 118 (49.6%) |
| 2 Vehicles | 0 (0.0%) | 0 (0.0%) |
| 3 Vehicles | 149 (100.0%) | 120 (50.4%) |
| 4 Vehicles | 0 (0.0%) | 0 (0.0%) |
| 5 or more Vehicles | 0 (0.0%) | 0 (0.0%) |
| Total | 149 (100.0%) | 238 (100.0%) |
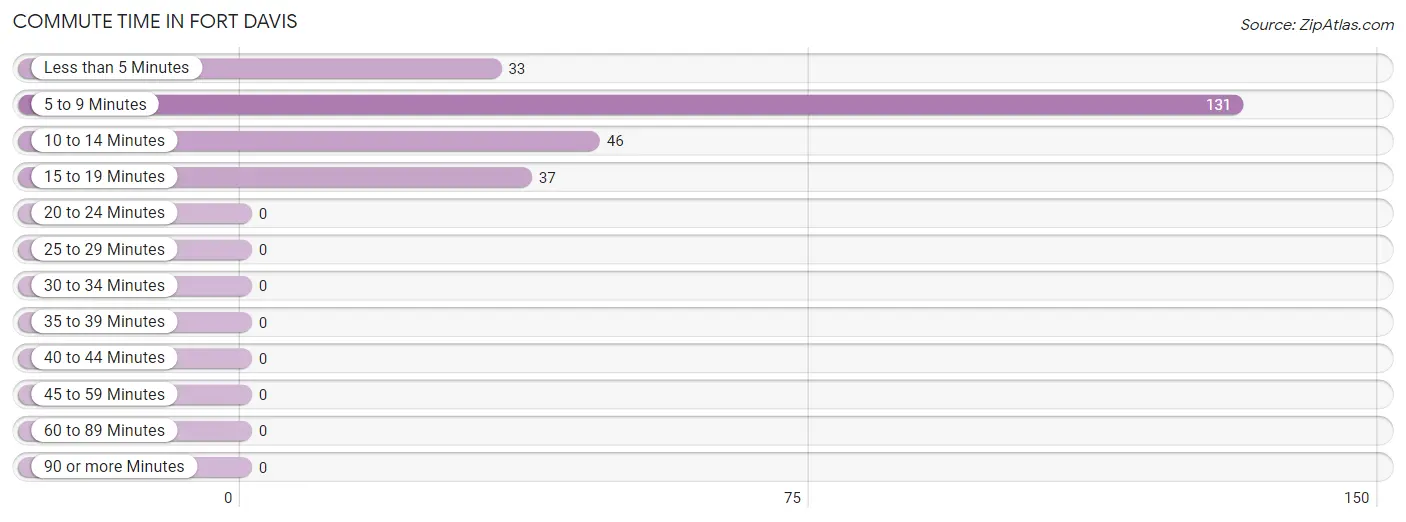
Commute Time in Fort Davis
The most frequently occuring commute durations in Fort Davis are 5 to 9 minutes (131 commuters, 53.0%), 10 to 14 minutes (46 commuters, 18.6%), and 15 to 19 minutes (37 commuters, 15.0%).
| Commute Time | # Commuters | % Commuters |
| Less than 5 Minutes | 33 | 13.4% |
| 5 to 9 Minutes | 131 | 53.0% |
| 10 to 14 Minutes | 46 | 18.6% |
| 15 to 19 Minutes | 37 | 15.0% |
| 20 to 24 Minutes | 0 | 0.0% |
| 25 to 29 Minutes | 0 | 0.0% |
| 30 to 34 Minutes | 0 | 0.0% |
| 35 to 39 Minutes | 0 | 0.0% |
| 40 to 44 Minutes | 0 | 0.0% |
| 45 to 59 Minutes | 0 | 0.0% |
| 60 to 89 Minutes | 0 | 0.0% |
| 90 or more Minutes | 0 | 0.0% |
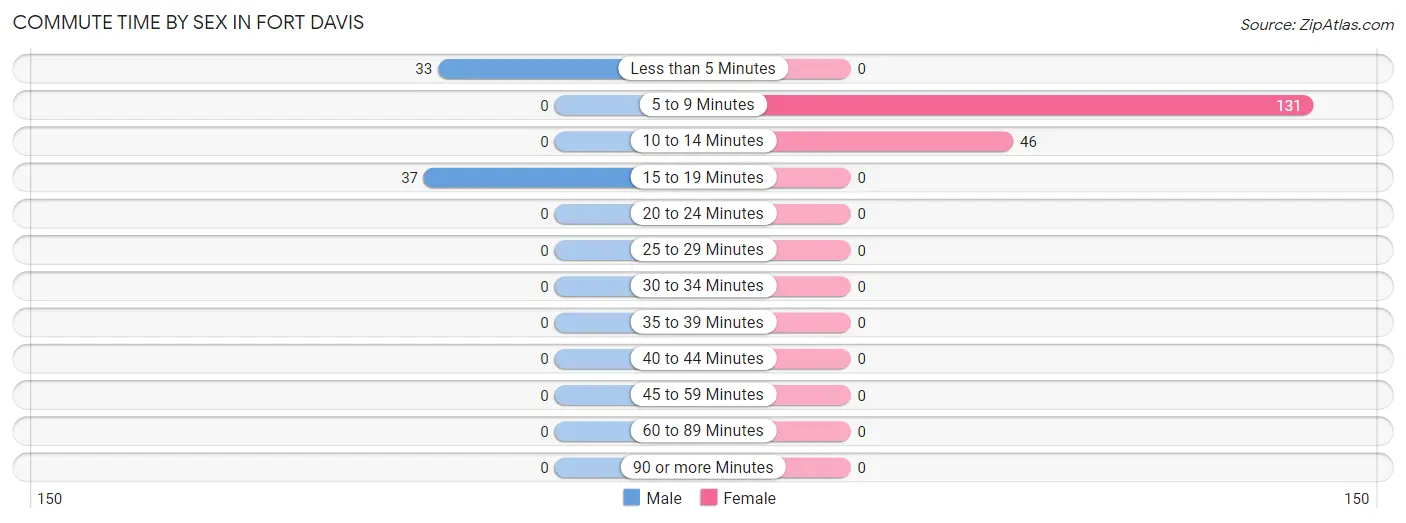
Commute Time by Sex in Fort Davis
The most common commute times in Fort Davis are 15 to 19 minutes (37 commuters, 52.9%) for males and 5 to 9 minutes (131 commuters, 74.0%) for females.
| Commute Time | Male | Female |
| Less than 5 Minutes | 33 (47.1%) | 0 (0.0%) |
| 5 to 9 Minutes | 0 (0.0%) | 131 (74.0%) |
| 10 to 14 Minutes | 0 (0.0%) | 46 (26.0%) |
| 15 to 19 Minutes | 37 (52.9%) | 0 (0.0%) |
| 20 to 24 Minutes | 0 (0.0%) | 0 (0.0%) |
| 25 to 29 Minutes | 0 (0.0%) | 0 (0.0%) |
| 30 to 34 Minutes | 0 (0.0%) | 0 (0.0%) |
| 35 to 39 Minutes | 0 (0.0%) | 0 (0.0%) |
| 40 to 44 Minutes | 0 (0.0%) | 0 (0.0%) |
| 45 to 59 Minutes | 0 (0.0%) | 0 (0.0%) |
| 60 to 89 Minutes | 0 (0.0%) | 0 (0.0%) |
| 90 or more Minutes | 0 (0.0%) | 0 (0.0%) |
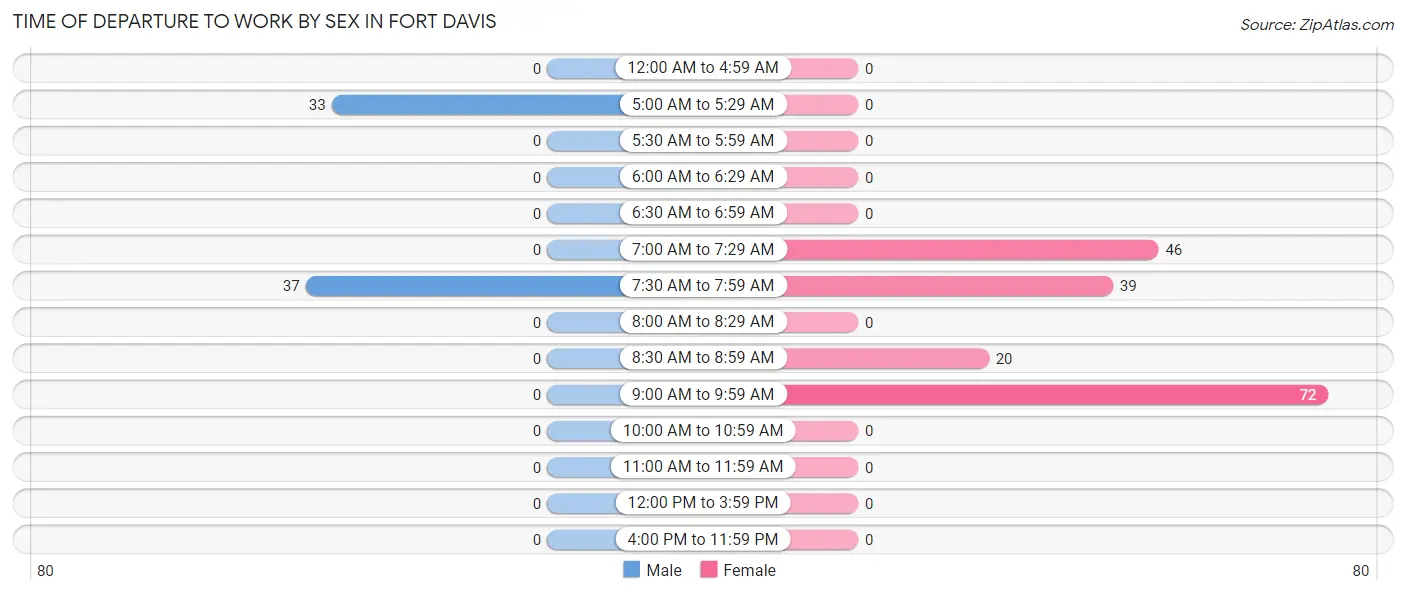
Time of Departure to Work by Sex in Fort Davis
The most frequent times of departure to work in Fort Davis are 7:30 AM to 7:59 AM (37, 52.9%) for males and 9:00 AM to 9:59 AM (72, 40.7%) for females.
| Time of Departure | Male | Female |
| 12:00 AM to 4:59 AM | 0 (0.0%) | 0 (0.0%) |
| 5:00 AM to 5:29 AM | 33 (47.1%) | 0 (0.0%) |
| 5:30 AM to 5:59 AM | 0 (0.0%) | 0 (0.0%) |
| 6:00 AM to 6:29 AM | 0 (0.0%) | 0 (0.0%) |
| 6:30 AM to 6:59 AM | 0 (0.0%) | 0 (0.0%) |
| 7:00 AM to 7:29 AM | 0 (0.0%) | 46 (26.0%) |
| 7:30 AM to 7:59 AM | 37 (52.9%) | 39 (22.0%) |
| 8:00 AM to 8:29 AM | 0 (0.0%) | 0 (0.0%) |
| 8:30 AM to 8:59 AM | 0 (0.0%) | 20 (11.3%) |
| 9:00 AM to 9:59 AM | 0 (0.0%) | 72 (40.7%) |
| 10:00 AM to 10:59 AM | 0 (0.0%) | 0 (0.0%) |
| 11:00 AM to 11:59 AM | 0 (0.0%) | 0 (0.0%) |
| 12:00 PM to 3:59 PM | 0 (0.0%) | 0 (0.0%) |
| 4:00 PM to 11:59 PM | 0 (0.0%) | 0 (0.0%) |
| Total | 70 (100.0%) | 177 (100.0%) |
Housing Occupancy in Fort Davis
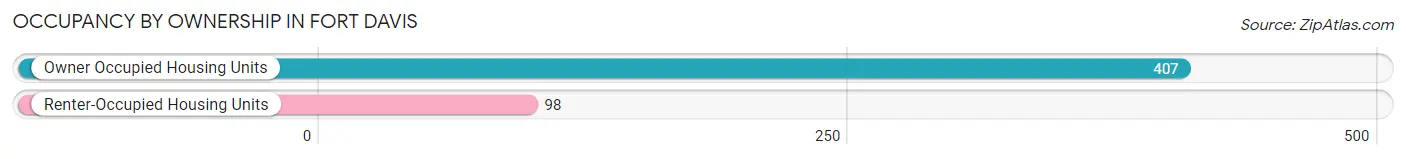
Occupancy by Ownership in Fort Davis
Of the total 505 dwellings in Fort Davis, owner-occupied units account for 407 (80.6%), while renter-occupied units make up 98 (19.4%).
| Occupancy | # Housing Units | % Housing Units |
| Owner Occupied Housing Units | 407 | 80.6% |
| Renter-Occupied Housing Units | 98 | 19.4% |
| Total Occupied Housing Units | 505 | 100.0% |
Occupancy by Household Size in Fort Davis
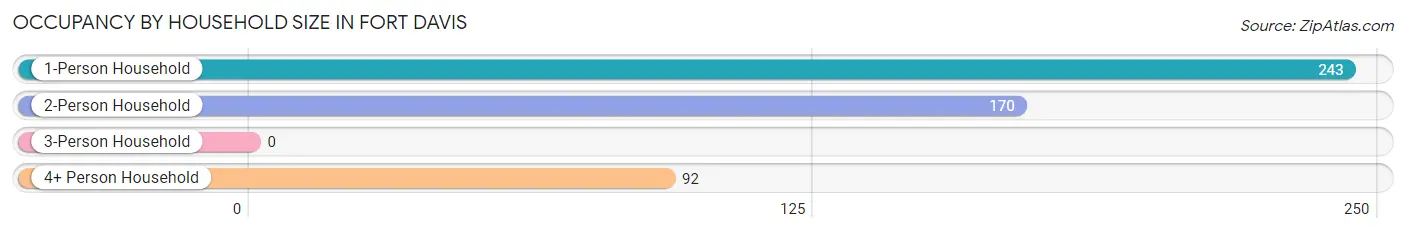
| Household Size | # Housing Units | % Housing Units |
| 1-Person Household | 243 | 48.1% |
| 2-Person Household | 170 | 33.7% |
| 3-Person Household | 0 | 0.0% |
| 4+ Person Household | 92 | 18.2% |
| Total Housing Units | 505 | 100.0% |
Occupancy by Ownership by Household Size in Fort Davis
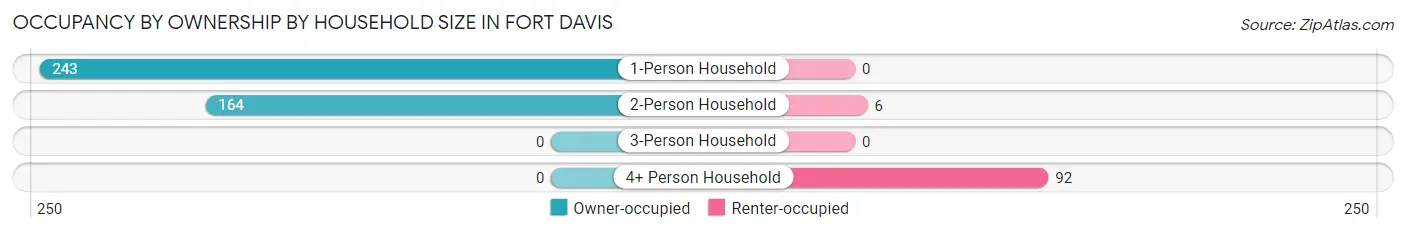
| Household Size | Owner-occupied | Renter-occupied |
| 1-Person Household | 243 (100.0%) | 0 (0.0%) |
| 2-Person Household | 164 (96.5%) | 6 (3.5%) |
| 3-Person Household | 0 (0.0%) | 0 (0.0%) |
| 4+ Person Household | 0 (0.0%) | 92 (100.0%) |
| Total Housing Units | 407 (80.6%) | 98 (19.4%) |
Occupancy by Educational Attainment in Fort Davis
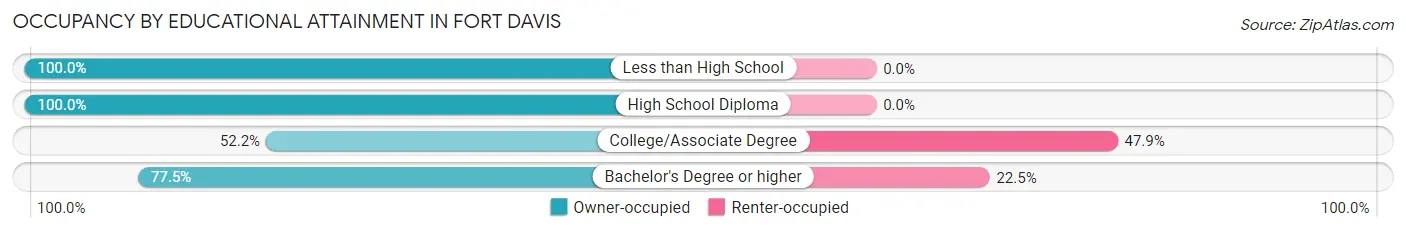
| Household Size | Owner-occupied | Renter-occupied |
| Less than High School | 128 (100.0%) | 0 (0.0%) |
| High School Diploma | 125 (100.0%) | 0 (0.0%) |
| College/Associate Degree | 85 (52.1%) | 78 (47.8%) |
| Bachelor's Degree or higher | 69 (77.5%) | 20 (22.5%) |
Occupancy by Age of Householder in Fort Davis
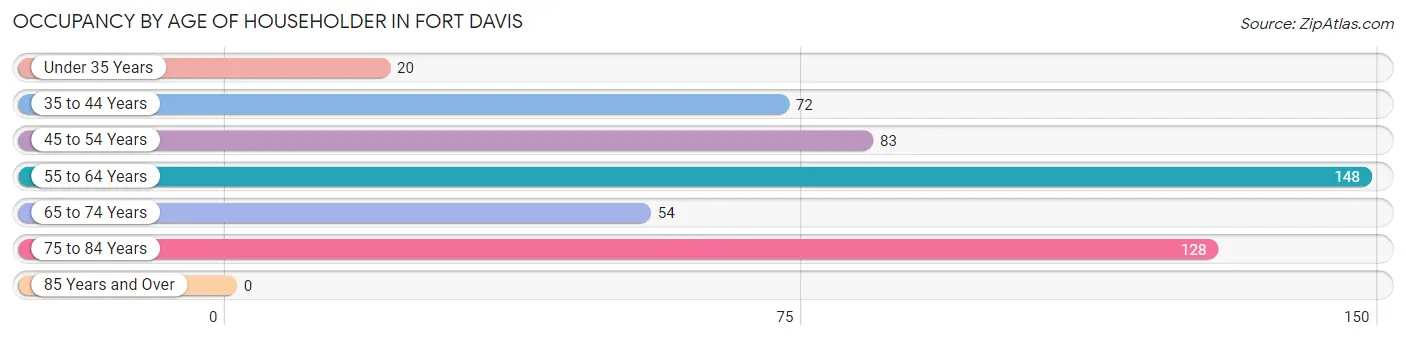
| Age Bracket | # Households | % Households |
| Under 35 Years | 20 | 4.0% |
| 35 to 44 Years | 72 | 14.3% |
| 45 to 54 Years | 83 | 16.4% |
| 55 to 64 Years | 148 | 29.3% |
| 65 to 74 Years | 54 | 10.7% |
| 75 to 84 Years | 128 | 25.4% |
| 85 Years and Over | 0 | 0.0% |
| Total | 505 | 100.0% |
Housing Finances in Fort Davis
Median Income by Occupancy in Fort Davis
| Occupancy Type | # Households | Median Income |
| Owner-Occupied | 407 (80.6%) | $0 |
| Renter-Occupied | 98 (19.4%) | $0 |
| Average | 505 (100.0%) | $0 |
Occupancy by Householder Income Bracket in Fort Davis
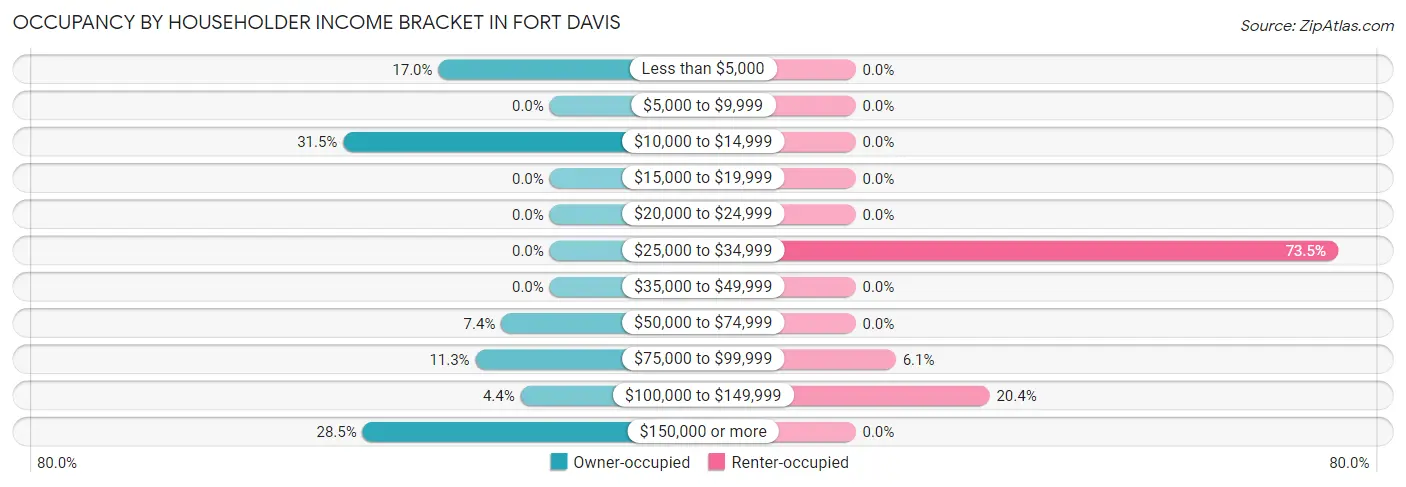
| Income Bracket | Owner-occupied | Renter-occupied |
| Less than $5,000 | 69 (17.0%) | 0 (0.0%) |
| $5,000 to $9,999 | 0 (0.0%) | 0 (0.0%) |
| $10,000 to $14,999 | 128 (31.5%) | 0 (0.0%) |
| $15,000 to $19,999 | 0 (0.0%) | 0 (0.0%) |
| $20,000 to $24,999 | 0 (0.0%) | 0 (0.0%) |
| $25,000 to $34,999 | 0 (0.0%) | 72 (73.5%) |
| $35,000 to $49,999 | 0 (0.0%) | 0 (0.0%) |
| $50,000 to $74,999 | 30 (7.4%) | 0 (0.0%) |
| $75,000 to $99,999 | 46 (11.3%) | 6 (6.1%) |
| $100,000 to $149,999 | 18 (4.4%) | 20 (20.4%) |
| $150,000 or more | 116 (28.5%) | 0 (0.0%) |
| Total | 407 (100.0%) | 98 (100.0%) |
Monthly Housing Cost Tiers in Fort Davis
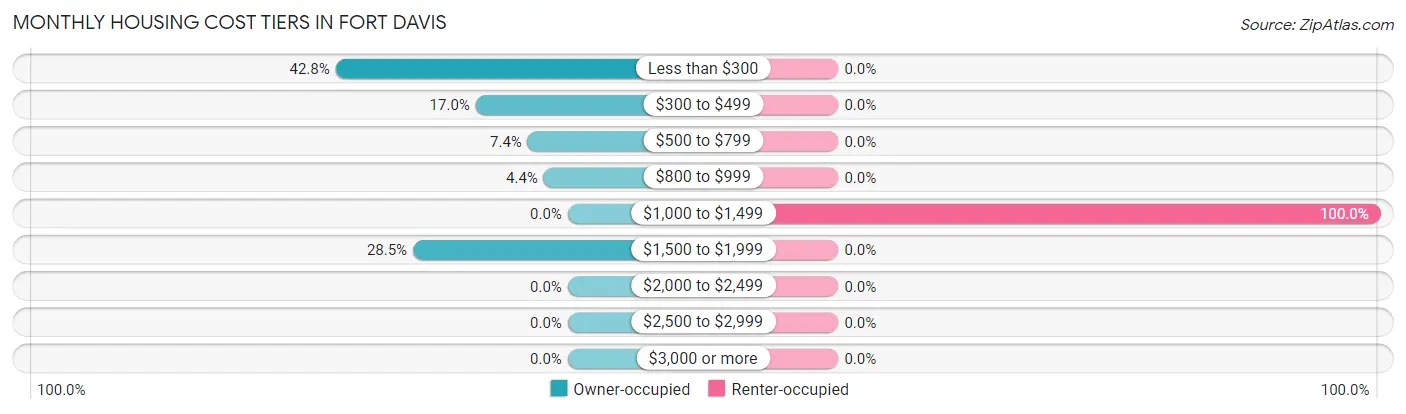
| Monthly Cost | Owner-occupied | Renter-occupied |
| Less than $300 | 174 (42.7%) | 0 (0.0%) |
| $300 to $499 | 69 (17.0%) | 0 (0.0%) |
| $500 to $799 | 30 (7.4%) | 0 (0.0%) |
| $800 to $999 | 18 (4.4%) | 0 (0.0%) |
| $1,000 to $1,499 | 0 (0.0%) | 98 (100.0%) |
| $1,500 to $1,999 | 116 (28.5%) | 0 (0.0%) |
| $2,000 to $2,499 | 0 (0.0%) | 0 (0.0%) |
| $2,500 to $2,999 | 0 (0.0%) | 0 (0.0%) |
| $3,000 or more | 0 (0.0%) | 0 (0.0%) |
| Total | 407 (100.0%) | 98 (100.0%) |
Physical Housing Characteristics in Fort Davis
Housing Structures in Fort Davis
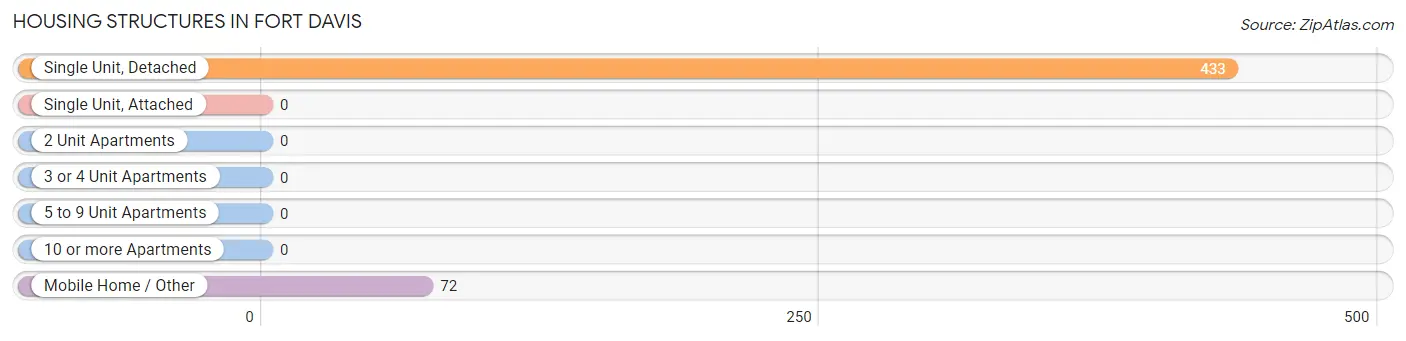
| Structure Type | # Housing Units | % Housing Units |
| Single Unit, Detached | 433 | 85.7% |
| Single Unit, Attached | 0 | 0.0% |
| 2 Unit Apartments | 0 | 0.0% |
| 3 or 4 Unit Apartments | 0 | 0.0% |
| 5 to 9 Unit Apartments | 0 | 0.0% |
| 10 or more Apartments | 0 | 0.0% |
| Mobile Home / Other | 72 | 14.3% |
| Total | 505 | 100.0% |
Housing Structures by Occupancy in Fort Davis
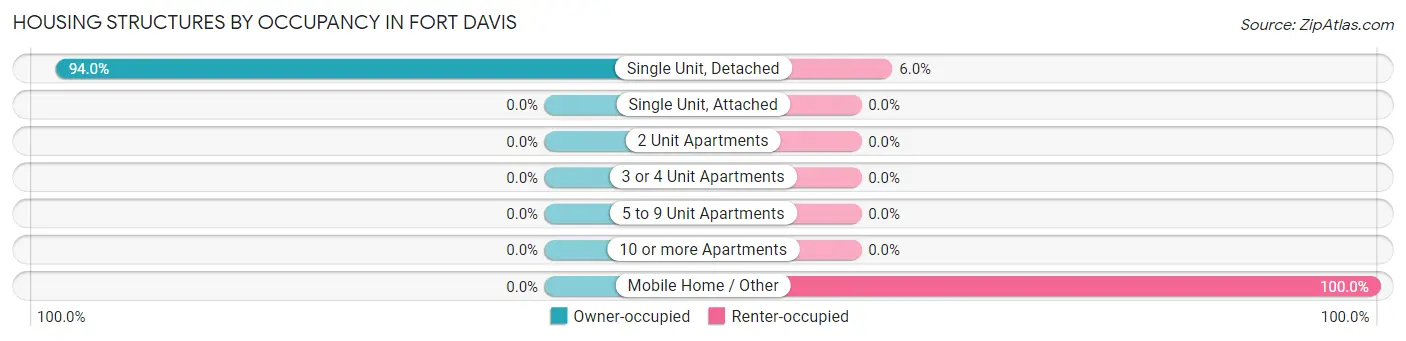
| Structure Type | Owner-occupied | Renter-occupied |
| Single Unit, Detached | 407 (94.0%) | 26 (6.0%) |
| Single Unit, Attached | 0 (0.0%) | 0 (0.0%) |
| 2 Unit Apartments | 0 (0.0%) | 0 (0.0%) |
| 3 or 4 Unit Apartments | 0 (0.0%) | 0 (0.0%) |
| 5 to 9 Unit Apartments | 0 (0.0%) | 0 (0.0%) |
| 10 or more Apartments | 0 (0.0%) | 0 (0.0%) |
| Mobile Home / Other | 0 (0.0%) | 72 (100.0%) |
| Total | 407 (80.6%) | 98 (19.4%) |
Housing Structures by Number of Rooms in Fort Davis
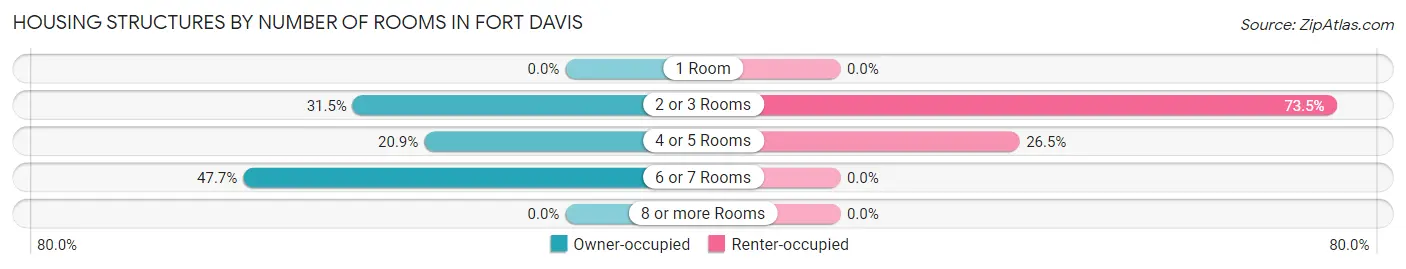
| Number of Rooms | Owner-occupied | Renter-occupied |
| 1 Room | 0 (0.0%) | 0 (0.0%) |
| 2 or 3 Rooms | 128 (31.5%) | 72 (73.5%) |
| 4 or 5 Rooms | 85 (20.9%) | 26 (26.5%) |
| 6 or 7 Rooms | 194 (47.7%) | 0 (0.0%) |
| 8 or more Rooms | 0 (0.0%) | 0 (0.0%) |
| Total | 407 (100.0%) | 98 (100.0%) |
Housing Structure by Heating Type in Fort Davis
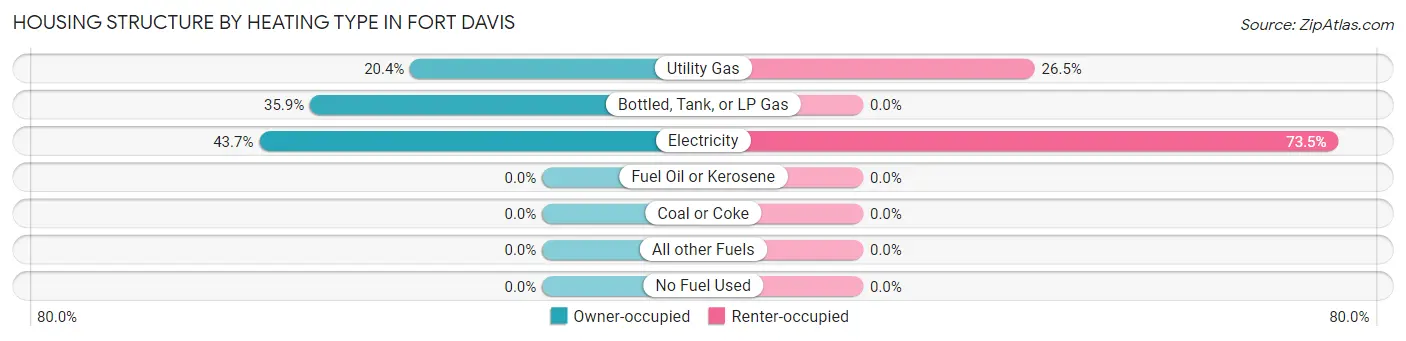
| Heating Type | Owner-occupied | Renter-occupied |
| Utility Gas | 83 (20.4%) | 26 (26.5%) |
| Bottled, Tank, or LP Gas | 146 (35.9%) | 0 (0.0%) |
| Electricity | 178 (43.7%) | 72 (73.5%) |
| Fuel Oil or Kerosene | 0 (0.0%) | 0 (0.0%) |
| Coal or Coke | 0 (0.0%) | 0 (0.0%) |
| All other Fuels | 0 (0.0%) | 0 (0.0%) |
| No Fuel Used | 0 (0.0%) | 0 (0.0%) |
| Total | 407 (100.0%) | 98 (100.0%) |
Household Vehicle Usage in Fort Davis
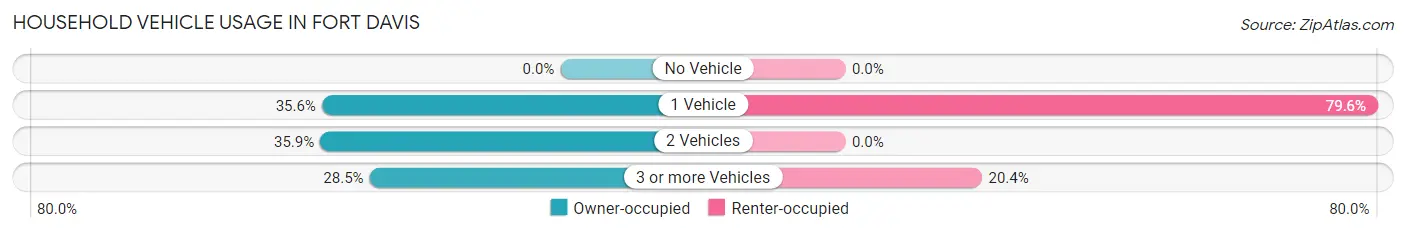
| Vehicles per Household | Owner-occupied | Renter-occupied |
| No Vehicle | 0 (0.0%) | 0 (0.0%) |
| 1 Vehicle | 145 (35.6%) | 78 (79.6%) |
| 2 Vehicles | 146 (35.9%) | 0 (0.0%) |
| 3 or more Vehicles | 116 (28.5%) | 20 (20.4%) |
| Total | 407 (100.0%) | 98 (100.0%) |
Real Estate & Mortgages in Fort Davis
Real Estate and Mortgage Overview in Fort Davis
| Characteristic | Without Mortgage | With Mortgage |
| Housing Units | 291 | 116 |
| Median Property Value | $156,000 | $0 |
| Median Household Income | - | - |
| Monthly Housing Costs | $242 | $0 |
| Real Estate Taxes | $1,076 | $0 |
Property Value by Mortgage Status in Fort Davis
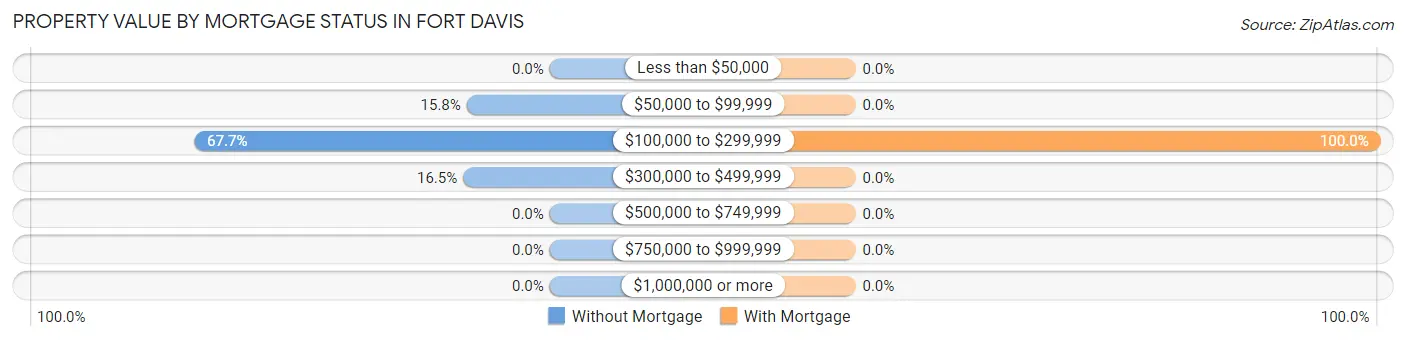
| Property Value | Without Mortgage | With Mortgage |
| Less than $50,000 | 0 (0.0%) | 0 (0.0%) |
| $50,000 to $99,999 | 46 (15.8%) | 0 (0.0%) |
| $100,000 to $299,999 | 197 (67.7%) | 116 (100.0%) |
| $300,000 to $499,999 | 48 (16.5%) | 0 (0.0%) |
| $500,000 to $749,999 | 0 (0.0%) | 0 (0.0%) |
| $750,000 to $999,999 | 0 (0.0%) | 0 (0.0%) |
| $1,000,000 or more | 0 (0.0%) | 0 (0.0%) |
| Total | 291 (100.0%) | 116 (100.0%) |
Household Income by Mortgage Status in Fort Davis
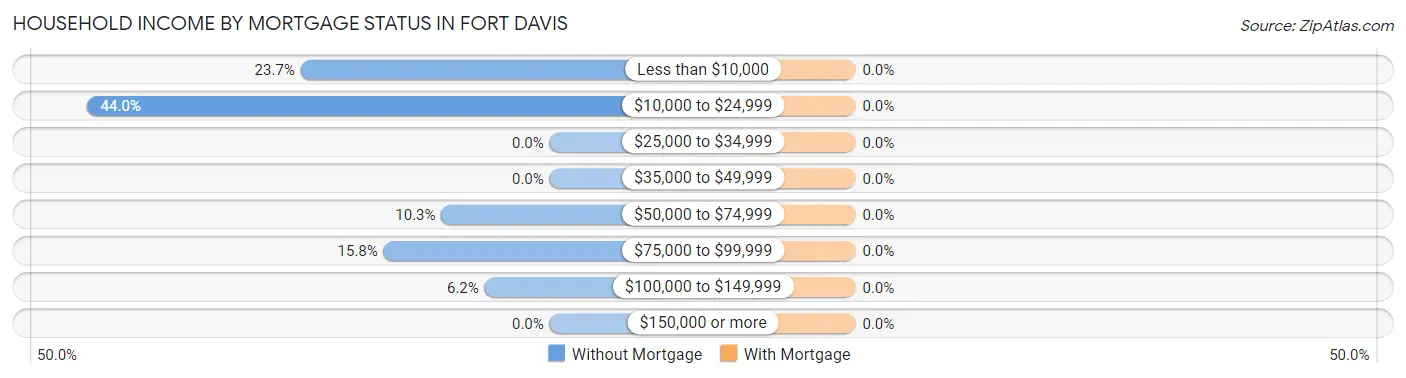
| Household Income | Without Mortgage | With Mortgage |
| Less than $10,000 | 69 (23.7%) | 0 (0.0%) |
| $10,000 to $24,999 | 128 (44.0%) | 0 (0.0%) |
| $25,000 to $34,999 | 0 (0.0%) | 0 (0.0%) |
| $35,000 to $49,999 | 0 (0.0%) | 0 (0.0%) |
| $50,000 to $74,999 | 30 (10.3%) | 0 (0.0%) |
| $75,000 to $99,999 | 46 (15.8%) | 0 (0.0%) |
| $100,000 to $149,999 | 18 (6.2%) | 0 (0.0%) |
| $150,000 or more | 0 (0.0%) | 0 (0.0%) |
| Total | 291 (100.0%) | 116 (100.0%) |
Property Value to Household Income Ratio in Fort Davis
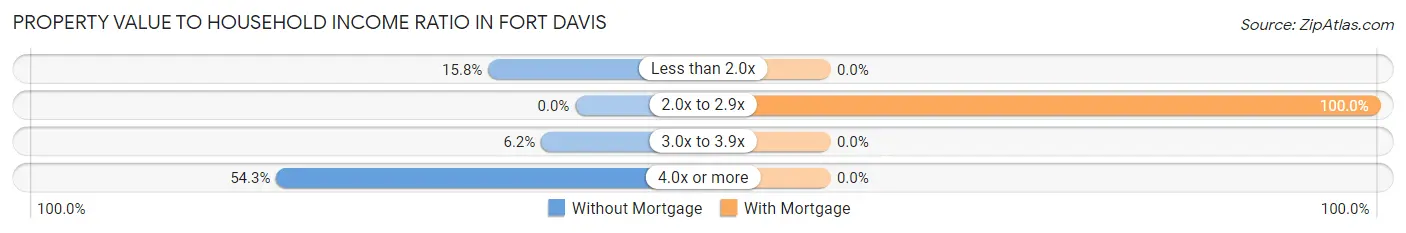
| Value-to-Income Ratio | Without Mortgage | With Mortgage |
| Less than 2.0x | 46 (15.8%) | 0 (0.0%) |
| 2.0x to 2.9x | 0 (0.0%) | 116 (100.0%) |
| 3.0x to 3.9x | 18 (6.2%) | 0 (0.0%) |
| 4.0x or more | 158 (54.3%) | 0 (0.0%) |
| Total | 291 (100.0%) | 116 (100.0%) |
Real Estate Taxes by Mortgage Status in Fort Davis
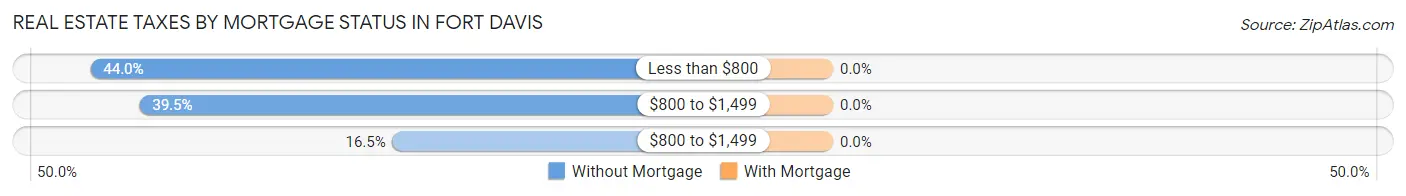
| Property Taxes | Without Mortgage | With Mortgage |
| Less than $800 | 128 (44.0%) | 0 (0.0%) |
| $800 to $1,499 | 115 (39.5%) | 0 (0.0%) |
| $800 to $1,499 | 48 (16.5%) | 0 (0.0%) |
| Total | 291 (100.0%) | 116 (100.0%) |
Health & Disability in Fort Davis
Health Insurance Coverage by Age in Fort Davis
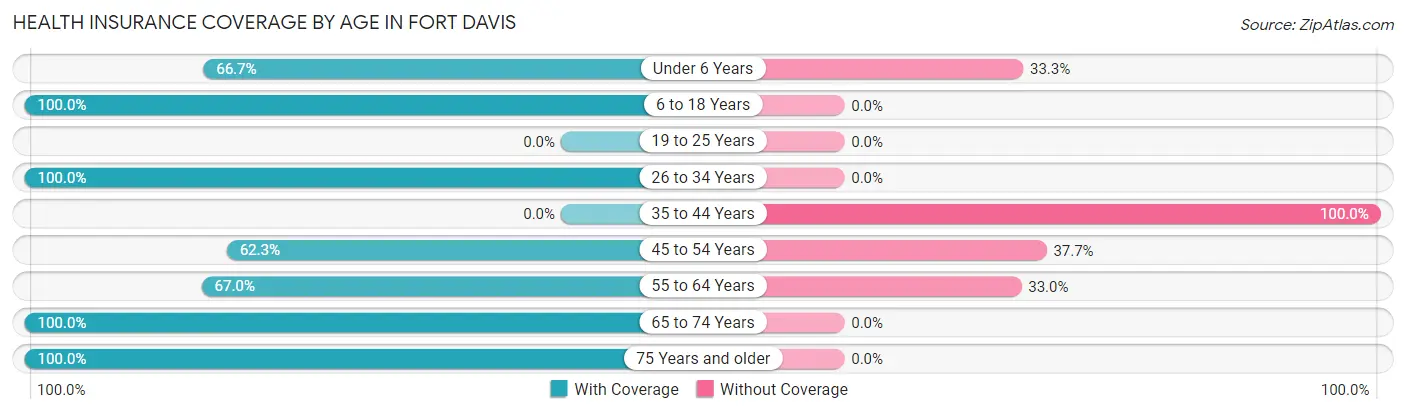
| Age Bracket | With Coverage | Without Coverage |
| Under 6 Years | 66 (66.7%) | 33 (33.3%) |
| 6 to 18 Years | 115 (100.0%) | 0 (0.0%) |
| 19 to 25 Years | 0 (0.0%) | 0 (0.0%) |
| 26 to 34 Years | 53 (100.0%) | 0 (0.0%) |
| 35 to 44 Years | 0 (0.0%) | 97 (100.0%) |
| 45 to 54 Years | 76 (62.3%) | 46 (37.7%) |
| 55 to 64 Years | 140 (67.0%) | 69 (33.0%) |
| 65 to 74 Years | 101 (100.0%) | 0 (0.0%) |
| 75 Years and older | 128 (100.0%) | 0 (0.0%) |
| Total | 679 (73.5%) | 245 (26.5%) |
Health Insurance Coverage by Citizenship Status in Fort Davis
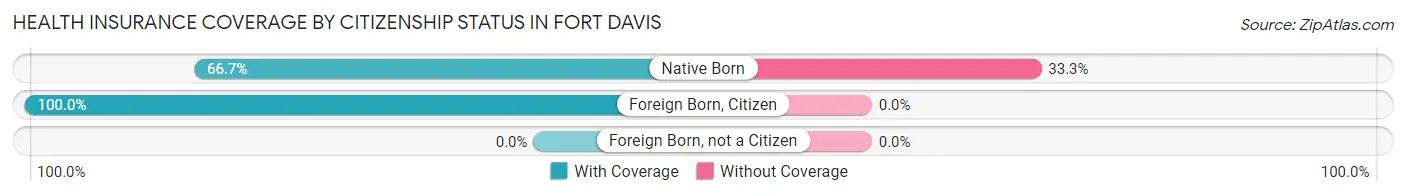
| Citizenship Status | With Coverage | Without Coverage |
| Native Born | 66 (66.7%) | 33 (33.3%) |
| Foreign Born, Citizen | 115 (100.0%) | 0 (0.0%) |
| Foreign Born, not a Citizen | 0 (0.0%) | 0 (0.0%) |
Health Insurance Coverage by Household Income in Fort Davis
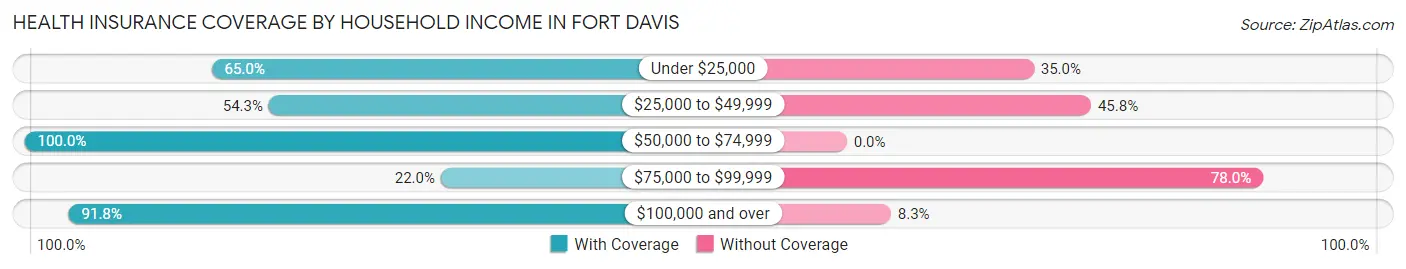
| Household Income | With Coverage | Without Coverage |
| Under $25,000 | 128 (65.0%) | 69 (35.0%) |
| $25,000 to $49,999 | 115 (54.2%) | 97 (45.8%) |
| $50,000 to $74,999 | 56 (100.0%) | 0 (0.0%) |
| $75,000 to $99,999 | 13 (22.0%) | 46 (78.0%) |
| $100,000 and over | 367 (91.7%) | 33 (8.3%) |
Public vs Private Health Insurance Coverage by Age in Fort Davis
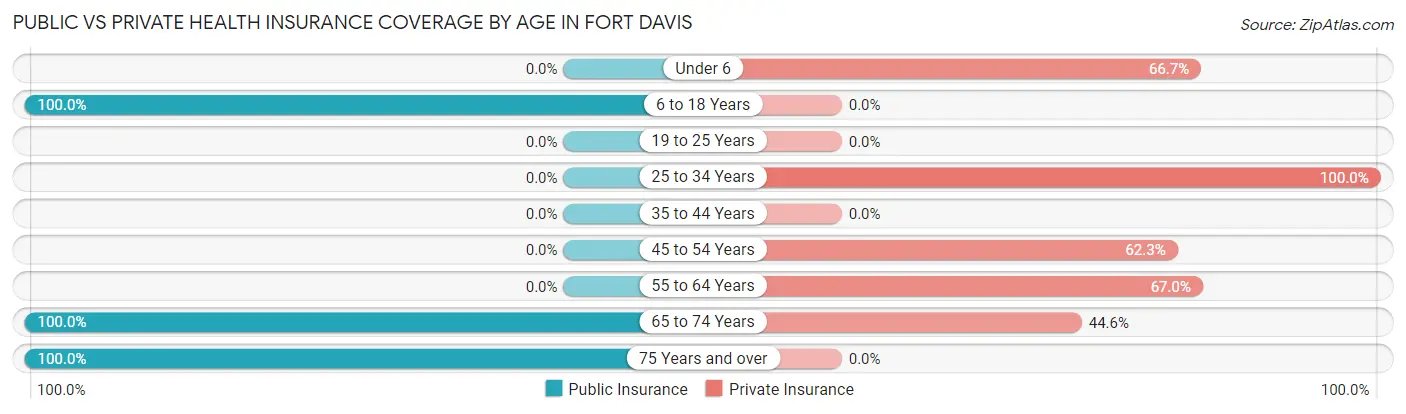
| Age Bracket | Public Insurance | Private Insurance |
| Under 6 | 0 (0.0%) | 66 (66.7%) |
| 6 to 18 Years | 115 (100.0%) | 0 (0.0%) |
| 19 to 25 Years | 0 (0.0%) | 0 (0.0%) |
| 25 to 34 Years | 0 (0.0%) | 53 (100.0%) |
| 35 to 44 Years | 0 (0.0%) | 0 (0.0%) |
| 45 to 54 Years | 0 (0.0%) | 76 (62.3%) |
| 55 to 64 Years | 0 (0.0%) | 140 (67.0%) |
| 65 to 74 Years | 101 (100.0%) | 45 (44.6%) |
| 75 Years and over | 128 (100.0%) | 0 (0.0%) |
| Total | 344 (37.2%) | 380 (41.1%) |
Disability Status by Sex by Age in Fort Davis
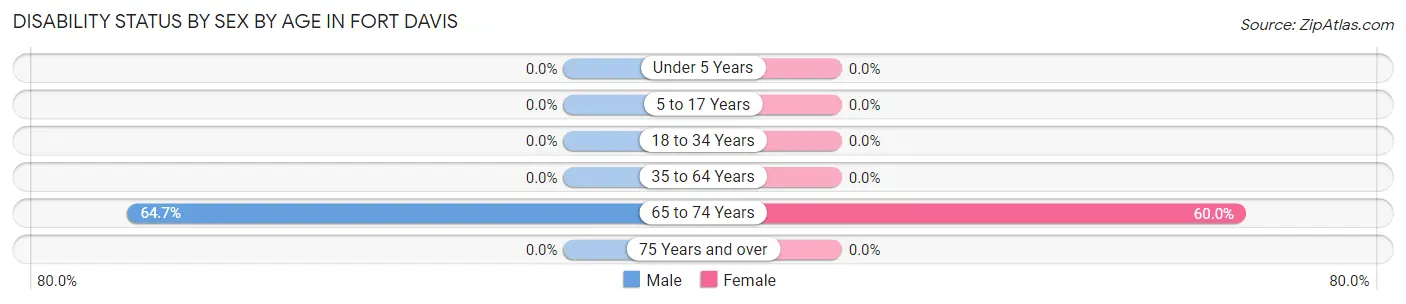
| Age Bracket | Male | Female |
| Under 5 Years | 0 (0.0%) | 0 (0.0%) |
| 5 to 17 Years | 0 (0.0%) | 0 (0.0%) |
| 18 to 34 Years | 0 (0.0%) | 0 (0.0%) |
| 35 to 64 Years | 0 (0.0%) | 0 (0.0%) |
| 65 to 74 Years | 33 (64.7%) | 30 (60.0%) |
| 75 Years and over | 0 (0.0%) | 0 (0.0%) |
Disability Class by Sex by Age in Fort Davis
Disability Class: Hearing Difficulty
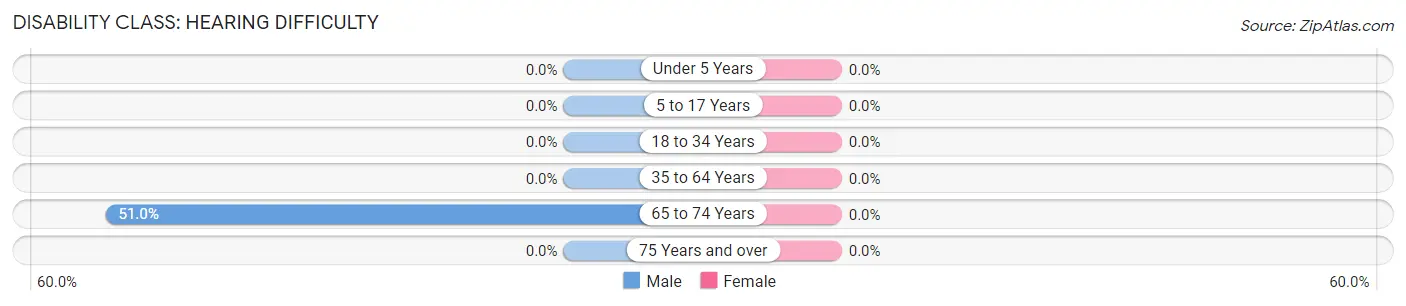
| Age Bracket | Male | Female |
| Under 5 Years | 0 (0.0%) | 0 (0.0%) |
| 5 to 17 Years | 0 (0.0%) | 0 (0.0%) |
| 18 to 34 Years | 0 (0.0%) | 0 (0.0%) |
| 35 to 64 Years | 0 (0.0%) | 0 (0.0%) |
| 65 to 74 Years | 26 (51.0%) | 0 (0.0%) |
| 75 Years and over | 0 (0.0%) | 0 (0.0%) |
Disability Class: Vision Difficulty
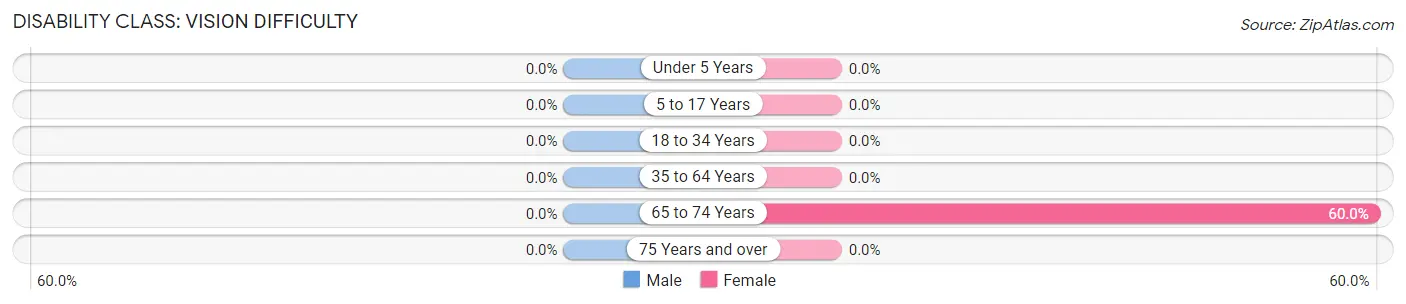
| Age Bracket | Male | Female |
| Under 5 Years | 0 (0.0%) | 0 (0.0%) |
| 5 to 17 Years | 0 (0.0%) | 0 (0.0%) |
| 18 to 34 Years | 0 (0.0%) | 0 (0.0%) |
| 35 to 64 Years | 0 (0.0%) | 0 (0.0%) |
| 65 to 74 Years | 0 (0.0%) | 30 (60.0%) |
| 75 Years and over | 0 (0.0%) | 0 (0.0%) |
Disability Class: Cognitive Difficulty
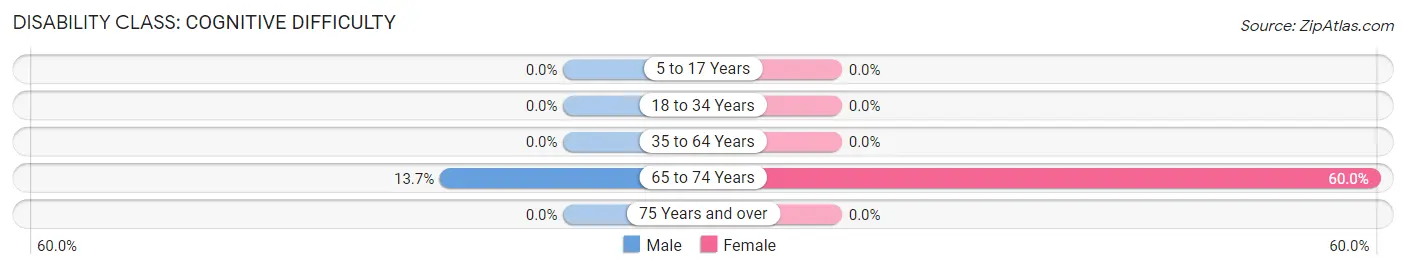
| Age Bracket | Male | Female |
| 5 to 17 Years | 0 (0.0%) | 0 (0.0%) |
| 18 to 34 Years | 0 (0.0%) | 0 (0.0%) |
| 35 to 64 Years | 0 (0.0%) | 0 (0.0%) |
| 65 to 74 Years | 7 (13.7%) | 30 (60.0%) |
| 75 Years and over | 0 (0.0%) | 0 (0.0%) |
Disability Class: Ambulatory Difficulty
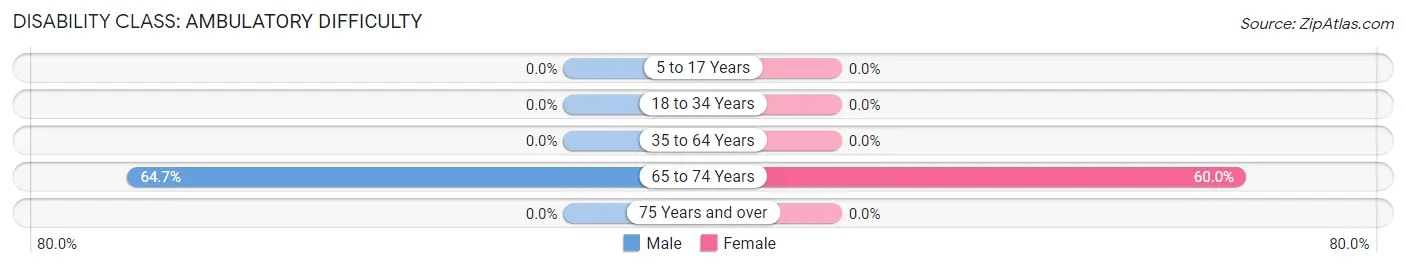
| Age Bracket | Male | Female |
| 5 to 17 Years | 0 (0.0%) | 0 (0.0%) |
| 18 to 34 Years | 0 (0.0%) | 0 (0.0%) |
| 35 to 64 Years | 0 (0.0%) | 0 (0.0%) |
| 65 to 74 Years | 33 (64.7%) | 30 (60.0%) |
| 75 Years and over | 0 (0.0%) | 0 (0.0%) |
Disability Class: Self-Care Difficulty
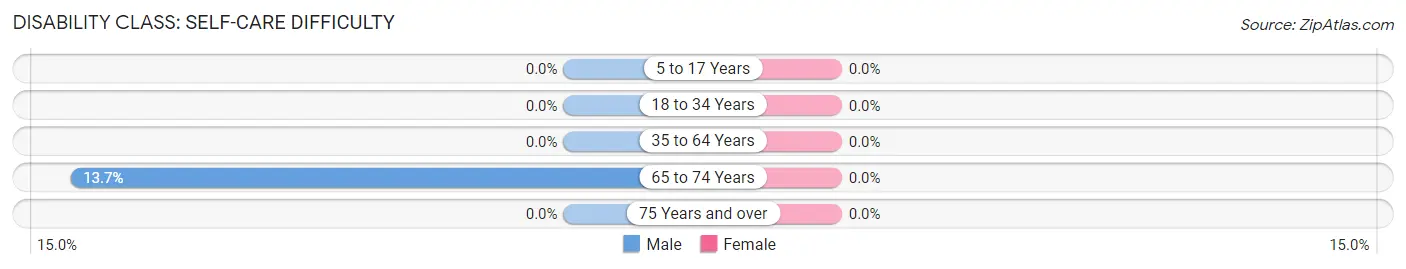
| Age Bracket | Male | Female |
| 5 to 17 Years | 0 (0.0%) | 0 (0.0%) |
| 18 to 34 Years | 0 (0.0%) | 0 (0.0%) |
| 35 to 64 Years | 0 (0.0%) | 0 (0.0%) |
| 65 to 74 Years | 7 (13.7%) | 0 (0.0%) |
| 75 Years and over | 0 (0.0%) | 0 (0.0%) |
Technology Access in Fort Davis
Computing Device Access in Fort Davis
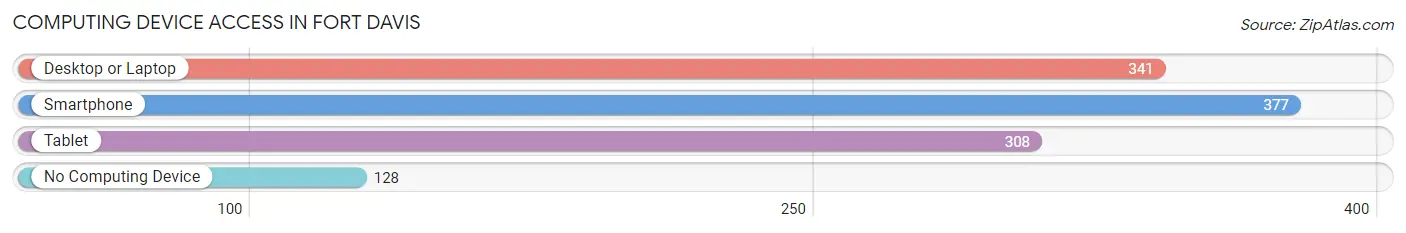
| Device Type | # Households | % Households |
| Desktop or Laptop | 341 | 67.5% |
| Smartphone | 377 | 74.7% |
| Tablet | 308 | 61.0% |
| No Computing Device | 128 | 25.4% |
| Total | 505 | 100.0% |
Internet Access in Fort Davis
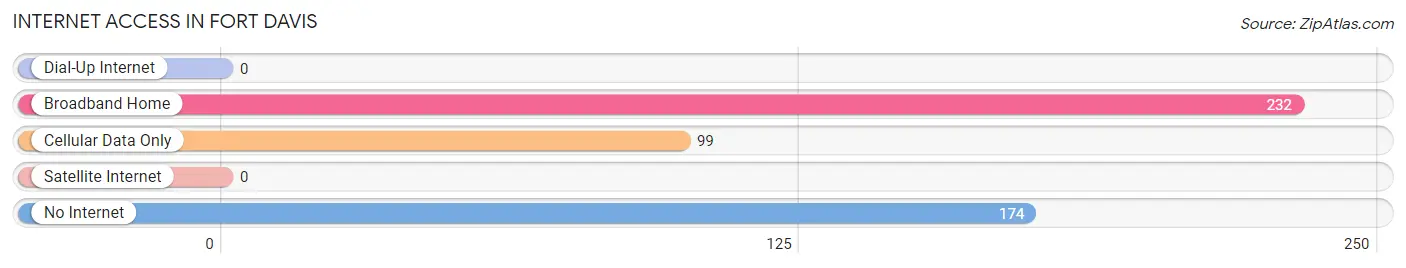
| Internet Type | # Households | % Households |
| Dial-Up Internet | 0 | 0.0% |
| Broadband Home | 232 | 45.9% |
| Cellular Data Only | 99 | 19.6% |
| Satellite Internet | 0 | 0.0% |
| No Internet | 174 | 34.5% |
| Total | 505 | 100.0% |
Fort Davis Summary
Davis, Texas is a small town located in the western part of the state, in Jeff Davis County. It is situated at the base of the Davis Mountains, and is the county seat of Jeff Davis County. The town was founded in 1854, and was named after Jefferson Davis, the President of the Confederate States of America.
History
The area around Davis was first inhabited by Native Americans, including the Apache, Comanche, and Kiowa tribes. The first Europeans to settle in the area were ranchers, who began to arrive in the late 1840s. The town of Davis was founded in 1854, and was named after Jefferson Davis, the President of the Confederate States of America.
In 1867, the United States Army established Fort Davis in the area, in order to protect settlers from Native American raids. The fort was abandoned in 1891, but the town of Davis continued to grow. In the early 1900s, Davis became a popular tourist destination, due to its proximity to the Davis Mountains and the nearby Chihuahuan Desert.
Geography
Davis is located in the western part of Texas, in Jeff Davis County. It is situated at the base of the Davis Mountains, and is surrounded by the Chihuahuan Desert. The town is located at an elevation of 4,945 feet, and has a total area of 1.3 square miles.
The climate in Davis is semi-arid, with hot summers and mild winters. The average annual temperature is 64°F, and the average annual precipitation is 16.5 inches.
Economy
The economy of Davis is largely based on tourism. The town is a popular destination for hikers, campers, and other outdoor enthusiasts, due to its proximity to the Davis Mountains and the nearby Chihuahuan Desert. The town is also home to several historic sites, including Fort Davis National Historic Site and the Davis Mountains State Park.
In addition to tourism, Davis is also home to several small businesses, including restaurants, shops, and other services. The town is also home to a small manufacturing sector, which produces a variety of products, including furniture, clothing, and electronics.
Demographics
As of the 2010 census, the population of Davis was 1,201. The racial makeup of the town was 94.3% White, 0.3% African American, 0.2% Native American, 0.2% Asian, 0.1% Pacific Islander, 3.3% from other races, and 1.6% from two or more races. Hispanic or Latino of any race were 8.2% of the population.
The median household income in Davis was $31,250, and the median family income was $37,500. The per capita income in Davis was $17,845. About 15.2% of the population was below the poverty line.
Common Questions
What is Per Capita Income in Fort Davis?
Per Capita income in Fort Davis is $43,847.
What is Inequality or Gini Index in Fort Davis?
Inequality or Gini Index in Fort Davis is 0.59.
What is the Total Population of Fort Davis?
Total Population of Fort Davis is 924.
What is the Total Male Population of Fort Davis?
Total Male Population of Fort Davis is 570.
What is the Total Female Population of Fort Davis?
Total Female Population of Fort Davis is 354.
What is the Ratio of Males per 100 Females in Fort Davis?
There are 161.02 Males per 100 Females in Fort Davis.
What is the Ratio of Females per 100 Males in Fort Davis?
There are 62.11 Females per 100 Males in Fort Davis.
What is the Median Population Age in Fort Davis?
Median Population Age in Fort Davis is 49.4 Years.
What is the Average Family Size in Fort Davis
Average Family Size in Fort Davis is 2.8 People.
What is the Average Household Size in Fort Davis
Average Household Size in Fort Davis is 1.8 People.
How Large is the Labor Force in Fort Davis?
There are 412 People in the Labor Forcein in Fort Davis.
What is the Percentage of People in the Labor Force in Fort Davis?
56.6% of People are in the Labor Force in Fort Davis.