Zip Codes with the Highest Percentage of Population Employed in Health Diagnosing & Treating in Huntsville, TX
RELATED REPORTS & OPTIONS
Health Diagnosing & Treating
Huntsville
Compare Zip Codes
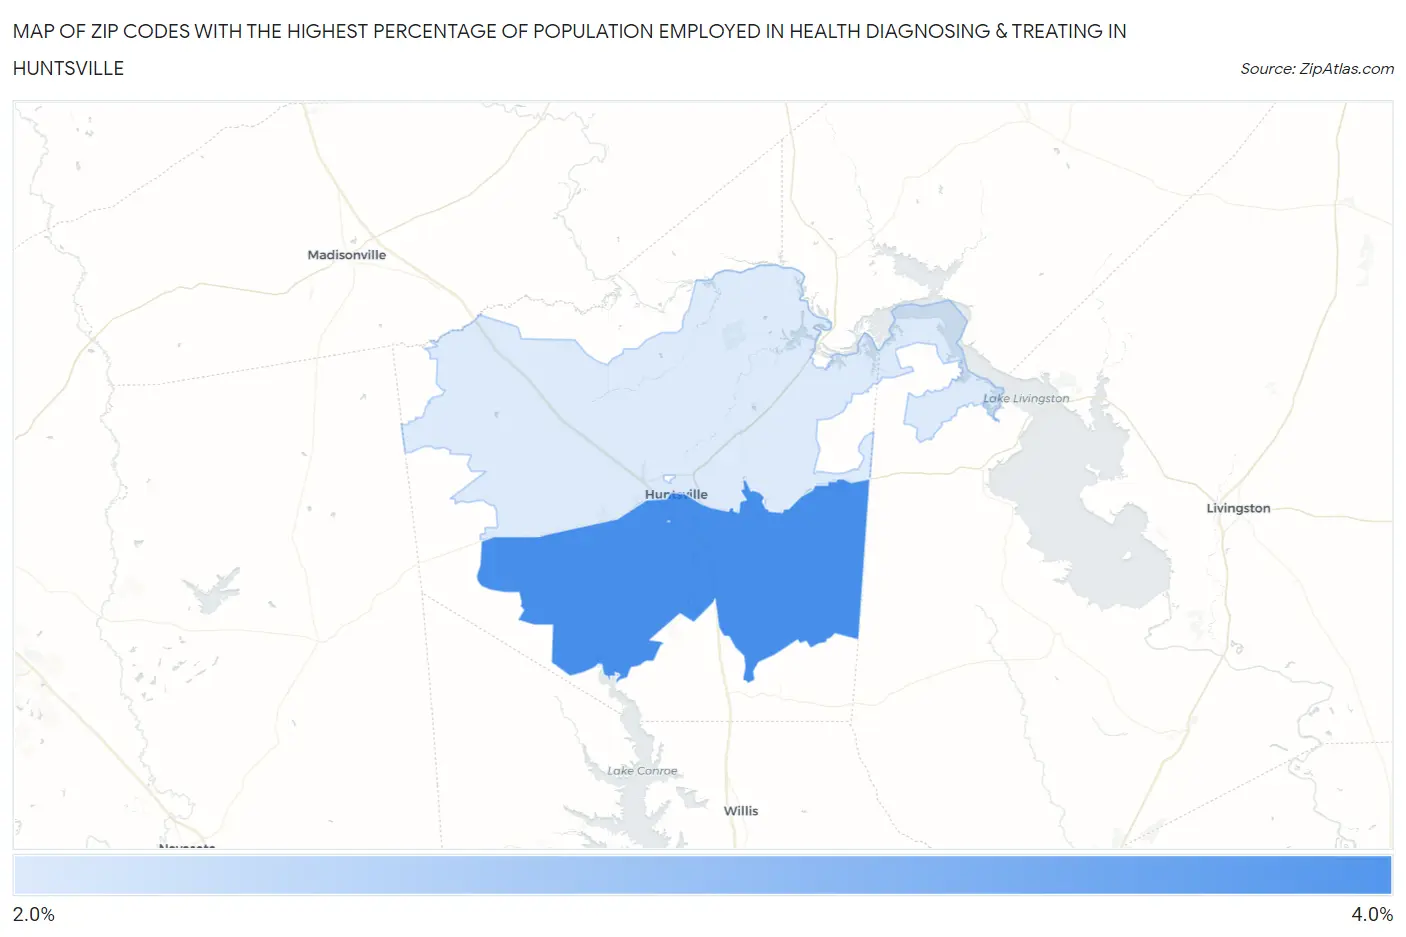
Map of Zip Codes with the Highest Percentage of Population Employed in Health Diagnosing & Treating in Huntsville
2.9%
4.0%
Zip Codes with the Highest Percentage of Population Employed in Health Diagnosing & Treating in Huntsville, TX
| Zip Code | % Employed | vs State | vs National | |
| 1. | 77340 | 4.0% | 5.5%(-1.56)#1,075 | 6.2%(-2.29)#21,494 |
| 2. | 77320 | 2.9% | 5.5%(-2.61)#1,309 | 6.2%(-3.33)#24,542 |
1
Common Questions
What are the Top Zip Codes with the Highest Percentage of Population Employed in Health Diagnosing & Treating in Huntsville, TX?
Top Zip Codes with the Highest Percentage of Population Employed in Health Diagnosing & Treating in Huntsville, TX are:
What zip code has the Highest Percentage of Population Employed in Health Diagnosing & Treating in Huntsville, TX?
77340 has the Highest Percentage of Population Employed in Health Diagnosing & Treating in Huntsville, TX with 4.0%.
What is the Percentage of Population Employed in Health Diagnosing & Treating in Huntsville, TX?
Percentage of Population Employed in Health Diagnosing & Treating in Huntsville is 3.5%.
What is the Percentage of Population Employed in Health Diagnosing & Treating in Texas?
Percentage of Population Employed in Health Diagnosing & Treating in Texas is 5.5%.
What is the Percentage of Population Employed in Health Diagnosing & Treating in the United States?
Percentage of Population Employed in Health Diagnosing & Treating in the United States is 6.2%.