Comfort, TX Map & Demographics
Comfort Map
Comfort Overview
$34,810
PER CAPITA INCOME
$77,132
AVG FAMILY INCOME
$63,079
AVG HOUSEHOLD INCOME
39.4%
WAGE / INCOME GAP [ % ]
60.6¢/ $1
WAGE / INCOME GAP [ $ ]
0.35
INEQUALITY / GINI INDEX
1,589
TOTAL POPULATION
834
MALE POPULATION
755
FEMALE POPULATION
110.46
MALES / 100 FEMALES
90.53
FEMALES / 100 MALES
46.5
MEDIAN AGE
2.9
AVG FAMILY SIZE
2.2
AVG HOUSEHOLD SIZE
1,041
LABOR FORCE [ PEOPLE ]
81.3%
PERCENT IN LABOR FORCE
7.4%
UNEMPLOYMENT RATE
Comfort Zip Codes
Comfort Area Codes
Income in Comfort
Income Overview in Comfort
Per Capita Income in Comfort is $34,810, while median incomes of families and households are $77,132 and $63,079 respectively.
| Characteristic | Number | Measure |
| Per Capita Income | 1,589 | $34,810 |
| Median Family Income | 414 | $77,132 |
| Mean Family Income | 414 | $93,428 |
| Median Household Income | 711 | $63,079 |
| Mean Household Income | 711 | $73,983 |
| Income Deficit | 414 | $0 |
| Wage / Income Gap (%) | 1,589 | 39.41% |
| Wage / Income Gap ($) | 1,589 | 60.59¢ per $1 |
| Gini / Inequality Index | 1,589 | 0.35 |
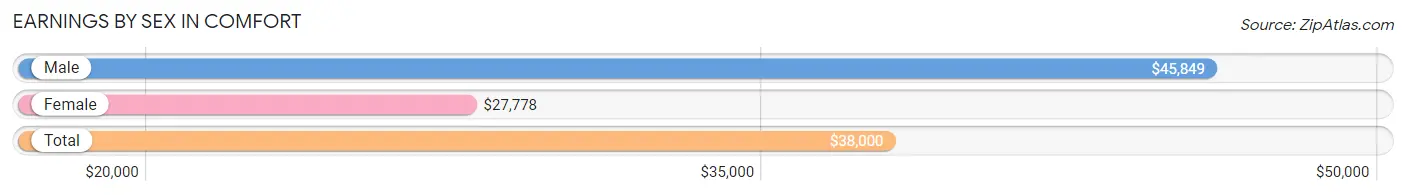
Earnings by Sex in Comfort
Average Earnings in Comfort are $38,000, $45,849 for men and $27,778 for women, a difference of 39.4%.
| Sex | Number | Average Earnings |
| Male | 580 (55.8%) | $45,849 |
| Female | 460 (44.2%) | $27,778 |
| Total | 1,040 (100.0%) | $38,000 |
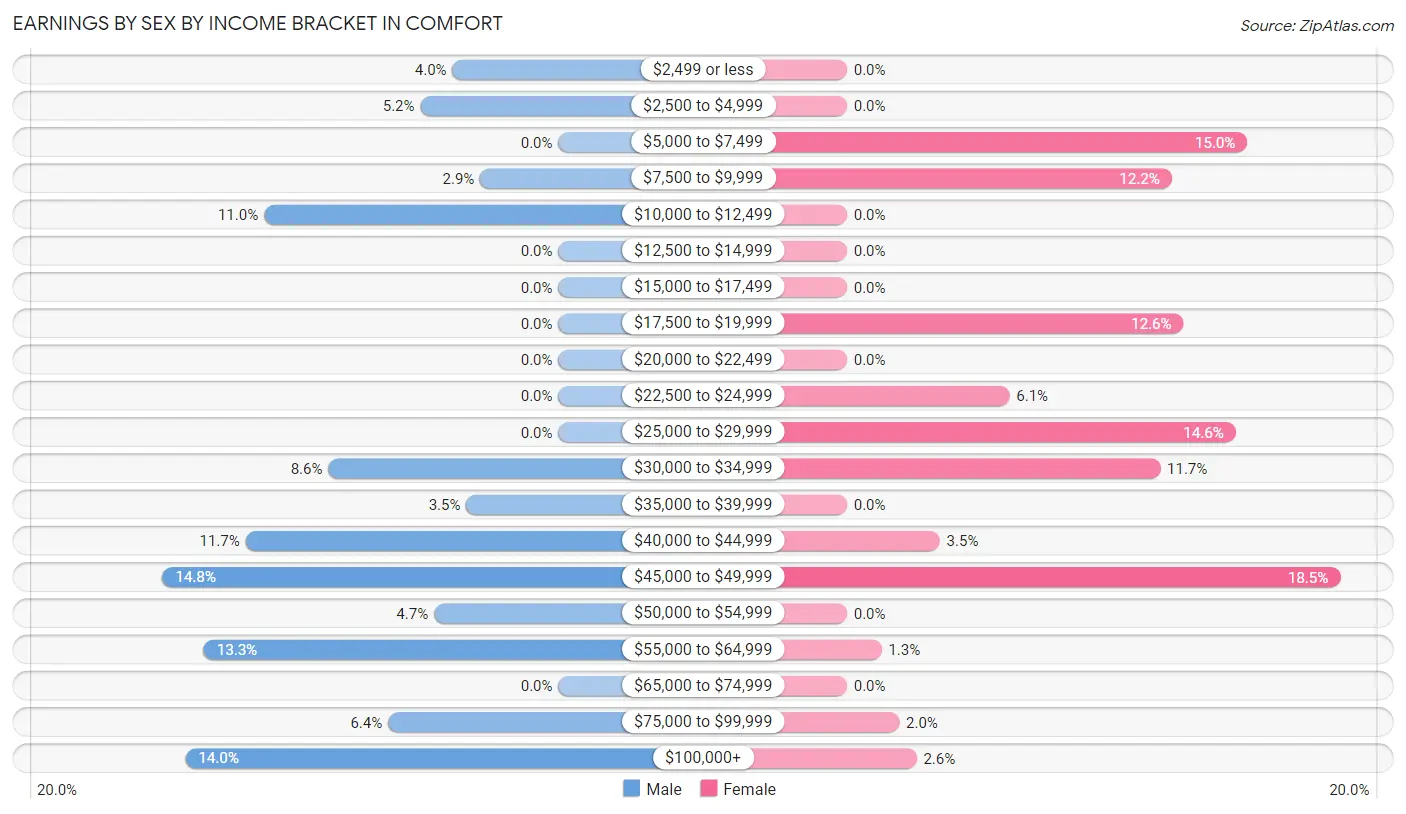
Earnings by Sex by Income Bracket in Comfort
The most common earnings brackets in Comfort are $45,000 to $49,999 for men (86 | 14.8%) and $45,000 to $49,999 for women (85 | 18.5%).
| Income | Male | Female |
| $2,499 or less | 23 (4.0%) | 0 (0.0%) |
| $2,500 to $4,999 | 30 (5.2%) | 0 (0.0%) |
| $5,000 to $7,499 | 0 (0.0%) | 69 (15.0%) |
| $7,500 to $9,999 | 17 (2.9%) | 56 (12.2%) |
| $10,000 to $12,499 | 64 (11.0%) | 0 (0.0%) |
| $12,500 to $14,999 | 0 (0.0%) | 0 (0.0%) |
| $15,000 to $17,499 | 0 (0.0%) | 0 (0.0%) |
| $17,500 to $19,999 | 0 (0.0%) | 58 (12.6%) |
| $20,000 to $22,499 | 0 (0.0%) | 0 (0.0%) |
| $22,500 to $24,999 | 0 (0.0%) | 28 (6.1%) |
| $25,000 to $29,999 | 0 (0.0%) | 67 (14.6%) |
| $30,000 to $34,999 | 50 (8.6%) | 54 (11.7%) |
| $35,000 to $39,999 | 20 (3.5%) | 0 (0.0%) |
| $40,000 to $44,999 | 68 (11.7%) | 16 (3.5%) |
| $45,000 to $49,999 | 86 (14.8%) | 85 (18.5%) |
| $50,000 to $54,999 | 27 (4.7%) | 0 (0.0%) |
| $55,000 to $64,999 | 77 (13.3%) | 6 (1.3%) |
| $65,000 to $74,999 | 0 (0.0%) | 0 (0.0%) |
| $75,000 to $99,999 | 37 (6.4%) | 9 (2.0%) |
| $100,000+ | 81 (14.0%) | 12 (2.6%) |
| Total | 580 (100.0%) | 460 (100.0%) |
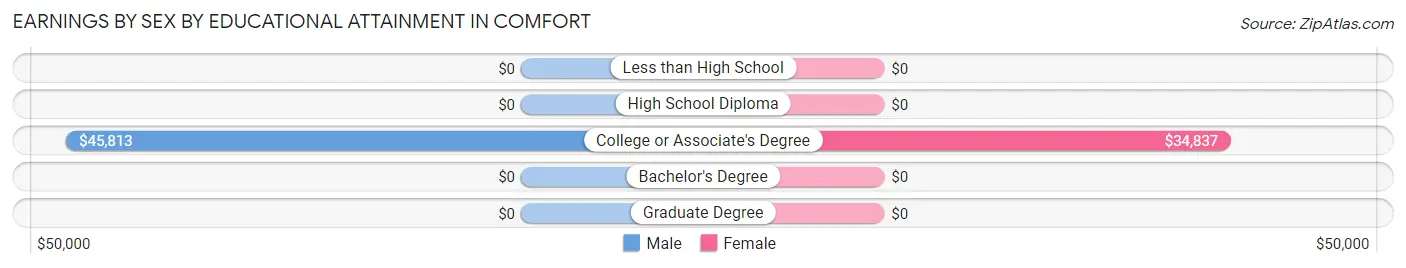
Earnings by Sex by Educational Attainment in Comfort
Average earnings in Comfort are $46,321 for men and $27,778 for women, a difference of 40.0%. Men with an educational attainment of college or associate's degree enjoy the highest average annual earnings of $45,813, while those with college or associate's degree education earn the least with $45,813. Women with an educational attainment of college or associate's degree earn the most with the average annual earnings of $34,837, while those with college or associate's degree education have the smallest earnings of $34,837.
| Educational Attainment | Male Income | Female Income |
| Less than High School | - | - |
| High School Diploma | - | - |
| College or Associate's Degree | $45,813 | $34,837 |
| Bachelor's Degree | - | - |
| Graduate Degree | - | - |
| Total | $46,321 | $27,778 |
Family Income in Comfort
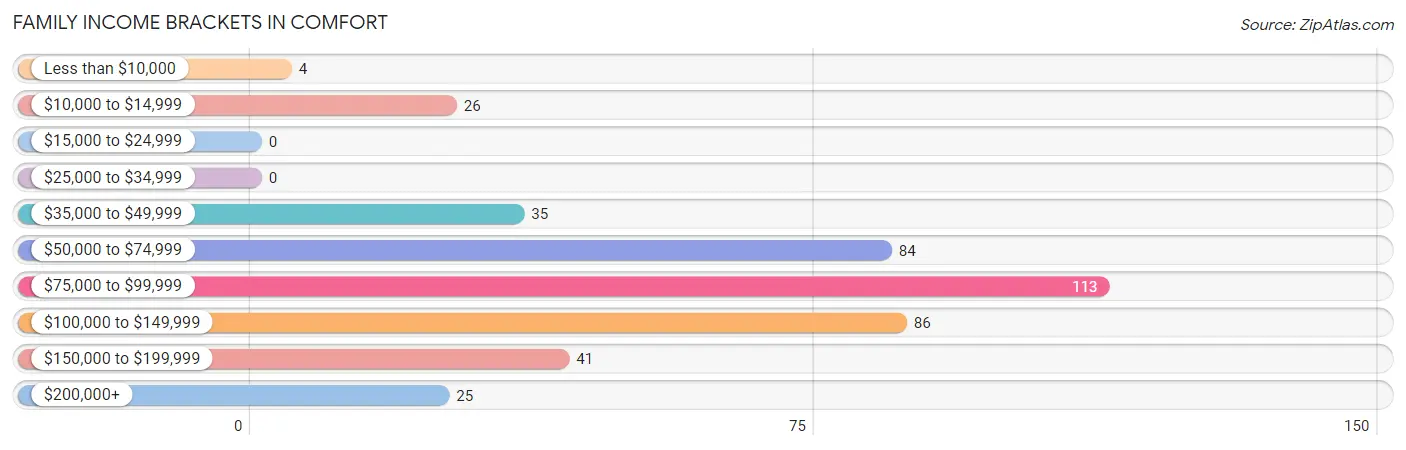
Family Income Brackets in Comfort
According to the Comfort family income data, there are 113 families falling into the $75,000 to $99,999 income range, which is the most common income bracket and makes up 27.3% of all families.
| Income Bracket | # Families | % Families |
| Less than $10,000 | 4 | 1.0% |
| $10,000 to $14,999 | 26 | 6.3% |
| $15,000 to $24,999 | 0 | 0.0% |
| $25,000 to $34,999 | 0 | 0.0% |
| $35,000 to $49,999 | 35 | 8.5% |
| $50,000 to $74,999 | 84 | 20.3% |
| $75,000 to $99,999 | 113 | 27.3% |
| $100,000 to $149,999 | 86 | 20.8% |
| $150,000 to $199,999 | 41 | 9.9% |
| $200,000+ | 25 | 6.0% |
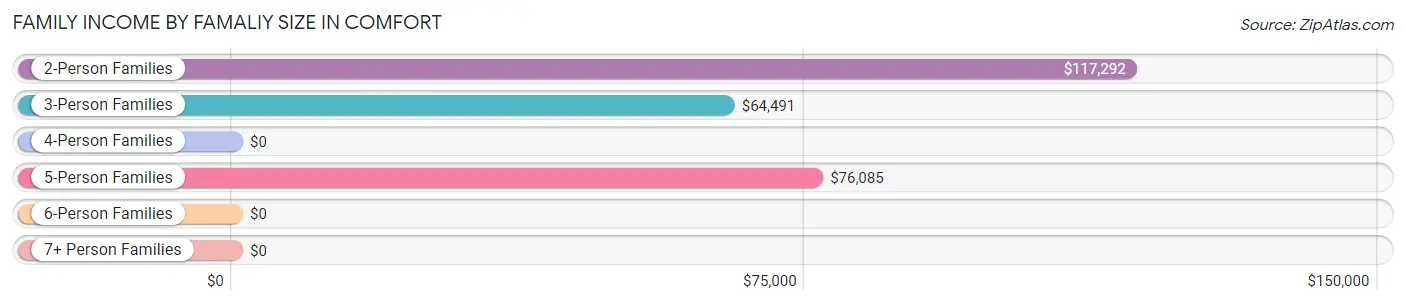
Family Income by Famaliy Size in Comfort
2-person families (145 | 35.0%) account for the highest median family income in Comfort with $117,292 per family, while 2-person families (145 | 35.0%) have the highest median income of $58,646 per family member.
| Income Bracket | # Families | Median Income |
| 2-Person Families | 145 (35.0%) | $117,292 |
| 3-Person Families | 146 (35.3%) | $64,491 |
| 4-Person Families | 12 (2.9%) | $0 |
| 5-Person Families | 111 (26.8%) | $76,085 |
| 6-Person Families | 0 (0.0%) | $0 |
| 7+ Person Families | 0 (0.0%) | $0 |
| Total | 414 (100.0%) | $77,132 |
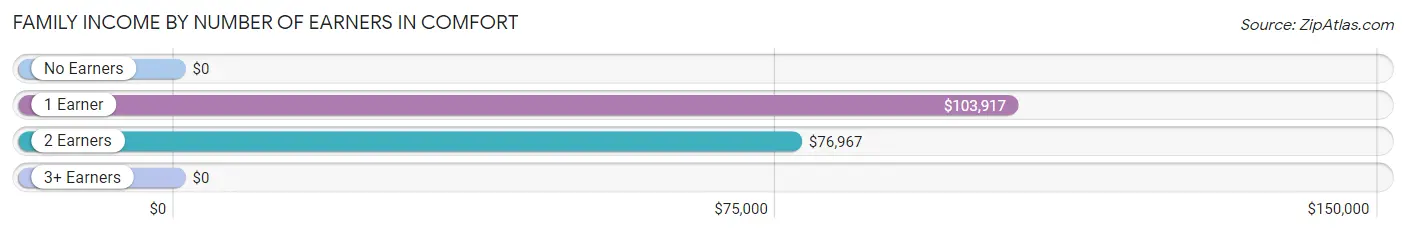
Family Income by Number of Earners in Comfort
| Number of Earners | # Families | Median Income |
| No Earners | 42 (10.1%) | $0 |
| 1 Earner | 41 (9.9%) | $103,917 |
| 2 Earners | 267 (64.5%) | $76,967 |
| 3+ Earners | 64 (15.5%) | $0 |
| Total | 414 (100.0%) | $77,132 |
Household Income in Comfort
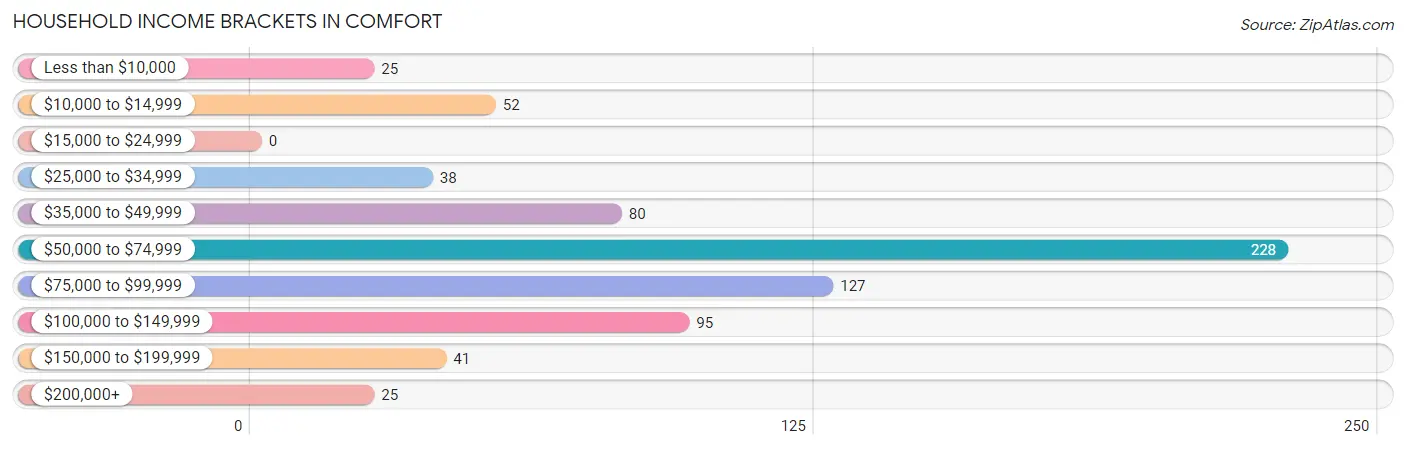
Household Income Brackets in Comfort
With 228 households falling in the category, the $50,000 to $74,999 income range is the most frequent in Comfort, accounting for 32.1% of all households.
| Income Bracket | # Households | % Households |
| Less than $10,000 | 25 | 3.5% |
| $10,000 to $14,999 | 52 | 7.3% |
| $15,000 to $24,999 | 0 | 0.0% |
| $25,000 to $34,999 | 38 | 5.3% |
| $35,000 to $49,999 | 80 | 11.3% |
| $50,000 to $74,999 | 228 | 32.1% |
| $75,000 to $99,999 | 127 | 17.9% |
| $100,000 to $149,999 | 95 | 13.4% |
| $150,000 to $199,999 | 41 | 5.8% |
| $200,000+ | 25 | 3.5% |
Household Income by Householder Age in Comfort
The median household income in Comfort is $63,079, with the highest median household income of $76,893 found in the 25 to 44 years age bracket for the primary householder. A total of 155 households (21.8%) fall into this category.
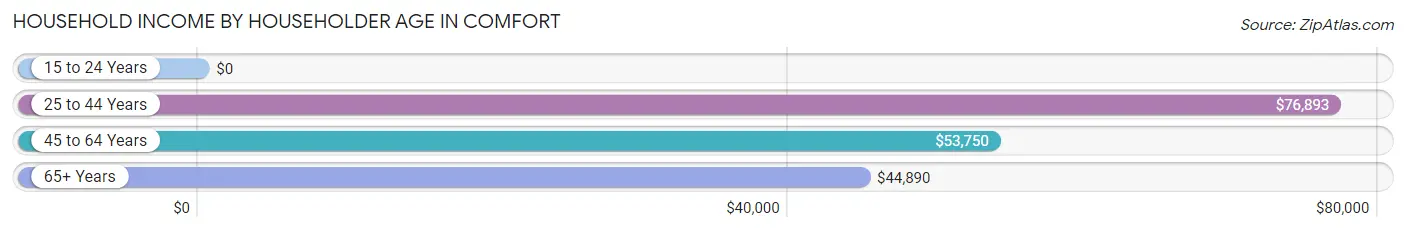
| Income Bracket | # Households | Median Income |
| 15 to 24 Years | 0 (0.0%) | $0 |
| 25 to 44 Years | 155 (21.8%) | $76,893 |
| 45 to 64 Years | 387 (54.4%) | $53,750 |
| 65+ Years | 169 (23.8%) | $44,890 |
| Total | 711 (100.0%) | $63,079 |
Poverty in Comfort
Income Below Poverty by Sex and Age in Comfort
With 17.2% poverty level for males and 8.7% for females among the residents of Comfort, 12 to 14 year old males and 12 to 14 year old females are the most vulnerable to poverty, with 3 males (100.0%) and 29 females (100.0%) in their respective age groups living below the poverty level.
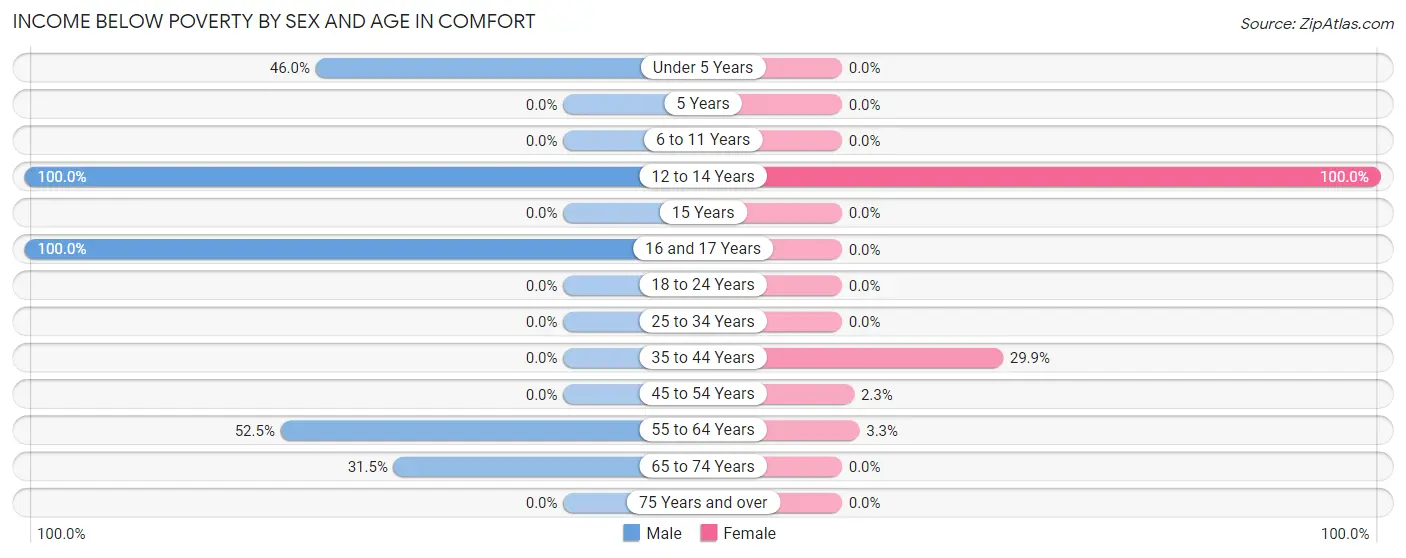
| Age Bracket | Male | Female |
| Under 5 Years | 34 (46.0%) | 0 (0.0%) |
| 5 Years | 0 (0.0%) | 0 (0.0%) |
| 6 to 11 Years | 0 (0.0%) | 0 (0.0%) |
| 12 to 14 Years | 3 (100.0%) | 29 (100.0%) |
| 15 Years | 0 (0.0%) | 0 (0.0%) |
| 16 and 17 Years | 23 (100.0%) | 0 (0.0%) |
| 18 to 24 Years | 0 (0.0%) | 0 (0.0%) |
| 25 to 34 Years | 0 (0.0%) | 0 (0.0%) |
| 35 to 44 Years | 0 (0.0%) | 26 (29.9%) |
| 45 to 54 Years | 0 (0.0%) | 4 (2.3%) |
| 55 to 64 Years | 64 (52.5%) | 4 (3.3%) |
| 65 to 74 Years | 17 (31.5%) | 0 (0.0%) |
| 75 Years and over | 0 (0.0%) | 0 (0.0%) |
| Total | 141 (17.2%) | 63 (8.7%) |
Income Above Poverty by Sex and Age in Comfort
According to the poverty statistics in Comfort, males aged 6 to 11 years and females aged under 5 years are the age groups that are most secure financially, with 100.0% of males and 100.0% of females in these age groups living above the poverty line.
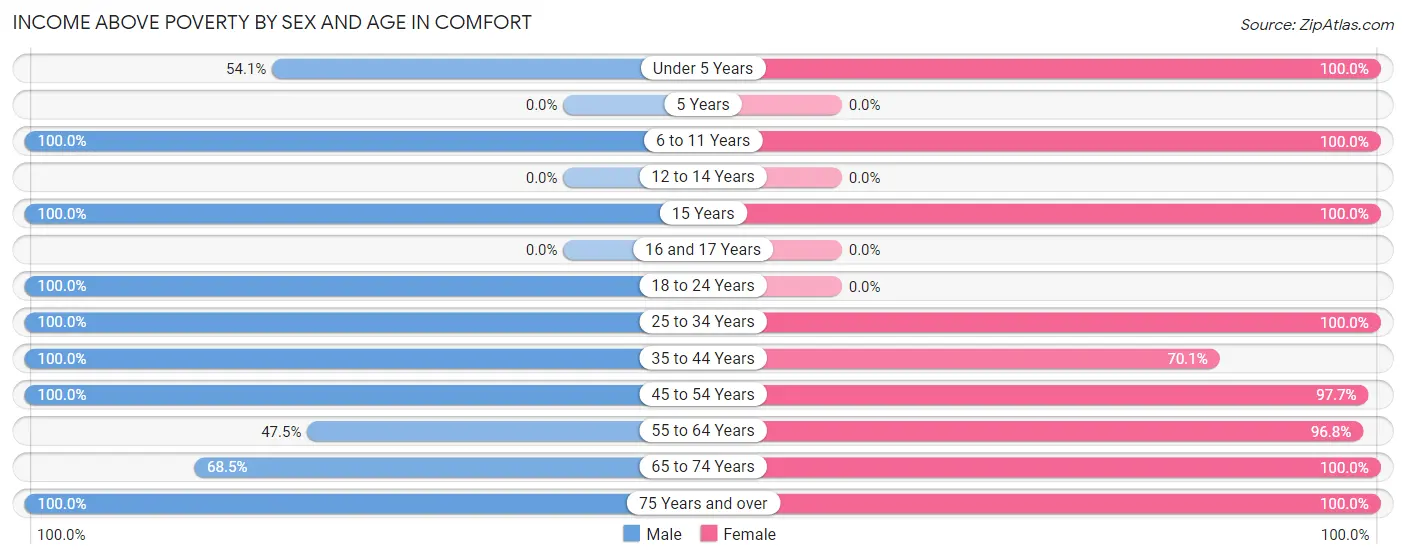
| Age Bracket | Male | Female |
| Under 5 Years | 40 (54.0%) | 53 (100.0%) |
| 5 Years | 0 (0.0%) | 0 (0.0%) |
| 6 to 11 Years | 68 (100.0%) | 54 (100.0%) |
| 12 to 14 Years | 0 (0.0%) | 0 (0.0%) |
| 15 Years | 13 (100.0%) | 15 (100.0%) |
| 16 and 17 Years | 0 (0.0%) | 0 (0.0%) |
| 18 to 24 Years | 63 (100.0%) | 0 (0.0%) |
| 25 to 34 Years | 196 (100.0%) | 54 (100.0%) |
| 35 to 44 Years | 42 (100.0%) | 61 (70.1%) |
| 45 to 54 Years | 109 (100.0%) | 173 (97.7%) |
| 55 to 64 Years | 58 (47.5%) | 119 (96.8%) |
| 65 to 74 Years | 37 (68.5%) | 55 (100.0%) |
| 75 Years and over | 54 (100.0%) | 79 (100.0%) |
| Total | 680 (82.8%) | 663 (91.3%) |
Income Below Poverty Among Married-Couple Families in Comfort
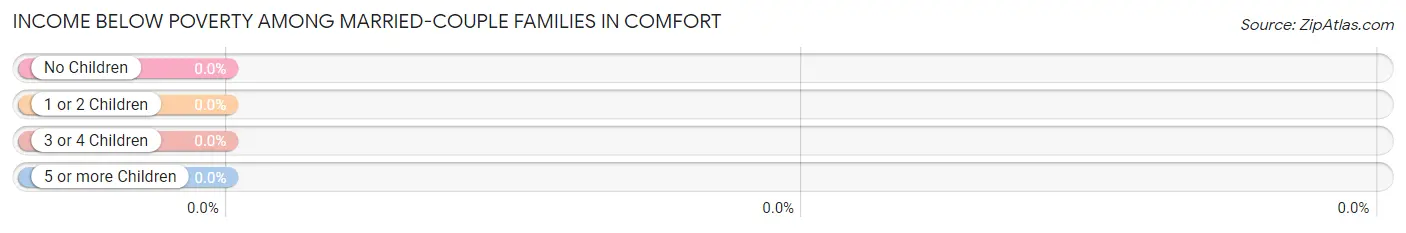
| Children | Above Poverty | Below Poverty |
| No Children | 164 (100.0%) | 0 (0.0%) |
| 1 or 2 Children | 94 (100.0%) | 0 (0.0%) |
| 3 or 4 Children | 85 (100.0%) | 0 (0.0%) |
| 5 or more Children | 0 (0.0%) | 0 (0.0%) |
| Total | 343 (100.0%) | 0 (0.0%) |
Income Below Poverty Among Single-Parent Households in Comfort
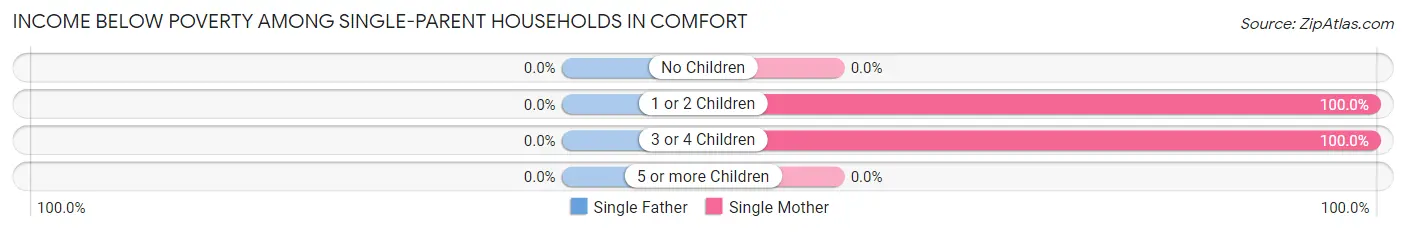
| Children | Single Father | Single Mother |
| No Children | 0 (0.0%) | 0 (0.0%) |
| 1 or 2 Children | 0 (0.0%) | 4 (100.0%) |
| 3 or 4 Children | 0 (0.0%) | 26 (100.0%) |
| 5 or more Children | 0 (0.0%) | 0 (0.0%) |
| Total | 0 (0.0%) | 30 (42.2%) |
Income Below Poverty Among Married-Couple vs Single-Parent Households in Comfort
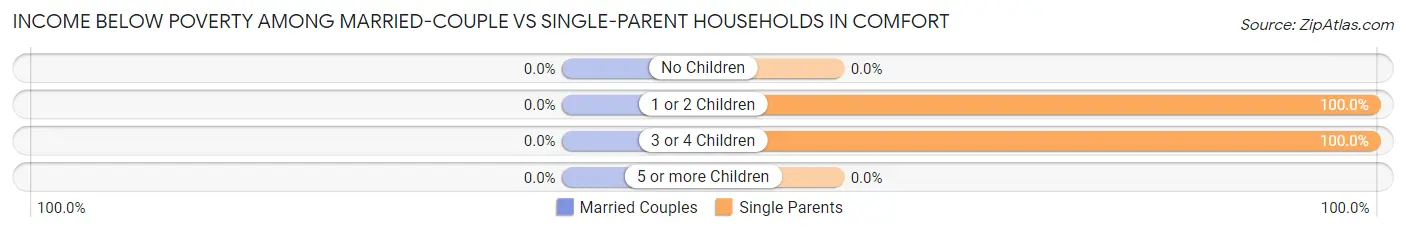
| Children | Married-Couple Families | Single-Parent Households |
| No Children | 0 (0.0%) | 0 (0.0%) |
| 1 or 2 Children | 0 (0.0%) | 4 (100.0%) |
| 3 or 4 Children | 0 (0.0%) | 26 (100.0%) |
| 5 or more Children | 0 (0.0%) | 0 (0.0%) |
| Total | 0 (0.0%) | 30 (42.2%) |
Race in Comfort
The most populous races in Comfort are White / Caucasian (1,141 | 71.8%), Hispanic or Latino (615 | 38.7%), and Two or more Races (268 | 16.9%).
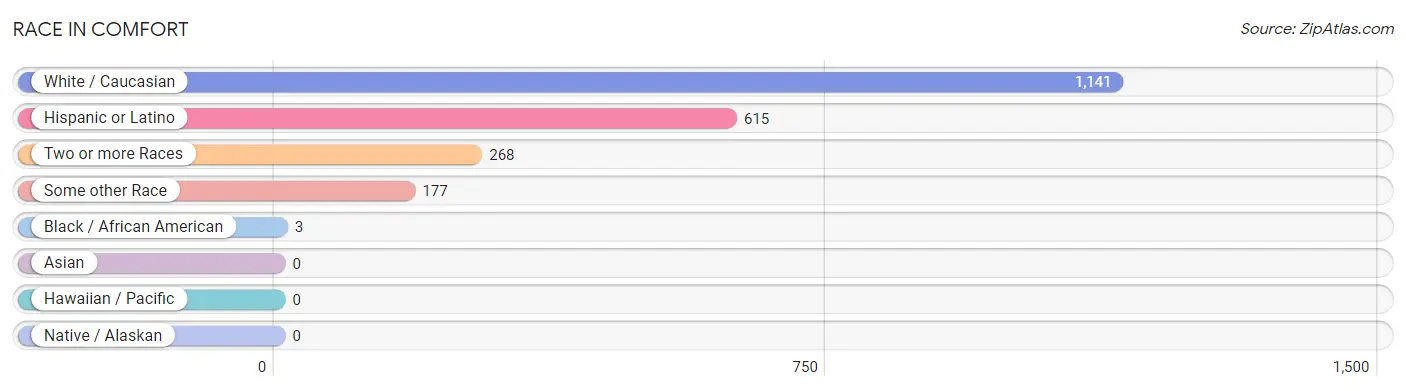
| Race | # Population | % Population |
| Asian | 0 | 0.0% |
| Black / African American | 3 | 0.2% |
| Hawaiian / Pacific | 0 | 0.0% |
| Hispanic or Latino | 615 | 38.7% |
| Native / Alaskan | 0 | 0.0% |
| White / Caucasian | 1,141 | 71.8% |
| Two or more Races | 268 | 16.9% |
| Some other Race | 177 | 11.1% |
| Total | 1,589 | 100.0% |
Ancestry in Comfort
The most populous ancestries reported in Comfort are Mexican (603 | 38.0%), German (533 | 33.5%), English (196 | 12.3%), Irish (184 | 11.6%), and Scottish (113 | 7.1%), together accounting for 102.5% of all Comfort residents.
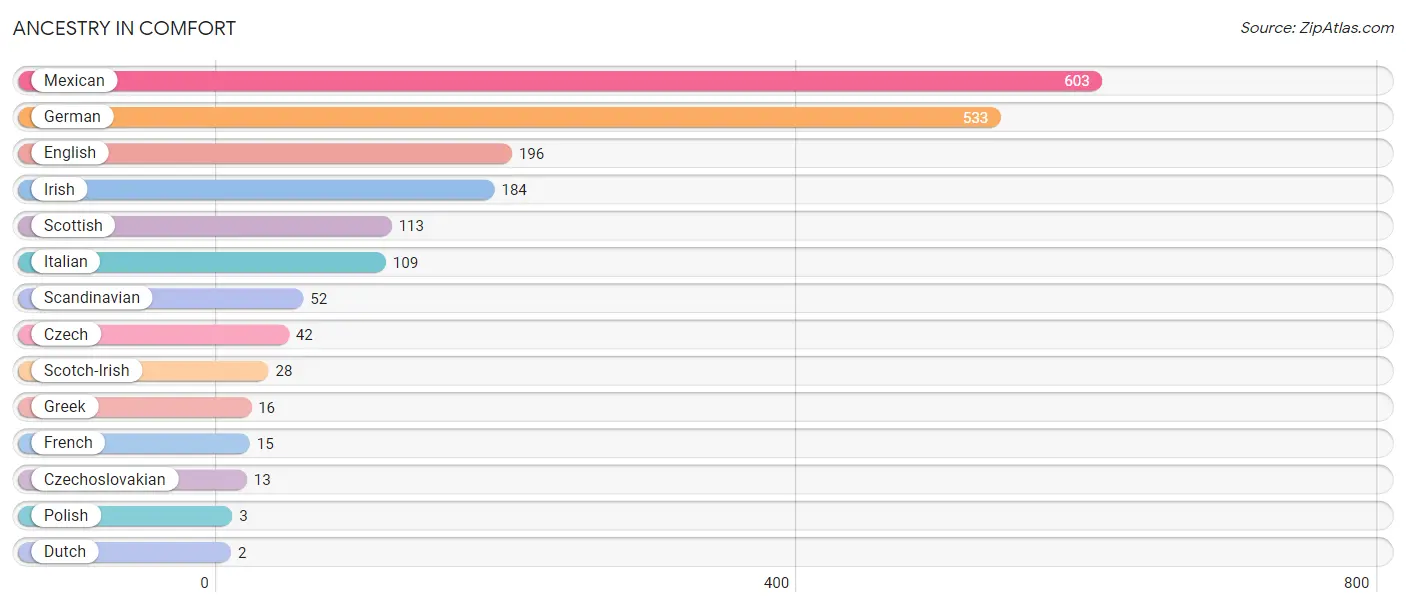
| Ancestry | # Population | % Population |
| Czech | 42 | 2.6% |
| Czechoslovakian | 13 | 0.8% |
| Dutch | 2 | 0.1% |
| English | 196 | 12.3% |
| French | 15 | 0.9% |
| German | 533 | 33.5% |
| Greek | 16 | 1.0% |
| Irish | 184 | 11.6% |
| Italian | 109 | 6.9% |
| Mexican | 603 | 38.0% |
| Polish | 3 | 0.2% |
| Scandinavian | 52 | 3.3% |
| Scotch-Irish | 28 | 1.8% |
| Scottish | 113 | 7.1% | View All 14 Rows |
Immigrants in Comfort
The most numerous immigrant groups reported in Comfort came from Central America (150 | 9.4%), Latin America (150 | 9.4%), Mexico (150 | 9.4%), and Canada (8 | 0.5%), together accounting for 28.8% of all Comfort residents.
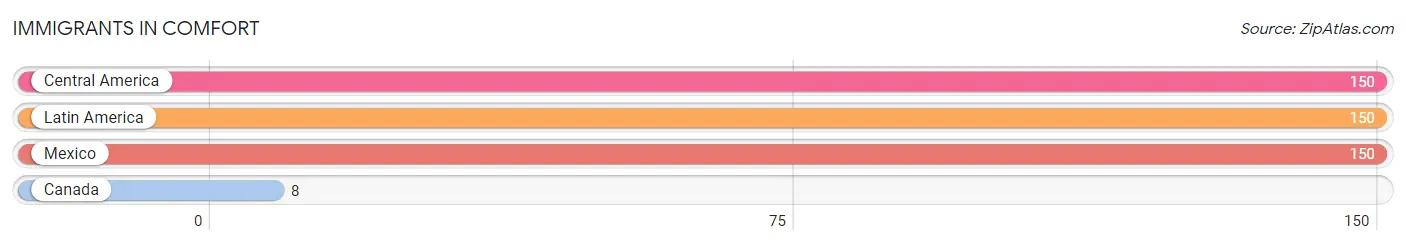
| Immigration Origin | # Population | % Population |
| Canada | 8 | 0.5% |
| Central America | 150 | 9.4% |
| Latin America | 150 | 9.4% |
| Mexico | 150 | 9.4% | View All 4 Rows |
Sex and Age in Comfort
Sex and Age in Comfort
The most populous age groups in Comfort are 25 to 29 Years (176 | 21.1%) for men and 50 to 54 Years (93 | 12.3%) for women.
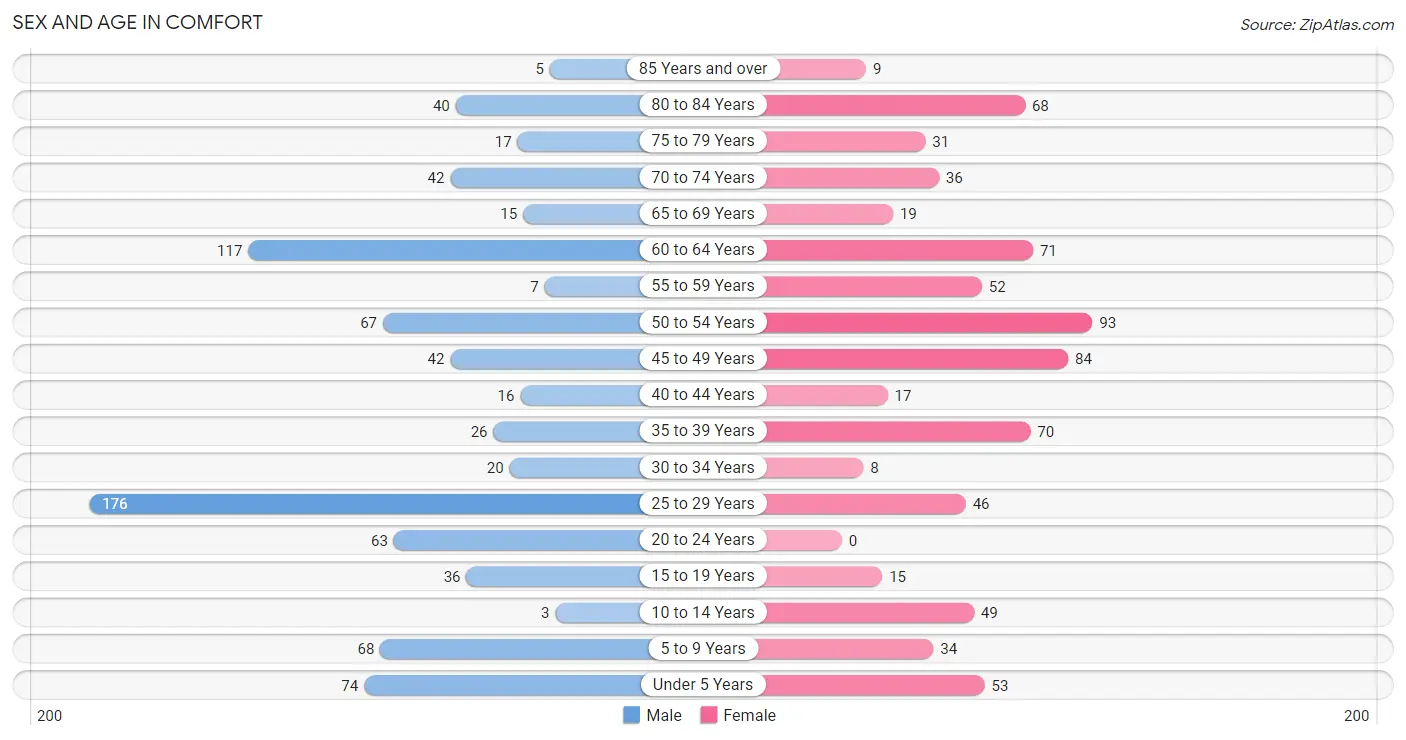
| Age Bracket | Male | Female |
| Under 5 Years | 74 (8.9%) | 53 (7.0%) |
| 5 to 9 Years | 68 (8.2%) | 34 (4.5%) |
| 10 to 14 Years | 3 (0.4%) | 49 (6.5%) |
| 15 to 19 Years | 36 (4.3%) | 15 (2.0%) |
| 20 to 24 Years | 63 (7.5%) | 0 (0.0%) |
| 25 to 29 Years | 176 (21.1%) | 46 (6.1%) |
| 30 to 34 Years | 20 (2.4%) | 8 (1.1%) |
| 35 to 39 Years | 26 (3.1%) | 70 (9.3%) |
| 40 to 44 Years | 16 (1.9%) | 17 (2.2%) |
| 45 to 49 Years | 42 (5.0%) | 84 (11.1%) |
| 50 to 54 Years | 67 (8.0%) | 93 (12.3%) |
| 55 to 59 Years | 7 (0.8%) | 52 (6.9%) |
| 60 to 64 Years | 117 (14.0%) | 71 (9.4%) |
| 65 to 69 Years | 15 (1.8%) | 19 (2.5%) |
| 70 to 74 Years | 42 (5.0%) | 36 (4.8%) |
| 75 to 79 Years | 17 (2.0%) | 31 (4.1%) |
| 80 to 84 Years | 40 (4.8%) | 68 (9.0%) |
| 85 Years and over | 5 (0.6%) | 9 (1.2%) |
| Total | 834 (100.0%) | 755 (100.0%) |
Families and Households in Comfort
Median Family Size in Comfort
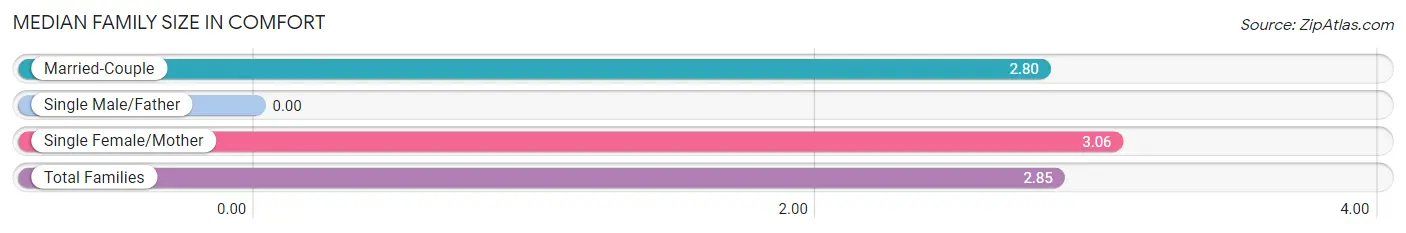
| Family Type | # Families | Family Size |
| Married-Couple | 343 (82.9%) | 2.80 |
| Single Male/Father | 0 (0.0%) | - |
| Single Female/Mother | 71 (17.2%) | 3.06 |
| Total Families | 414 (100.0%) | 2.85 |
Median Household Size in Comfort
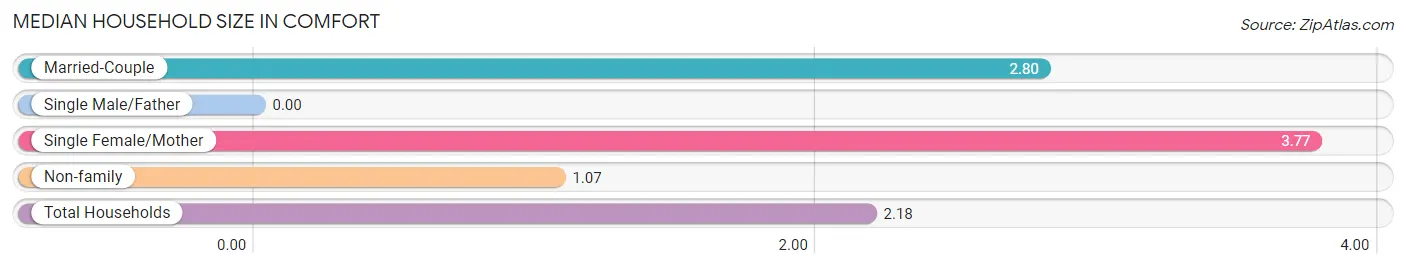
| Household Type | # Households | Household Size |
| Married-Couple | 343 (48.2%) | 2.80 |
| Single Male/Father | 0 (0.0%) | - |
| Single Female/Mother | 71 (10.0%) | 3.77 |
| Non-family | 297 (41.8%) | 1.07 |
| Total Households | 711 (100.0%) | 2.18 |
Household Size by Marriage Status in Comfort
Out of a total of 711 households in Comfort, 414 (58.2%) are family households, while 297 (41.8%) are nonfamily households. The most numerous type of family households are 3-person households, comprising 146, and the most common type of nonfamily households are 1-person households, comprising 275.
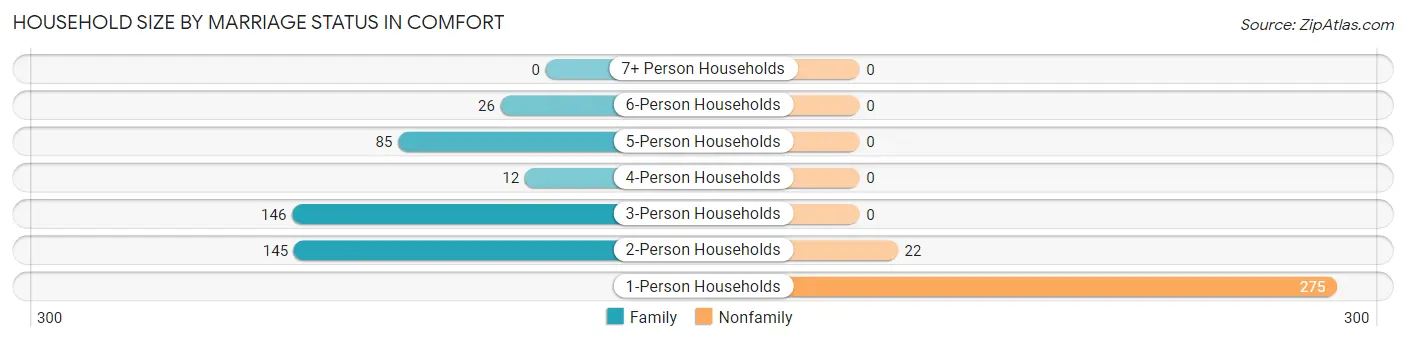
| Household Size | Family Households | Nonfamily Households |
| 1-Person Households | - | 275 (38.7%) |
| 2-Person Households | 145 (20.4%) | 22 (3.1%) |
| 3-Person Households | 146 (20.5%) | 0 (0.0%) |
| 4-Person Households | 12 (1.7%) | 0 (0.0%) |
| 5-Person Households | 85 (11.9%) | 0 (0.0%) |
| 6-Person Households | 26 (3.7%) | 0 (0.0%) |
| 7+ Person Households | 0 (0.0%) | 0 (0.0%) |
| Total | 414 (58.2%) | 297 (41.8%) |
Female Fertility in Comfort
Fertility by Age in Comfort
Average fertility rate in Comfort is 52.0 births per 1,000 women. Women in the age bracket of 35 to 50 years have the highest fertility rate with 65.0 births per 1,000 women. Women in the age bracket of 35 to 50 years acount for 100.0% of all women with births.
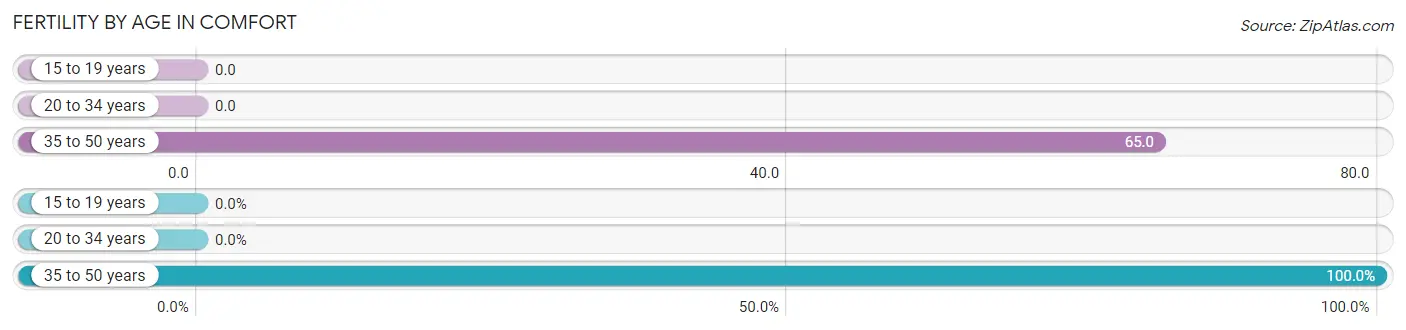
| Age Bracket | Women with Births | Births / 1,000 Women |
| 15 to 19 years | 0 (0.0%) | 0.0 |
| 20 to 34 years | 0 (0.0%) | 0.0 |
| 35 to 50 years | 17 (100.0%) | 65.0 |
| Total | 17 (100.0%) | 52.0 |
Fertility by Age by Marriage Status in Comfort
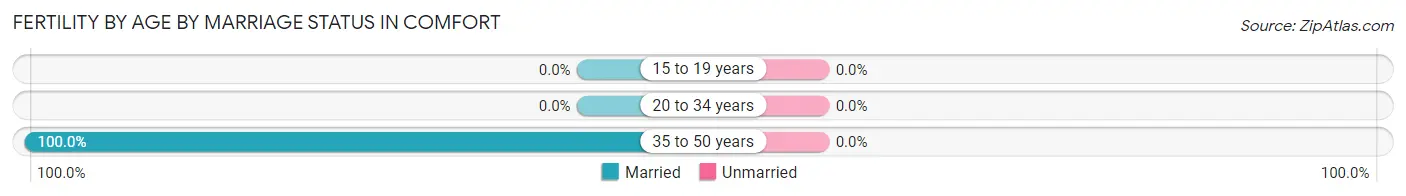
| Age Bracket | Married | Unmarried |
| 15 to 19 years | 0 (0.0%) | 0 (0.0%) |
| 20 to 34 years | 0 (0.0%) | 0 (0.0%) |
| 35 to 50 years | 17 (100.0%) | 0 (0.0%) |
| Total | 17 (100.0%) | 0 (0.0%) |
Fertility by Education in Comfort
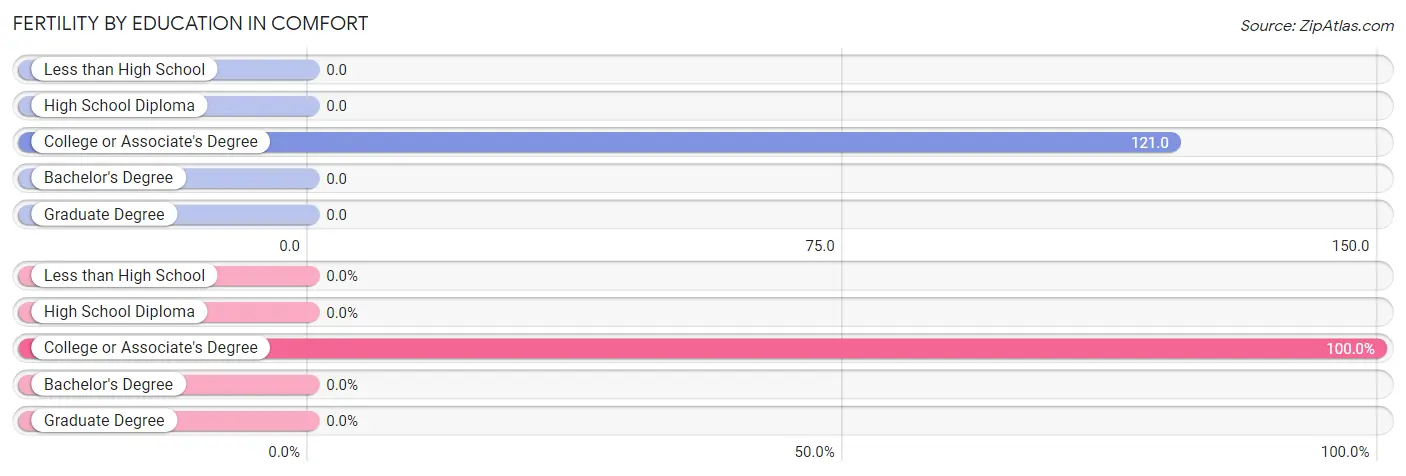
| Educational Attainment | Women with Births | Births / 1,000 Women |
| Less than High School | 0 (0.0%) | 0.0 |
| High School Diploma | 0 (0.0%) | 0.0 |
| College or Associate's Degree | 17 (100.0%) | 121.0 |
| Bachelor's Degree | 0 (0.0%) | 0.0 |
| Graduate Degree | 0 (0.0%) | 0.0 |
| Total | 17 (100.0%) | 52.0 |
Fertility by Education by Marriage Status in Comfort
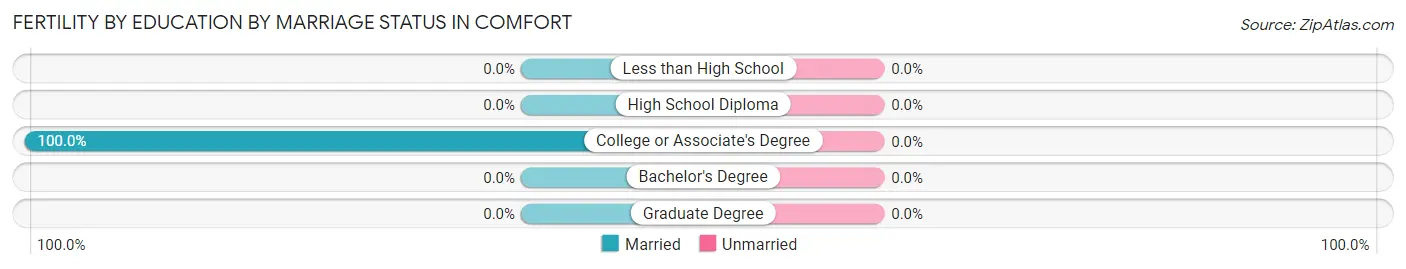
| Educational Attainment | Married | Unmarried |
| Less than High School | 0 (0.0%) | 0 (0.0%) |
| High School Diploma | 0 (0.0%) | 0 (0.0%) |
| College or Associate's Degree | 17 (100.0%) | 0 (0.0%) |
| Bachelor's Degree | 0 (0.0%) | 0 (0.0%) |
| Graduate Degree | 0 (0.0%) | 0 (0.0%) |
| Total | 17 (100.0%) | 0 (0.0%) |
Employment Characteristics in Comfort
Employment by Class of Employer in Comfort
Among the 963 employed individuals in Comfort, private company employees (740 | 76.8%), self-employed (not incorporated) (138 | 14.3%), and self-employed (incorporated) (42 | 4.4%) make up the most common classes of employment.
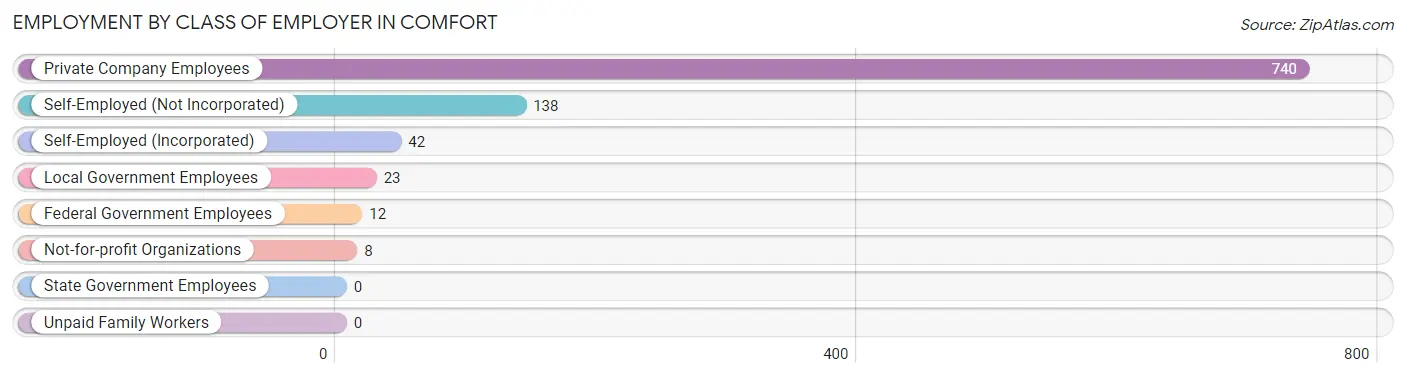
| Employer Class | # Employees | % Employees |
| Private Company Employees | 740 | 76.8% |
| Self-Employed (Incorporated) | 42 | 4.4% |
| Self-Employed (Not Incorporated) | 138 | 14.3% |
| Not-for-profit Organizations | 8 | 0.8% |
| Local Government Employees | 23 | 2.4% |
| State Government Employees | 0 | 0.0% |
| Federal Government Employees | 12 | 1.3% |
| Unpaid Family Workers | 0 | 0.0% |
| Total | 963 | 100.0% |
Employment Status by Age in Comfort
According to the labor force statistics for Comfort, out of the total population over 16 years of age (1,280), 81.3% or 1,041 individuals are in the labor force, with 7.4% or 77 of them unemployed. The age group with the highest labor force participation rate is 16 to 19 years, with 100.0% or 23 individuals in the labor force. Within the labor force, the 45 to 54 years age range has the highest percentage of unemployed individuals, with 28.5% or 77 of them being unemployed.
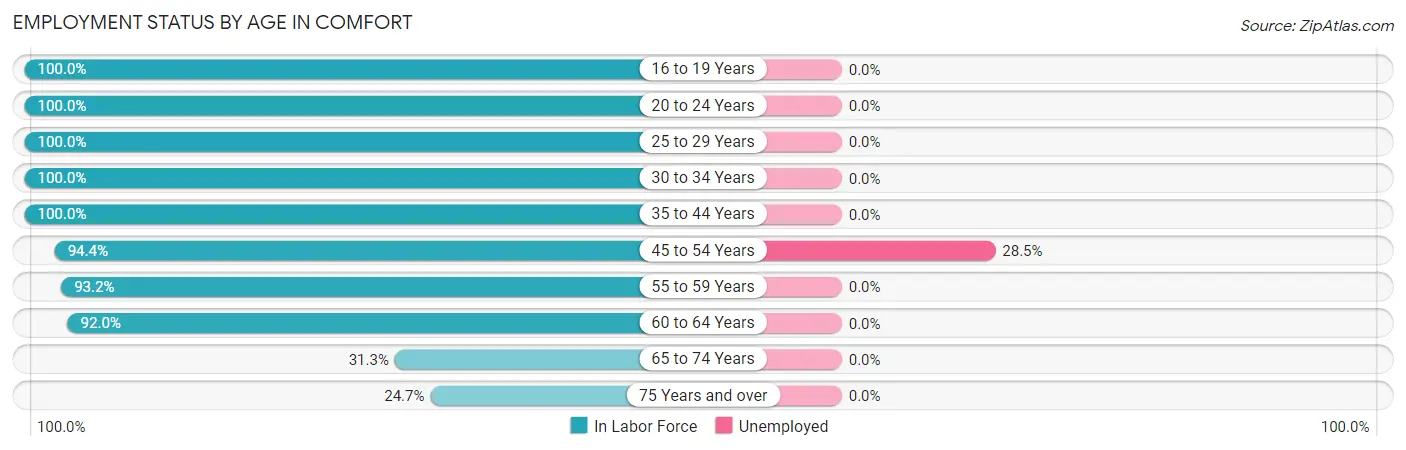
| Age Bracket | In Labor Force | Unemployed |
| 16 to 19 Years | 23 (100.0%) | 0 (0.0%) |
| 20 to 24 Years | 63 (100.0%) | 0 (0.0%) |
| 25 to 29 Years | 222 (100.0%) | 0 (0.0%) |
| 30 to 34 Years | 28 (100.0%) | 0 (0.0%) |
| 35 to 44 Years | 129 (100.0%) | 0 (0.0%) |
| 45 to 54 Years | 270 (94.4%) | 77 (28.5%) |
| 55 to 59 Years | 55 (93.2%) | 0 (0.0%) |
| 60 to 64 Years | 173 (92.0%) | 0 (0.0%) |
| 65 to 74 Years | 35 (31.3%) | 0 (0.0%) |
| 75 Years and over | 42 (24.7%) | 0 (0.0%) |
| Total | 1,041 (81.3%) | 77 (7.4%) |
Employment Status by Educational Attainment in Comfort
According to labor force statistics for Comfort, 96.2% of individuals (877) out of the total population between 25 and 64 years of age (912) are in the labor force, with 8.8% or 77 of them being unemployed. The group with the highest labor force participation rate are those with the educational attainment of college / associate degree, with 99.0% or 412 individuals in the labor force. Within the labor force, individuals with college / associate degree education have the highest percentage of unemployment, with 18.7% or 77 of them being unemployed.
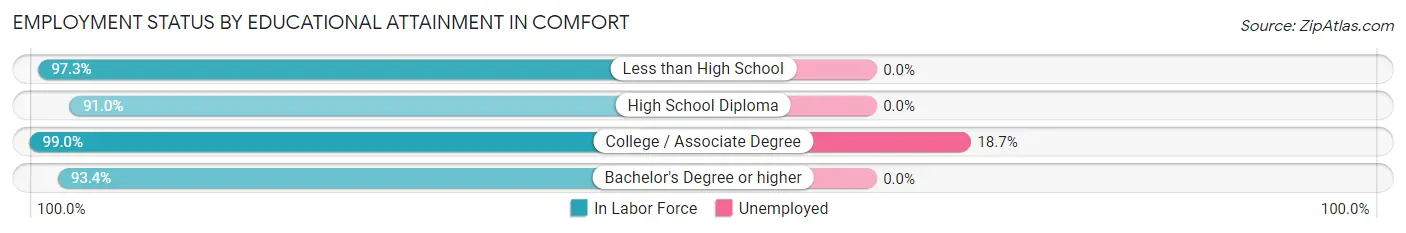
| Educational Attainment | In Labor Force | Unemployed |
| Less than High School | 145 (97.3%) | 0 (0.0%) |
| High School Diploma | 151 (91.0%) | 0 (0.0%) |
| College / Associate Degree | 412 (99.0%) | 78 (18.7%) |
| Bachelor's Degree or higher | 169 (93.4%) | 0 (0.0%) |
| Total | 877 (96.2%) | 80 (8.8%) |
Employment Occupations by Sex in Comfort
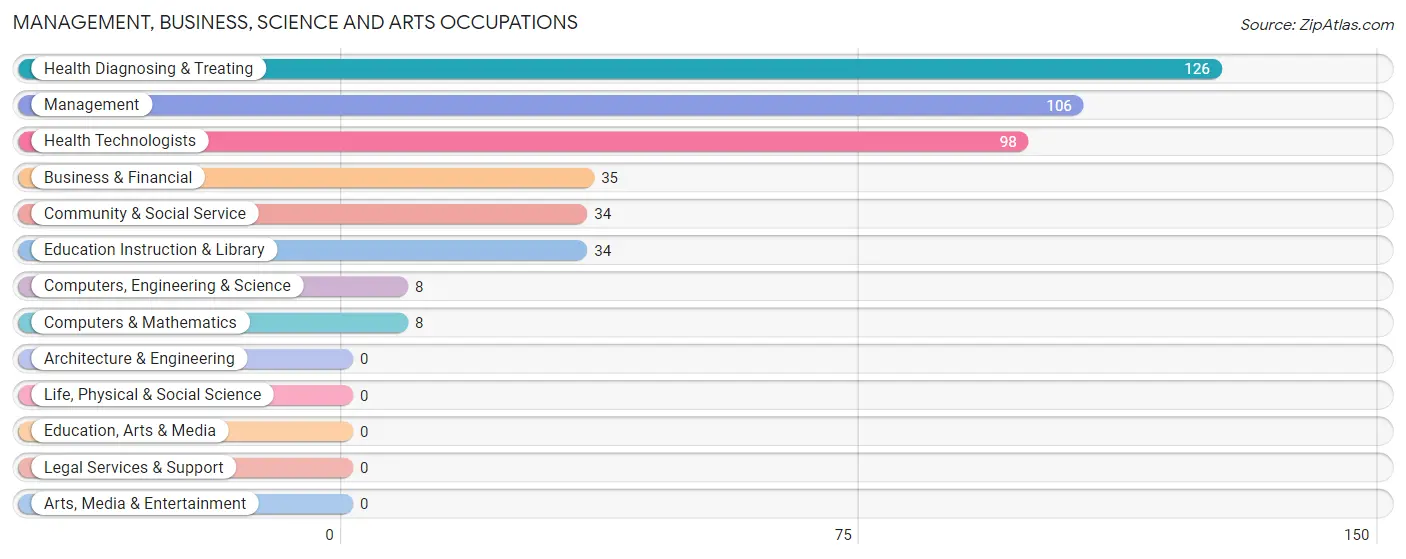
Management, Business, Science and Arts Occupations
The most common Management, Business, Science and Arts occupations in Comfort are Health Diagnosing & Treating (126 | 13.1%), Management (106 | 11.0%), Health Technologists (98 | 10.2%), Business & Financial (35 | 3.6%), and Community & Social Service (34 | 3.5%).
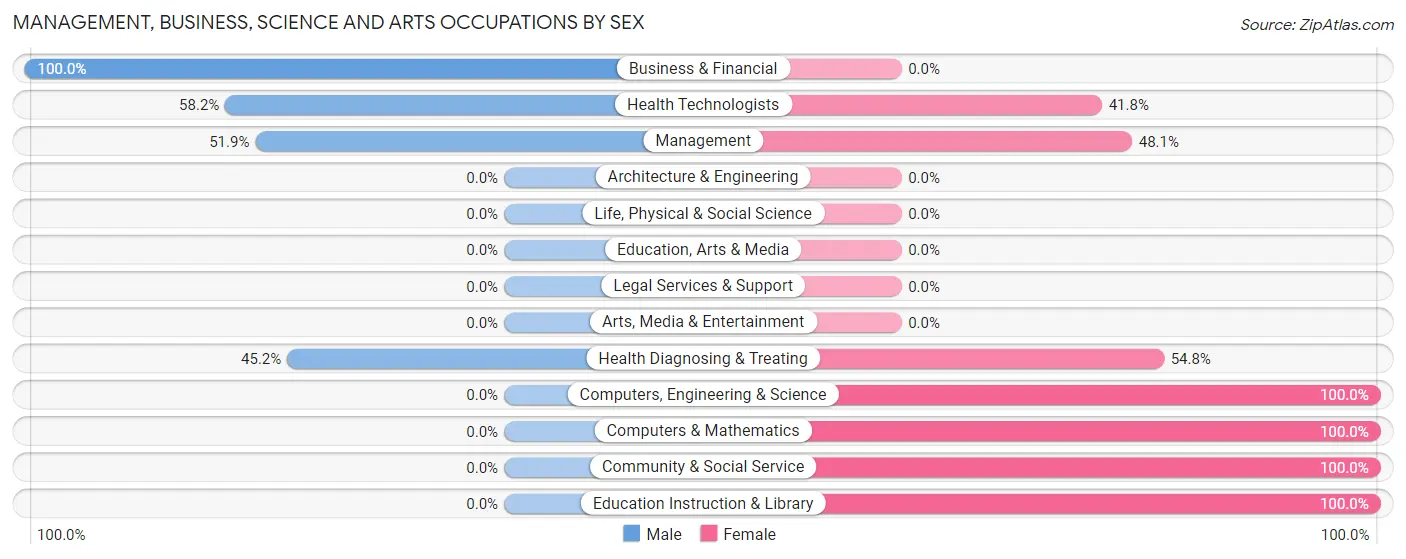
Management, Business, Science and Arts Occupations by Sex
Within the Management, Business, Science and Arts occupations in Comfort, the most male-oriented occupations are Business & Financial (100.0%), Health Technologists (58.2%), and Management (51.9%), while the most female-oriented occupations are Computers, Engineering & Science (100.0%), Computers & Mathematics (100.0%), and Community & Social Service (100.0%).
| Occupation | Male | Female |
| Management | 55 (51.9%) | 51 (48.1%) |
| Business & Financial | 35 (100.0%) | 0 (0.0%) |
| Computers, Engineering & Science | 0 (0.0%) | 8 (100.0%) |
| Computers & Mathematics | 0 (0.0%) | 8 (100.0%) |
| Architecture & Engineering | 0 (0.0%) | 0 (0.0%) |
| Life, Physical & Social Science | 0 (0.0%) | 0 (0.0%) |
| Community & Social Service | 0 (0.0%) | 34 (100.0%) |
| Education, Arts & Media | 0 (0.0%) | 0 (0.0%) |
| Legal Services & Support | 0 (0.0%) | 0 (0.0%) |
| Education Instruction & Library | 0 (0.0%) | 34 (100.0%) |
| Arts, Media & Entertainment | 0 (0.0%) | 0 (0.0%) |
| Health Diagnosing & Treating | 57 (45.2%) | 69 (54.8%) |
| Health Technologists | 57 (58.2%) | 41 (41.8%) |
| Total (Category) | 147 (47.6%) | 162 (52.4%) |
| Total (Overall) | 580 (60.2%) | 383 (39.8%) |
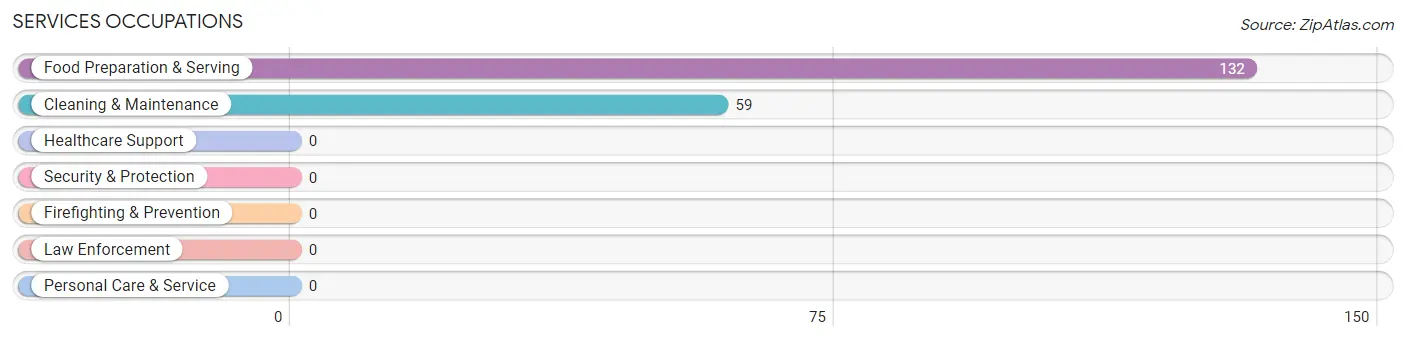
Services Occupations
The most common Services occupations in Comfort are Food Preparation & Serving (132 | 13.7%), and Cleaning & Maintenance (59 | 6.1%).
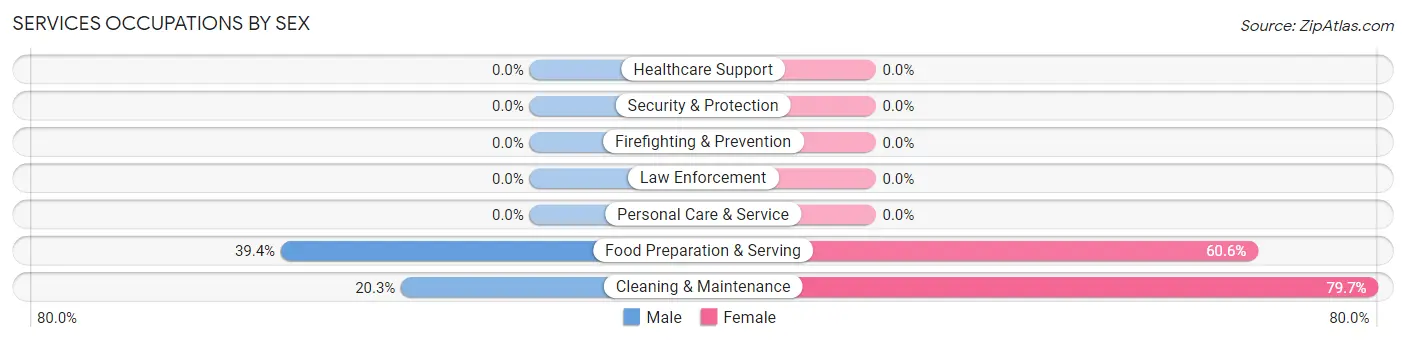
Services Occupations by Sex
Within the Services occupations in Comfort, the most male-oriented occupations are Food Preparation & Serving (39.4%), and Cleaning & Maintenance (20.3%), while the most female-oriented occupations are Cleaning & Maintenance (79.7%), and Food Preparation & Serving (60.6%).
| Occupation | Male | Female |
| Healthcare Support | 0 (0.0%) | 0 (0.0%) |
| Security & Protection | 0 (0.0%) | 0 (0.0%) |
| Firefighting & Prevention | 0 (0.0%) | 0 (0.0%) |
| Law Enforcement | 0 (0.0%) | 0 (0.0%) |
| Food Preparation & Serving | 52 (39.4%) | 80 (60.6%) |
| Cleaning & Maintenance | 12 (20.3%) | 47 (79.7%) |
| Personal Care & Service | 0 (0.0%) | 0 (0.0%) |
| Total (Category) | 64 (33.5%) | 127 (66.5%) |
| Total (Overall) | 580 (60.2%) | 383 (39.8%) |
Sales and Office Occupations
The most common Sales and Office occupations in Comfort are Sales & Related (104 | 10.8%), and Office & Administration (81 | 8.4%).
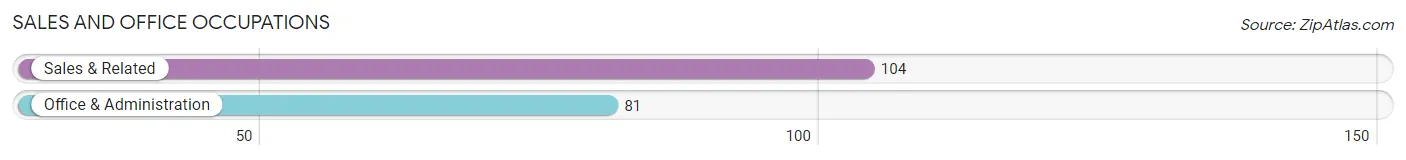
Sales and Office Occupations by Sex
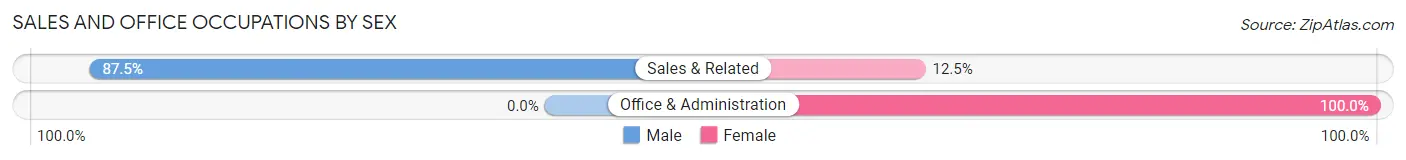
| Occupation | Male | Female |
| Sales & Related | 91 (87.5%) | 13 (12.5%) |
| Office & Administration | 0 (0.0%) | 81 (100.0%) |
| Total (Category) | 91 (49.2%) | 94 (50.8%) |
| Total (Overall) | 580 (60.2%) | 383 (39.8%) |
Natural Resources, Construction and Maintenance Occupations
The most common Natural Resources, Construction and Maintenance occupations in Comfort are Construction & Extraction (143 | 14.8%), and Installation, Maintenance & Repair (98 | 10.2%).
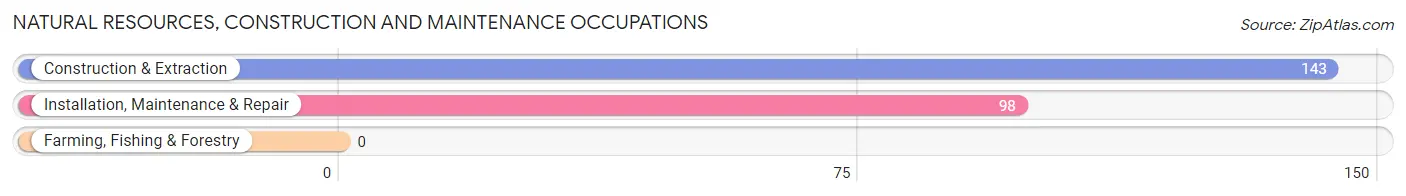
Natural Resources, Construction and Maintenance Occupations by Sex
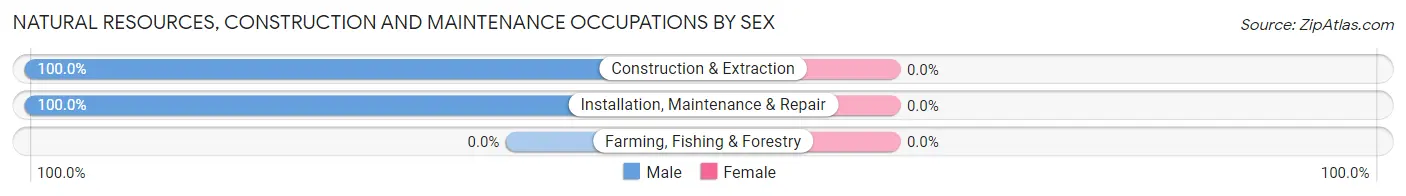
| Occupation | Male | Female |
| Farming, Fishing & Forestry | 0 (0.0%) | 0 (0.0%) |
| Construction & Extraction | 143 (100.0%) | 0 (0.0%) |
| Installation, Maintenance & Repair | 98 (100.0%) | 0 (0.0%) |
| Total (Category) | 241 (100.0%) | 0 (0.0%) |
| Total (Overall) | 580 (60.2%) | 383 (39.8%) |
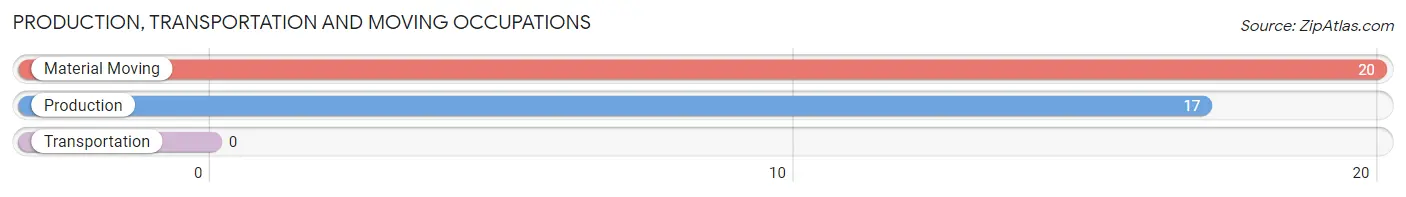
Production, Transportation and Moving Occupations
The most common Production, Transportation and Moving occupations in Comfort are Material Moving (20 | 2.1%), and Production (17 | 1.8%).
Production, Transportation and Moving Occupations by Sex
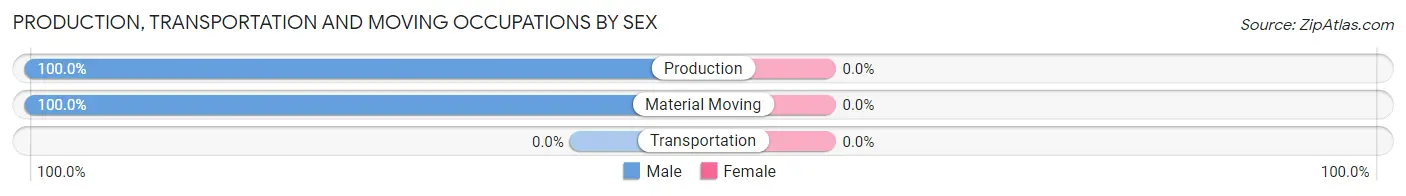
| Occupation | Male | Female |
| Production | 17 (100.0%) | 0 (0.0%) |
| Transportation | 0 (0.0%) | 0 (0.0%) |
| Material Moving | 20 (100.0%) | 0 (0.0%) |
| Total (Category) | 37 (100.0%) | 0 (0.0%) |
| Total (Overall) | 580 (60.2%) | 383 (39.8%) |
Employment Industries by Sex in Comfort
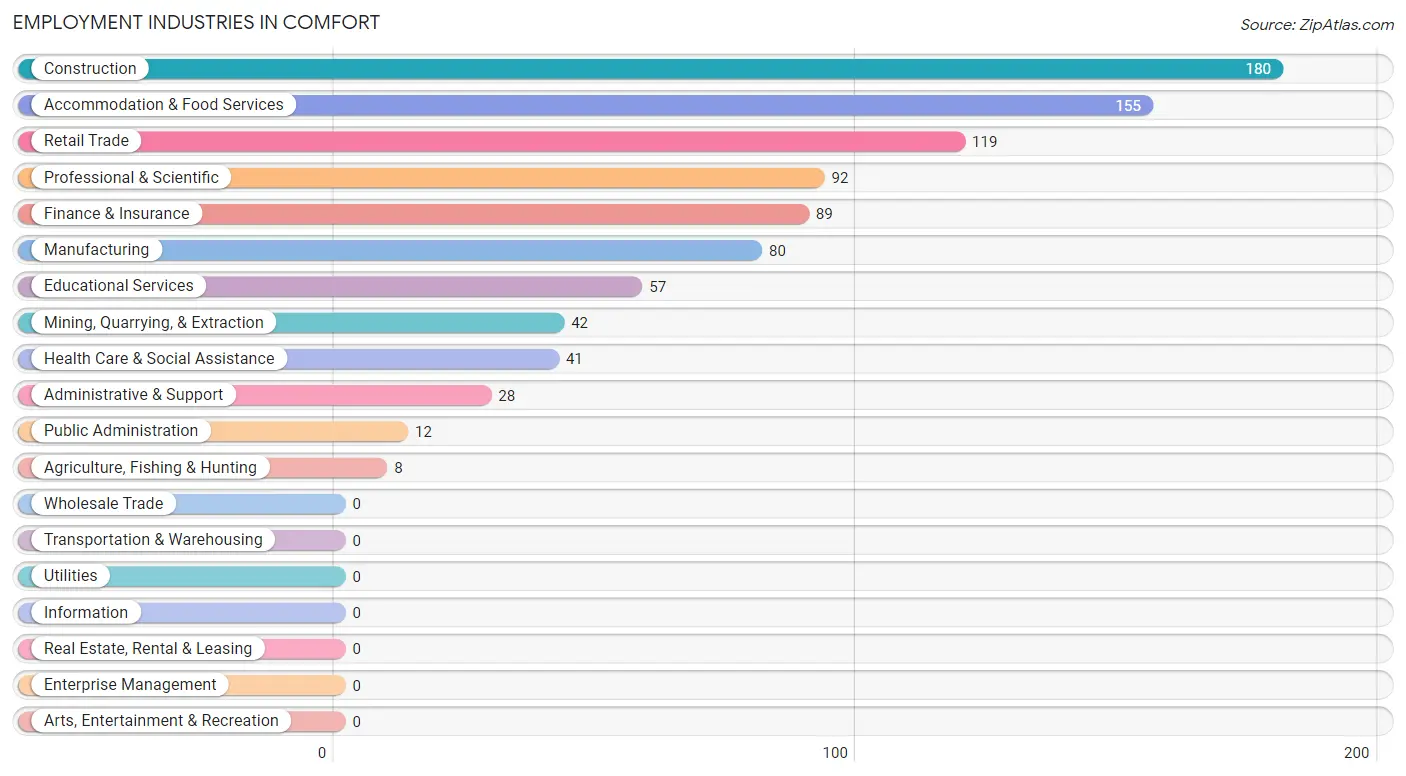
Employment Industries in Comfort
The major employment industries in Comfort include Construction (180 | 18.7%), Accommodation & Food Services (155 | 16.1%), Retail Trade (119 | 12.4%), Professional & Scientific (92 | 9.6%), and Finance & Insurance (89 | 9.2%).
Employment Industries by Sex in Comfort
The Comfort industries that see more men than women are Agriculture, Fishing & Hunting (100.0%), Mining, Quarrying, & Extraction (100.0%), and Professional & Scientific (100.0%), whereas the industries that tend to have a higher number of women are Finance & Insurance (100.0%), Administrative & Support (100.0%), and Educational Services (100.0%).
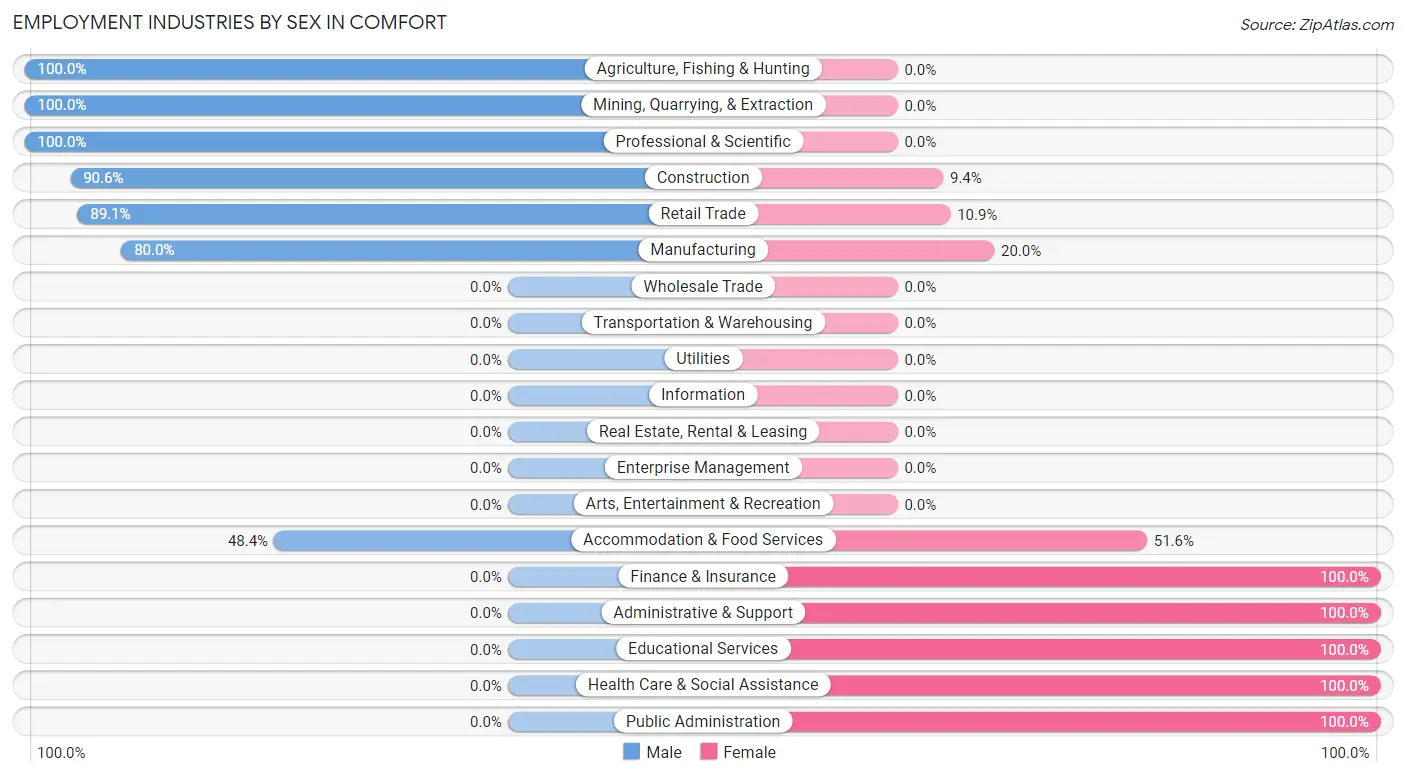
| Industry | Male | Female |
| Agriculture, Fishing & Hunting | 8 (100.0%) | 0 (0.0%) |
| Mining, Quarrying, & Extraction | 42 (100.0%) | 0 (0.0%) |
| Construction | 163 (90.6%) | 17 (9.4%) |
| Manufacturing | 64 (80.0%) | 16 (20.0%) |
| Wholesale Trade | 0 (0.0%) | 0 (0.0%) |
| Retail Trade | 106 (89.1%) | 13 (10.9%) |
| Transportation & Warehousing | 0 (0.0%) | 0 (0.0%) |
| Utilities | 0 (0.0%) | 0 (0.0%) |
| Information | 0 (0.0%) | 0 (0.0%) |
| Finance & Insurance | 0 (0.0%) | 89 (100.0%) |
| Real Estate, Rental & Leasing | 0 (0.0%) | 0 (0.0%) |
| Professional & Scientific | 92 (100.0%) | 0 (0.0%) |
| Enterprise Management | 0 (0.0%) | 0 (0.0%) |
| Administrative & Support | 0 (0.0%) | 28 (100.0%) |
| Educational Services | 0 (0.0%) | 57 (100.0%) |
| Health Care & Social Assistance | 0 (0.0%) | 41 (100.0%) |
| Arts, Entertainment & Recreation | 0 (0.0%) | 0 (0.0%) |
| Accommodation & Food Services | 75 (48.4%) | 80 (51.6%) |
| Public Administration | 0 (0.0%) | 12 (100.0%) |
| Total | 580 (60.2%) | 383 (39.8%) |
Education in Comfort
School Enrollment in Comfort
The most common levels of schooling among the 246 students in Comfort are elementary school (102 | 41.5%), middle school (52 | 21.1%), and high school (51 | 20.7%).
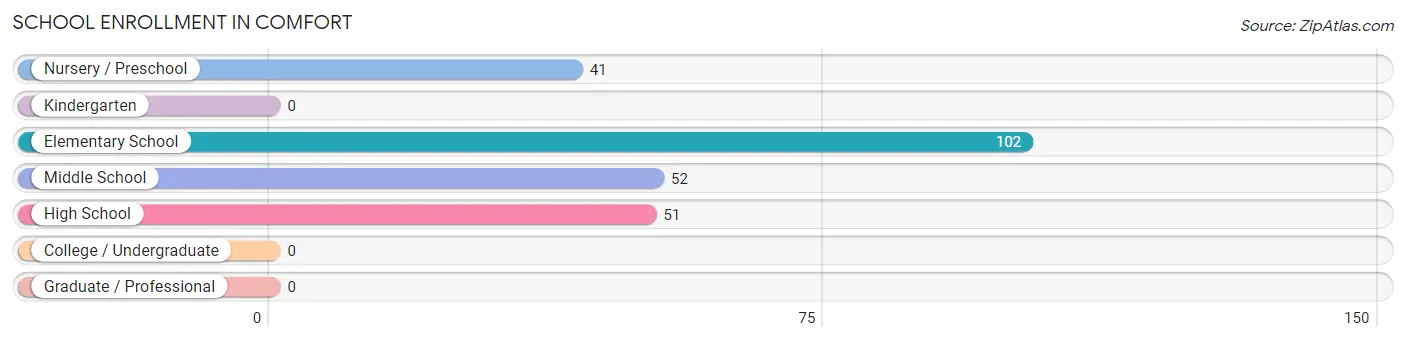
| School Level | # Students | % Students |
| Nursery / Preschool | 41 | 16.7% |
| Kindergarten | 0 | 0.0% |
| Elementary School | 102 | 41.5% |
| Middle School | 52 | 21.1% |
| High School | 51 | 20.7% |
| College / Undergraduate | 0 | 0.0% |
| Graduate / Professional | 0 | 0.0% |
| Total | 246 | 100.0% |
School Enrollment by Age by Funding Source in Comfort
Out of a total of 246 students who are enrolled in schools in Comfort, 66 (26.8%) attend a private institution, while the remaining 180 (73.2%) are enrolled in public schools. The age group of 3 to 4 year olds has the highest likelihood of being enrolled in private schools, with 18 (43.9% in the age bracket) enrolled. Conversely, the age group of 10 to 14 year olds has the lowest likelihood of being enrolled in a private school, with 52 (100.0% in the age bracket) attending a public institution.
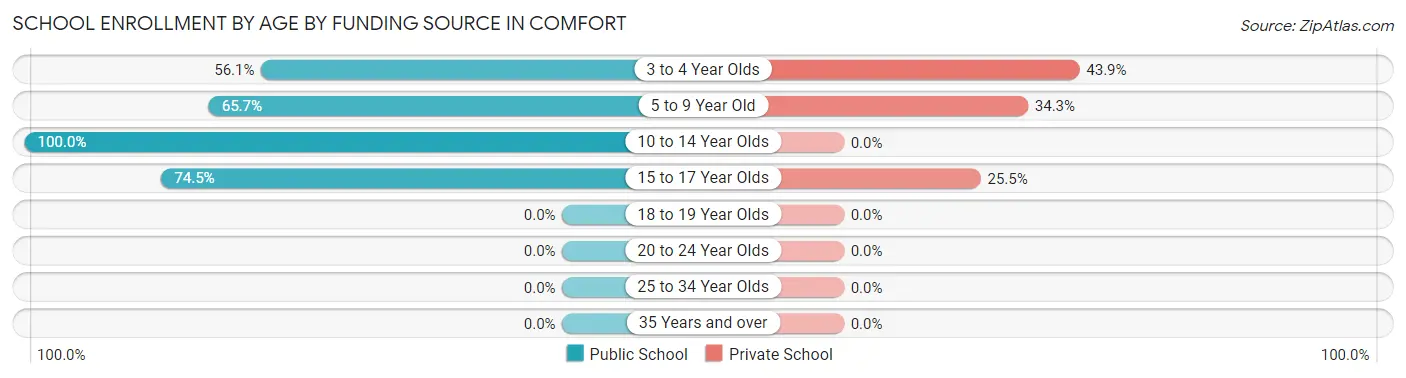
| Age Bracket | Public School | Private School |
| 3 to 4 Year Olds | 23 (56.1%) | 18 (43.9%) |
| 5 to 9 Year Old | 67 (65.7%) | 35 (34.3%) |
| 10 to 14 Year Olds | 52 (100.0%) | 0 (0.0%) |
| 15 to 17 Year Olds | 38 (74.5%) | 13 (25.5%) |
| 18 to 19 Year Olds | 0 (0.0%) | 0 (0.0%) |
| 20 to 24 Year Olds | 0 (0.0%) | 0 (0.0%) |
| 25 to 34 Year Olds | 0 (0.0%) | 0 (0.0%) |
| 35 Years and over | 0 (0.0%) | 0 (0.0%) |
| Total | 180 (73.2%) | 66 (26.8%) |
Educational Attainment by Field of Study in Comfort
Bio, nature & agricultural (57 | 21.0%), psychology (41 | 15.1%), science & technology (41 | 15.1%), education (28 | 10.3%), and literature & languages (28 | 10.3%) are the most common fields of study among 272 individuals in Comfort who have obtained a bachelor's degree or higher.
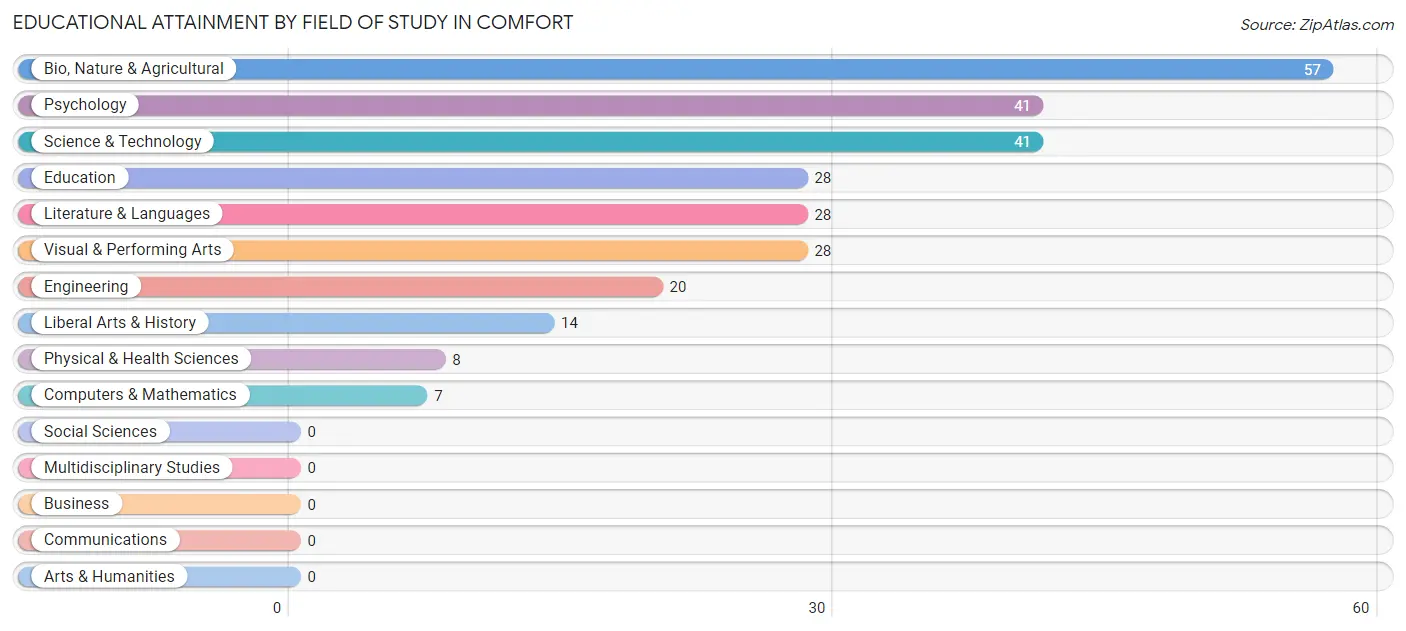
| Field of Study | # Graduates | % Graduates |
| Computers & Mathematics | 7 | 2.6% |
| Bio, Nature & Agricultural | 57 | 21.0% |
| Physical & Health Sciences | 8 | 2.9% |
| Psychology | 41 | 15.1% |
| Social Sciences | 0 | 0.0% |
| Engineering | 20 | 7.3% |
| Multidisciplinary Studies | 0 | 0.0% |
| Science & Technology | 41 | 15.1% |
| Business | 0 | 0.0% |
| Education | 28 | 10.3% |
| Literature & Languages | 28 | 10.3% |
| Liberal Arts & History | 14 | 5.1% |
| Visual & Performing Arts | 28 | 10.3% |
| Communications | 0 | 0.0% |
| Arts & Humanities | 0 | 0.0% |
| Total | 272 | 100.0% |
Transportation & Commute in Comfort
Vehicle Availability by Sex in Comfort
The most prevalent vehicle ownership categories in Comfort are males with 2 vehicles (177, accounting for 30.5%) and females with 2 vehicles (190, making up 46.2%).
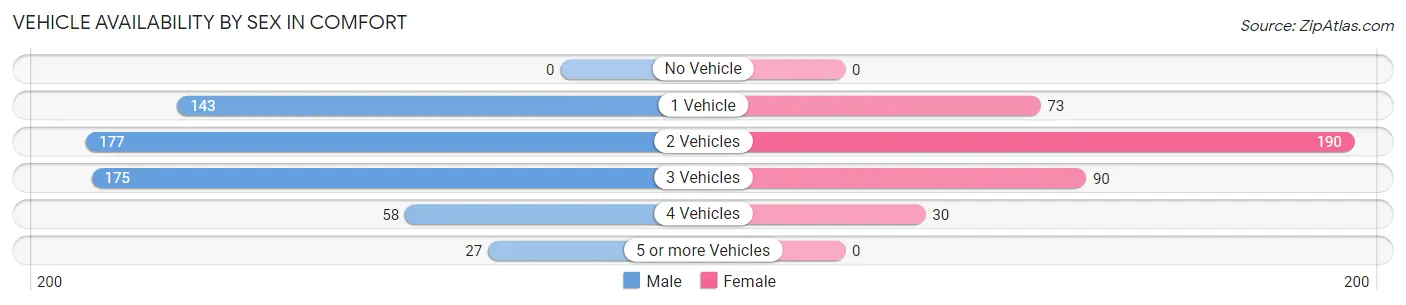
| Vehicles Available | Male | Female |
| No Vehicle | 0 (0.0%) | 0 (0.0%) |
| 1 Vehicle | 143 (24.7%) | 73 (19.1%) |
| 2 Vehicles | 177 (30.5%) | 190 (49.6%) |
| 3 Vehicles | 175 (30.2%) | 90 (23.5%) |
| 4 Vehicles | 58 (10.0%) | 30 (7.8%) |
| 5 or more Vehicles | 27 (4.7%) | 0 (0.0%) |
| Total | 580 (100.0%) | 383 (100.0%) |
Commute Time in Comfort
The most frequently occuring commute durations in Comfort are 30 to 34 minutes (330 commuters, 38.2%), 10 to 14 minutes (120 commuters, 13.9%), and less than 5 minutes (81 commuters, 9.4%).
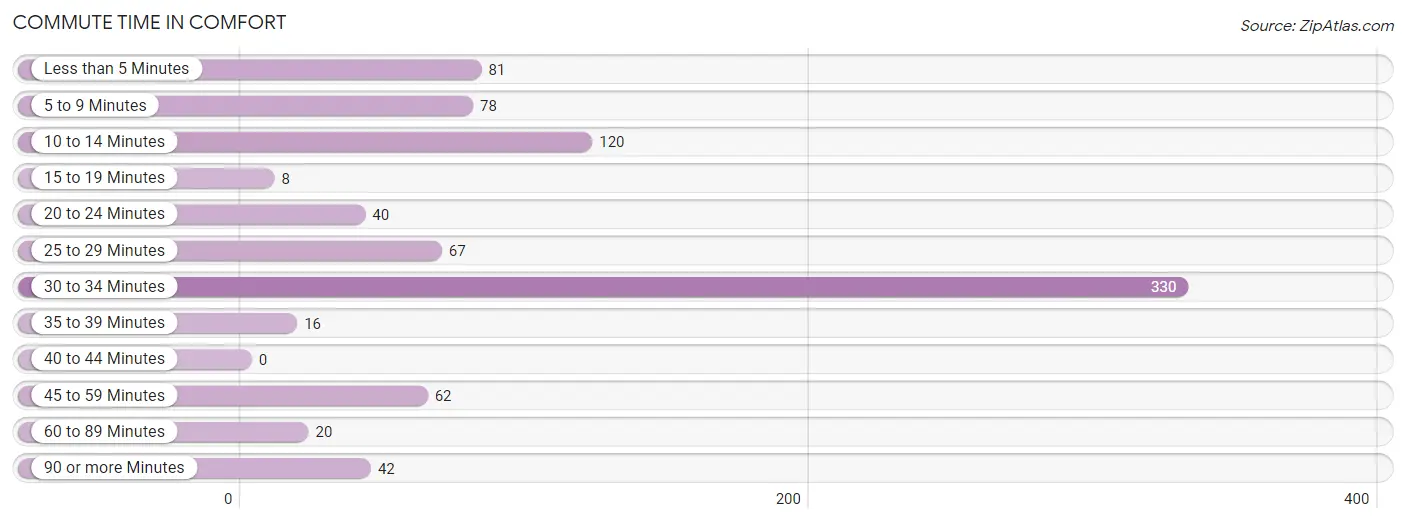
| Commute Time | # Commuters | % Commuters |
| Less than 5 Minutes | 81 | 9.4% |
| 5 to 9 Minutes | 78 | 9.0% |
| 10 to 14 Minutes | 120 | 13.9% |
| 15 to 19 Minutes | 8 | 0.9% |
| 20 to 24 Minutes | 40 | 4.6% |
| 25 to 29 Minutes | 67 | 7.7% |
| 30 to 34 Minutes | 330 | 38.2% |
| 35 to 39 Minutes | 16 | 1.8% |
| 40 to 44 Minutes | 0 | 0.0% |
| 45 to 59 Minutes | 62 | 7.2% |
| 60 to 89 Minutes | 20 | 2.3% |
| 90 or more Minutes | 42 | 4.9% |
Commute Time by Sex in Comfort
The most common commute times in Comfort are 30 to 34 minutes (266 commuters, 46.5%) for males and 5 to 9 minutes (78 commuters, 26.7%) for females.
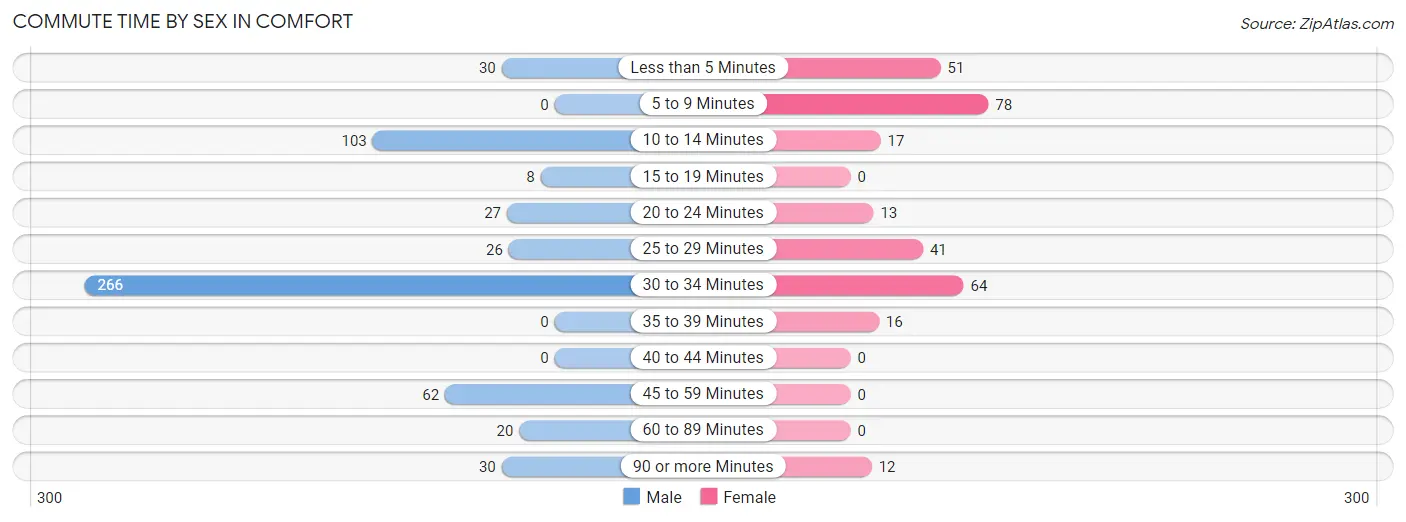
| Commute Time | Male | Female |
| Less than 5 Minutes | 30 (5.2%) | 51 (17.5%) |
| 5 to 9 Minutes | 0 (0.0%) | 78 (26.7%) |
| 10 to 14 Minutes | 103 (18.0%) | 17 (5.8%) |
| 15 to 19 Minutes | 8 (1.4%) | 0 (0.0%) |
| 20 to 24 Minutes | 27 (4.7%) | 13 (4.4%) |
| 25 to 29 Minutes | 26 (4.5%) | 41 (14.0%) |
| 30 to 34 Minutes | 266 (46.5%) | 64 (21.9%) |
| 35 to 39 Minutes | 0 (0.0%) | 16 (5.5%) |
| 40 to 44 Minutes | 0 (0.0%) | 0 (0.0%) |
| 45 to 59 Minutes | 62 (10.8%) | 0 (0.0%) |
| 60 to 89 Minutes | 20 (3.5%) | 0 (0.0%) |
| 90 or more Minutes | 30 (5.2%) | 12 (4.1%) |
Time of Departure to Work by Sex in Comfort
The most frequent times of departure to work in Comfort are 7:00 AM to 7:29 AM (171, 29.9%) for males and 7:30 AM to 7:59 AM (78, 26.7%) for females.
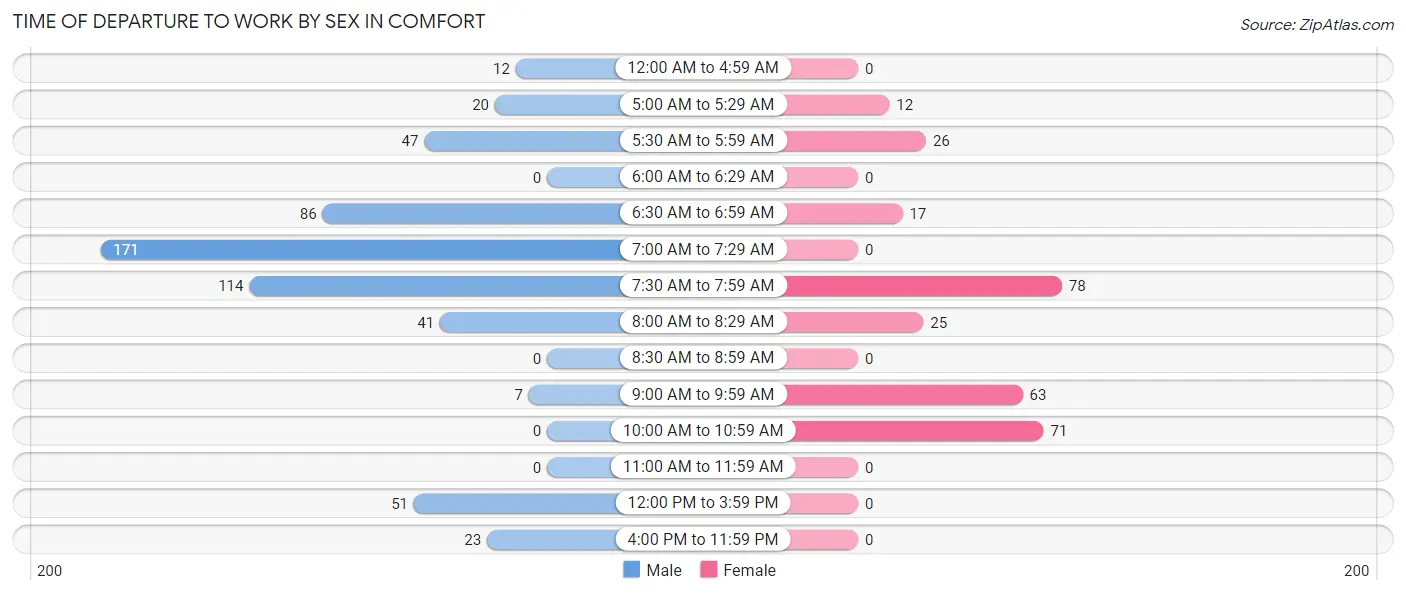
| Time of Departure | Male | Female |
| 12:00 AM to 4:59 AM | 12 (2.1%) | 0 (0.0%) |
| 5:00 AM to 5:29 AM | 20 (3.5%) | 12 (4.1%) |
| 5:30 AM to 5:59 AM | 47 (8.2%) | 26 (8.9%) |
| 6:00 AM to 6:29 AM | 0 (0.0%) | 0 (0.0%) |
| 6:30 AM to 6:59 AM | 86 (15.0%) | 17 (5.8%) |
| 7:00 AM to 7:29 AM | 171 (29.9%) | 0 (0.0%) |
| 7:30 AM to 7:59 AM | 114 (19.9%) | 78 (26.7%) |
| 8:00 AM to 8:29 AM | 41 (7.2%) | 25 (8.6%) |
| 8:30 AM to 8:59 AM | 0 (0.0%) | 0 (0.0%) |
| 9:00 AM to 9:59 AM | 7 (1.2%) | 63 (21.6%) |
| 10:00 AM to 10:59 AM | 0 (0.0%) | 71 (24.3%) |
| 11:00 AM to 11:59 AM | 0 (0.0%) | 0 (0.0%) |
| 12:00 PM to 3:59 PM | 51 (8.9%) | 0 (0.0%) |
| 4:00 PM to 11:59 PM | 23 (4.0%) | 0 (0.0%) |
| Total | 572 (100.0%) | 292 (100.0%) |
Housing Occupancy in Comfort
Occupancy by Ownership in Comfort
Of the total 711 dwellings in Comfort, owner-occupied units account for 537 (75.5%), while renter-occupied units make up 174 (24.5%).
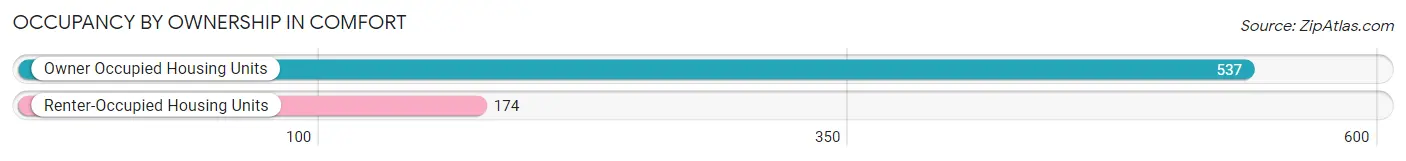
| Occupancy | # Housing Units | % Housing Units |
| Owner Occupied Housing Units | 537 | 75.5% |
| Renter-Occupied Housing Units | 174 | 24.5% |
| Total Occupied Housing Units | 711 | 100.0% |
Occupancy by Household Size in Comfort
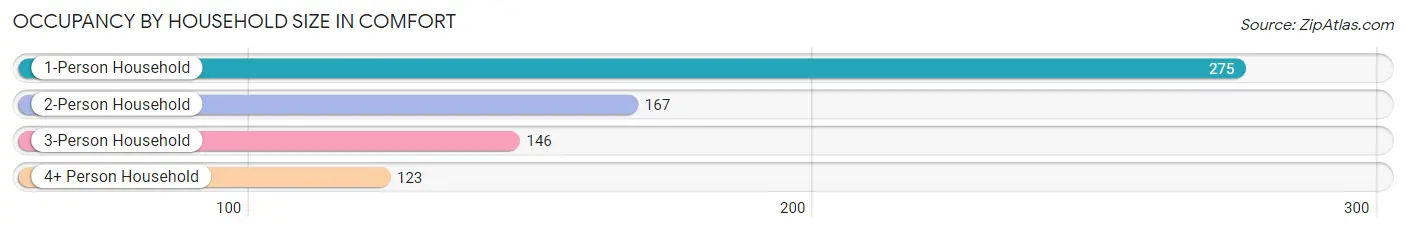
| Household Size | # Housing Units | % Housing Units |
| 1-Person Household | 275 | 38.7% |
| 2-Person Household | 167 | 23.5% |
| 3-Person Household | 146 | 20.5% |
| 4+ Person Household | 123 | 17.3% |
| Total Housing Units | 711 | 100.0% |
Occupancy by Ownership by Household Size in Comfort
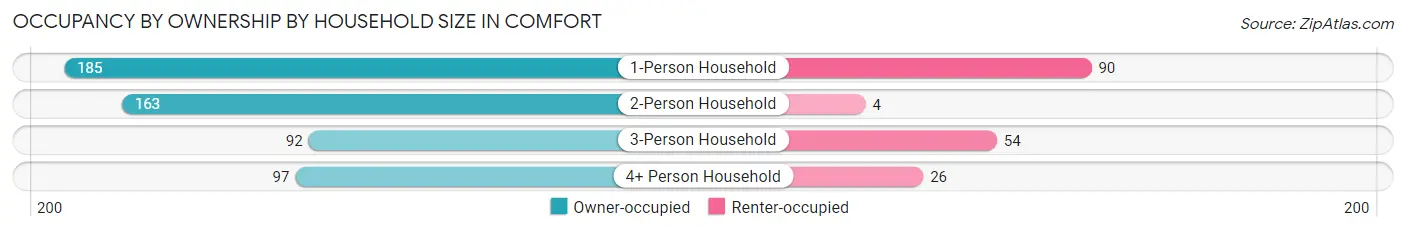
| Household Size | Owner-occupied | Renter-occupied |
| 1-Person Household | 185 (67.3%) | 90 (32.7%) |
| 2-Person Household | 163 (97.6%) | 4 (2.4%) |
| 3-Person Household | 92 (63.0%) | 54 (37.0%) |
| 4+ Person Household | 97 (78.9%) | 26 (21.1%) |
| Total Housing Units | 537 (75.5%) | 174 (24.5%) |
Occupancy by Educational Attainment in Comfort
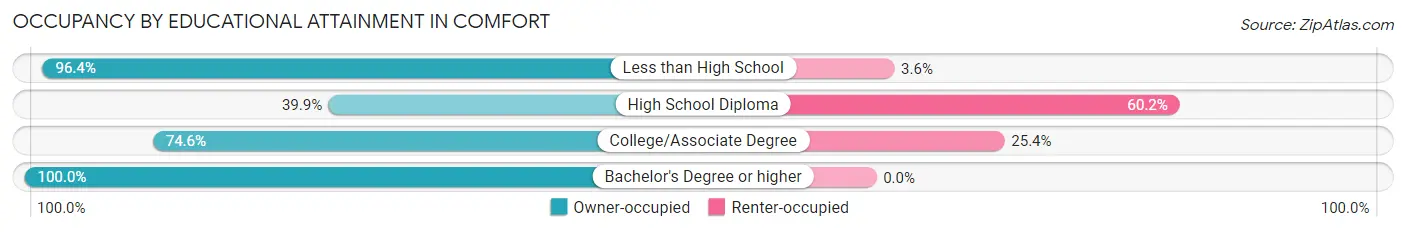
| Household Size | Owner-occupied | Renter-occupied |
| Less than High School | 108 (96.4%) | 4 (3.6%) |
| High School Diploma | 53 (39.9%) | 80 (60.2%) |
| College/Associate Degree | 264 (74.6%) | 90 (25.4%) |
| Bachelor's Degree or higher | 112 (100.0%) | 0 (0.0%) |
Occupancy by Age of Householder in Comfort
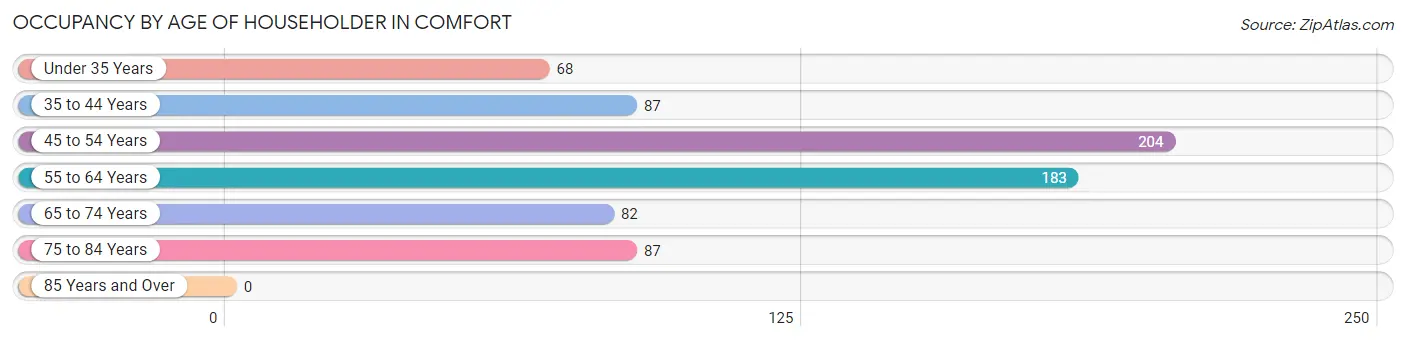
| Age Bracket | # Households | % Households |
| Under 35 Years | 68 | 9.6% |
| 35 to 44 Years | 87 | 12.2% |
| 45 to 54 Years | 204 | 28.7% |
| 55 to 64 Years | 183 | 25.7% |
| 65 to 74 Years | 82 | 11.5% |
| 75 to 84 Years | 87 | 12.2% |
| 85 Years and Over | 0 | 0.0% |
| Total | 711 | 100.0% |
Housing Finances in Comfort
Median Income by Occupancy in Comfort
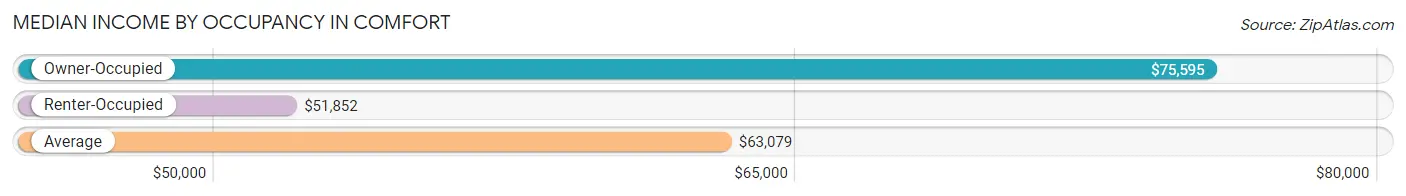
| Occupancy Type | # Households | Median Income |
| Owner-Occupied | 537 (75.5%) | $75,595 |
| Renter-Occupied | 174 (24.5%) | $51,852 |
| Average | 711 (100.0%) | $63,079 |
Occupancy by Householder Income Bracket in Comfort
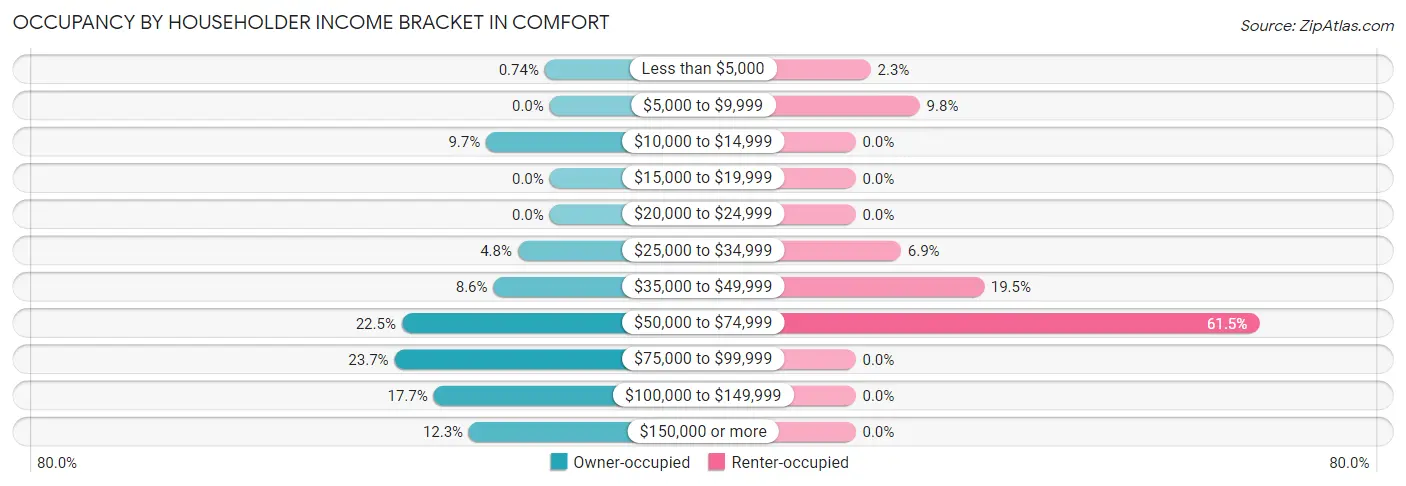
| Income Bracket | Owner-occupied | Renter-occupied |
| Less than $5,000 | 4 (0.7%) | 4 (2.3%) |
| $5,000 to $9,999 | 0 (0.0%) | 17 (9.8%) |
| $10,000 to $14,999 | 52 (9.7%) | 0 (0.0%) |
| $15,000 to $19,999 | 0 (0.0%) | 0 (0.0%) |
| $20,000 to $24,999 | 0 (0.0%) | 0 (0.0%) |
| $25,000 to $34,999 | 26 (4.8%) | 12 (6.9%) |
| $35,000 to $49,999 | 46 (8.6%) | 34 (19.5%) |
| $50,000 to $74,999 | 121 (22.5%) | 107 (61.5%) |
| $75,000 to $99,999 | 127 (23.6%) | 0 (0.0%) |
| $100,000 to $149,999 | 95 (17.7%) | 0 (0.0%) |
| $150,000 or more | 66 (12.3%) | 0 (0.0%) |
| Total | 537 (100.0%) | 174 (100.0%) |
Monthly Housing Cost Tiers in Comfort
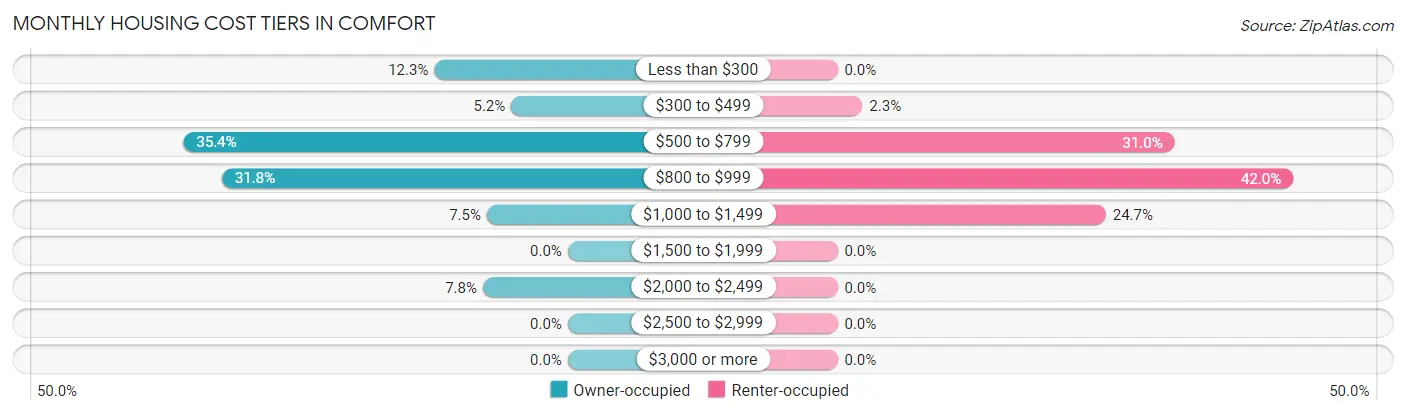
| Monthly Cost | Owner-occupied | Renter-occupied |
| Less than $300 | 66 (12.3%) | 0 (0.0%) |
| $300 to $499 | 28 (5.2%) | 4 (2.3%) |
| $500 to $799 | 190 (35.4%) | 54 (31.0%) |
| $800 to $999 | 171 (31.8%) | 73 (41.9%) |
| $1,000 to $1,499 | 40 (7.4%) | 43 (24.7%) |
| $1,500 to $1,999 | 0 (0.0%) | 0 (0.0%) |
| $2,000 to $2,499 | 42 (7.8%) | 0 (0.0%) |
| $2,500 to $2,999 | 0 (0.0%) | 0 (0.0%) |
| $3,000 or more | 0 (0.0%) | 0 (0.0%) |
| Total | 537 (100.0%) | 174 (100.0%) |
Physical Housing Characteristics in Comfort
Housing Structures in Comfort
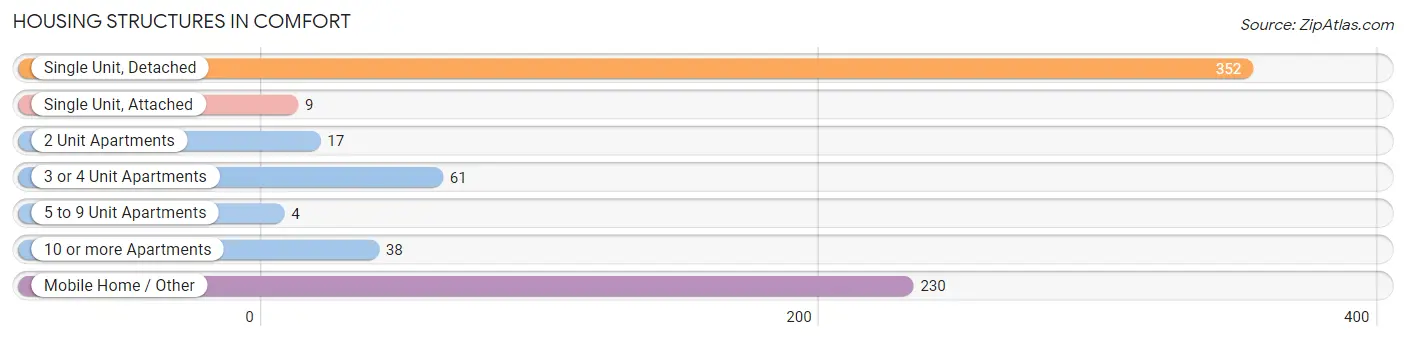
| Structure Type | # Housing Units | % Housing Units |
| Single Unit, Detached | 352 | 49.5% |
| Single Unit, Attached | 9 | 1.3% |
| 2 Unit Apartments | 17 | 2.4% |
| 3 or 4 Unit Apartments | 61 | 8.6% |
| 5 to 9 Unit Apartments | 4 | 0.6% |
| 10 or more Apartments | 38 | 5.3% |
| Mobile Home / Other | 230 | 32.4% |
| Total | 711 | 100.0% |
Housing Structures by Occupancy in Comfort
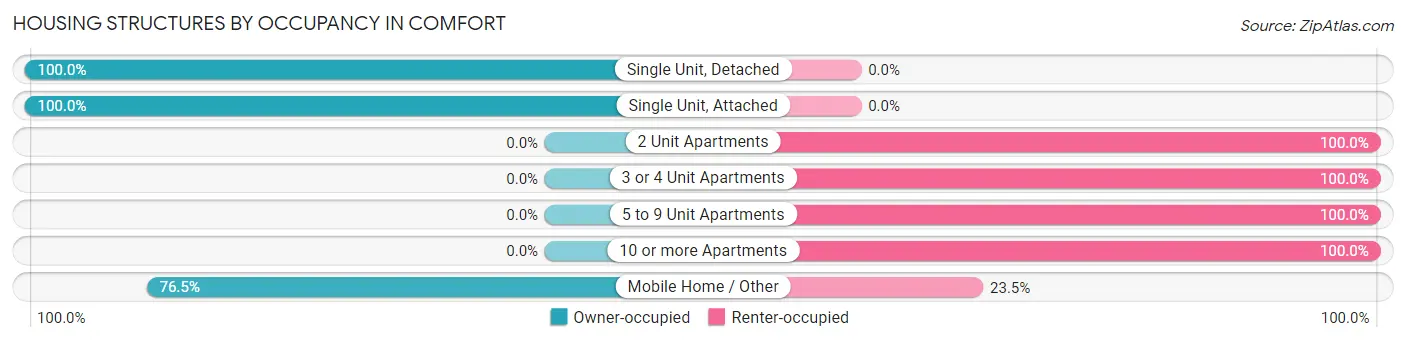
| Structure Type | Owner-occupied | Renter-occupied |
| Single Unit, Detached | 352 (100.0%) | 0 (0.0%) |
| Single Unit, Attached | 9 (100.0%) | 0 (0.0%) |
| 2 Unit Apartments | 0 (0.0%) | 17 (100.0%) |
| 3 or 4 Unit Apartments | 0 (0.0%) | 61 (100.0%) |
| 5 to 9 Unit Apartments | 0 (0.0%) | 4 (100.0%) |
| 10 or more Apartments | 0 (0.0%) | 38 (100.0%) |
| Mobile Home / Other | 176 (76.5%) | 54 (23.5%) |
| Total | 537 (75.5%) | 174 (24.5%) |
Housing Structures by Number of Rooms in Comfort
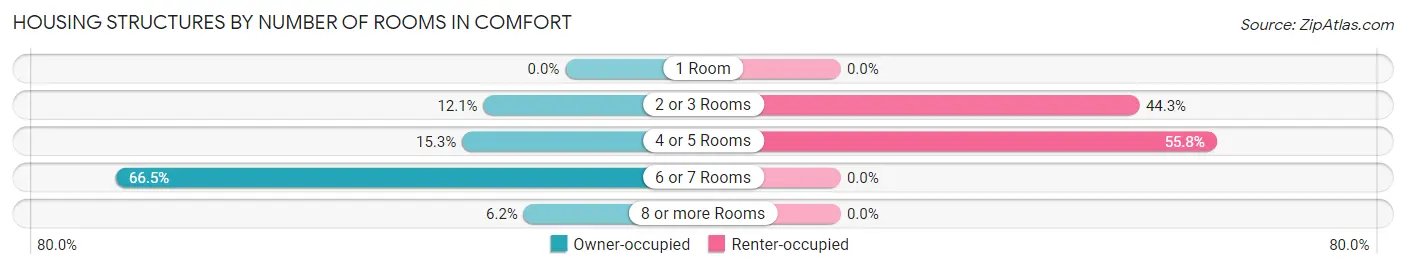
| Number of Rooms | Owner-occupied | Renter-occupied |
| 1 Room | 0 (0.0%) | 0 (0.0%) |
| 2 or 3 Rooms | 65 (12.1%) | 77 (44.3%) |
| 4 or 5 Rooms | 82 (15.3%) | 97 (55.7%) |
| 6 or 7 Rooms | 357 (66.5%) | 0 (0.0%) |
| 8 or more Rooms | 33 (6.1%) | 0 (0.0%) |
| Total | 537 (100.0%) | 174 (100.0%) |
Housing Structure by Heating Type in Comfort
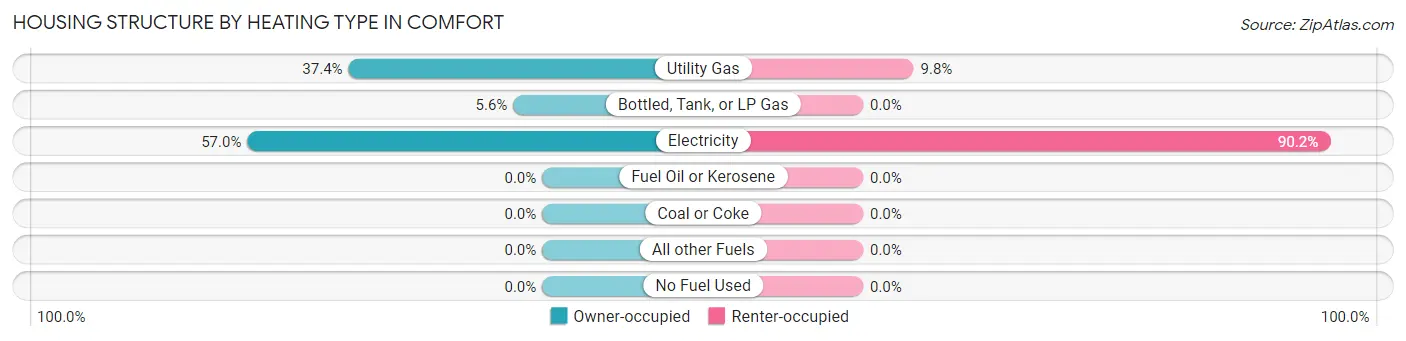
| Heating Type | Owner-occupied | Renter-occupied |
| Utility Gas | 201 (37.4%) | 17 (9.8%) |
| Bottled, Tank, or LP Gas | 30 (5.6%) | 0 (0.0%) |
| Electricity | 306 (57.0%) | 157 (90.2%) |
| Fuel Oil or Kerosene | 0 (0.0%) | 0 (0.0%) |
| Coal or Coke | 0 (0.0%) | 0 (0.0%) |
| All other Fuels | 0 (0.0%) | 0 (0.0%) |
| No Fuel Used | 0 (0.0%) | 0 (0.0%) |
| Total | 537 (100.0%) | 174 (100.0%) |
Household Vehicle Usage in Comfort
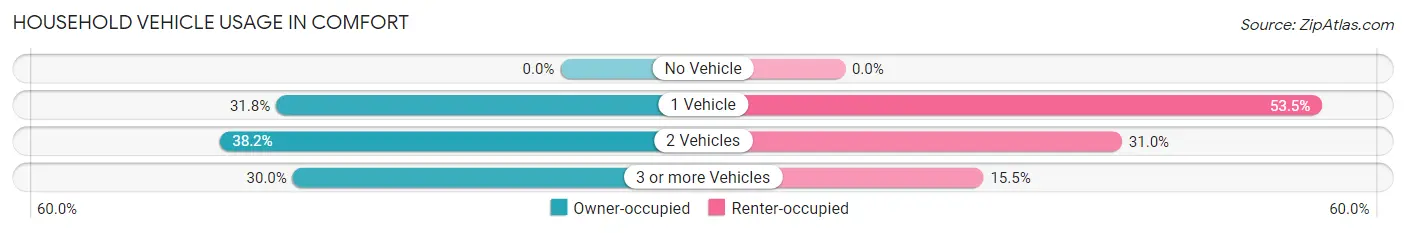
| Vehicles per Household | Owner-occupied | Renter-occupied |
| No Vehicle | 0 (0.0%) | 0 (0.0%) |
| 1 Vehicle | 171 (31.8%) | 93 (53.4%) |
| 2 Vehicles | 205 (38.2%) | 54 (31.0%) |
| 3 or more Vehicles | 161 (30.0%) | 27 (15.5%) |
| Total | 537 (100.0%) | 174 (100.0%) |
Real Estate & Mortgages in Comfort
Real Estate and Mortgage Overview in Comfort
| Characteristic | Without Mortgage | With Mortgage |
| Housing Units | 310 | 227 |
| Median Property Value | $171,400 | $259,300 |
| Median Household Income | - | - |
| Monthly Housing Costs | $580 | $0 |
| Real Estate Taxes | $2,371 | $0 |
Property Value by Mortgage Status in Comfort
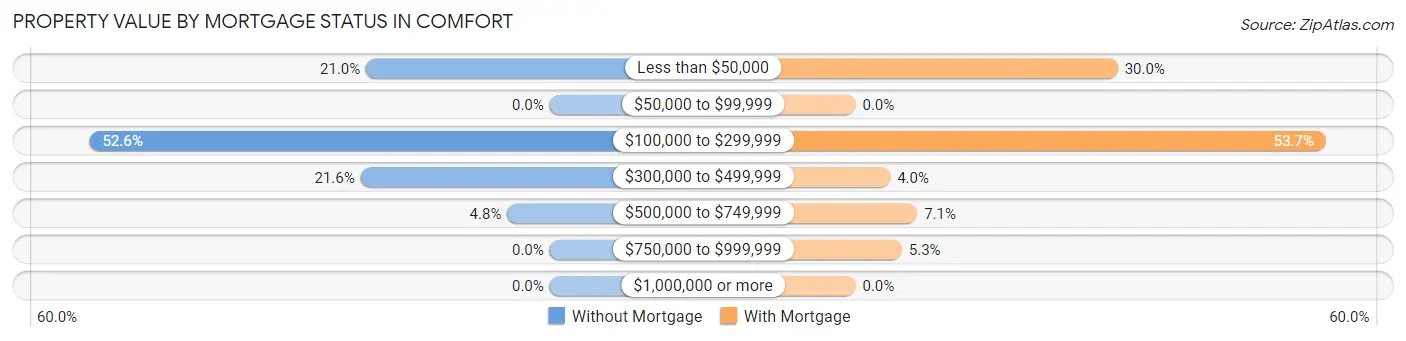
| Property Value | Without Mortgage | With Mortgage |
| Less than $50,000 | 65 (21.0%) | 68 (30.0%) |
| $50,000 to $99,999 | 0 (0.0%) | 0 (0.0%) |
| $100,000 to $299,999 | 163 (52.6%) | 122 (53.7%) |
| $300,000 to $499,999 | 67 (21.6%) | 9 (4.0%) |
| $500,000 to $749,999 | 15 (4.8%) | 16 (7.0%) |
| $750,000 to $999,999 | 0 (0.0%) | 12 (5.3%) |
| $1,000,000 or more | 0 (0.0%) | 0 (0.0%) |
| Total | 310 (100.0%) | 227 (100.0%) |
Household Income by Mortgage Status in Comfort
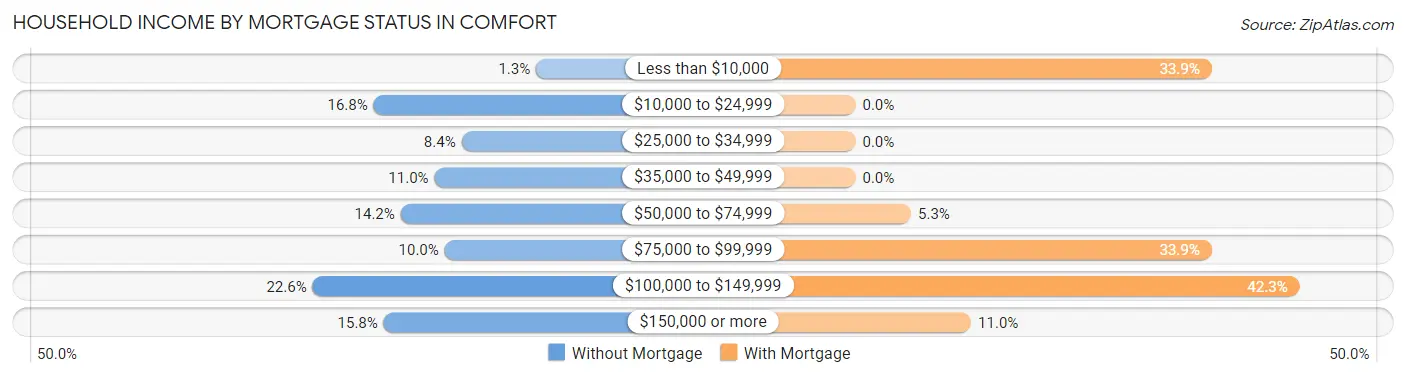
| Household Income | Without Mortgage | With Mortgage |
| Less than $10,000 | 4 (1.3%) | 77 (33.9%) |
| $10,000 to $24,999 | 52 (16.8%) | 0 (0.0%) |
| $25,000 to $34,999 | 26 (8.4%) | 0 (0.0%) |
| $35,000 to $49,999 | 34 (11.0%) | 0 (0.0%) |
| $50,000 to $74,999 | 44 (14.2%) | 12 (5.3%) |
| $75,000 to $99,999 | 31 (10.0%) | 77 (33.9%) |
| $100,000 to $149,999 | 70 (22.6%) | 96 (42.3%) |
| $150,000 or more | 49 (15.8%) | 25 (11.0%) |
| Total | 310 (100.0%) | 227 (100.0%) |
Property Value to Household Income Ratio in Comfort
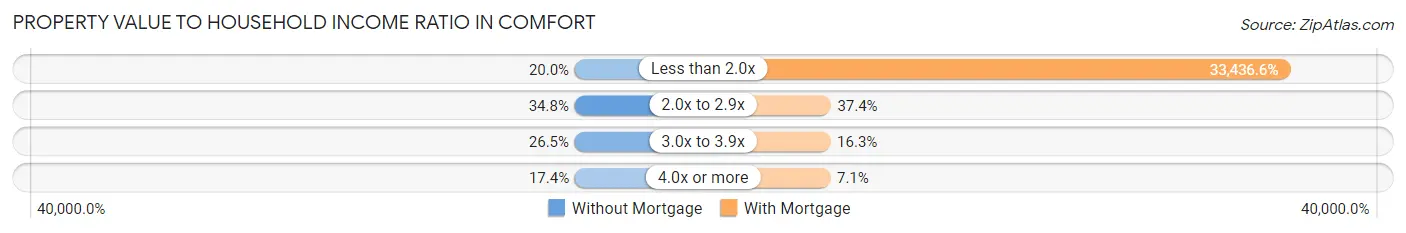
| Value-to-Income Ratio | Without Mortgage | With Mortgage |
| Less than 2.0x | 62 (20.0%) | 75,901 (33,436.6%) |
| 2.0x to 2.9x | 108 (34.8%) | 85 (37.4%) |
| 3.0x to 3.9x | 82 (26.5%) | 37 (16.3%) |
| 4.0x or more | 54 (17.4%) | 16 (7.0%) |
| Total | 310 (100.0%) | 227 (100.0%) |
Real Estate Taxes by Mortgage Status in Comfort
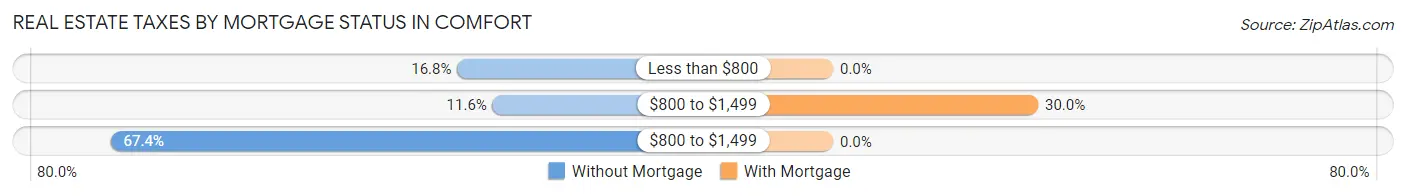
| Property Taxes | Without Mortgage | With Mortgage |
| Less than $800 | 52 (16.8%) | 0 (0.0%) |
| $800 to $1,499 | 36 (11.6%) | 68 (30.0%) |
| $800 to $1,499 | 209 (67.4%) | 0 (0.0%) |
| Total | 310 (100.0%) | 227 (100.0%) |
Health & Disability in Comfort
Health Insurance Coverage by Age in Comfort
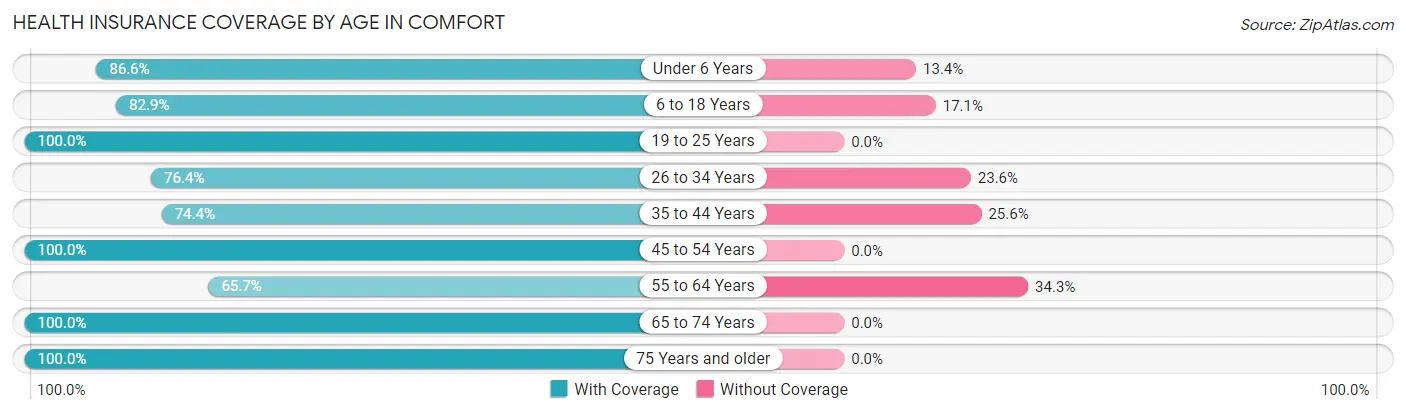
| Age Bracket | With Coverage | Without Coverage |
| Under 6 Years | 110 (86.6%) | 17 (13.4%) |
| 6 to 18 Years | 170 (82.9%) | 35 (17.1%) |
| 19 to 25 Years | 63 (100.0%) | 0 (0.0%) |
| 26 to 34 Years | 191 (76.4%) | 59 (23.6%) |
| 35 to 44 Years | 96 (74.4%) | 33 (25.6%) |
| 45 to 54 Years | 286 (100.0%) | 0 (0.0%) |
| 55 to 64 Years | 161 (65.7%) | 84 (34.3%) |
| 65 to 74 Years | 109 (100.0%) | 0 (0.0%) |
| 75 Years and older | 133 (100.0%) | 0 (0.0%) |
| Total | 1,319 (85.3%) | 228 (14.7%) |
Health Insurance Coverage by Citizenship Status in Comfort
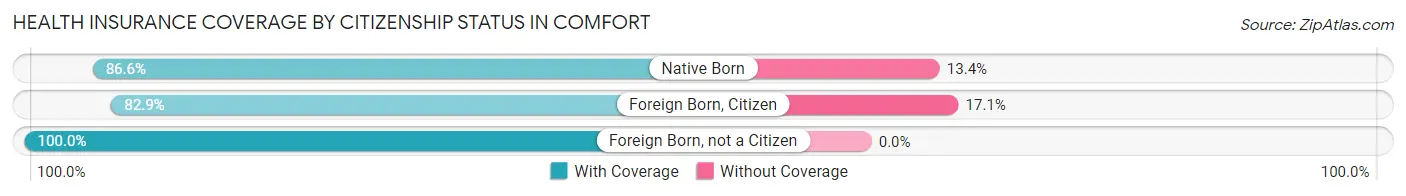
| Citizenship Status | With Coverage | Without Coverage |
| Native Born | 110 (86.6%) | 17 (13.4%) |
| Foreign Born, Citizen | 170 (82.9%) | 35 (17.1%) |
| Foreign Born, not a Citizen | 63 (100.0%) | 0 (0.0%) |
Health Insurance Coverage by Household Income in Comfort
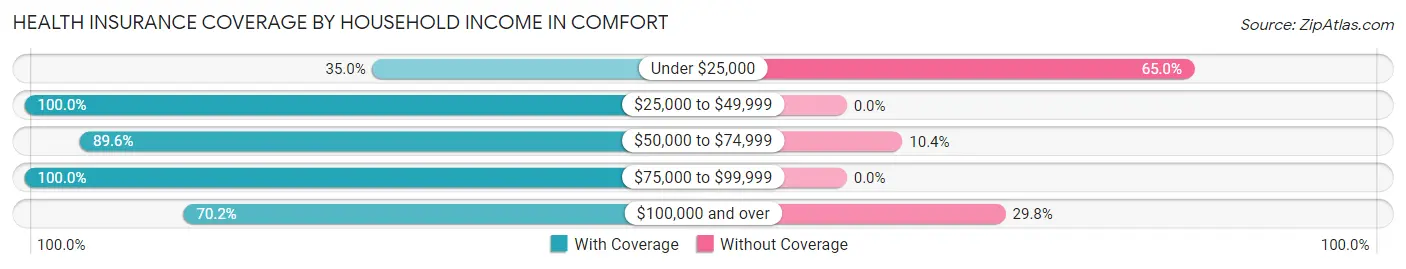
| Household Income | With Coverage | Without Coverage |
| Under $25,000 | 28 (35.0%) | 52 (65.0%) |
| $25,000 to $49,999 | 213 (100.0%) | 0 (0.0%) |
| $50,000 to $74,999 | 439 (89.6%) | 51 (10.4%) |
| $75,000 to $99,999 | 344 (100.0%) | 0 (0.0%) |
| $100,000 and over | 295 (70.2%) | 125 (29.8%) |
Public vs Private Health Insurance Coverage by Age in Comfort
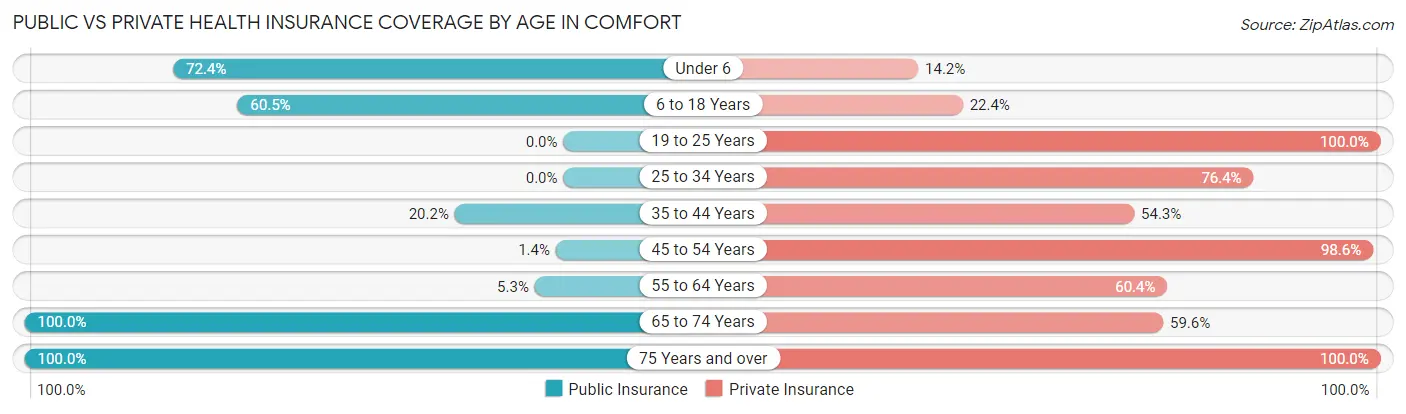
| Age Bracket | Public Insurance | Private Insurance |
| Under 6 | 92 (72.4%) | 18 (14.2%) |
| 6 to 18 Years | 124 (60.5%) | 46 (22.4%) |
| 19 to 25 Years | 0 (0.0%) | 63 (100.0%) |
| 25 to 34 Years | 0 (0.0%) | 191 (76.4%) |
| 35 to 44 Years | 26 (20.2%) | 70 (54.3%) |
| 45 to 54 Years | 4 (1.4%) | 282 (98.6%) |
| 55 to 64 Years | 13 (5.3%) | 148 (60.4%) |
| 65 to 74 Years | 109 (100.0%) | 65 (59.6%) |
| 75 Years and over | 133 (100.0%) | 133 (100.0%) |
| Total | 501 (32.4%) | 1,016 (65.7%) |
Disability Status by Sex by Age in Comfort
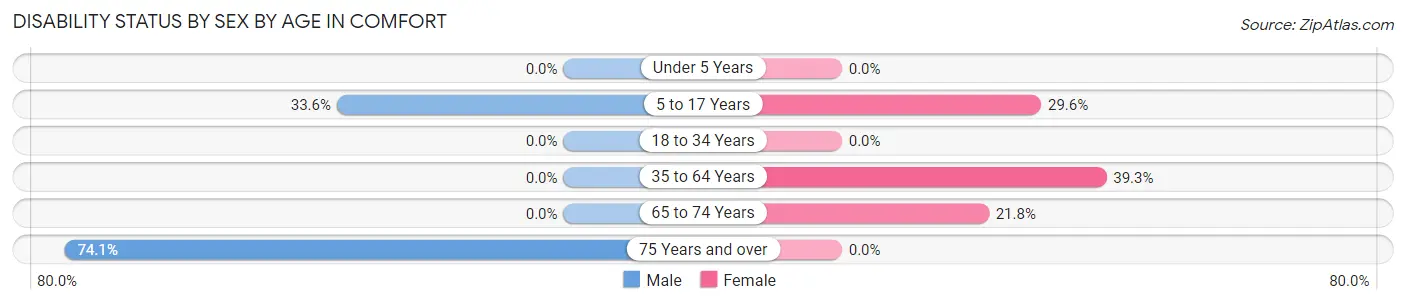
| Age Bracket | Male | Female |
| Under 5 Years | 0 (0.0%) | 0 (0.0%) |
| 5 to 17 Years | 36 (33.6%) | 29 (29.6%) |
| 18 to 34 Years | 0 (0.0%) | 0 (0.0%) |
| 35 to 64 Years | 0 (0.0%) | 152 (39.3%) |
| 65 to 74 Years | 0 (0.0%) | 12 (21.8%) |
| 75 Years and over | 40 (74.1%) | 0 (0.0%) |
Disability Class by Sex by Age in Comfort
Disability Class: Hearing Difficulty
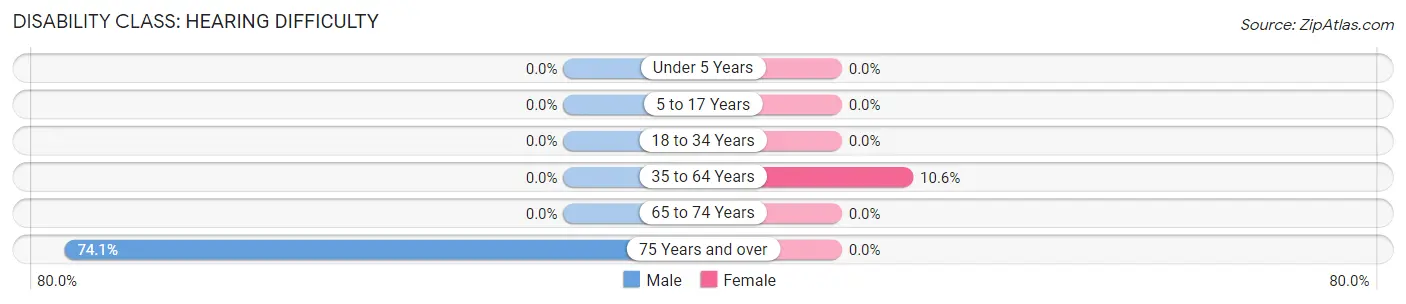
| Age Bracket | Male | Female |
| Under 5 Years | 0 (0.0%) | 0 (0.0%) |
| 5 to 17 Years | 0 (0.0%) | 0 (0.0%) |
| 18 to 34 Years | 0 (0.0%) | 0 (0.0%) |
| 35 to 64 Years | 0 (0.0%) | 41 (10.6%) |
| 65 to 74 Years | 0 (0.0%) | 0 (0.0%) |
| 75 Years and over | 40 (74.1%) | 0 (0.0%) |
Disability Class: Vision Difficulty
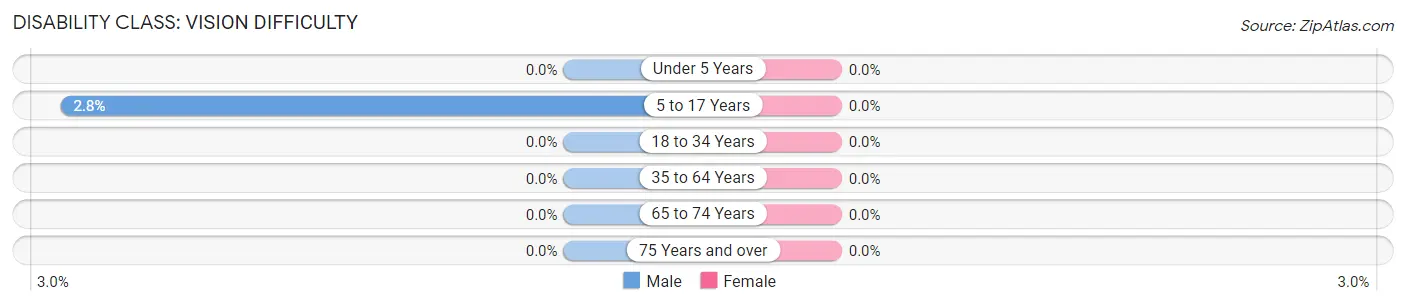
| Age Bracket | Male | Female |
| Under 5 Years | 0 (0.0%) | 0 (0.0%) |
| 5 to 17 Years | 3 (2.8%) | 0 (0.0%) |
| 18 to 34 Years | 0 (0.0%) | 0 (0.0%) |
| 35 to 64 Years | 0 (0.0%) | 0 (0.0%) |
| 65 to 74 Years | 0 (0.0%) | 0 (0.0%) |
| 75 Years and over | 0 (0.0%) | 0 (0.0%) |
Disability Class: Cognitive Difficulty
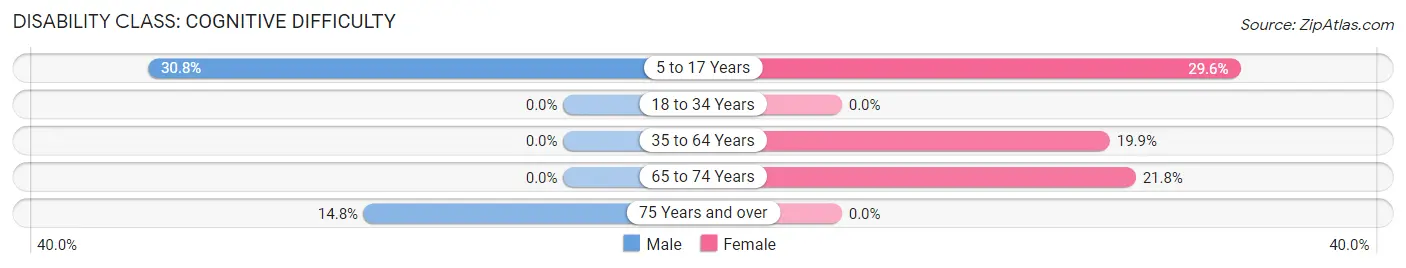
| Age Bracket | Male | Female |
| 5 to 17 Years | 33 (30.8%) | 29 (29.6%) |
| 18 to 34 Years | 0 (0.0%) | 0 (0.0%) |
| 35 to 64 Years | 0 (0.0%) | 77 (19.9%) |
| 65 to 74 Years | 0 (0.0%) | 12 (21.8%) |
| 75 Years and over | 8 (14.8%) | 0 (0.0%) |
Disability Class: Ambulatory Difficulty
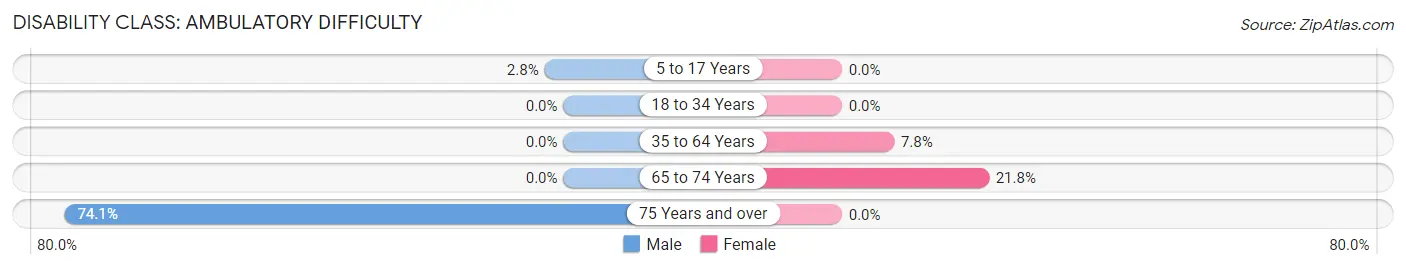
| Age Bracket | Male | Female |
| 5 to 17 Years | 3 (2.8%) | 0 (0.0%) |
| 18 to 34 Years | 0 (0.0%) | 0 (0.0%) |
| 35 to 64 Years | 0 (0.0%) | 30 (7.7%) |
| 65 to 74 Years | 0 (0.0%) | 12 (21.8%) |
| 75 Years and over | 40 (74.1%) | 0 (0.0%) |
Disability Class: Self-Care Difficulty
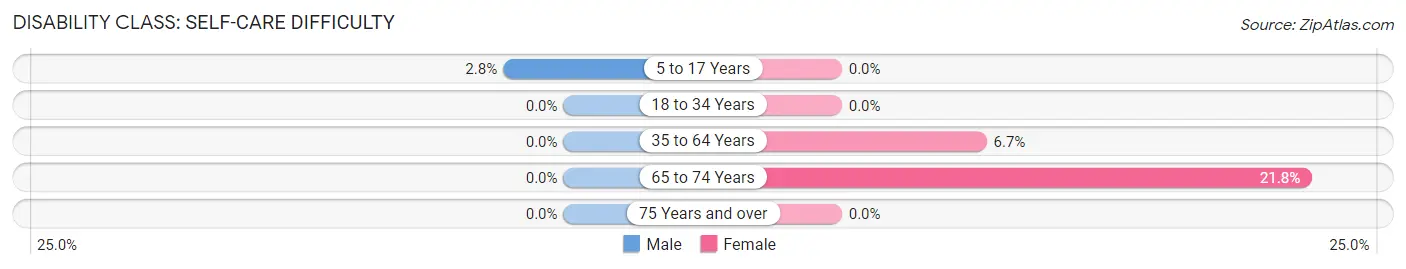
| Age Bracket | Male | Female |
| 5 to 17 Years | 3 (2.8%) | 0 (0.0%) |
| 18 to 34 Years | 0 (0.0%) | 0 (0.0%) |
| 35 to 64 Years | 0 (0.0%) | 26 (6.7%) |
| 65 to 74 Years | 0 (0.0%) | 12 (21.8%) |
| 75 Years and over | 0 (0.0%) | 0 (0.0%) |
Technology Access in Comfort
Computing Device Access in Comfort
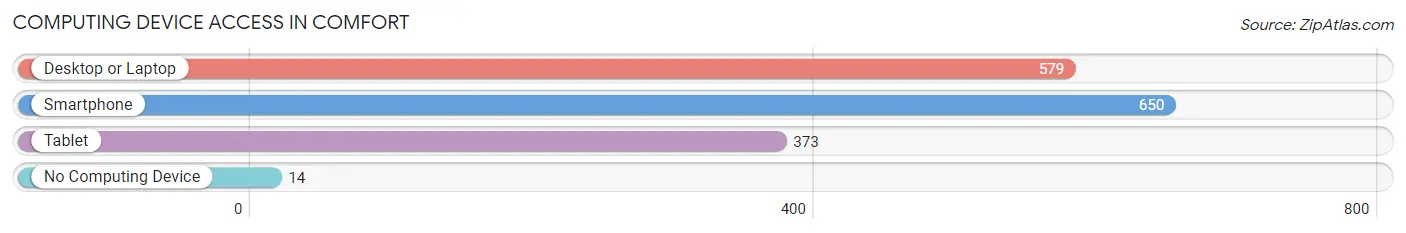
| Device Type | # Households | % Households |
| Desktop or Laptop | 579 | 81.4% |
| Smartphone | 650 | 91.4% |
| Tablet | 373 | 52.5% |
| No Computing Device | 14 | 2.0% |
| Total | 711 | 100.0% |
Internet Access in Comfort
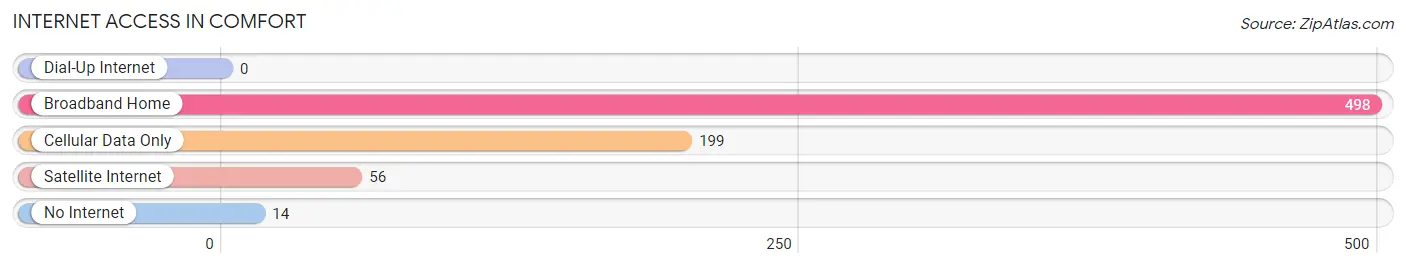
| Internet Type | # Households | % Households |
| Dial-Up Internet | 0 | 0.0% |
| Broadband Home | 498 | 70.0% |
| Cellular Data Only | 199 | 28.0% |
| Satellite Internet | 56 | 7.9% |
| No Internet | 14 | 2.0% |
| Total | 711 | 100.0% |
Comfort Summary
Comfort is a small town located in the Texas Hill Country, about an hour northwest of San Antonio. It is the county seat of Kendall County and has a population of about 2,363 people. The town was founded in 1854 by German immigrants and was named after the Comal River, which runs through the area.
Geography
Comfort is located in the Texas Hill Country, a region of rolling hills and limestone outcroppings. The town is situated on the banks of the Guadalupe River, which is a major tributary of the San Antonio River. The town is surrounded by several small towns, including Boerne, Fredericksburg, and Kerrville. The terrain is mostly flat, with some hills and valleys. The climate is mild, with hot summers and cool winters.
Economy
Comfort’s economy is largely based on tourism and agriculture. The town is home to several wineries, as well as a number of bed and breakfasts. The town also has a thriving antiques and collectibles market. Agriculture is also an important part of the local economy, with cattle, sheep, and goats being raised in the area.
Demographics
As of the 2010 census, Comfort had a population of 2,363 people. The racial makeup of the town was 94.3% White, 0.7% African American, 0.3% Native American, 0.2% Asian, 0.1% Pacific Islander, 3.2% from other races, and 1.4% from two or more races. Hispanic or Latino of any race were 8.2% of the population.
The median income for a household in Comfort was $41,250, and the median income for a family was $50,000. The per capita income for the town was $20,945. About 11.2% of families and 14.3% of the population were below the poverty line, including 18.2% of those under age 18 and 8.9% of those age 65 or over.
Conclusion
Comfort is a small town located in the Texas Hill Country, about an hour northwest of San Antonio. It is the county seat of Kendall County and has a population of about 2,363 people. The town was founded in 1854 by German immigrants and was named after the Comal River, which runs through the area. The economy of Comfort is largely based on tourism and agriculture, and the town has a diverse population. Comfort is a great place to visit and live, with its mild climate, beautiful scenery, and friendly people.
Common Questions
What is Per Capita Income in Comfort?
Per Capita income in Comfort is $34,810.
What is the Median Family Income in Comfort?
Median Family Income in Comfort is $77,132.
What is the Median Household income in Comfort?
Median Household Income in Comfort is $63,079.
What is Income or Wage Gap in Comfort?
Income or Wage Gap in Comfort is 39.4%.
Women in Comfort earn 60.6 cents for every dollar earned by a man.
What is Inequality or Gini Index in Comfort?
Inequality or Gini Index in Comfort is 0.35.
What is the Total Population of Comfort?
Total Population of Comfort is 1,589.
What is the Total Male Population of Comfort?
Total Male Population of Comfort is 834.
What is the Total Female Population of Comfort?
Total Female Population of Comfort is 755.
What is the Ratio of Males per 100 Females in Comfort?
There are 110.46 Males per 100 Females in Comfort.
What is the Ratio of Females per 100 Males in Comfort?
There are 90.53 Females per 100 Males in Comfort.
What is the Median Population Age in Comfort?
Median Population Age in Comfort is 46.5 Years.
What is the Average Family Size in Comfort
Average Family Size in Comfort is 2.9 People.
What is the Average Household Size in Comfort
Average Household Size in Comfort is 2.2 People.
How Large is the Labor Force in Comfort?
There are 1,041 People in the Labor Forcein in Comfort.
What is the Percentage of People in the Labor Force in Comfort?
81.3% of People are in the Labor Force in Comfort.
What is the Unemployment Rate in Comfort?
Unemployment Rate in Comfort is 7.4%.