Zip Codes with the Highest Percentage of Population Employed in Health Diagnosing & Treating in Houston, TX
RELATED REPORTS & OPTIONS
Health Diagnosing & Treating
Houston
Compare Zip Codes
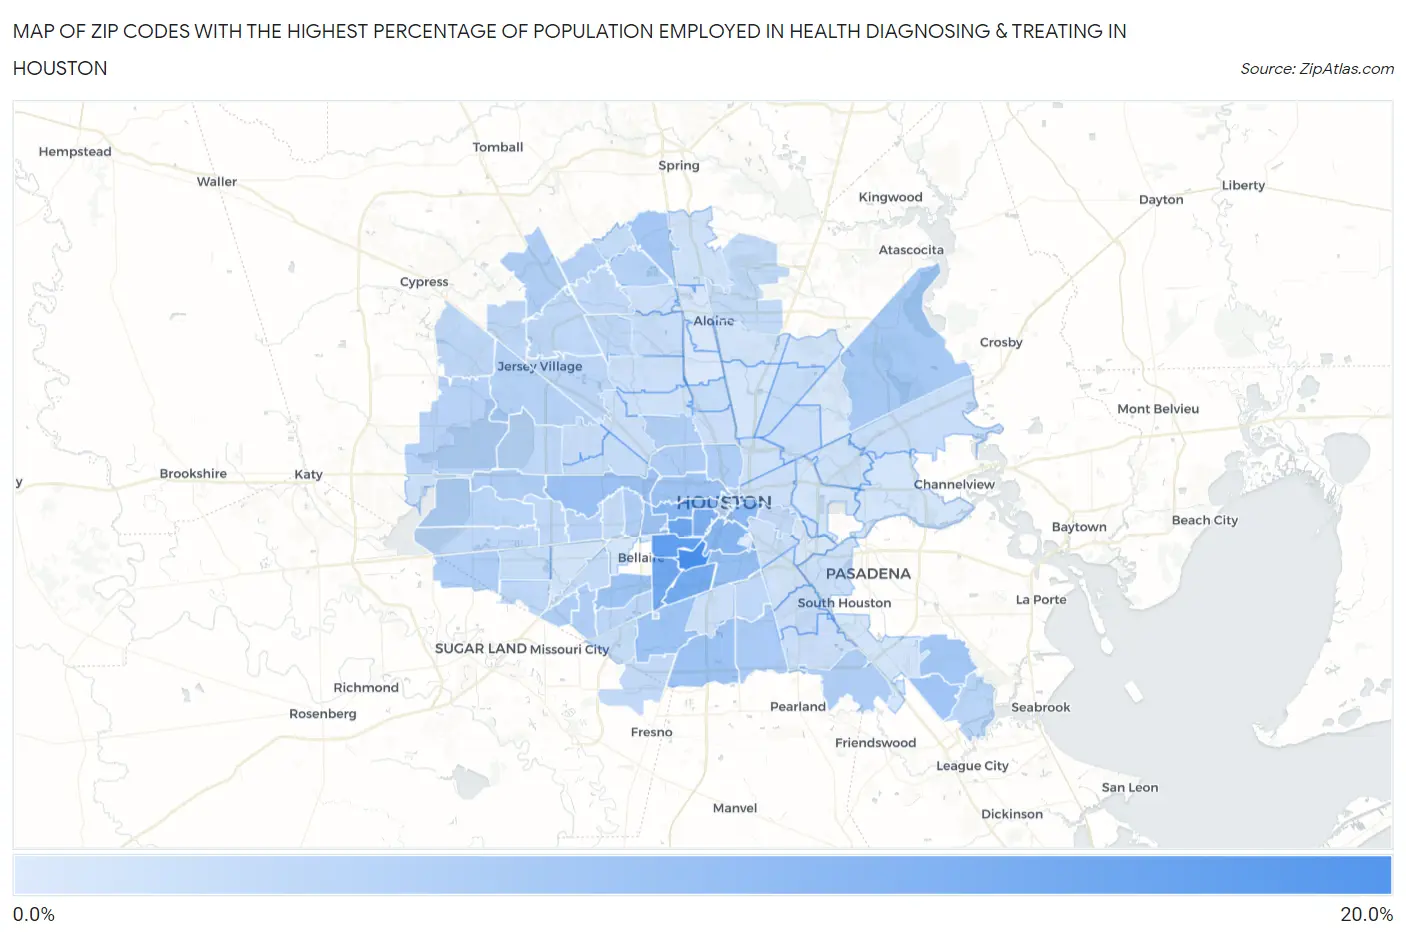
Map of Zip Codes with the Highest Percentage of Population Employed in Health Diagnosing & Treating in Houston
0.57%
19.7%
Zip Codes with the Highest Percentage of Population Employed in Health Diagnosing & Treating in Houston, TX
| Zip Code | % Employed | vs State | vs National | |
| 1. | 77030 | 19.7% | 5.5%(+14.2)#29 | 6.2%(+13.5)#570 |
| 2. | 77005 | 16.3% | 5.5%(+10.8)#46 | 6.2%(+10.0)#916 |
| 3. | 77098 | 14.7% | 5.5%(+9.22)#59 | 6.2%(+8.49)#1,209 |
| 4. | 77025 | 13.8% | 5.5%(+8.27)#68 | 6.2%(+7.54)#1,476 |
| 5. | 77054 | 13.4% | 5.5%(+7.86)#74 | 6.2%(+7.13)#1,617 |
| 6. | 77006 | 12.3% | 5.5%(+6.79)#95 | 6.2%(+6.07)#2,053 |
| 7. | 77019 | 11.1% | 5.5%(+5.54)#123 | 6.2%(+4.82)#2,850 |
| 8. | 77004 | 11.1% | 5.5%(+5.54)#125 | 6.2%(+4.81)#2,854 |
| 9. | 77003 | 10.1% | 5.5%(+4.63)#155 | 6.2%(+3.90)#3,700 |
| 10. | 77021 | 9.2% | 5.5%(+3.72)#208 | 6.2%(+2.99)#4,964 |
| 11. | 77027 | 8.8% | 5.5%(+3.29)#232 | 6.2%(+2.57)#5,714 |
| 12. | 77024 | 8.4% | 5.5%(+2.91)#263 | 6.2%(+2.19)#6,468 |
| 13. | 77047 | 8.1% | 5.5%(+2.61)#300 | 6.2%(+1.88)#7,178 |
| 14. | 77010 | 8.1% | 5.5%(+2.59)#302 | 6.2%(+1.87)#7,222 |
| 15. | 77096 | 8.1% | 5.5%(+2.55)#308 | 6.2%(+1.83)#7,323 |
| 16. | 77045 | 8.0% | 5.5%(+2.46)#322 | 6.2%(+1.74)#7,543 |
| 17. | 77007 | 7.9% | 5.5%(+2.37)#337 | 6.2%(+1.64)#7,790 |
| 18. | 77062 | 7.8% | 5.5%(+2.26)#345 | 6.2%(+1.53)#8,057 |
| 19. | 77059 | 7.5% | 5.5%(+2.01)#378 | 6.2%(+1.28)#8,738 |
| 20. | 77090 | 7.3% | 5.5%(+1.74)#416 | 6.2%(+1.02)#9,518 |
| 21. | 77044 | 6.9% | 5.5%(+1.41)#450 | 6.2%(+0.683)#10,592 |
| 22. | 77048 | 6.6% | 5.5%(+1.04)#501 | 6.2%(+0.314)#11,824 |
| 23. | 77079 | 6.2% | 5.5%(+0.716)#557 | 6.2%(-0.010)#13,022 |
| 24. | 77008 | 6.1% | 5.5%(+0.554)#587 | 6.2%(-0.172)#13,603 |
| 25. | 77089 | 6.1% | 5.5%(+0.542)#589 | 6.2%(-0.184)#13,638 |
| 26. | 77031 | 5.9% | 5.5%(+0.402)#612 | 6.2%(-0.325)#14,146 |
| 27. | 77071 | 5.9% | 5.5%(+0.332)#627 | 6.2%(-0.394)#14,410 |
| 28. | 77018 | 5.8% | 5.5%(+0.306)#630 | 6.2%(-0.420)#14,503 |
| 29. | 77056 | 5.8% | 5.5%(+0.296)#632 | 6.2%(-0.430)#14,546 |
| 30. | 77009 | 5.8% | 5.5%(+0.270)#639 | 6.2%(-0.457)#14,658 |
| 31. | 77070 | 5.7% | 5.5%(+0.214)#649 | 6.2%(-0.512)#14,864 |
| 32. | 77083 | 5.7% | 5.5%(+0.193)#654 | 6.2%(-0.533)#14,953 |
| 33. | 77069 | 5.4% | 5.5%(-0.143)#740 | 6.2%(-0.869)#16,265 |
| 34. | 77014 | 5.2% | 5.5%(-0.281)#770 | 6.2%(-1.01)#16,799 |
| 35. | 77041 | 5.1% | 5.5%(-0.378)#795 | 6.2%(-1.10)#17,161 |
| 36. | 77084 | 5.0% | 5.5%(-0.480)#820 | 6.2%(-1.21)#17,544 |
| 37. | 77063 | 5.0% | 5.5%(-0.561)#837 | 6.2%(-1.29)#17,880 |
| 38. | 77077 | 4.8% | 5.5%(-0.739)#878 | 6.2%(-1.47)#18,571 |
| 39. | 77058 | 4.7% | 5.5%(-0.786)#890 | 6.2%(-1.51)#18,741 |
| 40. | 77002 | 4.6% | 5.5%(-0.918)#917 | 6.2%(-1.64)#19,251 |
| 41. | 77040 | 4.4% | 5.5%(-1.07)#957 | 6.2%(-1.80)#19,833 |
| 42. | 77035 | 4.4% | 5.5%(-1.07)#958 | 6.2%(-1.80)#19,843 |
| 43. | 77099 | 4.2% | 5.5%(-1.27)#994 | 6.2%(-2.00)#20,528 |
| 44. | 77086 | 4.2% | 5.5%(-1.28)#997 | 6.2%(-2.00)#20,553 |
| 45. | 77043 | 4.2% | 5.5%(-1.30)#1,009 | 6.2%(-2.03)#20,638 |
| 46. | 77082 | 4.2% | 5.5%(-1.30)#1,010 | 6.2%(-2.03)#20,643 |
| 47. | 77095 | 4.2% | 5.5%(-1.31)#1,013 | 6.2%(-2.04)#20,676 |
| 48. | 77064 | 4.2% | 5.5%(-1.35)#1,019 | 6.2%(-2.07)#20,800 |
| 49. | 77065 | 4.1% | 5.5%(-1.40)#1,035 | 6.2%(-2.12)#20,984 |
| 50. | 77033 | 4.1% | 5.5%(-1.42)#1,041 | 6.2%(-2.15)#21,064 |
| 51. | 77042 | 4.0% | 5.5%(-1.50)#1,061 | 6.2%(-2.23)#21,309 |
| 52. | 77053 | 4.0% | 5.5%(-1.56)#1,073 | 6.2%(-2.28)#21,479 |
| 53. | 77066 | 3.9% | 5.5%(-1.65)#1,096 | 6.2%(-2.38)#21,779 |
| 54. | 77011 | 3.8% | 5.5%(-1.77)#1,122 | 6.2%(-2.49)#22,137 |
| 55. | 77074 | 3.7% | 5.5%(-1.81)#1,133 | 6.2%(-2.54)#22,265 |
| 56. | 77057 | 3.6% | 5.5%(-1.87)#1,146 | 6.2%(-2.60)#22,479 |
| 57. | 77032 | 3.6% | 5.5%(-1.91)#1,155 | 6.2%(-2.64)#22,598 |
| 58. | 77085 | 3.3% | 5.5%(-2.17)#1,212 | 6.2%(-2.90)#23,337 |
| 59. | 77055 | 3.3% | 5.5%(-2.20)#1,217 | 6.2%(-2.93)#23,417 |
| 60. | 77068 | 3.3% | 5.5%(-2.26)#1,231 | 6.2%(-2.99)#23,609 |
| 61. | 77072 | 3.3% | 5.5%(-2.26)#1,234 | 6.2%(-2.99)#23,622 |
| 62. | 77016 | 3.2% | 5.5%(-2.31)#1,244 | 6.2%(-3.04)#23,758 |
| 63. | 77076 | 3.2% | 5.5%(-2.35)#1,258 | 6.2%(-3.08)#23,876 |
| 64. | 77080 | 3.1% | 5.5%(-2.41)#1,276 | 6.2%(-3.14)#24,034 |
| 65. | 77028 | 3.1% | 5.5%(-2.43)#1,279 | 6.2%(-3.15)#24,098 |
| 66. | 77049 | 3.0% | 5.5%(-2.50)#1,293 | 6.2%(-3.23)#24,261 |
| 67. | 77038 | 2.9% | 5.5%(-2.61)#1,311 | 6.2%(-3.34)#24,553 |
| 68. | 77061 | 2.8% | 5.5%(-2.70)#1,329 | 6.2%(-3.43)#24,775 |
| 69. | 77075 | 2.7% | 5.5%(-2.81)#1,343 | 6.2%(-3.54)#25,023 |
| 70. | 77022 | 2.7% | 5.5%(-2.86)#1,353 | 6.2%(-3.59)#25,140 |
| 71. | 77017 | 2.6% | 5.5%(-2.92)#1,361 | 6.2%(-3.64)#25,266 |
| 72. | 77023 | 2.6% | 5.5%(-2.94)#1,368 | 6.2%(-3.66)#25,314 |
| 73. | 77088 | 2.5% | 5.5%(-3.00)#1,384 | 6.2%(-3.72)#25,472 |
| 74. | 77094 | 2.5% | 5.5%(-3.02)#1,388 | 6.2%(-3.74)#25,506 |
| 75. | 77020 | 2.5% | 5.5%(-3.02)#1,389 | 6.2%(-3.75)#25,527 |
| 76. | 77067 | 2.4% | 5.5%(-3.08)#1,400 | 6.2%(-3.80)#25,646 |
| 77. | 77051 | 2.4% | 5.5%(-3.14)#1,407 | 6.2%(-3.86)#25,764 |
| 78. | 77092 | 2.4% | 5.5%(-3.16)#1,409 | 6.2%(-3.88)#25,806 |
| 79. | 77013 | 2.3% | 5.5%(-3.18)#1,412 | 6.2%(-3.91)#25,843 |
| 80. | 77026 | 2.3% | 5.5%(-3.22)#1,419 | 6.2%(-3.95)#25,939 |
| 81. | 77091 | 2.2% | 5.5%(-3.28)#1,426 | 6.2%(-4.01)#26,030 |
| 82. | 77073 | 2.2% | 5.5%(-3.31)#1,432 | 6.2%(-4.04)#26,104 |
| 83. | 77087 | 2.1% | 5.5%(-3.47)#1,453 | 6.2%(-4.19)#26,367 |
| 84. | 77039 | 2.1% | 5.5%(-3.47)#1,455 | 6.2%(-4.19)#26,376 |
| 85. | 77036 | 1.9% | 5.5%(-3.63)#1,492 | 6.2%(-4.36)#26,663 |
| 86. | 77050 | 1.8% | 5.5%(-3.71)#1,510 | 6.2%(-4.44)#26,790 |
| 87. | 77015 | 1.7% | 5.5%(-3.77)#1,519 | 6.2%(-4.50)#26,879 |
| 88. | 77093 | 1.7% | 5.5%(-3.81)#1,526 | 6.2%(-4.54)#26,945 |
| 89. | 77029 | 1.6% | 5.5%(-3.93)#1,543 | 6.2%(-4.66)#27,096 |
| 90. | 77034 | 1.5% | 5.5%(-3.97)#1,548 | 6.2%(-4.70)#27,154 |
| 91. | 77081 | 1.5% | 5.5%(-4.01)#1,553 | 6.2%(-4.73)#27,199 |
| 92. | 77046 | 1.4% | 5.5%(-4.15)#1,561 | 6.2%(-4.88)#27,378 |
| 93. | 77012 | 1.2% | 5.5%(-4.35)#1,575 | 6.2%(-5.07)#27,628 |
| 94. | 77078 | 1.2% | 5.5%(-4.36)#1,577 | 6.2%(-5.09)#27,650 |
| 95. | 77060 | 1.0% | 5.5%(-4.51)#1,595 | 6.2%(-5.24)#27,836 |
| 96. | 77037 | 0.80% | 5.5%(-4.72)#1,616 | 6.2%(-5.45)#28,065 |
| 97. | 77204 | 0.57% | 5.5%(-4.95)#1,626 | 6.2%(-5.68)#28,252 |
1
Common Questions
What are the Top 10 Zip Codes with the Highest Percentage of Population Employed in Health Diagnosing & Treating in Houston, TX?
Top 10 Zip Codes with the Highest Percentage of Population Employed in Health Diagnosing & Treating in Houston, TX are:
What zip code has the Highest Percentage of Population Employed in Health Diagnosing & Treating in Houston, TX?
77030 has the Highest Percentage of Population Employed in Health Diagnosing & Treating in Houston, TX with 19.7%.
What is the Percentage of Population Employed in Health Diagnosing & Treating in Houston, TX?
Percentage of Population Employed in Health Diagnosing & Treating in Houston is 5.1%.
What is the Percentage of Population Employed in Health Diagnosing & Treating in Texas?
Percentage of Population Employed in Health Diagnosing & Treating in Texas is 5.5%.
What is the Percentage of Population Employed in Health Diagnosing & Treating in the United States?
Percentage of Population Employed in Health Diagnosing & Treating in the United States is 6.2%.