Yorktown, TX Map & Demographics
Yorktown Map

Yorktown Overview
$25,793
PER CAPITA INCOME
$73,182
AVG FAMILY INCOME
$66,125
AVG HOUSEHOLD INCOME
21.9%
WAGE / INCOME GAP [ % ]
78.1¢/ $1
WAGE / INCOME GAP [ $ ]
$6,428
FAMILY INCOME DEFICIT
0.43
INEQUALITY / GINI INDEX
2,183
TOTAL POPULATION
1,126
MALE POPULATION
1,057
FEMALE POPULATION
106.53
MALES / 100 FEMALES
93.87
FEMALES / 100 MALES
35.7
MEDIAN AGE
3.5
AVG FAMILY SIZE
2.8
AVG HOUSEHOLD SIZE
763
LABOR FORCE [ PEOPLE ]
45.3%
PERCENT IN LABOR FORCE
7.5%
UNEMPLOYMENT RATE
Yorktown Zip Codes
Yorktown Area Codes
Income in Yorktown
Income Overview in Yorktown
Per Capita Income in Yorktown is $25,793, while median incomes of families and households are $73,182 and $66,125 respectively.
| Characteristic | Number | Measure |
| Per Capita Income | 2,183 | $25,793 |
| Median Family Income | 464 | $73,182 |
| Mean Family Income | 464 | $81,942 |
| Median Household Income | 761 | $66,125 |
| Mean Household Income | 761 | $71,165 |
| Income Deficit | 464 | $6,428 |
| Wage / Income Gap (%) | 2,183 | 21.88% |
| Wage / Income Gap ($) | 2,183 | 78.12¢ per $1 |
| Gini / Inequality Index | 2,183 | 0.43 |
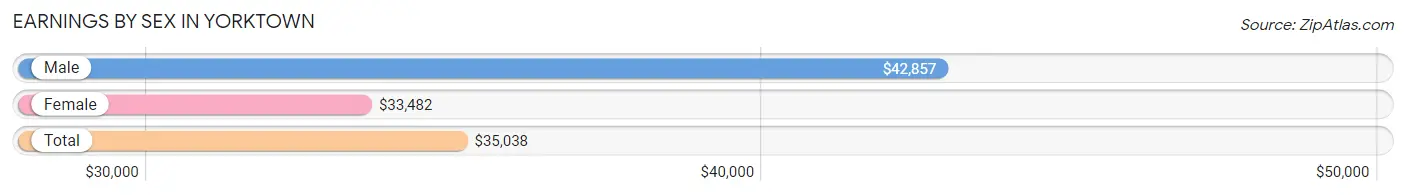
Earnings by Sex in Yorktown
Average Earnings in Yorktown are $35,038, $42,857 for men and $33,482 for women, a difference of 21.9%.
| Sex | Number | Average Earnings |
| Male | 460 (58.0%) | $42,857 |
| Female | 333 (42.0%) | $33,482 |
| Total | 793 (100.0%) | $35,038 |
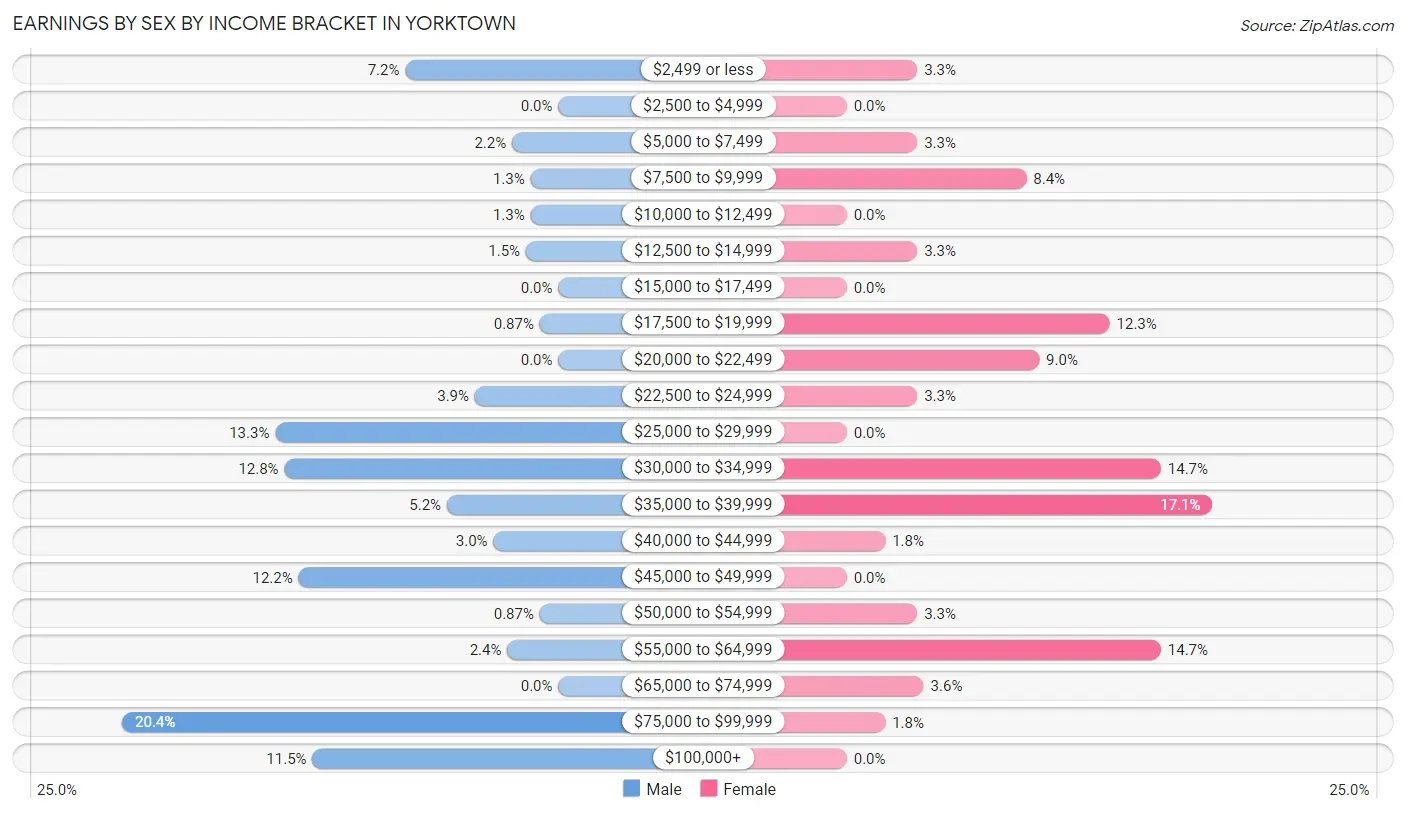
Earnings by Sex by Income Bracket in Yorktown
The most common earnings brackets in Yorktown are $75,000 to $99,999 for men (94 | 20.4%) and $35,000 to $39,999 for women (57 | 17.1%).
| Income | Male | Female |
| $2,499 or less | 33 (7.2%) | 11 (3.3%) |
| $2,500 to $4,999 | 0 (0.0%) | 0 (0.0%) |
| $5,000 to $7,499 | 10 (2.2%) | 11 (3.3%) |
| $7,500 to $9,999 | 6 (1.3%) | 28 (8.4%) |
| $10,000 to $12,499 | 6 (1.3%) | 0 (0.0%) |
| $12,500 to $14,999 | 7 (1.5%) | 11 (3.3%) |
| $15,000 to $17,499 | 0 (0.0%) | 0 (0.0%) |
| $17,500 to $19,999 | 4 (0.9%) | 41 (12.3%) |
| $20,000 to $22,499 | 0 (0.0%) | 30 (9.0%) |
| $22,500 to $24,999 | 18 (3.9%) | 11 (3.3%) |
| $25,000 to $29,999 | 61 (13.3%) | 0 (0.0%) |
| $30,000 to $34,999 | 59 (12.8%) | 49 (14.7%) |
| $35,000 to $39,999 | 24 (5.2%) | 57 (17.1%) |
| $40,000 to $44,999 | 14 (3.0%) | 6 (1.8%) |
| $45,000 to $49,999 | 56 (12.2%) | 0 (0.0%) |
| $50,000 to $54,999 | 4 (0.9%) | 11 (3.3%) |
| $55,000 to $64,999 | 11 (2.4%) | 49 (14.7%) |
| $65,000 to $74,999 | 0 (0.0%) | 12 (3.6%) |
| $75,000 to $99,999 | 94 (20.4%) | 6 (1.8%) |
| $100,000+ | 53 (11.5%) | 0 (0.0%) |
| Total | 460 (100.0%) | 333 (100.0%) |
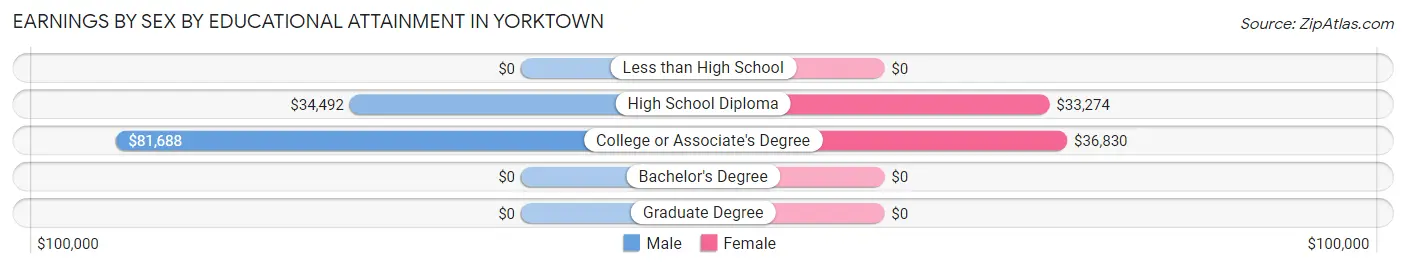
Earnings by Sex by Educational Attainment in Yorktown
Average earnings in Yorktown are $44,643 for men and $34,464 for women, a difference of 22.8%. Men with an educational attainment of college or associate's degree enjoy the highest average annual earnings of $81,688, while those with high school diploma education earn the least with $34,492. Women with an educational attainment of college or associate's degree earn the most with the average annual earnings of $36,830, while those with high school diploma education have the smallest earnings of $33,274.
| Educational Attainment | Male Income | Female Income |
| Less than High School | - | - |
| High School Diploma | $34,492 | $33,274 |
| College or Associate's Degree | $81,688 | $36,830 |
| Bachelor's Degree | - | - |
| Graduate Degree | - | - |
| Total | $44,643 | $34,464 |
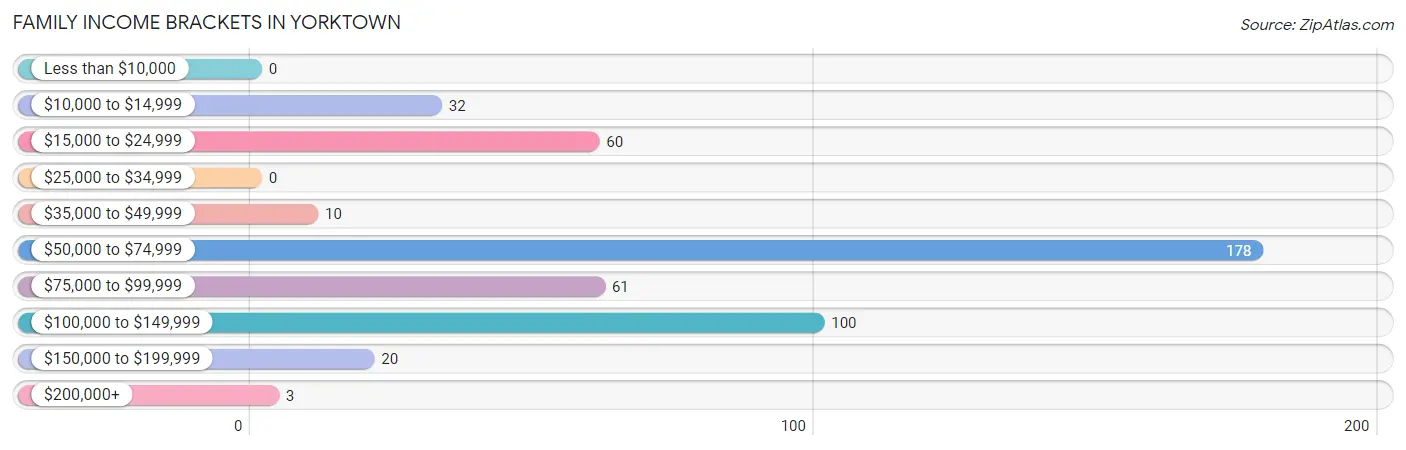
Family Income in Yorktown
Family Income Brackets in Yorktown
According to the Yorktown family income data, there are 178 families falling into the $50,000 to $74,999 income range, which is the most common income bracket and makes up 38.4% of all families.
| Income Bracket | # Families | % Families |
| Less than $10,000 | 0 | 0.0% |
| $10,000 to $14,999 | 32 | 6.9% |
| $15,000 to $24,999 | 60 | 12.9% |
| $25,000 to $34,999 | 0 | 0.0% |
| $35,000 to $49,999 | 10 | 2.2% |
| $50,000 to $74,999 | 178 | 38.4% |
| $75,000 to $99,999 | 61 | 13.1% |
| $100,000 to $149,999 | 100 | 21.6% |
| $150,000 to $199,999 | 20 | 4.3% |
| $200,000+ | 3 | 0.6% |
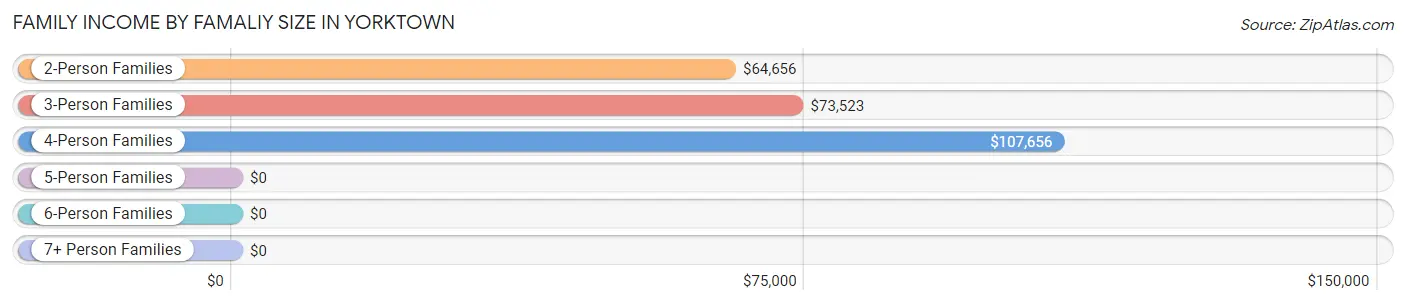
Family Income by Famaliy Size in Yorktown
4-person families (96 | 20.7%) account for the highest median family income in Yorktown with $107,656 per family, while 2-person families (215 | 46.3%) have the highest median income of $32,328 per family member.
| Income Bracket | # Families | Median Income |
| 2-Person Families | 215 (46.3%) | $64,656 |
| 3-Person Families | 120 (25.9%) | $73,523 |
| 4-Person Families | 96 (20.7%) | $107,656 |
| 5-Person Families | 18 (3.9%) | $0 |
| 6-Person Families | 15 (3.2%) | $0 |
| 7+ Person Families | 0 (0.0%) | $0 |
| Total | 464 (100.0%) | $73,182 |
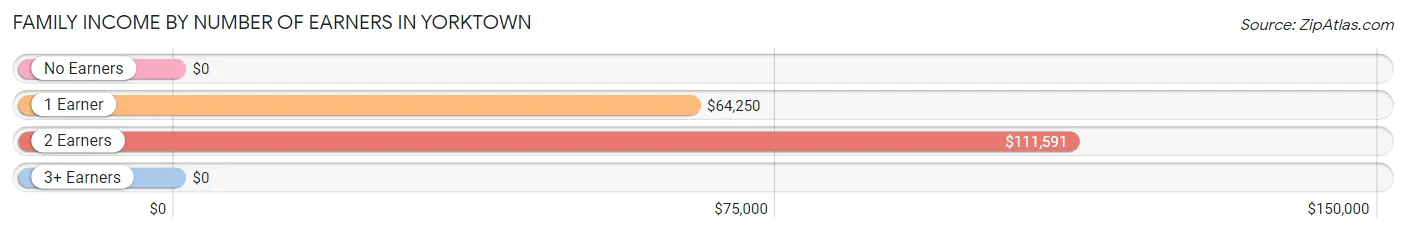
Family Income by Number of Earners in Yorktown
| Number of Earners | # Families | Median Income |
| No Earners | 157 (33.8%) | $0 |
| 1 Earner | 130 (28.0%) | $64,250 |
| 2 Earners | 172 (37.1%) | $111,591 |
| 3+ Earners | 5 (1.1%) | $0 |
| Total | 464 (100.0%) | $73,182 |
Household Income in Yorktown
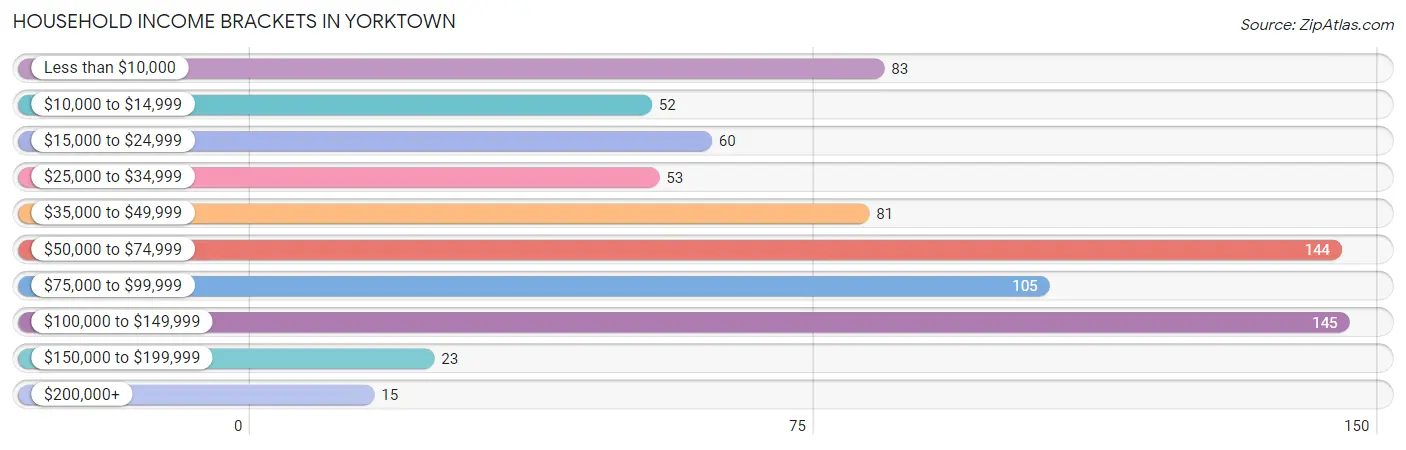
Household Income Brackets in Yorktown
With 145 households falling in the category, the $100,000 to $149,999 income range is the most frequent in Yorktown, accounting for 19.1% of all households. In contrast, only 15 households (2.0%) fall into the $200,000+ income bracket, making it the least populous group.
| Income Bracket | # Households | % Households |
| Less than $10,000 | 83 | 10.9% |
| $10,000 to $14,999 | 52 | 6.8% |
| $15,000 to $24,999 | 60 | 7.9% |
| $25,000 to $34,999 | 53 | 7.0% |
| $35,000 to $49,999 | 81 | 10.6% |
| $50,000 to $74,999 | 144 | 18.9% |
| $75,000 to $99,999 | 105 | 13.8% |
| $100,000 to $149,999 | 145 | 19.1% |
| $150,000 to $199,999 | 23 | 3.0% |
| $200,000+ | 15 | 2.0% |
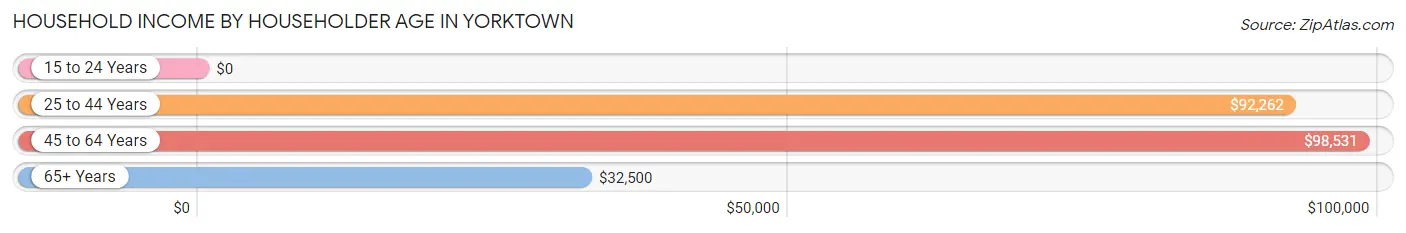
Household Income by Householder Age in Yorktown
The median household income in Yorktown is $66,125, with the highest median household income of $98,531 found in the 45 to 64 years age bracket for the primary householder. A total of 227 households (29.8%) fall into this category. Meanwhile, the 15 to 24 years age bracket for the primary householder has the lowest median household income of $0, with 12 households (1.6%) in this group.
| Income Bracket | # Households | Median Income |
| 15 to 24 Years | 12 (1.6%) | $0 |
| 25 to 44 Years | 166 (21.8%) | $92,262 |
| 45 to 64 Years | 227 (29.8%) | $98,531 |
| 65+ Years | 356 (46.8%) | $32,500 |
| Total | 761 (100.0%) | $66,125 |
Poverty in Yorktown
Income Below Poverty by Sex and Age in Yorktown
With 17.2% poverty level for males and 19.1% for females among the residents of Yorktown, 65 to 74 year old males and 16 and 17 year old females are the most vulnerable to poverty, with 81 males (55.1%) and 14 females (100.0%) in their respective age groups living below the poverty level.
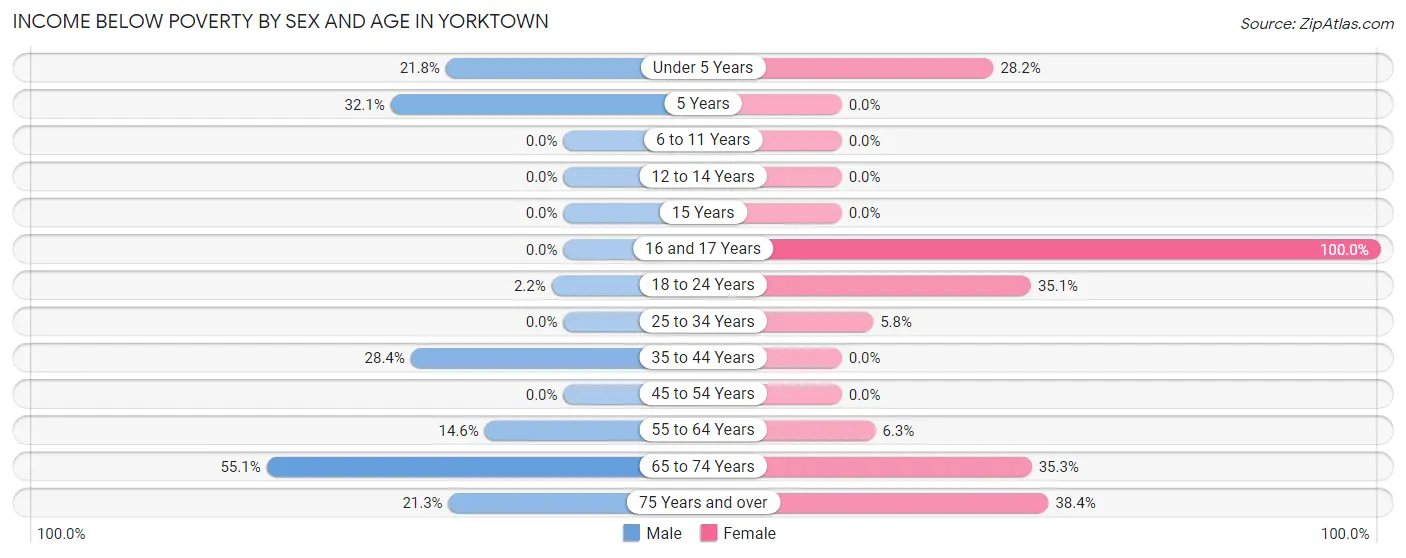
| Age Bracket | Male | Female |
| Under 5 Years | 19 (21.8%) | 29 (28.2%) |
| 5 Years | 17 (32.1%) | 0 (0.0%) |
| 6 to 11 Years | 0 (0.0%) | 0 (0.0%) |
| 12 to 14 Years | 0 (0.0%) | 0 (0.0%) |
| 15 Years | 0 (0.0%) | 0 (0.0%) |
| 16 and 17 Years | 0 (0.0%) | 14 (100.0%) |
| 18 to 24 Years | 3 (2.2%) | 33 (35.1%) |
| 25 to 34 Years | 0 (0.0%) | 7 (5.8%) |
| 35 to 44 Years | 36 (28.3%) | 0 (0.0%) |
| 45 to 54 Years | 0 (0.0%) | 0 (0.0%) |
| 55 to 64 Years | 19 (14.6%) | 3 (6.2%) |
| 65 to 74 Years | 81 (55.1%) | 49 (35.2%) |
| 75 Years and over | 16 (21.3%) | 56 (38.4%) |
| Total | 191 (17.2%) | 191 (19.1%) |
Income Above Poverty by Sex and Age in Yorktown
According to the poverty statistics in Yorktown, males aged 6 to 11 years and females aged 5 years are the age groups that are most secure financially, with 100.0% of males and 100.0% of females in these age groups living above the poverty line.
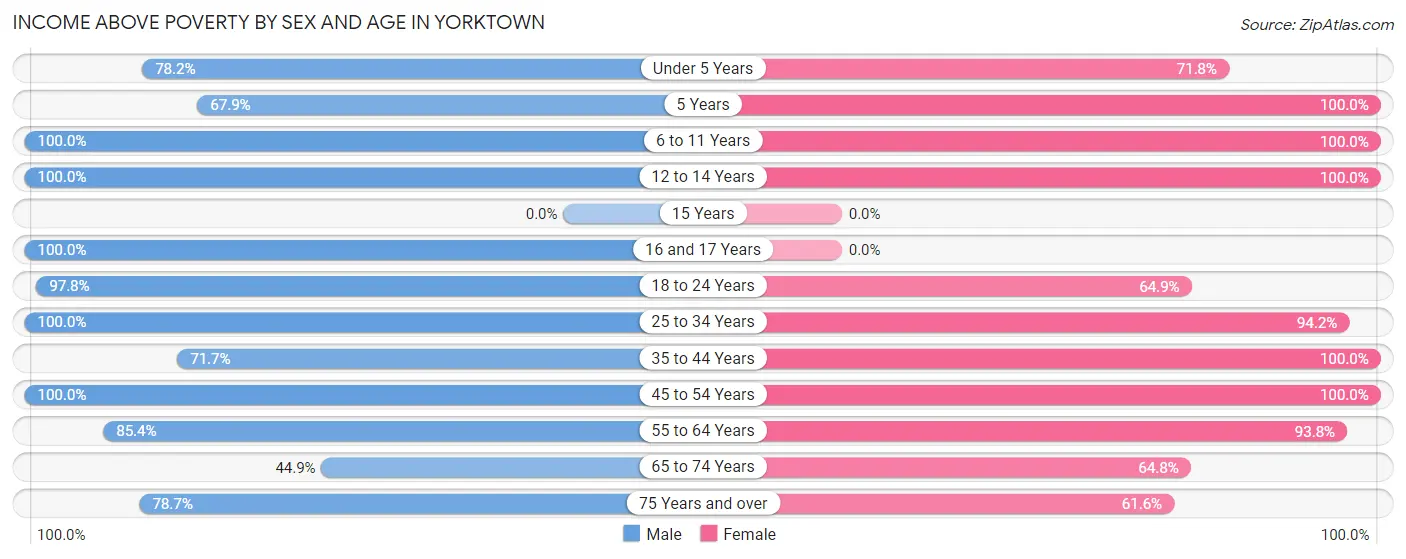
| Age Bracket | Male | Female |
| Under 5 Years | 68 (78.2%) | 74 (71.8%) |
| 5 Years | 36 (67.9%) | 15 (100.0%) |
| 6 to 11 Years | 52 (100.0%) | 65 (100.0%) |
| 12 to 14 Years | 42 (100.0%) | 63 (100.0%) |
| 15 Years | 0 (0.0%) | 0 (0.0%) |
| 16 and 17 Years | 48 (100.0%) | 0 (0.0%) |
| 18 to 24 Years | 134 (97.8%) | 61 (64.9%) |
| 25 to 34 Years | 157 (100.0%) | 113 (94.2%) |
| 35 to 44 Years | 91 (71.7%) | 76 (100.0%) |
| 45 to 54 Years | 55 (100.0%) | 116 (100.0%) |
| 55 to 64 Years | 111 (85.4%) | 45 (93.8%) |
| 65 to 74 Years | 66 (44.9%) | 90 (64.7%) |
| 75 Years and over | 59 (78.7%) | 90 (61.6%) |
| Total | 919 (82.8%) | 808 (80.9%) |
Income Below Poverty Among Married-Couple Families in Yorktown
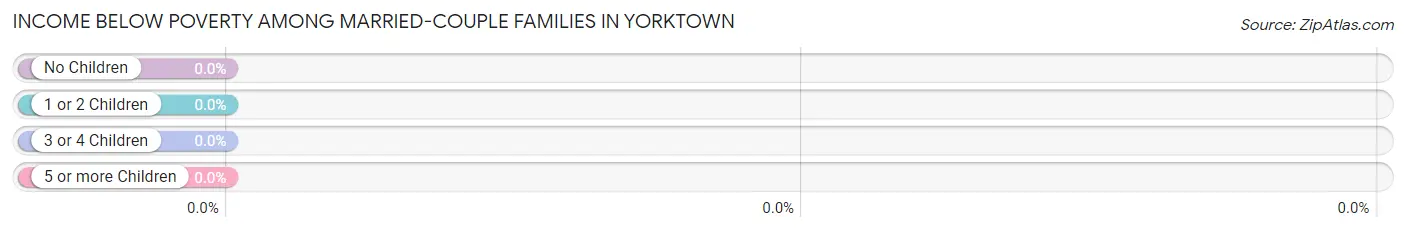
| Children | Above Poverty | Below Poverty |
| No Children | 209 (100.0%) | 0 (0.0%) |
| 1 or 2 Children | 78 (100.0%) | 0 (0.0%) |
| 3 or 4 Children | 33 (100.0%) | 0 (0.0%) |
| 5 or more Children | 0 (0.0%) | 0 (0.0%) |
| Total | 320 (100.0%) | 0 (0.0%) |
Income Below Poverty Among Single-Parent Households in Yorktown
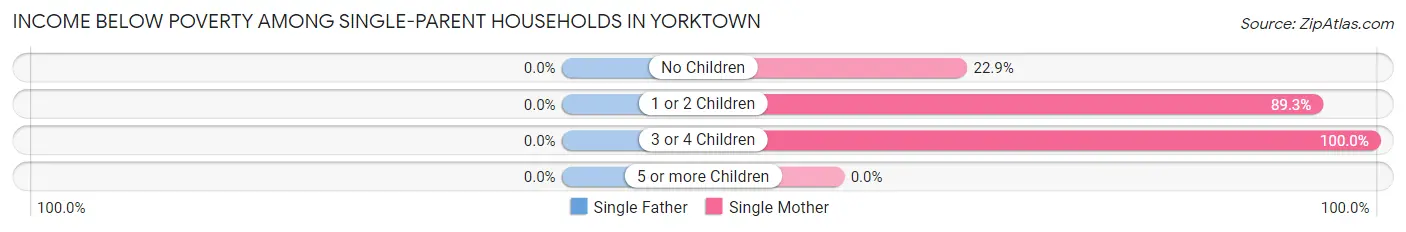
| Children | Single Father | Single Mother |
| No Children | 0 (0.0%) | 19 (22.9%) |
| 1 or 2 Children | 0 (0.0%) | 25 (89.3%) |
| 3 or 4 Children | 0 (0.0%) | 2 (100.0%) |
| 5 or more Children | 0 (0.0%) | 0 (0.0%) |
| Total | 0 (0.0%) | 46 (40.7%) |
Income Below Poverty Among Married-Couple vs Single-Parent Households in Yorktown
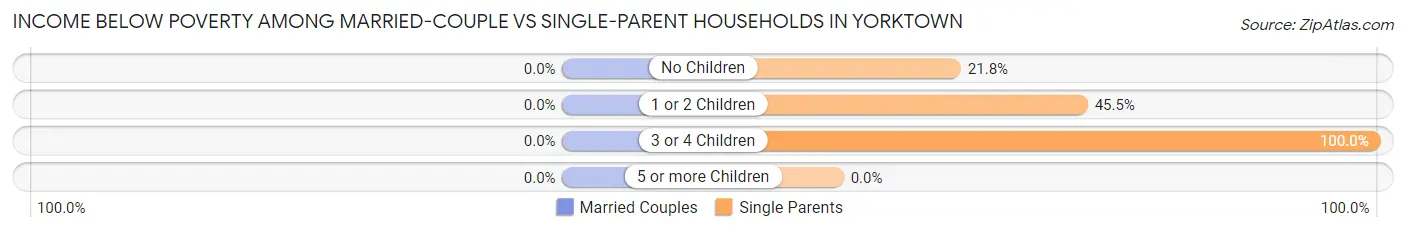
| Children | Married-Couple Families | Single-Parent Households |
| No Children | 0 (0.0%) | 19 (21.8%) |
| 1 or 2 Children | 0 (0.0%) | 25 (45.5%) |
| 3 or 4 Children | 0 (0.0%) | 2 (100.0%) |
| 5 or more Children | 0 (0.0%) | 0 (0.0%) |
| Total | 0 (0.0%) | 46 (31.9%) |
Race in Yorktown
The most populous races in Yorktown are Hispanic or Latino (1,232 | 56.4%), White / Caucasian (1,147 | 52.5%), and Some other Race (919 | 42.1%).
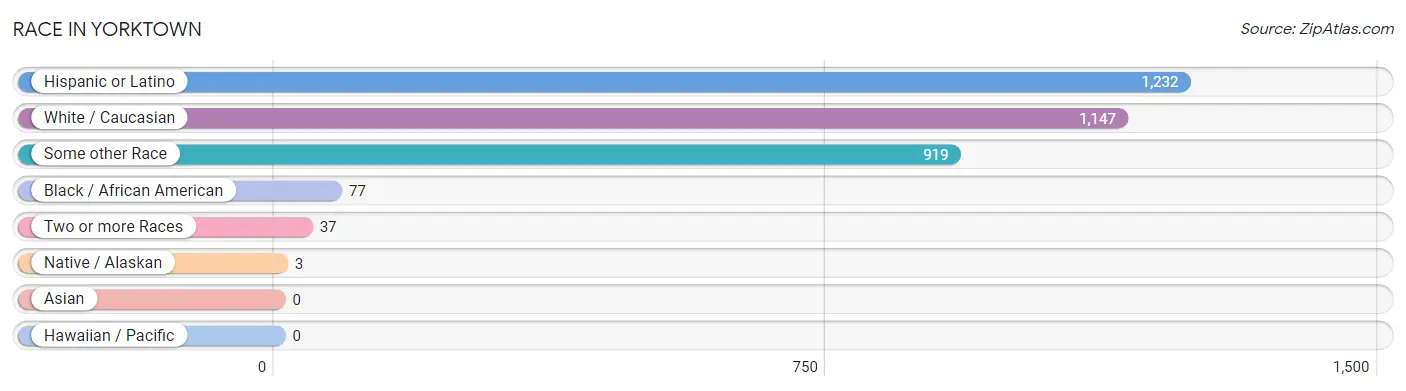
| Race | # Population | % Population |
| Asian | 0 | 0.0% |
| Black / African American | 77 | 3.5% |
| Hawaiian / Pacific | 0 | 0.0% |
| Hispanic or Latino | 1,232 | 56.4% |
| Native / Alaskan | 3 | 0.1% |
| White / Caucasian | 1,147 | 52.5% |
| Two or more Races | 37 | 1.7% |
| Some other Race | 919 | 42.1% |
| Total | 2,183 | 100.0% |
Ancestry in Yorktown
The most populous ancestries reported in Yorktown are Mexican (1,144 | 52.4%), German (700 | 32.1%), Irish (126 | 5.8%), Polish (104 | 4.8%), and English (80 | 3.7%), together accounting for 98.7% of all Yorktown residents.
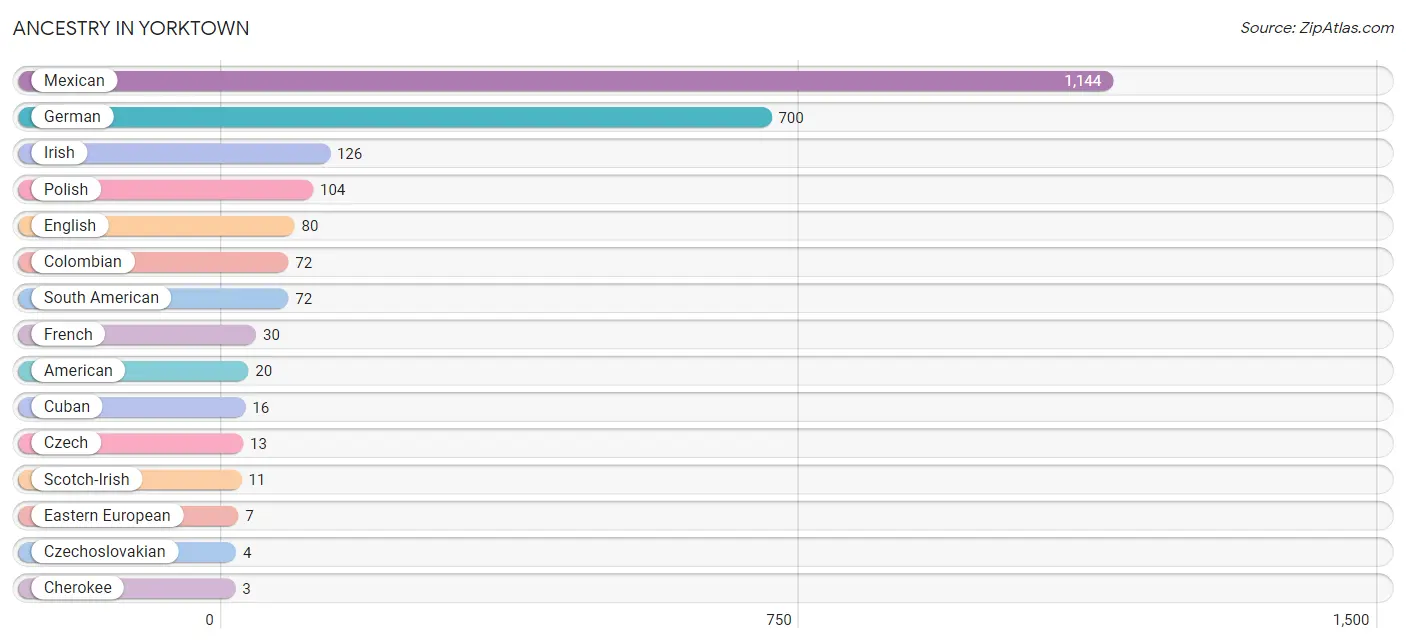
| Ancestry | # Population | % Population |
| American | 20 | 0.9% |
| Cherokee | 3 | 0.1% |
| Choctaw | 1 | 0.1% |
| Colombian | 72 | 3.3% |
| Cuban | 16 | 0.7% |
| Czech | 13 | 0.6% |
| Czechoslovakian | 4 | 0.2% |
| Eastern European | 7 | 0.3% |
| English | 80 | 3.7% |
| French | 30 | 1.4% |
| German | 700 | 32.1% |
| Irish | 126 | 5.8% |
| Italian | 3 | 0.1% |
| Mexican | 1,144 | 52.4% |
| Polish | 104 | 4.8% |
| Scotch-Irish | 11 | 0.5% |
| South American | 72 | 3.3% | View All 17 Rows |
Immigrants in Yorktown
The most numerous immigrant groups reported in Yorktown came from Central America (26 | 1.2%), Latin America (26 | 1.2%), and Mexico (26 | 1.2%), together accounting for 3.6% of all Yorktown residents.
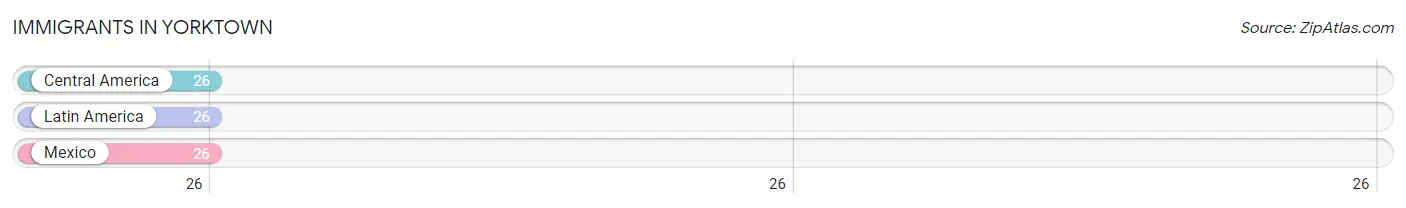
| Immigration Origin | # Population | % Population |
| Central America | 26 | 1.2% |
| Latin America | 26 | 1.2% |
| Mexico | 26 | 1.2% | View All 3 Rows |
Sex and Age in Yorktown
Sex and Age in Yorktown
The most populous age groups in Yorktown are 70 to 74 Years (120 | 10.7%) for men and 10 to 14 Years (139 | 13.2%) for women.
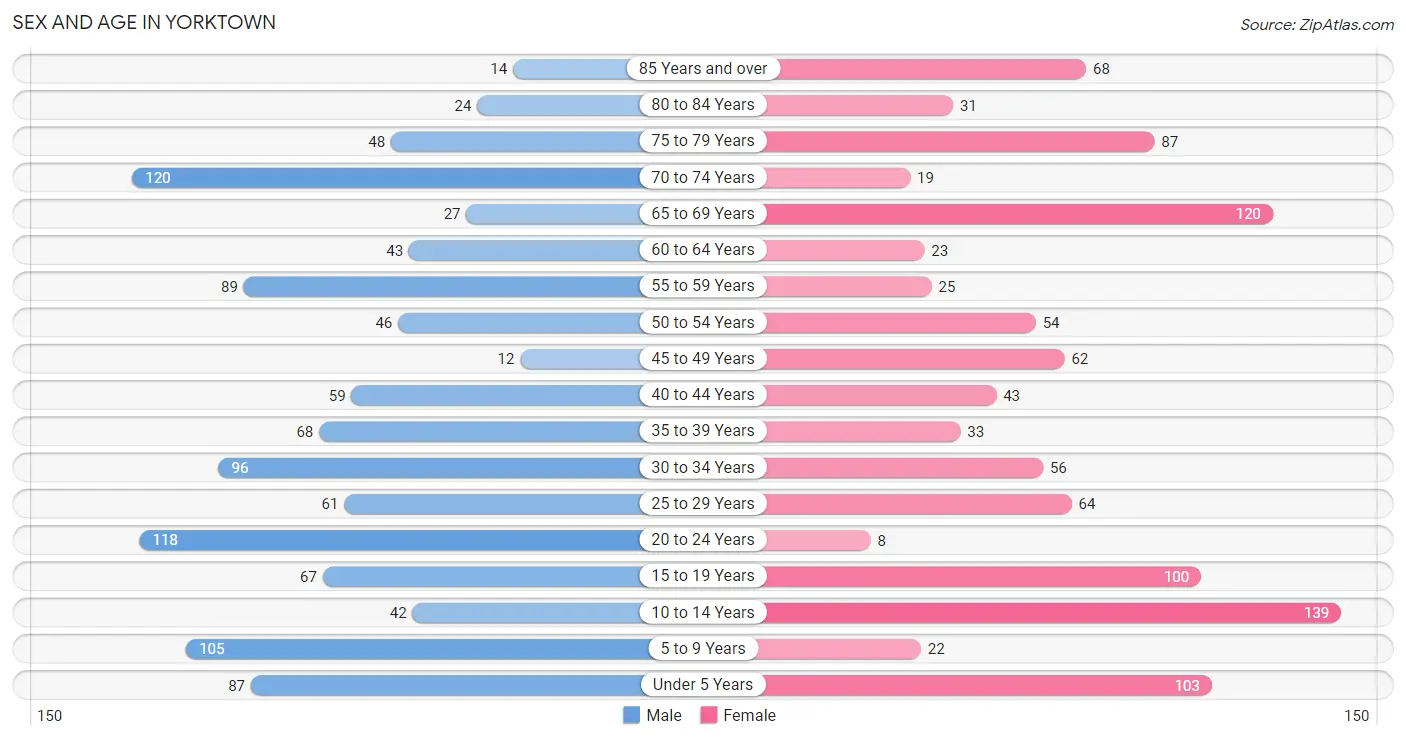
| Age Bracket | Male | Female |
| Under 5 Years | 87 (7.7%) | 103 (9.7%) |
| 5 to 9 Years | 105 (9.3%) | 22 (2.1%) |
| 10 to 14 Years | 42 (3.7%) | 139 (13.2%) |
| 15 to 19 Years | 67 (5.9%) | 100 (9.5%) |
| 20 to 24 Years | 118 (10.5%) | 8 (0.8%) |
| 25 to 29 Years | 61 (5.4%) | 64 (6.0%) |
| 30 to 34 Years | 96 (8.5%) | 56 (5.3%) |
| 35 to 39 Years | 68 (6.0%) | 33 (3.1%) |
| 40 to 44 Years | 59 (5.2%) | 43 (4.1%) |
| 45 to 49 Years | 12 (1.1%) | 62 (5.9%) |
| 50 to 54 Years | 46 (4.1%) | 54 (5.1%) |
| 55 to 59 Years | 89 (7.9%) | 25 (2.4%) |
| 60 to 64 Years | 43 (3.8%) | 23 (2.2%) |
| 65 to 69 Years | 27 (2.4%) | 120 (11.4%) |
| 70 to 74 Years | 120 (10.7%) | 19 (1.8%) |
| 75 to 79 Years | 48 (4.3%) | 87 (8.2%) |
| 80 to 84 Years | 24 (2.1%) | 31 (2.9%) |
| 85 Years and over | 14 (1.2%) | 68 (6.4%) |
| Total | 1,126 (100.0%) | 1,057 (100.0%) |
Families and Households in Yorktown
Median Family Size in Yorktown
The median family size in Yorktown is 3.49 persons per family, with single male/father families (31 | 6.7%) accounting for the largest median family size of 4.19 persons per family. On the other hand, single female/mother families (113 | 24.3%) represent the smallest median family size with 3.32 persons per family.
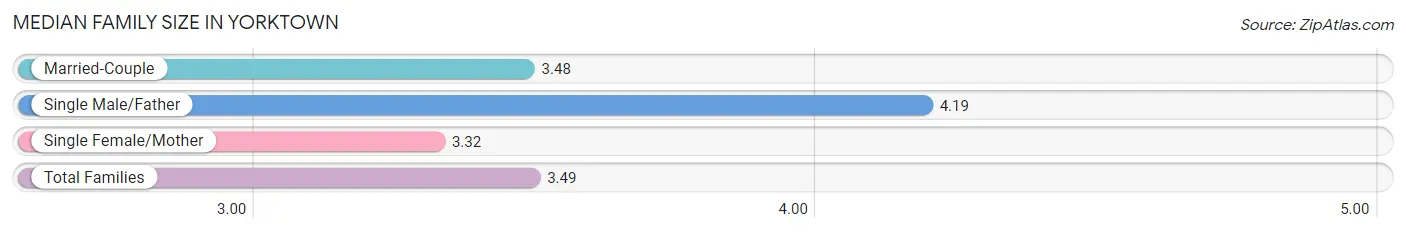
| Family Type | # Families | Family Size |
| Married-Couple | 320 (69.0%) | 3.48 |
| Single Male/Father | 31 (6.7%) | 4.19 |
| Single Female/Mother | 113 (24.3%) | 3.32 |
| Total Families | 464 (100.0%) | 3.49 |
Median Household Size in Yorktown
The median household size in Yorktown is 2.79 persons per household, with single male/father households (31 | 4.1%) accounting for the largest median household size of 4.74 persons per household. non-family households (297 | 39.0%) represent the smallest median household size with 1.22 persons per household.
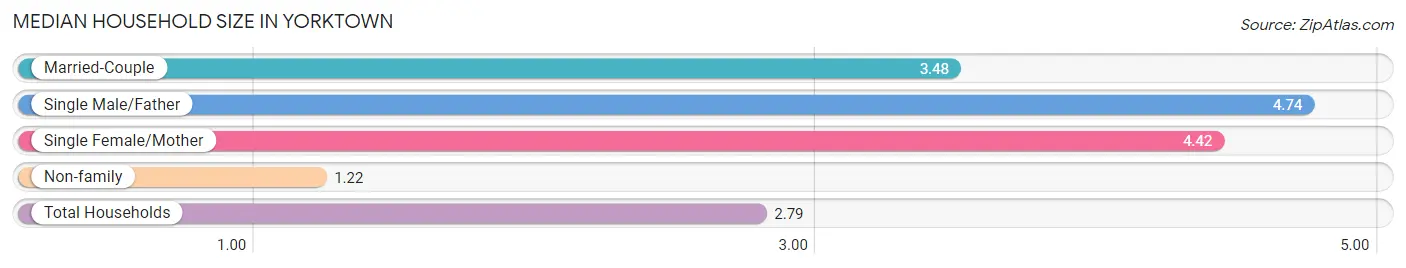
| Household Type | # Households | Household Size |
| Married-Couple | 320 (42.0%) | 3.48 |
| Single Male/Father | 31 (4.1%) | 4.74 |
| Single Female/Mother | 113 (14.8%) | 4.42 |
| Non-family | 297 (39.0%) | 1.22 |
| Total Households | 761 (100.0%) | 2.79 |
Household Size by Marriage Status in Yorktown
Out of a total of 761 households in Yorktown, 464 (61.0%) are family households, while 297 (39.0%) are nonfamily households. The most numerous type of family households are 3-person households, comprising 171, and the most common type of nonfamily households are 1-person households, comprising 263.
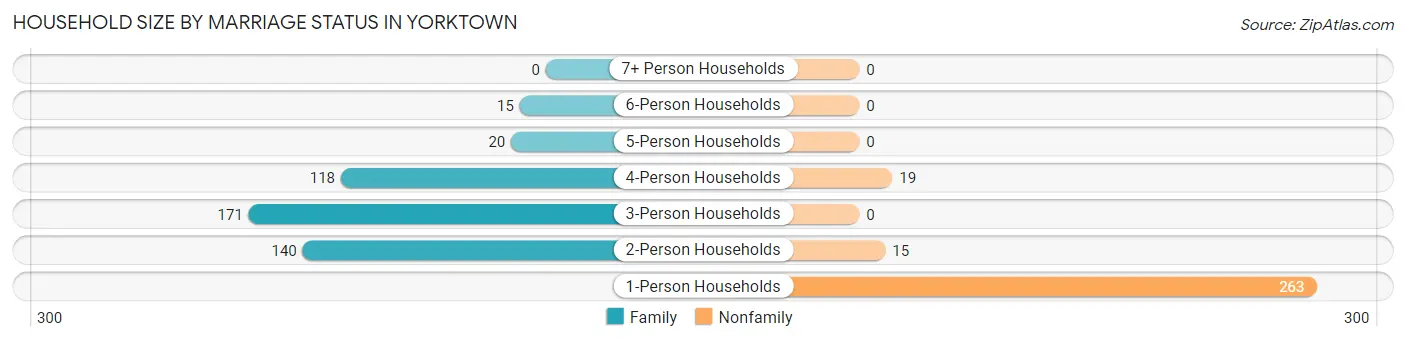
| Household Size | Family Households | Nonfamily Households |
| 1-Person Households | - | 263 (34.6%) |
| 2-Person Households | 140 (18.4%) | 15 (2.0%) |
| 3-Person Households | 171 (22.5%) | 0 (0.0%) |
| 4-Person Households | 118 (15.5%) | 19 (2.5%) |
| 5-Person Households | 20 (2.6%) | 0 (0.0%) |
| 6-Person Households | 15 (2.0%) | 0 (0.0%) |
| 7+ Person Households | 0 (0.0%) | 0 (0.0%) |
| Total | 464 (61.0%) | 297 (39.0%) |
Female Fertility in Yorktown
Fertility by Age in Yorktown
Average fertility rate in Yorktown is 71.0 births per 1,000 women. Women in the age bracket of 20 to 34 years have the highest fertility rate with 203.0 births per 1,000 women. Women in the age bracket of 20 to 34 years acount for 100.0% of all women with births.
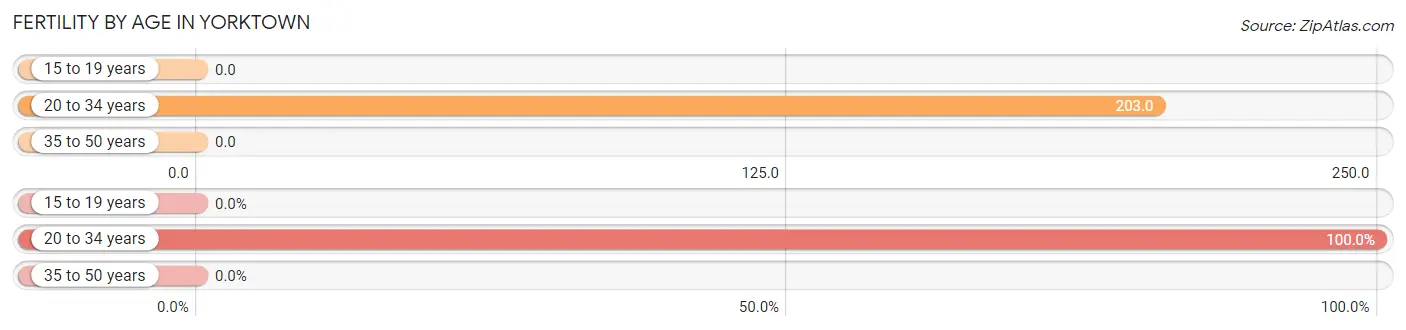
| Age Bracket | Women with Births | Births / 1,000 Women |
| 15 to 19 years | 0 (0.0%) | 0.0 |
| 20 to 34 years | 26 (100.0%) | 203.0 |
| 35 to 50 years | 0 (0.0%) | 0.0 |
| Total | 26 (100.0%) | 71.0 |
Fertility by Age by Marriage Status in Yorktown
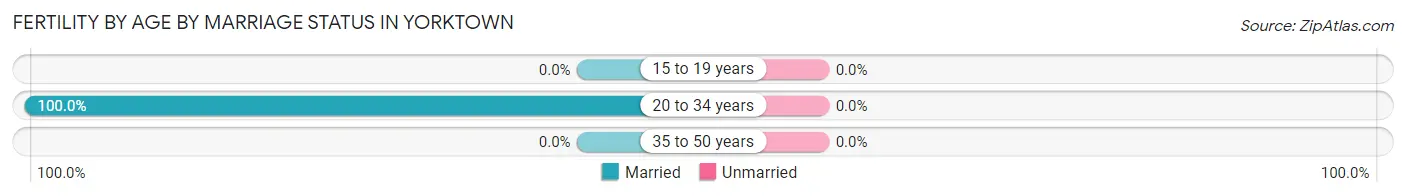
| Age Bracket | Married | Unmarried |
| 15 to 19 years | 0 (0.0%) | 0 (0.0%) |
| 20 to 34 years | 26 (100.0%) | 0 (0.0%) |
| 35 to 50 years | 0 (0.0%) | 0 (0.0%) |
| Total | 26 (100.0%) | 0 (0.0%) |
Fertility by Education in Yorktown
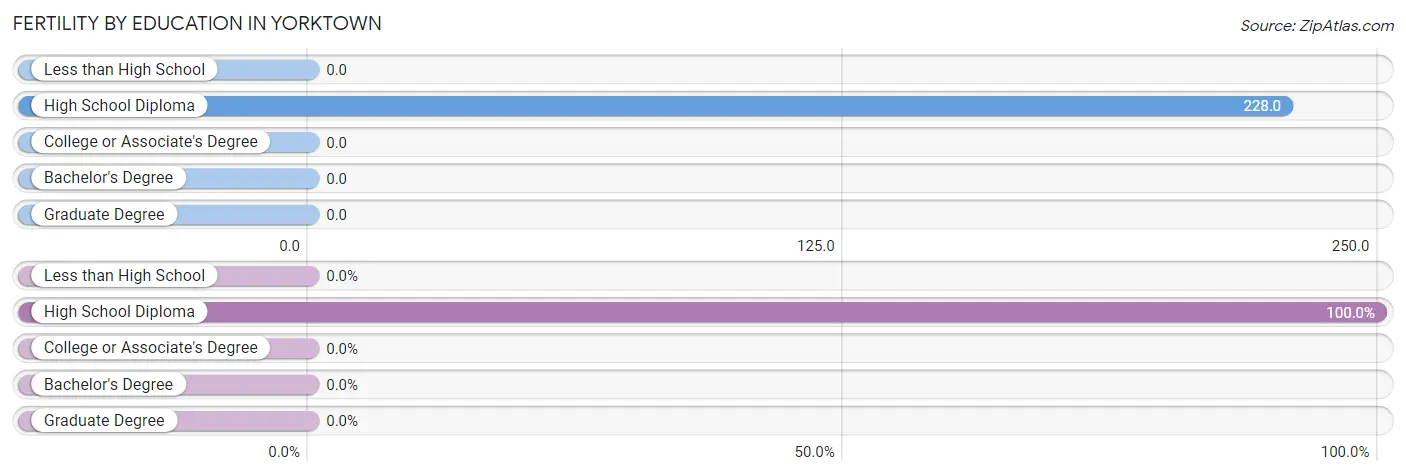
| Educational Attainment | Women with Births | Births / 1,000 Women |
| Less than High School | 0 (0.0%) | 0.0 |
| High School Diploma | 26 (100.0%) | 228.0 |
| College or Associate's Degree | 0 (0.0%) | 0.0 |
| Bachelor's Degree | 0 (0.0%) | 0.0 |
| Graduate Degree | 0 (0.0%) | 0.0 |
| Total | 26 (100.0%) | 71.0 |
Fertility by Education by Marriage Status in Yorktown
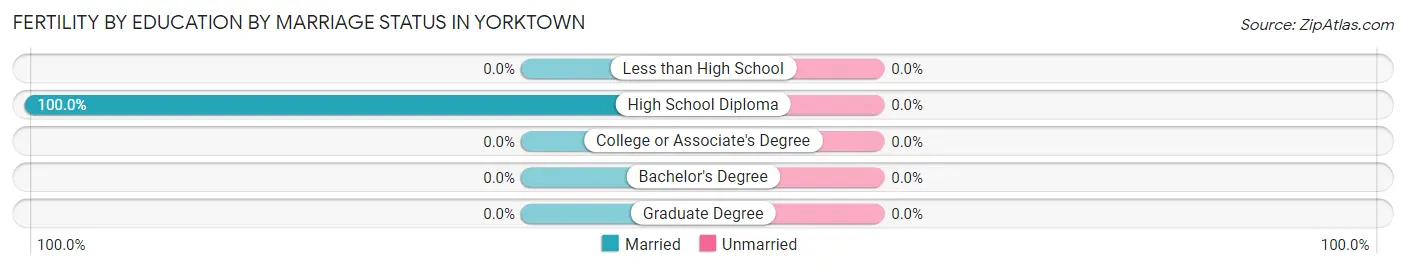
| Educational Attainment | Married | Unmarried |
| Less than High School | 0 (0.0%) | 0 (0.0%) |
| High School Diploma | 26 (100.0%) | 0 (0.0%) |
| College or Associate's Degree | 0 (0.0%) | 0 (0.0%) |
| Bachelor's Degree | 0 (0.0%) | 0 (0.0%) |
| Graduate Degree | 0 (0.0%) | 0 (0.0%) |
| Total | 26 (100.0%) | 0 (0.0%) |
Employment Characteristics in Yorktown
Employment by Class of Employer in Yorktown
Among the 699 employed individuals in Yorktown, private company employees (566 | 81.0%), self-employed (not incorporated) (53 | 7.6%), and local government employees (41 | 5.9%) make up the most common classes of employment.
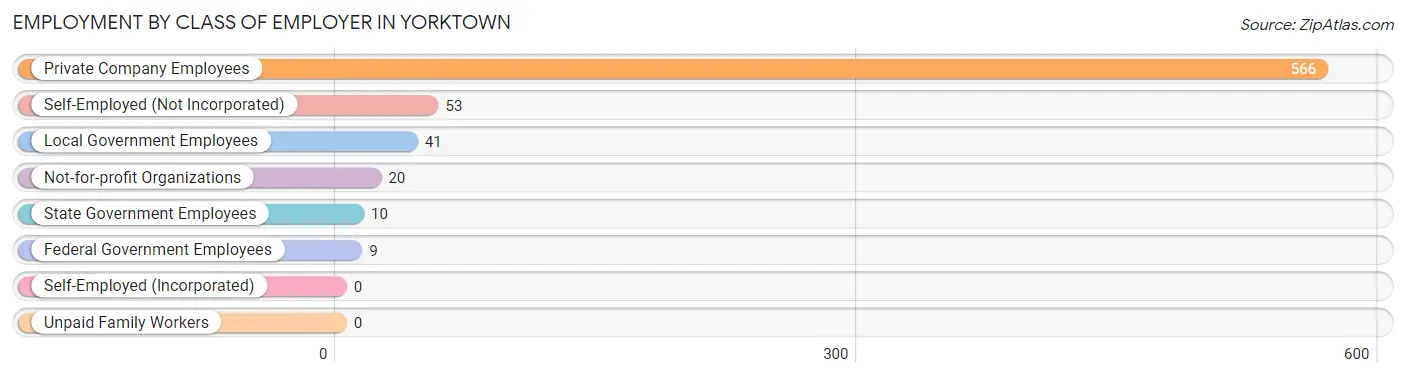
| Employer Class | # Employees | % Employees |
| Private Company Employees | 566 | 81.0% |
| Self-Employed (Incorporated) | 0 | 0.0% |
| Self-Employed (Not Incorporated) | 53 | 7.6% |
| Not-for-profit Organizations | 20 | 2.9% |
| Local Government Employees | 41 | 5.9% |
| State Government Employees | 10 | 1.4% |
| Federal Government Employees | 9 | 1.3% |
| Unpaid Family Workers | 0 | 0.0% |
| Total | 699 | 100.0% |
Employment Status by Age in Yorktown
According to the labor force statistics for Yorktown, out of the total population over 16 years of age (1,685), 45.3% or 763 individuals are in the labor force, with 7.5% or 57 of them unemployed. The age group with the highest labor force participation rate is 45 to 54 years, with 84.5% or 147 individuals in the labor force. Within the labor force, the 16 to 19 years age range has the highest percentage of unemployed individuals, with 69.4% or 25 of them being unemployed.
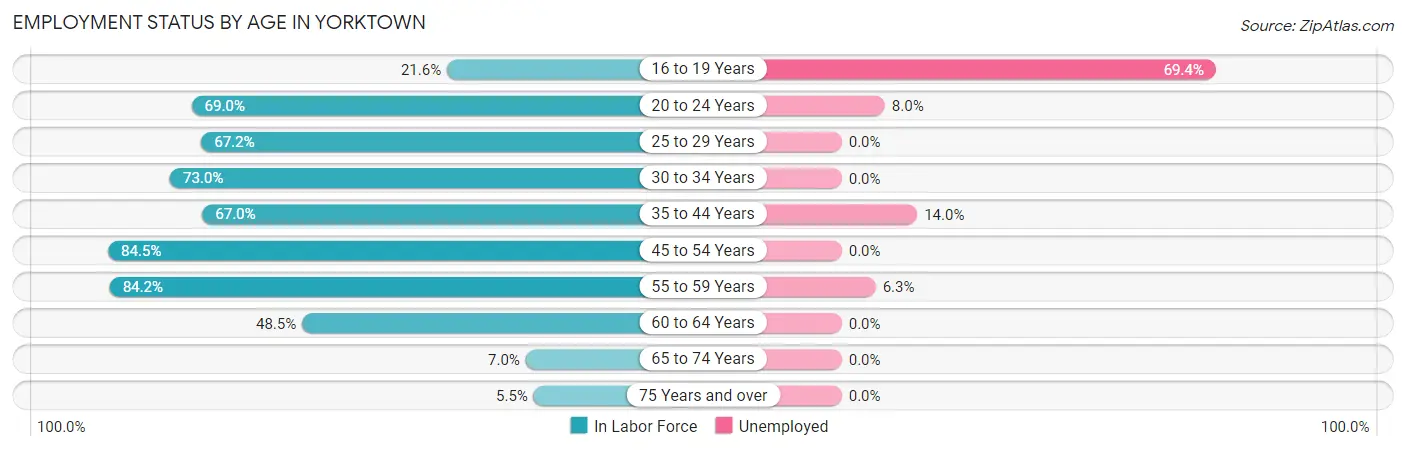
| Age Bracket | In Labor Force | Unemployed |
| 16 to 19 Years | 36 (21.6%) | 25 (69.4%) |
| 20 to 24 Years | 87 (69.0%) | 7 (8.0%) |
| 25 to 29 Years | 84 (67.2%) | 0 (0.0%) |
| 30 to 34 Years | 111 (73.0%) | 0 (0.0%) |
| 35 to 44 Years | 136 (67.0%) | 19 (14.0%) |
| 45 to 54 Years | 147 (84.5%) | 0 (0.0%) |
| 55 to 59 Years | 96 (84.2%) | 6 (6.3%) |
| 60 to 64 Years | 32 (48.5%) | 0 (0.0%) |
| 65 to 74 Years | 20 (7.0%) | 0 (0.0%) |
| 75 Years and over | 15 (5.5%) | 0 (0.0%) |
| Total | 763 (45.3%) | 57 (7.5%) |
Employment Status by Educational Attainment in Yorktown
According to labor force statistics for Yorktown, 72.7% of individuals (606) out of the total population between 25 and 64 years of age (834) are in the labor force, with 4.1% or 25 of them being unemployed. The group with the highest labor force participation rate are those with the educational attainment of college / associate degree, with 76.4% or 204 individuals in the labor force. Within the labor force, individuals with high school diploma education have the highest percentage of unemployment, with 8.1% or 25 of them being unemployed.
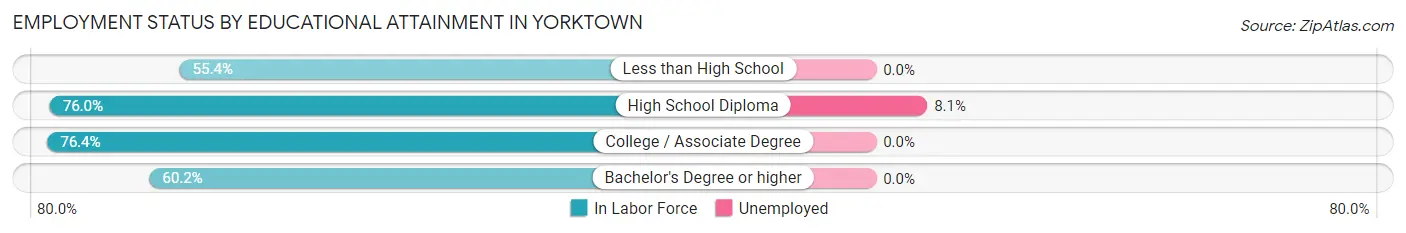
| Educational Attainment | In Labor Force | Unemployed |
| Less than High School | 36 (55.4%) | 0 (0.0%) |
| High School Diploma | 307 (76.0%) | 33 (8.1%) |
| College / Associate Degree | 204 (76.4%) | 0 (0.0%) |
| Bachelor's Degree or higher | 59 (60.2%) | 0 (0.0%) |
| Total | 606 (72.7%) | 34 (4.1%) |
Employment Occupations by Sex in Yorktown
Management, Business, Science and Arts Occupations
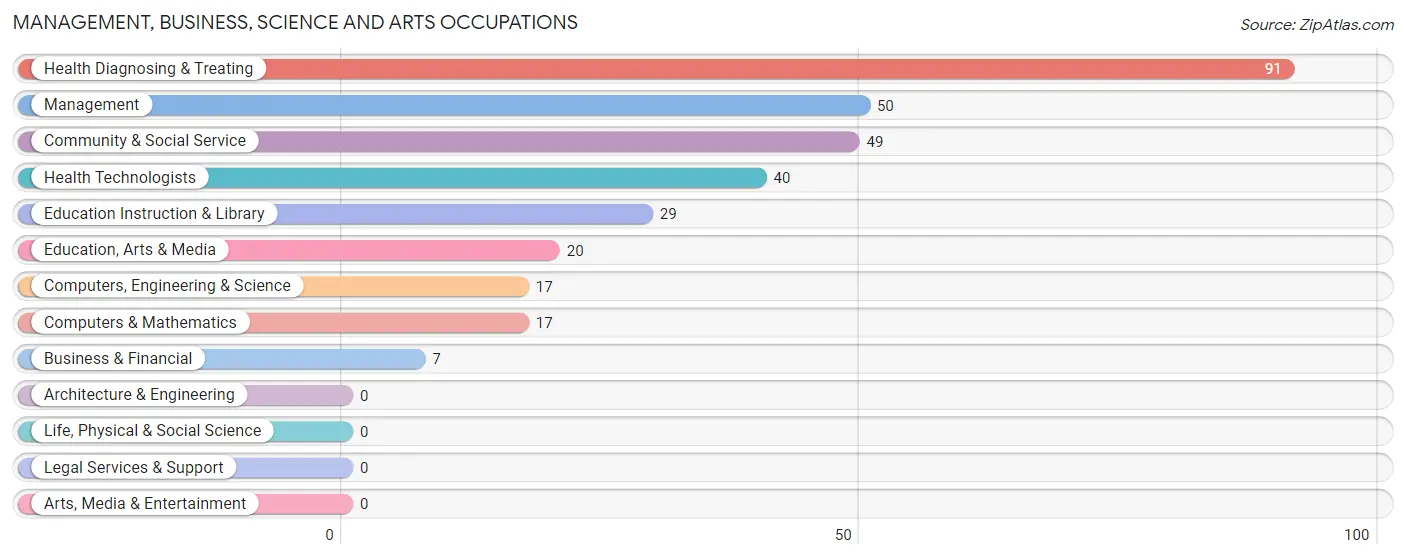
The most common Management, Business, Science and Arts occupations in Yorktown are Health Diagnosing & Treating (91 | 12.9%), Management (50 | 7.1%), Community & Social Service (49 | 6.9%), Health Technologists (40 | 5.7%), and Education Instruction & Library (29 | 4.1%).
Management, Business, Science and Arts Occupations by Sex
Within the Management, Business, Science and Arts occupations in Yorktown, the most male-oriented occupations are Business & Financial (100.0%), Computers, Engineering & Science (100.0%), and Computers & Mathematics (100.0%), while the most female-oriented occupations are Education Instruction & Library (100.0%), Health Diagnosing & Treating (100.0%), and Health Technologists (100.0%).
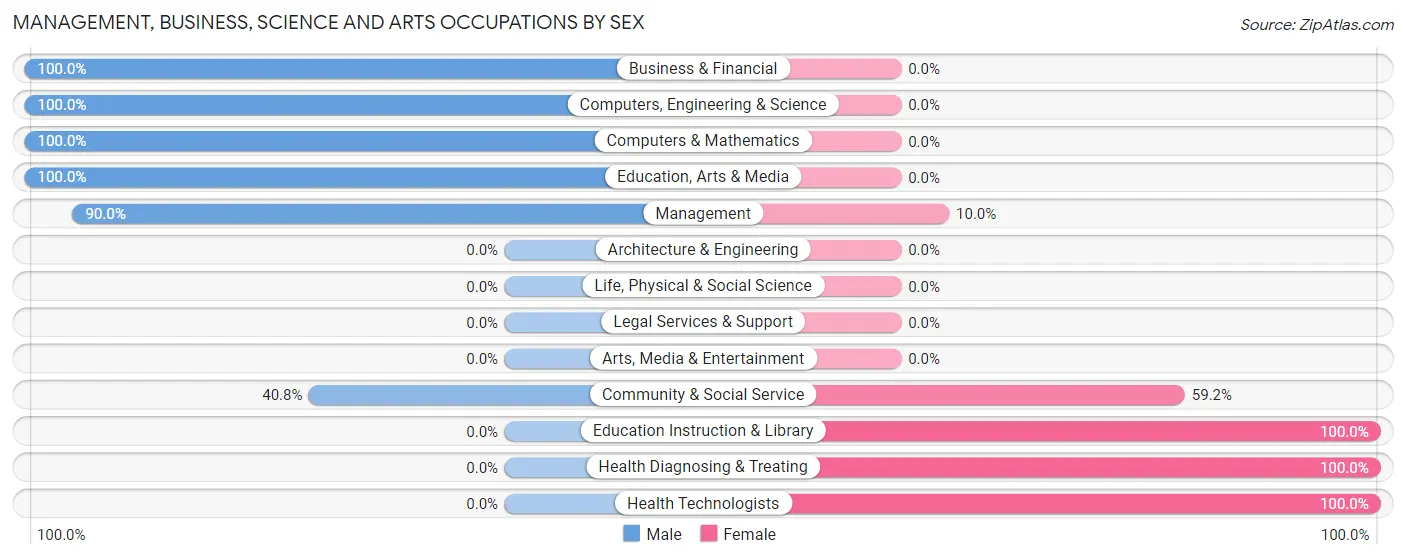
| Occupation | Male | Female |
| Management | 45 (90.0%) | 5 (10.0%) |
| Business & Financial | 7 (100.0%) | 0 (0.0%) |
| Computers, Engineering & Science | 17 (100.0%) | 0 (0.0%) |
| Computers & Mathematics | 17 (100.0%) | 0 (0.0%) |
| Architecture & Engineering | 0 (0.0%) | 0 (0.0%) |
| Life, Physical & Social Science | 0 (0.0%) | 0 (0.0%) |
| Community & Social Service | 20 (40.8%) | 29 (59.2%) |
| Education, Arts & Media | 20 (100.0%) | 0 (0.0%) |
| Legal Services & Support | 0 (0.0%) | 0 (0.0%) |
| Education Instruction & Library | 0 (0.0%) | 29 (100.0%) |
| Arts, Media & Entertainment | 0 (0.0%) | 0 (0.0%) |
| Health Diagnosing & Treating | 0 (0.0%) | 91 (100.0%) |
| Health Technologists | 0 (0.0%) | 40 (100.0%) |
| Total (Category) | 89 (41.6%) | 125 (58.4%) |
| Total (Overall) | 425 (60.1%) | 282 (39.9%) |
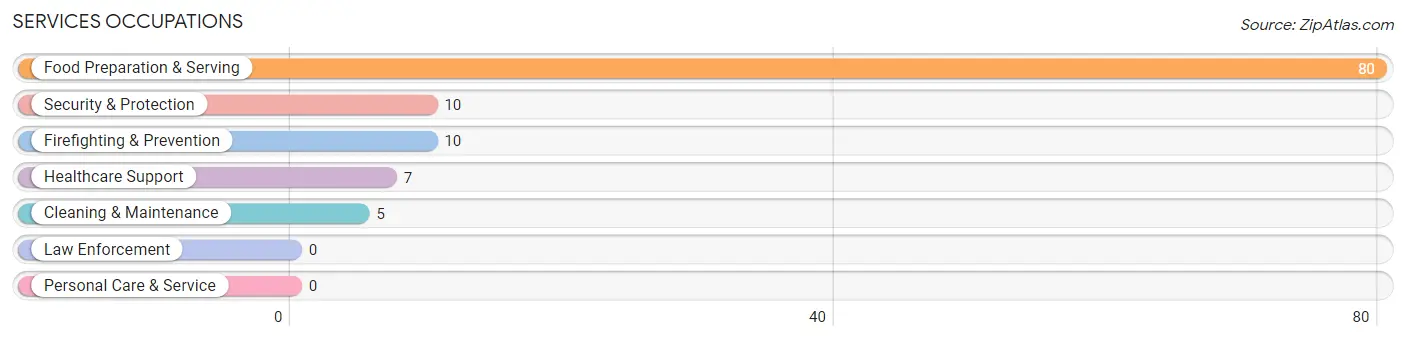
Services Occupations
The most common Services occupations in Yorktown are Food Preparation & Serving (80 | 11.3%), Security & Protection (10 | 1.4%), Firefighting & Prevention (10 | 1.4%), Healthcare Support (7 | 1.0%), and Cleaning & Maintenance (5 | 0.7%).
Services Occupations by Sex
Within the Services occupations in Yorktown, the most male-oriented occupations are Security & Protection (100.0%), Firefighting & Prevention (100.0%), and Food Preparation & Serving (46.3%), while the most female-oriented occupations are Healthcare Support (100.0%), Cleaning & Maintenance (100.0%), and Food Preparation & Serving (53.7%).
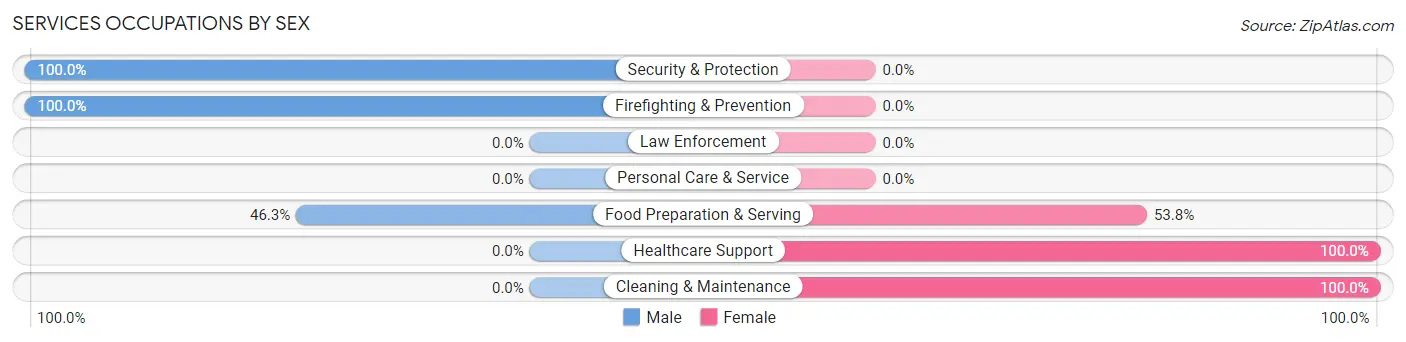
| Occupation | Male | Female |
| Healthcare Support | 0 (0.0%) | 7 (100.0%) |
| Security & Protection | 10 (100.0%) | 0 (0.0%) |
| Firefighting & Prevention | 10 (100.0%) | 0 (0.0%) |
| Law Enforcement | 0 (0.0%) | 0 (0.0%) |
| Food Preparation & Serving | 37 (46.3%) | 43 (53.7%) |
| Cleaning & Maintenance | 0 (0.0%) | 5 (100.0%) |
| Personal Care & Service | 0 (0.0%) | 0 (0.0%) |
| Total (Category) | 47 (46.1%) | 55 (53.9%) |
| Total (Overall) | 425 (60.1%) | 282 (39.9%) |
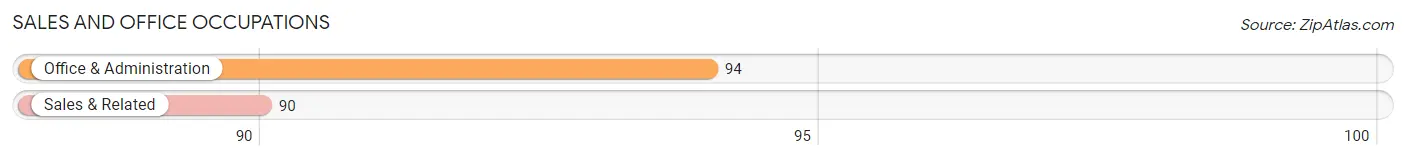
Sales and Office Occupations
The most common Sales and Office occupations in Yorktown are Office & Administration (94 | 13.3%), and Sales & Related (90 | 12.7%).
Sales and Office Occupations by Sex

| Occupation | Male | Female |
| Sales & Related | 16 (17.8%) | 74 (82.2%) |
| Office & Administration | 77 (81.9%) | 17 (18.1%) |
| Total (Category) | 93 (50.5%) | 91 (49.5%) |
| Total (Overall) | 425 (60.1%) | 282 (39.9%) |
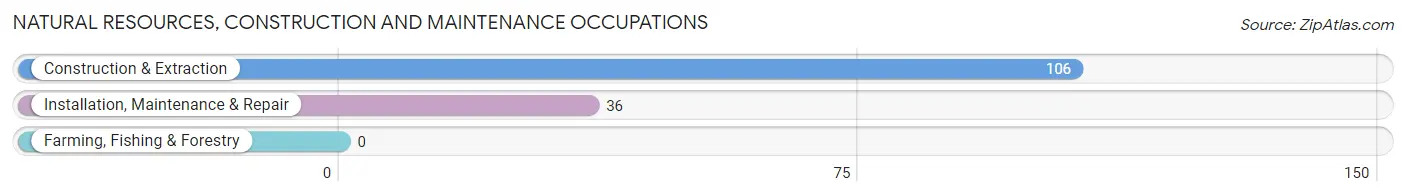
Natural Resources, Construction and Maintenance Occupations
The most common Natural Resources, Construction and Maintenance occupations in Yorktown are Construction & Extraction (106 | 15.0%), and Installation, Maintenance & Repair (36 | 5.1%).
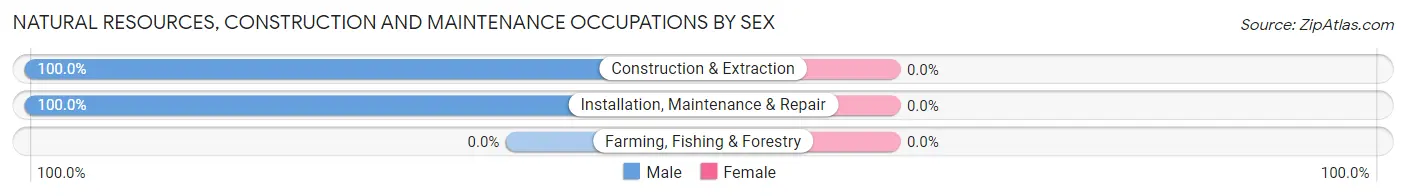
Natural Resources, Construction and Maintenance Occupations by Sex
| Occupation | Male | Female |
| Farming, Fishing & Forestry | 0 (0.0%) | 0 (0.0%) |
| Construction & Extraction | 106 (100.0%) | 0 (0.0%) |
| Installation, Maintenance & Repair | 36 (100.0%) | 0 (0.0%) |
| Total (Category) | 142 (100.0%) | 0 (0.0%) |
| Total (Overall) | 425 (60.1%) | 282 (39.9%) |
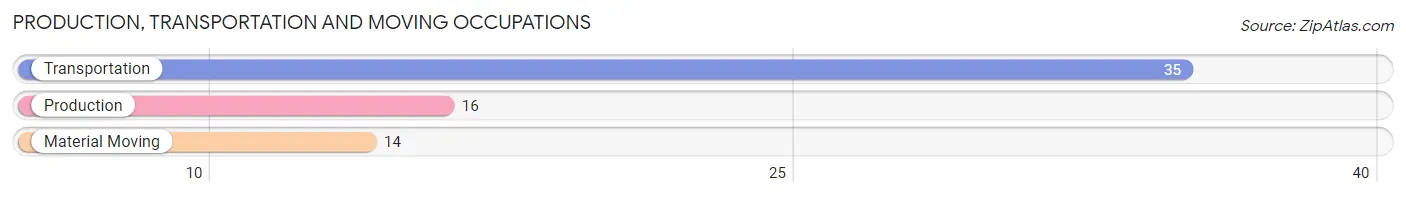
Production, Transportation and Moving Occupations
The most common Production, Transportation and Moving occupations in Yorktown are Transportation (35 | 5.0%), Production (16 | 2.3%), and Material Moving (14 | 2.0%).
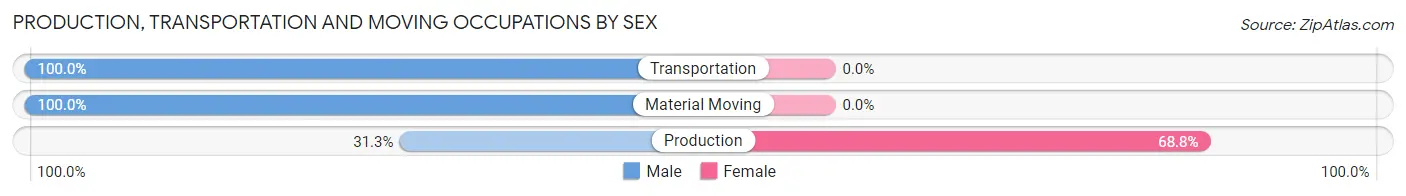
Production, Transportation and Moving Occupations by Sex
| Occupation | Male | Female |
| Production | 5 (31.2%) | 11 (68.8%) |
| Transportation | 35 (100.0%) | 0 (0.0%) |
| Material Moving | 14 (100.0%) | 0 (0.0%) |
| Total (Category) | 54 (83.1%) | 11 (16.9%) |
| Total (Overall) | 425 (60.1%) | 282 (39.9%) |
Employment Industries by Sex in Yorktown
Employment Industries in Yorktown
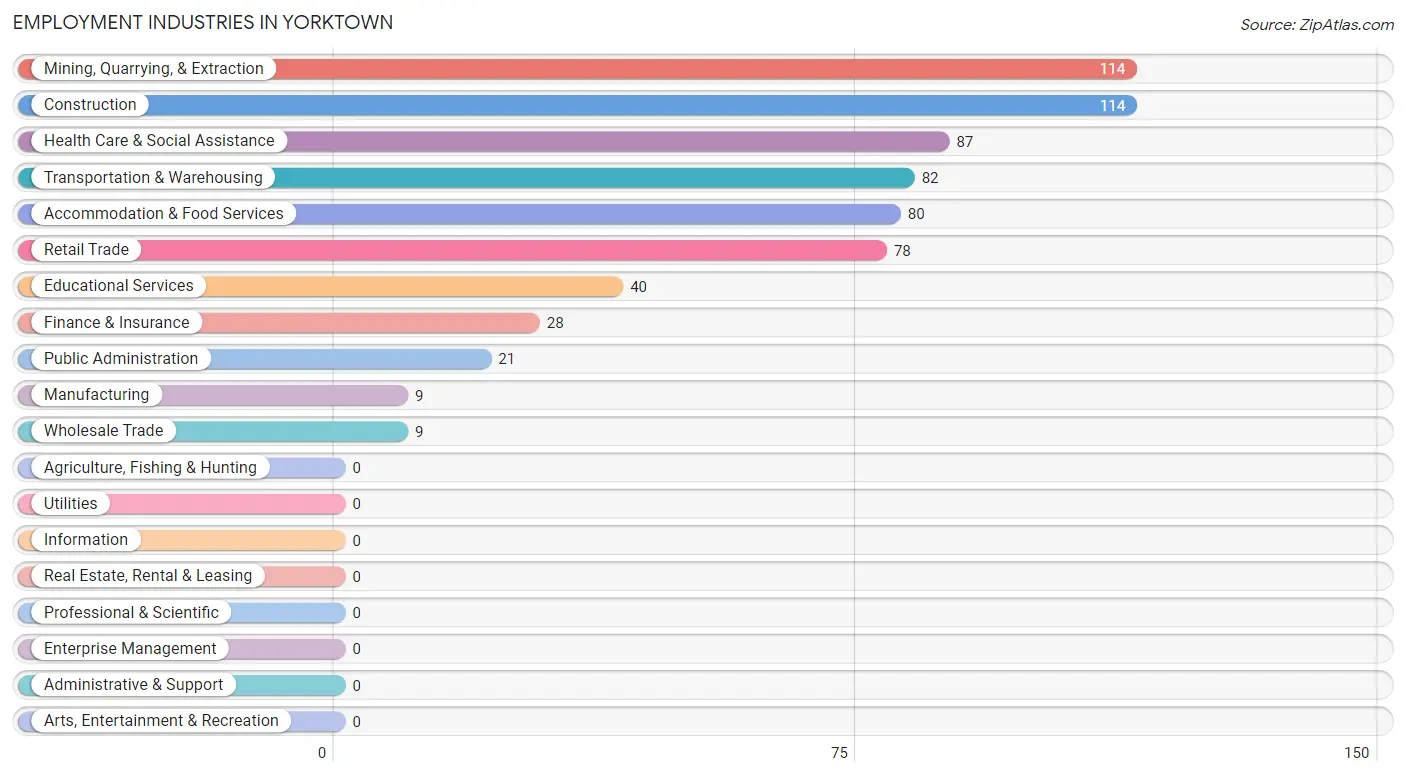
The major employment industries in Yorktown include Mining, Quarrying, & Extraction (114 | 16.1%), Construction (114 | 16.1%), Health Care & Social Assistance (87 | 12.3%), Transportation & Warehousing (82 | 11.6%), and Accommodation & Food Services (80 | 11.3%).
Employment Industries by Sex in Yorktown
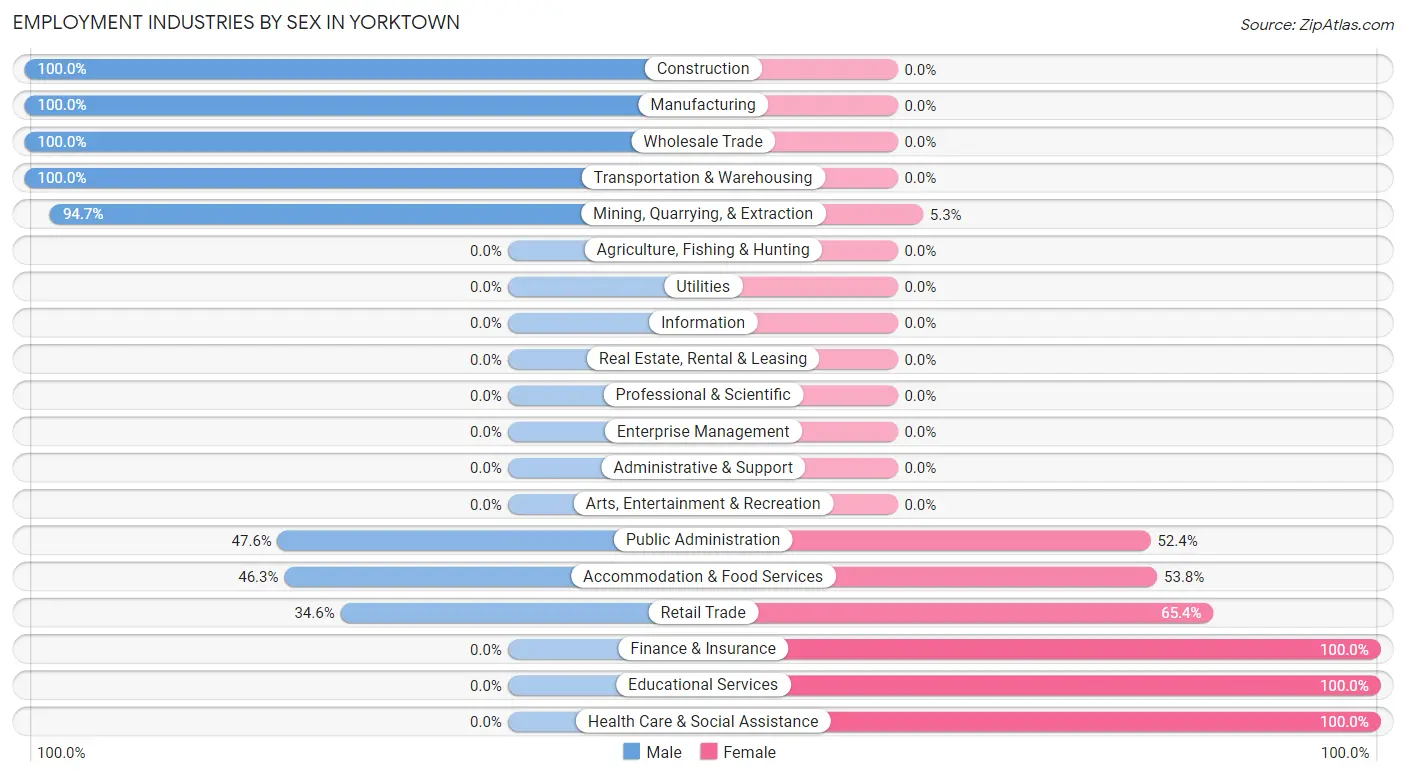
The Yorktown industries that see more men than women are Construction (100.0%), Manufacturing (100.0%), and Wholesale Trade (100.0%), whereas the industries that tend to have a higher number of women are Finance & Insurance (100.0%), Educational Services (100.0%), and Health Care & Social Assistance (100.0%).
| Industry | Male | Female |
| Agriculture, Fishing & Hunting | 0 (0.0%) | 0 (0.0%) |
| Mining, Quarrying, & Extraction | 108 (94.7%) | 6 (5.3%) |
| Construction | 114 (100.0%) | 0 (0.0%) |
| Manufacturing | 9 (100.0%) | 0 (0.0%) |
| Wholesale Trade | 9 (100.0%) | 0 (0.0%) |
| Retail Trade | 27 (34.6%) | 51 (65.4%) |
| Transportation & Warehousing | 82 (100.0%) | 0 (0.0%) |
| Utilities | 0 (0.0%) | 0 (0.0%) |
| Information | 0 (0.0%) | 0 (0.0%) |
| Finance & Insurance | 0 (0.0%) | 28 (100.0%) |
| Real Estate, Rental & Leasing | 0 (0.0%) | 0 (0.0%) |
| Professional & Scientific | 0 (0.0%) | 0 (0.0%) |
| Enterprise Management | 0 (0.0%) | 0 (0.0%) |
| Administrative & Support | 0 (0.0%) | 0 (0.0%) |
| Educational Services | 0 (0.0%) | 40 (100.0%) |
| Health Care & Social Assistance | 0 (0.0%) | 87 (100.0%) |
| Arts, Entertainment & Recreation | 0 (0.0%) | 0 (0.0%) |
| Accommodation & Food Services | 37 (46.3%) | 43 (53.7%) |
| Public Administration | 10 (47.6%) | 11 (52.4%) |
| Total | 425 (60.1%) | 282 (39.9%) |
Education in Yorktown
School Enrollment in Yorktown
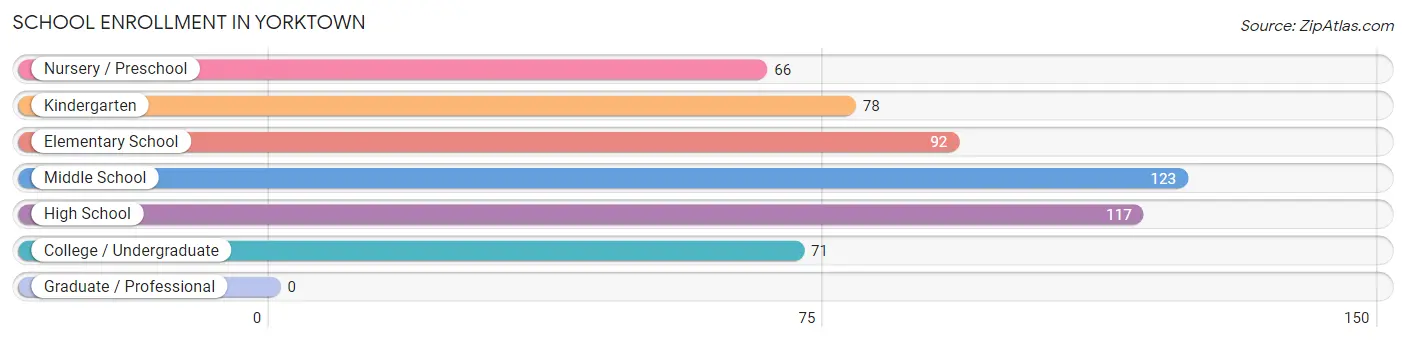
The most common levels of schooling among the 547 students in Yorktown are middle school (123 | 22.5%), high school (117 | 21.4%), and elementary school (92 | 16.8%).
| School Level | # Students | % Students |
| Nursery / Preschool | 66 | 12.1% |
| Kindergarten | 78 | 14.3% |
| Elementary School | 92 | 16.8% |
| Middle School | 123 | 22.5% |
| High School | 117 | 21.4% |
| College / Undergraduate | 71 | 13.0% |
| Graduate / Professional | 0 | 0.0% |
| Total | 547 | 100.0% |
School Enrollment by Age by Funding Source in Yorktown
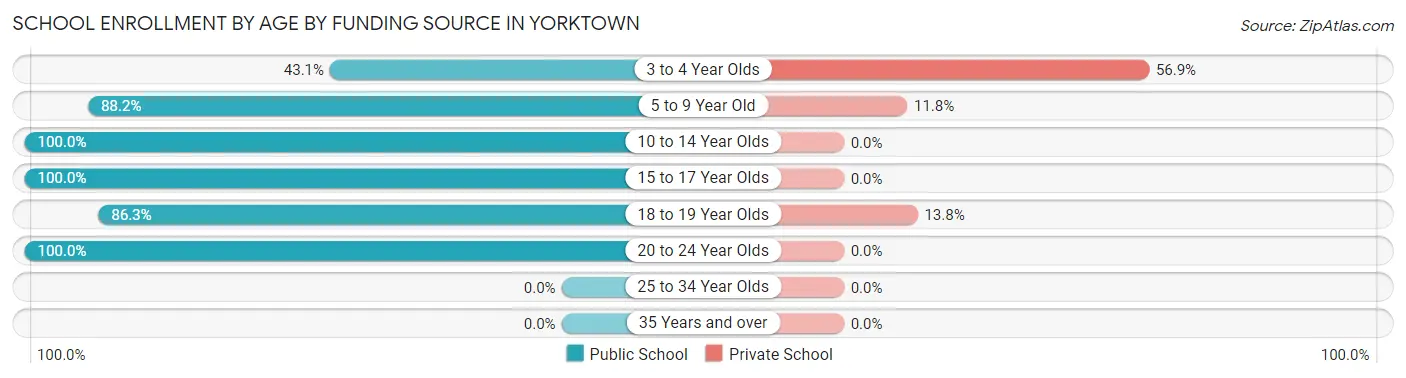
Out of a total of 547 students who are enrolled in schools in Yorktown, 55 (10.1%) attend a private institution, while the remaining 492 (89.9%) are enrolled in public schools. The age group of 3 to 4 year olds has the highest likelihood of being enrolled in private schools, with 29 (56.9% in the age bracket) enrolled. Conversely, the age group of 10 to 14 year olds has the lowest likelihood of being enrolled in a private school, with 181 (100.0% in the age bracket) attending a public institution.
| Age Bracket | Public School | Private School |
| 3 to 4 Year Olds | 22 (43.1%) | 29 (56.9%) |
| 5 to 9 Year Old | 112 (88.2%) | 15 (11.8%) |
| 10 to 14 Year Olds | 181 (100.0%) | 0 (0.0%) |
| 15 to 17 Year Olds | 62 (100.0%) | 0 (0.0%) |
| 18 to 19 Year Olds | 69 (86.3%) | 11 (13.8%) |
| 20 to 24 Year Olds | 46 (100.0%) | 0 (0.0%) |
| 25 to 34 Year Olds | 0 (0.0%) | 0 (0.0%) |
| 35 Years and over | 0 (0.0%) | 0 (0.0%) |
| Total | 492 (89.9%) | 55 (10.1%) |
Educational Attainment by Field of Study in Yorktown
Education (52 | 43.3%), arts & humanities (35 | 29.2%), business (16 | 13.3%), liberal arts & history (16 | 13.3%), and engineering (1 | 0.8%) are the most common fields of study among 120 individuals in Yorktown who have obtained a bachelor's degree or higher.
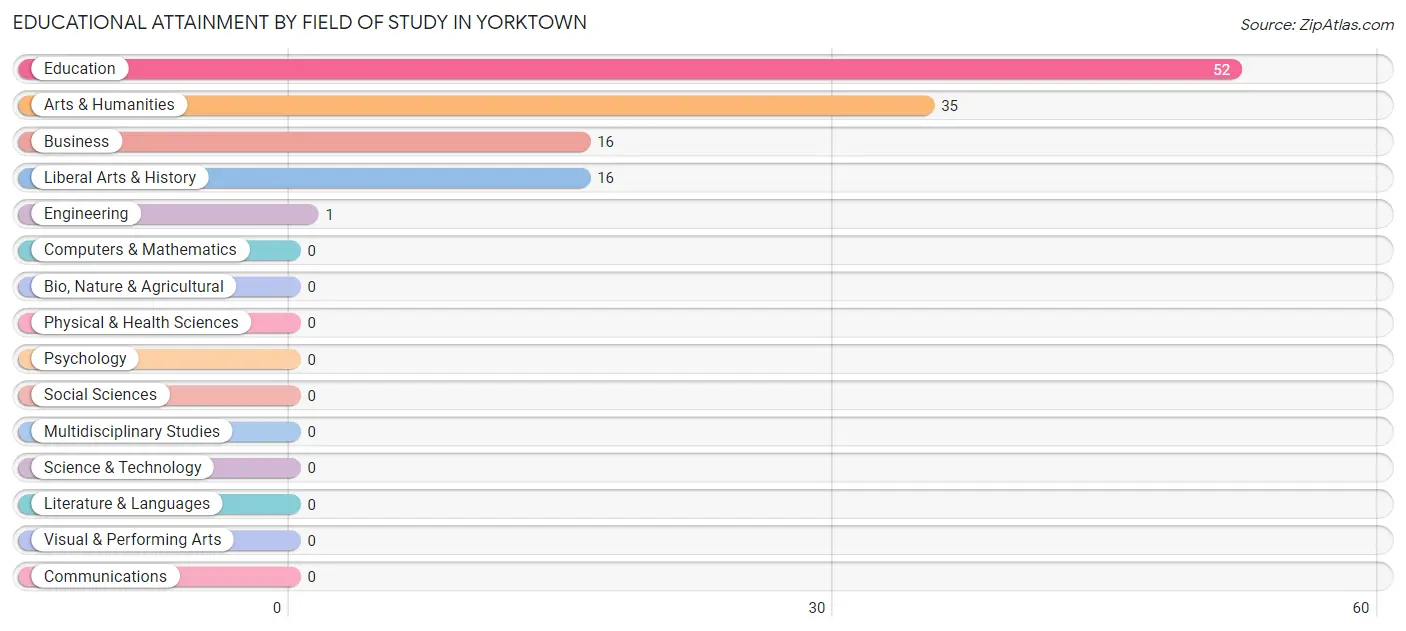
| Field of Study | # Graduates | % Graduates |
| Computers & Mathematics | 0 | 0.0% |
| Bio, Nature & Agricultural | 0 | 0.0% |
| Physical & Health Sciences | 0 | 0.0% |
| Psychology | 0 | 0.0% |
| Social Sciences | 0 | 0.0% |
| Engineering | 1 | 0.8% |
| Multidisciplinary Studies | 0 | 0.0% |
| Science & Technology | 0 | 0.0% |
| Business | 16 | 13.3% |
| Education | 52 | 43.3% |
| Literature & Languages | 0 | 0.0% |
| Liberal Arts & History | 16 | 13.3% |
| Visual & Performing Arts | 0 | 0.0% |
| Communications | 0 | 0.0% |
| Arts & Humanities | 35 | 29.2% |
| Total | 120 | 100.0% |
Transportation & Commute in Yorktown
Vehicle Availability by Sex in Yorktown
The most prevalent vehicle ownership categories in Yorktown are males with 3 vehicles (170, accounting for 40.0%) and females with 3 vehicles (86, making up 62.0%).
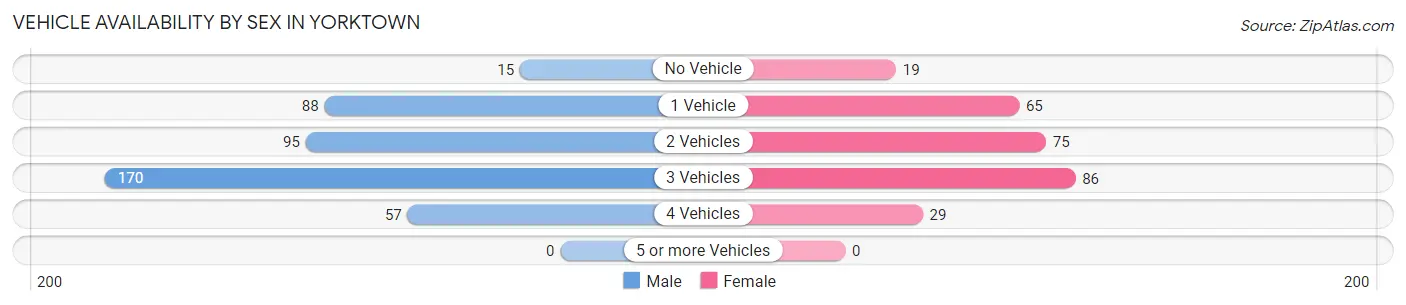
| Vehicles Available | Male | Female |
| No Vehicle | 15 (3.5%) | 19 (6.9%) |
| 1 Vehicle | 88 (20.7%) | 65 (23.7%) |
| 2 Vehicles | 95 (22.4%) | 75 (27.4%) |
| 3 Vehicles | 170 (40.0%) | 86 (31.4%) |
| 4 Vehicles | 57 (13.4%) | 29 (10.6%) |
| 5 or more Vehicles | 0 (0.0%) | 0 (0.0%) |
| Total | 425 (100.0%) | 274 (100.0%) |
Commute Time in Yorktown
The most frequently occuring commute durations in Yorktown are 45 to 59 minutes (127 commuters, 18.5%), 5 to 9 minutes (120 commuters, 17.4%), and 30 to 34 minutes (79 commuters, 11.5%).
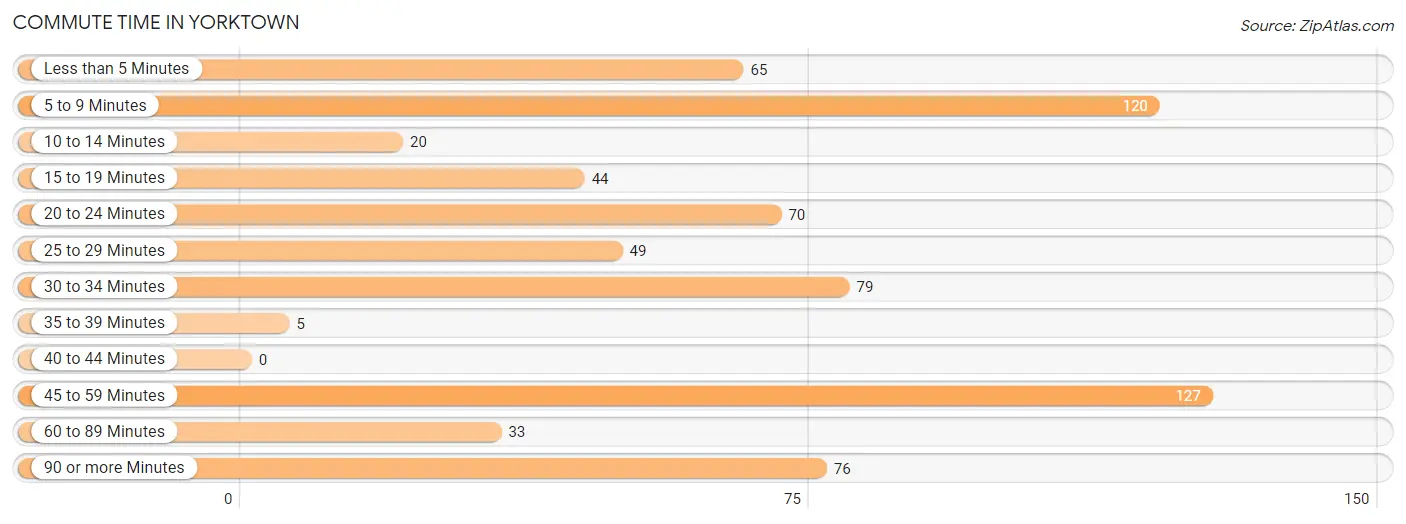
| Commute Time | # Commuters | % Commuters |
| Less than 5 Minutes | 65 | 9.5% |
| 5 to 9 Minutes | 120 | 17.4% |
| 10 to 14 Minutes | 20 | 2.9% |
| 15 to 19 Minutes | 44 | 6.4% |
| 20 to 24 Minutes | 70 | 10.2% |
| 25 to 29 Minutes | 49 | 7.1% |
| 30 to 34 Minutes | 79 | 11.5% |
| 35 to 39 Minutes | 5 | 0.7% |
| 40 to 44 Minutes | 0 | 0.0% |
| 45 to 59 Minutes | 127 | 18.5% |
| 60 to 89 Minutes | 33 | 4.8% |
| 90 or more Minutes | 76 | 11.1% |
Commute Time by Sex in Yorktown
The most common commute times in Yorktown are 45 to 59 minutes (110 commuters, 25.9%) for males and less than 5 minutes (45 commuters, 17.1%) for females.
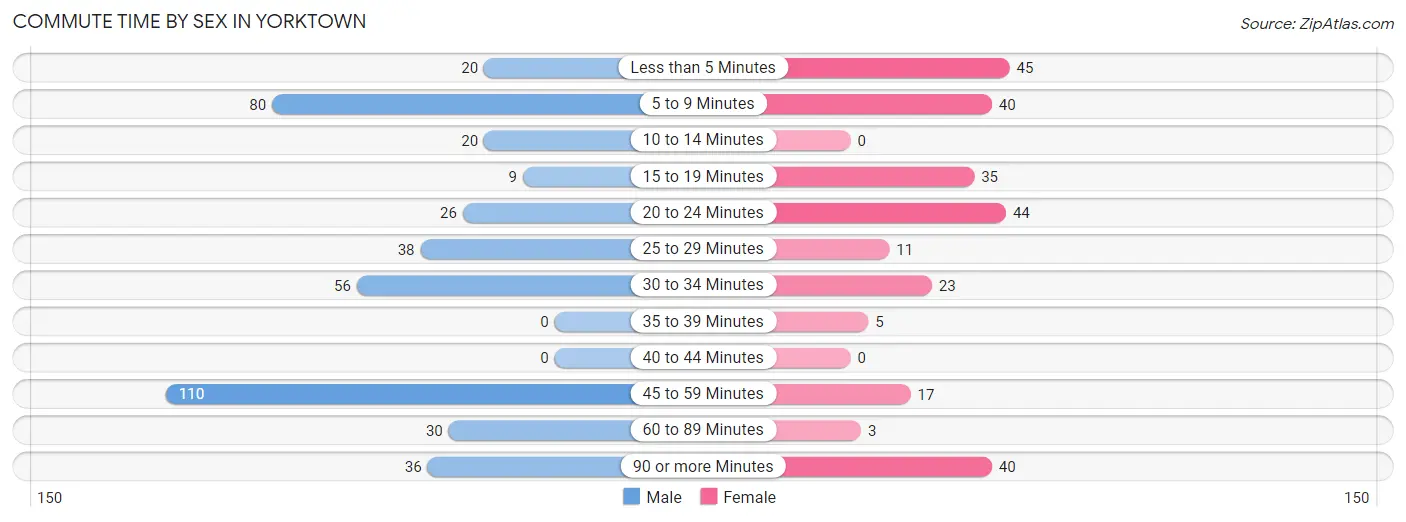
| Commute Time | Male | Female |
| Less than 5 Minutes | 20 (4.7%) | 45 (17.1%) |
| 5 to 9 Minutes | 80 (18.8%) | 40 (15.2%) |
| 10 to 14 Minutes | 20 (4.7%) | 0 (0.0%) |
| 15 to 19 Minutes | 9 (2.1%) | 35 (13.3%) |
| 20 to 24 Minutes | 26 (6.1%) | 44 (16.7%) |
| 25 to 29 Minutes | 38 (8.9%) | 11 (4.2%) |
| 30 to 34 Minutes | 56 (13.2%) | 23 (8.7%) |
| 35 to 39 Minutes | 0 (0.0%) | 5 (1.9%) |
| 40 to 44 Minutes | 0 (0.0%) | 0 (0.0%) |
| 45 to 59 Minutes | 110 (25.9%) | 17 (6.5%) |
| 60 to 89 Minutes | 30 (7.1%) | 3 (1.1%) |
| 90 or more Minutes | 36 (8.5%) | 40 (15.2%) |
Time of Departure to Work by Sex in Yorktown
The most frequent times of departure to work in Yorktown are 7:00 AM to 7:29 AM (174, 40.9%) for males and 6:30 AM to 6:59 AM (62, 23.6%) for females.
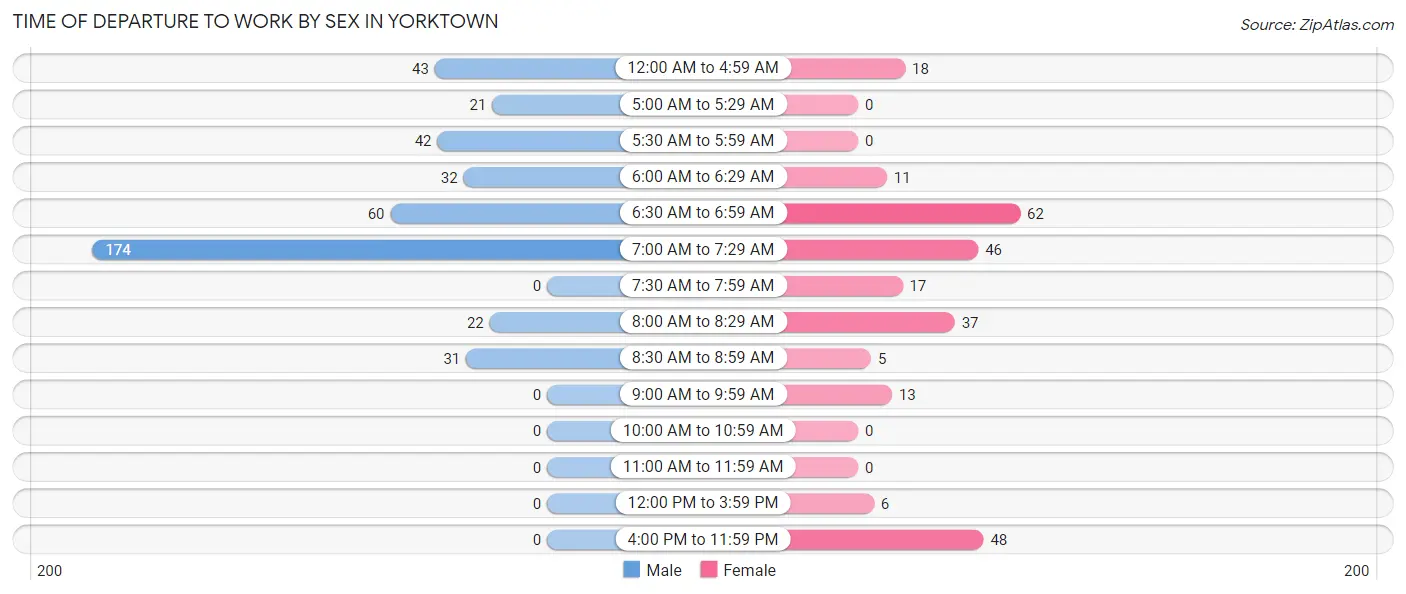
| Time of Departure | Male | Female |
| 12:00 AM to 4:59 AM | 43 (10.1%) | 18 (6.8%) |
| 5:00 AM to 5:29 AM | 21 (4.9%) | 0 (0.0%) |
| 5:30 AM to 5:59 AM | 42 (9.9%) | 0 (0.0%) |
| 6:00 AM to 6:29 AM | 32 (7.5%) | 11 (4.2%) |
| 6:30 AM to 6:59 AM | 60 (14.1%) | 62 (23.6%) |
| 7:00 AM to 7:29 AM | 174 (40.9%) | 46 (17.5%) |
| 7:30 AM to 7:59 AM | 0 (0.0%) | 17 (6.5%) |
| 8:00 AM to 8:29 AM | 22 (5.2%) | 37 (14.1%) |
| 8:30 AM to 8:59 AM | 31 (7.3%) | 5 (1.9%) |
| 9:00 AM to 9:59 AM | 0 (0.0%) | 13 (4.9%) |
| 10:00 AM to 10:59 AM | 0 (0.0%) | 0 (0.0%) |
| 11:00 AM to 11:59 AM | 0 (0.0%) | 0 (0.0%) |
| 12:00 PM to 3:59 PM | 0 (0.0%) | 6 (2.3%) |
| 4:00 PM to 11:59 PM | 0 (0.0%) | 48 (18.2%) |
| Total | 425 (100.0%) | 263 (100.0%) |
Housing Occupancy in Yorktown
Occupancy by Ownership in Yorktown
Of the total 761 dwellings in Yorktown, owner-occupied units account for 562 (73.9%), while renter-occupied units make up 199 (26.2%).
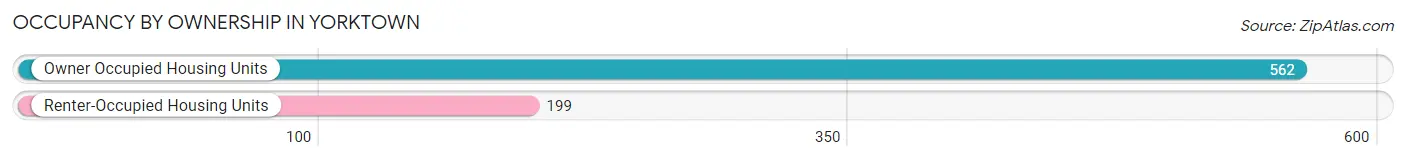
| Occupancy | # Housing Units | % Housing Units |
| Owner Occupied Housing Units | 562 | 73.9% |
| Renter-Occupied Housing Units | 199 | 26.2% |
| Total Occupied Housing Units | 761 | 100.0% |
Occupancy by Household Size in Yorktown
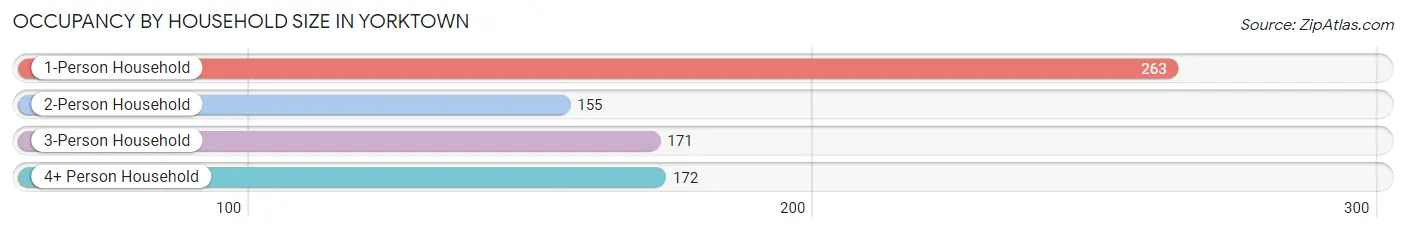
| Household Size | # Housing Units | % Housing Units |
| 1-Person Household | 263 | 34.6% |
| 2-Person Household | 155 | 20.4% |
| 3-Person Household | 171 | 22.5% |
| 4+ Person Household | 172 | 22.6% |
| Total Housing Units | 761 | 100.0% |
Occupancy by Ownership by Household Size in Yorktown
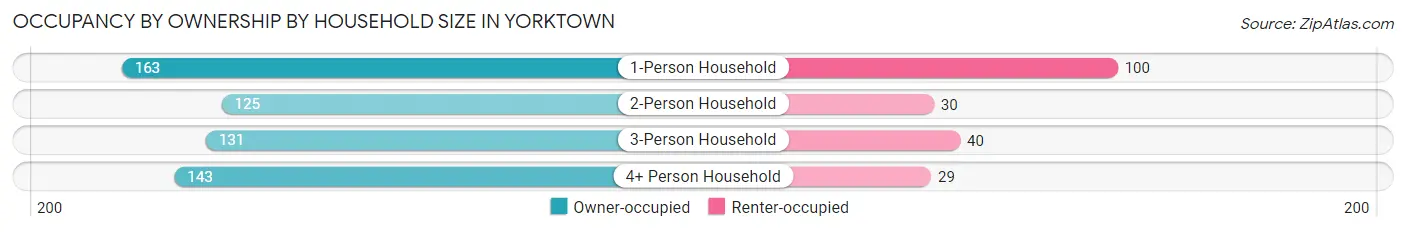
| Household Size | Owner-occupied | Renter-occupied |
| 1-Person Household | 163 (62.0%) | 100 (38.0%) |
| 2-Person Household | 125 (80.6%) | 30 (19.4%) |
| 3-Person Household | 131 (76.6%) | 40 (23.4%) |
| 4+ Person Household | 143 (83.1%) | 29 (16.9%) |
| Total Housing Units | 562 (73.9%) | 199 (26.2%) |
Occupancy by Educational Attainment in Yorktown
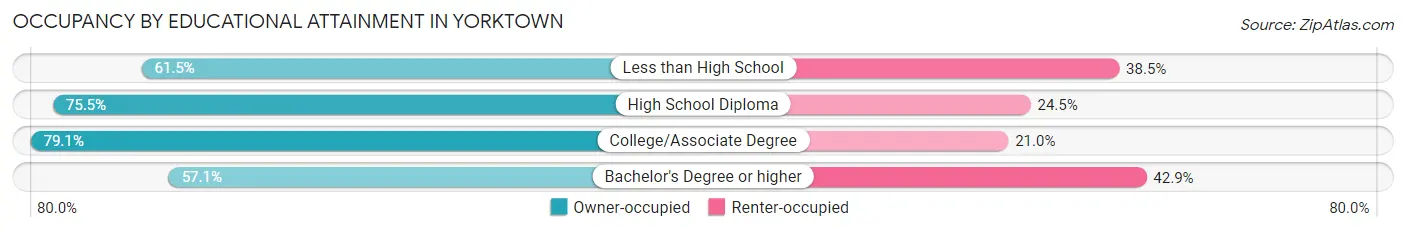
| Household Size | Owner-occupied | Renter-occupied |
| Less than High School | 59 (61.5%) | 37 (38.5%) |
| High School Diploma | 222 (75.5%) | 72 (24.5%) |
| College/Associate Degree | 249 (79.0%) | 66 (20.9%) |
| Bachelor's Degree or higher | 32 (57.1%) | 24 (42.9%) |
Occupancy by Age of Householder in Yorktown
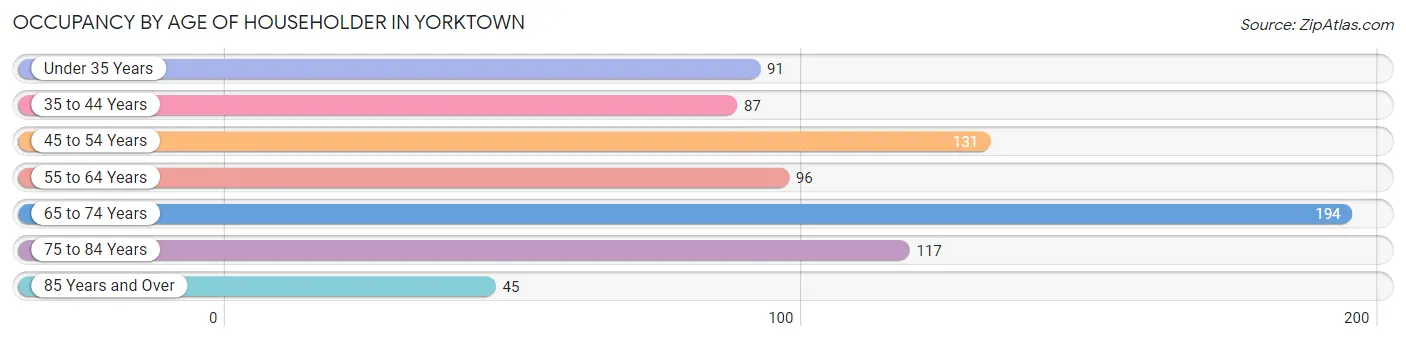
| Age Bracket | # Households | % Households |
| Under 35 Years | 91 | 12.0% |
| 35 to 44 Years | 87 | 11.4% |
| 45 to 54 Years | 131 | 17.2% |
| 55 to 64 Years | 96 | 12.6% |
| 65 to 74 Years | 194 | 25.5% |
| 75 to 84 Years | 117 | 15.4% |
| 85 Years and Over | 45 | 5.9% |
| Total | 761 | 100.0% |
Housing Finances in Yorktown
Median Income by Occupancy in Yorktown
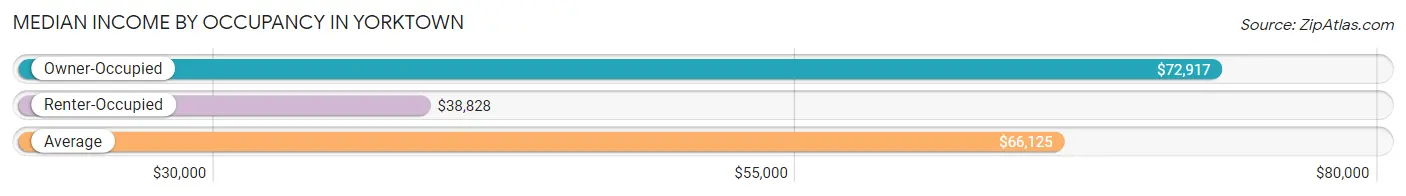
| Occupancy Type | # Households | Median Income |
| Owner-Occupied | 562 (73.9%) | $72,917 |
| Renter-Occupied | 199 (26.2%) | $38,828 |
| Average | 761 (100.0%) | $66,125 |
Occupancy by Householder Income Bracket in Yorktown
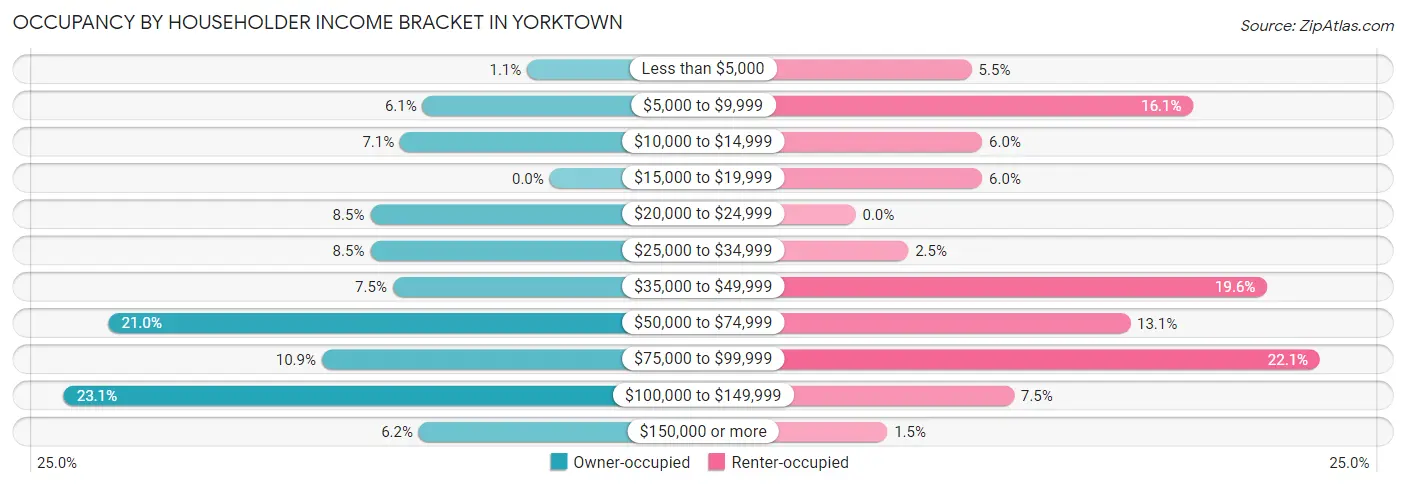
| Income Bracket | Owner-occupied | Renter-occupied |
| Less than $5,000 | 6 (1.1%) | 11 (5.5%) |
| $5,000 to $9,999 | 34 (6.0%) | 32 (16.1%) |
| $10,000 to $14,999 | 40 (7.1%) | 12 (6.0%) |
| $15,000 to $19,999 | 0 (0.0%) | 12 (6.0%) |
| $20,000 to $24,999 | 48 (8.5%) | 0 (0.0%) |
| $25,000 to $34,999 | 48 (8.5%) | 5 (2.5%) |
| $35,000 to $49,999 | 42 (7.5%) | 39 (19.6%) |
| $50,000 to $74,999 | 118 (21.0%) | 26 (13.1%) |
| $75,000 to $99,999 | 61 (10.8%) | 44 (22.1%) |
| $100,000 to $149,999 | 130 (23.1%) | 15 (7.5%) |
| $150,000 or more | 35 (6.2%) | 3 (1.5%) |
| Total | 562 (100.0%) | 199 (100.0%) |
Monthly Housing Cost Tiers in Yorktown
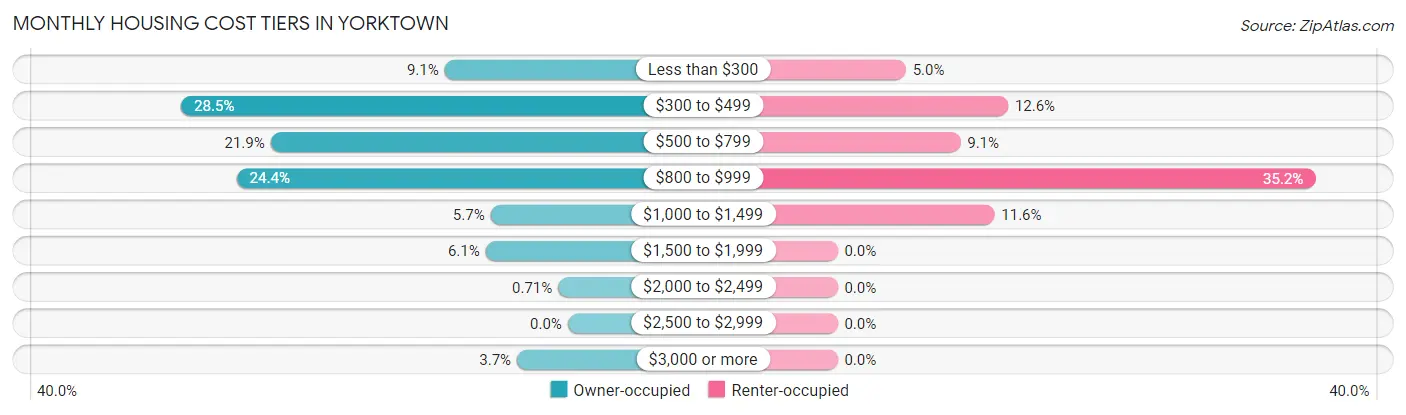
| Monthly Cost | Owner-occupied | Renter-occupied |
| Less than $300 | 51 (9.1%) | 10 (5.0%) |
| $300 to $499 | 160 (28.5%) | 25 (12.6%) |
| $500 to $799 | 123 (21.9%) | 18 (9.0%) |
| $800 to $999 | 137 (24.4%) | 70 (35.2%) |
| $1,000 to $1,499 | 32 (5.7%) | 23 (11.6%) |
| $1,500 to $1,999 | 34 (6.0%) | 0 (0.0%) |
| $2,000 to $2,499 | 4 (0.7%) | 0 (0.0%) |
| $2,500 to $2,999 | 0 (0.0%) | 0 (0.0%) |
| $3,000 or more | 21 (3.7%) | 0 (0.0%) |
| Total | 562 (100.0%) | 199 (100.0%) |
Physical Housing Characteristics in Yorktown
Housing Structures in Yorktown
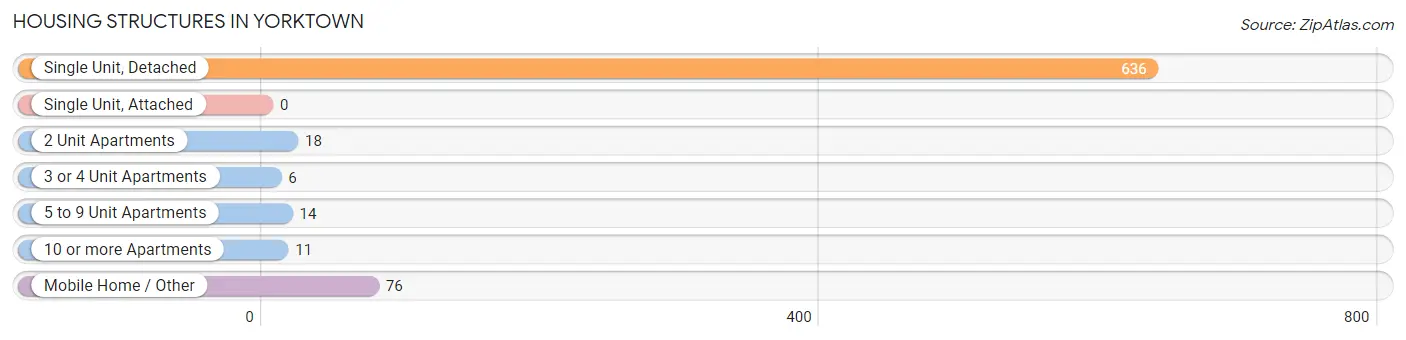
| Structure Type | # Housing Units | % Housing Units |
| Single Unit, Detached | 636 | 83.6% |
| Single Unit, Attached | 0 | 0.0% |
| 2 Unit Apartments | 18 | 2.4% |
| 3 or 4 Unit Apartments | 6 | 0.8% |
| 5 to 9 Unit Apartments | 14 | 1.8% |
| 10 or more Apartments | 11 | 1.5% |
| Mobile Home / Other | 76 | 10.0% |
| Total | 761 | 100.0% |
Housing Structures by Occupancy in Yorktown
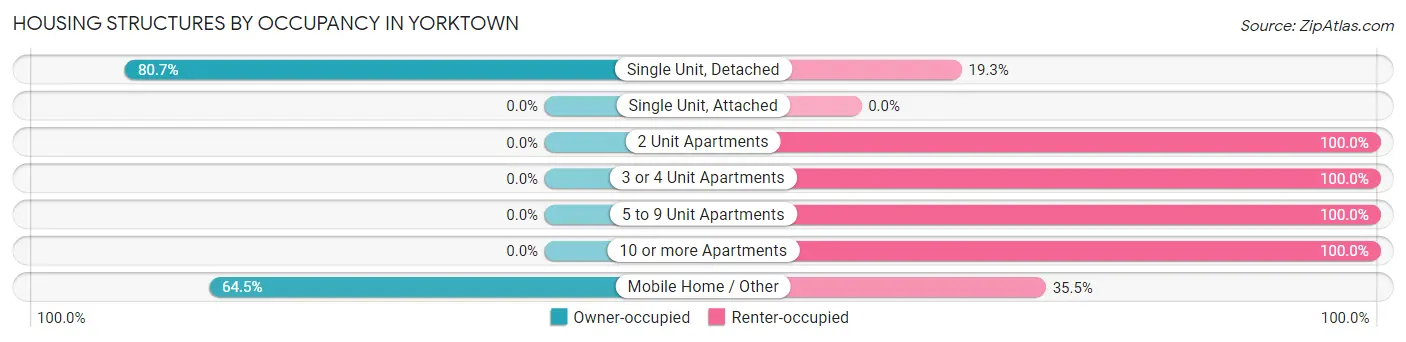
| Structure Type | Owner-occupied | Renter-occupied |
| Single Unit, Detached | 513 (80.7%) | 123 (19.3%) |
| Single Unit, Attached | 0 (0.0%) | 0 (0.0%) |
| 2 Unit Apartments | 0 (0.0%) | 18 (100.0%) |
| 3 or 4 Unit Apartments | 0 (0.0%) | 6 (100.0%) |
| 5 to 9 Unit Apartments | 0 (0.0%) | 14 (100.0%) |
| 10 or more Apartments | 0 (0.0%) | 11 (100.0%) |
| Mobile Home / Other | 49 (64.5%) | 27 (35.5%) |
| Total | 562 (73.9%) | 199 (26.2%) |
Housing Structures by Number of Rooms in Yorktown
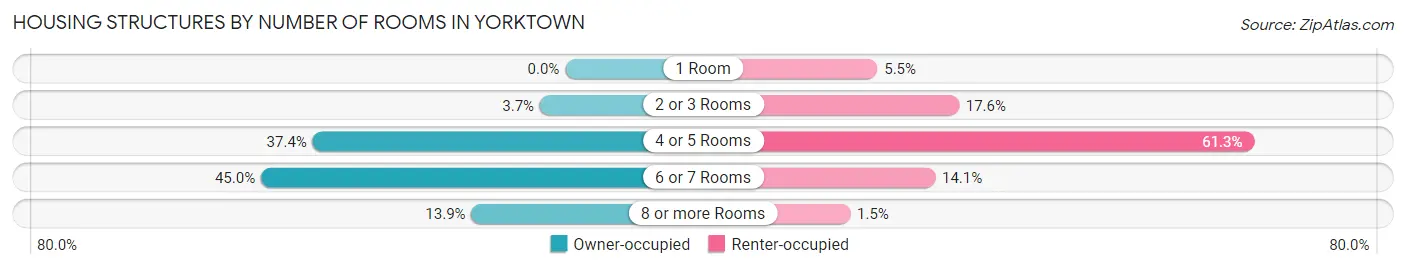
| Number of Rooms | Owner-occupied | Renter-occupied |
| 1 Room | 0 (0.0%) | 11 (5.5%) |
| 2 or 3 Rooms | 21 (3.7%) | 35 (17.6%) |
| 4 or 5 Rooms | 210 (37.4%) | 122 (61.3%) |
| 6 or 7 Rooms | 253 (45.0%) | 28 (14.1%) |
| 8 or more Rooms | 78 (13.9%) | 3 (1.5%) |
| Total | 562 (100.0%) | 199 (100.0%) |
Housing Structure by Heating Type in Yorktown
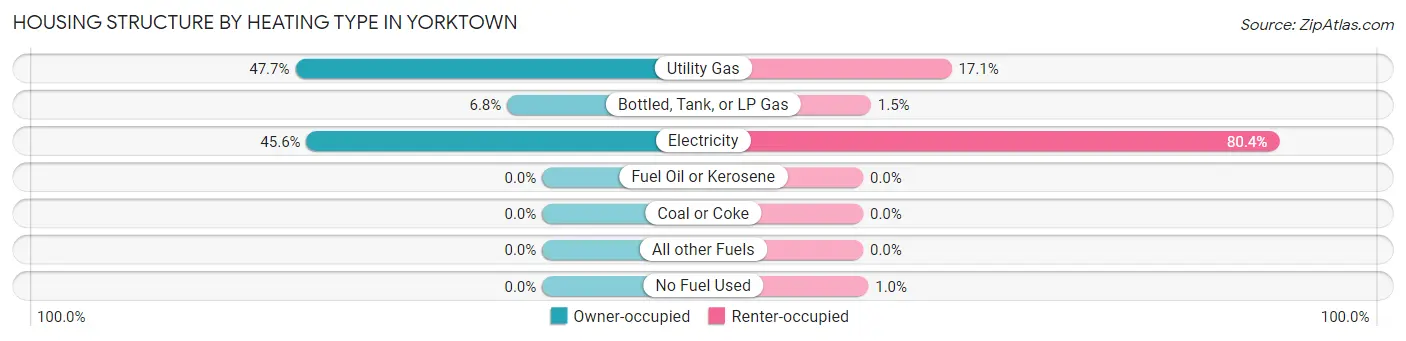
| Heating Type | Owner-occupied | Renter-occupied |
| Utility Gas | 268 (47.7%) | 34 (17.1%) |
| Bottled, Tank, or LP Gas | 38 (6.8%) | 3 (1.5%) |
| Electricity | 256 (45.6%) | 160 (80.4%) |
| Fuel Oil or Kerosene | 0 (0.0%) | 0 (0.0%) |
| Coal or Coke | 0 (0.0%) | 0 (0.0%) |
| All other Fuels | 0 (0.0%) | 0 (0.0%) |
| No Fuel Used | 0 (0.0%) | 2 (1.0%) |
| Total | 562 (100.0%) | 199 (100.0%) |
Household Vehicle Usage in Yorktown
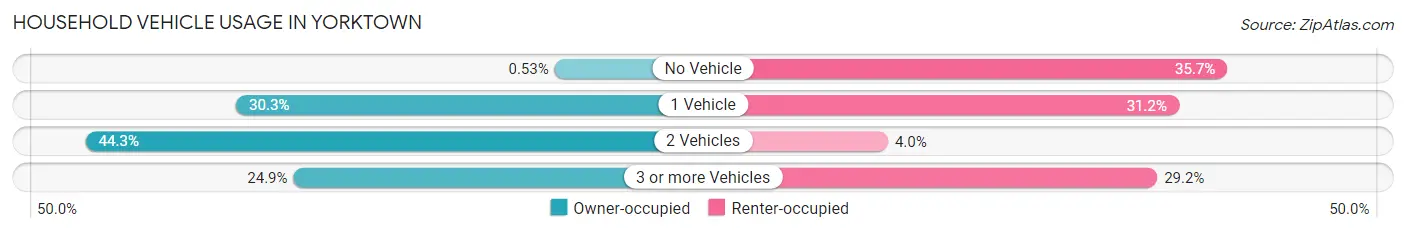
| Vehicles per Household | Owner-occupied | Renter-occupied |
| No Vehicle | 3 (0.5%) | 71 (35.7%) |
| 1 Vehicle | 170 (30.2%) | 62 (31.2%) |
| 2 Vehicles | 249 (44.3%) | 8 (4.0%) |
| 3 or more Vehicles | 140 (24.9%) | 58 (29.1%) |
| Total | 562 (100.0%) | 199 (100.0%) |
Real Estate & Mortgages in Yorktown
Real Estate and Mortgage Overview in Yorktown
| Characteristic | Without Mortgage | With Mortgage |
| Housing Units | 444 | 118 |
| Median Property Value | $165,100 | $209,200 |
| Median Household Income | $66,932 | $20 |
| Monthly Housing Costs | $525 | $21 |
| Real Estate Taxes | $1,376 | $1 |
Property Value by Mortgage Status in Yorktown
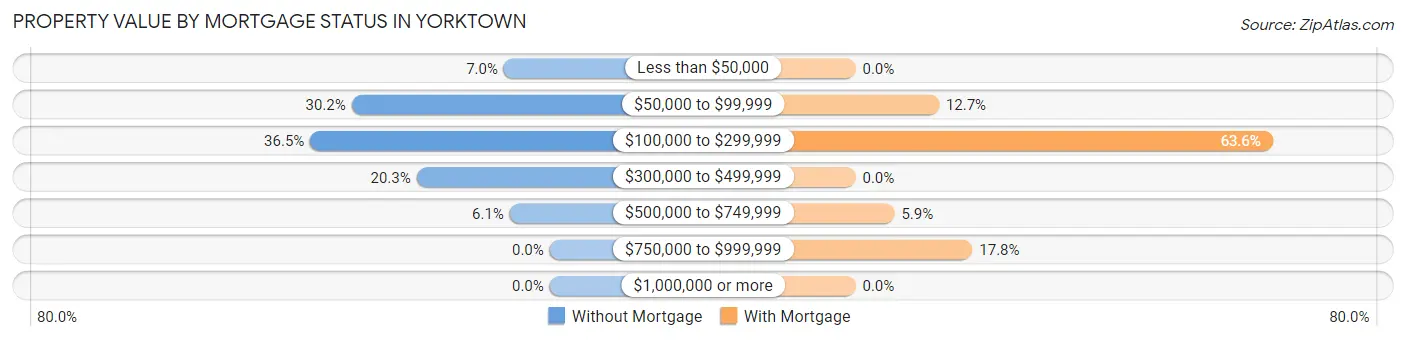
| Property Value | Without Mortgage | With Mortgage |
| Less than $50,000 | 31 (7.0%) | 0 (0.0%) |
| $50,000 to $99,999 | 134 (30.2%) | 15 (12.7%) |
| $100,000 to $299,999 | 162 (36.5%) | 75 (63.6%) |
| $300,000 to $499,999 | 90 (20.3%) | 0 (0.0%) |
| $500,000 to $749,999 | 27 (6.1%) | 7 (5.9%) |
| $750,000 to $999,999 | 0 (0.0%) | 21 (17.8%) |
| $1,000,000 or more | 0 (0.0%) | 0 (0.0%) |
| Total | 444 (100.0%) | 118 (100.0%) |
Household Income by Mortgage Status in Yorktown
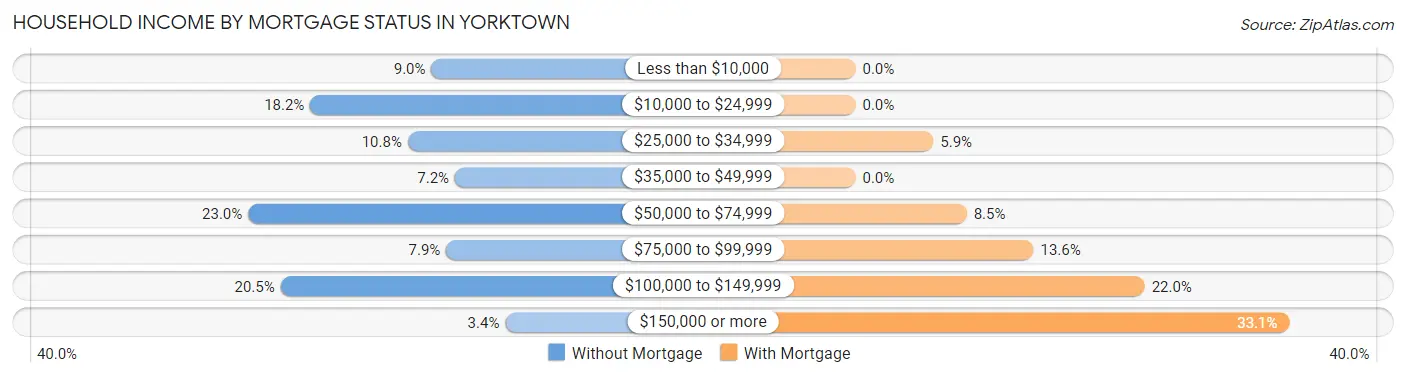
| Household Income | Without Mortgage | With Mortgage |
| Less than $10,000 | 40 (9.0%) | 0 (0.0%) |
| $10,000 to $24,999 | 81 (18.2%) | 0 (0.0%) |
| $25,000 to $34,999 | 48 (10.8%) | 7 (5.9%) |
| $35,000 to $49,999 | 32 (7.2%) | 0 (0.0%) |
| $50,000 to $74,999 | 102 (23.0%) | 10 (8.5%) |
| $75,000 to $99,999 | 35 (7.9%) | 16 (13.6%) |
| $100,000 to $149,999 | 91 (20.5%) | 26 (22.0%) |
| $150,000 or more | 15 (3.4%) | 39 (33.1%) |
| Total | 444 (100.0%) | 118 (100.0%) |
Property Value to Household Income Ratio in Yorktown
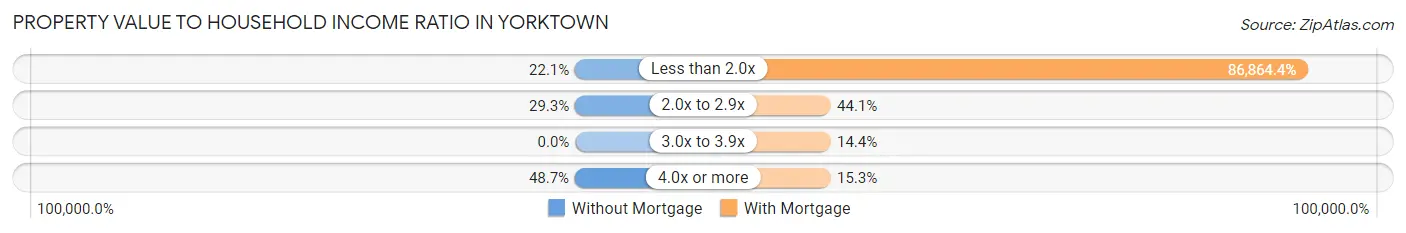
| Value-to-Income Ratio | Without Mortgage | With Mortgage |
| Less than 2.0x | 98 (22.1%) | 102,500 (86,864.4%) |
| 2.0x to 2.9x | 130 (29.3%) | 52 (44.1%) |
| 3.0x to 3.9x | 0 (0.0%) | 17 (14.4%) |
| 4.0x or more | 216 (48.6%) | 18 (15.2%) |
| Total | 444 (100.0%) | 118 (100.0%) |
Real Estate Taxes by Mortgage Status in Yorktown
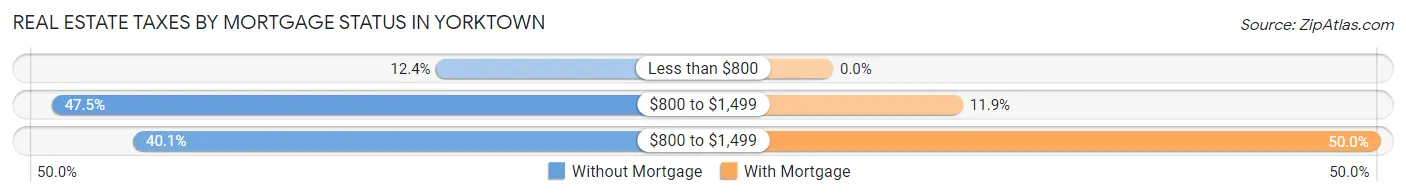
| Property Taxes | Without Mortgage | With Mortgage |
| Less than $800 | 55 (12.4%) | 0 (0.0%) |
| $800 to $1,499 | 211 (47.5%) | 14 (11.9%) |
| $800 to $1,499 | 178 (40.1%) | 59 (50.0%) |
| Total | 444 (100.0%) | 118 (100.0%) |
Health & Disability in Yorktown
Health Insurance Coverage by Age in Yorktown
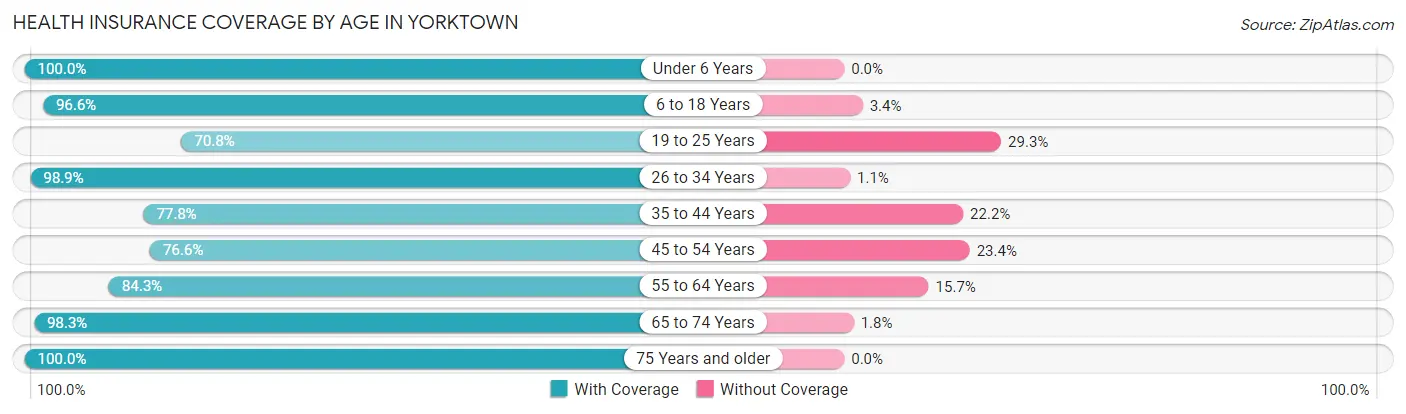
| Age Bracket | With Coverage | Without Coverage |
| Under 6 Years | 258 (100.0%) | 0 (0.0%) |
| 6 to 18 Years | 310 (96.6%) | 11 (3.4%) |
| 19 to 25 Years | 150 (70.8%) | 62 (29.2%) |
| 26 to 34 Years | 274 (98.9%) | 3 (1.1%) |
| 35 to 44 Years | 158 (77.8%) | 45 (22.2%) |
| 45 to 54 Years | 131 (76.6%) | 40 (23.4%) |
| 55 to 64 Years | 150 (84.3%) | 28 (15.7%) |
| 65 to 74 Years | 281 (98.3%) | 5 (1.8%) |
| 75 Years and older | 221 (100.0%) | 0 (0.0%) |
| Total | 1,933 (90.9%) | 194 (9.1%) |
Health Insurance Coverage by Citizenship Status in Yorktown
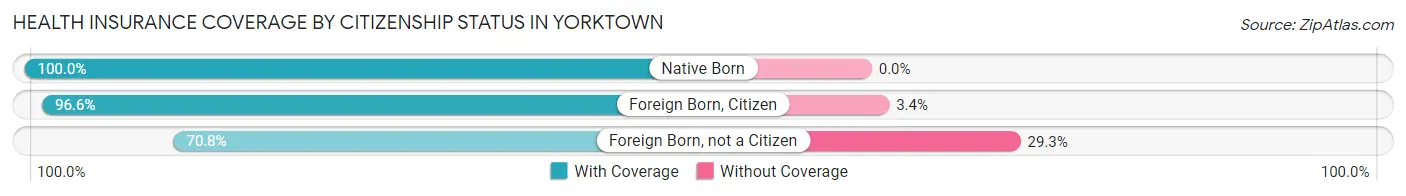
| Citizenship Status | With Coverage | Without Coverage |
| Native Born | 258 (100.0%) | 0 (0.0%) |
| Foreign Born, Citizen | 310 (96.6%) | 11 (3.4%) |
| Foreign Born, not a Citizen | 150 (70.8%) | 62 (29.2%) |
Health Insurance Coverage by Household Income in Yorktown
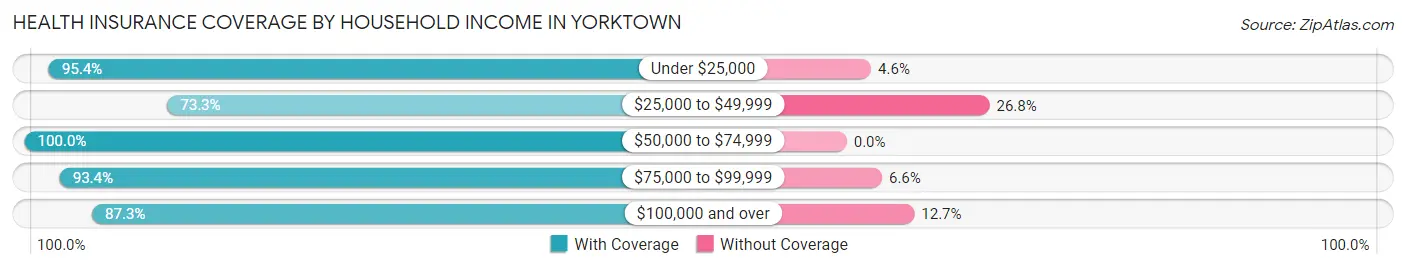
| Household Income | With Coverage | Without Coverage |
| Under $25,000 | 293 (95.4%) | 14 (4.6%) |
| $25,000 to $49,999 | 167 (73.3%) | 61 (26.8%) |
| $50,000 to $74,999 | 420 (100.0%) | 0 (0.0%) |
| $75,000 to $99,999 | 439 (93.4%) | 31 (6.6%) |
| $100,000 and over | 607 (87.3%) | 88 (12.7%) |
Public vs Private Health Insurance Coverage by Age in Yorktown
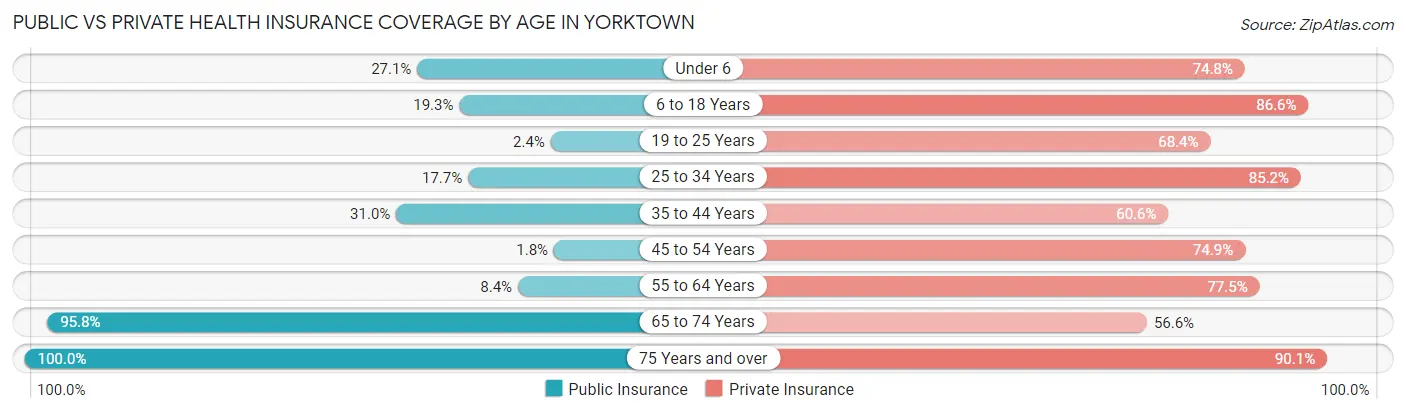
| Age Bracket | Public Insurance | Private Insurance |
| Under 6 | 70 (27.1%) | 193 (74.8%) |
| 6 to 18 Years | 62 (19.3%) | 278 (86.6%) |
| 19 to 25 Years | 5 (2.4%) | 145 (68.4%) |
| 25 to 34 Years | 49 (17.7%) | 236 (85.2%) |
| 35 to 44 Years | 63 (31.0%) | 123 (60.6%) |
| 45 to 54 Years | 3 (1.8%) | 128 (74.9%) |
| 55 to 64 Years | 15 (8.4%) | 138 (77.5%) |
| 65 to 74 Years | 274 (95.8%) | 162 (56.6%) |
| 75 Years and over | 221 (100.0%) | 199 (90.0%) |
| Total | 762 (35.8%) | 1,602 (75.3%) |
Disability Status by Sex by Age in Yorktown
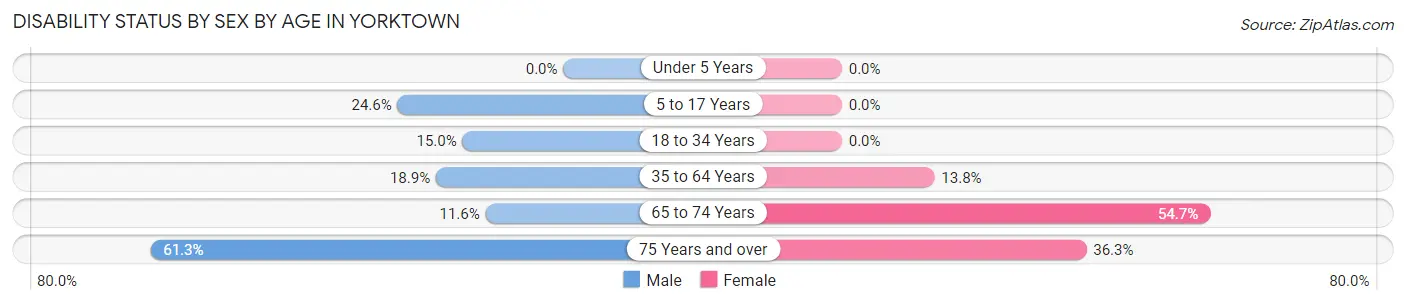
| Age Bracket | Male | Female |
| Under 5 Years | 0 (0.0%) | 0 (0.0%) |
| 5 to 17 Years | 48 (24.6%) | 0 (0.0%) |
| 18 to 34 Years | 44 (15.0%) | 0 (0.0%) |
| 35 to 64 Years | 59 (18.9%) | 33 (13.8%) |
| 65 to 74 Years | 17 (11.6%) | 76 (54.7%) |
| 75 Years and over | 46 (61.3%) | 53 (36.3%) |
Disability Class by Sex by Age in Yorktown
Disability Class: Hearing Difficulty
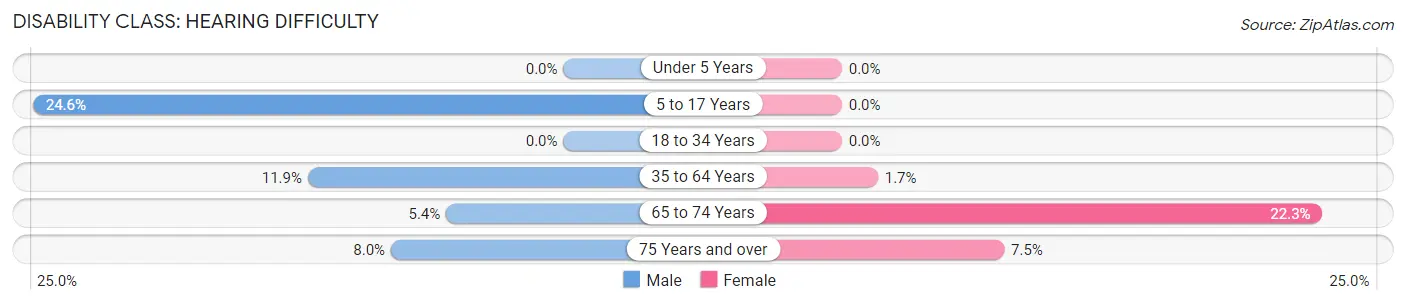
| Age Bracket | Male | Female |
| Under 5 Years | 0 (0.0%) | 0 (0.0%) |
| 5 to 17 Years | 48 (24.6%) | 0 (0.0%) |
| 18 to 34 Years | 0 (0.0%) | 0 (0.0%) |
| 35 to 64 Years | 37 (11.9%) | 4 (1.7%) |
| 65 to 74 Years | 8 (5.4%) | 31 (22.3%) |
| 75 Years and over | 6 (8.0%) | 11 (7.5%) |
Disability Class: Vision Difficulty
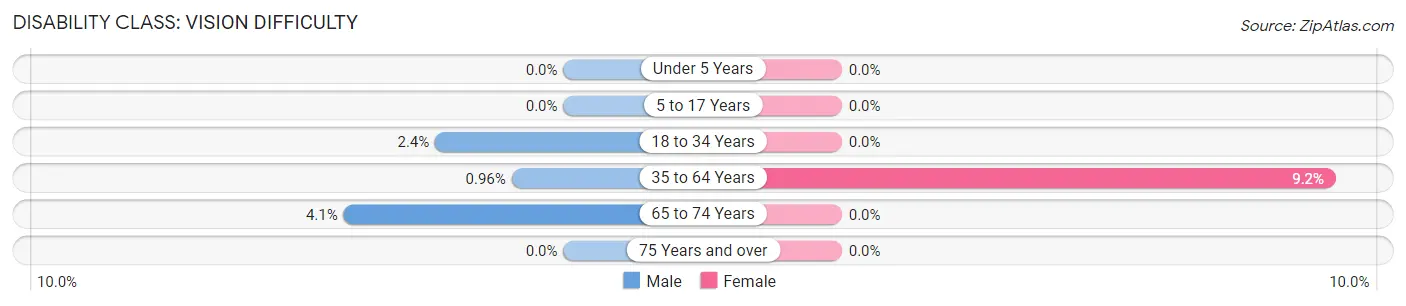
| Age Bracket | Male | Female |
| Under 5 Years | 0 (0.0%) | 0 (0.0%) |
| 5 to 17 Years | 0 (0.0%) | 0 (0.0%) |
| 18 to 34 Years | 7 (2.4%) | 0 (0.0%) |
| 35 to 64 Years | 3 (1.0%) | 22 (9.2%) |
| 65 to 74 Years | 6 (4.1%) | 0 (0.0%) |
| 75 Years and over | 0 (0.0%) | 0 (0.0%) |
Disability Class: Cognitive Difficulty
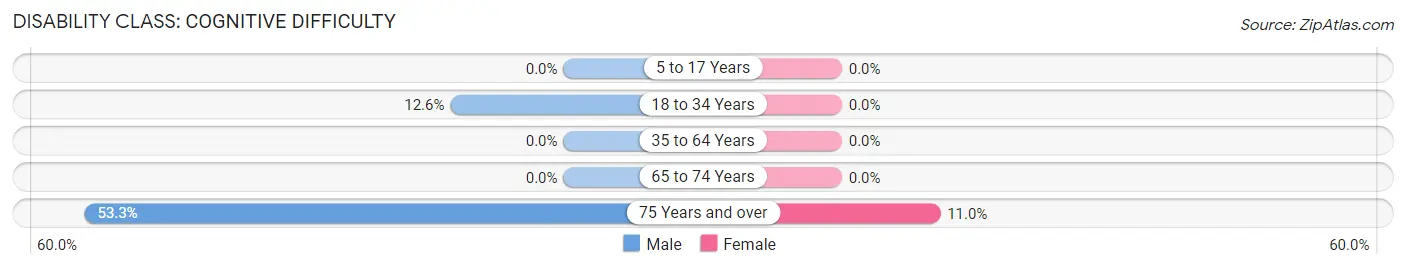
| Age Bracket | Male | Female |
| 5 to 17 Years | 0 (0.0%) | 0 (0.0%) |
| 18 to 34 Years | 37 (12.6%) | 0 (0.0%) |
| 35 to 64 Years | 0 (0.0%) | 0 (0.0%) |
| 65 to 74 Years | 0 (0.0%) | 0 (0.0%) |
| 75 Years and over | 40 (53.3%) | 16 (11.0%) |
Disability Class: Ambulatory Difficulty
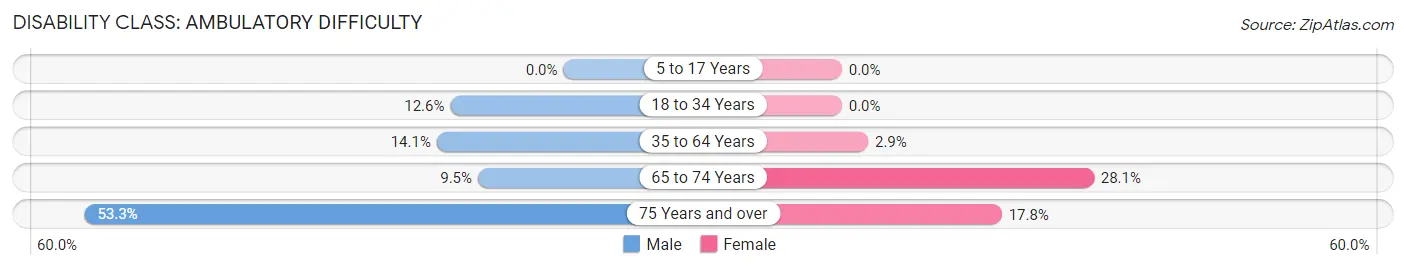
| Age Bracket | Male | Female |
| 5 to 17 Years | 0 (0.0%) | 0 (0.0%) |
| 18 to 34 Years | 37 (12.6%) | 0 (0.0%) |
| 35 to 64 Years | 44 (14.1%) | 7 (2.9%) |
| 65 to 74 Years | 14 (9.5%) | 39 (28.1%) |
| 75 Years and over | 40 (53.3%) | 26 (17.8%) |
Disability Class: Self-Care Difficulty
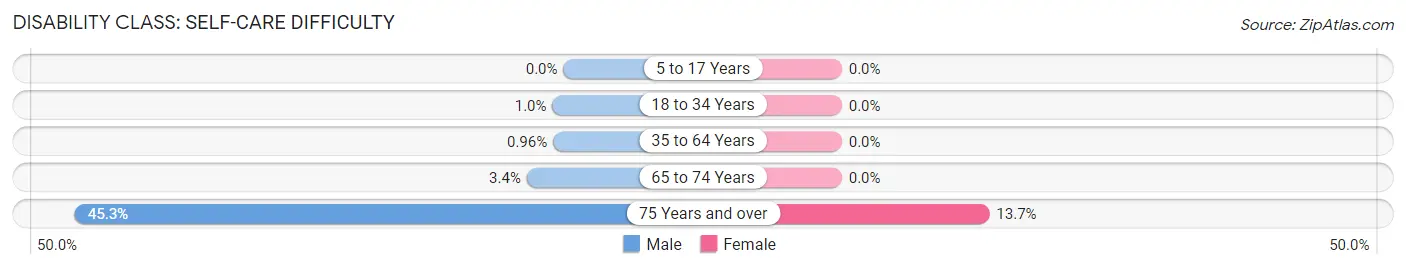
| Age Bracket | Male | Female |
| 5 to 17 Years | 0 (0.0%) | 0 (0.0%) |
| 18 to 34 Years | 3 (1.0%) | 0 (0.0%) |
| 35 to 64 Years | 3 (1.0%) | 0 (0.0%) |
| 65 to 74 Years | 5 (3.4%) | 0 (0.0%) |
| 75 Years and over | 34 (45.3%) | 20 (13.7%) |
Technology Access in Yorktown
Computing Device Access in Yorktown
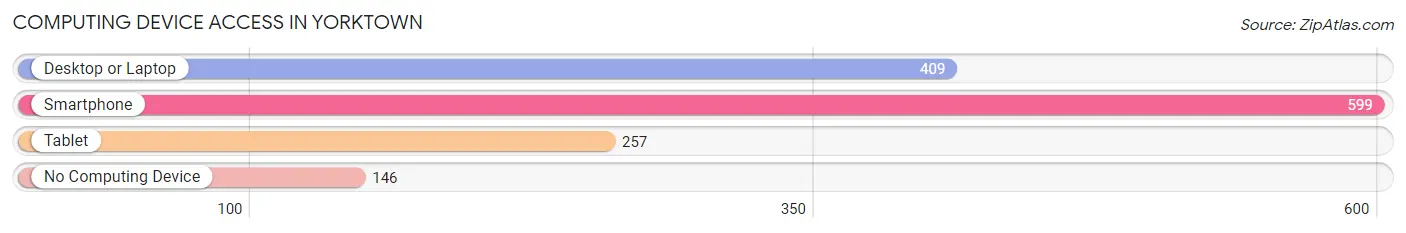
| Device Type | # Households | % Households |
| Desktop or Laptop | 409 | 53.7% |
| Smartphone | 599 | 78.7% |
| Tablet | 257 | 33.8% |
| No Computing Device | 146 | 19.2% |
| Total | 761 | 100.0% |
Internet Access in Yorktown
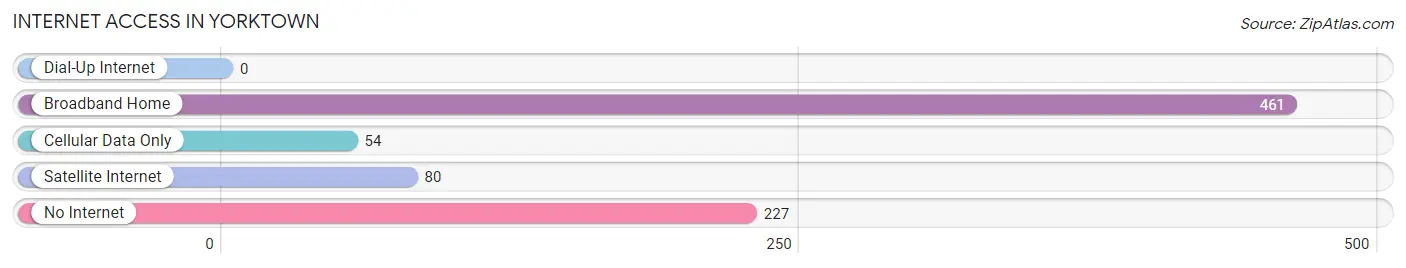
| Internet Type | # Households | % Households |
| Dial-Up Internet | 0 | 0.0% |
| Broadband Home | 461 | 60.6% |
| Cellular Data Only | 54 | 7.1% |
| Satellite Internet | 80 | 10.5% |
| No Internet | 227 | 29.8% |
| Total | 761 | 100.0% |
Yorktown Summary
Town History
The town of Yorktown, Texas is located in DeWitt County, Texas, and is part of the Victoria, Texas Metropolitan Statistical Area. The town was founded in 1887 by a group of German immigrants who had settled in the area. The town was named after the Battle of Yorktown, which was fought during the American Revolutionary War.
The town was originally a farming community, and the main crops grown were cotton, corn, and wheat. The town also had a number of small businesses, including a general store, a blacksmith shop, and a saloon.
In the early 1900s, the town began to grow and develop. The first school was built in 1910, and the first bank opened in 1912. The town also had a post office, a hotel, and a movie theater.
In the 1920s, the town began to experience a population boom. This was due to the discovery of oil in the area, which led to an influx of people looking for work in the oil industry. The population of the town grew from around 500 in 1920 to over 2,000 by 1930.
The town continued to grow throughout the 20th century, and by 2000, the population had grown to over 3,000.
Geography
Yorktown is located in DeWitt County, Texas, and is part of the Victoria, Texas Metropolitan Statistical Area. The town is situated on the banks of the Guadalupe River, and is surrounded by rolling hills and farmland.
The town has a total area of 2.3 square miles, all of which is land. The town has a humid subtropical climate, with hot summers and mild winters.
Economy
The economy of Yorktown is largely based on agriculture and oil production. The town is home to several large farms, which produce cotton, corn, and wheat. The town also has several oil wells, which produce oil and natural gas.
The town also has a number of small businesses, including restaurants, retail stores, and service providers.
Demographics
As of the 2010 census, the population of Yorktown was 3,190. The racial makeup of the town was 79.3% White, 0.7% African American, 0.3% Native American, 0.2% Asian, 0.1% Pacific Islander, 17.2% from other races, and 2.4% from two or more races. Hispanic or Latino of any race were 33.2% of the population.
The median income for a household in the town was $37,917, and the median income for a family was $45,000. The per capita income for the town was $17,845. About 17.2% of families and 20.3% of the population were below the poverty line, including 28.2% of those under age 18 and 11.2% of those age 65 or over.
Common Questions
What is Per Capita Income in Yorktown?
Per Capita income in Yorktown is $25,793.
What is the Median Family Income in Yorktown?
Median Family Income in Yorktown is $73,182.
What is the Median Household income in Yorktown?
Median Household Income in Yorktown is $66,125.
What is Income or Wage Gap in Yorktown?
Income or Wage Gap in Yorktown is 21.9%.
Women in Yorktown earn 78.1 cents for every dollar earned by a man.
What is Family Income Deficit in Yorktown?
Family Income Deficit in Yorktown is $6,428.
Families that are below poverty line in Yorktown earn $6,428 less on average than the poverty threshold level.
What is Inequality or Gini Index in Yorktown?
Inequality or Gini Index in Yorktown is 0.43.
What is the Total Population of Yorktown?
Total Population of Yorktown is 2,183.
What is the Total Male Population of Yorktown?
Total Male Population of Yorktown is 1,126.
What is the Total Female Population of Yorktown?
Total Female Population of Yorktown is 1,057.
What is the Ratio of Males per 100 Females in Yorktown?
There are 106.53 Males per 100 Females in Yorktown.
What is the Ratio of Females per 100 Males in Yorktown?
There are 93.87 Females per 100 Males in Yorktown.
What is the Median Population Age in Yorktown?
Median Population Age in Yorktown is 35.7 Years.
What is the Average Family Size in Yorktown
Average Family Size in Yorktown is 3.5 People.
What is the Average Household Size in Yorktown
Average Household Size in Yorktown is 2.8 People.
How Large is the Labor Force in Yorktown?
There are 763 People in the Labor Forcein in Yorktown.
What is the Percentage of People in the Labor Force in Yorktown?
45.3% of People are in the Labor Force in Yorktown.
What is the Unemployment Rate in Yorktown?
Unemployment Rate in Yorktown is 7.5%.