Cities with the Highest Percentage of Population Employed in Construction in South Carolina
RELATED REPORTS & OPTIONS
Construction
South Carolina
Compare Cities
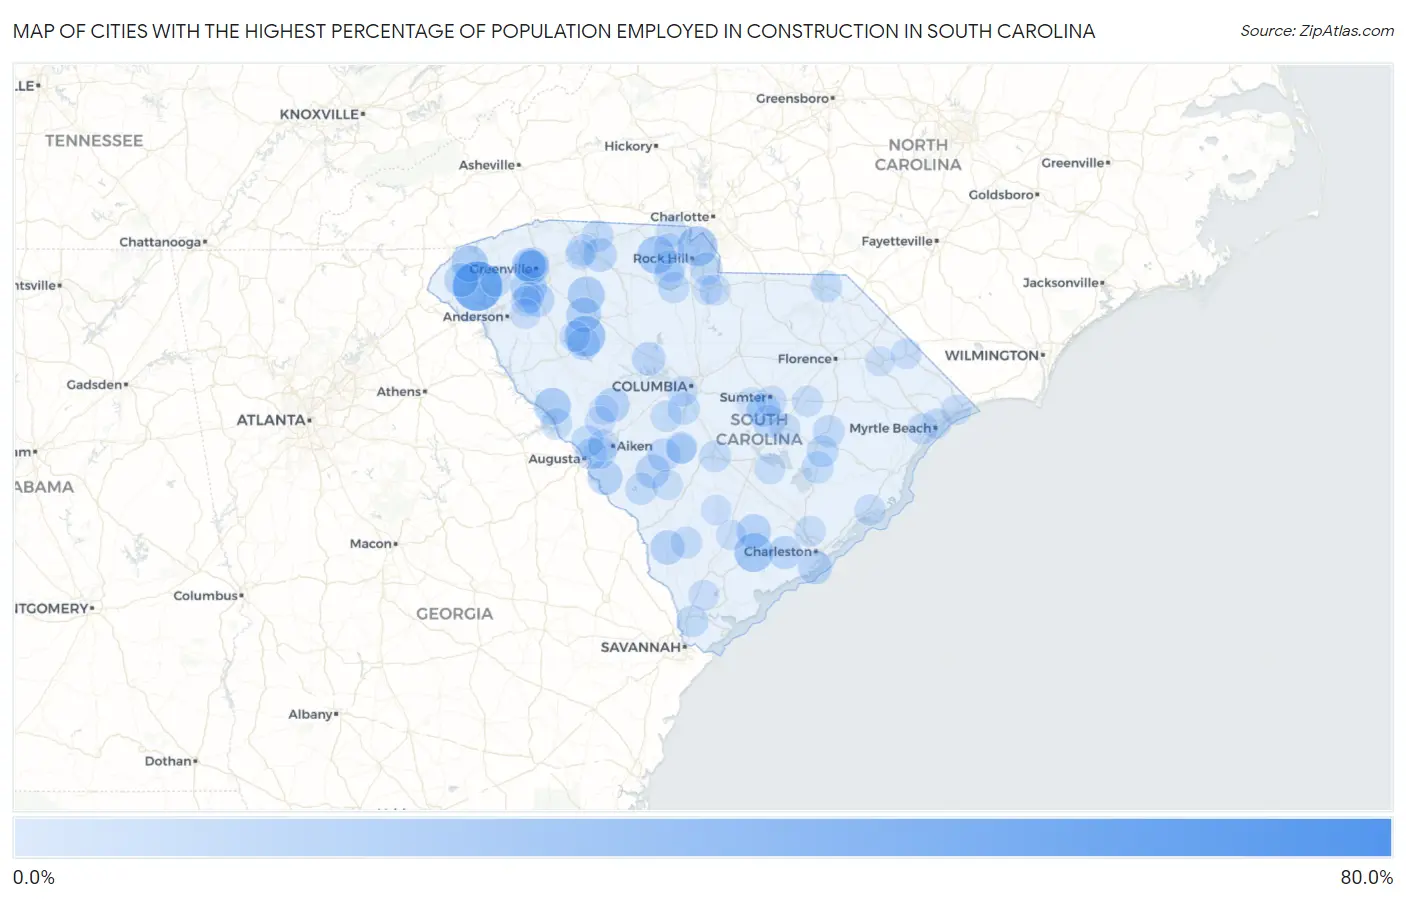
Map of Cities with the Highest Percentage of Population Employed in Construction in South Carolina
0.0%
80.0%
Cities with the Highest Percentage of Population Employed in Construction in South Carolina
| City | % Employed | vs State | vs National | |
| 1. | Gillisonville | 78.2% | 7.0%(+71.2)#1 | 6.9%(+71.3)#66 |
| 2. | Newry | 53.1% | 7.0%(+46.2)#2 | 6.9%(+46.2)#189 |
| 3. | Conestee | 44.6% | 7.0%(+37.6)#3 | 6.9%(+37.7)#279 |
| 4. | Mountville | 33.0% | 7.0%(+26.0)#4 | 6.9%(+26.1)#606 |
| 5. | Riverview | 31.0% | 7.0%(+24.0)#5 | 6.9%(+24.1)#690 |
| 6. | Jacksonboro | 28.9% | 7.0%(+21.9)#6 | 6.9%(+22.0)#808 |
| 7. | Sharon | 27.1% | 7.0%(+20.1)#7 | 6.9%(+20.2)#966 |
| 8. | Enoree | 25.1% | 7.0%(+18.2)#8 | 6.9%(+18.2)#1,115 |
| 9. | Plum Branch | 24.4% | 7.0%(+17.5)#9 | 6.9%(+17.6)#1,185 |
| 10. | Piedmont | 24.0% | 7.0%(+17.0)#10 | 6.9%(+17.1)#1,247 |
| 11. | Salem | 23.5% | 7.0%(+16.6)#11 | 6.9%(+16.7)#1,308 |
| 12. | Watts Mills | 20.8% | 7.0%(+13.9)#12 | 6.9%(+14.0)#1,743 |
| 13. | Jackson | 20.6% | 7.0%(+13.6)#13 | 6.9%(+13.7)#1,783 |
| 14. | Finklea | 20.5% | 7.0%(+13.5)#14 | 6.9%(+13.6)#1,789 |
| 15. | Harbor Island | 20.3% | 7.0%(+13.3)#15 | 6.9%(+13.4)#1,833 |
| 16. | Ward | 20.0% | 7.0%(+13.0)#16 | 6.9%(+13.1)#1,883 |
| 17. | Cottageville | 19.4% | 7.0%(+12.4)#17 | 6.9%(+12.5)#2,034 |
| 18. | Luray | 19.2% | 7.0%(+12.3)#18 | 6.9%(+12.4)#2,083 |
| 19. | Parker | 18.8% | 7.0%(+11.8)#19 | 6.9%(+11.9)#2,207 |
| 20. | Elko | 18.8% | 7.0%(+11.8)#20 | 6.9%(+11.9)#2,218 |
| 21. | Lobeco | 18.6% | 7.0%(+11.6)#21 | 6.9%(+11.7)#2,249 |
| 22. | Walhalla | 18.5% | 7.0%(+11.5)#22 | 6.9%(+11.6)#2,279 |
| 23. | Ware Place | 18.4% | 7.0%(+11.4)#23 | 6.9%(+11.5)#2,306 |
| 24. | City View | 18.3% | 7.0%(+11.4)#24 | 6.9%(+11.5)#2,313 |
| 25. | Folly Beach | 18.2% | 7.0%(+11.2)#25 | 6.9%(+11.3)#2,396 |
| 26. | Wyboo | 17.9% | 7.0%(+10.9)#26 | 6.9%(+11.0)#2,472 |
| 27. | Glendale | 17.8% | 7.0%(+10.8)#27 | 6.9%(+10.9)#2,488 |
| 28. | Pimlico | 17.7% | 7.0%(+10.7)#28 | 6.9%(+10.8)#2,513 |
| 29. | Privateer | 17.7% | 7.0%(+10.7)#29 | 6.9%(+10.8)#2,527 |
| 30. | Little Mountain | 17.6% | 7.0%(+10.6)#30 | 6.9%(+10.7)#2,557 |
| 31. | Berea | 17.6% | 7.0%(+10.6)#31 | 6.9%(+10.7)#2,573 |
| 32. | Ravenel | 17.1% | 7.0%(+10.1)#32 | 6.9%(+10.2)#2,699 |
| 33. | Floydale | 17.0% | 7.0%(+10.1)#33 | 6.9%(+10.2)#2,733 |
| 34. | Springfield | 17.0% | 7.0%(+10.1)#34 | 6.9%(+10.2)#2,737 |
| 35. | Dovesville | 16.8% | 7.0%(+9.83)#35 | 6.9%(+9.93)#2,809 |
| 36. | Paxville | 16.5% | 7.0%(+9.50)#36 | 6.9%(+9.59)#2,968 |
| 37. | Catawba | 16.3% | 7.0%(+9.28)#37 | 6.9%(+9.38)#3,039 |
| 38. | Cross Hill | 16.1% | 7.0%(+9.16)#38 | 6.9%(+9.25)#3,081 |
| 39. | Langley | 15.9% | 7.0%(+8.95)#39 | 6.9%(+9.04)#3,167 |
| 40. | Snelling | 15.0% | 7.0%(+8.07)#40 | 6.9%(+8.16)#3,574 |
| 41. | Kingstree | 15.0% | 7.0%(+8.06)#41 | 6.9%(+8.16)#3,577 |
| 42. | Gaston | 14.9% | 7.0%(+7.90)#42 | 6.9%(+7.99)#3,686 |
| 43. | Grover | 14.8% | 7.0%(+7.82)#43 | 6.9%(+7.91)#3,730 |
| 44. | Murphys Estates | 14.6% | 7.0%(+7.66)#44 | 6.9%(+7.76)#3,825 |
| 45. | Hardeeville | 14.3% | 7.0%(+7.37)#45 | 6.9%(+7.47)#3,996 |
| 46. | St Stephen | 14.3% | 7.0%(+7.31)#46 | 6.9%(+7.41)#4,019 |
| 47. | Clearwater | 14.2% | 7.0%(+7.26)#47 | 6.9%(+7.36)#4,086 |
| 48. | Lane | 14.2% | 7.0%(+7.23)#48 | 6.9%(+7.32)#4,095 |
| 49. | Mayo | 14.2% | 7.0%(+7.21)#49 | 6.9%(+7.30)#4,105 |
| 50. | Southern Shops | 13.9% | 7.0%(+6.93)#50 | 6.9%(+7.03)#4,272 |
| 51. | Wilkinson Heights | 13.9% | 7.0%(+6.89)#51 | 6.9%(+6.99)#4,299 |
| 52. | Mcconnells | 13.8% | 7.0%(+6.86)#52 | 6.9%(+6.96)#4,317 |
| 53. | Varnville | 13.7% | 7.0%(+6.76)#53 | 6.9%(+6.85)#4,386 |
| 54. | Livingston | 13.7% | 7.0%(+6.75)#54 | 6.9%(+6.85)#4,392 |
| 55. | Pelion | 13.6% | 7.0%(+6.63)#55 | 6.9%(+6.72)#4,475 |
| 56. | Wallace | 13.6% | 7.0%(+6.62)#56 | 6.9%(+6.72)#4,477 |
| 57. | Modoc | 13.3% | 7.0%(+6.33)#57 | 6.9%(+6.43)#4,709 |
| 58. | Norris | 13.0% | 7.0%(+6.07)#58 | 6.9%(+6.17)#4,873 |
| 59. | Eureka Mill | 13.0% | 7.0%(+6.00)#59 | 6.9%(+6.10)#4,943 |
| 60. | Socastee | 12.8% | 7.0%(+5.84)#60 | 6.9%(+5.93)#5,057 |
| 61. | Graniteville | 12.6% | 7.0%(+5.62)#61 | 6.9%(+5.71)#5,186 |
| 62. | Mcclellanville | 12.5% | 7.0%(+5.57)#62 | 6.9%(+5.67)#5,214 |
| 63. | Waterloo | 12.5% | 7.0%(+5.53)#63 | 6.9%(+5.62)#5,252 |
| 64. | Edmund | 12.5% | 7.0%(+5.48)#64 | 6.9%(+5.57)#5,307 |
| 65. | Turbeville | 12.4% | 7.0%(+5.47)#65 | 6.9%(+5.57)#5,310 |
| 66. | Pelzer | 12.4% | 7.0%(+5.42)#66 | 6.9%(+5.51)#5,361 |
| 67. | Clover | 12.3% | 7.0%(+5.31)#67 | 6.9%(+5.40)#5,453 |
| 68. | South Sumter | 12.3% | 7.0%(+5.28)#68 | 6.9%(+5.38)#5,478 |
| 69. | Hanahan | 12.2% | 7.0%(+5.23)#69 | 6.9%(+5.33)#5,516 |
| 70. | Irwin | 12.2% | 7.0%(+5.21)#70 | 6.9%(+5.31)#5,533 |
| 71. | Homewood | 12.0% | 7.0%(+5.07)#71 | 6.9%(+5.17)#5,645 |
| 72. | Lowrys | 12.0% | 7.0%(+5.06)#72 | 6.9%(+5.16)#5,652 |
| 73. | Manning | 12.0% | 7.0%(+5.06)#73 | 6.9%(+5.16)#5,655 |
| 74. | Fripp Island | 12.0% | 7.0%(+5.00)#74 | 6.9%(+5.10)#5,727 |
| 75. | Eutawville | 11.9% | 7.0%(+4.96)#75 | 6.9%(+5.06)#5,778 |
| 76. | Williamston | 11.7% | 7.0%(+4.77)#76 | 6.9%(+4.87)#5,963 |
| 77. | Dale | 11.7% | 7.0%(+4.73)#77 | 6.9%(+4.82)#6,006 |
| 78. | York | 11.7% | 7.0%(+4.68)#78 | 6.9%(+4.78)#6,056 |
| 79. | Ridgeland | 11.6% | 7.0%(+4.65)#79 | 6.9%(+4.74)#6,096 |
| 80. | Springdale | 11.6% | 7.0%(+4.58)#80 | 6.9%(+4.68)#6,165 |
| 81. | Hilltop | 11.5% | 7.0%(+4.52)#81 | 6.9%(+4.61)#6,236 |
| 82. | Belton | 11.4% | 7.0%(+4.47)#82 | 6.9%(+4.57)#6,275 |
| 83. | Nichols | 11.4% | 7.0%(+4.46)#83 | 6.9%(+4.55)#6,294 |
| 84. | Hilda | 11.4% | 7.0%(+4.44)#84 | 6.9%(+4.53)#6,321 |
| 85. | Walterboro | 11.3% | 7.0%(+4.31)#85 | 6.9%(+4.41)#6,448 |
| 86. | Myrtle Beach | 11.1% | 7.0%(+4.14)#86 | 6.9%(+4.24)#6,607 |
| 87. | Smoaks | 11.1% | 7.0%(+4.14)#87 | 6.9%(+4.23)#6,659 |
| 88. | North Myrtle Beach | 11.0% | 7.0%(+4.04)#88 | 6.9%(+4.14)#6,760 |
| 89. | Sans Souci | 10.9% | 7.0%(+3.88)#89 | 6.9%(+3.98)#6,942 |
| 90. | Elliott | 10.8% | 7.0%(+3.82)#90 | 6.9%(+3.91)#7,015 |
| 91. | Daviston | 10.8% | 7.0%(+3.78)#91 | 6.9%(+3.88)#7,069 |
| 92. | Neeses | 10.7% | 7.0%(+3.74)#92 | 6.9%(+3.84)#7,116 |
| 93. | Trenton | 10.7% | 7.0%(+3.74)#93 | 6.9%(+3.84)#7,117 |
| 94. | Wedgefield | 10.6% | 7.0%(+3.67)#94 | 6.9%(+3.77)#7,216 |
| 95. | Fairforest | 10.4% | 7.0%(+3.43)#95 | 6.9%(+3.53)#7,506 |
| 96. | Johnston | 10.4% | 7.0%(+3.41)#96 | 6.9%(+3.50)#7,538 |
| 97. | Chickasaw Point | 10.3% | 7.0%(+3.30)#97 | 6.9%(+3.39)#7,675 |
| 98. | Marion | 10.3% | 7.0%(+3.29)#98 | 6.9%(+3.38)#7,690 |
| 99. | Fort Lawn | 10.1% | 7.0%(+3.17)#99 | 6.9%(+3.27)#7,817 |
| 100. | East Camden | 10.1% | 7.0%(+3.16)#100 | 6.9%(+3.26)#7,840 |
Common Questions
What are the Top 10 Cities with the Highest Percentage of Population Employed in Construction in South Carolina?
Top 10 Cities with the Highest Percentage of Population Employed in Construction in South Carolina are:
#1
53.1%
#2
33.0%
#3
31.0%
#4
28.9%
#5
27.1%
#6
25.1%
#7
24.4%
#8
24.0%
#9
23.5%
#10
20.8%
What city has the Highest Percentage of Population Employed in Construction in South Carolina?
Newry has the Highest Percentage of Population Employed in Construction in South Carolina with 53.1%.
What is the Percentage of Population Employed in Construction in the State of South Carolina?
Percentage of Population Employed in Construction in South Carolina is 7.0%.
What is the Percentage of Population Employed in Construction in the United States?
Percentage of Population Employed in Construction in the United States is 6.9%.