Luray, SC Map & Demographics
Luray Map
Luray Overview
$23,753
PER CAPITA INCOME
$55,000
AVG FAMILY INCOME
$51,705
AVG HOUSEHOLD INCOME
20.2%
WAGE / INCOME GAP [ % ]
79.8¢/ $1
WAGE / INCOME GAP [ $ ]
0.29
INEQUALITY / GINI INDEX
176
TOTAL POPULATION
126
MALE POPULATION
50
FEMALE POPULATION
252.00
MALES / 100 FEMALES
39.68
FEMALES / 100 MALES
28.9
MEDIAN AGE
3.5
AVG FAMILY SIZE
3.2
AVG HOUSEHOLD SIZE
119
LABOR FORCE [ PEOPLE ]
70.0%
PERCENT IN LABOR FORCE
9.6%
UNEMPLOYMENT RATE
Luray Zip Codes
Luray Area Codes
Income in Luray
Income Overview in Luray
Per Capita Income in Luray is $23,753, while median incomes of families and households are $55,000 and $51,705 respectively.
| Characteristic | Number | Measure |
| Per Capita Income | 176 | $23,753 |
| Median Family Income | 48 | $55,000 |
| Mean Family Income | 48 | $64,923 |
| Median Household Income | 55 | $51,705 |
| Mean Household Income | 55 | $60,240 |
| Income Deficit | 48 | $0 |
| Wage / Income Gap (%) | 176 | 20.19% |
| Wage / Income Gap ($) | 176 | 79.81¢ per $1 |
| Gini / Inequality Index | 176 | 0.29 |
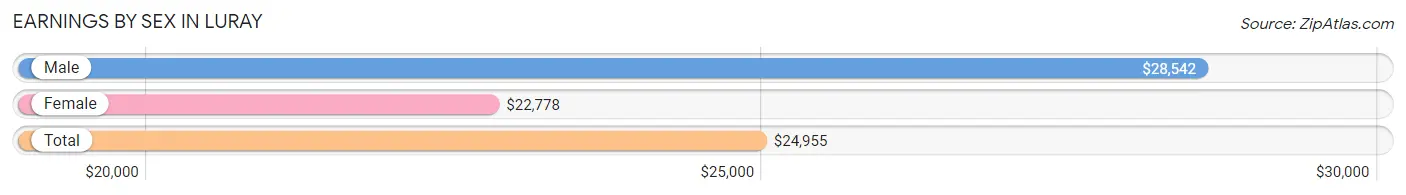
Earnings by Sex in Luray
Average Earnings in Luray are $24,955, $28,542 for men and $22,778 for women, a difference of 20.2%.
| Sex | Number | Average Earnings |
| Male | 97 (84.4%) | $28,542 |
| Female | 18 (15.7%) | $22,778 |
| Total | 115 (100.0%) | $24,955 |
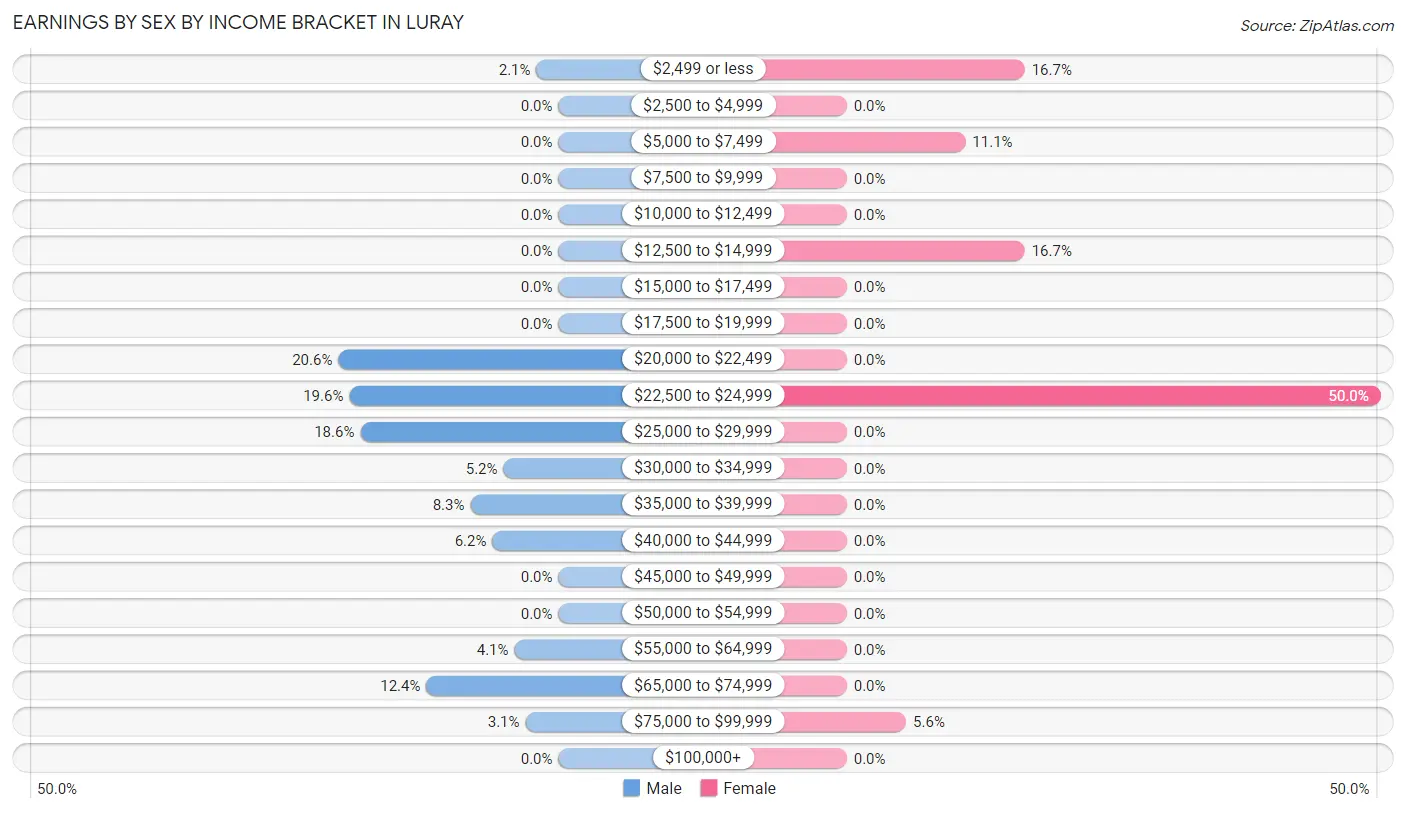
Earnings by Sex by Income Bracket in Luray
The most common earnings brackets in Luray are $20,000 to $22,499 for men (20 | 20.6%) and $22,500 to $24,999 for women (9 | 50.0%).
| Income | Male | Female |
| $2,499 or less | 2 (2.1%) | 3 (16.7%) |
| $2,500 to $4,999 | 0 (0.0%) | 0 (0.0%) |
| $5,000 to $7,499 | 0 (0.0%) | 2 (11.1%) |
| $7,500 to $9,999 | 0 (0.0%) | 0 (0.0%) |
| $10,000 to $12,499 | 0 (0.0%) | 0 (0.0%) |
| $12,500 to $14,999 | 0 (0.0%) | 3 (16.7%) |
| $15,000 to $17,499 | 0 (0.0%) | 0 (0.0%) |
| $17,500 to $19,999 | 0 (0.0%) | 0 (0.0%) |
| $20,000 to $22,499 | 20 (20.6%) | 0 (0.0%) |
| $22,500 to $24,999 | 19 (19.6%) | 9 (50.0%) |
| $25,000 to $29,999 | 18 (18.6%) | 0 (0.0%) |
| $30,000 to $34,999 | 5 (5.1%) | 0 (0.0%) |
| $35,000 to $39,999 | 8 (8.3%) | 0 (0.0%) |
| $40,000 to $44,999 | 6 (6.2%) | 0 (0.0%) |
| $45,000 to $49,999 | 0 (0.0%) | 0 (0.0%) |
| $50,000 to $54,999 | 0 (0.0%) | 0 (0.0%) |
| $55,000 to $64,999 | 4 (4.1%) | 0 (0.0%) |
| $65,000 to $74,999 | 12 (12.4%) | 0 (0.0%) |
| $75,000 to $99,999 | 3 (3.1%) | 1 (5.6%) |
| $100,000+ | 0 (0.0%) | 0 (0.0%) |
| Total | 97 (100.0%) | 18 (100.0%) |
Earnings by Sex by Educational Attainment in Luray
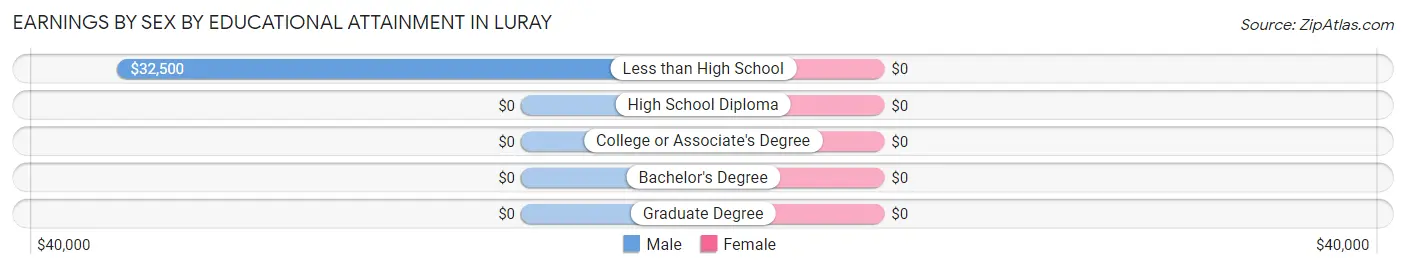
| Educational Attainment | Male Income | Female Income |
| Less than High School | $32,500 | $0 |
| High School Diploma | - | - |
| College or Associate's Degree | - | - |
| Bachelor's Degree | - | - |
| Graduate Degree | - | - |
| Total | $29,722 | $0 |
Family Income in Luray
Family Income Brackets in Luray
According to the Luray family income data, there are 16 families falling into the $50,000 to $74,999 income range, which is the most common income bracket and makes up 33.3% of all families.
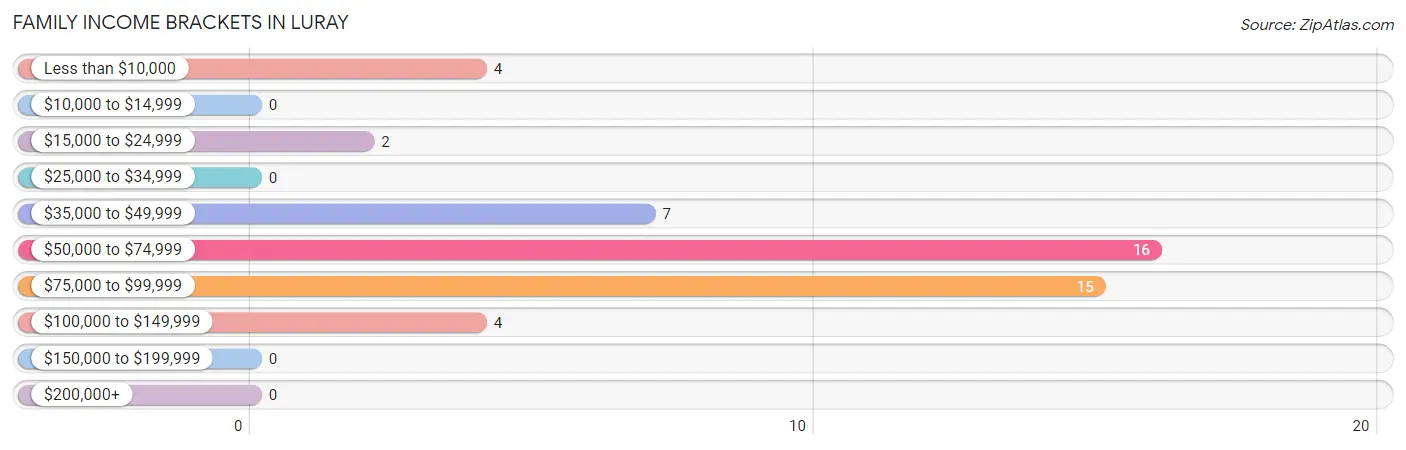
| Income Bracket | # Families | % Families |
| Less than $10,000 | 4 | 8.3% |
| $10,000 to $14,999 | 0 | 0.0% |
| $15,000 to $24,999 | 2 | 4.2% |
| $25,000 to $34,999 | 0 | 0.0% |
| $35,000 to $49,999 | 7 | 14.6% |
| $50,000 to $74,999 | 16 | 33.3% |
| $75,000 to $99,999 | 15 | 31.3% |
| $100,000 to $149,999 | 4 | 8.3% |
| $150,000 to $199,999 | 0 | 0.0% |
| $200,000+ | 0 | 0.0% |
Family Income by Famaliy Size in Luray
4-person families (24 | 50.0%) account for the highest median family income in Luray with $95,208 per family, while 2-person families (21 | 43.8%) have the highest median income of $24,554 per family member.
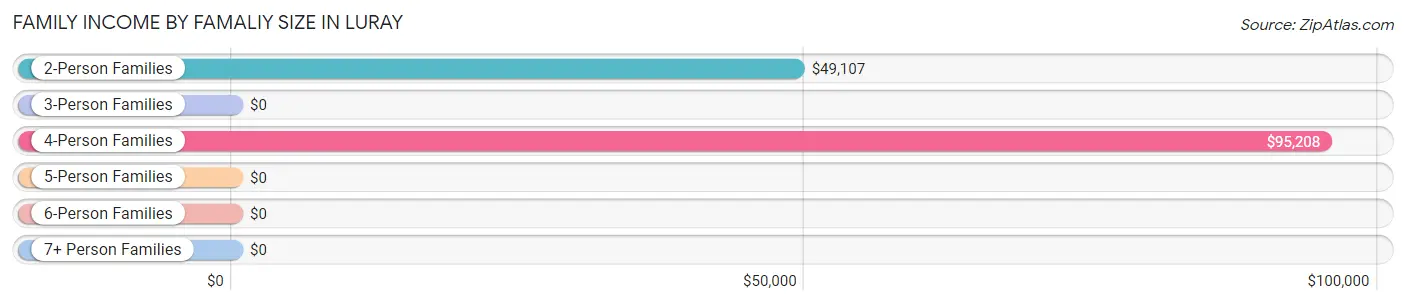
| Income Bracket | # Families | Median Income |
| 2-Person Families | 21 (43.8%) | $49,107 |
| 3-Person Families | 3 (6.2%) | $0 |
| 4-Person Families | 24 (50.0%) | $95,208 |
| 5-Person Families | 0 (0.0%) | $0 |
| 6-Person Families | 0 (0.0%) | $0 |
| 7+ Person Families | 0 (0.0%) | $0 |
| Total | 48 (100.0%) | $55,000 |
Family Income by Number of Earners in Luray
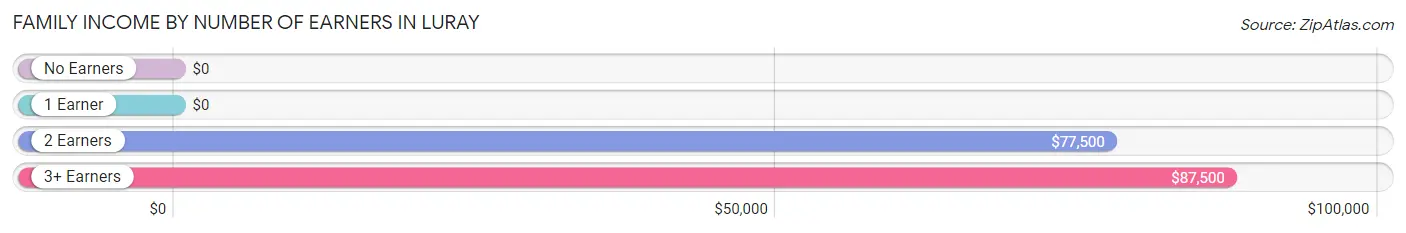
| Number of Earners | # Families | Median Income |
| No Earners | 7 (14.6%) | $0 |
| 1 Earner | 7 (14.6%) | $0 |
| 2 Earners | 30 (62.5%) | $77,500 |
| 3+ Earners | 4 (8.3%) | $87,500 |
| Total | 48 (100.0%) | $55,000 |
Household Income in Luray
Household Income Brackets in Luray
With 16 households falling in the category, the $50,000 to $74,999 income range is the most frequent in Luray, accounting for 29.1% of all households.
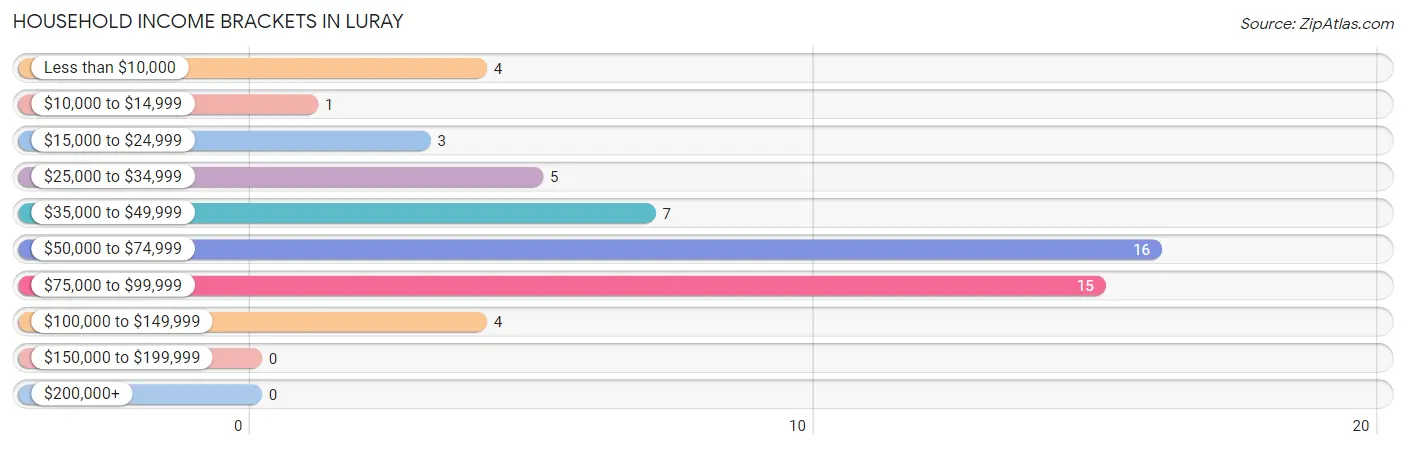
| Income Bracket | # Households | % Households |
| Less than $10,000 | 4 | 7.3% |
| $10,000 to $14,999 | 1 | 1.8% |
| $15,000 to $24,999 | 3 | 5.5% |
| $25,000 to $34,999 | 5 | 9.1% |
| $35,000 to $49,999 | 7 | 12.7% |
| $50,000 to $74,999 | 16 | 29.1% |
| $75,000 to $99,999 | 15 | 27.3% |
| $100,000 to $149,999 | 4 | 7.3% |
| $150,000 to $199,999 | 0 | 0.0% |
| $200,000+ | 0 | 0.0% |
Household Income by Householder Age in Luray
The median household income in Luray is $51,705, with the highest median household income of $95,417 found in the 25 to 44 years age bracket for the primary householder. A total of 20 households (36.4%) fall into this category.
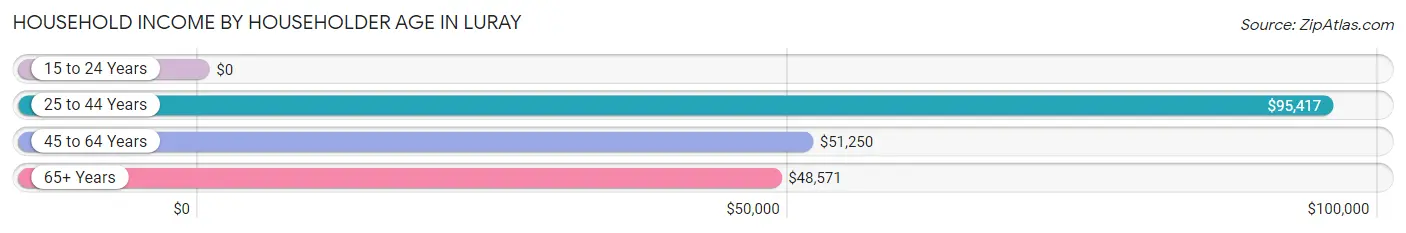
| Income Bracket | # Households | Median Income |
| 15 to 24 Years | 0 (0.0%) | $0 |
| 25 to 44 Years | 20 (36.4%) | $95,417 |
| 45 to 64 Years | 23 (41.8%) | $51,250 |
| 65+ Years | 12 (21.8%) | $48,571 |
| Total | 55 (100.0%) | $51,705 |
Poverty in Luray
Income Below Poverty by Sex and Age in Luray
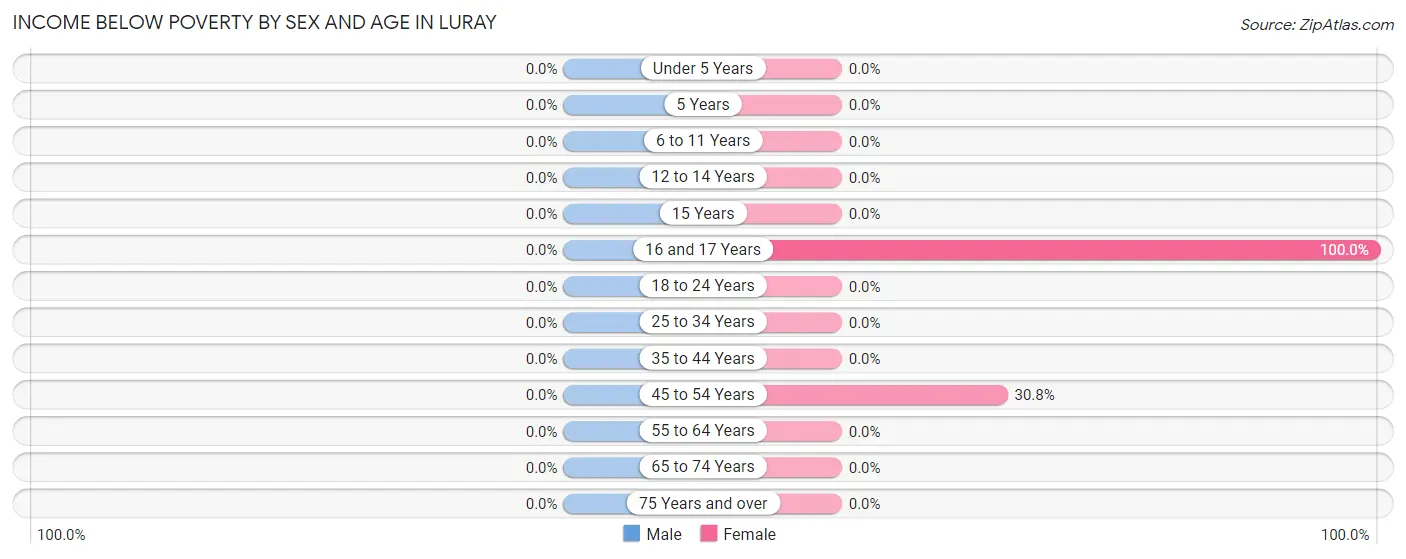
| Age Bracket | Male | Female |
| Under 5 Years | 0 (0.0%) | 0 (0.0%) |
| 5 Years | 0 (0.0%) | 0 (0.0%) |
| 6 to 11 Years | 0 (0.0%) | 0 (0.0%) |
| 12 to 14 Years | 0 (0.0%) | 0 (0.0%) |
| 15 Years | 0 (0.0%) | 0 (0.0%) |
| 16 and 17 Years | 0 (0.0%) | 5 (100.0%) |
| 18 to 24 Years | 0 (0.0%) | 0 (0.0%) |
| 25 to 34 Years | 0 (0.0%) | 0 (0.0%) |
| 35 to 44 Years | 0 (0.0%) | 0 (0.0%) |
| 45 to 54 Years | 0 (0.0%) | 4 (30.8%) |
| 55 to 64 Years | 0 (0.0%) | 0 (0.0%) |
| 65 to 74 Years | 0 (0.0%) | 0 (0.0%) |
| 75 Years and over | 0 (0.0%) | 0 (0.0%) |
| Total | 0 (0.0%) | 9 (18.0%) |
Income Above Poverty by Sex and Age in Luray
According to the poverty statistics in Luray, males aged 15 years and females aged 18 to 24 years are the age groups that are most secure financially, with 100.0% of males and 100.0% of females in these age groups living above the poverty line.
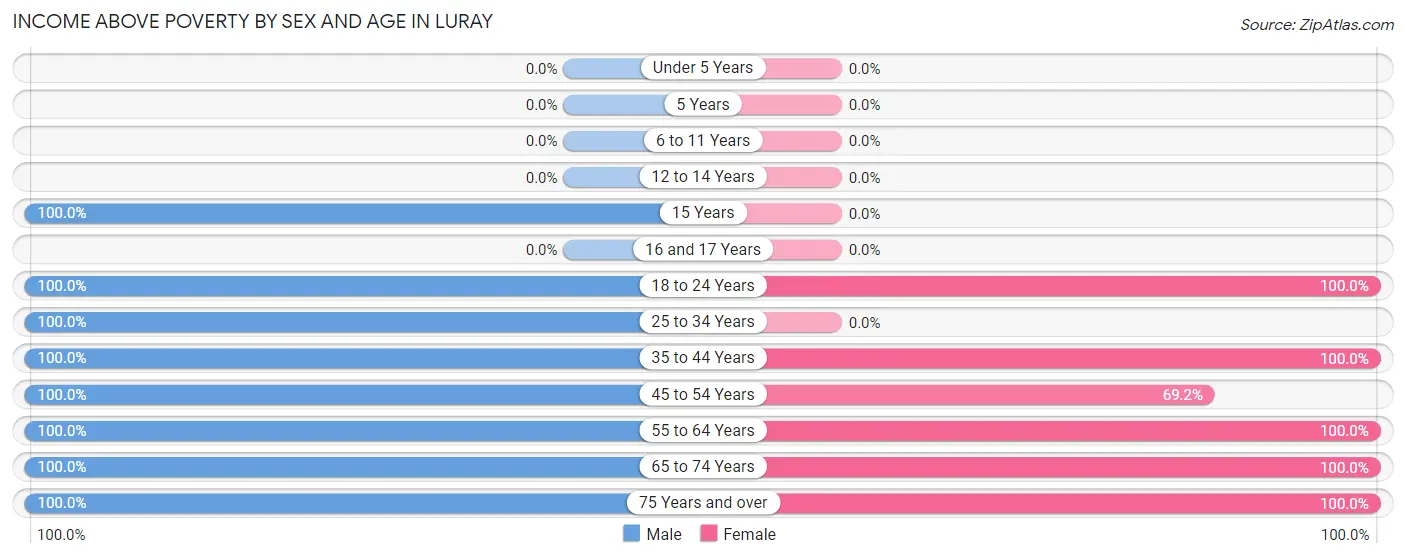
| Age Bracket | Male | Female |
| Under 5 Years | 0 (0.0%) | 0 (0.0%) |
| 5 Years | 0 (0.0%) | 0 (0.0%) |
| 6 to 11 Years | 0 (0.0%) | 0 (0.0%) |
| 12 to 14 Years | 0 (0.0%) | 0 (0.0%) |
| 15 Years | 6 (100.0%) | 0 (0.0%) |
| 16 and 17 Years | 0 (0.0%) | 0 (0.0%) |
| 18 to 24 Years | 45 (100.0%) | 6 (100.0%) |
| 25 to 34 Years | 28 (100.0%) | 0 (0.0%) |
| 35 to 44 Years | 12 (100.0%) | 13 (100.0%) |
| 45 to 54 Years | 22 (100.0%) | 9 (69.2%) |
| 55 to 64 Years | 2 (100.0%) | 1 (100.0%) |
| 65 to 74 Years | 9 (100.0%) | 5 (100.0%) |
| 75 Years and over | 2 (100.0%) | 7 (100.0%) |
| Total | 126 (100.0%) | 41 (82.0%) |
Income Below Poverty Among Married-Couple Families in Luray
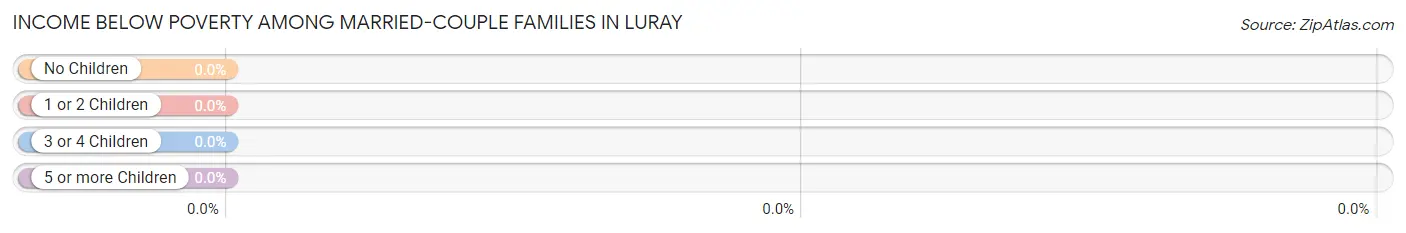
| Children | Above Poverty | Below Poverty |
| No Children | 31 (100.0%) | 0 (0.0%) |
| 1 or 2 Children | 11 (100.0%) | 0 (0.0%) |
| 3 or 4 Children | 0 (0.0%) | 0 (0.0%) |
| 5 or more Children | 0 (0.0%) | 0 (0.0%) |
| Total | 42 (100.0%) | 0 (0.0%) |
Income Below Poverty Among Single-Parent Households in Luray
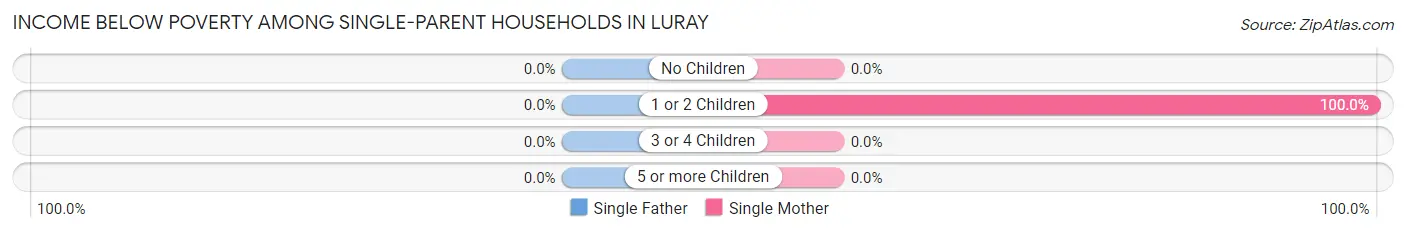
| Children | Single Father | Single Mother |
| No Children | 0 (0.0%) | 0 (0.0%) |
| 1 or 2 Children | 0 (0.0%) | 4 (100.0%) |
| 3 or 4 Children | 0 (0.0%) | 0 (0.0%) |
| 5 or more Children | 0 (0.0%) | 0 (0.0%) |
| Total | 0 (0.0%) | 4 (66.7%) |
Income Below Poverty Among Married-Couple vs Single-Parent Households in Luray
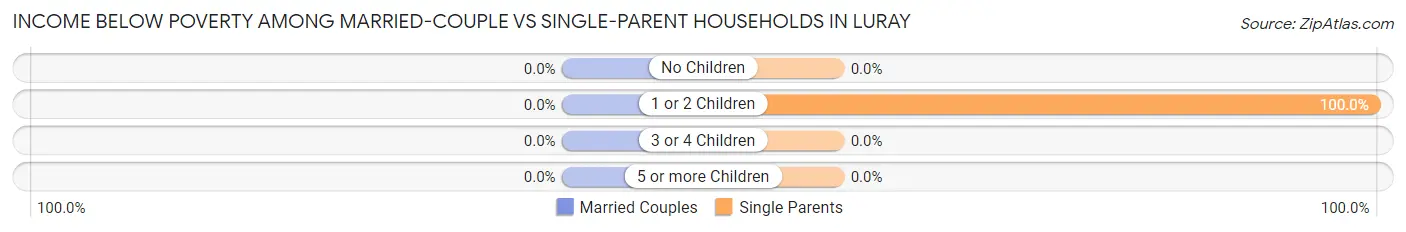
| Children | Married-Couple Families | Single-Parent Households |
| No Children | 0 (0.0%) | 0 (0.0%) |
| 1 or 2 Children | 0 (0.0%) | 4 (100.0%) |
| 3 or 4 Children | 0 (0.0%) | 0 (0.0%) |
| 5 or more Children | 0 (0.0%) | 0 (0.0%) |
| Total | 0 (0.0%) | 4 (66.7%) |
Race in Luray
The most populous races in Luray are Hispanic or Latino (114 | 64.8%), Some other Race (110 | 62.5%), and Black / African American (33 | 18.8%).
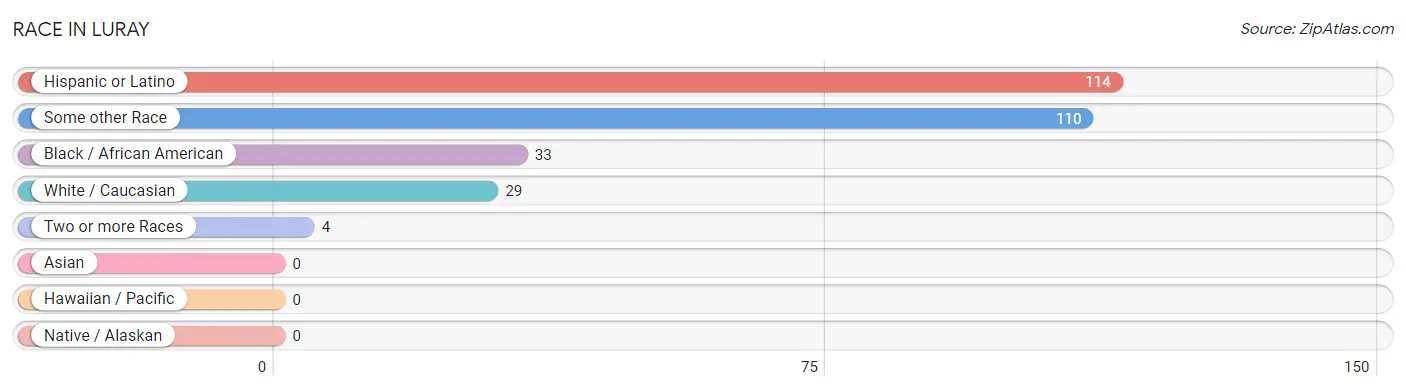
| Race | # Population | % Population |
| Asian | 0 | 0.0% |
| Black / African American | 33 | 18.8% |
| Hawaiian / Pacific | 0 | 0.0% |
| Hispanic or Latino | 114 | 64.8% |
| Native / Alaskan | 0 | 0.0% |
| White / Caucasian | 29 | 16.5% |
| Two or more Races | 4 | 2.3% |
| Some other Race | 110 | 62.5% |
| Total | 176 | 100.0% |
Ancestry in Luray
The most populous ancestries reported in Luray are Mexican (110 | 62.5%), English (10 | 5.7%), Puerto Rican (4 | 2.3%), Dutch (2 | 1.1%), and German (2 | 1.1%), together accounting for 72.7% of all Luray residents.
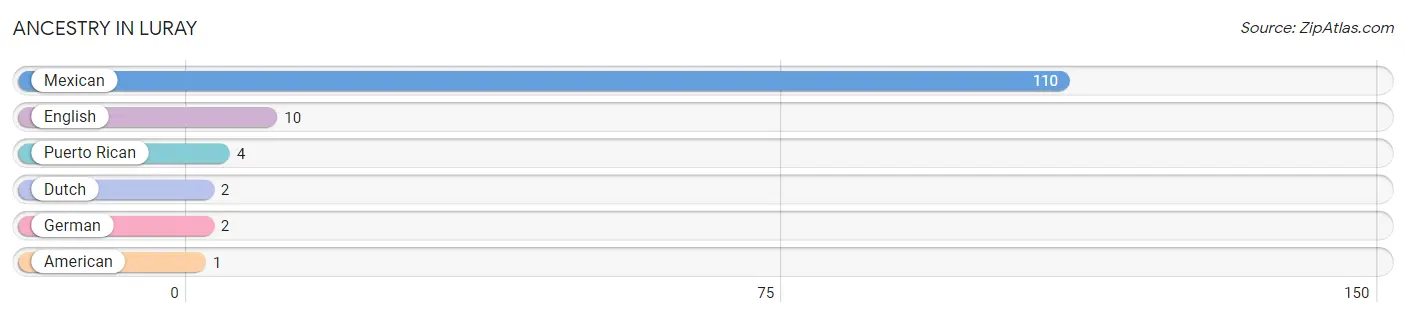
| Ancestry | # Population | % Population |
| American | 1 | 0.6% |
| Dutch | 2 | 1.1% |
| English | 10 | 5.7% |
| German | 2 | 1.1% |
| Mexican | 110 | 62.5% |
| Puerto Rican | 4 | 2.3% | View All 6 Rows |
Immigrants in Luray
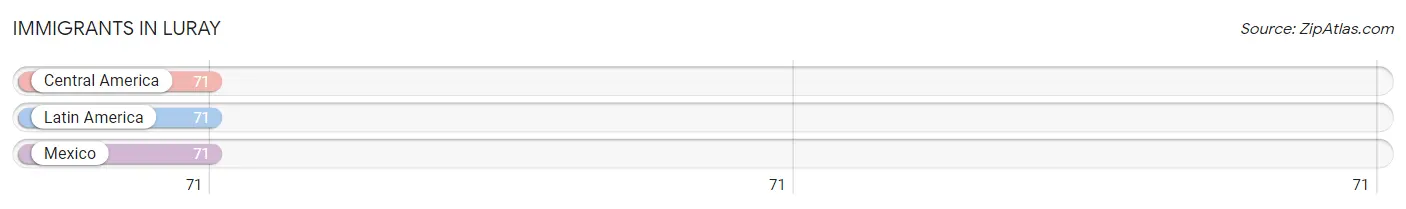
The most numerous immigrant groups reported in Luray came from Central America (71 | 40.3%), Latin America (71 | 40.3%), and Mexico (71 | 40.3%), together accounting for 121.0% of all Luray residents.
| Immigration Origin | # Population | % Population |
| Central America | 71 | 40.3% |
| Latin America | 71 | 40.3% |
| Mexico | 71 | 40.3% | View All 3 Rows |
Sex and Age in Luray
Sex and Age in Luray
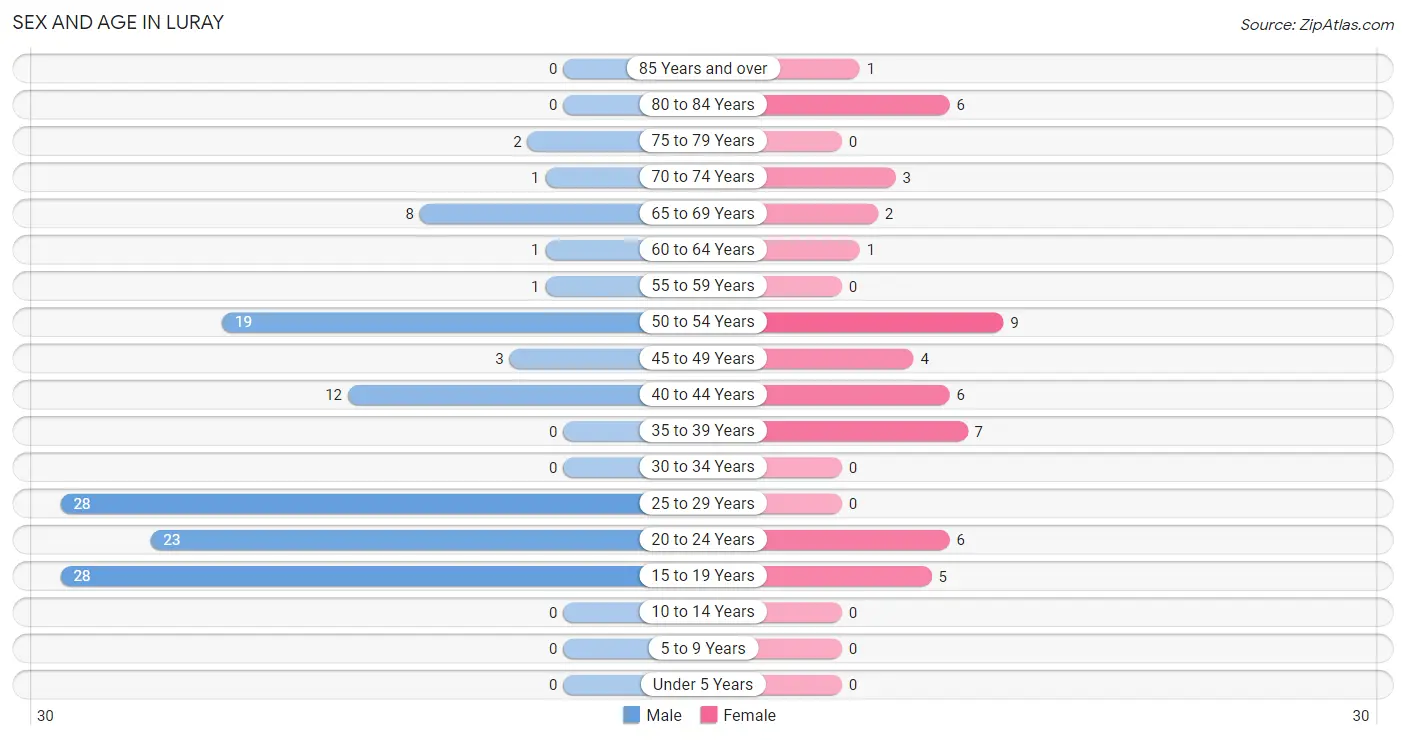
The most populous age groups in Luray are 15 to 19 Years (28 | 22.2%) for men and 50 to 54 Years (9 | 18.0%) for women.
| Age Bracket | Male | Female |
| Under 5 Years | 0 (0.0%) | 0 (0.0%) |
| 5 to 9 Years | 0 (0.0%) | 0 (0.0%) |
| 10 to 14 Years | 0 (0.0%) | 0 (0.0%) |
| 15 to 19 Years | 28 (22.2%) | 5 (10.0%) |
| 20 to 24 Years | 23 (18.2%) | 6 (12.0%) |
| 25 to 29 Years | 28 (22.2%) | 0 (0.0%) |
| 30 to 34 Years | 0 (0.0%) | 0 (0.0%) |
| 35 to 39 Years | 0 (0.0%) | 7 (14.0%) |
| 40 to 44 Years | 12 (9.5%) | 6 (12.0%) |
| 45 to 49 Years | 3 (2.4%) | 4 (8.0%) |
| 50 to 54 Years | 19 (15.1%) | 9 (18.0%) |
| 55 to 59 Years | 1 (0.8%) | 0 (0.0%) |
| 60 to 64 Years | 1 (0.8%) | 1 (2.0%) |
| 65 to 69 Years | 8 (6.4%) | 2 (4.0%) |
| 70 to 74 Years | 1 (0.8%) | 3 (6.0%) |
| 75 to 79 Years | 2 (1.6%) | 0 (0.0%) |
| 80 to 84 Years | 0 (0.0%) | 6 (12.0%) |
| 85 Years and over | 0 (0.0%) | 1 (2.0%) |
| Total | 126 (100.0%) | 50 (100.0%) |
Families and Households in Luray
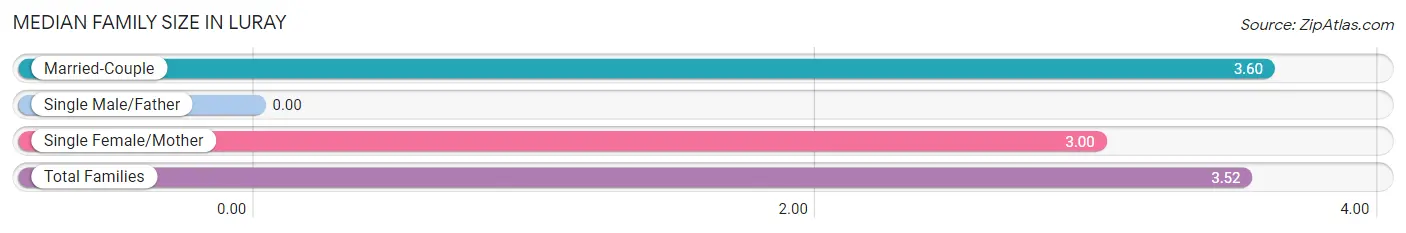
Median Family Size in Luray
| Family Type | # Families | Family Size |
| Married-Couple | 42 (87.5%) | 3.60 |
| Single Male/Father | 0 (0.0%) | - |
| Single Female/Mother | 6 (12.5%) | 3.00 |
| Total Families | 48 (100.0%) | 3.52 |
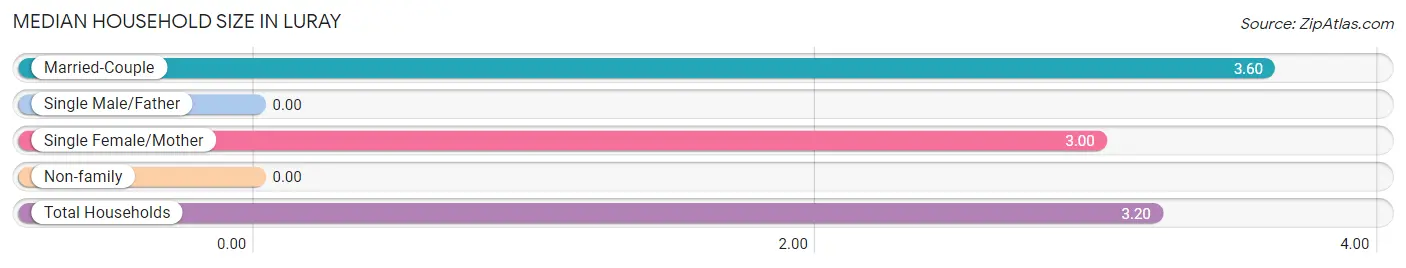
Median Household Size in Luray
| Household Type | # Households | Household Size |
| Married-Couple | 42 (76.4%) | 3.60 |
| Single Male/Father | 0 (0.0%) | - |
| Single Female/Mother | 6 (10.9%) | 3.00 |
| Non-family | 7 (12.7%) | - |
| Total Households | 55 (100.0%) | 3.20 |
Household Size by Marriage Status in Luray
Out of a total of 55 households in Luray, 48 (87.3%) are family households, while 7 (12.7%) are nonfamily households. The most numerous type of family households are 4-person households, comprising 24, and the most common type of nonfamily households are 1-person households, comprising 7.
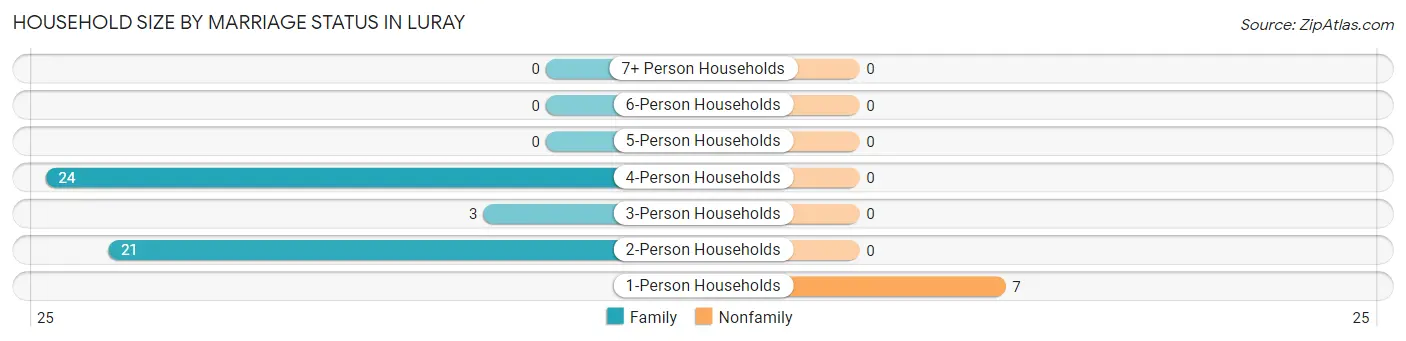
| Household Size | Family Households | Nonfamily Households |
| 1-Person Households | - | 7 (12.7%) |
| 2-Person Households | 21 (38.2%) | 0 (0.0%) |
| 3-Person Households | 3 (5.4%) | 0 (0.0%) |
| 4-Person Households | 24 (43.6%) | 0 (0.0%) |
| 5-Person Households | 0 (0.0%) | 0 (0.0%) |
| 6-Person Households | 0 (0.0%) | 0 (0.0%) |
| 7+ Person Households | 0 (0.0%) | 0 (0.0%) |
| Total | 48 (87.3%) | 7 (12.7%) |
Female Fertility in Luray
Fertility by Age in Luray
| Age Bracket | Women with Births | Births / 1,000 Women |
| 15 to 19 years | 0 (0.0%) | 0.0 |
| 20 to 34 years | 0 (0.0%) | 0.0 |
| 35 to 50 years | 0 (0.0%) | 0.0 |
| Total | 0 (0.0%) | 0.0 |
Fertility by Age by Marriage Status in Luray
| Age Bracket | Married | Unmarried |
| 15 to 19 years | 0 (0.0%) | 0 (0.0%) |
| 20 to 34 years | 0 (0.0%) | 0 (0.0%) |
| 35 to 50 years | 0 (0.0%) | 0 (0.0%) |
| Total | 0 (0.0%) | 0 (0.0%) |
Fertility by Education in Luray
| Educational Attainment | Women with Births | Births / 1,000 Women |
| Less than High School | 0 (0.0%) | 0.0 |
| High School Diploma | 0 (0.0%) | 0.0 |
| College or Associate's Degree | 0 (0.0%) | 0.0 |
| Bachelor's Degree | 0 (0.0%) | 0.0 |
| Graduate Degree | 0 (0.0%) | 0.0 |
| Total | 0 (0.0%) | 0.0 |
Fertility by Education by Marriage Status in Luray
| Educational Attainment | Married | Unmarried |
| Less than High School | 0 (0.0%) | 0 (0.0%) |
| High School Diploma | 0 (0.0%) | 0 (0.0%) |
| College or Associate's Degree | 0 (0.0%) | 0 (0.0%) |
| Bachelor's Degree | 0 (0.0%) | 0 (0.0%) |
| Graduate Degree | 0 (0.0%) | 0 (0.0%) |
| Total | 0 (0.0%) | 0 (0.0%) |
Employment Characteristics in Luray
Employment by Class of Employer in Luray
Among the 108 employed individuals in Luray, private company employees (86 | 79.6%), self-employed (incorporated) (8 | 7.4%), and local government employees (6 | 5.6%) make up the most common classes of employment.
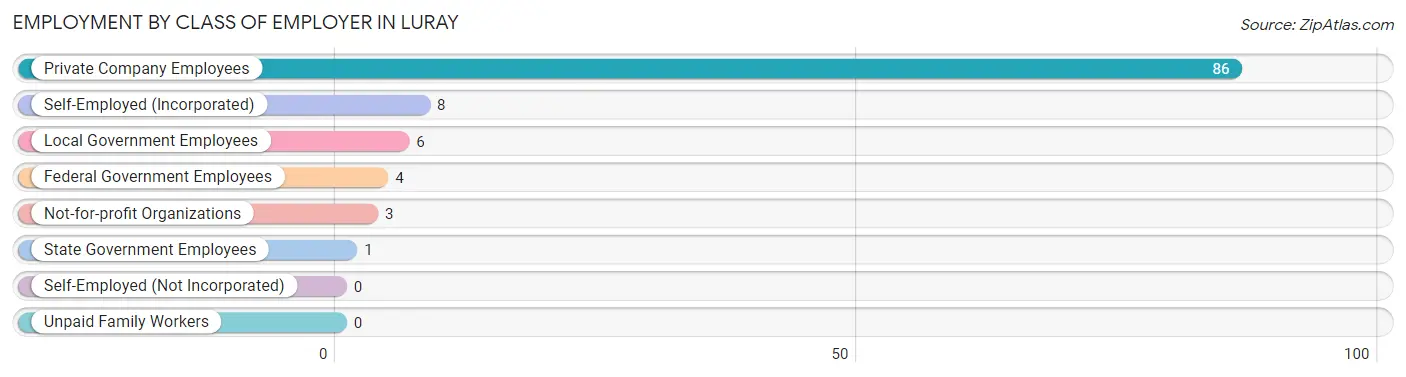
| Employer Class | # Employees | % Employees |
| Private Company Employees | 86 | 79.6% |
| Self-Employed (Incorporated) | 8 | 7.4% |
| Self-Employed (Not Incorporated) | 0 | 0.0% |
| Not-for-profit Organizations | 3 | 2.8% |
| Local Government Employees | 6 | 5.6% |
| State Government Employees | 1 | 0.9% |
| Federal Government Employees | 4 | 3.7% |
| Unpaid Family Workers | 0 | 0.0% |
| Total | 108 | 100.0% |
Employment Status by Age in Luray
According to the labor force statistics for Luray, out of the total population over 16 years of age (170), 70.0% or 119 individuals are in the labor force, with 9.6% or 11 of them unemployed. The age group with the highest labor force participation rate is 20 to 24 years, with 100.0% or 29 individuals in the labor force. Within the labor force, the 35 to 44 years age range has the highest percentage of unemployed individuals, with 15.8% or 3 of them being unemployed.
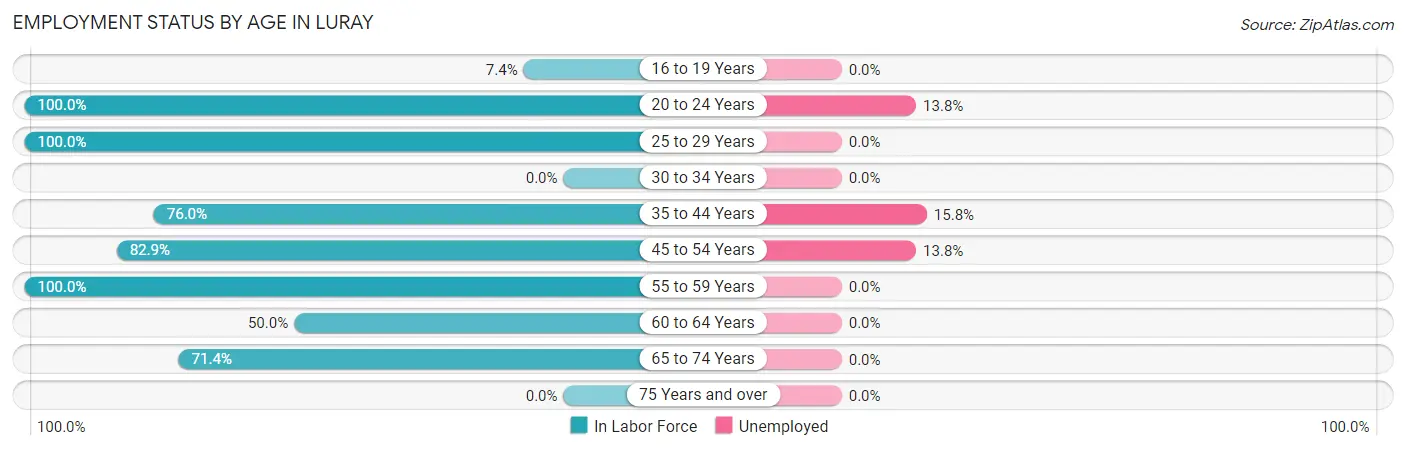
| Age Bracket | In Labor Force | Unemployed |
| 16 to 19 Years | 2 (7.4%) | 0 (0.0%) |
| 20 to 24 Years | 29 (100.0%) | 4 (13.8%) |
| 25 to 29 Years | 28 (100.0%) | 0 (0.0%) |
| 30 to 34 Years | 0 (0.0%) | 0 (0.0%) |
| 35 to 44 Years | 19 (76.0%) | 3 (15.8%) |
| 45 to 54 Years | 29 (82.9%) | 4 (13.8%) |
| 55 to 59 Years | 1 (100.0%) | 0 (0.0%) |
| 60 to 64 Years | 1 (50.0%) | 0 (0.0%) |
| 65 to 74 Years | 10 (71.4%) | 0 (0.0%) |
| 75 Years and over | 0 (0.0%) | 0 (0.0%) |
| Total | 119 (70.0%) | 11 (9.6%) |
Employment Status by Educational Attainment in Luray
According to labor force statistics for Luray, 85.7% of individuals (78) out of the total population between 25 and 64 years of age (91) are in the labor force, with 9.5% or 7 of them being unemployed. The group with the highest labor force participation rate are those with the educational attainment of high school diploma, with 100.0% or 60 individuals in the labor force. Within the labor force, individuals with college / associate degree education have the highest percentage of unemployment, with 100.0% or 3 of them being unemployed.
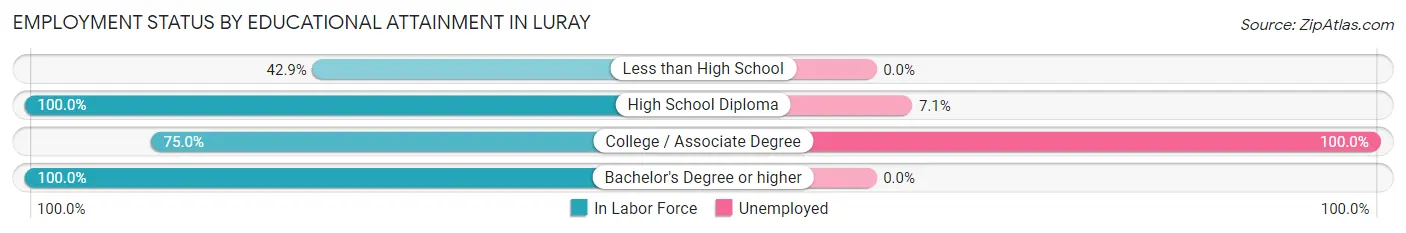
| Educational Attainment | In Labor Force | Unemployed |
| Less than High School | 9 (42.9%) | 0 (0.0%) |
| High School Diploma | 60 (100.0%) | 4 (7.1%) |
| College / Associate Degree | 3 (75.0%) | 4 (100.0%) |
| Bachelor's Degree or higher | 6 (100.0%) | 0 (0.0%) |
| Total | 78 (85.7%) | 9 (9.5%) |
Employment Occupations by Sex in Luray
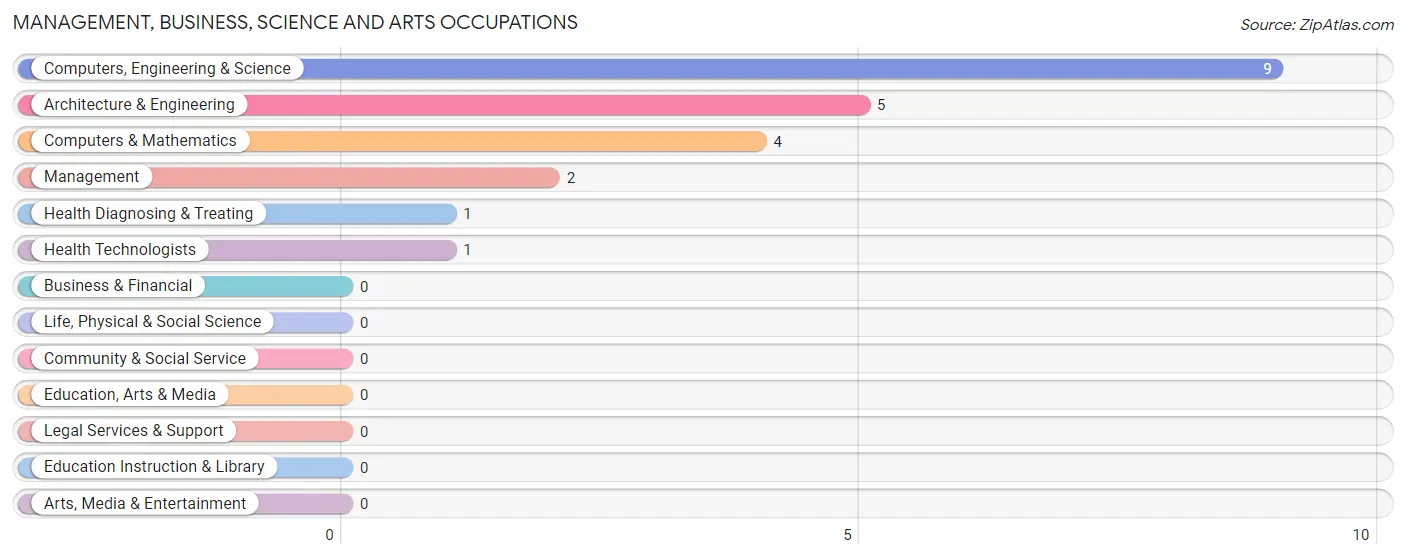
Management, Business, Science and Arts Occupations
The most common Management, Business, Science and Arts occupations in Luray are Computers, Engineering & Science (9 | 8.6%), Architecture & Engineering (5 | 4.8%), Computers & Mathematics (4 | 3.8%), Management (2 | 1.9%), and Health Diagnosing & Treating (1 | 1.0%).
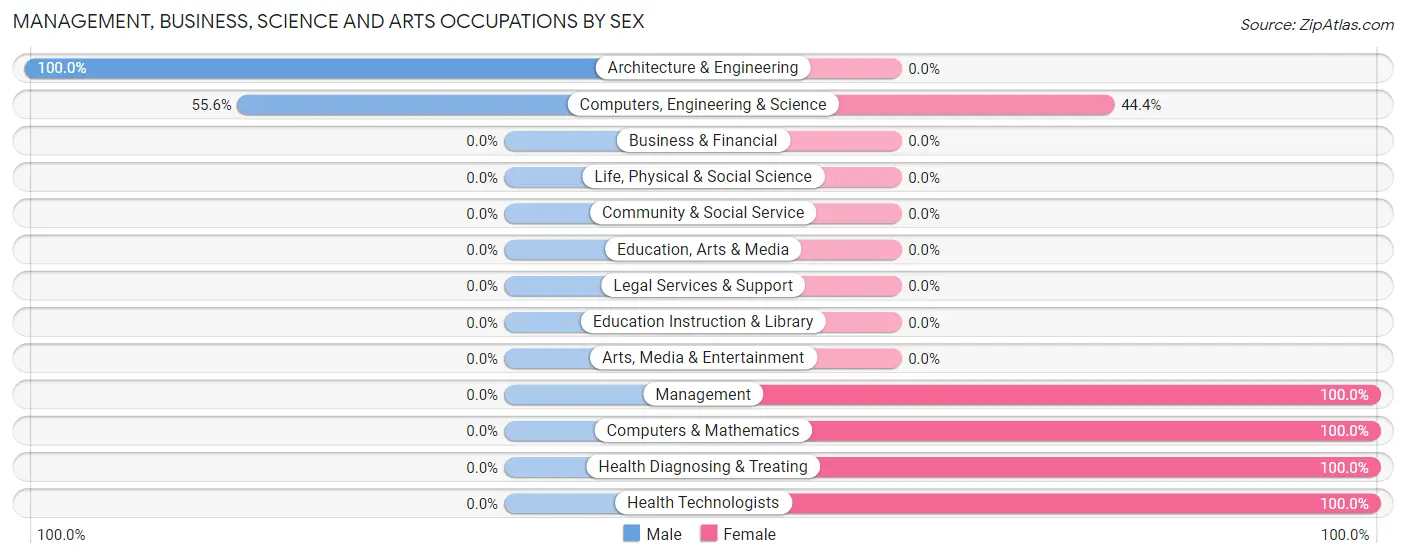
Management, Business, Science and Arts Occupations by Sex
Within the Management, Business, Science and Arts occupations in Luray, the most male-oriented occupations are Architecture & Engineering (100.0%), and Computers, Engineering & Science (55.6%), while the most female-oriented occupations are Management (100.0%), Computers & Mathematics (100.0%), and Health Diagnosing & Treating (100.0%).
| Occupation | Male | Female |
| Management | 0 (0.0%) | 2 (100.0%) |
| Business & Financial | 0 (0.0%) | 0 (0.0%) |
| Computers, Engineering & Science | 5 (55.6%) | 4 (44.4%) |
| Computers & Mathematics | 0 (0.0%) | 4 (100.0%) |
| Architecture & Engineering | 5 (100.0%) | 0 (0.0%) |
| Life, Physical & Social Science | 0 (0.0%) | 0 (0.0%) |
| Community & Social Service | 0 (0.0%) | 0 (0.0%) |
| Education, Arts & Media | 0 (0.0%) | 0 (0.0%) |
| Legal Services & Support | 0 (0.0%) | 0 (0.0%) |
| Education Instruction & Library | 0 (0.0%) | 0 (0.0%) |
| Arts, Media & Entertainment | 0 (0.0%) | 0 (0.0%) |
| Health Diagnosing & Treating | 0 (0.0%) | 1 (100.0%) |
| Health Technologists | 0 (0.0%) | 1 (100.0%) |
| Total (Category) | 5 (41.7%) | 7 (58.3%) |
| Total (Overall) | 89 (85.6%) | 15 (14.4%) |
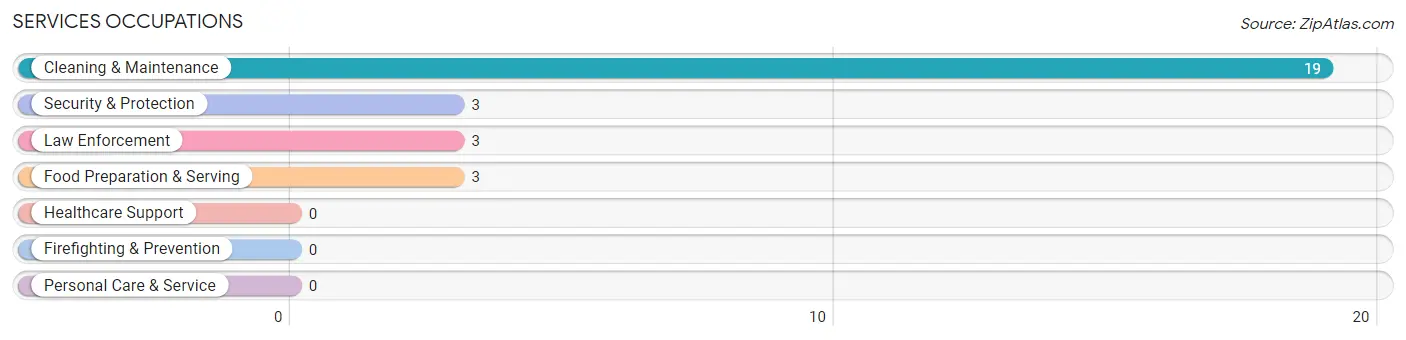
Services Occupations
The most common Services occupations in Luray are Cleaning & Maintenance (19 | 18.3%), Security & Protection (3 | 2.9%), Law Enforcement (3 | 2.9%), and Food Preparation & Serving (3 | 2.9%).
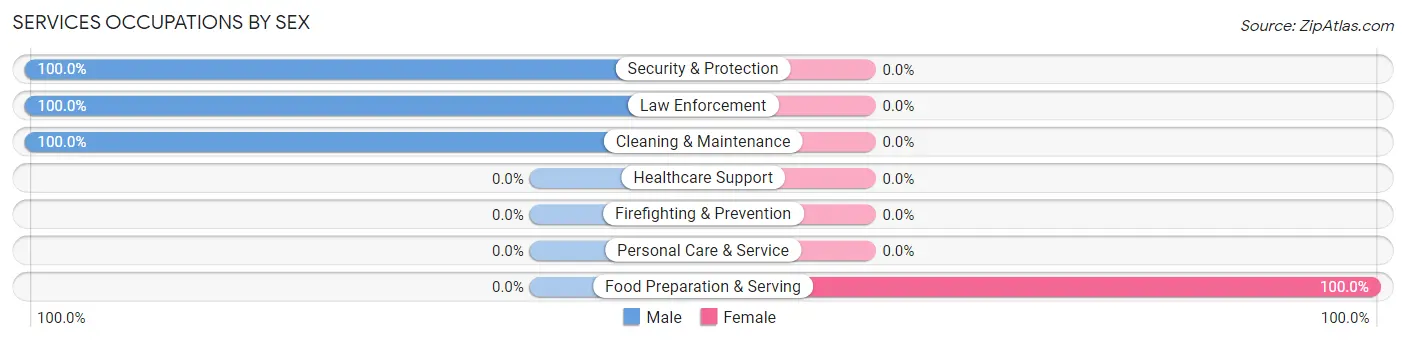
Services Occupations by Sex
| Occupation | Male | Female |
| Healthcare Support | 0 (0.0%) | 0 (0.0%) |
| Security & Protection | 3 (100.0%) | 0 (0.0%) |
| Firefighting & Prevention | 0 (0.0%) | 0 (0.0%) |
| Law Enforcement | 3 (100.0%) | 0 (0.0%) |
| Food Preparation & Serving | 0 (0.0%) | 3 (100.0%) |
| Cleaning & Maintenance | 19 (100.0%) | 0 (0.0%) |
| Personal Care & Service | 0 (0.0%) | 0 (0.0%) |
| Total (Category) | 22 (88.0%) | 3 (12.0%) |
| Total (Overall) | 89 (85.6%) | 15 (14.4%) |
Sales and Office Occupations
The most common Sales and Office occupations in Luray are , and Office & Administration (7 | 6.7%).
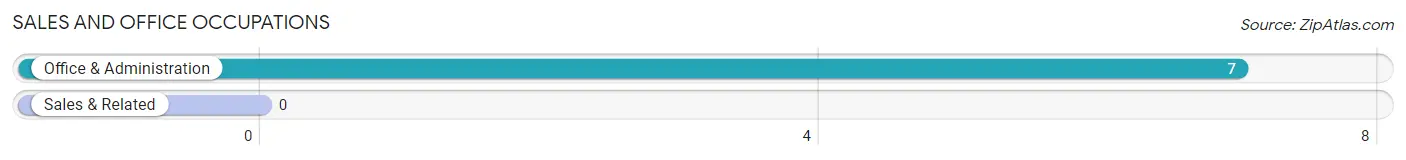
Sales and Office Occupations by Sex
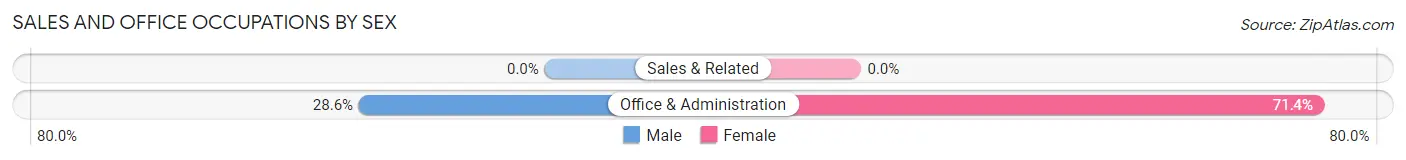
| Occupation | Male | Female |
| Sales & Related | 0 (0.0%) | 0 (0.0%) |
| Office & Administration | 2 (28.6%) | 5 (71.4%) |
| Total (Category) | 2 (28.6%) | 5 (71.4%) |
| Total (Overall) | 89 (85.6%) | 15 (14.4%) |
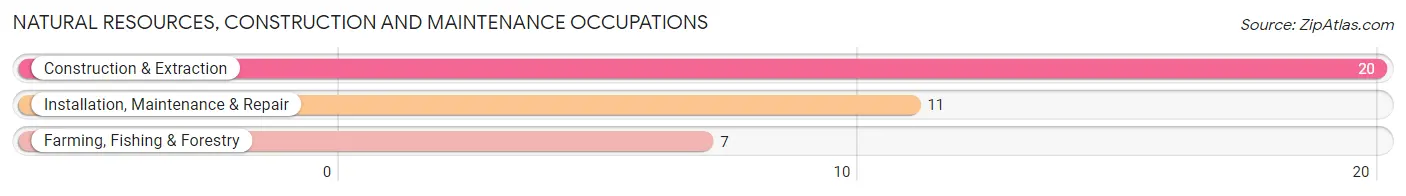
Natural Resources, Construction and Maintenance Occupations
The most common Natural Resources, Construction and Maintenance occupations in Luray are Construction & Extraction (20 | 19.2%), Installation, Maintenance & Repair (11 | 10.6%), and Farming, Fishing & Forestry (7 | 6.7%).
Natural Resources, Construction and Maintenance Occupations by Sex
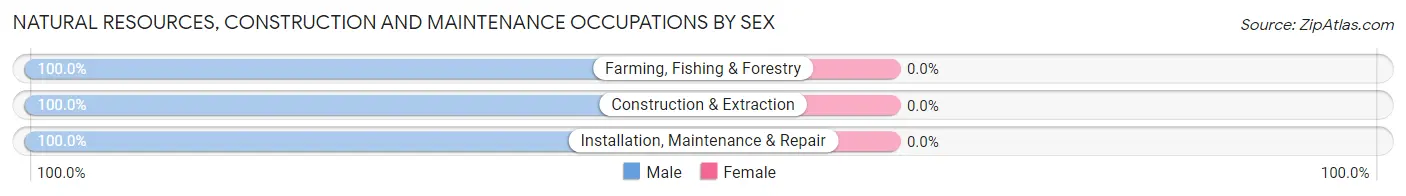
| Occupation | Male | Female |
| Farming, Fishing & Forestry | 7 (100.0%) | 0 (0.0%) |
| Construction & Extraction | 20 (100.0%) | 0 (0.0%) |
| Installation, Maintenance & Repair | 11 (100.0%) | 0 (0.0%) |
| Total (Category) | 38 (100.0%) | 0 (0.0%) |
| Total (Overall) | 89 (85.6%) | 15 (14.4%) |
Production, Transportation and Moving Occupations
The most common Production, Transportation and Moving occupations in Luray are Production (13 | 12.5%), and Material Moving (9 | 8.6%).
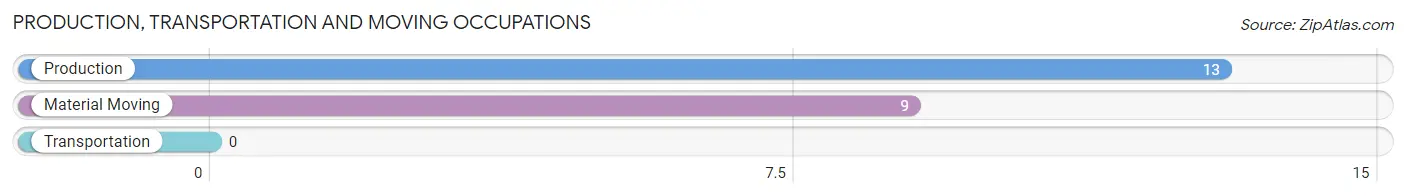
Production, Transportation and Moving Occupations by Sex
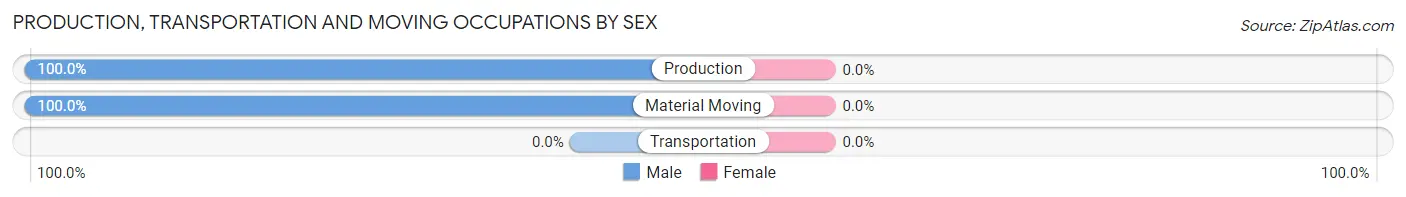
| Occupation | Male | Female |
| Production | 13 (100.0%) | 0 (0.0%) |
| Transportation | 0 (0.0%) | 0 (0.0%) |
| Material Moving | 9 (100.0%) | 0 (0.0%) |
| Total (Category) | 22 (100.0%) | 0 (0.0%) |
| Total (Overall) | 89 (85.6%) | 15 (14.4%) |
Employment Industries by Sex in Luray
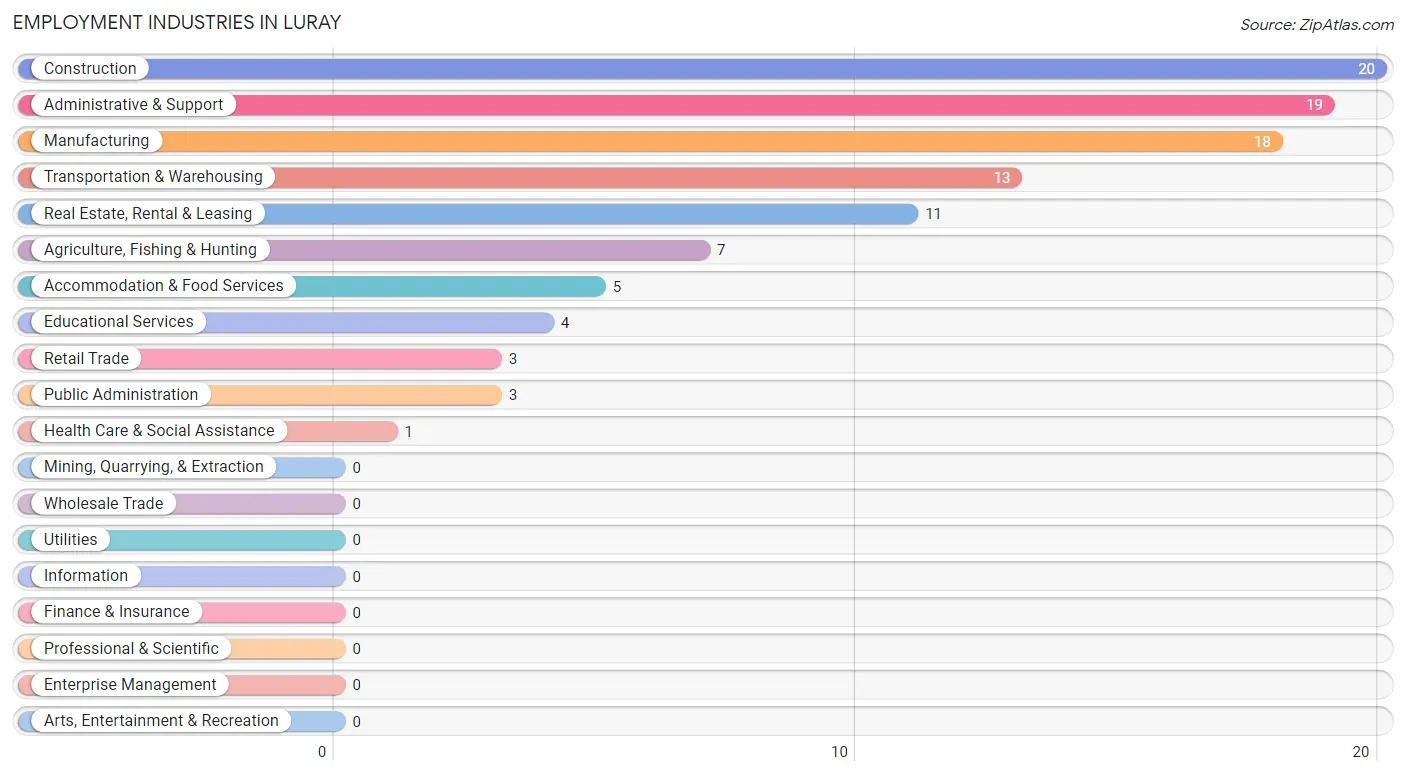
Employment Industries in Luray
The major employment industries in Luray include Construction (20 | 19.2%), Administrative & Support (19 | 18.3%), Manufacturing (18 | 17.3%), Transportation & Warehousing (13 | 12.5%), and Real Estate, Rental & Leasing (11 | 10.6%).
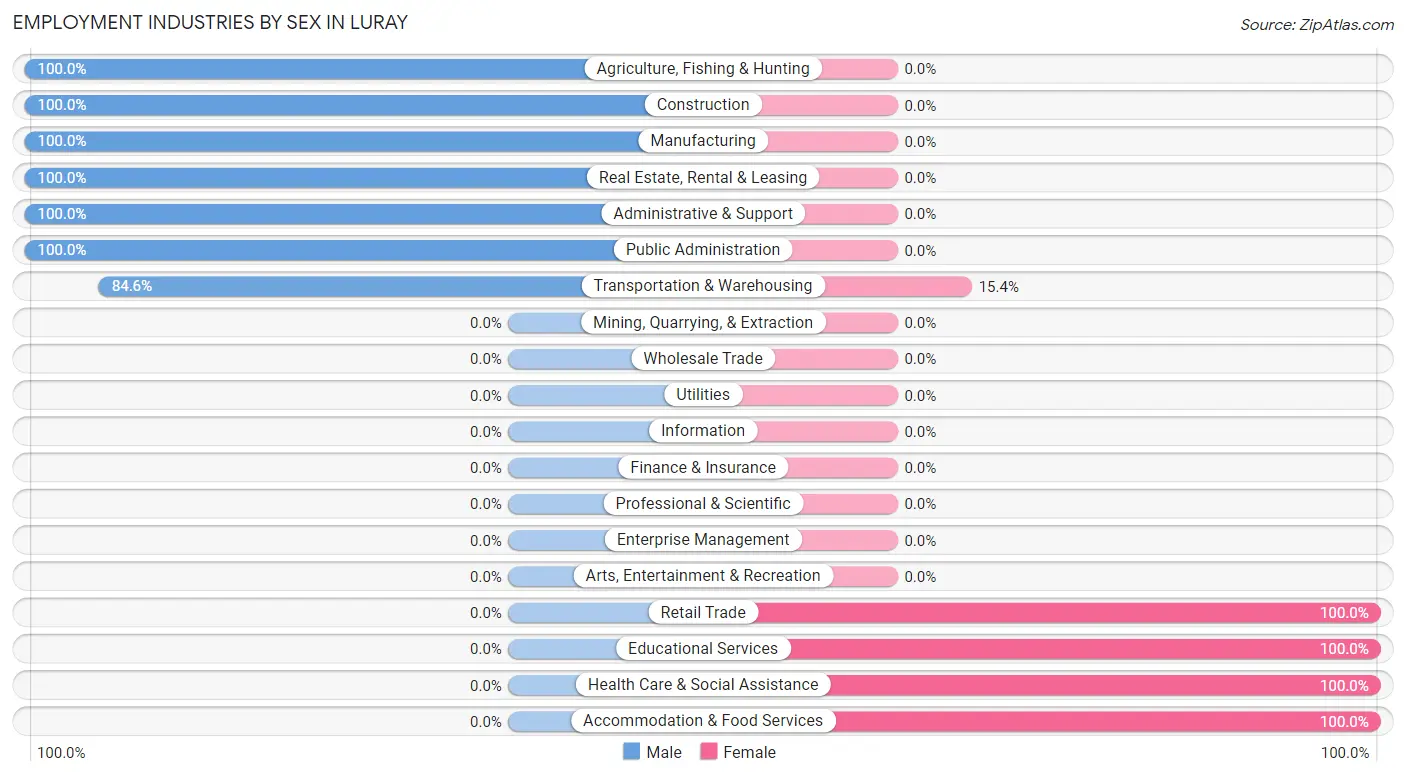
Employment Industries by Sex in Luray
The Luray industries that see more men than women are Agriculture, Fishing & Hunting (100.0%), Construction (100.0%), and Manufacturing (100.0%), whereas the industries that tend to have a higher number of women are Retail Trade (100.0%), Educational Services (100.0%), and Health Care & Social Assistance (100.0%).
| Industry | Male | Female |
| Agriculture, Fishing & Hunting | 7 (100.0%) | 0 (0.0%) |
| Mining, Quarrying, & Extraction | 0 (0.0%) | 0 (0.0%) |
| Construction | 20 (100.0%) | 0 (0.0%) |
| Manufacturing | 18 (100.0%) | 0 (0.0%) |
| Wholesale Trade | 0 (0.0%) | 0 (0.0%) |
| Retail Trade | 0 (0.0%) | 3 (100.0%) |
| Transportation & Warehousing | 11 (84.6%) | 2 (15.4%) |
| Utilities | 0 (0.0%) | 0 (0.0%) |
| Information | 0 (0.0%) | 0 (0.0%) |
| Finance & Insurance | 0 (0.0%) | 0 (0.0%) |
| Real Estate, Rental & Leasing | 11 (100.0%) | 0 (0.0%) |
| Professional & Scientific | 0 (0.0%) | 0 (0.0%) |
| Enterprise Management | 0 (0.0%) | 0 (0.0%) |
| Administrative & Support | 19 (100.0%) | 0 (0.0%) |
| Educational Services | 0 (0.0%) | 4 (100.0%) |
| Health Care & Social Assistance | 0 (0.0%) | 1 (100.0%) |
| Arts, Entertainment & Recreation | 0 (0.0%) | 0 (0.0%) |
| Accommodation & Food Services | 0 (0.0%) | 5 (100.0%) |
| Public Administration | 3 (100.0%) | 0 (0.0%) |
| Total | 89 (85.6%) | 15 (14.4%) |
Education in Luray
School Enrollment in Luray
The most common levels of schooling among the 33 students in Luray are high school (31 | 93.9%), and college / undergraduate (2 | 6.1%).
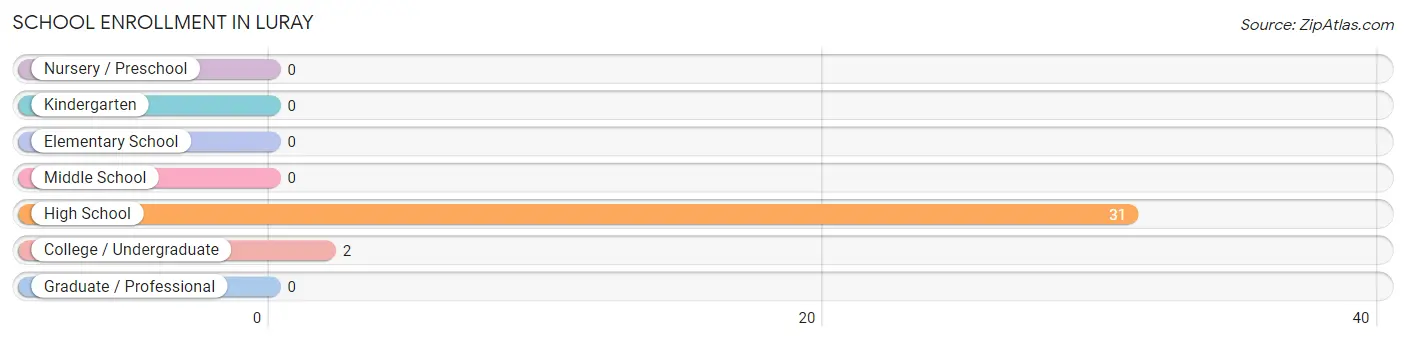
| School Level | # Students | % Students |
| Nursery / Preschool | 0 | 0.0% |
| Kindergarten | 0 | 0.0% |
| Elementary School | 0 | 0.0% |
| Middle School | 0 | 0.0% |
| High School | 31 | 93.9% |
| College / Undergraduate | 2 | 6.1% |
| Graduate / Professional | 0 | 0.0% |
| Total | 33 | 100.0% |
School Enrollment by Age by Funding Source in Luray
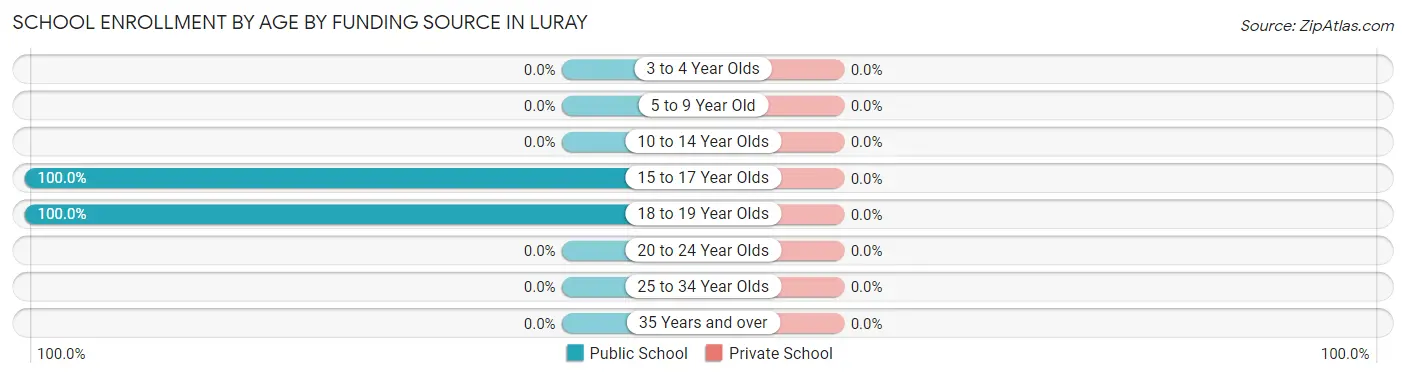
| Age Bracket | Public School | Private School |
| 3 to 4 Year Olds | 0 (0.0%) | 0 (0.0%) |
| 5 to 9 Year Old | 0 (0.0%) | 0 (0.0%) |
| 10 to 14 Year Olds | 0 (0.0%) | 0 (0.0%) |
| 15 to 17 Year Olds | 11 (100.0%) | 0 (0.0%) |
| 18 to 19 Year Olds | 22 (100.0%) | 0 (0.0%) |
| 20 to 24 Year Olds | 0 (0.0%) | 0 (0.0%) |
| 25 to 34 Year Olds | 0 (0.0%) | 0 (0.0%) |
| 35 Years and over | 0 (0.0%) | 0 (0.0%) |
| Total | 33 (100.0%) | 0 (0.0%) |
Educational Attainment by Field of Study in Luray
Business (5 | 83.3%), and science & technology (1 | 16.7%) are the most common fields of study among 6 individuals in Luray who have obtained a bachelor's degree or higher.
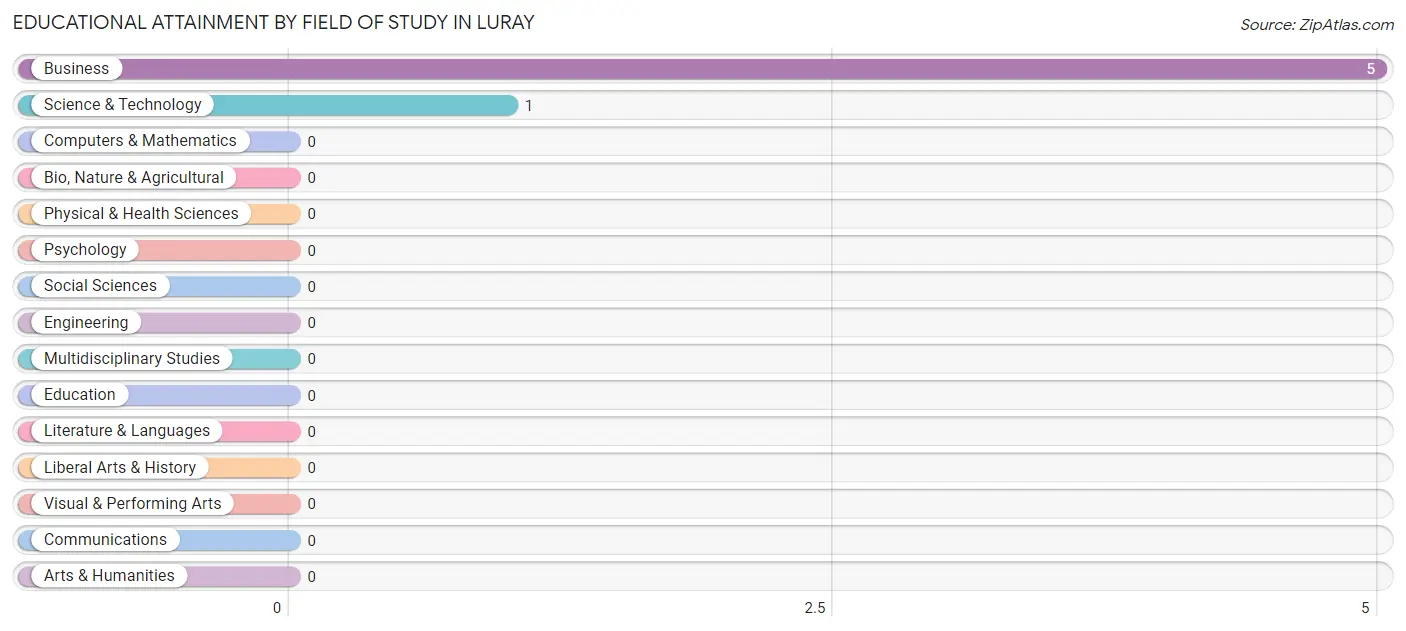
| Field of Study | # Graduates | % Graduates |
| Computers & Mathematics | 0 | 0.0% |
| Bio, Nature & Agricultural | 0 | 0.0% |
| Physical & Health Sciences | 0 | 0.0% |
| Psychology | 0 | 0.0% |
| Social Sciences | 0 | 0.0% |
| Engineering | 0 | 0.0% |
| Multidisciplinary Studies | 0 | 0.0% |
| Science & Technology | 1 | 16.7% |
| Business | 5 | 83.3% |
| Education | 0 | 0.0% |
| Literature & Languages | 0 | 0.0% |
| Liberal Arts & History | 0 | 0.0% |
| Visual & Performing Arts | 0 | 0.0% |
| Communications | 0 | 0.0% |
| Arts & Humanities | 0 | 0.0% |
| Total | 6 | 100.0% |
Transportation & Commute in Luray
Vehicle Availability by Sex in Luray
The most prevalent vehicle ownership categories in Luray are males with 4 vehicles (40, accounting for 43.0%) and females with 4 vehicles (6, making up 266.7%).
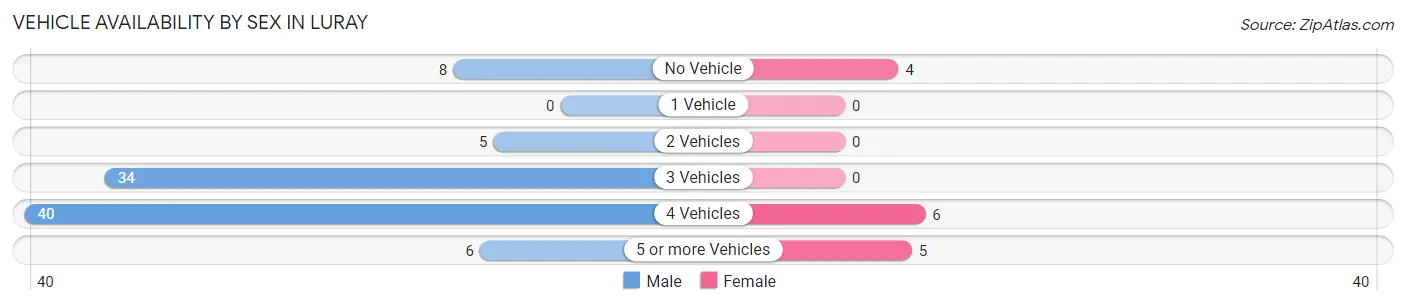
| Vehicles Available | Male | Female |
| No Vehicle | 8 (8.6%) | 4 (26.7%) |
| 1 Vehicle | 0 (0.0%) | 0 (0.0%) |
| 2 Vehicles | 5 (5.4%) | 0 (0.0%) |
| 3 Vehicles | 34 (36.6%) | 0 (0.0%) |
| 4 Vehicles | 40 (43.0%) | 6 (40.0%) |
| 5 or more Vehicles | 6 (6.5%) | 5 (33.3%) |
| Total | 93 (100.0%) | 15 (100.0%) |
Commute Time in Luray
The most frequently occuring commute durations in Luray are 60 to 89 minutes (38 commuters, 35.2%), 5 to 9 minutes (21 commuters, 19.4%), and 90 or more minutes (19 commuters, 17.6%).
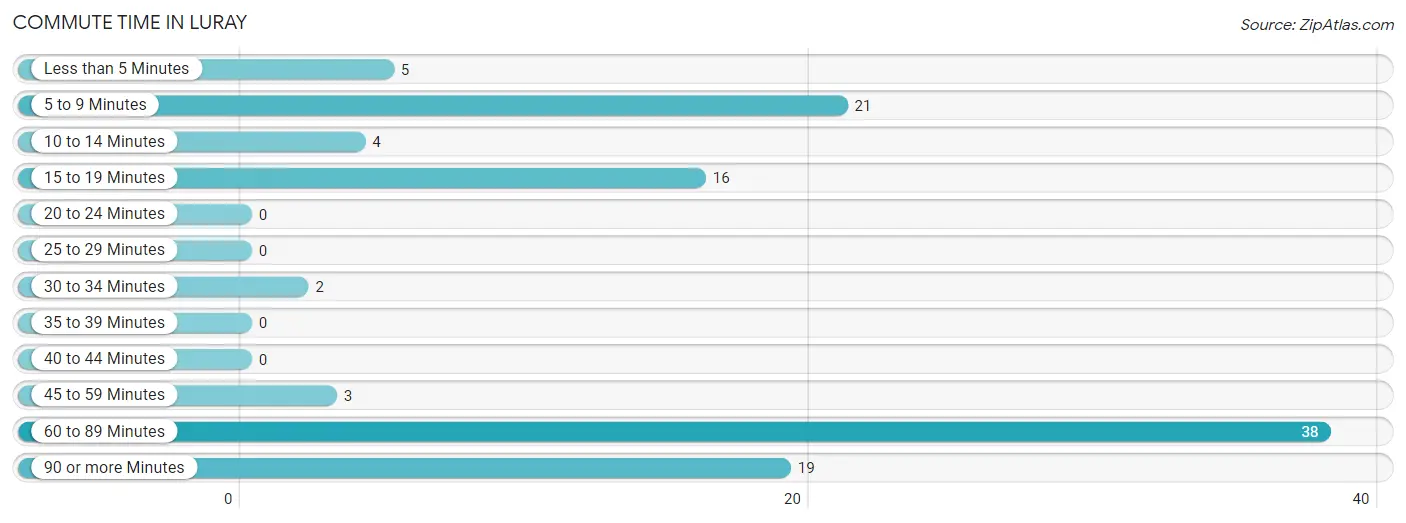
| Commute Time | # Commuters | % Commuters |
| Less than 5 Minutes | 5 | 4.6% |
| 5 to 9 Minutes | 21 | 19.4% |
| 10 to 14 Minutes | 4 | 3.7% |
| 15 to 19 Minutes | 16 | 14.8% |
| 20 to 24 Minutes | 0 | 0.0% |
| 25 to 29 Minutes | 0 | 0.0% |
| 30 to 34 Minutes | 2 | 1.8% |
| 35 to 39 Minutes | 0 | 0.0% |
| 40 to 44 Minutes | 0 | 0.0% |
| 45 to 59 Minutes | 3 | 2.8% |
| 60 to 89 Minutes | 38 | 35.2% |
| 90 or more Minutes | 19 | 17.6% |
Commute Time by Sex in Luray
The most common commute times in Luray are 60 to 89 minutes (38 commuters, 40.9%) for males and 5 to 9 minutes (9 commuters, 60.0%) for females.
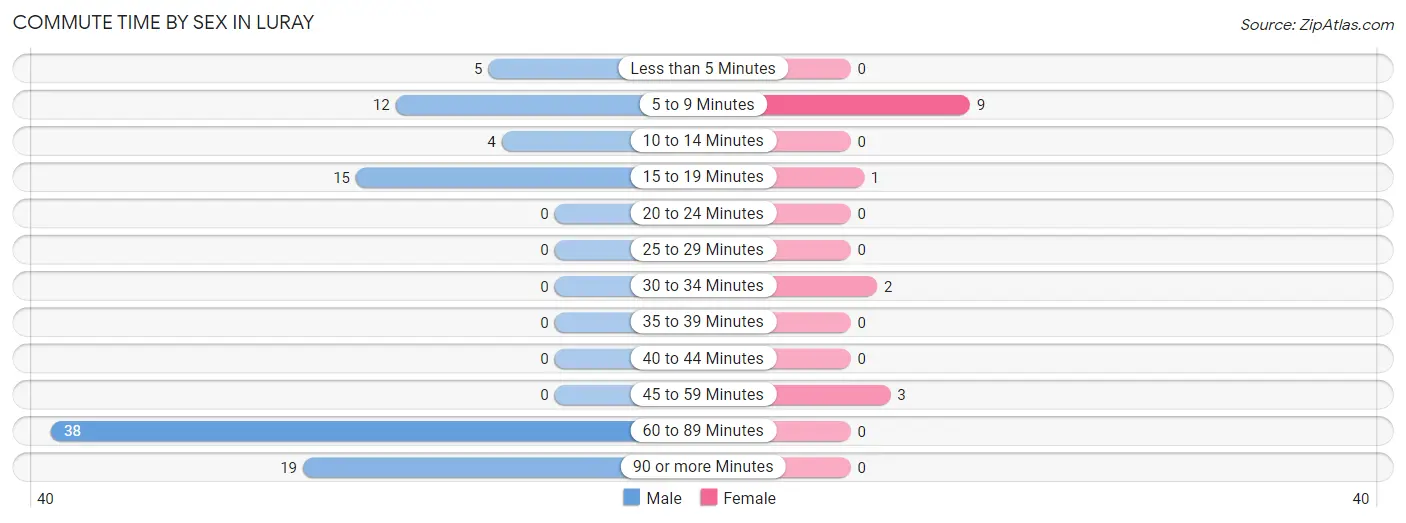
| Commute Time | Male | Female |
| Less than 5 Minutes | 5 (5.4%) | 0 (0.0%) |
| 5 to 9 Minutes | 12 (12.9%) | 9 (60.0%) |
| 10 to 14 Minutes | 4 (4.3%) | 0 (0.0%) |
| 15 to 19 Minutes | 15 (16.1%) | 1 (6.7%) |
| 20 to 24 Minutes | 0 (0.0%) | 0 (0.0%) |
| 25 to 29 Minutes | 0 (0.0%) | 0 (0.0%) |
| 30 to 34 Minutes | 0 (0.0%) | 2 (13.3%) |
| 35 to 39 Minutes | 0 (0.0%) | 0 (0.0%) |
| 40 to 44 Minutes | 0 (0.0%) | 0 (0.0%) |
| 45 to 59 Minutes | 0 (0.0%) | 3 (20.0%) |
| 60 to 89 Minutes | 38 (40.9%) | 0 (0.0%) |
| 90 or more Minutes | 19 (20.4%) | 0 (0.0%) |
Time of Departure to Work by Sex in Luray
The most frequent times of departure to work in Luray are 6:00 AM to 6:29 AM (37, 39.8%) for males and 4:00 PM to 11:59 PM (4, 26.7%) for females.
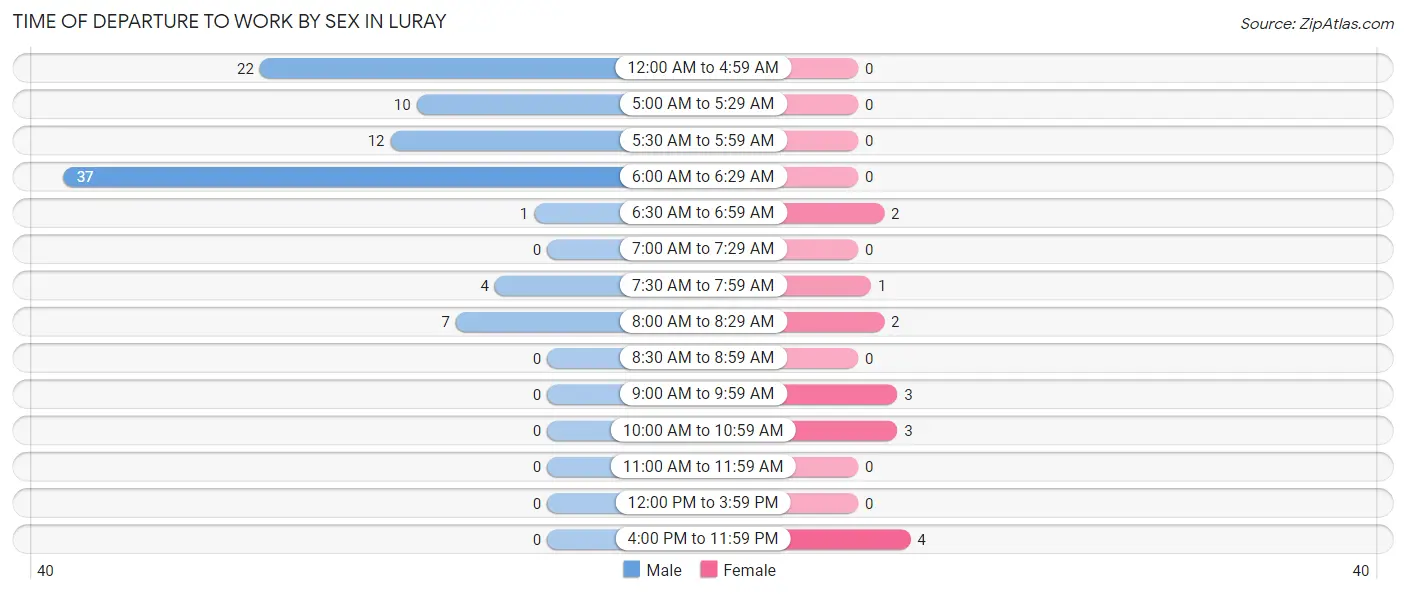
| Time of Departure | Male | Female |
| 12:00 AM to 4:59 AM | 22 (23.7%) | 0 (0.0%) |
| 5:00 AM to 5:29 AM | 10 (10.7%) | 0 (0.0%) |
| 5:30 AM to 5:59 AM | 12 (12.9%) | 0 (0.0%) |
| 6:00 AM to 6:29 AM | 37 (39.8%) | 0 (0.0%) |
| 6:30 AM to 6:59 AM | 1 (1.1%) | 2 (13.3%) |
| 7:00 AM to 7:29 AM | 0 (0.0%) | 0 (0.0%) |
| 7:30 AM to 7:59 AM | 4 (4.3%) | 1 (6.7%) |
| 8:00 AM to 8:29 AM | 7 (7.5%) | 2 (13.3%) |
| 8:30 AM to 8:59 AM | 0 (0.0%) | 0 (0.0%) |
| 9:00 AM to 9:59 AM | 0 (0.0%) | 3 (20.0%) |
| 10:00 AM to 10:59 AM | 0 (0.0%) | 3 (20.0%) |
| 11:00 AM to 11:59 AM | 0 (0.0%) | 0 (0.0%) |
| 12:00 PM to 3:59 PM | 0 (0.0%) | 0 (0.0%) |
| 4:00 PM to 11:59 PM | 0 (0.0%) | 4 (26.7%) |
| Total | 93 (100.0%) | 15 (100.0%) |
Housing Occupancy in Luray
Occupancy by Ownership in Luray
Of the total 55 dwellings in Luray, owner-occupied units account for 34 (61.8%), while renter-occupied units make up 21 (38.2%).
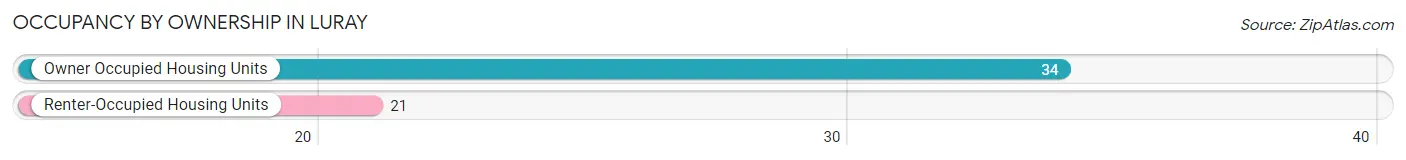
| Occupancy | # Housing Units | % Housing Units |
| Owner Occupied Housing Units | 34 | 61.8% |
| Renter-Occupied Housing Units | 21 | 38.2% |
| Total Occupied Housing Units | 55 | 100.0% |
Occupancy by Household Size in Luray
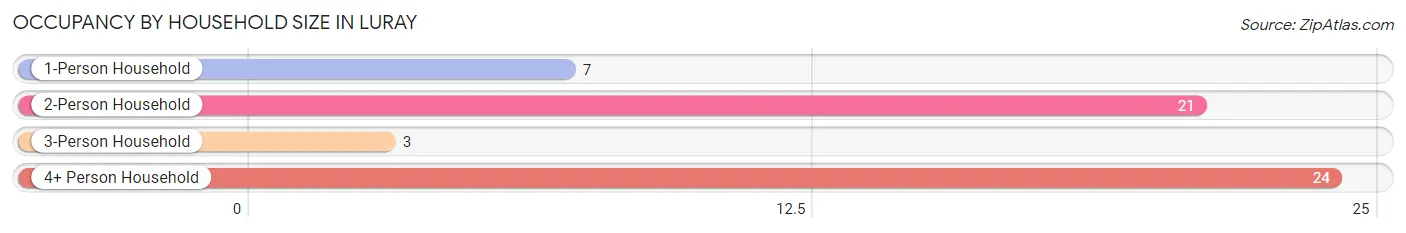
| Household Size | # Housing Units | % Housing Units |
| 1-Person Household | 7 | 12.7% |
| 2-Person Household | 21 | 38.2% |
| 3-Person Household | 3 | 5.4% |
| 4+ Person Household | 24 | 43.6% |
| Total Housing Units | 55 | 100.0% |
Occupancy by Ownership by Household Size in Luray
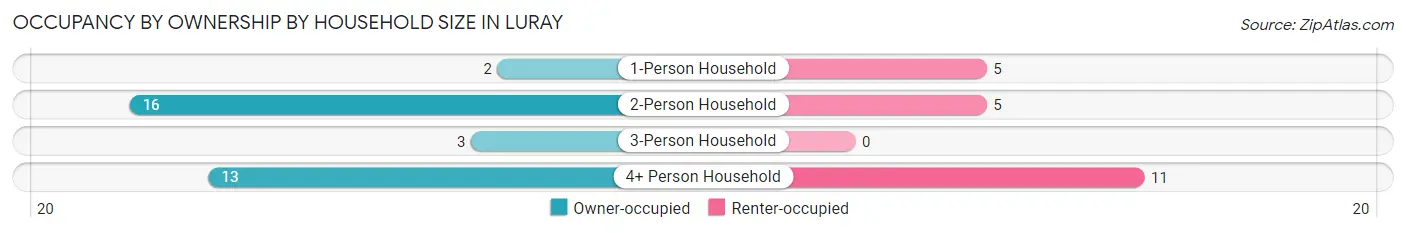
| Household Size | Owner-occupied | Renter-occupied |
| 1-Person Household | 2 (28.6%) | 5 (71.4%) |
| 2-Person Household | 16 (76.2%) | 5 (23.8%) |
| 3-Person Household | 3 (100.0%) | 0 (0.0%) |
| 4+ Person Household | 13 (54.2%) | 11 (45.8%) |
| Total Housing Units | 34 (61.8%) | 21 (38.2%) |
Occupancy by Educational Attainment in Luray

| Household Size | Owner-occupied | Renter-occupied |
| Less than High School | 8 (100.0%) | 0 (0.0%) |
| High School Diploma | 21 (51.2%) | 20 (48.8%) |
| College/Associate Degree | 4 (80.0%) | 1 (20.0%) |
| Bachelor's Degree or higher | 1 (100.0%) | 0 (0.0%) |
Occupancy by Age of Householder in Luray
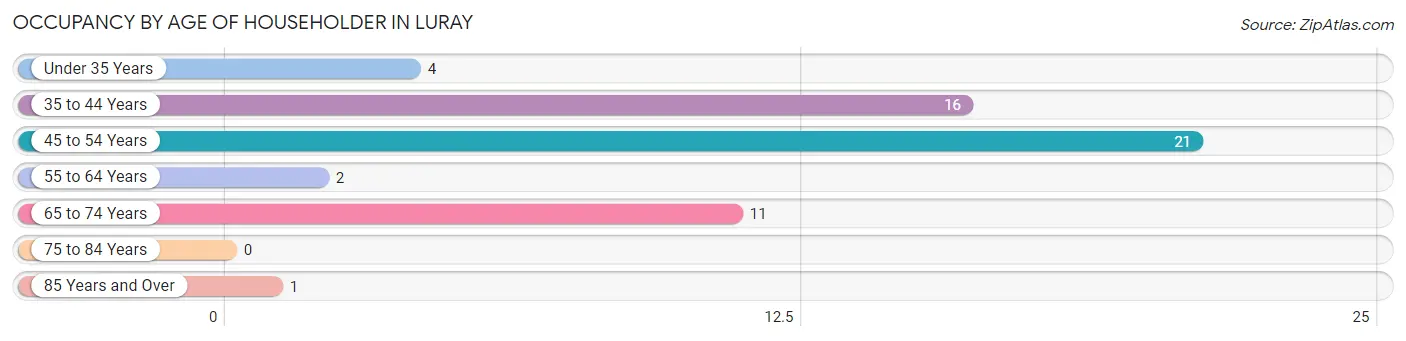
| Age Bracket | # Households | % Households |
| Under 35 Years | 4 | 7.3% |
| 35 to 44 Years | 16 | 29.1% |
| 45 to 54 Years | 21 | 38.2% |
| 55 to 64 Years | 2 | 3.6% |
| 65 to 74 Years | 11 | 20.0% |
| 75 to 84 Years | 0 | 0.0% |
| 85 Years and Over | 1 | 1.8% |
| Total | 55 | 100.0% |
Housing Finances in Luray
Median Income by Occupancy in Luray
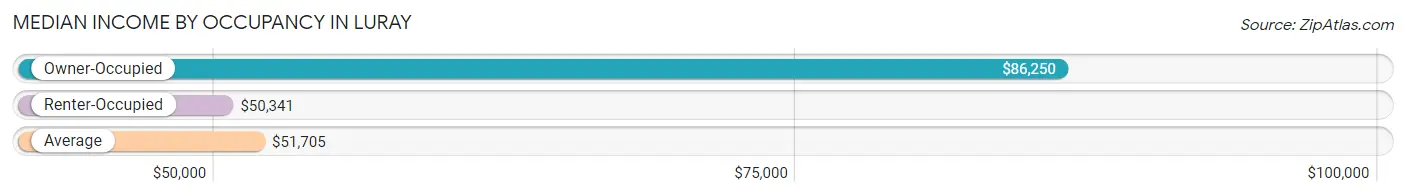
| Occupancy Type | # Households | Median Income |
| Owner-Occupied | 34 (61.8%) | $86,250 |
| Renter-Occupied | 21 (38.2%) | $50,341 |
| Average | 55 (100.0%) | $51,705 |
Occupancy by Householder Income Bracket in Luray
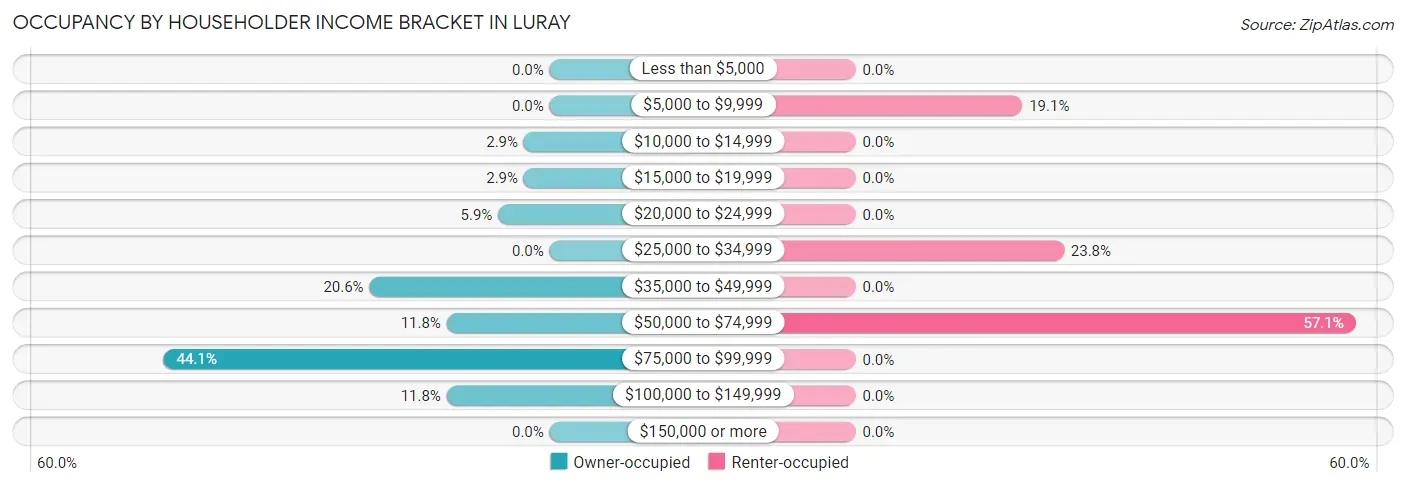
| Income Bracket | Owner-occupied | Renter-occupied |
| Less than $5,000 | 0 (0.0%) | 0 (0.0%) |
| $5,000 to $9,999 | 0 (0.0%) | 4 (19.1%) |
| $10,000 to $14,999 | 1 (2.9%) | 0 (0.0%) |
| $15,000 to $19,999 | 1 (2.9%) | 0 (0.0%) |
| $20,000 to $24,999 | 2 (5.9%) | 0 (0.0%) |
| $25,000 to $34,999 | 0 (0.0%) | 5 (23.8%) |
| $35,000 to $49,999 | 7 (20.6%) | 0 (0.0%) |
| $50,000 to $74,999 | 4 (11.8%) | 12 (57.1%) |
| $75,000 to $99,999 | 15 (44.1%) | 0 (0.0%) |
| $100,000 to $149,999 | 4 (11.8%) | 0 (0.0%) |
| $150,000 or more | 0 (0.0%) | 0 (0.0%) |
| Total | 34 (100.0%) | 21 (100.0%) |
Monthly Housing Cost Tiers in Luray
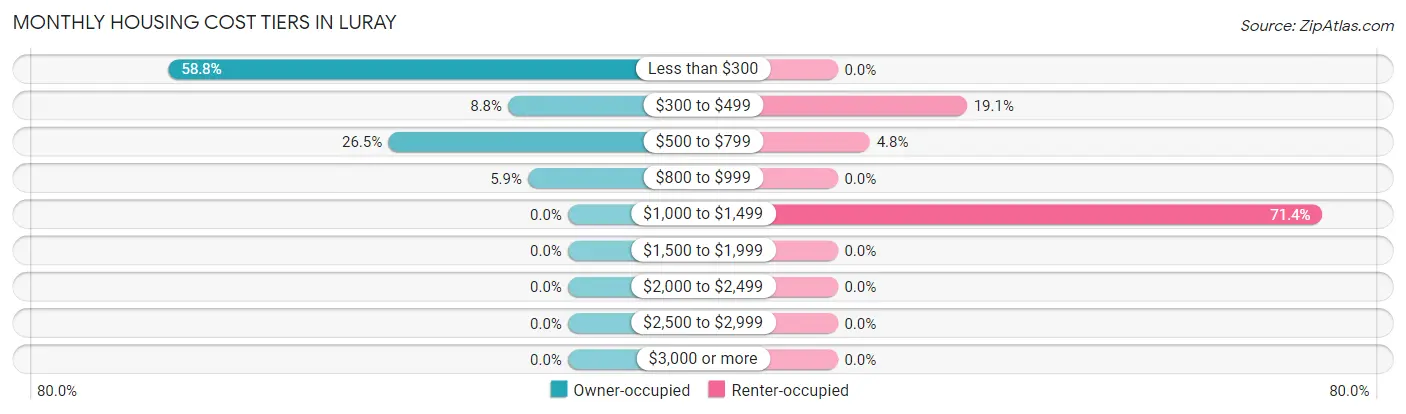
| Monthly Cost | Owner-occupied | Renter-occupied |
| Less than $300 | 20 (58.8%) | 0 (0.0%) |
| $300 to $499 | 3 (8.8%) | 4 (19.1%) |
| $500 to $799 | 9 (26.5%) | 1 (4.8%) |
| $800 to $999 | 2 (5.9%) | 0 (0.0%) |
| $1,000 to $1,499 | 0 (0.0%) | 15 (71.4%) |
| $1,500 to $1,999 | 0 (0.0%) | 0 (0.0%) |
| $2,000 to $2,499 | 0 (0.0%) | 0 (0.0%) |
| $2,500 to $2,999 | 0 (0.0%) | 0 (0.0%) |
| $3,000 or more | 0 (0.0%) | 0 (0.0%) |
| Total | 34 (100.0%) | 21 (100.0%) |
Physical Housing Characteristics in Luray
Housing Structures in Luray
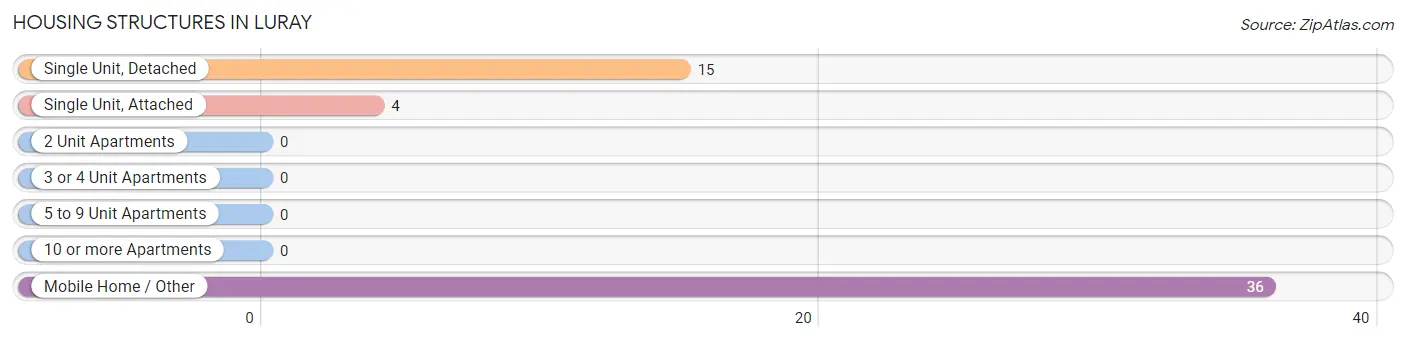
| Structure Type | # Housing Units | % Housing Units |
| Single Unit, Detached | 15 | 27.3% |
| Single Unit, Attached | 4 | 7.3% |
| 2 Unit Apartments | 0 | 0.0% |
| 3 or 4 Unit Apartments | 0 | 0.0% |
| 5 to 9 Unit Apartments | 0 | 0.0% |
| 10 or more Apartments | 0 | 0.0% |
| Mobile Home / Other | 36 | 65.4% |
| Total | 55 | 100.0% |
Housing Structures by Occupancy in Luray
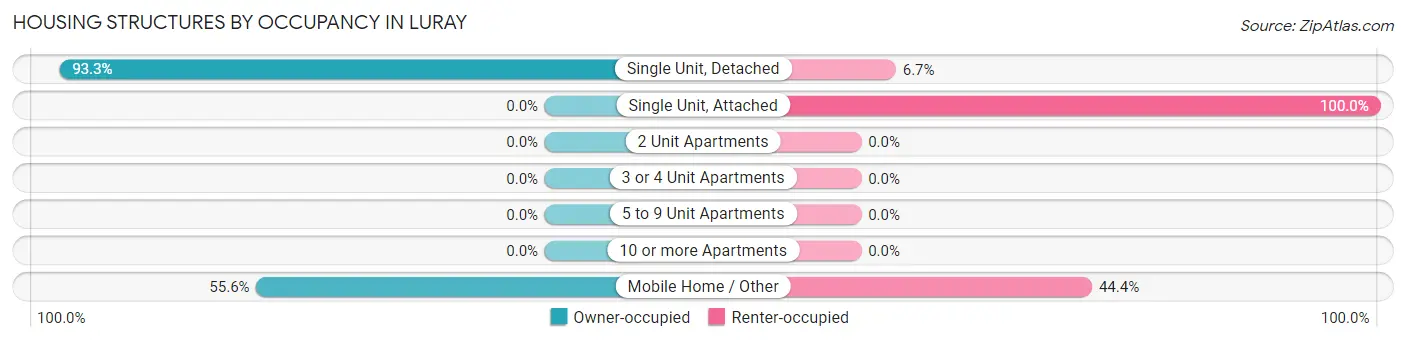
| Structure Type | Owner-occupied | Renter-occupied |
| Single Unit, Detached | 14 (93.3%) | 1 (6.7%) |
| Single Unit, Attached | 0 (0.0%) | 4 (100.0%) |
| 2 Unit Apartments | 0 (0.0%) | 0 (0.0%) |
| 3 or 4 Unit Apartments | 0 (0.0%) | 0 (0.0%) |
| 5 to 9 Unit Apartments | 0 (0.0%) | 0 (0.0%) |
| 10 or more Apartments | 0 (0.0%) | 0 (0.0%) |
| Mobile Home / Other | 20 (55.6%) | 16 (44.4%) |
| Total | 34 (61.8%) | 21 (38.2%) |
Housing Structures by Number of Rooms in Luray
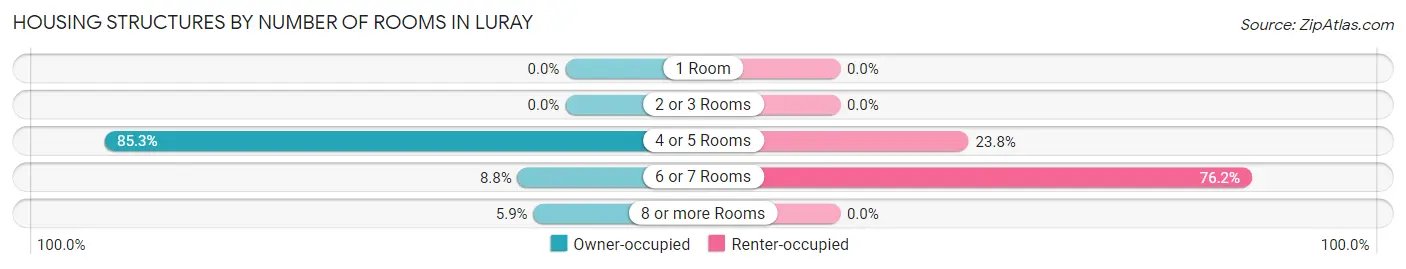
| Number of Rooms | Owner-occupied | Renter-occupied |
| 1 Room | 0 (0.0%) | 0 (0.0%) |
| 2 or 3 Rooms | 0 (0.0%) | 0 (0.0%) |
| 4 or 5 Rooms | 29 (85.3%) | 5 (23.8%) |
| 6 or 7 Rooms | 3 (8.8%) | 16 (76.2%) |
| 8 or more Rooms | 2 (5.9%) | 0 (0.0%) |
| Total | 34 (100.0%) | 21 (100.0%) |
Housing Structure by Heating Type in Luray
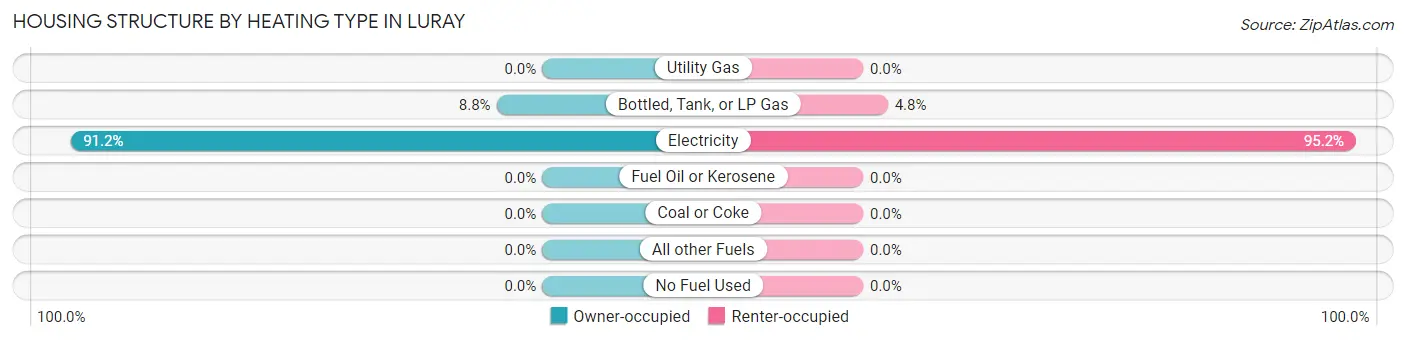
| Heating Type | Owner-occupied | Renter-occupied |
| Utility Gas | 0 (0.0%) | 0 (0.0%) |
| Bottled, Tank, or LP Gas | 3 (8.8%) | 1 (4.8%) |
| Electricity | 31 (91.2%) | 20 (95.2%) |
| Fuel Oil or Kerosene | 0 (0.0%) | 0 (0.0%) |
| Coal or Coke | 0 (0.0%) | 0 (0.0%) |
| All other Fuels | 0 (0.0%) | 0 (0.0%) |
| No Fuel Used | 0 (0.0%) | 0 (0.0%) |
| Total | 34 (100.0%) | 21 (100.0%) |
Household Vehicle Usage in Luray
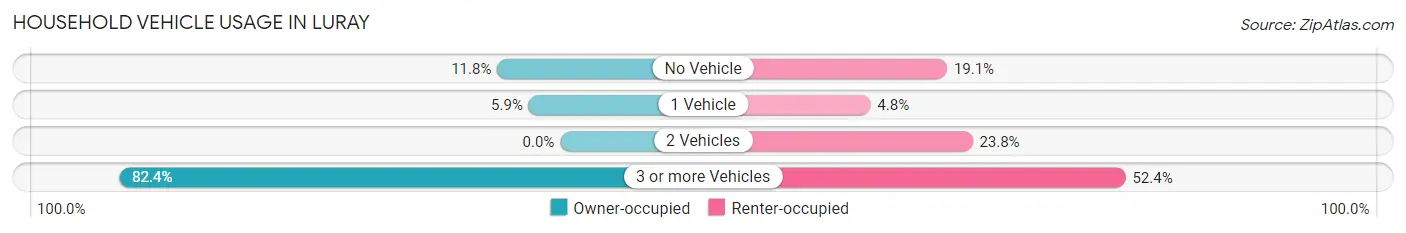
| Vehicles per Household | Owner-occupied | Renter-occupied |
| No Vehicle | 4 (11.8%) | 4 (19.1%) |
| 1 Vehicle | 2 (5.9%) | 1 (4.8%) |
| 2 Vehicles | 0 (0.0%) | 5 (23.8%) |
| 3 or more Vehicles | 28 (82.4%) | 11 (52.4%) |
| Total | 34 (100.0%) | 21 (100.0%) |
Real Estate & Mortgages in Luray
Real Estate and Mortgage Overview in Luray
| Characteristic | Without Mortgage | With Mortgage |
| Housing Units | 32 | 2 |
| Median Property Value | - | - |
| Median Household Income | $86,250 | $0 |
| Monthly Housing Costs | $290 | $0 |
| Real Estate Taxes | - | - |
Property Value by Mortgage Status in Luray
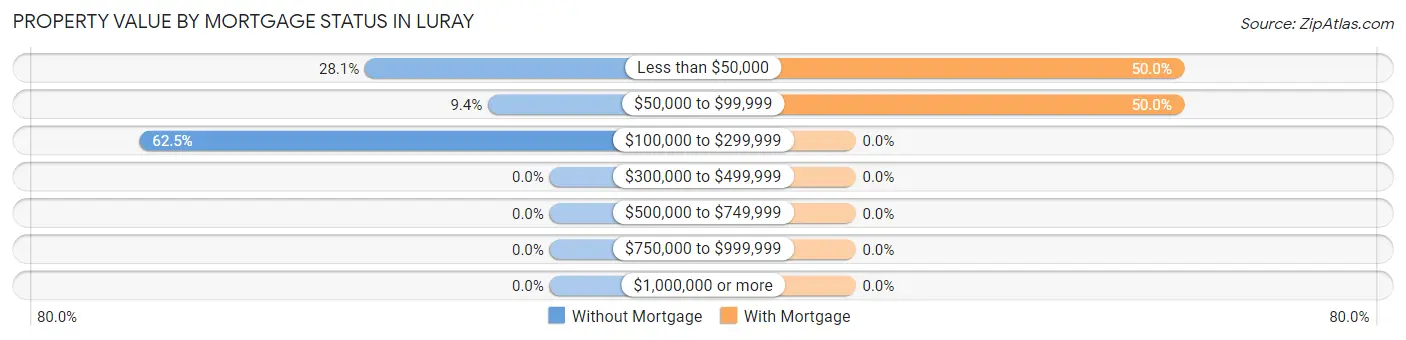
| Property Value | Without Mortgage | With Mortgage |
| Less than $50,000 | 9 (28.1%) | 1 (50.0%) |
| $50,000 to $99,999 | 3 (9.4%) | 1 (50.0%) |
| $100,000 to $299,999 | 20 (62.5%) | 0 (0.0%) |
| $300,000 to $499,999 | 0 (0.0%) | 0 (0.0%) |
| $500,000 to $749,999 | 0 (0.0%) | 0 (0.0%) |
| $750,000 to $999,999 | 0 (0.0%) | 0 (0.0%) |
| $1,000,000 or more | 0 (0.0%) | 0 (0.0%) |
| Total | 32 (100.0%) | 2 (100.0%) |
Household Income by Mortgage Status in Luray
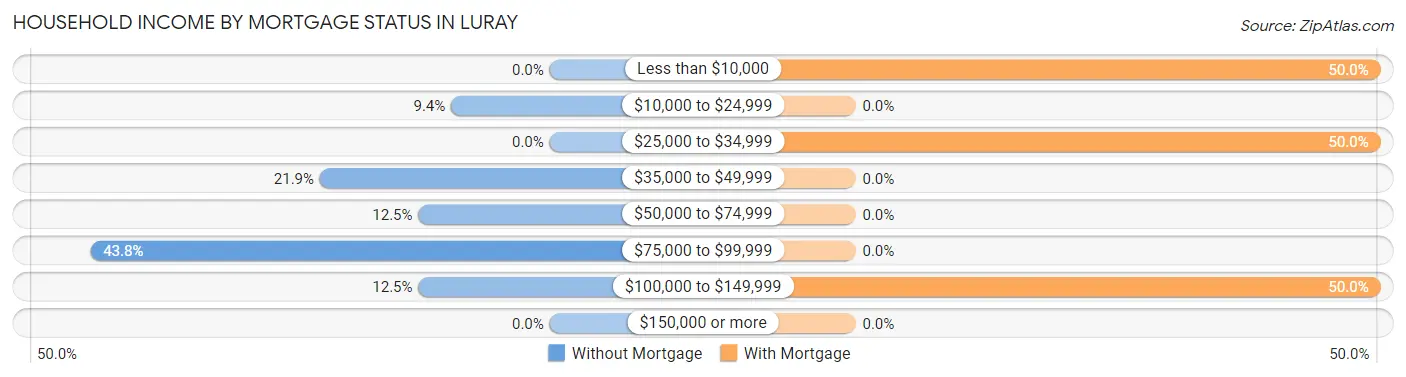
| Household Income | Without Mortgage | With Mortgage |
| Less than $10,000 | 0 (0.0%) | 1 (50.0%) |
| $10,000 to $24,999 | 3 (9.4%) | 0 (0.0%) |
| $25,000 to $34,999 | 0 (0.0%) | 1 (50.0%) |
| $35,000 to $49,999 | 7 (21.9%) | 0 (0.0%) |
| $50,000 to $74,999 | 4 (12.5%) | 0 (0.0%) |
| $75,000 to $99,999 | 14 (43.8%) | 0 (0.0%) |
| $100,000 to $149,999 | 4 (12.5%) | 1 (50.0%) |
| $150,000 or more | 0 (0.0%) | 0 (0.0%) |
| Total | 32 (100.0%) | 2 (100.0%) |
Property Value to Household Income Ratio in Luray
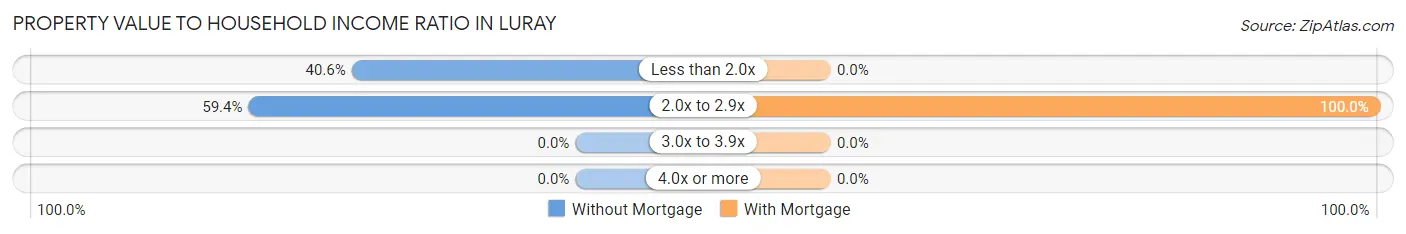
| Value-to-Income Ratio | Without Mortgage | With Mortgage |
| Less than 2.0x | 13 (40.6%) | 0 (0.0%) |
| 2.0x to 2.9x | 19 (59.4%) | 2 (100.0%) |
| 3.0x to 3.9x | 0 (0.0%) | 0 (0.0%) |
| 4.0x or more | 0 (0.0%) | 0 (0.0%) |
| Total | 32 (100.0%) | 2 (100.0%) |
Real Estate Taxes by Mortgage Status in Luray
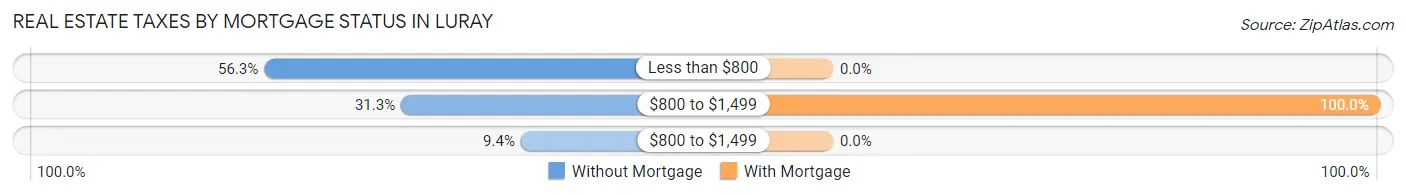
| Property Taxes | Without Mortgage | With Mortgage |
| Less than $800 | 18 (56.2%) | 0 (0.0%) |
| $800 to $1,499 | 10 (31.2%) | 2 (100.0%) |
| $800 to $1,499 | 3 (9.4%) | 0 (0.0%) |
| Total | 32 (100.0%) | 2 (100.0%) |
Health & Disability in Luray
Health Insurance Coverage by Age in Luray
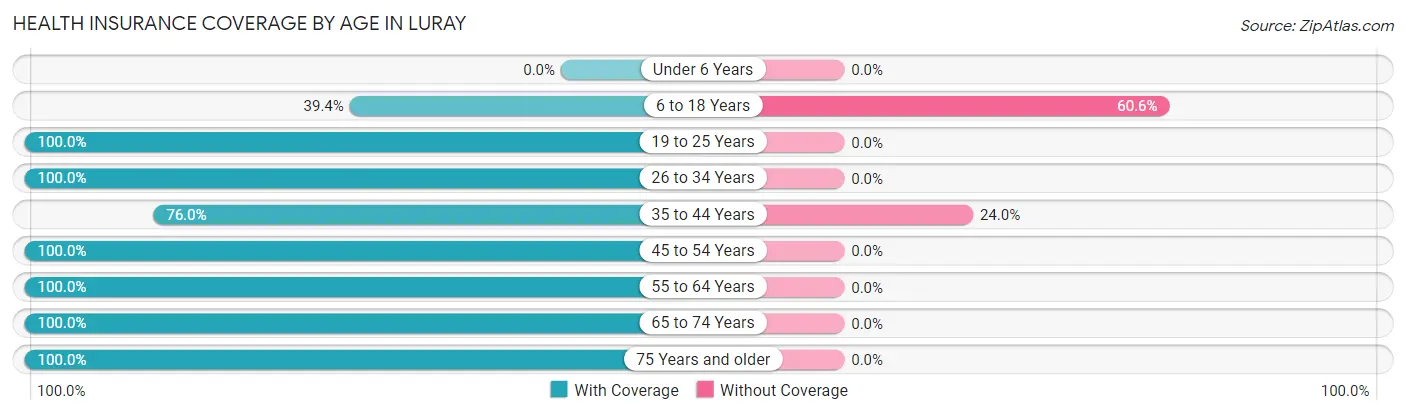
| Age Bracket | With Coverage | Without Coverage |
| Under 6 Years | 0 (0.0%) | 0 (0.0%) |
| 6 to 18 Years | 13 (39.4%) | 20 (60.6%) |
| 19 to 25 Years | 29 (100.0%) | 0 (0.0%) |
| 26 to 34 Years | 24 (100.0%) | 0 (0.0%) |
| 35 to 44 Years | 19 (76.0%) | 6 (24.0%) |
| 45 to 54 Years | 35 (100.0%) | 0 (0.0%) |
| 55 to 64 Years | 3 (100.0%) | 0 (0.0%) |
| 65 to 74 Years | 14 (100.0%) | 0 (0.0%) |
| 75 Years and older | 9 (100.0%) | 0 (0.0%) |
| Total | 146 (84.9%) | 26 (15.1%) |
Health Insurance Coverage by Citizenship Status in Luray
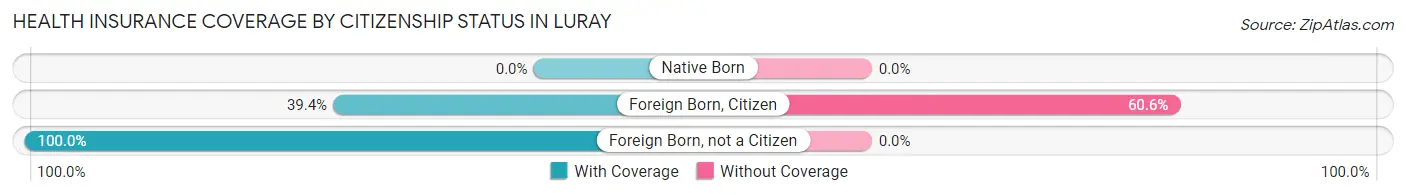
| Citizenship Status | With Coverage | Without Coverage |
| Native Born | 0 (0.0%) | 0 (0.0%) |
| Foreign Born, Citizen | 13 (39.4%) | 20 (60.6%) |
| Foreign Born, not a Citizen | 29 (100.0%) | 0 (0.0%) |
Health Insurance Coverage by Household Income in Luray
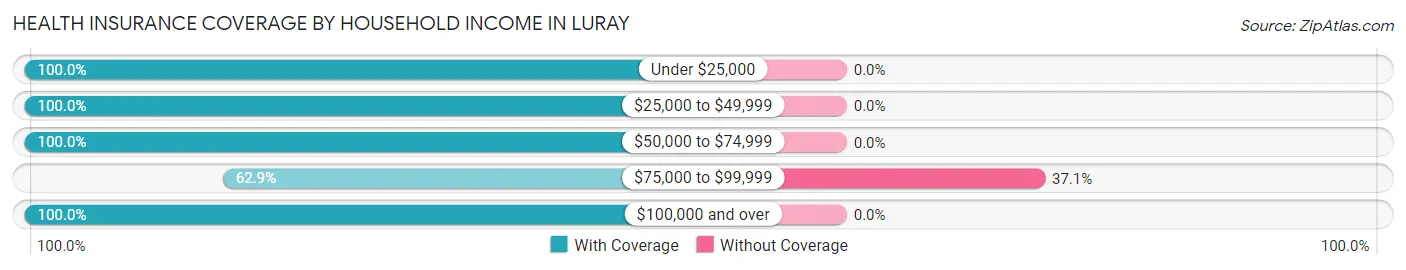
| Household Income | With Coverage | Without Coverage |
| Under $25,000 | 14 (100.0%) | 0 (0.0%) |
| $25,000 to $49,999 | 14 (100.0%) | 0 (0.0%) |
| $50,000 to $74,999 | 57 (100.0%) | 0 (0.0%) |
| $75,000 to $99,999 | 44 (62.9%) | 26 (37.1%) |
| $100,000 and over | 17 (100.0%) | 0 (0.0%) |
Public vs Private Health Insurance Coverage by Age in Luray
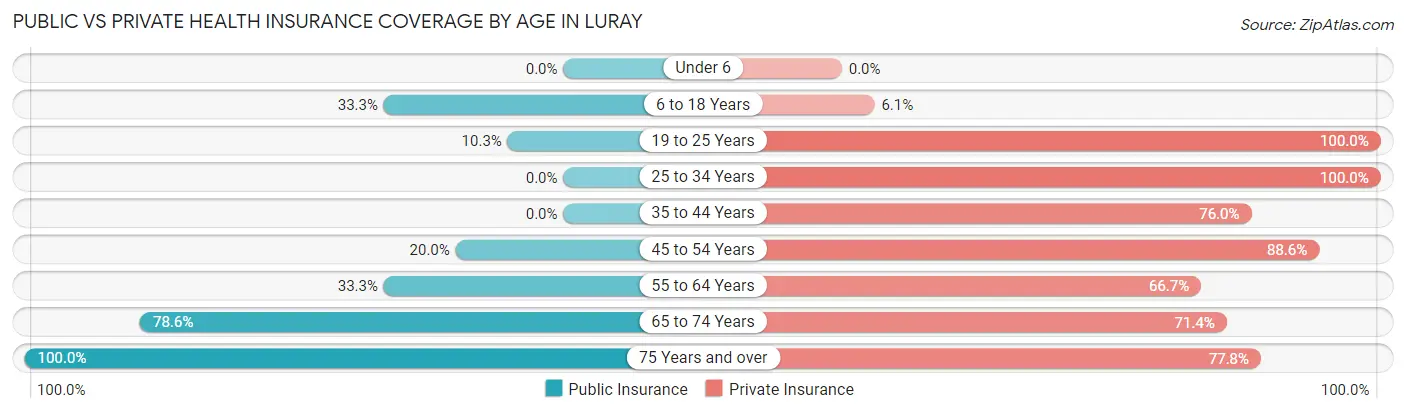
| Age Bracket | Public Insurance | Private Insurance |
| Under 6 | 0 (0.0%) | 0 (0.0%) |
| 6 to 18 Years | 11 (33.3%) | 2 (6.1%) |
| 19 to 25 Years | 3 (10.3%) | 29 (100.0%) |
| 25 to 34 Years | 0 (0.0%) | 24 (100.0%) |
| 35 to 44 Years | 0 (0.0%) | 19 (76.0%) |
| 45 to 54 Years | 7 (20.0%) | 31 (88.6%) |
| 55 to 64 Years | 1 (33.3%) | 2 (66.7%) |
| 65 to 74 Years | 11 (78.6%) | 10 (71.4%) |
| 75 Years and over | 9 (100.0%) | 7 (77.8%) |
| Total | 42 (24.4%) | 124 (72.1%) |
Disability Status by Sex by Age in Luray
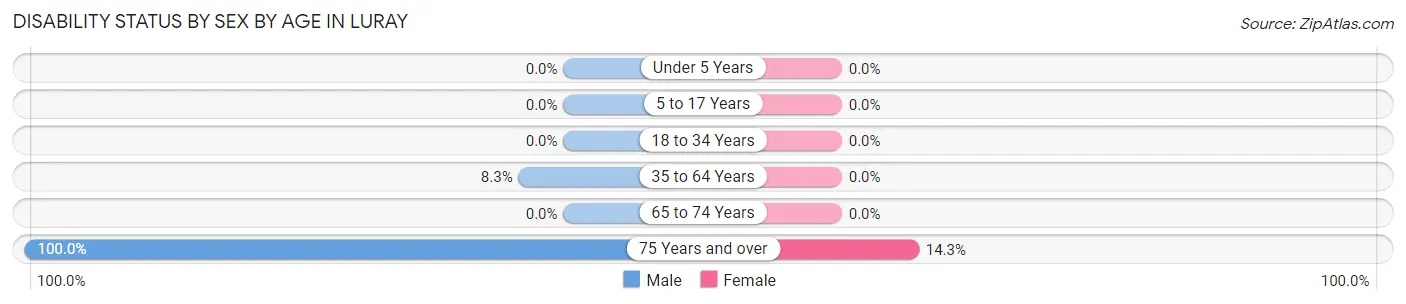
| Age Bracket | Male | Female |
| Under 5 Years | 0 (0.0%) | 0 (0.0%) |
| 5 to 17 Years | 0 (0.0%) | 0 (0.0%) |
| 18 to 34 Years | 0 (0.0%) | 0 (0.0%) |
| 35 to 64 Years | 3 (8.3%) | 0 (0.0%) |
| 65 to 74 Years | 0 (0.0%) | 0 (0.0%) |
| 75 Years and over | 2 (100.0%) | 1 (14.3%) |
Disability Class by Sex by Age in Luray
Disability Class: Hearing Difficulty
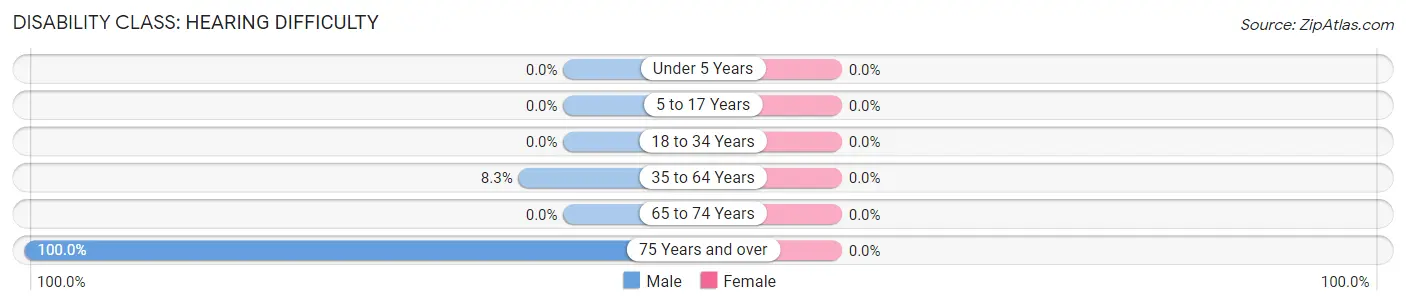
| Age Bracket | Male | Female |
| Under 5 Years | 0 (0.0%) | 0 (0.0%) |
| 5 to 17 Years | 0 (0.0%) | 0 (0.0%) |
| 18 to 34 Years | 0 (0.0%) | 0 (0.0%) |
| 35 to 64 Years | 3 (8.3%) | 0 (0.0%) |
| 65 to 74 Years | 0 (0.0%) | 0 (0.0%) |
| 75 Years and over | 2 (100.0%) | 0 (0.0%) |
Disability Class: Vision Difficulty
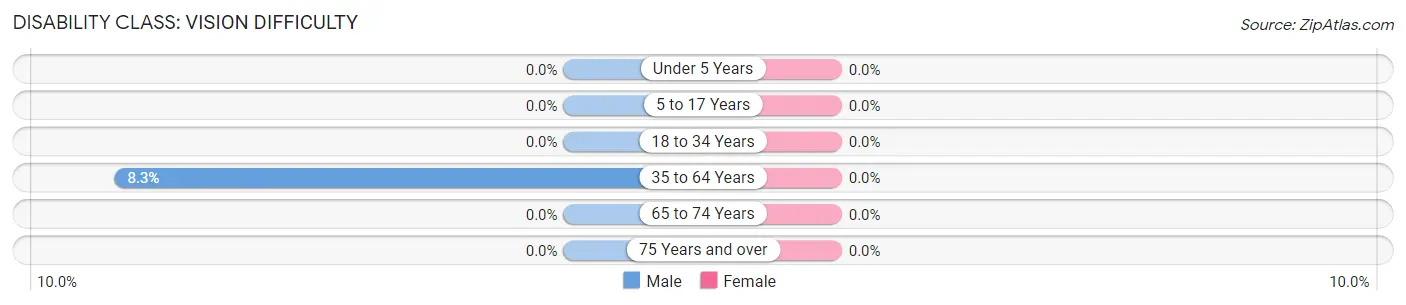
| Age Bracket | Male | Female |
| Under 5 Years | 0 (0.0%) | 0 (0.0%) |
| 5 to 17 Years | 0 (0.0%) | 0 (0.0%) |
| 18 to 34 Years | 0 (0.0%) | 0 (0.0%) |
| 35 to 64 Years | 3 (8.3%) | 0 (0.0%) |
| 65 to 74 Years | 0 (0.0%) | 0 (0.0%) |
| 75 Years and over | 0 (0.0%) | 0 (0.0%) |
Disability Class: Cognitive Difficulty
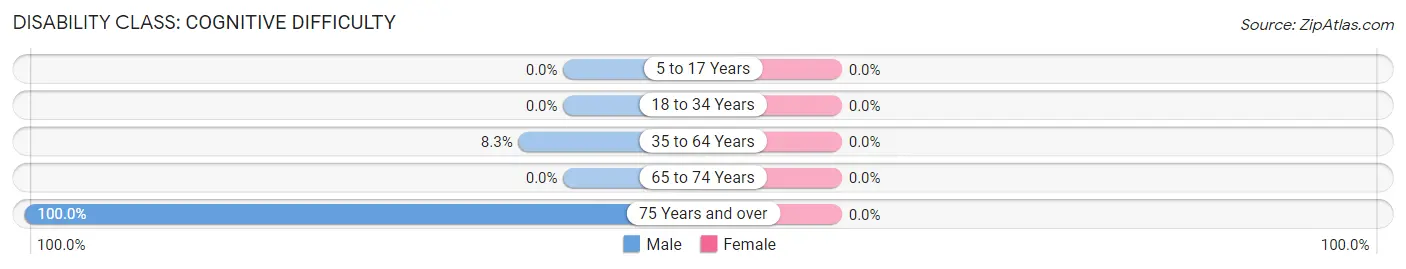
| Age Bracket | Male | Female |
| 5 to 17 Years | 0 (0.0%) | 0 (0.0%) |
| 18 to 34 Years | 0 (0.0%) | 0 (0.0%) |
| 35 to 64 Years | 3 (8.3%) | 0 (0.0%) |
| 65 to 74 Years | 0 (0.0%) | 0 (0.0%) |
| 75 Years and over | 2 (100.0%) | 0 (0.0%) |
Disability Class: Ambulatory Difficulty
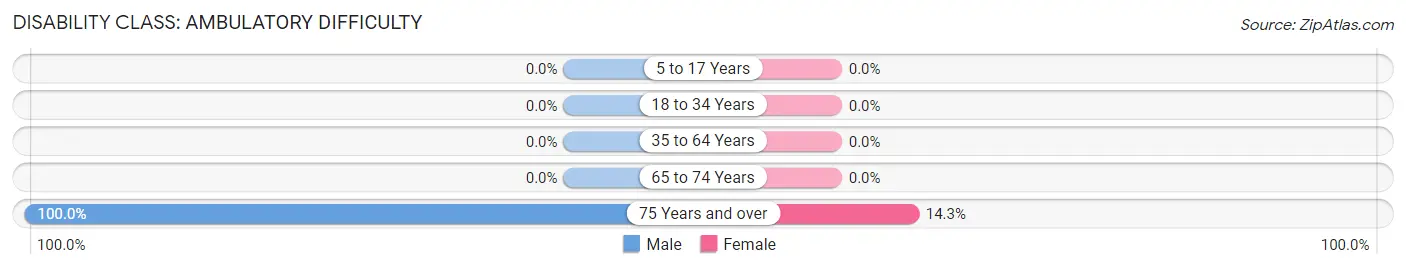
| Age Bracket | Male | Female |
| 5 to 17 Years | 0 (0.0%) | 0 (0.0%) |
| 18 to 34 Years | 0 (0.0%) | 0 (0.0%) |
| 35 to 64 Years | 0 (0.0%) | 0 (0.0%) |
| 65 to 74 Years | 0 (0.0%) | 0 (0.0%) |
| 75 Years and over | 2 (100.0%) | 1 (14.3%) |
Disability Class: Self-Care Difficulty
| Age Bracket | Male | Female |
| 5 to 17 Years | 0 (0.0%) | 0 (0.0%) |
| 18 to 34 Years | 0 (0.0%) | 0 (0.0%) |
| 35 to 64 Years | 0 (0.0%) | 0 (0.0%) |
| 65 to 74 Years | 0 (0.0%) | 0 (0.0%) |
| 75 Years and over | 0 (0.0%) | 0 (0.0%) |
Technology Access in Luray
Computing Device Access in Luray
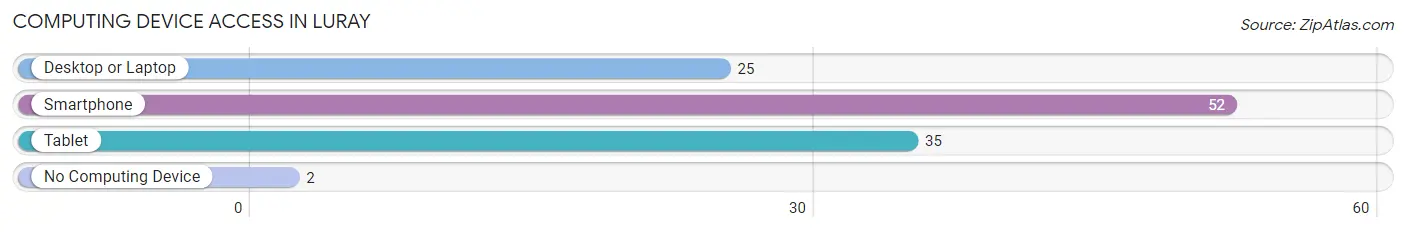
| Device Type | # Households | % Households |
| Desktop or Laptop | 25 | 45.5% |
| Smartphone | 52 | 94.6% |
| Tablet | 35 | 63.6% |
| No Computing Device | 2 | 3.6% |
| Total | 55 | 100.0% |
Internet Access in Luray
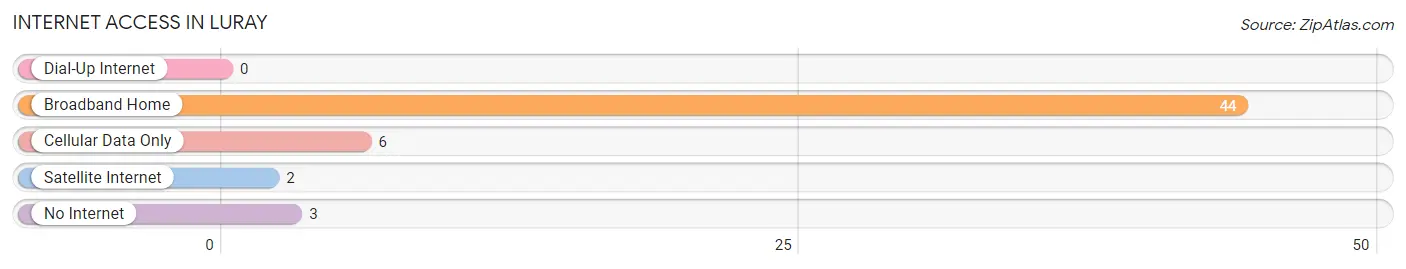
| Internet Type | # Households | % Households |
| Dial-Up Internet | 0 | 0.0% |
| Broadband Home | 44 | 80.0% |
| Cellular Data Only | 6 | 10.9% |
| Satellite Internet | 2 | 3.6% |
| No Internet | 3 | 5.4% |
| Total | 55 | 100.0% |
Luray Summary
Luray is a small town located in the state of South Carolina, United States. It is situated in the northwestern corner of the state, near the border with North Carolina. The town is part of the larger Aiken County, and is located about 25 miles from the city of Aiken. The population of Luray was estimated to be 1,845 in the year 2000.
History
Luray was first settled in the early 1800s by a group of settlers from North Carolina. The town was originally known as “Luray Station”, and was named after the nearby Luray Creek. The town was officially incorporated in 1883, and was named after the creek.
The town was a major stop on the South Carolina Railroad, and was a popular destination for travelers. The railroad also brought in many new businesses to the area, including a cotton mill, a sawmill, and a gristmill.
In the early 1900s, the town experienced a period of growth and prosperity. The population increased from around 500 in 1900 to over 1,000 by the 1920s. The town also saw the construction of several new buildings, including a new school, a post office, and a bank.
Geography
Luray is located in the northwestern corner of South Carolina, near the border with North Carolina. The town is situated in the Piedmont region of the state, and is surrounded by rolling hills and forests. The town is located about 25 miles from the city of Aiken, and is about an hour’s drive from the state capital of Columbia.
The town is located at an elevation of around 500 feet above sea level, and has a humid subtropical climate. The average annual temperature is around 70 degrees Fahrenheit, and the average annual precipitation is around 45 inches.
Economy
The economy of Luray is largely based on agriculture and tourism. The town is home to several farms, which produce a variety of crops, including corn, soybeans, and cotton. The town is also home to several tourist attractions, including the Luray Zoo and the Luray Caverns.
The town is also home to several small businesses, including restaurants, shops, and other services. The town is also home to a few manufacturing companies, which produce a variety of products, including furniture, clothing, and electronics.
Demographics
The population of Luray was estimated to be 1,845 in the year 2000. The town has a diverse population, with a mix of races and ethnicities. The majority of the population is white, followed by African Americans, Hispanics, and Asians. The median household income in the town is around $35,000, and the median home value is around $100,000.
The town is served by the Aiken County School District, which includes several elementary, middle, and high schools. The town is also home to several churches, including the First Baptist Church of Luray and the Church of the Nazarene.
Common Questions
What is Per Capita Income in Luray?
Per Capita income in Luray is $23,753.
What is the Median Family Income in Luray?
Median Family Income in Luray is $55,000.
What is the Median Household income in Luray?
Median Household Income in Luray is $51,705.
What is Income or Wage Gap in Luray?
Income or Wage Gap in Luray is 20.2%.
Women in Luray earn 79.8 cents for every dollar earned by a man.
What is Inequality or Gini Index in Luray?
Inequality or Gini Index in Luray is 0.29.
What is the Total Population of Luray?
Total Population of Luray is 176.
What is the Total Male Population of Luray?
Total Male Population of Luray is 126.
What is the Total Female Population of Luray?
Total Female Population of Luray is 50.
What is the Ratio of Males per 100 Females in Luray?
There are 252.00 Males per 100 Females in Luray.
What is the Ratio of Females per 100 Males in Luray?
There are 39.68 Females per 100 Males in Luray.
What is the Median Population Age in Luray?
Median Population Age in Luray is 28.9 Years.
What is the Average Family Size in Luray
Average Family Size in Luray is 3.5 People.
What is the Average Household Size in Luray
Average Household Size in Luray is 3.2 People.
How Large is the Labor Force in Luray?
There are 119 People in the Labor Forcein in Luray.
What is the Percentage of People in the Labor Force in Luray?
70.0% of People are in the Labor Force in Luray.
What is the Unemployment Rate in Luray?
Unemployment Rate in Luray is 9.6%.