Lowrys, SC Map & Demographics
Lowrys Map
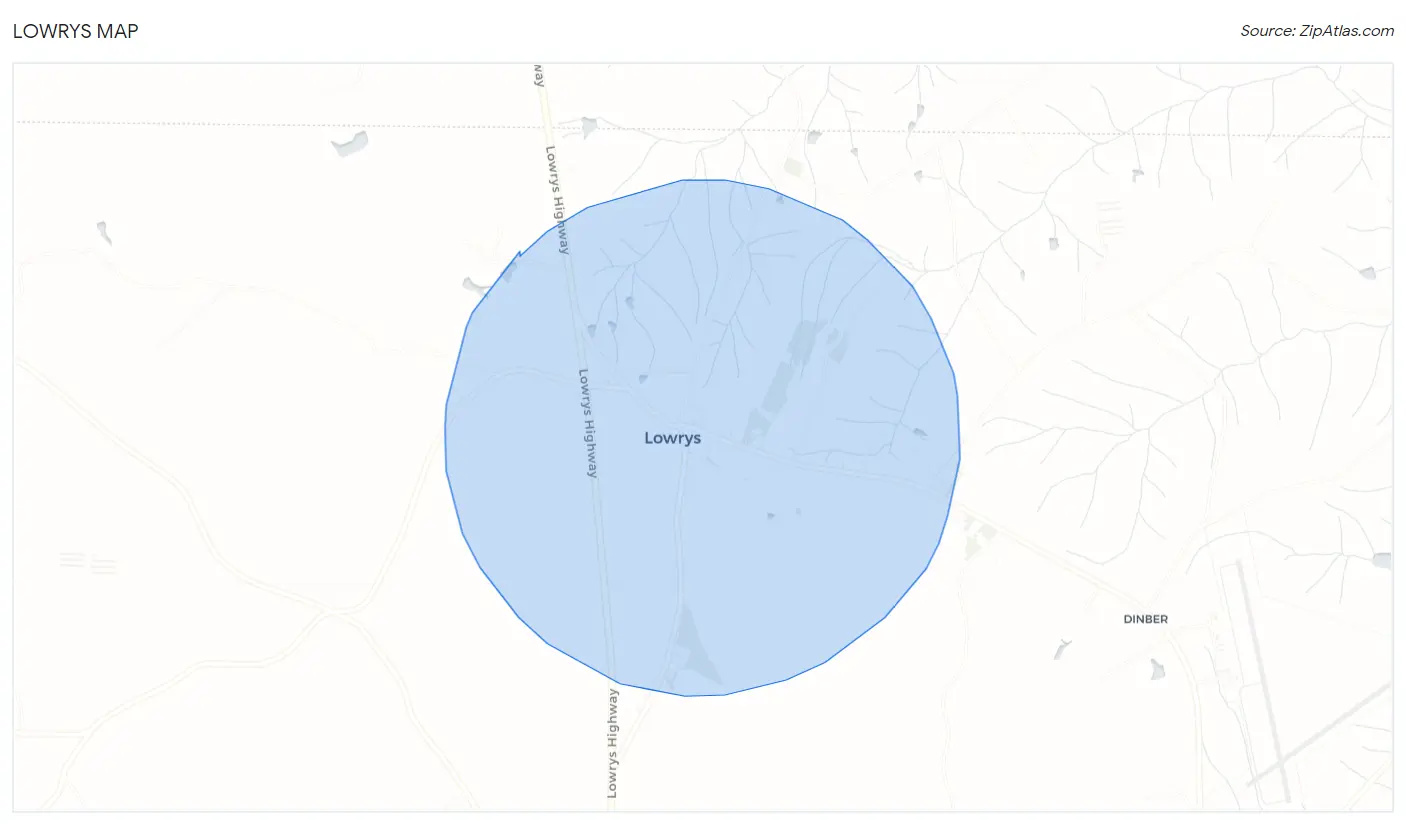
Lowrys Overview
$26,856
PER CAPITA INCOME
$70,750
AVG FAMILY INCOME
$57,250
AVG HOUSEHOLD INCOME
53.1%
WAGE / INCOME GAP [ % ]
46.9¢/ $1
WAGE / INCOME GAP [ $ ]
0.42
INEQUALITY / GINI INDEX
297
TOTAL POPULATION
170
MALE POPULATION
127
FEMALE POPULATION
133.86
MALES / 100 FEMALES
74.71
FEMALES / 100 MALES
35.3
MEDIAN AGE
3.2
AVG FAMILY SIZE
2.7
AVG HOUSEHOLD SIZE
112
LABOR FORCE [ PEOPLE ]
50.9%
PERCENT IN LABOR FORCE
3.6%
UNEMPLOYMENT RATE
Income in Lowrys
Income Overview in Lowrys
Per Capita Income in Lowrys is $26,856, while median incomes of families and households are $70,750 and $57,250 respectively.
| Characteristic | Number | Measure |
| Per Capita Income | 297 | $26,856 |
| Median Family Income | 81 | $70,750 |
| Mean Family Income | 81 | $88,830 |
| Median Household Income | 110 | $57,250 |
| Mean Household Income | 110 | $71,935 |
| Income Deficit | 81 | $0 |
| Wage / Income Gap (%) | 297 | 53.09% |
| Wage / Income Gap ($) | 297 | 46.91¢ per $1 |
| Gini / Inequality Index | 297 | 0.42 |
Earnings by Sex in Lowrys
Average Earnings in Lowrys are $39,375, $71,607 for men and $33,594 for women, a difference of 53.1%.
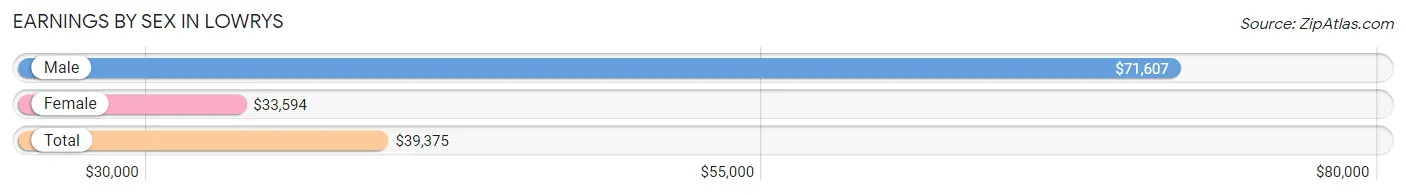
| Sex | Number | Average Earnings |
| Male | 67 (53.2%) | $71,607 |
| Female | 59 (46.8%) | $33,594 |
| Total | 126 (100.0%) | $39,375 |
Earnings by Sex by Income Bracket in Lowrys
The most common earnings brackets in Lowrys are $75,000 to $99,999 for men (25 | 37.3%) and $2,499 or less for women (11 | 18.6%).
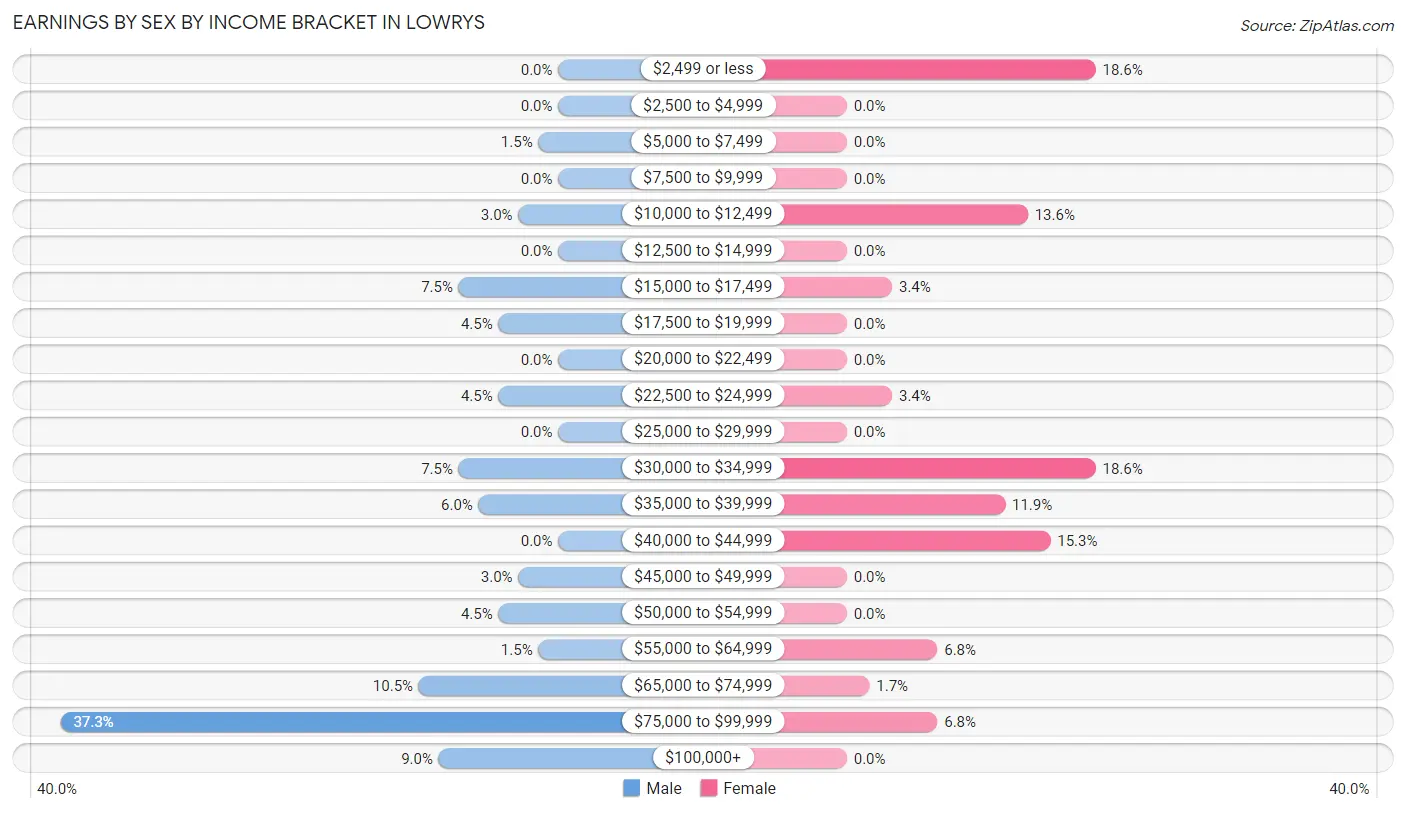
| Income | Male | Female |
| $2,499 or less | 0 (0.0%) | 11 (18.6%) |
| $2,500 to $4,999 | 0 (0.0%) | 0 (0.0%) |
| $5,000 to $7,499 | 1 (1.5%) | 0 (0.0%) |
| $7,500 to $9,999 | 0 (0.0%) | 0 (0.0%) |
| $10,000 to $12,499 | 2 (3.0%) | 8 (13.6%) |
| $12,500 to $14,999 | 0 (0.0%) | 0 (0.0%) |
| $15,000 to $17,499 | 5 (7.5%) | 2 (3.4%) |
| $17,500 to $19,999 | 3 (4.5%) | 0 (0.0%) |
| $20,000 to $22,499 | 0 (0.0%) | 0 (0.0%) |
| $22,500 to $24,999 | 3 (4.5%) | 2 (3.4%) |
| $25,000 to $29,999 | 0 (0.0%) | 0 (0.0%) |
| $30,000 to $34,999 | 5 (7.5%) | 11 (18.6%) |
| $35,000 to $39,999 | 4 (6.0%) | 7 (11.9%) |
| $40,000 to $44,999 | 0 (0.0%) | 9 (15.2%) |
| $45,000 to $49,999 | 2 (3.0%) | 0 (0.0%) |
| $50,000 to $54,999 | 3 (4.5%) | 0 (0.0%) |
| $55,000 to $64,999 | 1 (1.5%) | 4 (6.8%) |
| $65,000 to $74,999 | 7 (10.4%) | 1 (1.7%) |
| $75,000 to $99,999 | 25 (37.3%) | 4 (6.8%) |
| $100,000+ | 6 (9.0%) | 0 (0.0%) |
| Total | 67 (100.0%) | 59 (100.0%) |
Earnings by Sex by Educational Attainment in Lowrys
Average earnings in Lowrys are $85,625 for men and $33,594 for women, a difference of 60.8%. Men with an educational attainment of college or associate's degree enjoy the highest average annual earnings of $80,625, while those with high school diploma education earn the least with $26,250. Women with an educational attainment of college or associate's degree earn the most with the average annual earnings of $35,625, while those with college or associate's degree education have the smallest earnings of $35,625.
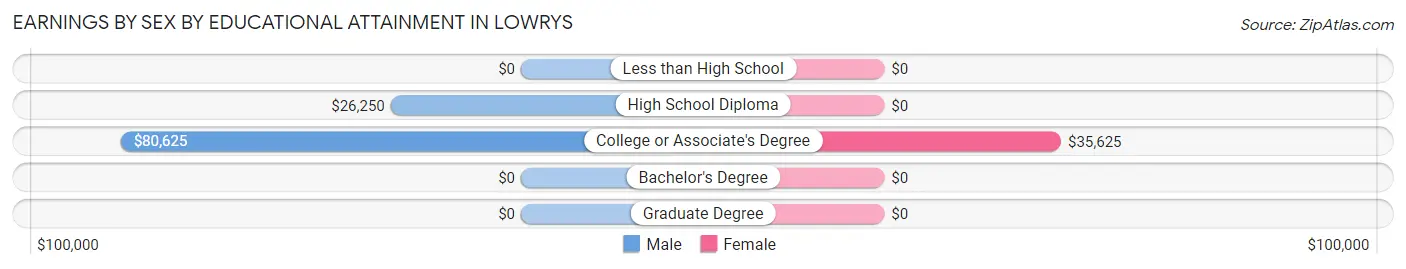
| Educational Attainment | Male Income | Female Income |
| Less than High School | - | - |
| High School Diploma | $26,250 | $0 |
| College or Associate's Degree | $80,625 | $35,625 |
| Bachelor's Degree | - | - |
| Graduate Degree | - | - |
| Total | $85,625 | $33,594 |
Family Income in Lowrys
Family Income Brackets in Lowrys
According to the Lowrys family income data, there are 23 families falling into the $50,000 to $74,999 income range, which is the most common income bracket and makes up 28.4% of all families.
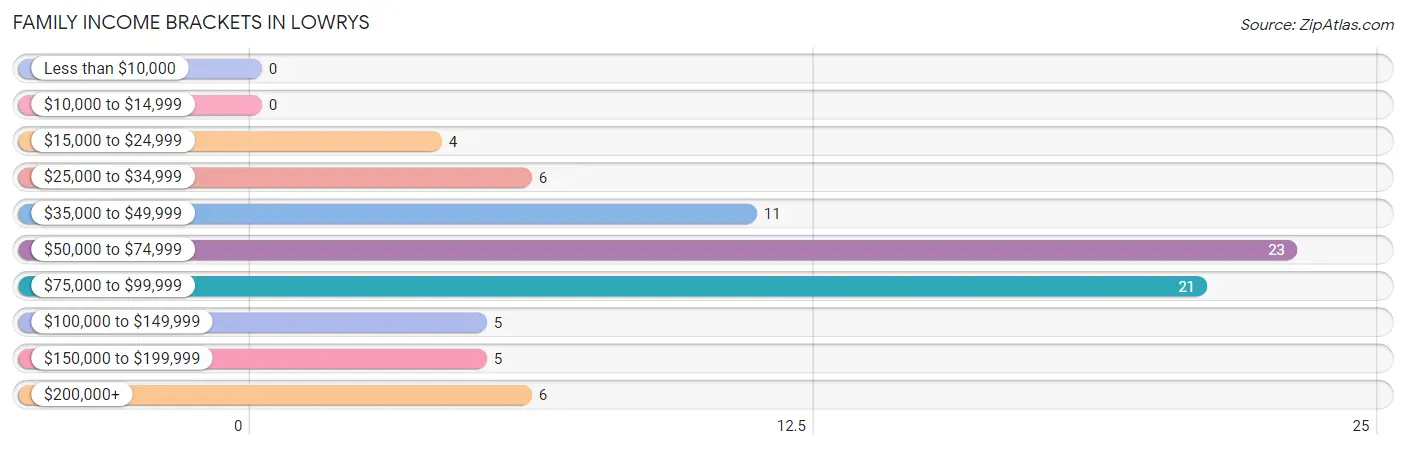
| Income Bracket | # Families | % Families |
| Less than $10,000 | 0 | 0.0% |
| $10,000 to $14,999 | 0 | 0.0% |
| $15,000 to $24,999 | 4 | 4.9% |
| $25,000 to $34,999 | 6 | 7.4% |
| $35,000 to $49,999 | 11 | 13.6% |
| $50,000 to $74,999 | 23 | 28.4% |
| $75,000 to $99,999 | 21 | 25.9% |
| $100,000 to $149,999 | 5 | 6.2% |
| $150,000 to $199,999 | 5 | 6.2% |
| $200,000+ | 6 | 7.4% |
Family Income by Famaliy Size in Lowrys
2-person families (38 | 46.9%) account for the highest median family income in Lowrys with $68,000 per family, while 2-person families (38 | 46.9%) have the highest median income of $34,000 per family member.
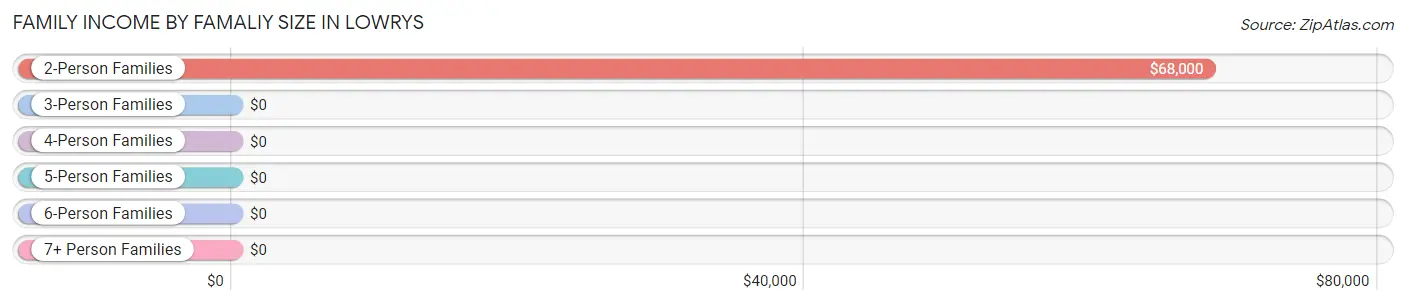
| Income Bracket | # Families | Median Income |
| 2-Person Families | 38 (46.9%) | $68,000 |
| 3-Person Families | 17 (21.0%) | $0 |
| 4-Person Families | 19 (23.5%) | $0 |
| 5-Person Families | 5 (6.2%) | $0 |
| 6-Person Families | 2 (2.5%) | $0 |
| 7+ Person Families | 0 (0.0%) | $0 |
| Total | 81 (100.0%) | $70,750 |
Family Income by Number of Earners in Lowrys
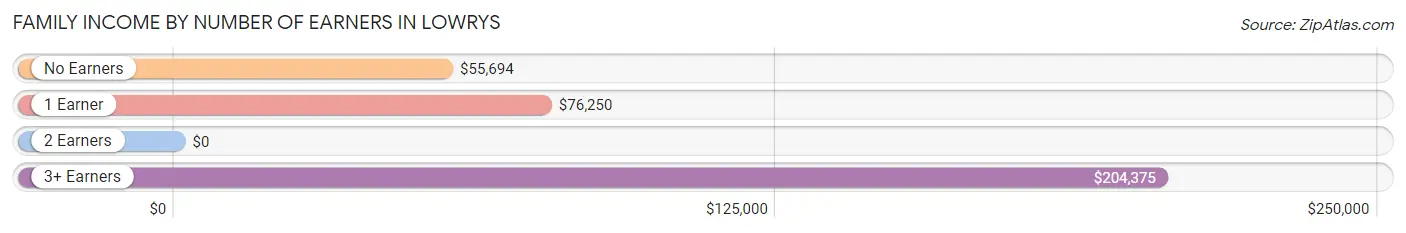
| Number of Earners | # Families | Median Income |
| No Earners | 15 (18.5%) | $55,694 |
| 1 Earner | 40 (49.4%) | $76,250 |
| 2 Earners | 17 (21.0%) | $0 |
| 3+ Earners | 9 (11.1%) | $204,375 |
| Total | 81 (100.0%) | $70,750 |
Household Income in Lowrys
Household Income Brackets in Lowrys
With 26 households falling in the category, the $50,000 to $74,999 income range is the most frequent in Lowrys, accounting for 23.6% of all households. In contrast, only 3 households (2.7%) fall into the $10,000 to $14,999 income bracket, making it the least populous group.
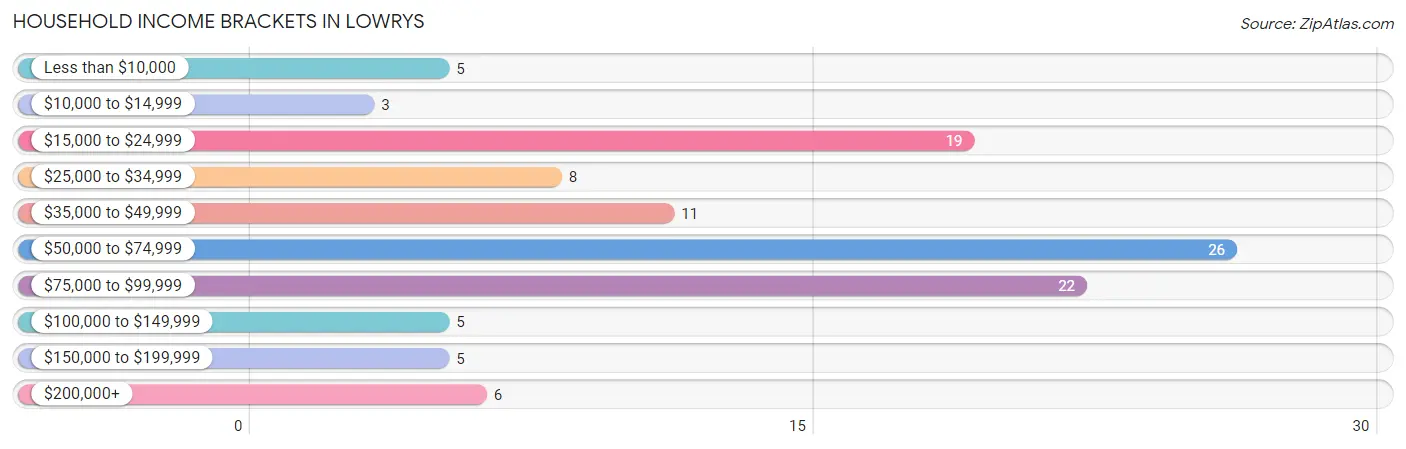
| Income Bracket | # Households | % Households |
| Less than $10,000 | 5 | 4.5% |
| $10,000 to $14,999 | 3 | 2.7% |
| $15,000 to $24,999 | 19 | 17.3% |
| $25,000 to $34,999 | 8 | 7.3% |
| $35,000 to $49,999 | 11 | 10.0% |
| $50,000 to $74,999 | 26 | 23.6% |
| $75,000 to $99,999 | 22 | 20.0% |
| $100,000 to $149,999 | 5 | 4.5% |
| $150,000 to $199,999 | 5 | 4.5% |
| $200,000+ | 6 | 5.5% |
Household Income by Householder Age in Lowrys
The median household income in Lowrys is $57,250, with the highest median household income of $71,429 found in the 15 to 24 years age bracket for the primary householder. A total of 8 households (7.3%) fall into this category. Meanwhile, the 25 to 44 years age bracket for the primary householder has the lowest median household income of $0, with 17 households (15.4%) in this group.
| Income Bracket | # Households | Median Income |
| 15 to 24 Years | 8 (7.3%) | $71,429 |
| 25 to 44 Years | 17 (15.4%) | $0 |
| 45 to 64 Years | 52 (47.3%) | $69,000 |
| 65+ Years | 33 (30.0%) | $55,375 |
| Total | 110 (100.0%) | $57,250 |
Poverty in Lowrys
Income Below Poverty by Sex and Age in Lowrys
With 10.6% poverty level for males and 18.9% for females among the residents of Lowrys, 12 to 14 year old males and 12 to 14 year old females are the most vulnerable to poverty, with 9 males (52.9%) and 7 females (77.8%) in their respective age groups living below the poverty level.
| Age Bracket | Male | Female |
| Under 5 Years | 0 (0.0%) | 0 (0.0%) |
| 5 Years | 0 (0.0%) | 0 (0.0%) |
| 6 to 11 Years | 4 (25.0%) | 0 (0.0%) |
| 12 to 14 Years | 9 (52.9%) | 7 (77.8%) |
| 15 Years | 0 (0.0%) | 0 (0.0%) |
| 16 and 17 Years | 0 (0.0%) | 0 (0.0%) |
| 18 to 24 Years | 0 (0.0%) | 11 (64.7%) |
| 25 to 34 Years | 0 (0.0%) | 0 (0.0%) |
| 35 to 44 Years | 5 (50.0%) | 1 (7.1%) |
| 45 to 54 Years | 0 (0.0%) | 0 (0.0%) |
| 55 to 64 Years | 0 (0.0%) | 5 (22.7%) |
| 65 to 74 Years | 0 (0.0%) | 0 (0.0%) |
| 75 Years and over | 0 (0.0%) | 0 (0.0%) |
| Total | 18 (10.6%) | 24 (18.9%) |
Income Above Poverty by Sex and Age in Lowrys
According to the poverty statistics in Lowrys, males aged under 5 years and females aged under 5 years are the age groups that are most secure financially, with 100.0% of males and 100.0% of females in these age groups living above the poverty line.
| Age Bracket | Male | Female |
| Under 5 Years | 21 (100.0%) | 2 (100.0%) |
| 5 Years | 0 (0.0%) | 0 (0.0%) |
| 6 to 11 Years | 12 (75.0%) | 0 (0.0%) |
| 12 to 14 Years | 8 (47.1%) | 2 (22.2%) |
| 15 Years | 12 (100.0%) | 0 (0.0%) |
| 16 and 17 Years | 0 (0.0%) | 0 (0.0%) |
| 18 to 24 Years | 23 (100.0%) | 6 (35.3%) |
| 25 to 34 Years | 5 (100.0%) | 26 (100.0%) |
| 35 to 44 Years | 5 (50.0%) | 13 (92.9%) |
| 45 to 54 Years | 24 (100.0%) | 16 (100.0%) |
| 55 to 64 Years | 16 (100.0%) | 17 (77.3%) |
| 65 to 74 Years | 20 (100.0%) | 12 (100.0%) |
| 75 Years and over | 6 (100.0%) | 9 (100.0%) |
| Total | 152 (89.4%) | 103 (81.1%) |
Income Below Poverty Among Married-Couple Families in Lowrys
| Children | Above Poverty | Below Poverty |
| No Children | 38 (100.0%) | 0 (0.0%) |
| 1 or 2 Children | 26 (100.0%) | 0 (0.0%) |
| 3 or 4 Children | 0 (0.0%) | 0 (0.0%) |
| 5 or more Children | 0 (0.0%) | 0 (0.0%) |
| Total | 64 (100.0%) | 0 (0.0%) |
Income Below Poverty Among Single-Parent Households in Lowrys
| Children | Single Father | Single Mother |
| No Children | 0 (0.0%) | 0 (0.0%) |
| 1 or 2 Children | 0 (0.0%) | 0 (0.0%) |
| 3 or 4 Children | 0 (0.0%) | 5 (100.0%) |
| 5 or more Children | 0 (0.0%) | 0 (0.0%) |
| Total | 0 (0.0%) | 5 (41.7%) |
Income Below Poverty Among Married-Couple vs Single-Parent Households in Lowrys
| Children | Married-Couple Families | Single-Parent Households |
| No Children | 0 (0.0%) | 0 (0.0%) |
| 1 or 2 Children | 0 (0.0%) | 0 (0.0%) |
| 3 or 4 Children | 0 (0.0%) | 5 (100.0%) |
| 5 or more Children | 0 (0.0%) | 0 (0.0%) |
| Total | 0 (0.0%) | 5 (29.4%) |
Race in Lowrys
The most populous races in Lowrys are White / Caucasian (217 | 73.1%), Hispanic or Latino (39 | 13.1%), and Two or more Races (39 | 13.1%).
| Race | # Population | % Population |
| Asian | 0 | 0.0% |
| Black / African American | 37 | 12.5% |
| Hawaiian / Pacific | 0 | 0.0% |
| Hispanic or Latino | 39 | 13.1% |
| Native / Alaskan | 0 | 0.0% |
| White / Caucasian | 217 | 73.1% |
| Two or more Races | 39 | 13.1% |
| Some other Race | 4 | 1.3% |
| Total | 297 | 100.0% |
Ancestry in Lowrys
The most populous ancestries reported in Lowrys are American (71 | 23.9%), English (62 | 20.9%), Mexican (35 | 11.8%), Scotch-Irish (33 | 11.1%), and German (9 | 3.0%), together accounting for 70.7% of all Lowrys residents.
| Ancestry | # Population | % Population |
| African | 1 | 0.3% |
| American | 71 | 23.9% |
| English | 62 | 20.9% |
| European | 1 | 0.3% |
| German | 9 | 3.0% |
| Irish | 9 | 3.0% |
| Mexican | 35 | 11.8% |
| Peruvian | 4 | 1.3% |
| Scotch-Irish | 33 | 11.1% |
| South American | 4 | 1.3% |
| Subsaharan African | 1 | 0.3% | View All 11 Rows |
Immigrants in Lowrys
The most numerous immigrant groups reported in Lowrys came from Central America (35 | 11.8%), Latin America (35 | 11.8%), Mexico (35 | 11.8%), Europe (2 | 0.7%), and Germany (2 | 0.7%), together accounting for 36.7% of all Lowrys residents.
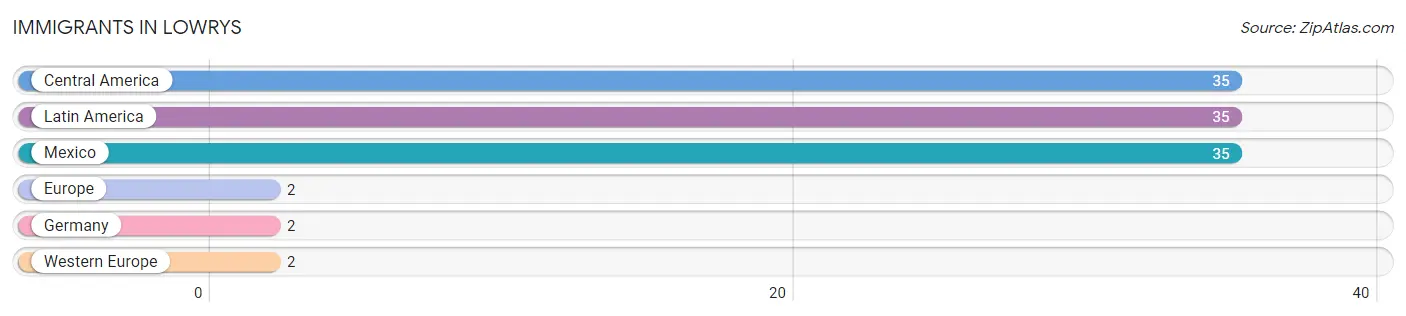
| Immigration Origin | # Population | % Population |
| Central America | 35 | 11.8% |
| Europe | 2 | 0.7% |
| Germany | 2 | 0.7% |
| Latin America | 35 | 11.8% |
| Mexico | 35 | 11.8% |
| Western Europe | 2 | 0.7% | View All 6 Rows |
Sex and Age in Lowrys
Sex and Age in Lowrys
The most populous age groups in Lowrys are Under 5 Years (21 | 12.3%) for men and 30 to 34 Years (26 | 20.5%) for women.
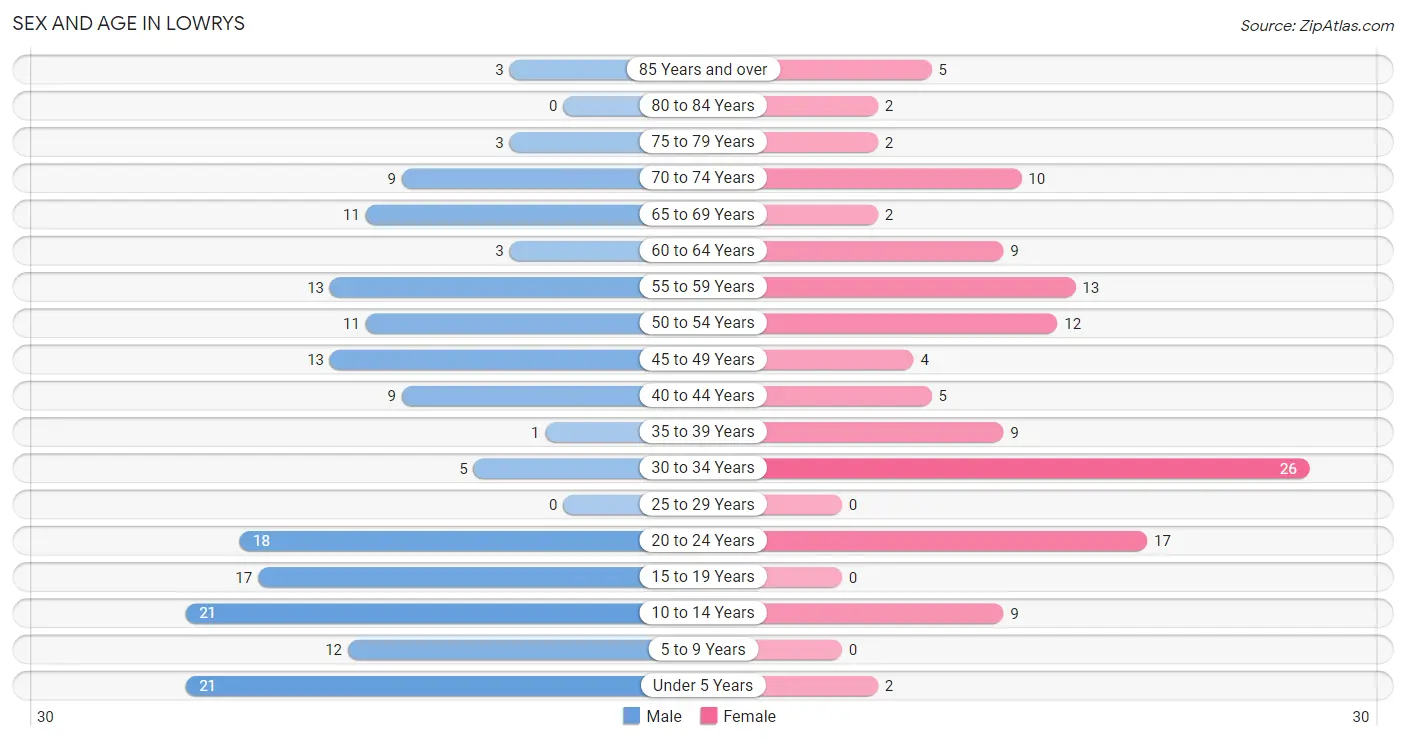
| Age Bracket | Male | Female |
| Under 5 Years | 21 (12.3%) | 2 (1.6%) |
| 5 to 9 Years | 12 (7.1%) | 0 (0.0%) |
| 10 to 14 Years | 21 (12.3%) | 9 (7.1%) |
| 15 to 19 Years | 17 (10.0%) | 0 (0.0%) |
| 20 to 24 Years | 18 (10.6%) | 17 (13.4%) |
| 25 to 29 Years | 0 (0.0%) | 0 (0.0%) |
| 30 to 34 Years | 5 (2.9%) | 26 (20.5%) |
| 35 to 39 Years | 1 (0.6%) | 9 (7.1%) |
| 40 to 44 Years | 9 (5.3%) | 5 (3.9%) |
| 45 to 49 Years | 13 (7.6%) | 4 (3.2%) |
| 50 to 54 Years | 11 (6.5%) | 12 (9.5%) |
| 55 to 59 Years | 13 (7.6%) | 13 (10.2%) |
| 60 to 64 Years | 3 (1.8%) | 9 (7.1%) |
| 65 to 69 Years | 11 (6.5%) | 2 (1.6%) |
| 70 to 74 Years | 9 (5.3%) | 10 (7.9%) |
| 75 to 79 Years | 3 (1.8%) | 2 (1.6%) |
| 80 to 84 Years | 0 (0.0%) | 2 (1.6%) |
| 85 Years and over | 3 (1.8%) | 5 (3.9%) |
| Total | 170 (100.0%) | 127 (100.0%) |
Families and Households in Lowrys
Median Family Size in Lowrys
The median family size in Lowrys is 3.17 persons per family, with single male/father families (5 | 6.2%) accounting for the largest median family size of 4.2 persons per family. On the other hand, married-couple families (64 | 79.0%) represent the smallest median family size with 3.02 persons per family.
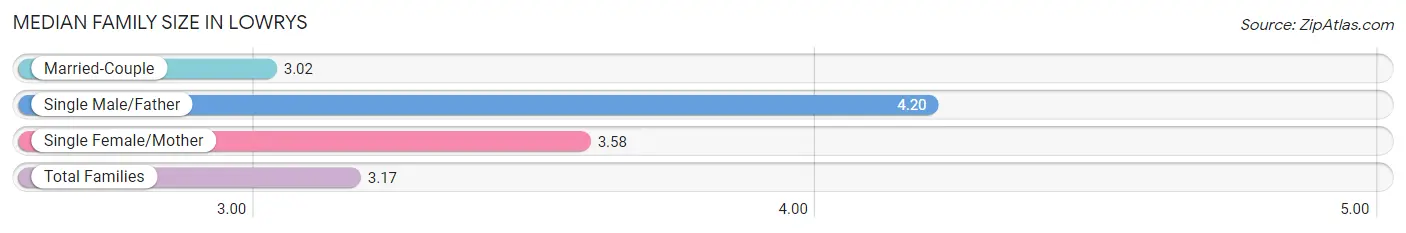
| Family Type | # Families | Family Size |
| Married-Couple | 64 (79.0%) | 3.02 |
| Single Male/Father | 5 (6.2%) | 4.20 |
| Single Female/Mother | 12 (14.8%) | 3.58 |
| Total Families | 81 (100.0%) | 3.17 |
Median Household Size in Lowrys
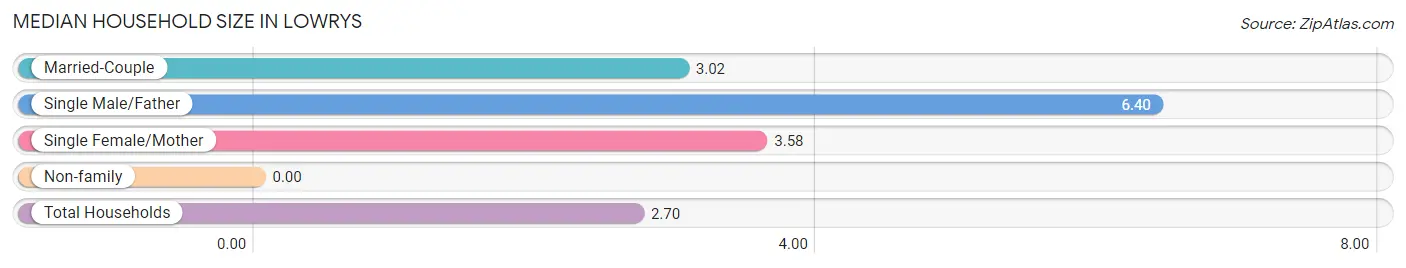
| Household Type | # Households | Household Size |
| Married-Couple | 64 (58.2%) | 3.02 |
| Single Male/Father | 5 (4.5%) | 6.40 |
| Single Female/Mother | 12 (10.9%) | 3.58 |
| Non-family | 29 (26.4%) | - |
| Total Households | 110 (100.0%) | 2.70 |
Household Size by Marriage Status in Lowrys
Out of a total of 110 households in Lowrys, 81 (73.6%) are family households, while 29 (26.4%) are nonfamily households. The most numerous type of family households are 2-person households, comprising 33, and the most common type of nonfamily households are 1-person households, comprising 29.
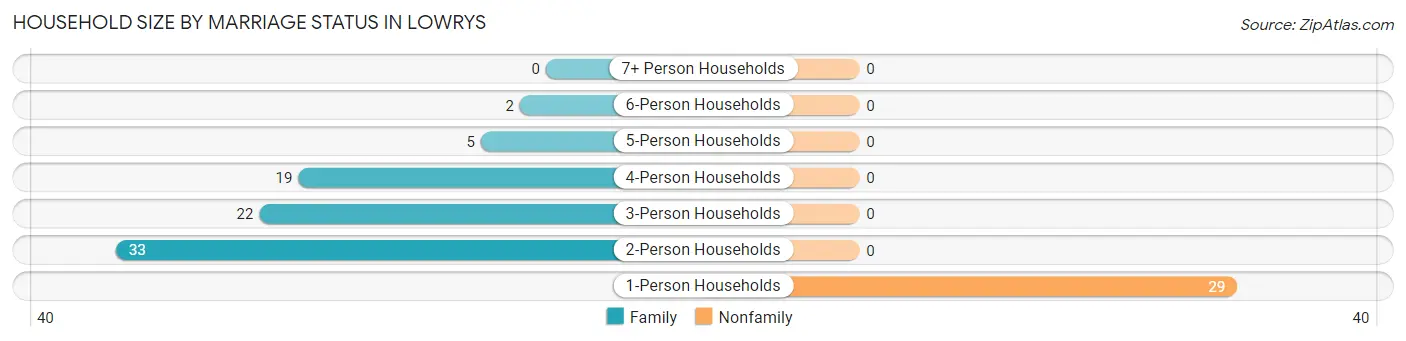
| Household Size | Family Households | Nonfamily Households |
| 1-Person Households | - | 29 (26.4%) |
| 2-Person Households | 33 (30.0%) | 0 (0.0%) |
| 3-Person Households | 22 (20.0%) | 0 (0.0%) |
| 4-Person Households | 19 (17.3%) | 0 (0.0%) |
| 5-Person Households | 5 (4.5%) | 0 (0.0%) |
| 6-Person Households | 2 (1.8%) | 0 (0.0%) |
| 7+ Person Households | 0 (0.0%) | 0 (0.0%) |
| Total | 81 (73.6%) | 29 (26.4%) |
Female Fertility in Lowrys
Fertility by Age in Lowrys
Average fertility rate in Lowrys is 180.0 births per 1,000 women. Women in the age bracket of 20 to 34 years have the highest fertility rate with 256.0 births per 1,000 women. Women in the age bracket of 20 to 34 years acount for 100.0% of all women with births.
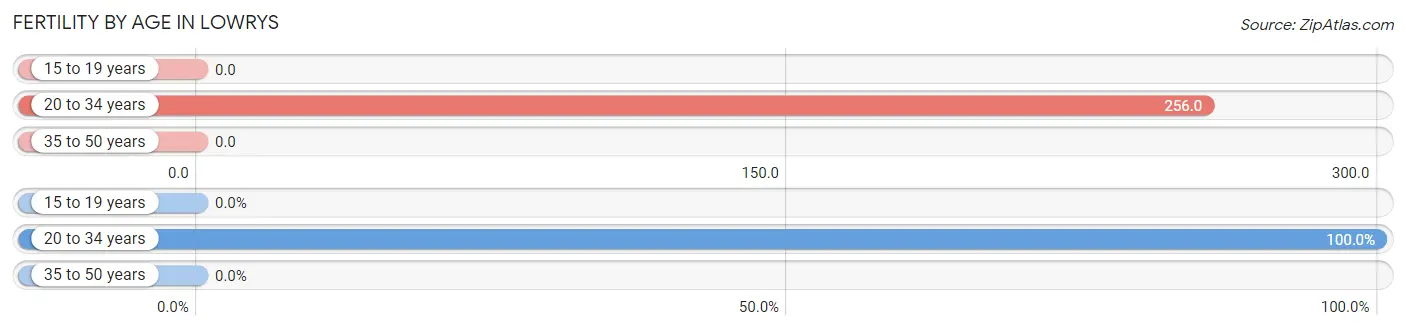
| Age Bracket | Women with Births | Births / 1,000 Women |
| 15 to 19 years | 0 (0.0%) | 0.0 |
| 20 to 34 years | 11 (100.0%) | 256.0 |
| 35 to 50 years | 0 (0.0%) | 0.0 |
| Total | 11 (100.0%) | 180.0 |
Fertility by Age by Marriage Status in Lowrys
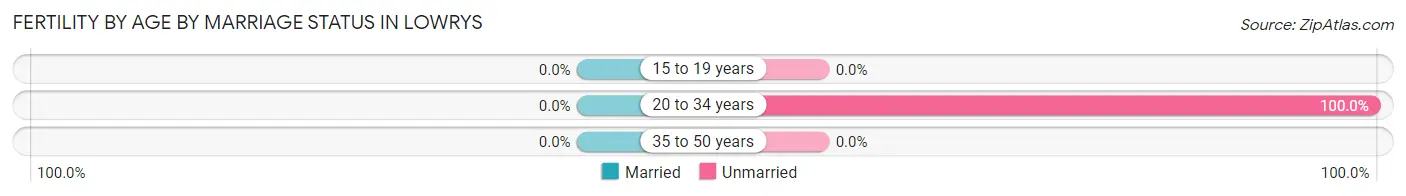
| Age Bracket | Married | Unmarried |
| 15 to 19 years | 0 (0.0%) | 0 (0.0%) |
| 20 to 34 years | 0 (0.0%) | 11 (100.0%) |
| 35 to 50 years | 0 (0.0%) | 0 (0.0%) |
| Total | 0 (0.0%) | 11 (100.0%) |
Fertility by Education in Lowrys
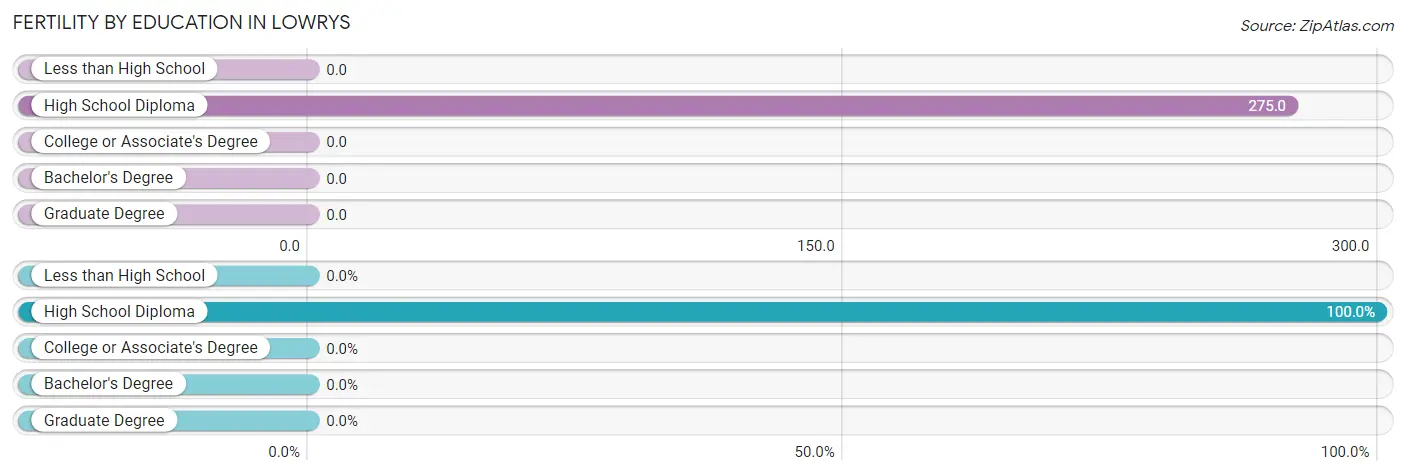
| Educational Attainment | Women with Births | Births / 1,000 Women |
| Less than High School | 0 (0.0%) | 0.0 |
| High School Diploma | 11 (100.0%) | 275.0 |
| College or Associate's Degree | 0 (0.0%) | 0.0 |
| Bachelor's Degree | 0 (0.0%) | 0.0 |
| Graduate Degree | 0 (0.0%) | 0.0 |
| Total | 11 (100.0%) | 180.0 |
Fertility by Education by Marriage Status in Lowrys
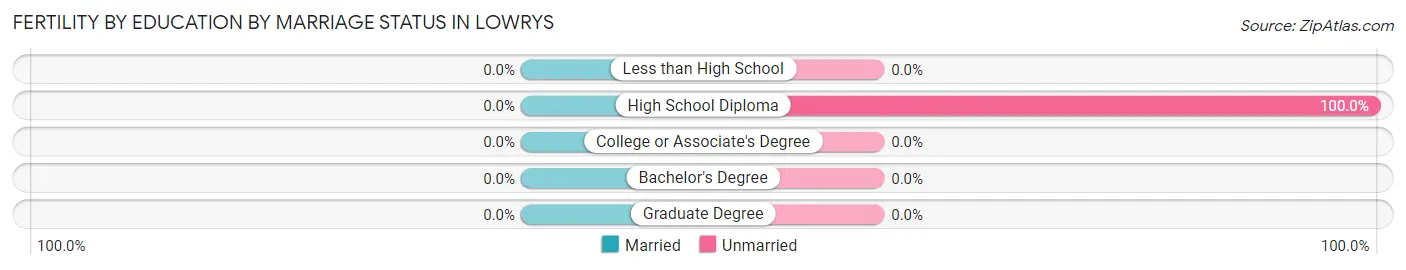
| Educational Attainment | Married | Unmarried |
| Less than High School | 0 (0.0%) | 0 (0.0%) |
| High School Diploma | 0 (0.0%) | 11 (100.0%) |
| College or Associate's Degree | 0 (0.0%) | 0 (0.0%) |
| Bachelor's Degree | 0 (0.0%) | 0 (0.0%) |
| Graduate Degree | 0 (0.0%) | 0 (0.0%) |
| Total | 0 (0.0%) | 11 (100.0%) |
Employment Characteristics in Lowrys
Employment by Class of Employer in Lowrys
Among the 108 employed individuals in Lowrys, private company employees (61 | 56.5%), self-employed (not incorporated) (16 | 14.8%), and local government employees (14 | 13.0%) make up the most common classes of employment.
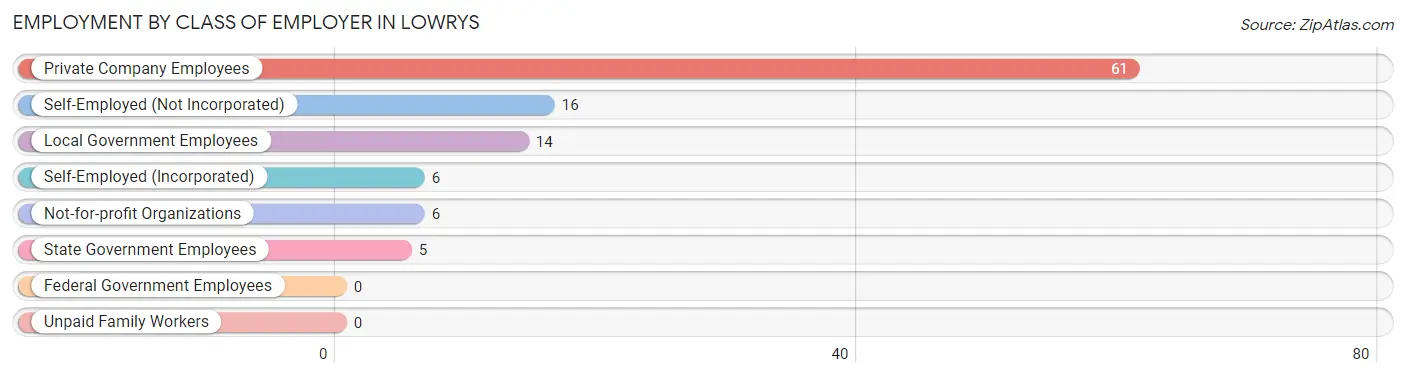
| Employer Class | # Employees | % Employees |
| Private Company Employees | 61 | 56.5% |
| Self-Employed (Incorporated) | 6 | 5.6% |
| Self-Employed (Not Incorporated) | 16 | 14.8% |
| Not-for-profit Organizations | 6 | 5.6% |
| Local Government Employees | 14 | 13.0% |
| State Government Employees | 5 | 4.6% |
| Federal Government Employees | 0 | 0.0% |
| Unpaid Family Workers | 0 | 0.0% |
| Total | 108 | 100.0% |
Employment Status by Age in Lowrys
According to the labor force statistics for Lowrys, out of the total population over 16 years of age (220), 50.9% or 112 individuals are in the labor force, with 3.6% or 4 of them unemployed. The age group with the highest labor force participation rate is 16 to 19 years, with 100.0% or 5 individuals in the labor force. Within the labor force, the 30 to 34 years age range has the highest percentage of unemployed individuals, with 28.6% or 4 of them being unemployed.
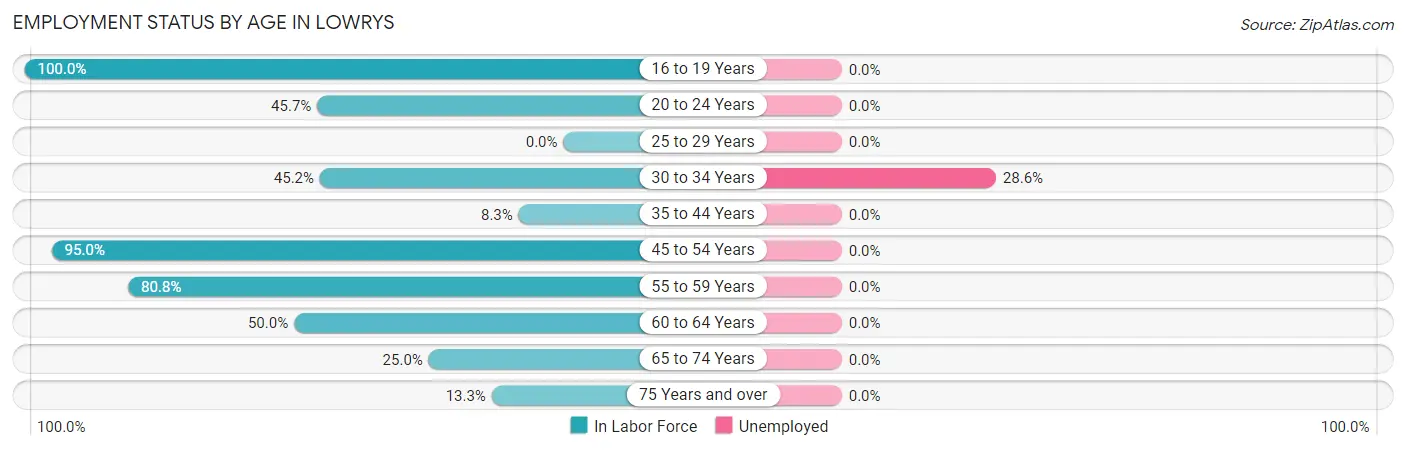
| Age Bracket | In Labor Force | Unemployed |
| 16 to 19 Years | 5 (100.0%) | 0 (0.0%) |
| 20 to 24 Years | 16 (45.7%) | 0 (0.0%) |
| 25 to 29 Years | 0 (0.0%) | 0 (0.0%) |
| 30 to 34 Years | 14 (45.2%) | 4 (28.6%) |
| 35 to 44 Years | 2 (8.3%) | 0 (0.0%) |
| 45 to 54 Years | 38 (95.0%) | 0 (0.0%) |
| 55 to 59 Years | 21 (80.8%) | 0 (0.0%) |
| 60 to 64 Years | 6 (50.0%) | 0 (0.0%) |
| 65 to 74 Years | 8 (25.0%) | 0 (0.0%) |
| 75 Years and over | 2 (13.3%) | 0 (0.0%) |
| Total | 112 (50.9%) | 4 (3.6%) |
Employment Status by Educational Attainment in Lowrys
According to labor force statistics for Lowrys, 60.9% of individuals (81) out of the total population between 25 and 64 years of age (133) are in the labor force, with 4.9% or 4 of them being unemployed. The group with the highest labor force participation rate are those with the educational attainment of college / associate degree, with 92.0% or 23 individuals in the labor force. Within the labor force, individuals with college / associate degree education have the highest percentage of unemployment, with 17.4% or 4 of them being unemployed.
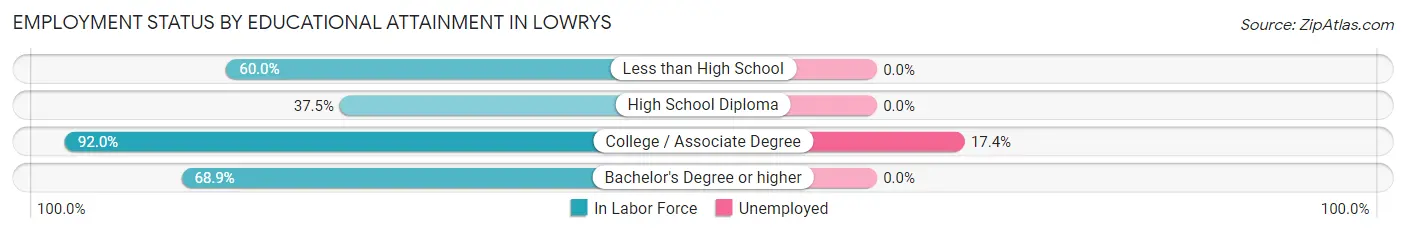
| Educational Attainment | In Labor Force | Unemployed |
| Less than High School | 9 (60.0%) | 0 (0.0%) |
| High School Diploma | 18 (37.5%) | 0 (0.0%) |
| College / Associate Degree | 23 (92.0%) | 4 (17.4%) |
| Bachelor's Degree or higher | 31 (68.9%) | 0 (0.0%) |
| Total | 81 (60.9%) | 7 (4.9%) |
Employment Occupations by Sex in Lowrys
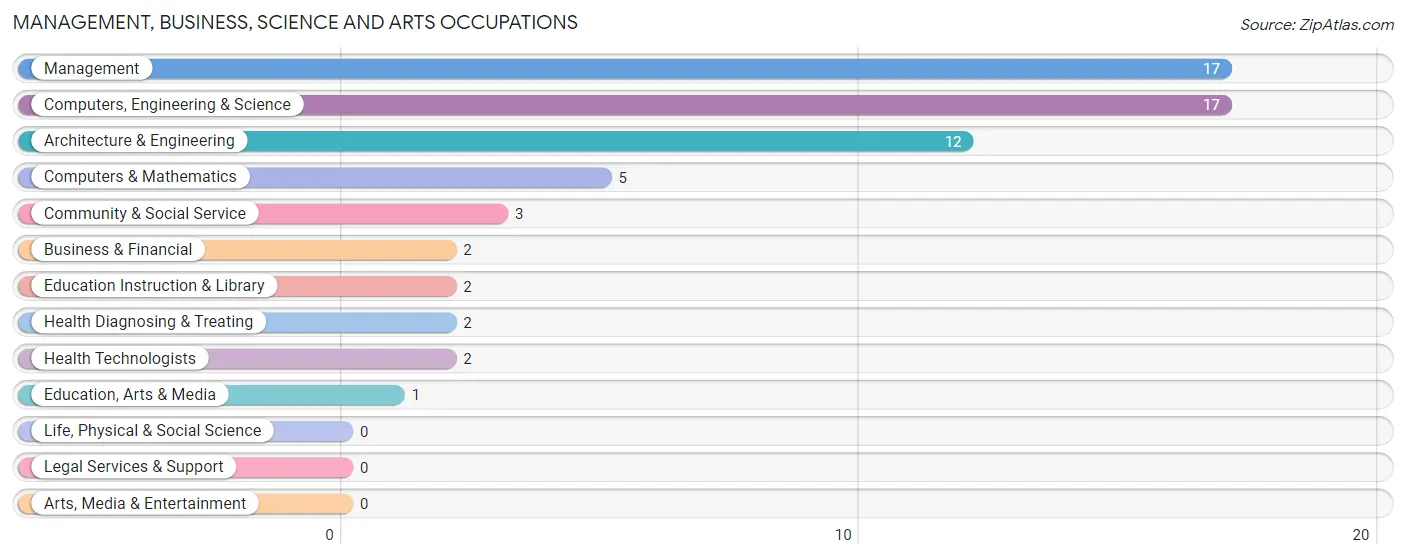
Management, Business, Science and Arts Occupations
The most common Management, Business, Science and Arts occupations in Lowrys are Management (17 | 15.7%), Computers, Engineering & Science (17 | 15.7%), Architecture & Engineering (12 | 11.1%), Computers & Mathematics (5 | 4.6%), and Community & Social Service (3 | 2.8%).
Management, Business, Science and Arts Occupations by Sex
Within the Management, Business, Science and Arts occupations in Lowrys, the most male-oriented occupations are Business & Financial (100.0%), Architecture & Engineering (100.0%), and Education, Arts & Media (100.0%), while the most female-oriented occupations are Computers & Mathematics (100.0%), Education Instruction & Library (100.0%), and Health Diagnosing & Treating (100.0%).
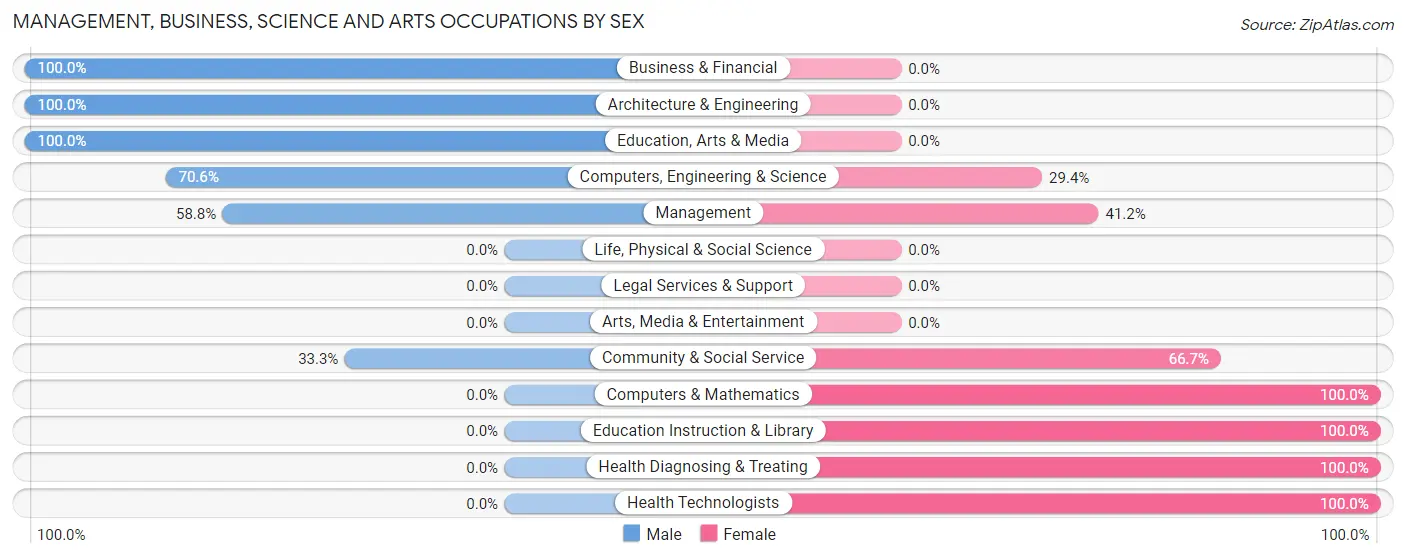
| Occupation | Male | Female |
| Management | 10 (58.8%) | 7 (41.2%) |
| Business & Financial | 2 (100.0%) | 0 (0.0%) |
| Computers, Engineering & Science | 12 (70.6%) | 5 (29.4%) |
| Computers & Mathematics | 0 (0.0%) | 5 (100.0%) |
| Architecture & Engineering | 12 (100.0%) | 0 (0.0%) |
| Life, Physical & Social Science | 0 (0.0%) | 0 (0.0%) |
| Community & Social Service | 1 (33.3%) | 2 (66.7%) |
| Education, Arts & Media | 1 (100.0%) | 0 (0.0%) |
| Legal Services & Support | 0 (0.0%) | 0 (0.0%) |
| Education Instruction & Library | 0 (0.0%) | 2 (100.0%) |
| Arts, Media & Entertainment | 0 (0.0%) | 0 (0.0%) |
| Health Diagnosing & Treating | 0 (0.0%) | 2 (100.0%) |
| Health Technologists | 0 (0.0%) | 2 (100.0%) |
| Total (Category) | 25 (61.0%) | 16 (39.0%) |
| Total (Overall) | 65 (60.2%) | 43 (39.8%) |
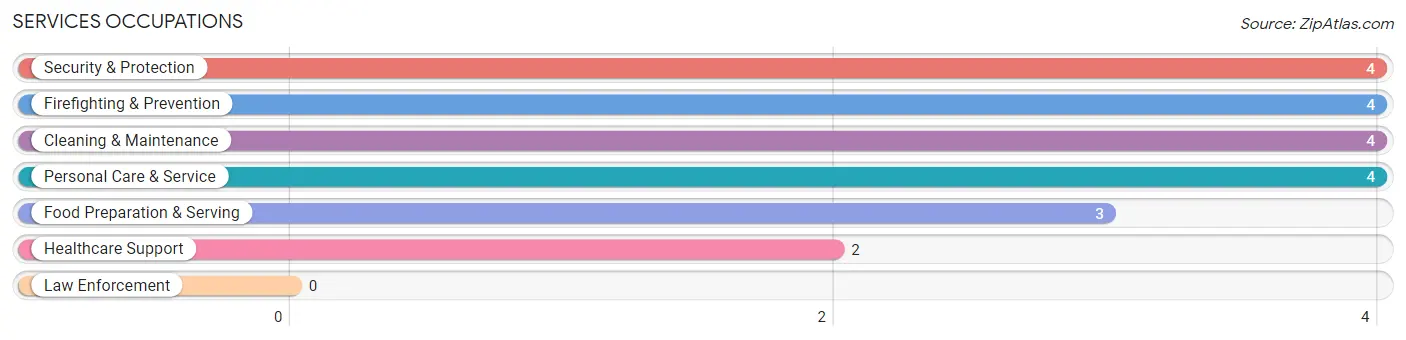
Services Occupations
The most common Services occupations in Lowrys are Security & Protection (4 | 3.7%), Firefighting & Prevention (4 | 3.7%), Cleaning & Maintenance (4 | 3.7%), Personal Care & Service (4 | 3.7%), and Food Preparation & Serving (3 | 2.8%).
Services Occupations by Sex
Within the Services occupations in Lowrys, the most male-oriented occupations are Security & Protection (100.0%), Firefighting & Prevention (100.0%), and Food Preparation & Serving (100.0%), while the most female-oriented occupations are Healthcare Support (100.0%), Personal Care & Service (100.0%), and Cleaning & Maintenance (25.0%).
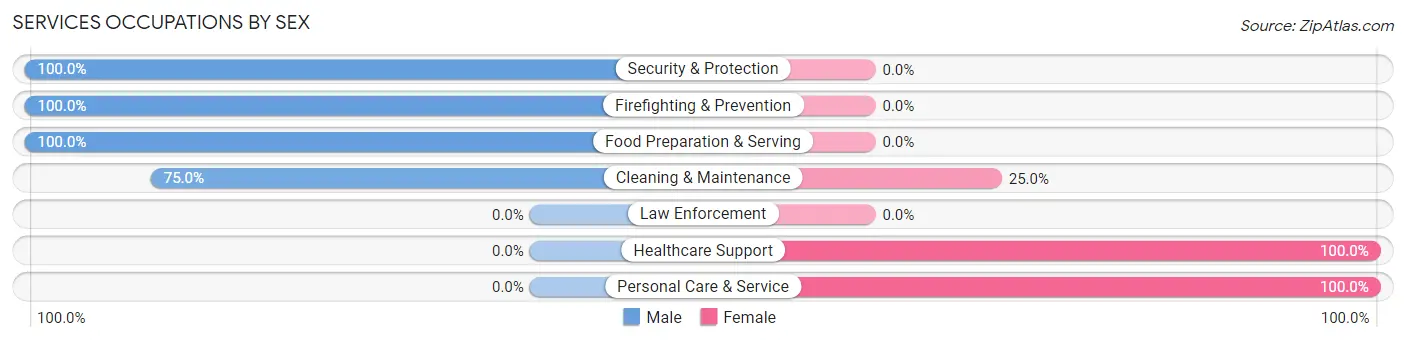
| Occupation | Male | Female |
| Healthcare Support | 0 (0.0%) | 2 (100.0%) |
| Security & Protection | 4 (100.0%) | 0 (0.0%) |
| Firefighting & Prevention | 4 (100.0%) | 0 (0.0%) |
| Law Enforcement | 0 (0.0%) | 0 (0.0%) |
| Food Preparation & Serving | 3 (100.0%) | 0 (0.0%) |
| Cleaning & Maintenance | 3 (75.0%) | 1 (25.0%) |
| Personal Care & Service | 0 (0.0%) | 4 (100.0%) |
| Total (Category) | 10 (58.8%) | 7 (41.2%) |
| Total (Overall) | 65 (60.2%) | 43 (39.8%) |
Sales and Office Occupations
The most common Sales and Office occupations in Lowrys are Office & Administration (17 | 15.7%), and Sales & Related (6 | 5.6%).
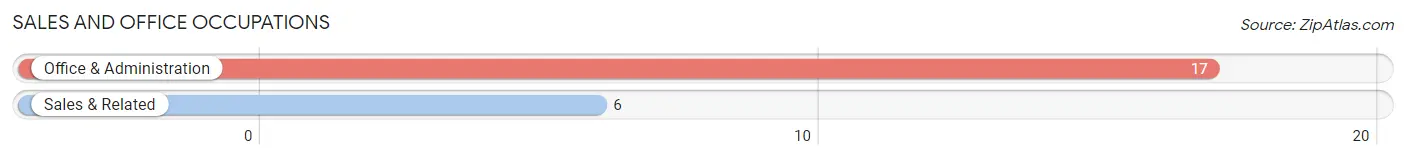
Sales and Office Occupations by Sex
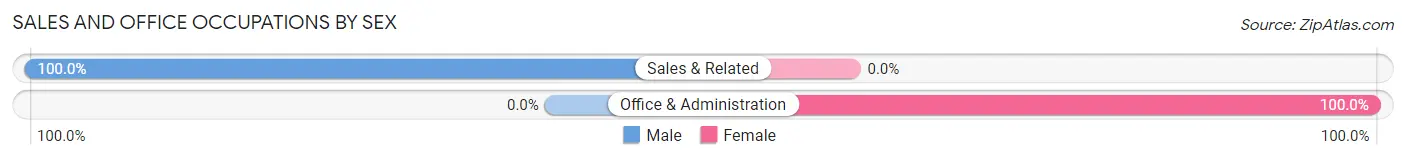
| Occupation | Male | Female |
| Sales & Related | 6 (100.0%) | 0 (0.0%) |
| Office & Administration | 0 (0.0%) | 17 (100.0%) |
| Total (Category) | 6 (26.1%) | 17 (73.9%) |
| Total (Overall) | 65 (60.2%) | 43 (39.8%) |
Natural Resources, Construction and Maintenance Occupations
The most common Natural Resources, Construction and Maintenance occupations in Lowrys are Farming, Fishing & Forestry (6 | 5.6%), Construction & Extraction (2 | 1.8%), and Installation, Maintenance & Repair (2 | 1.8%).
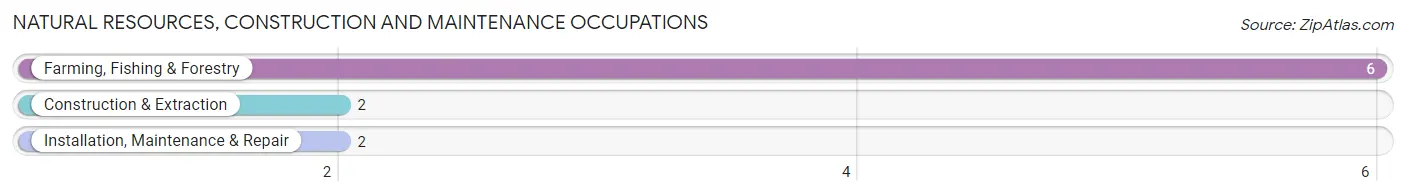
Natural Resources, Construction and Maintenance Occupations by Sex
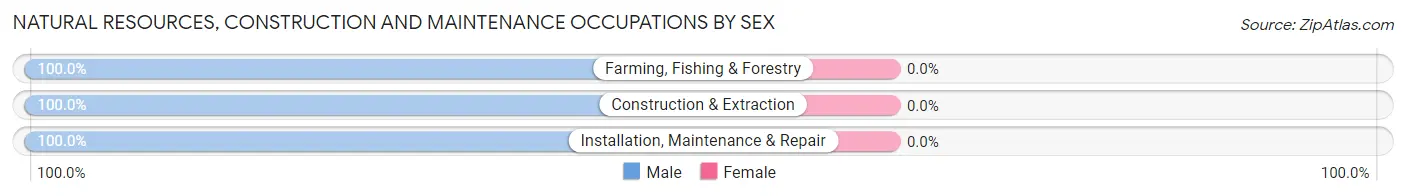
| Occupation | Male | Female |
| Farming, Fishing & Forestry | 6 (100.0%) | 0 (0.0%) |
| Construction & Extraction | 2 (100.0%) | 0 (0.0%) |
| Installation, Maintenance & Repair | 2 (100.0%) | 0 (0.0%) |
| Total (Category) | 10 (100.0%) | 0 (0.0%) |
| Total (Overall) | 65 (60.2%) | 43 (39.8%) |
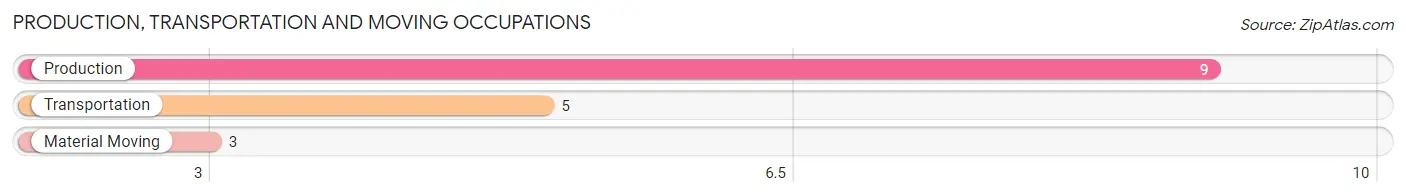
Production, Transportation and Moving Occupations
The most common Production, Transportation and Moving occupations in Lowrys are Production (9 | 8.3%), Transportation (5 | 4.6%), and Material Moving (3 | 2.8%).
Production, Transportation and Moving Occupations by Sex
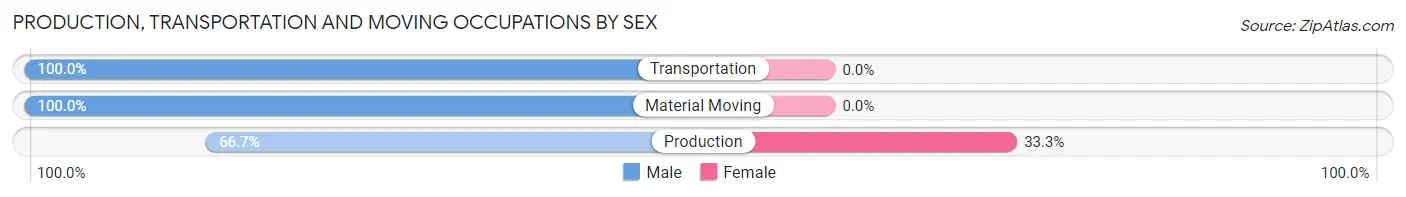
| Occupation | Male | Female |
| Production | 6 (66.7%) | 3 (33.3%) |
| Transportation | 5 (100.0%) | 0 (0.0%) |
| Material Moving | 3 (100.0%) | 0 (0.0%) |
| Total (Category) | 14 (82.4%) | 3 (17.6%) |
| Total (Overall) | 65 (60.2%) | 43 (39.8%) |
Employment Industries by Sex in Lowrys
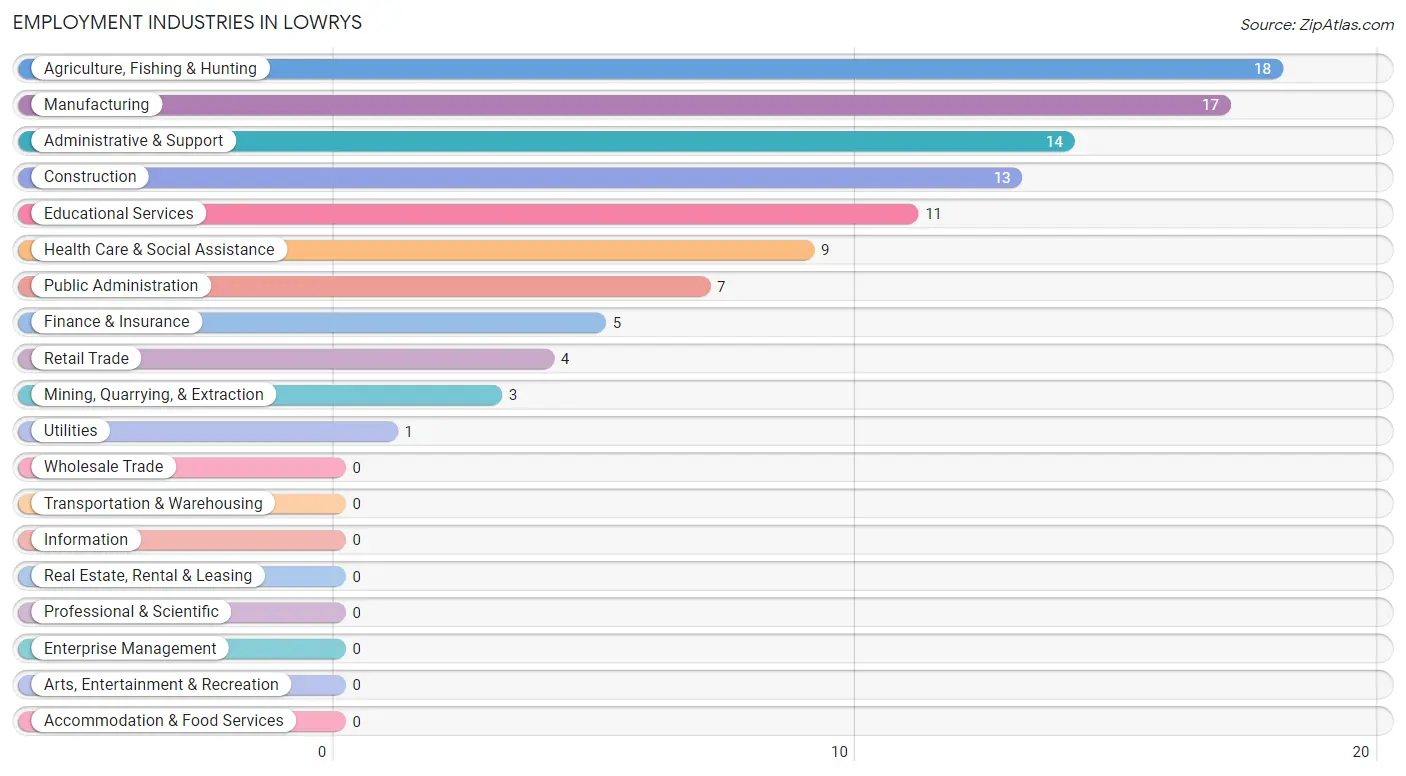
Employment Industries in Lowrys
The major employment industries in Lowrys include Agriculture, Fishing & Hunting (18 | 16.7%), Manufacturing (17 | 15.7%), Administrative & Support (14 | 13.0%), Construction (13 | 12.0%), and Educational Services (11 | 10.2%).
Employment Industries by Sex in Lowrys
The Lowrys industries that see more men than women are Mining, Quarrying, & Extraction (100.0%), Retail Trade (100.0%), and Administrative & Support (85.7%), whereas the industries that tend to have a higher number of women are Utilities (100.0%), Health Care & Social Assistance (100.0%), and Public Administration (100.0%).
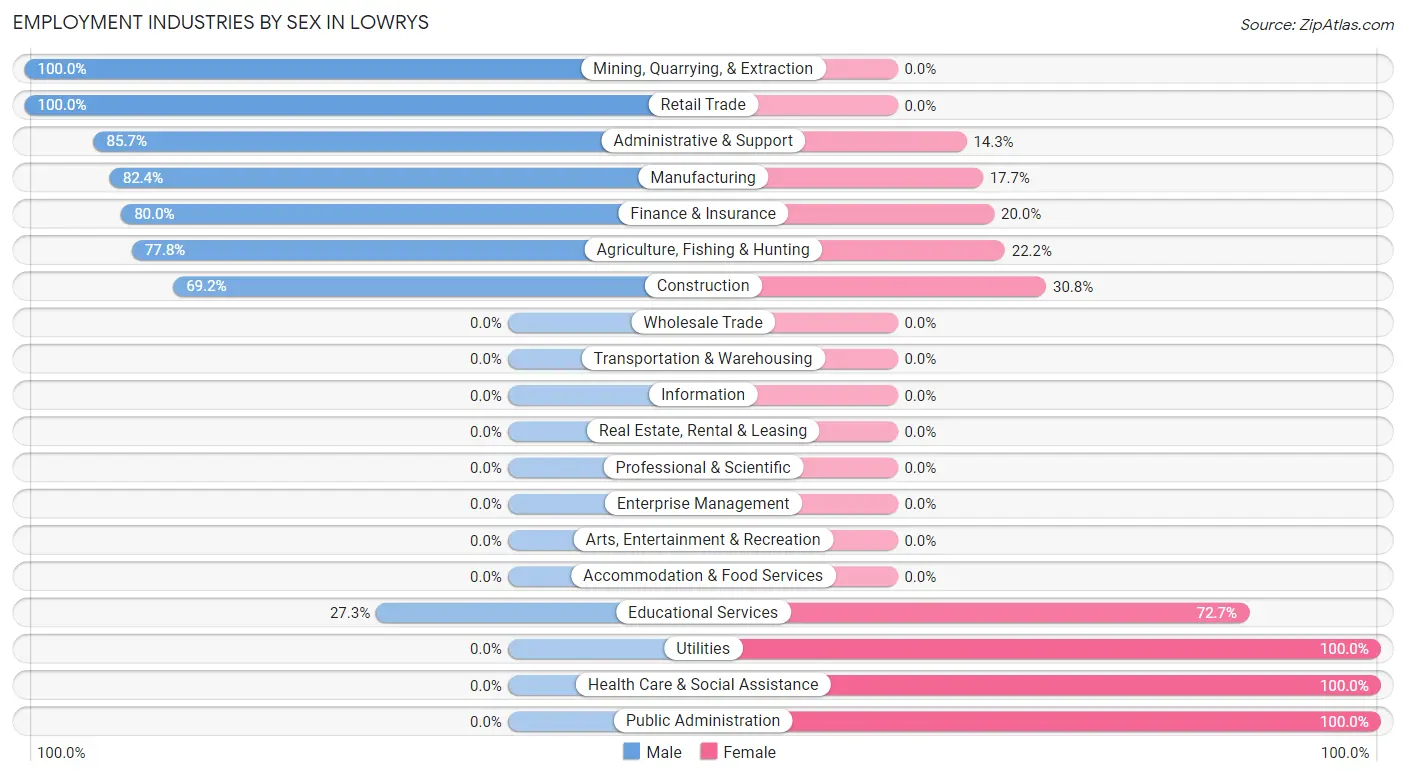
| Industry | Male | Female |
| Agriculture, Fishing & Hunting | 14 (77.8%) | 4 (22.2%) |
| Mining, Quarrying, & Extraction | 3 (100.0%) | 0 (0.0%) |
| Construction | 9 (69.2%) | 4 (30.8%) |
| Manufacturing | 14 (82.4%) | 3 (17.6%) |
| Wholesale Trade | 0 (0.0%) | 0 (0.0%) |
| Retail Trade | 4 (100.0%) | 0 (0.0%) |
| Transportation & Warehousing | 0 (0.0%) | 0 (0.0%) |
| Utilities | 0 (0.0%) | 1 (100.0%) |
| Information | 0 (0.0%) | 0 (0.0%) |
| Finance & Insurance | 4 (80.0%) | 1 (20.0%) |
| Real Estate, Rental & Leasing | 0 (0.0%) | 0 (0.0%) |
| Professional & Scientific | 0 (0.0%) | 0 (0.0%) |
| Enterprise Management | 0 (0.0%) | 0 (0.0%) |
| Administrative & Support | 12 (85.7%) | 2 (14.3%) |
| Educational Services | 3 (27.3%) | 8 (72.7%) |
| Health Care & Social Assistance | 0 (0.0%) | 9 (100.0%) |
| Arts, Entertainment & Recreation | 0 (0.0%) | 0 (0.0%) |
| Accommodation & Food Services | 0 (0.0%) | 0 (0.0%) |
| Public Administration | 0 (0.0%) | 7 (100.0%) |
| Total | 65 (60.2%) | 43 (39.8%) |
Education in Lowrys
School Enrollment in Lowrys
The most common levels of schooling among the 78 students in Lowrys are middle school (26 | 33.3%), high school (21 | 26.9%), and elementary school (12 | 15.4%).
| School Level | # Students | % Students |
| Nursery / Preschool | 5 | 6.4% |
| Kindergarten | 0 | 0.0% |
| Elementary School | 12 | 15.4% |
| Middle School | 26 | 33.3% |
| High School | 21 | 26.9% |
| College / Undergraduate | 12 | 15.4% |
| Graduate / Professional | 2 | 2.6% |
| Total | 78 | 100.0% |
School Enrollment by Age by Funding Source in Lowrys
Out of a total of 78 students who are enrolled in schools in Lowrys, 4 (5.1%) attend a private institution, while the remaining 74 (94.9%) are enrolled in public schools. The age group of 25 to 34 year olds has the highest likelihood of being enrolled in private schools, with 2 (33.3% in the age bracket) enrolled. Conversely, the age group of 3 to 4 year olds has the lowest likelihood of being enrolled in a private school, with 5 (100.0% in the age bracket) attending a public institution.
| Age Bracket | Public School | Private School |
| 3 to 4 Year Olds | 5 (100.0%) | 0 (0.0%) |
| 5 to 9 Year Old | 12 (100.0%) | 0 (0.0%) |
| 10 to 14 Year Olds | 30 (100.0%) | 0 (0.0%) |
| 15 to 17 Year Olds | 12 (100.0%) | 0 (0.0%) |
| 18 to 19 Year Olds | 5 (100.0%) | 0 (0.0%) |
| 20 to 24 Year Olds | 6 (75.0%) | 2 (25.0%) |
| 25 to 34 Year Olds | 4 (66.7%) | 2 (33.3%) |
| 35 Years and over | 0 (0.0%) | 0 (0.0%) |
| Total | 74 (94.9%) | 4 (5.1%) |
Educational Attainment by Field of Study in Lowrys
Engineering (24 | 46.2%), education (11 | 21.1%), visual & performing arts (4 | 7.7%), communications (4 | 7.7%), and multidisciplinary studies (3 | 5.8%) are the most common fields of study among 52 individuals in Lowrys who have obtained a bachelor's degree or higher.
| Field of Study | # Graduates | % Graduates |
| Computers & Mathematics | 0 | 0.0% |
| Bio, Nature & Agricultural | 0 | 0.0% |
| Physical & Health Sciences | 0 | 0.0% |
| Psychology | 0 | 0.0% |
| Social Sciences | 0 | 0.0% |
| Engineering | 24 | 46.2% |
| Multidisciplinary Studies | 3 | 5.8% |
| Science & Technology | 2 | 3.8% |
| Business | 0 | 0.0% |
| Education | 11 | 21.1% |
| Literature & Languages | 2 | 3.8% |
| Liberal Arts & History | 2 | 3.8% |
| Visual & Performing Arts | 4 | 7.7% |
| Communications | 4 | 7.7% |
| Arts & Humanities | 0 | 0.0% |
| Total | 52 | 100.0% |
Transportation & Commute in Lowrys
Vehicle Availability by Sex in Lowrys
The most prevalent vehicle ownership categories in Lowrys are males with 2 vehicles (18, accounting for 27.7%) and females with 2 vehicles (11, making up 41.9%).
| Vehicles Available | Male | Female |
| No Vehicle | 0 (0.0%) | 0 (0.0%) |
| 1 Vehicle | 10 (15.4%) | 7 (16.3%) |
| 2 Vehicles | 18 (27.7%) | 11 (25.6%) |
| 3 Vehicles | 13 (20.0%) | 14 (32.6%) |
| 4 Vehicles | 9 (13.9%) | 2 (4.6%) |
| 5 or more Vehicles | 15 (23.1%) | 9 (20.9%) |
| Total | 65 (100.0%) | 43 (100.0%) |
Commute Time in Lowrys
The most frequently occuring commute durations in Lowrys are 45 to 59 minutes (21 commuters, 19.4%), 10 to 14 minutes (20 commuters, 18.5%), and 5 to 9 minutes (19 commuters, 17.6%).
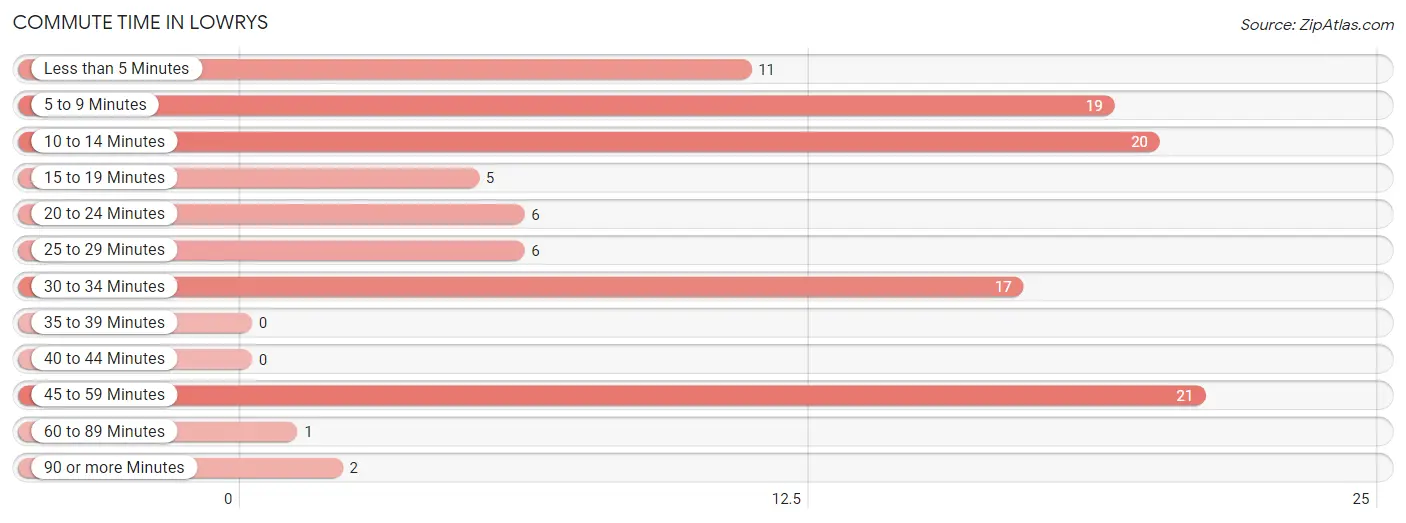
| Commute Time | # Commuters | % Commuters |
| Less than 5 Minutes | 11 | 10.2% |
| 5 to 9 Minutes | 19 | 17.6% |
| 10 to 14 Minutes | 20 | 18.5% |
| 15 to 19 Minutes | 5 | 4.6% |
| 20 to 24 Minutes | 6 | 5.6% |
| 25 to 29 Minutes | 6 | 5.6% |
| 30 to 34 Minutes | 17 | 15.7% |
| 35 to 39 Minutes | 0 | 0.0% |
| 40 to 44 Minutes | 0 | 0.0% |
| 45 to 59 Minutes | 21 | 19.4% |
| 60 to 89 Minutes | 1 | 0.9% |
| 90 or more Minutes | 2 | 1.8% |
Commute Time by Sex in Lowrys
The most common commute times in Lowrys are 5 to 9 minutes (15 commuters, 23.1%) for males and 45 to 59 minutes (8 commuters, 18.6%) for females.
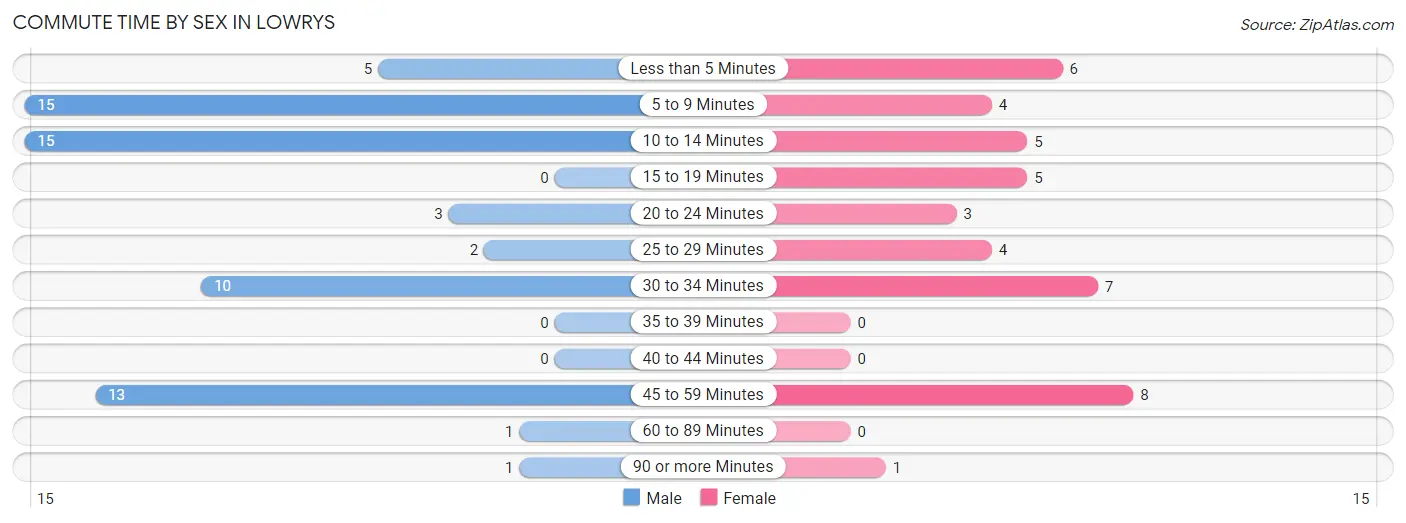
| Commute Time | Male | Female |
| Less than 5 Minutes | 5 (7.7%) | 6 (14.0%) |
| 5 to 9 Minutes | 15 (23.1%) | 4 (9.3%) |
| 10 to 14 Minutes | 15 (23.1%) | 5 (11.6%) |
| 15 to 19 Minutes | 0 (0.0%) | 5 (11.6%) |
| 20 to 24 Minutes | 3 (4.6%) | 3 (7.0%) |
| 25 to 29 Minutes | 2 (3.1%) | 4 (9.3%) |
| 30 to 34 Minutes | 10 (15.4%) | 7 (16.3%) |
| 35 to 39 Minutes | 0 (0.0%) | 0 (0.0%) |
| 40 to 44 Minutes | 0 (0.0%) | 0 (0.0%) |
| 45 to 59 Minutes | 13 (20.0%) | 8 (18.6%) |
| 60 to 89 Minutes | 1 (1.5%) | 0 (0.0%) |
| 90 or more Minutes | 1 (1.5%) | 1 (2.3%) |
Time of Departure to Work by Sex in Lowrys
The most frequent times of departure to work in Lowrys are 5:30 AM to 5:59 AM (14, 21.5%) for males and 8:00 AM to 8:29 AM (11, 25.6%) for females.
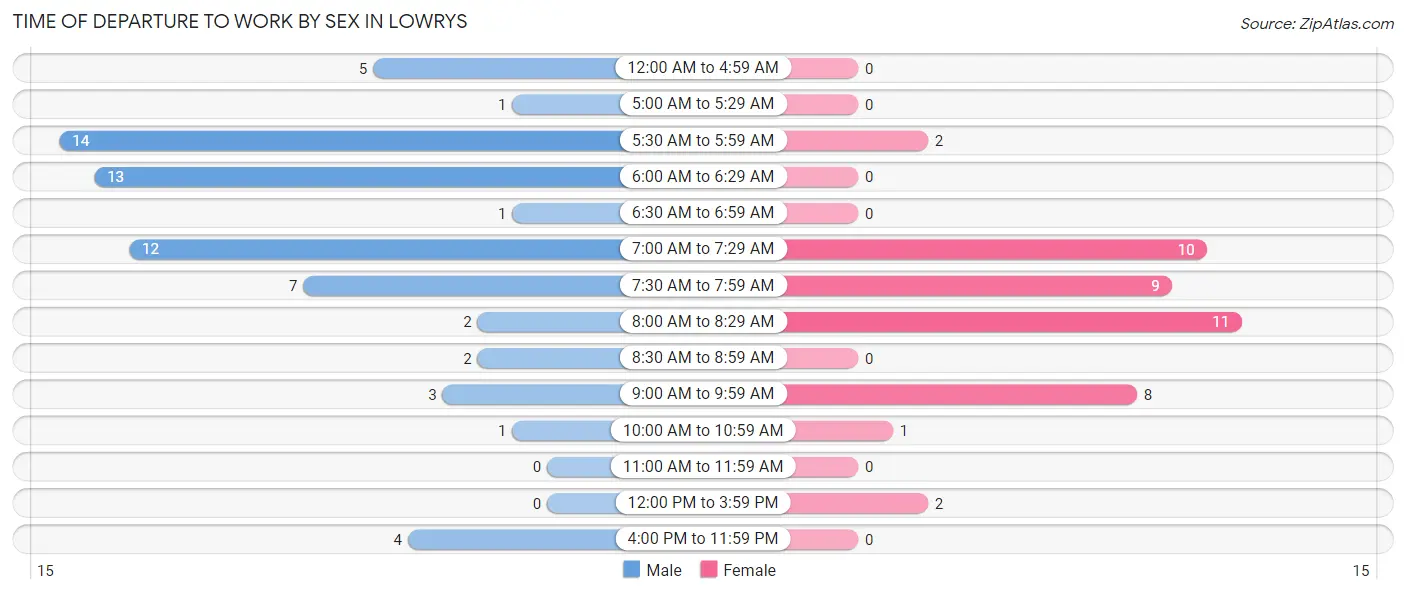
| Time of Departure | Male | Female |
| 12:00 AM to 4:59 AM | 5 (7.7%) | 0 (0.0%) |
| 5:00 AM to 5:29 AM | 1 (1.5%) | 0 (0.0%) |
| 5:30 AM to 5:59 AM | 14 (21.5%) | 2 (4.6%) |
| 6:00 AM to 6:29 AM | 13 (20.0%) | 0 (0.0%) |
| 6:30 AM to 6:59 AM | 1 (1.5%) | 0 (0.0%) |
| 7:00 AM to 7:29 AM | 12 (18.5%) | 10 (23.3%) |
| 7:30 AM to 7:59 AM | 7 (10.8%) | 9 (20.9%) |
| 8:00 AM to 8:29 AM | 2 (3.1%) | 11 (25.6%) |
| 8:30 AM to 8:59 AM | 2 (3.1%) | 0 (0.0%) |
| 9:00 AM to 9:59 AM | 3 (4.6%) | 8 (18.6%) |
| 10:00 AM to 10:59 AM | 1 (1.5%) | 1 (2.3%) |
| 11:00 AM to 11:59 AM | 0 (0.0%) | 0 (0.0%) |
| 12:00 PM to 3:59 PM | 0 (0.0%) | 2 (4.6%) |
| 4:00 PM to 11:59 PM | 4 (6.1%) | 0 (0.0%) |
| Total | 65 (100.0%) | 43 (100.0%) |
Housing Occupancy in Lowrys
Occupancy by Ownership in Lowrys
Of the total 110 dwellings in Lowrys, owner-occupied units account for 92 (83.6%), while renter-occupied units make up 18 (16.4%).
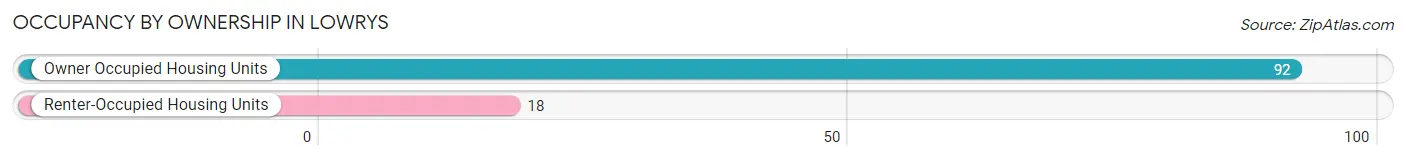
| Occupancy | # Housing Units | % Housing Units |
| Owner Occupied Housing Units | 92 | 83.6% |
| Renter-Occupied Housing Units | 18 | 16.4% |
| Total Occupied Housing Units | 110 | 100.0% |
Occupancy by Household Size in Lowrys
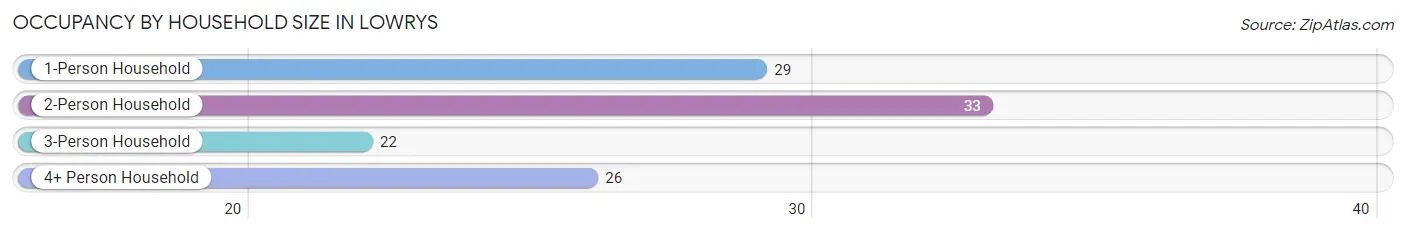
| Household Size | # Housing Units | % Housing Units |
| 1-Person Household | 29 | 26.4% |
| 2-Person Household | 33 | 30.0% |
| 3-Person Household | 22 | 20.0% |
| 4+ Person Household | 26 | 23.6% |
| Total Housing Units | 110 | 100.0% |
Occupancy by Ownership by Household Size in Lowrys
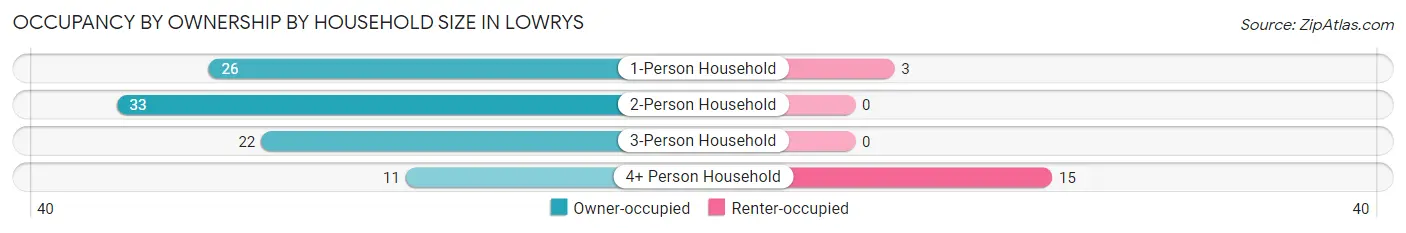
| Household Size | Owner-occupied | Renter-occupied |
| 1-Person Household | 26 (89.7%) | 3 (10.3%) |
| 2-Person Household | 33 (100.0%) | 0 (0.0%) |
| 3-Person Household | 22 (100.0%) | 0 (0.0%) |
| 4+ Person Household | 11 (42.3%) | 15 (57.7%) |
| Total Housing Units | 92 (83.6%) | 18 (16.4%) |
Occupancy by Educational Attainment in Lowrys
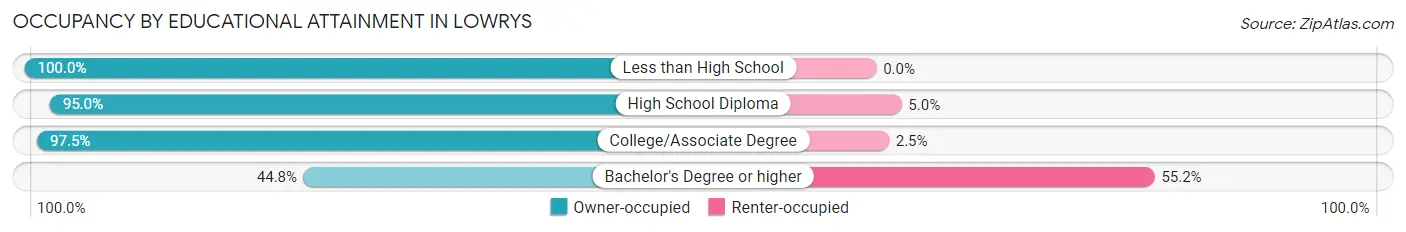
| Household Size | Owner-occupied | Renter-occupied |
| Less than High School | 21 (100.0%) | 0 (0.0%) |
| High School Diploma | 19 (95.0%) | 1 (5.0%) |
| College/Associate Degree | 39 (97.5%) | 1 (2.5%) |
| Bachelor's Degree or higher | 13 (44.8%) | 16 (55.2%) |
Occupancy by Age of Householder in Lowrys
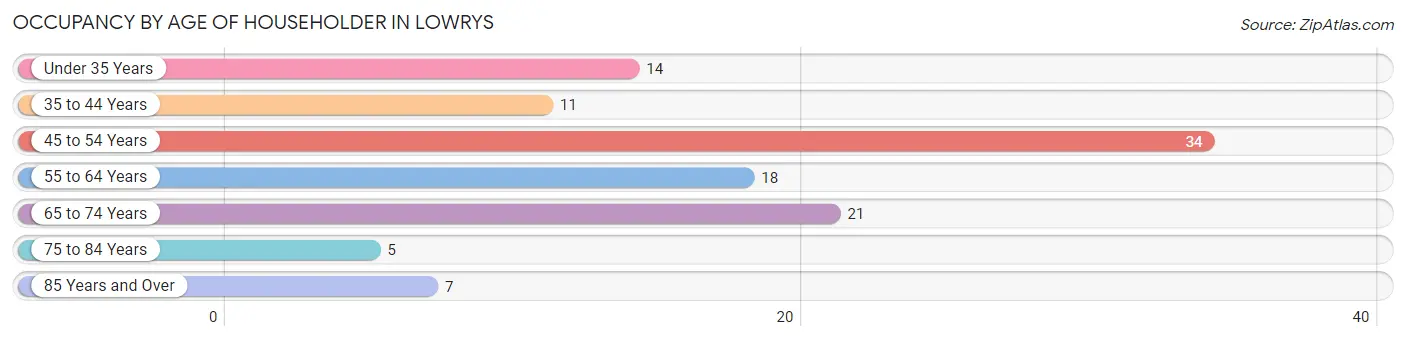
| Age Bracket | # Households | % Households |
| Under 35 Years | 14 | 12.7% |
| 35 to 44 Years | 11 | 10.0% |
| 45 to 54 Years | 34 | 30.9% |
| 55 to 64 Years | 18 | 16.4% |
| 65 to 74 Years | 21 | 19.1% |
| 75 to 84 Years | 5 | 4.5% |
| 85 Years and Over | 7 | 6.4% |
| Total | 110 | 100.0% |
Housing Finances in Lowrys
Median Income by Occupancy in Lowrys
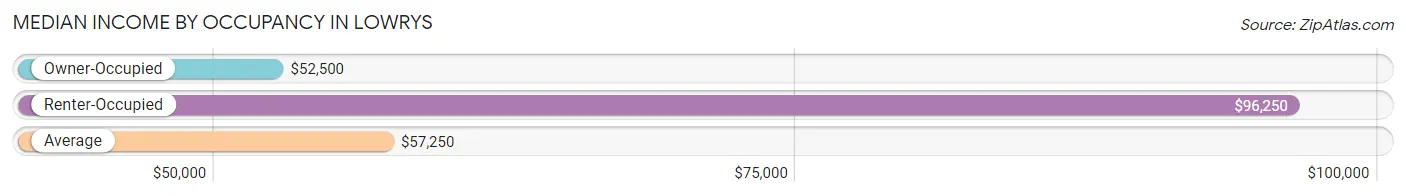
| Occupancy Type | # Households | Median Income |
| Owner-Occupied | 92 (83.6%) | $52,500 |
| Renter-Occupied | 18 (16.4%) | $96,250 |
| Average | 110 (100.0%) | $57,250 |
Occupancy by Householder Income Bracket in Lowrys
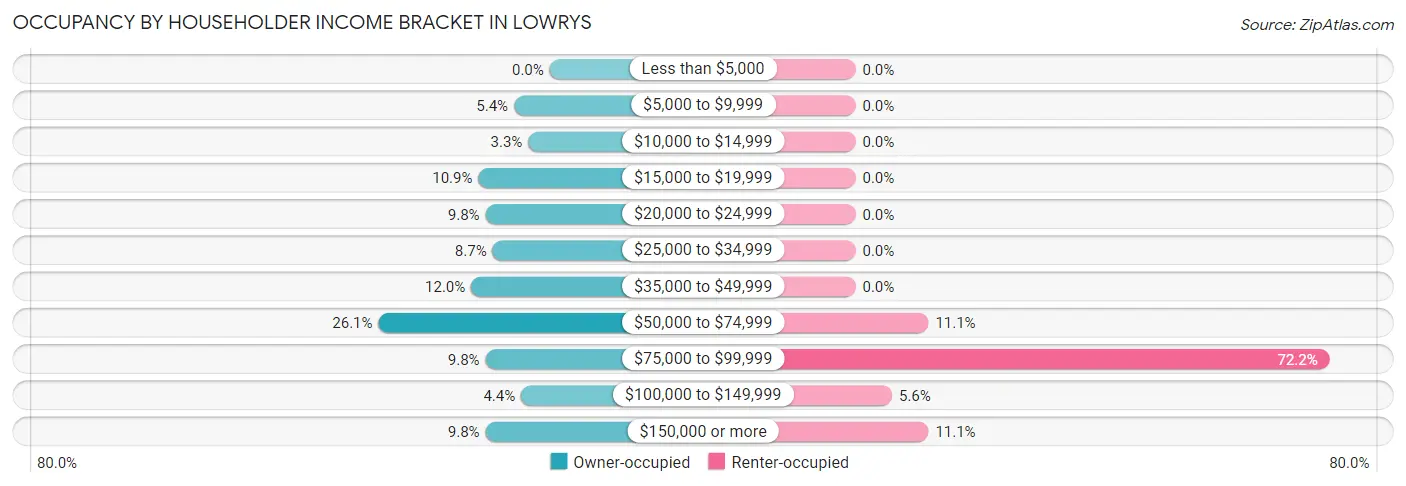
| Income Bracket | Owner-occupied | Renter-occupied |
| Less than $5,000 | 0 (0.0%) | 0 (0.0%) |
| $5,000 to $9,999 | 5 (5.4%) | 0 (0.0%) |
| $10,000 to $14,999 | 3 (3.3%) | 0 (0.0%) |
| $15,000 to $19,999 | 10 (10.9%) | 0 (0.0%) |
| $20,000 to $24,999 | 9 (9.8%) | 0 (0.0%) |
| $25,000 to $34,999 | 8 (8.7%) | 0 (0.0%) |
| $35,000 to $49,999 | 11 (12.0%) | 0 (0.0%) |
| $50,000 to $74,999 | 24 (26.1%) | 2 (11.1%) |
| $75,000 to $99,999 | 9 (9.8%) | 13 (72.2%) |
| $100,000 to $149,999 | 4 (4.3%) | 1 (5.6%) |
| $150,000 or more | 9 (9.8%) | 2 (11.1%) |
| Total | 92 (100.0%) | 18 (100.0%) |
Monthly Housing Cost Tiers in Lowrys
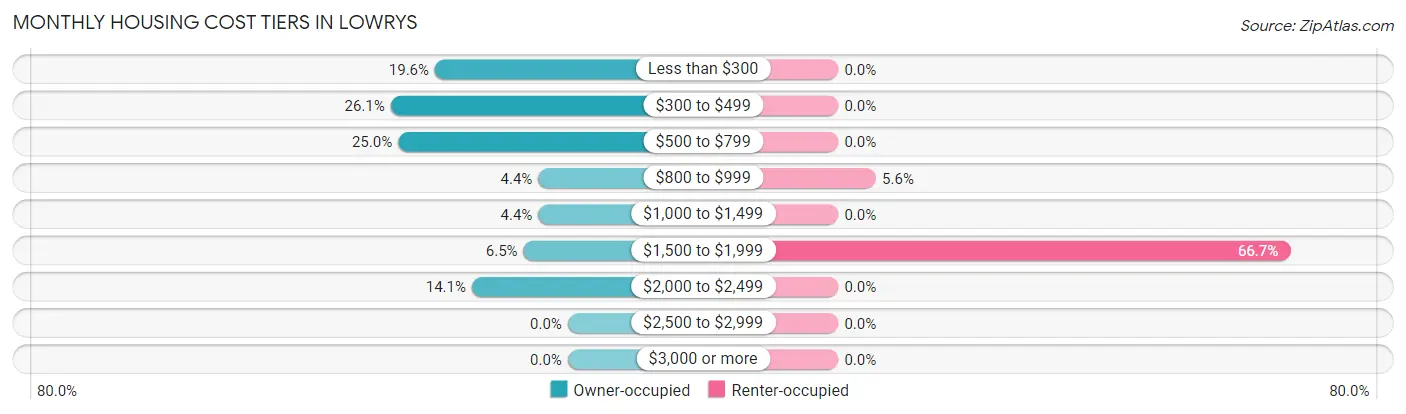
| Monthly Cost | Owner-occupied | Renter-occupied |
| Less than $300 | 18 (19.6%) | 0 (0.0%) |
| $300 to $499 | 24 (26.1%) | 0 (0.0%) |
| $500 to $799 | 23 (25.0%) | 0 (0.0%) |
| $800 to $999 | 4 (4.3%) | 1 (5.6%) |
| $1,000 to $1,499 | 4 (4.3%) | 0 (0.0%) |
| $1,500 to $1,999 | 6 (6.5%) | 12 (66.7%) |
| $2,000 to $2,499 | 13 (14.1%) | 0 (0.0%) |
| $2,500 to $2,999 | 0 (0.0%) | 0 (0.0%) |
| $3,000 or more | 0 (0.0%) | 0 (0.0%) |
| Total | 92 (100.0%) | 18 (100.0%) |
Physical Housing Characteristics in Lowrys
Housing Structures in Lowrys
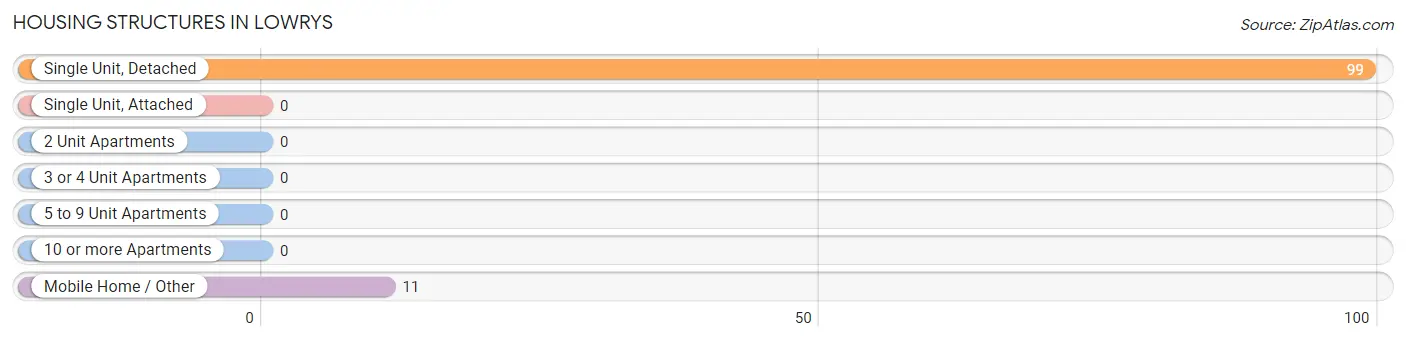
| Structure Type | # Housing Units | % Housing Units |
| Single Unit, Detached | 99 | 90.0% |
| Single Unit, Attached | 0 | 0.0% |
| 2 Unit Apartments | 0 | 0.0% |
| 3 or 4 Unit Apartments | 0 | 0.0% |
| 5 to 9 Unit Apartments | 0 | 0.0% |
| 10 or more Apartments | 0 | 0.0% |
| Mobile Home / Other | 11 | 10.0% |
| Total | 110 | 100.0% |
Housing Structures by Occupancy in Lowrys
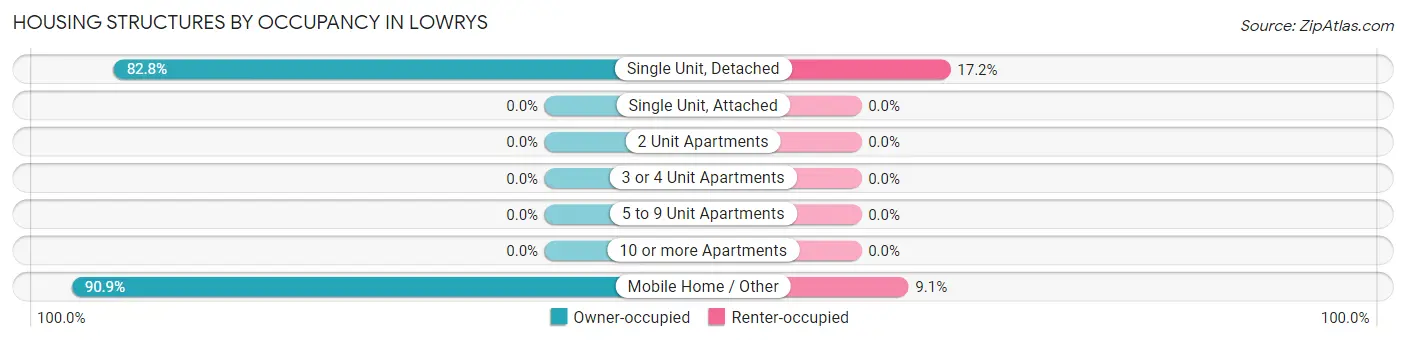
| Structure Type | Owner-occupied | Renter-occupied |
| Single Unit, Detached | 82 (82.8%) | 17 (17.2%) |
| Single Unit, Attached | 0 (0.0%) | 0 (0.0%) |
| 2 Unit Apartments | 0 (0.0%) | 0 (0.0%) |
| 3 or 4 Unit Apartments | 0 (0.0%) | 0 (0.0%) |
| 5 to 9 Unit Apartments | 0 (0.0%) | 0 (0.0%) |
| 10 or more Apartments | 0 (0.0%) | 0 (0.0%) |
| Mobile Home / Other | 10 (90.9%) | 1 (9.1%) |
| Total | 92 (83.6%) | 18 (16.4%) |
Housing Structures by Number of Rooms in Lowrys
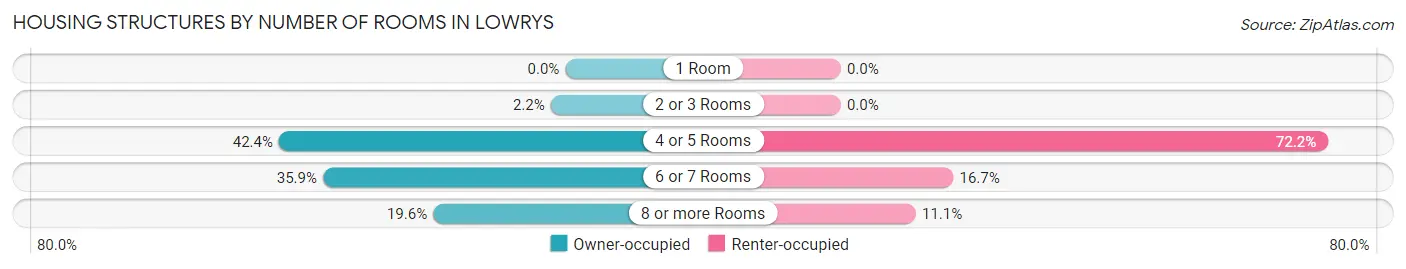
| Number of Rooms | Owner-occupied | Renter-occupied |
| 1 Room | 0 (0.0%) | 0 (0.0%) |
| 2 or 3 Rooms | 2 (2.2%) | 0 (0.0%) |
| 4 or 5 Rooms | 39 (42.4%) | 13 (72.2%) |
| 6 or 7 Rooms | 33 (35.9%) | 3 (16.7%) |
| 8 or more Rooms | 18 (19.6%) | 2 (11.1%) |
| Total | 92 (100.0%) | 18 (100.0%) |
Housing Structure by Heating Type in Lowrys
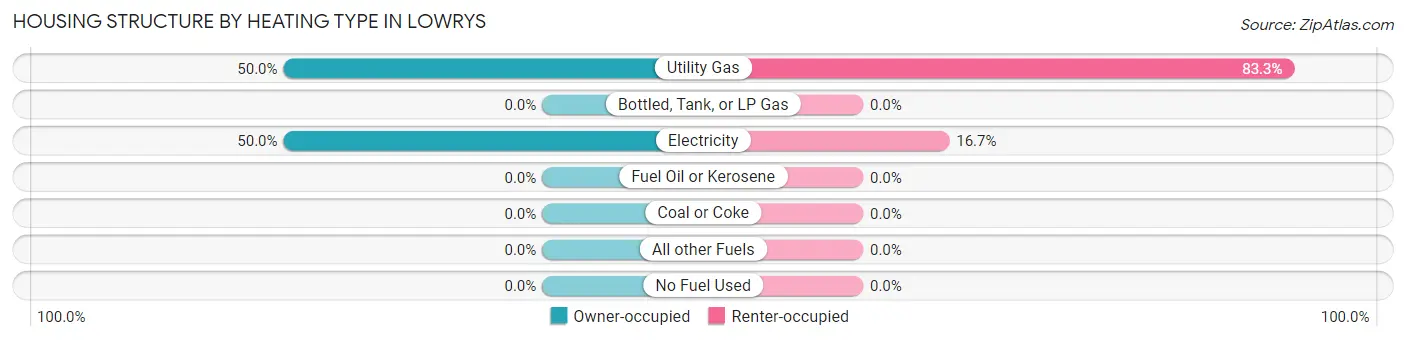
| Heating Type | Owner-occupied | Renter-occupied |
| Utility Gas | 46 (50.0%) | 15 (83.3%) |
| Bottled, Tank, or LP Gas | 0 (0.0%) | 0 (0.0%) |
| Electricity | 46 (50.0%) | 3 (16.7%) |
| Fuel Oil or Kerosene | 0 (0.0%) | 0 (0.0%) |
| Coal or Coke | 0 (0.0%) | 0 (0.0%) |
| All other Fuels | 0 (0.0%) | 0 (0.0%) |
| No Fuel Used | 0 (0.0%) | 0 (0.0%) |
| Total | 92 (100.0%) | 18 (100.0%) |
Household Vehicle Usage in Lowrys
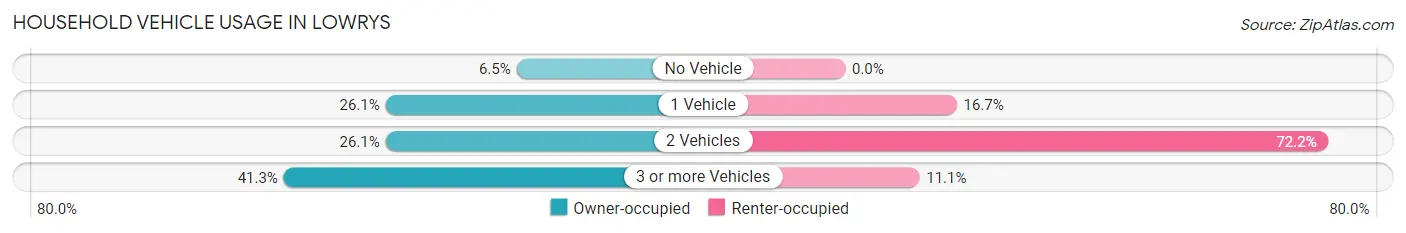
| Vehicles per Household | Owner-occupied | Renter-occupied |
| No Vehicle | 6 (6.5%) | 0 (0.0%) |
| 1 Vehicle | 24 (26.1%) | 3 (16.7%) |
| 2 Vehicles | 24 (26.1%) | 13 (72.2%) |
| 3 or more Vehicles | 38 (41.3%) | 2 (11.1%) |
| Total | 92 (100.0%) | 18 (100.0%) |
Real Estate & Mortgages in Lowrys
Real Estate and Mortgage Overview in Lowrys
| Characteristic | Without Mortgage | With Mortgage |
| Housing Units | 47 | 45 |
| Median Property Value | $69,000 | $184,400 |
| Median Household Income | $24,375 | $7 |
| Monthly Housing Costs | $331 | $0 |
| Real Estate Taxes | $722 | $0 |
Property Value by Mortgage Status in Lowrys
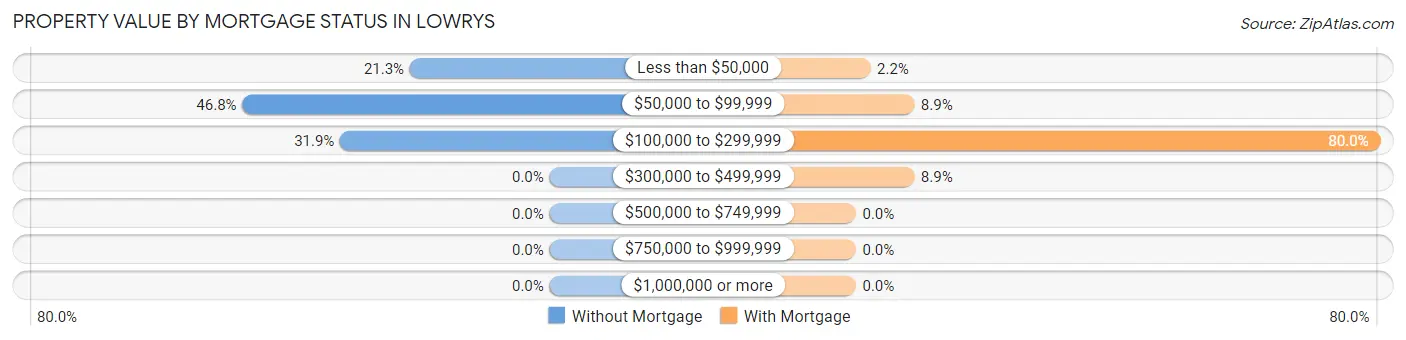
| Property Value | Without Mortgage | With Mortgage |
| Less than $50,000 | 10 (21.3%) | 1 (2.2%) |
| $50,000 to $99,999 | 22 (46.8%) | 4 (8.9%) |
| $100,000 to $299,999 | 15 (31.9%) | 36 (80.0%) |
| $300,000 to $499,999 | 0 (0.0%) | 4 (8.9%) |
| $500,000 to $749,999 | 0 (0.0%) | 0 (0.0%) |
| $750,000 to $999,999 | 0 (0.0%) | 0 (0.0%) |
| $1,000,000 or more | 0 (0.0%) | 0 (0.0%) |
| Total | 47 (100.0%) | 45 (100.0%) |
Household Income by Mortgage Status in Lowrys
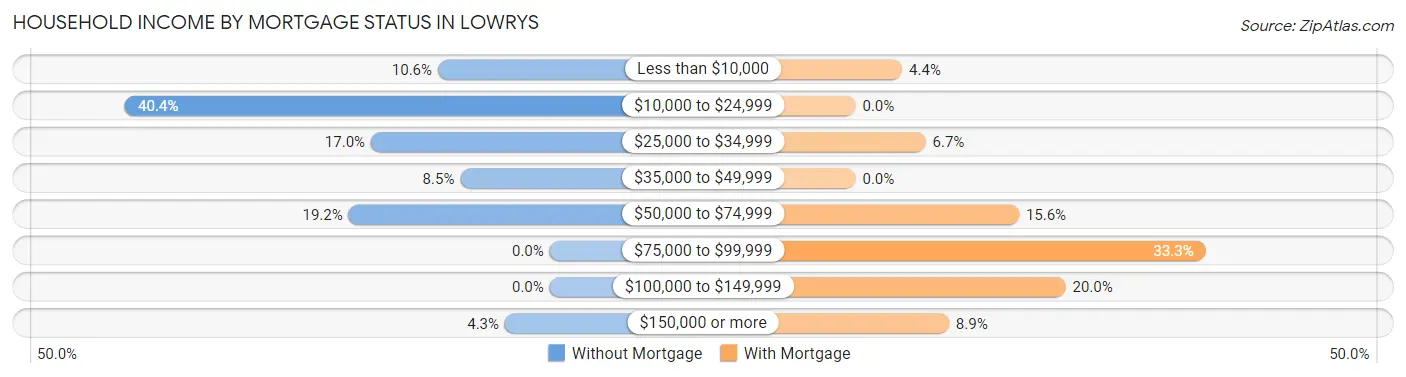
| Household Income | Without Mortgage | With Mortgage |
| Less than $10,000 | 5 (10.6%) | 2 (4.4%) |
| $10,000 to $24,999 | 19 (40.4%) | 0 (0.0%) |
| $25,000 to $34,999 | 8 (17.0%) | 3 (6.7%) |
| $35,000 to $49,999 | 4 (8.5%) | 0 (0.0%) |
| $50,000 to $74,999 | 9 (19.2%) | 7 (15.6%) |
| $75,000 to $99,999 | 0 (0.0%) | 15 (33.3%) |
| $100,000 to $149,999 | 0 (0.0%) | 9 (20.0%) |
| $150,000 or more | 2 (4.3%) | 4 (8.9%) |
| Total | 47 (100.0%) | 45 (100.0%) |
Property Value to Household Income Ratio in Lowrys
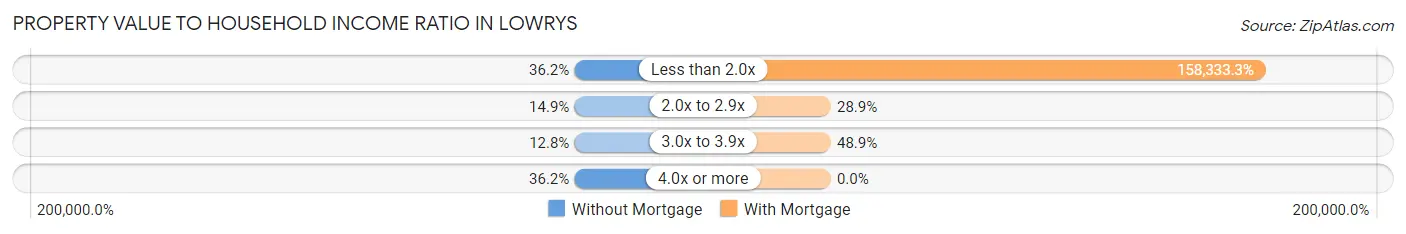
| Value-to-Income Ratio | Without Mortgage | With Mortgage |
| Less than 2.0x | 17 (36.2%) | 71,250 (158,333.3%) |
| 2.0x to 2.9x | 7 (14.9%) | 13 (28.9%) |
| 3.0x to 3.9x | 6 (12.8%) | 22 (48.9%) |
| 4.0x or more | 17 (36.2%) | 0 (0.0%) |
| Total | 47 (100.0%) | 45 (100.0%) |
Real Estate Taxes by Mortgage Status in Lowrys
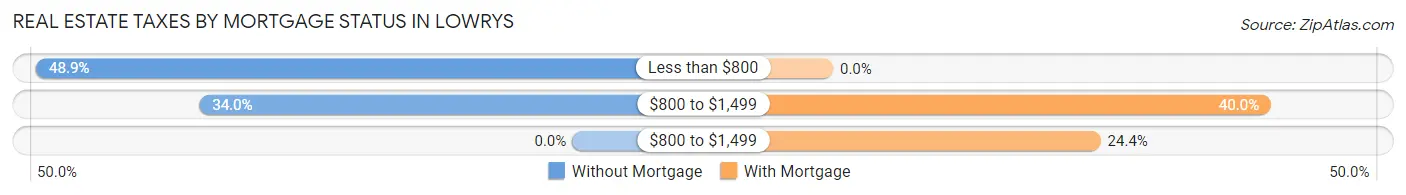
| Property Taxes | Without Mortgage | With Mortgage |
| Less than $800 | 23 (48.9%) | 0 (0.0%) |
| $800 to $1,499 | 16 (34.0%) | 18 (40.0%) |
| $800 to $1,499 | 0 (0.0%) | 11 (24.4%) |
| Total | 47 (100.0%) | 45 (100.0%) |
Health & Disability in Lowrys
Health Insurance Coverage by Age in Lowrys
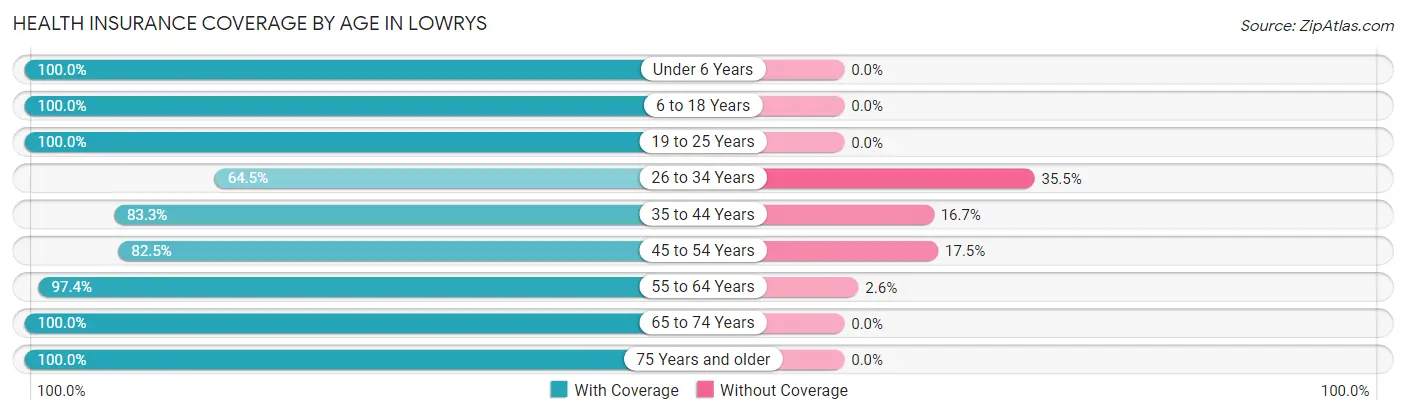
| Age Bracket | With Coverage | Without Coverage |
| Under 6 Years | 23 (100.0%) | 0 (0.0%) |
| 6 to 18 Years | 59 (100.0%) | 0 (0.0%) |
| 19 to 25 Years | 35 (100.0%) | 0 (0.0%) |
| 26 to 34 Years | 20 (64.5%) | 11 (35.5%) |
| 35 to 44 Years | 20 (83.3%) | 4 (16.7%) |
| 45 to 54 Years | 33 (82.5%) | 7 (17.5%) |
| 55 to 64 Years | 37 (97.4%) | 1 (2.6%) |
| 65 to 74 Years | 32 (100.0%) | 0 (0.0%) |
| 75 Years and older | 15 (100.0%) | 0 (0.0%) |
| Total | 274 (92.3%) | 23 (7.7%) |
Health Insurance Coverage by Citizenship Status in Lowrys
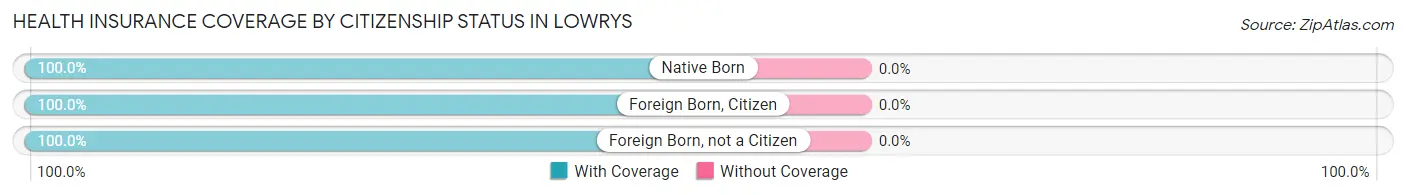
| Citizenship Status | With Coverage | Without Coverage |
| Native Born | 23 (100.0%) | 0 (0.0%) |
| Foreign Born, Citizen | 59 (100.0%) | 0 (0.0%) |
| Foreign Born, not a Citizen | 35 (100.0%) | 0 (0.0%) |
Health Insurance Coverage by Household Income in Lowrys
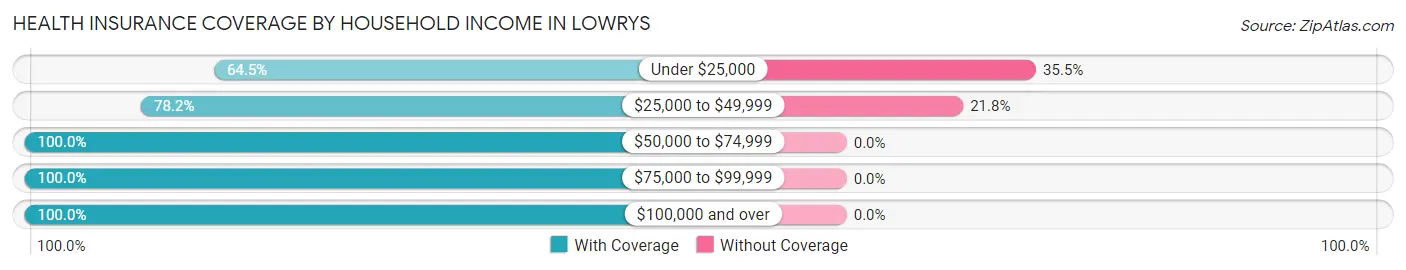
| Household Income | With Coverage | Without Coverage |
| Under $25,000 | 20 (64.5%) | 11 (35.5%) |
| $25,000 to $49,999 | 43 (78.2%) | 12 (21.8%) |
| $50,000 to $74,999 | 78 (100.0%) | 0 (0.0%) |
| $75,000 to $99,999 | 56 (100.0%) | 0 (0.0%) |
| $100,000 and over | 77 (100.0%) | 0 (0.0%) |
Public vs Private Health Insurance Coverage by Age in Lowrys
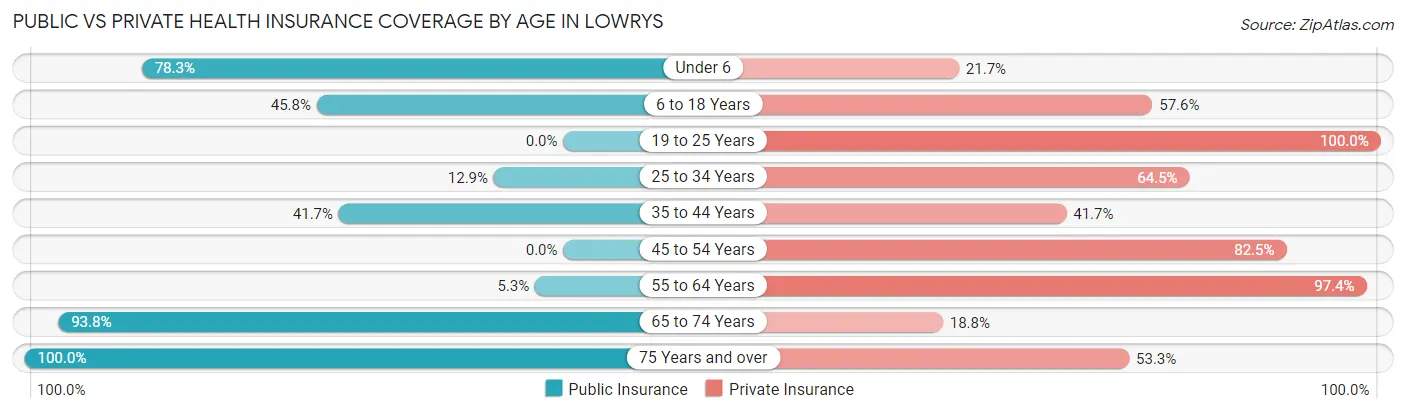
| Age Bracket | Public Insurance | Private Insurance |
| Under 6 | 18 (78.3%) | 5 (21.7%) |
| 6 to 18 Years | 27 (45.8%) | 34 (57.6%) |
| 19 to 25 Years | 0 (0.0%) | 35 (100.0%) |
| 25 to 34 Years | 4 (12.9%) | 20 (64.5%) |
| 35 to 44 Years | 10 (41.7%) | 10 (41.7%) |
| 45 to 54 Years | 0 (0.0%) | 33 (82.5%) |
| 55 to 64 Years | 2 (5.3%) | 37 (97.4%) |
| 65 to 74 Years | 30 (93.8%) | 6 (18.8%) |
| 75 Years and over | 15 (100.0%) | 8 (53.3%) |
| Total | 106 (35.7%) | 188 (63.3%) |
Disability Status by Sex by Age in Lowrys
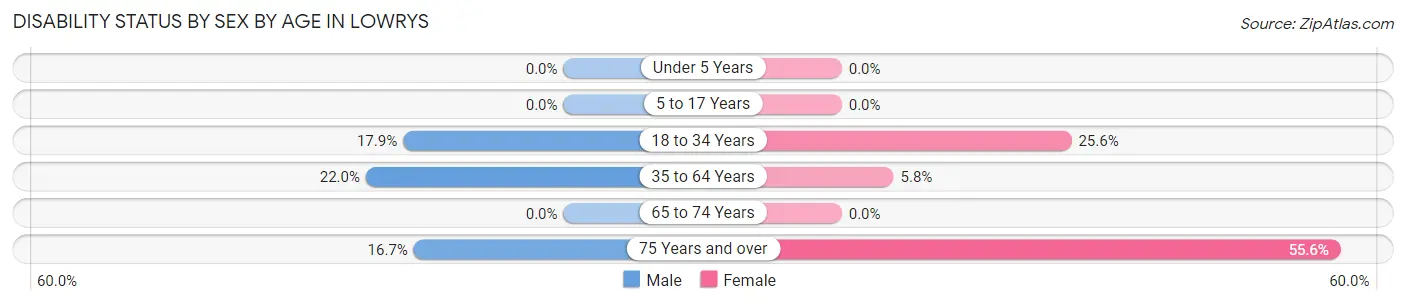
| Age Bracket | Male | Female |
| Under 5 Years | 0 (0.0%) | 0 (0.0%) |
| 5 to 17 Years | 0 (0.0%) | 0 (0.0%) |
| 18 to 34 Years | 5 (17.9%) | 11 (25.6%) |
| 35 to 64 Years | 11 (22.0%) | 3 (5.8%) |
| 65 to 74 Years | 0 (0.0%) | 0 (0.0%) |
| 75 Years and over | 1 (16.7%) | 5 (55.6%) |
Disability Class by Sex by Age in Lowrys
Disability Class: Hearing Difficulty
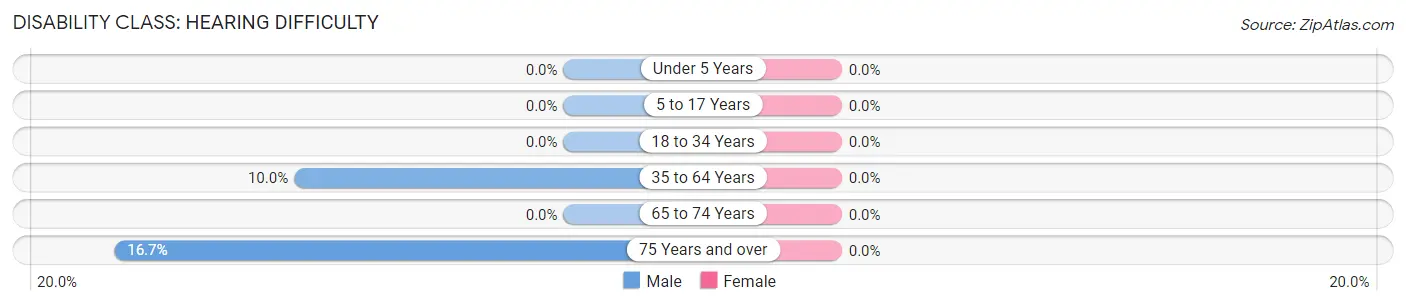
| Age Bracket | Male | Female |
| Under 5 Years | 0 (0.0%) | 0 (0.0%) |
| 5 to 17 Years | 0 (0.0%) | 0 (0.0%) |
| 18 to 34 Years | 0 (0.0%) | 0 (0.0%) |
| 35 to 64 Years | 5 (10.0%) | 0 (0.0%) |
| 65 to 74 Years | 0 (0.0%) | 0 (0.0%) |
| 75 Years and over | 1 (16.7%) | 0 (0.0%) |
Disability Class: Vision Difficulty
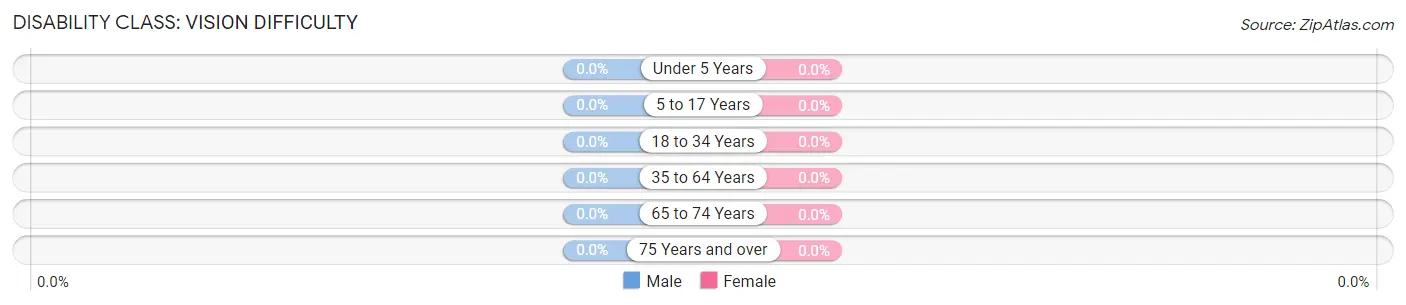
| Age Bracket | Male | Female |
| Under 5 Years | 0 (0.0%) | 0 (0.0%) |
| 5 to 17 Years | 0 (0.0%) | 0 (0.0%) |
| 18 to 34 Years | 0 (0.0%) | 0 (0.0%) |
| 35 to 64 Years | 0 (0.0%) | 0 (0.0%) |
| 65 to 74 Years | 0 (0.0%) | 0 (0.0%) |
| 75 Years and over | 0 (0.0%) | 0 (0.0%) |
Disability Class: Cognitive Difficulty
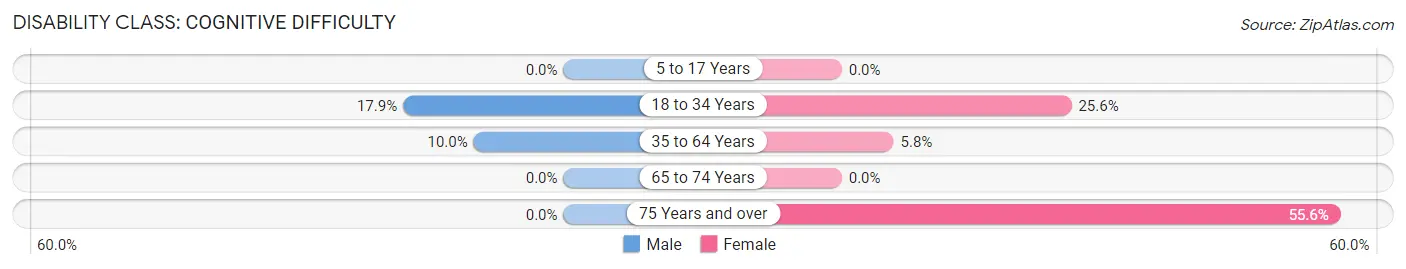
| Age Bracket | Male | Female |
| 5 to 17 Years | 0 (0.0%) | 0 (0.0%) |
| 18 to 34 Years | 5 (17.9%) | 11 (25.6%) |
| 35 to 64 Years | 5 (10.0%) | 3 (5.8%) |
| 65 to 74 Years | 0 (0.0%) | 0 (0.0%) |
| 75 Years and over | 0 (0.0%) | 5 (55.6%) |
Disability Class: Ambulatory Difficulty
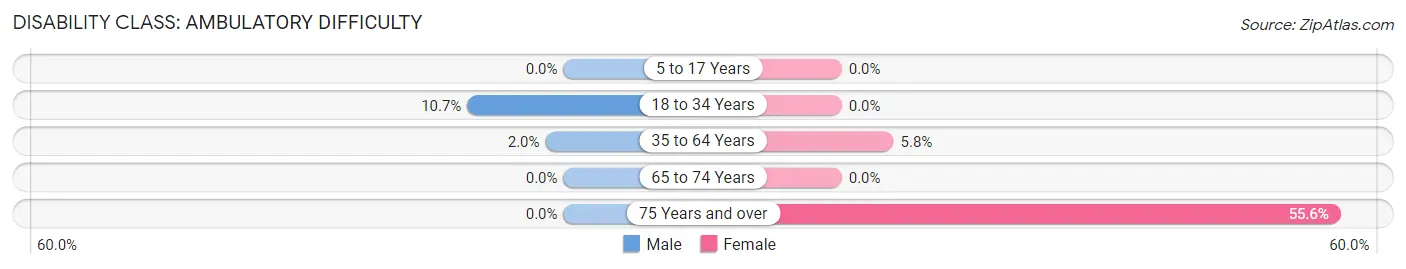
| Age Bracket | Male | Female |
| 5 to 17 Years | 0 (0.0%) | 0 (0.0%) |
| 18 to 34 Years | 3 (10.7%) | 0 (0.0%) |
| 35 to 64 Years | 1 (2.0%) | 3 (5.8%) |
| 65 to 74 Years | 0 (0.0%) | 0 (0.0%) |
| 75 Years and over | 0 (0.0%) | 5 (55.6%) |
Disability Class: Self-Care Difficulty
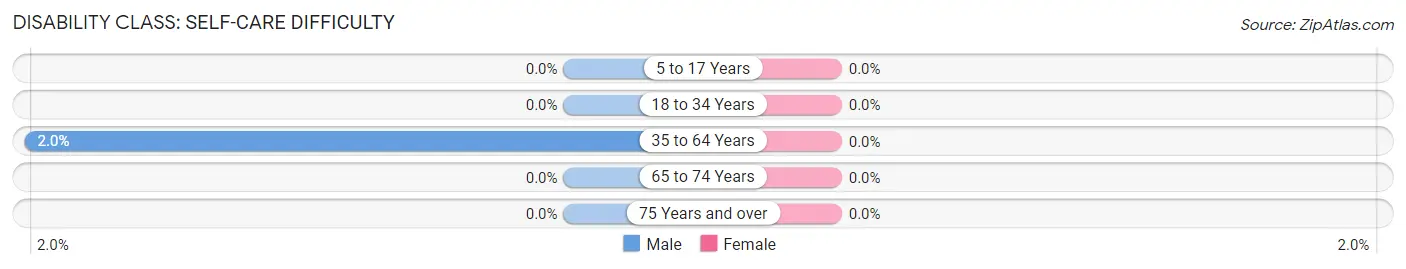
| Age Bracket | Male | Female |
| 5 to 17 Years | 0 (0.0%) | 0 (0.0%) |
| 18 to 34 Years | 0 (0.0%) | 0 (0.0%) |
| 35 to 64 Years | 1 (2.0%) | 0 (0.0%) |
| 65 to 74 Years | 0 (0.0%) | 0 (0.0%) |
| 75 Years and over | 0 (0.0%) | 0 (0.0%) |
Technology Access in Lowrys
Computing Device Access in Lowrys
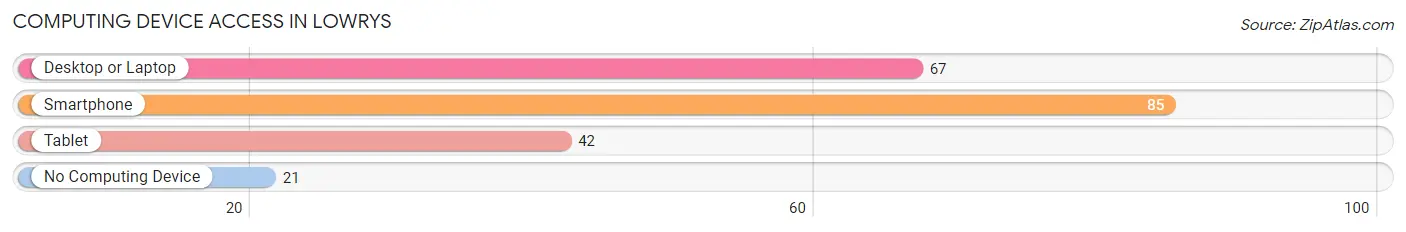
| Device Type | # Households | % Households |
| Desktop or Laptop | 67 | 60.9% |
| Smartphone | 85 | 77.3% |
| Tablet | 42 | 38.2% |
| No Computing Device | 21 | 19.1% |
| Total | 110 | 100.0% |
Internet Access in Lowrys
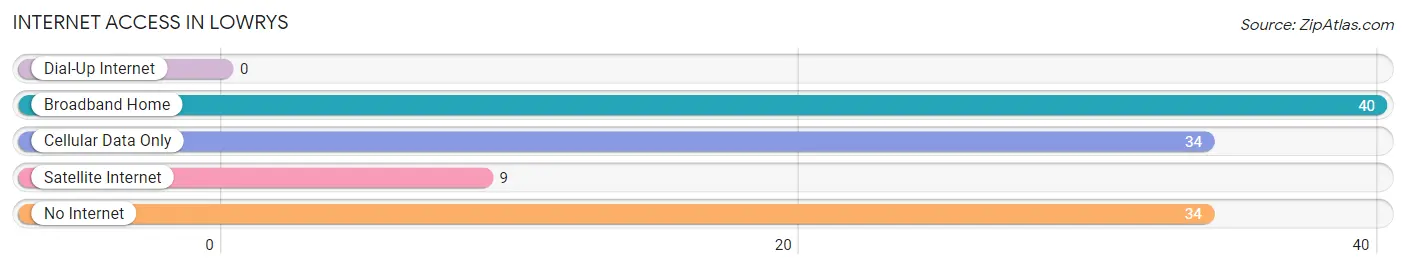
| Internet Type | # Households | % Households |
| Dial-Up Internet | 0 | 0.0% |
| Broadband Home | 40 | 36.4% |
| Cellular Data Only | 34 | 30.9% |
| Satellite Internet | 9 | 8.2% |
| No Internet | 34 | 30.9% |
| Total | 110 | 100.0% |
Lowrys Summary
Lowrys, South Carolina is a small town located in the Pee Dee region of the state. It is situated in Marion County, approximately 20 miles south of Florence and 40 miles north of Myrtle Beach. The town was founded in 1883 and named after the Lowry family, who were among the first settlers in the area.
Lowrys is a rural community with a population of just over 1,000 people. The town is home to a variety of businesses, including a grocery store, a hardware store, a gas station, and a few restaurants. The town is also home to a post office, a library, and a fire station.
The town is located in a predominantly agricultural area, with cotton, soybeans, and corn being the main crops grown in the area. The town is also home to a number of small businesses, including a few antique stores, a few gift shops, and a few restaurants.
The town is served by the Marion County School District, which includes two elementary schools, a middle school, and a high school. The town is also home to a few churches, including the First Baptist Church of Lowrys, the Lowrys United Methodist Church, and the Lowrys Presbyterian Church.
The town is located in a humid subtropical climate, with hot, humid summers and mild winters. The average temperature in the summer is around 90 degrees Fahrenheit, while the average temperature in the winter is around 50 degrees Fahrenheit. The town receives an average of 48 inches of rain per year.
The town has a diverse population, with a mix of African American, Caucasian, and Hispanic residents. The median household income in the town is around $30,000, and the median home value is around $90,000. The town has a low unemployment rate, with only 4.2% of the population unemployed.
Lowrys is a small town with a rich history and a bright future. The town is home to a variety of businesses, churches, and schools, and is a great place to live and work. The town is a great place to raise a family, and is a great place to visit.
Common Questions
What is Per Capita Income in Lowrys?
Per Capita income in Lowrys is $26,856.
What is the Median Family Income in Lowrys?
Median Family Income in Lowrys is $70,750.
What is the Median Household income in Lowrys?
Median Household Income in Lowrys is $57,250.
What is Income or Wage Gap in Lowrys?
Income or Wage Gap in Lowrys is 53.1%.
Women in Lowrys earn 46.9 cents for every dollar earned by a man.
What is Inequality or Gini Index in Lowrys?
Inequality or Gini Index in Lowrys is 0.42.
What is the Total Population of Lowrys?
Total Population of Lowrys is 297.
What is the Total Male Population of Lowrys?
Total Male Population of Lowrys is 170.
What is the Total Female Population of Lowrys?
Total Female Population of Lowrys is 127.
What is the Ratio of Males per 100 Females in Lowrys?
There are 133.86 Males per 100 Females in Lowrys.
What is the Ratio of Females per 100 Males in Lowrys?
There are 74.71 Females per 100 Males in Lowrys.
What is the Median Population Age in Lowrys?
Median Population Age in Lowrys is 35.3 Years.
What is the Average Family Size in Lowrys
Average Family Size in Lowrys is 3.2 People.
What is the Average Household Size in Lowrys
Average Household Size in Lowrys is 2.7 People.
How Large is the Labor Force in Lowrys?
There are 112 People in the Labor Forcein in Lowrys.
What is the Percentage of People in the Labor Force in Lowrys?
50.9% of People are in the Labor Force in Lowrys.
What is the Unemployment Rate in Lowrys?
Unemployment Rate in Lowrys is 3.6%.