Salem, SC Map & Demographics
Salem Map
Salem Overview
$25,185
PER CAPITA INCOME
$72,917
AVG FAMILY INCOME
$61,250
AVG HOUSEHOLD INCOME
0.40
INEQUALITY / GINI INDEX
145
TOTAL POPULATION
69
MALE POPULATION
76
FEMALE POPULATION
90.79
MALES / 100 FEMALES
110.14
FEMALES / 100 MALES
44.6
MEDIAN AGE
3.0
AVG FAMILY SIZE
2.7
AVG HOUSEHOLD SIZE
51
LABOR FORCE [ PEOPLE ]
44.0%
PERCENT IN LABOR FORCE
Salem Zip Codes
Salem Area Codes
Income in Salem
Income Overview in Salem
Per Capita Income in Salem is $25,185, while median incomes of families and households are $72,917 and $61,250 respectively.
| Characteristic | Number | Measure |
| Per Capita Income | 145 | $25,185 |
| Median Family Income | 41 | $72,917 |
| Mean Family Income | 41 | $75,168 |
| Median Household Income | 53 | $61,250 |
| Mean Household Income | 53 | $70,342 |
| Income Deficit | 41 | $0 |
| Wage / Income Gap (%) | 145 | 0.00% |
| Wage / Income Gap ($) | 145 | 100.00¢ per $1 |
| Gini / Inequality Index | 145 | 0.40 |
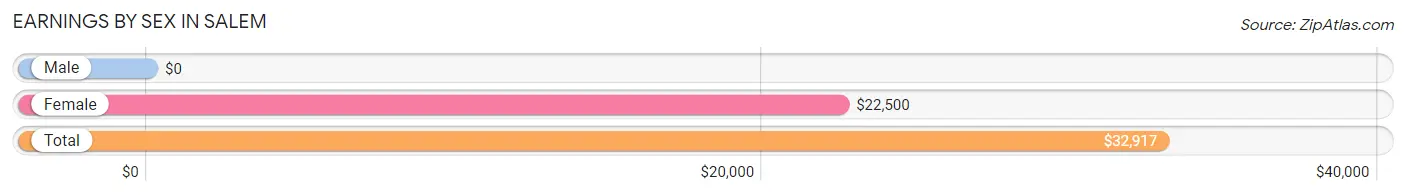
Earnings by Sex in Salem
| Sex | Number | Average Earnings |
| Male | 32 (53.3%) | $0 |
| Female | 28 (46.7%) | $22,500 |
| Total | 60 (100.0%) | $32,917 |
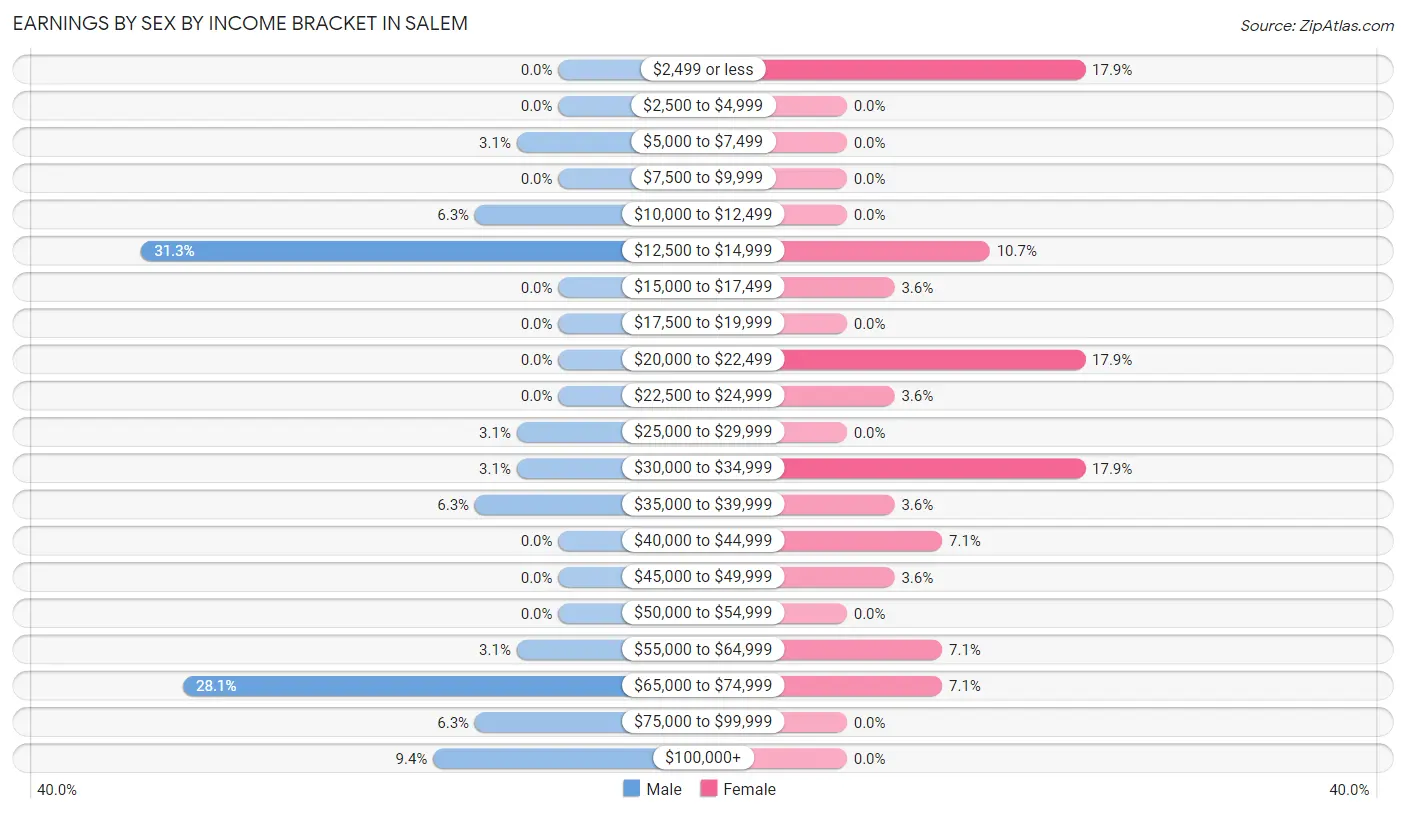
Earnings by Sex by Income Bracket in Salem
The most common earnings brackets in Salem are $12,500 to $14,999 for men (10 | 31.2%) and $2,499 or less for women (5 | 17.9%).
| Income | Male | Female |
| $2,499 or less | 0 (0.0%) | 5 (17.9%) |
| $2,500 to $4,999 | 0 (0.0%) | 0 (0.0%) |
| $5,000 to $7,499 | 1 (3.1%) | 0 (0.0%) |
| $7,500 to $9,999 | 0 (0.0%) | 0 (0.0%) |
| $10,000 to $12,499 | 2 (6.2%) | 0 (0.0%) |
| $12,500 to $14,999 | 10 (31.2%) | 3 (10.7%) |
| $15,000 to $17,499 | 0 (0.0%) | 1 (3.6%) |
| $17,500 to $19,999 | 0 (0.0%) | 0 (0.0%) |
| $20,000 to $22,499 | 0 (0.0%) | 5 (17.9%) |
| $22,500 to $24,999 | 0 (0.0%) | 1 (3.6%) |
| $25,000 to $29,999 | 1 (3.1%) | 0 (0.0%) |
| $30,000 to $34,999 | 1 (3.1%) | 5 (17.9%) |
| $35,000 to $39,999 | 2 (6.2%) | 1 (3.6%) |
| $40,000 to $44,999 | 0 (0.0%) | 2 (7.1%) |
| $45,000 to $49,999 | 0 (0.0%) | 1 (3.6%) |
| $50,000 to $54,999 | 0 (0.0%) | 0 (0.0%) |
| $55,000 to $64,999 | 1 (3.1%) | 2 (7.1%) |
| $65,000 to $74,999 | 9 (28.1%) | 2 (7.1%) |
| $75,000 to $99,999 | 2 (6.2%) | 0 (0.0%) |
| $100,000+ | 3 (9.4%) | 0 (0.0%) |
| Total | 32 (100.0%) | 28 (100.0%) |
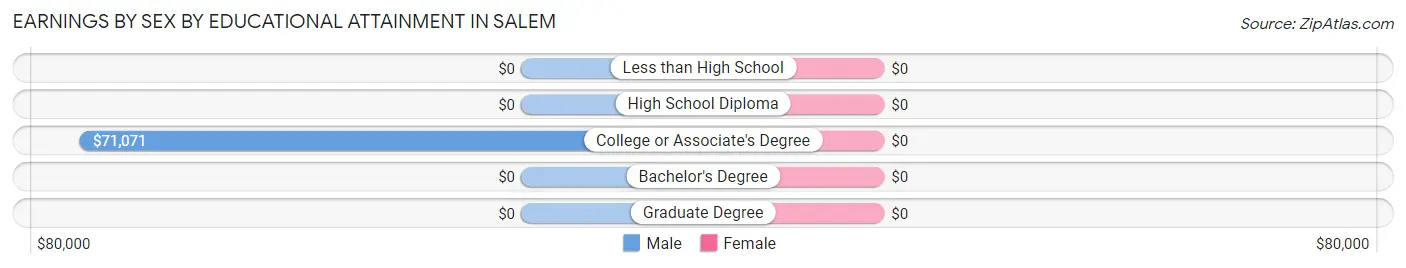
Earnings by Sex by Educational Attainment in Salem
| Educational Attainment | Male Income | Female Income |
| Less than High School | - | - |
| High School Diploma | - | - |
| College or Associate's Degree | $71,071 | $0 |
| Bachelor's Degree | - | - |
| Graduate Degree | - | - |
| Total | - | - |
Family Income in Salem
Family Income Brackets in Salem
According to the Salem family income data, there are 11 families falling into the $100,000 to $149,999 income range, which is the most common income bracket and makes up 26.8% of all families.
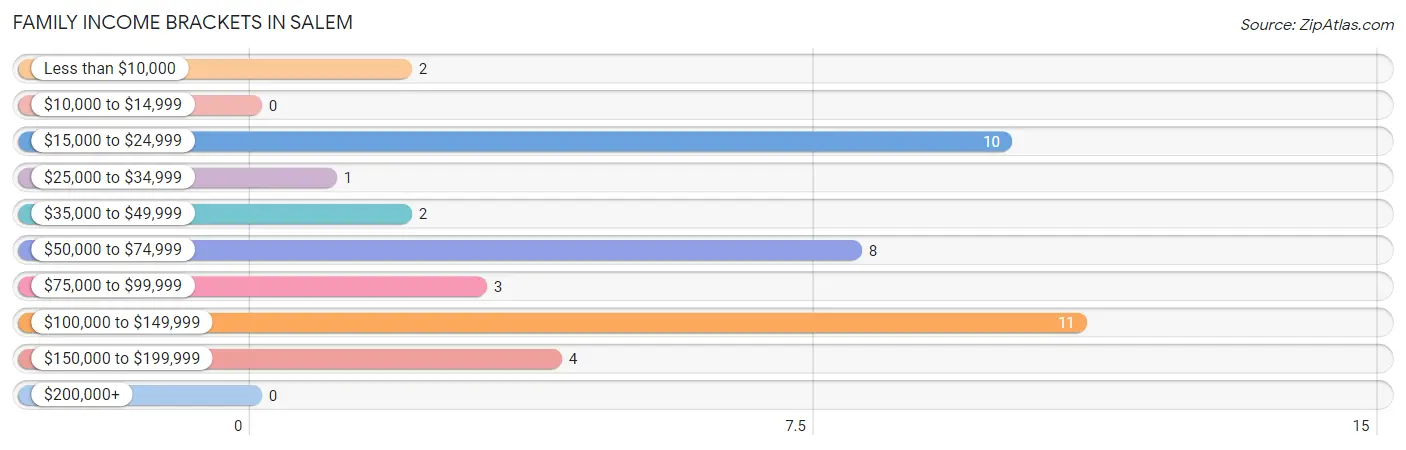
| Income Bracket | # Families | % Families |
| Less than $10,000 | 2 | 4.9% |
| $10,000 to $14,999 | 0 | 0.0% |
| $15,000 to $24,999 | 10 | 24.4% |
| $25,000 to $34,999 | 1 | 2.4% |
| $35,000 to $49,999 | 2 | 4.9% |
| $50,000 to $74,999 | 8 | 19.5% |
| $75,000 to $99,999 | 3 | 7.3% |
| $100,000 to $149,999 | 11 | 26.8% |
| $150,000 to $199,999 | 4 | 9.8% |
| $200,000+ | 0 | 0.0% |
Family Income by Famaliy Size in Salem
3-person families (14 | 34.2%) account for the highest median family income in Salem with $105,714 per family, while 3-person families (14 | 34.2%) have the highest median income of $35,238 per family member.
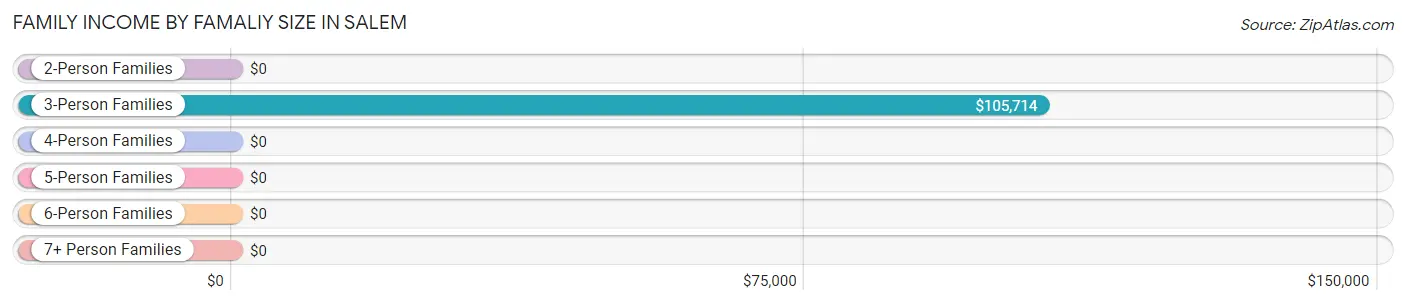
| Income Bracket | # Families | Median Income |
| 2-Person Families | 22 (53.7%) | $0 |
| 3-Person Families | 14 (34.2%) | $105,714 |
| 4-Person Families | 2 (4.9%) | $0 |
| 5-Person Families | 0 (0.0%) | $0 |
| 6-Person Families | 0 (0.0%) | $0 |
| 7+ Person Families | 3 (7.3%) | $0 |
| Total | 41 (100.0%) | $72,917 |
Family Income by Number of Earners in Salem
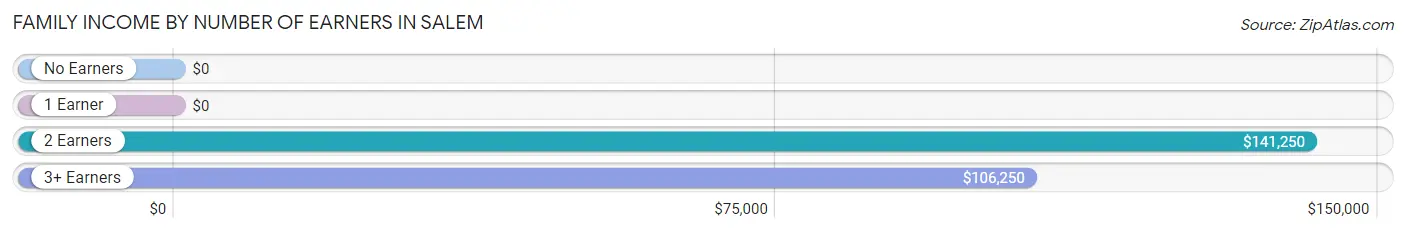
| Number of Earners | # Families | Median Income |
| No Earners | 20 (48.8%) | $0 |
| 1 Earner | 7 (17.1%) | $0 |
| 2 Earners | 5 (12.2%) | $141,250 |
| 3+ Earners | 9 (22.0%) | $106,250 |
| Total | 41 (100.0%) | $72,917 |
Household Income in Salem
Household Income Brackets in Salem
With 12 households falling in the category, the $50,000 to $74,999 income range is the most frequent in Salem, accounting for 22.6% of all households.
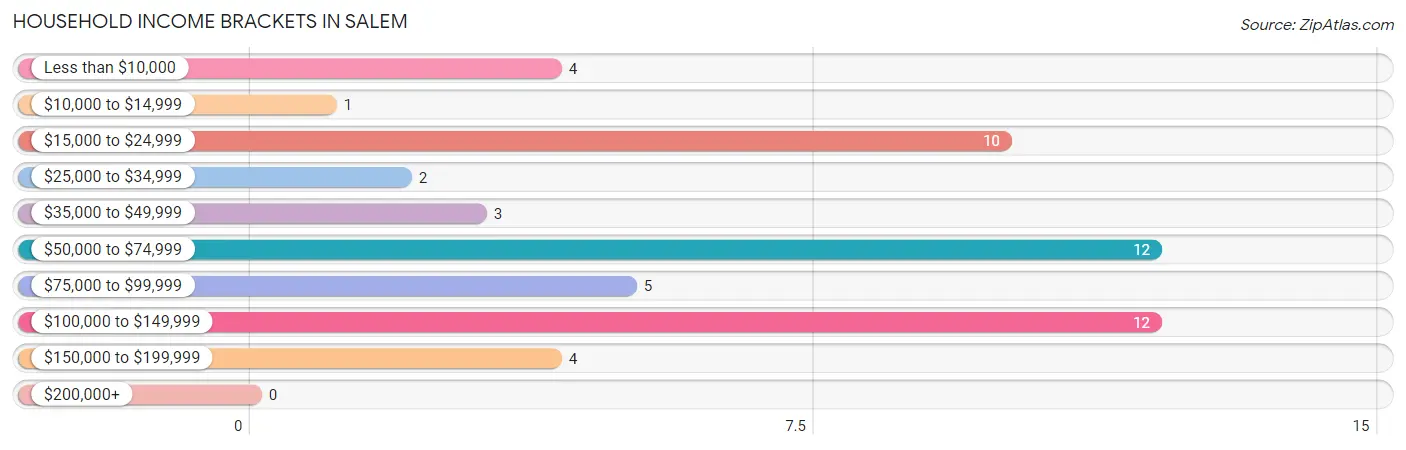
| Income Bracket | # Households | % Households |
| Less than $10,000 | 4 | 7.5% |
| $10,000 to $14,999 | 1 | 1.9% |
| $15,000 to $24,999 | 10 | 18.9% |
| $25,000 to $34,999 | 2 | 3.8% |
| $35,000 to $49,999 | 3 | 5.7% |
| $50,000 to $74,999 | 12 | 22.6% |
| $75,000 to $99,999 | 5 | 9.4% |
| $100,000 to $149,999 | 12 | 22.6% |
| $150,000 to $199,999 | 4 | 7.5% |
| $200,000+ | 0 | 0.0% |
Household Income by Householder Age in Salem
The median household income in Salem is $61,250, with the highest median household income of $78,125 found in the 25 to 44 years age bracket for the primary householder. A total of 13 households (24.5%) fall into this category.
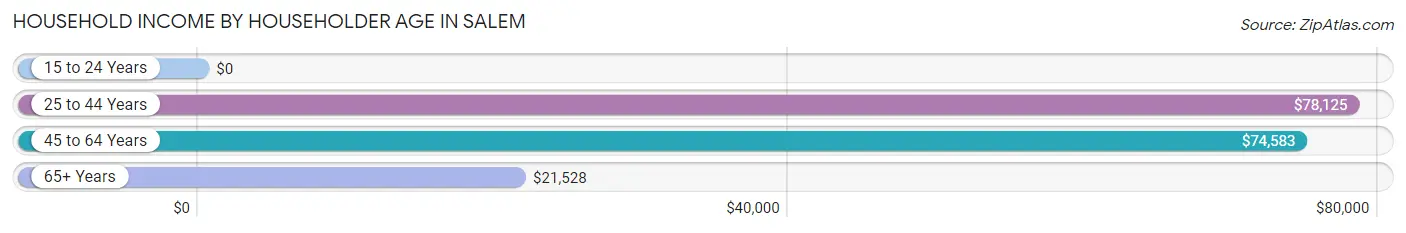
| Income Bracket | # Households | Median Income |
| 15 to 24 Years | 0 (0.0%) | $0 |
| 25 to 44 Years | 13 (24.5%) | $78,125 |
| 45 to 64 Years | 23 (43.4%) | $74,583 |
| 65+ Years | 17 (32.1%) | $21,528 |
| Total | 53 (100.0%) | $61,250 |
Poverty in Salem
Income Below Poverty by Sex and Age in Salem
With 4.3% poverty level for males and 8.1% for females among the residents of Salem, 55 to 64 year old males and 45 to 54 year old females are the most vulnerable to poverty, with 3 males (21.4%) and 1 females (25.0%) in their respective age groups living below the poverty level.
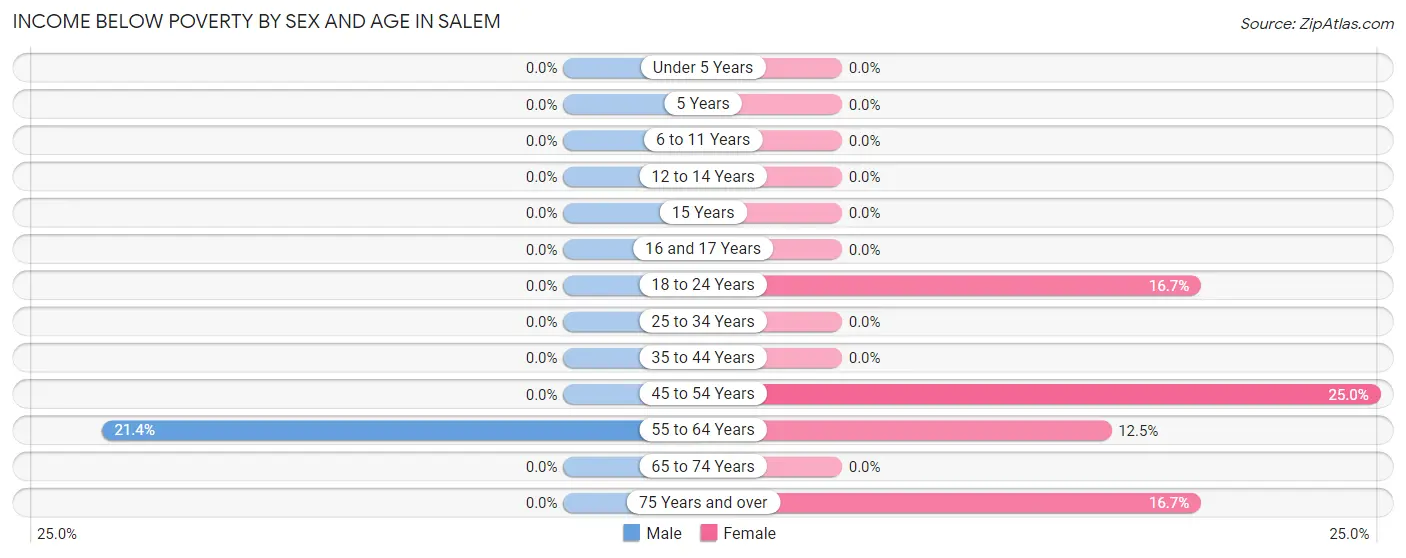
| Age Bracket | Male | Female |
| Under 5 Years | 0 (0.0%) | 0 (0.0%) |
| 5 Years | 0 (0.0%) | 0 (0.0%) |
| 6 to 11 Years | 0 (0.0%) | 0 (0.0%) |
| 12 to 14 Years | 0 (0.0%) | 0 (0.0%) |
| 15 Years | 0 (0.0%) | 0 (0.0%) |
| 16 and 17 Years | 0 (0.0%) | 0 (0.0%) |
| 18 to 24 Years | 0 (0.0%) | 1 (16.7%) |
| 25 to 34 Years | 0 (0.0%) | 0 (0.0%) |
| 35 to 44 Years | 0 (0.0%) | 0 (0.0%) |
| 45 to 54 Years | 0 (0.0%) | 1 (25.0%) |
| 55 to 64 Years | 3 (21.4%) | 2 (12.5%) |
| 65 to 74 Years | 0 (0.0%) | 0 (0.0%) |
| 75 Years and over | 0 (0.0%) | 2 (16.7%) |
| Total | 3 (4.3%) | 6 (8.1%) |
Income Above Poverty by Sex and Age in Salem
According to the poverty statistics in Salem, males aged under 5 years and females aged under 5 years are the age groups that are most secure financially, with 100.0% of males and 100.0% of females in these age groups living above the poverty line.
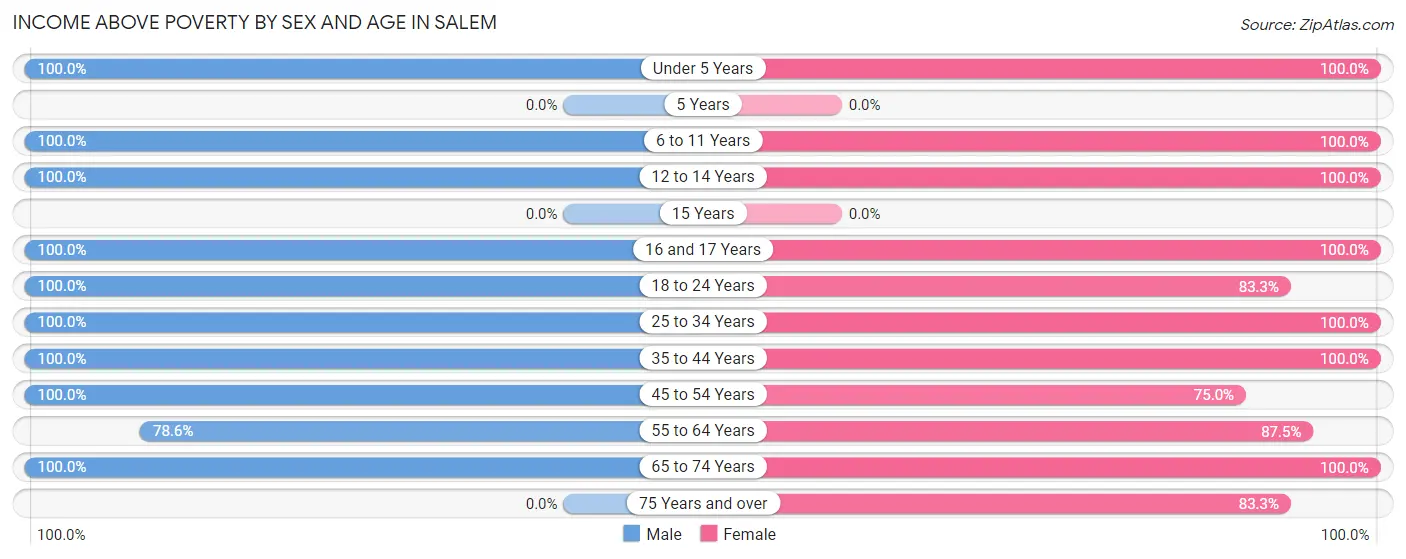
| Age Bracket | Male | Female |
| Under 5 Years | 6 (100.0%) | 5 (100.0%) |
| 5 Years | 0 (0.0%) | 0 (0.0%) |
| 6 to 11 Years | 6 (100.0%) | 2 (100.0%) |
| 12 to 14 Years | 3 (100.0%) | 5 (100.0%) |
| 15 Years | 0 (0.0%) | 0 (0.0%) |
| 16 and 17 Years | 2 (100.0%) | 3 (100.0%) |
| 18 to 24 Years | 1 (100.0%) | 5 (83.3%) |
| 25 to 34 Years | 8 (100.0%) | 4 (100.0%) |
| 35 to 44 Years | 11 (100.0%) | 10 (100.0%) |
| 45 to 54 Years | 12 (100.0%) | 3 (75.0%) |
| 55 to 64 Years | 11 (78.6%) | 14 (87.5%) |
| 65 to 74 Years | 6 (100.0%) | 7 (100.0%) |
| 75 Years and over | 0 (0.0%) | 10 (83.3%) |
| Total | 66 (95.7%) | 68 (91.9%) |
Income Below Poverty Among Married-Couple Families in Salem
The poverty statistics for married-couple families in Salem show that 7.1% or 2 of the total 28 families live below the poverty line. Families with no children have the highest poverty rate of 9.1%, comprising of 2 families. On the other hand, families with 1 or 2 children have the lowest poverty rate of 0.0%, which includes 0 families.
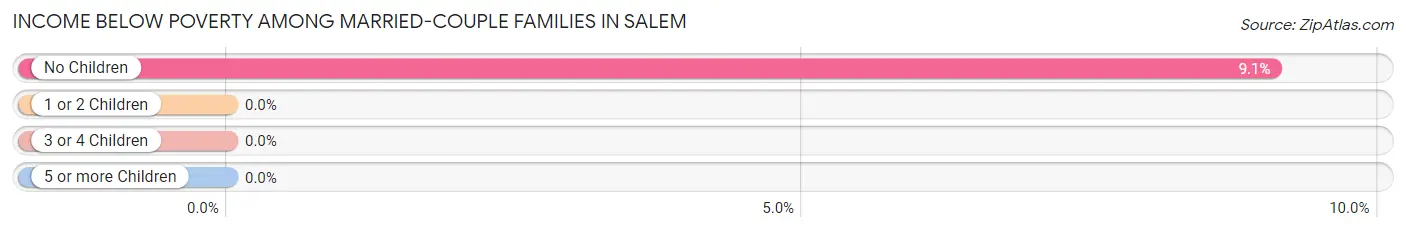
| Children | Above Poverty | Below Poverty |
| No Children | 20 (90.9%) | 2 (9.1%) |
| 1 or 2 Children | 4 (100.0%) | 0 (0.0%) |
| 3 or 4 Children | 0 (0.0%) | 0 (0.0%) |
| 5 or more Children | 2 (100.0%) | 0 (0.0%) |
| Total | 26 (92.9%) | 2 (7.1%) |
Income Below Poverty Among Single-Parent Households in Salem
| Children | Single Father | Single Mother |
| No Children | 0 (0.0%) | 0 (0.0%) |
| 1 or 2 Children | 0 (0.0%) | 0 (0.0%) |
| 3 or 4 Children | 0 (0.0%) | 0 (0.0%) |
| 5 or more Children | 0 (0.0%) | 0 (0.0%) |
| Total | 0 (0.0%) | 0 (0.0%) |
Income Below Poverty Among Married-Couple vs Single-Parent Households in Salem
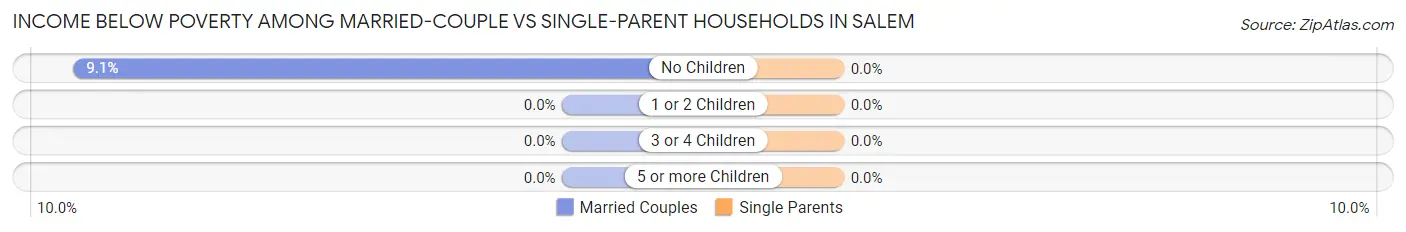
| Children | Married-Couple Families | Single-Parent Households |
| No Children | 2 (9.1%) | 0 (0.0%) |
| 1 or 2 Children | 0 (0.0%) | 0 (0.0%) |
| 3 or 4 Children | 0 (0.0%) | 0 (0.0%) |
| 5 or more Children | 0 (0.0%) | 0 (0.0%) |
| Total | 2 (7.1%) | 0 (0.0%) |
Race in Salem
The most populous races in Salem are White / Caucasian (139 | 95.9%), Two or more Races (5 | 3.5%), and Hispanic or Latino (2 | 1.4%).
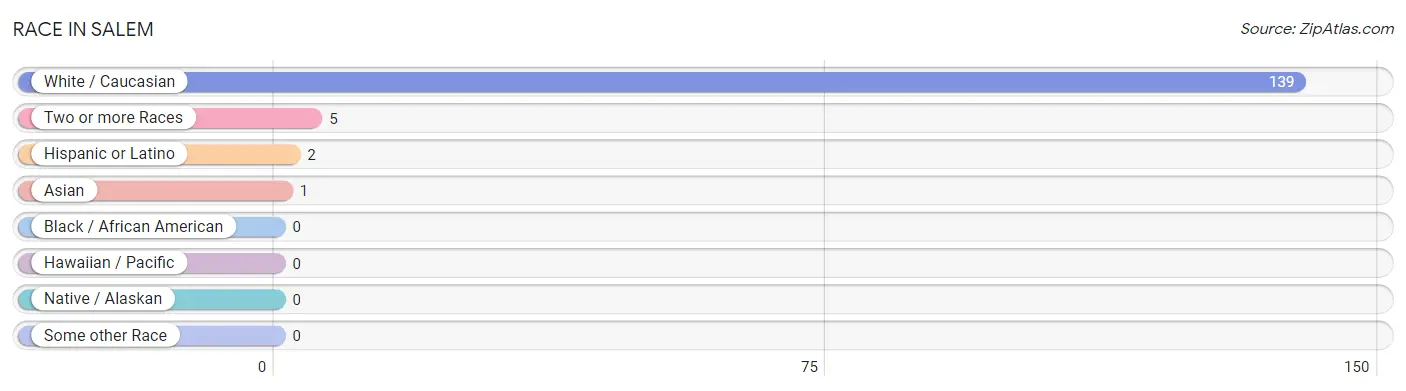
| Race | # Population | % Population |
| Asian | 1 | 0.7% |
| Black / African American | 0 | 0.0% |
| Hawaiian / Pacific | 0 | 0.0% |
| Hispanic or Latino | 2 | 1.4% |
| Native / Alaskan | 0 | 0.0% |
| White / Caucasian | 139 | 95.9% |
| Two or more Races | 5 | 3.5% |
| Some other Race | 0 | 0.0% |
| Total | 145 | 100.0% |
Ancestry in Salem
The most populous ancestries reported in Salem are German (37 | 25.5%), American (24 | 16.6%), Irish (15 | 10.3%), English (8 | 5.5%), and Scottish (7 | 4.8%), together accounting for 62.8% of all Salem residents.
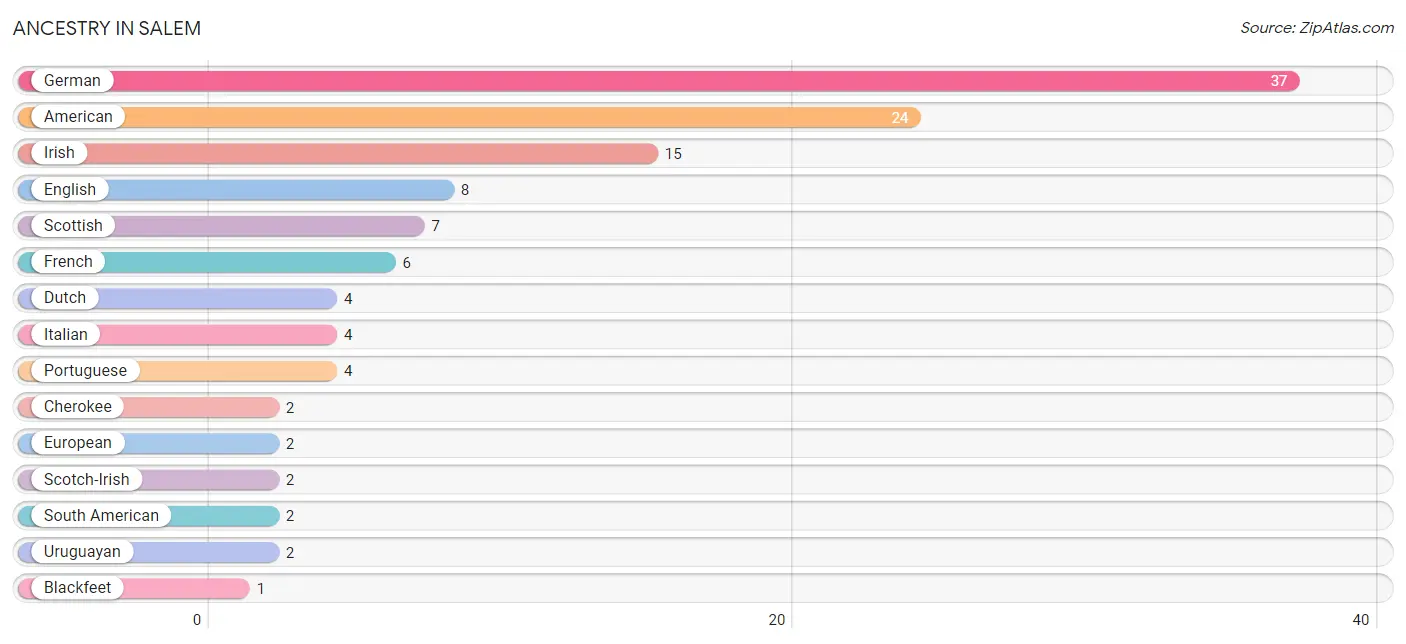
| Ancestry | # Population | % Population |
| American | 24 | 16.6% |
| Blackfeet | 1 | 0.7% |
| Cherokee | 2 | 1.4% |
| Dutch | 4 | 2.8% |
| English | 8 | 5.5% |
| European | 2 | 1.4% |
| French | 6 | 4.1% |
| German | 37 | 25.5% |
| Irish | 15 | 10.3% |
| Italian | 4 | 2.8% |
| Polish | 1 | 0.7% |
| Portuguese | 4 | 2.8% |
| Scotch-Irish | 2 | 1.4% |
| Scottish | 7 | 4.8% |
| South American | 2 | 1.4% |
| Thai | 1 | 0.7% |
| Uruguayan | 2 | 1.4% | View All 17 Rows |
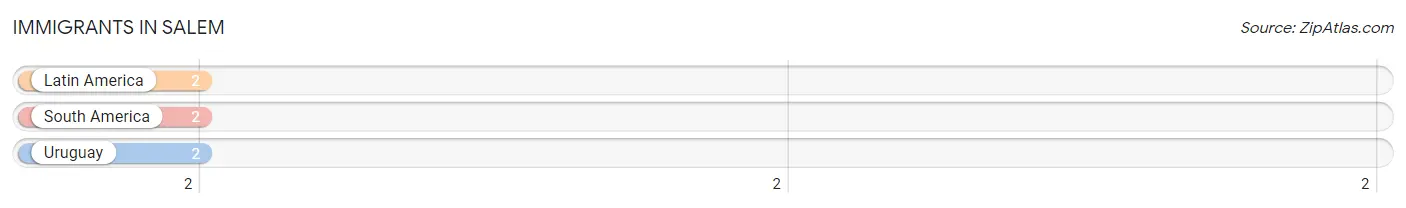
Immigrants in Salem
The most numerous immigrant groups reported in Salem came from Latin America (2 | 1.4%), South America (2 | 1.4%), and Uruguay (2 | 1.4%), together accounting for 4.1% of all Salem residents.
| Immigration Origin | # Population | % Population |
| Latin America | 2 | 1.4% |
| South America | 2 | 1.4% |
| Uruguay | 2 | 1.4% | View All 3 Rows |
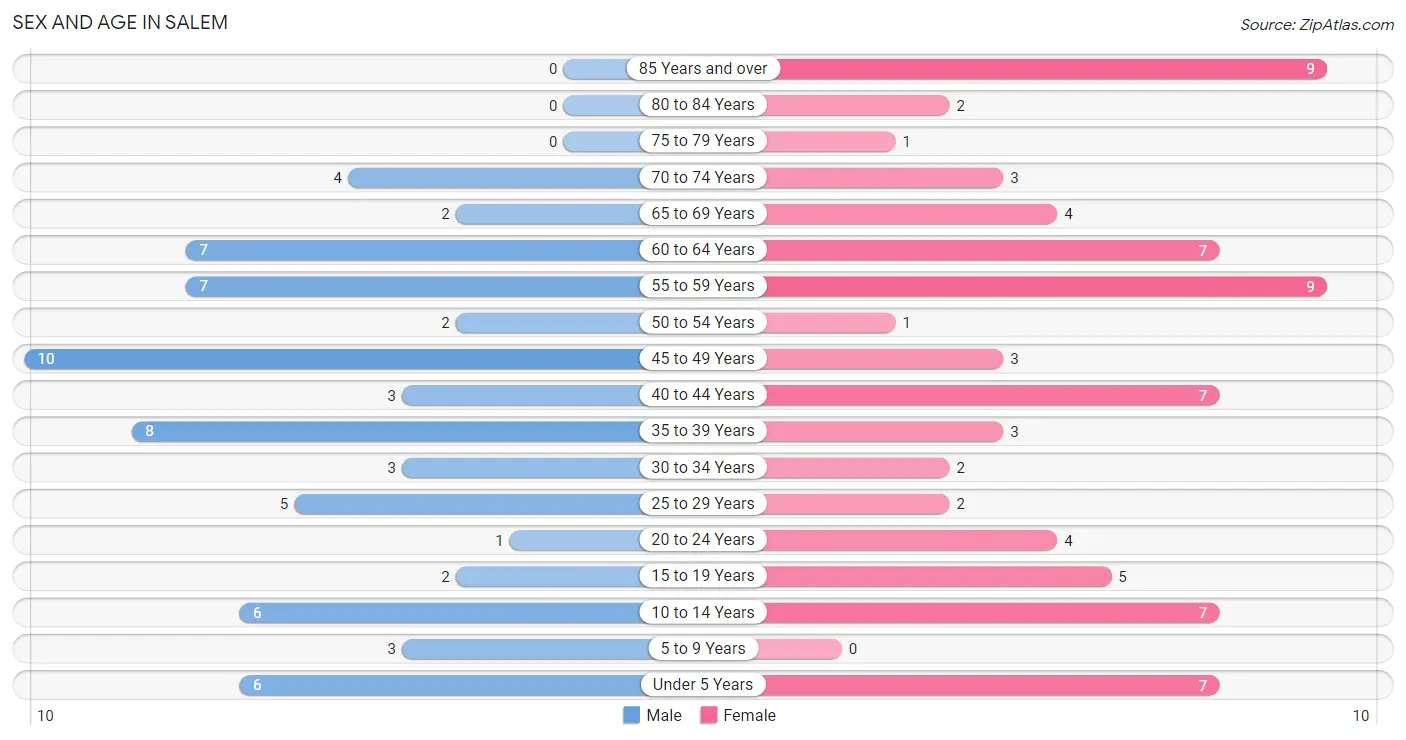
Sex and Age in Salem
Sex and Age in Salem
The most populous age groups in Salem are 45 to 49 Years (10 | 14.5%) for men and 55 to 59 Years (9 | 11.8%) for women.
| Age Bracket | Male | Female |
| Under 5 Years | 6 (8.7%) | 7 (9.2%) |
| 5 to 9 Years | 3 (4.3%) | 0 (0.0%) |
| 10 to 14 Years | 6 (8.7%) | 7 (9.2%) |
| 15 to 19 Years | 2 (2.9%) | 5 (6.6%) |
| 20 to 24 Years | 1 (1.5%) | 4 (5.3%) |
| 25 to 29 Years | 5 (7.2%) | 2 (2.6%) |
| 30 to 34 Years | 3 (4.3%) | 2 (2.6%) |
| 35 to 39 Years | 8 (11.6%) | 3 (4.0%) |
| 40 to 44 Years | 3 (4.3%) | 7 (9.2%) |
| 45 to 49 Years | 10 (14.5%) | 3 (4.0%) |
| 50 to 54 Years | 2 (2.9%) | 1 (1.3%) |
| 55 to 59 Years | 7 (10.1%) | 9 (11.8%) |
| 60 to 64 Years | 7 (10.1%) | 7 (9.2%) |
| 65 to 69 Years | 2 (2.9%) | 4 (5.3%) |
| 70 to 74 Years | 4 (5.8%) | 3 (4.0%) |
| 75 to 79 Years | 0 (0.0%) | 1 (1.3%) |
| 80 to 84 Years | 0 (0.0%) | 2 (2.6%) |
| 85 Years and over | 0 (0.0%) | 9 (11.8%) |
| Total | 69 (100.0%) | 76 (100.0%) |
Families and Households in Salem
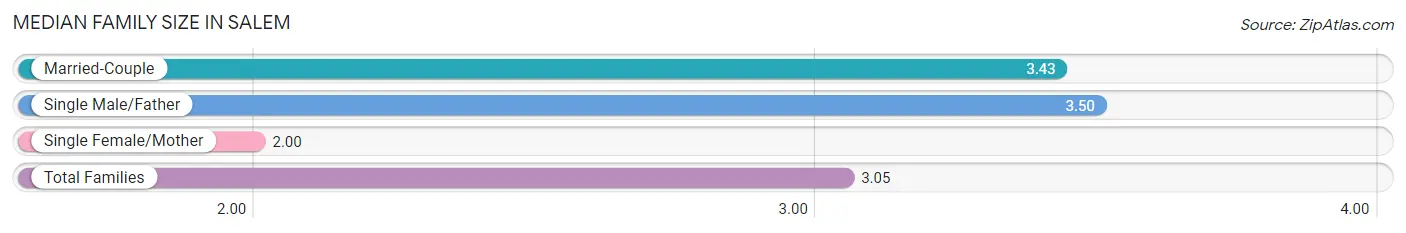
Median Family Size in Salem
The median family size in Salem is 3.05 persons per family, with single male/father families (2 | 4.9%) accounting for the largest median family size of 3.5 persons per family. On the other hand, single female/mother families (11 | 26.8%) represent the smallest median family size with 2.00 persons per family.
| Family Type | # Families | Family Size |
| Married-Couple | 28 (68.3%) | 3.43 |
| Single Male/Father | 2 (4.9%) | 3.50 |
| Single Female/Mother | 11 (26.8%) | 2.00 |
| Total Families | 41 (100.0%) | 3.05 |
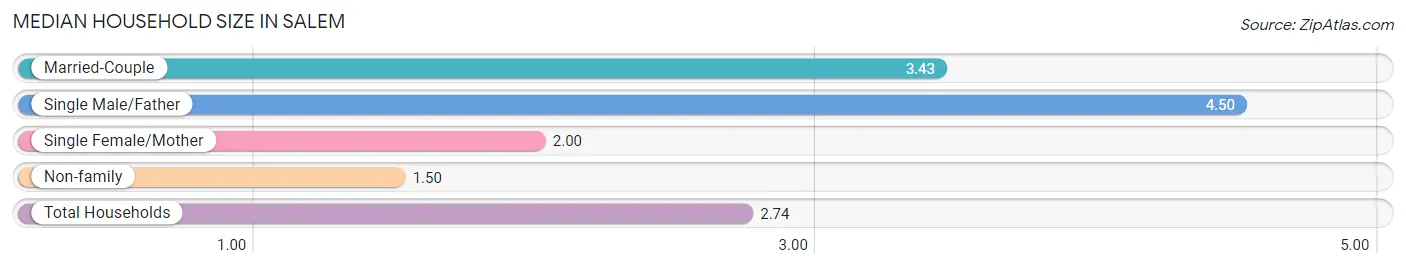
Median Household Size in Salem
The median household size in Salem is 2.74 persons per household, with single male/father households (2 | 3.8%) accounting for the largest median household size of 4.5 persons per household. non-family households (12 | 22.6%) represent the smallest median household size with 1.50 persons per household.
| Household Type | # Households | Household Size |
| Married-Couple | 28 (52.8%) | 3.43 |
| Single Male/Father | 2 (3.8%) | 4.50 |
| Single Female/Mother | 11 (20.7%) | 2.00 |
| Non-family | 12 (22.6%) | 1.50 |
| Total Households | 53 (100.0%) | 2.74 |
Household Size by Marriage Status in Salem
Out of a total of 53 households in Salem, 41 (77.4%) are family households, while 12 (22.6%) are nonfamily households. The most numerous type of family households are 2-person households, comprising 22, and the most common type of nonfamily households are 1-person households, comprising 7.
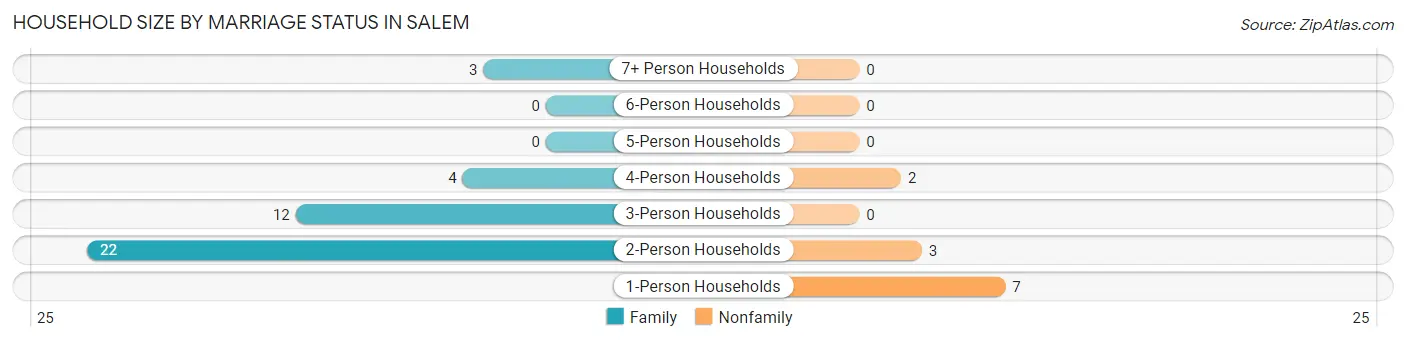
| Household Size | Family Households | Nonfamily Households |
| 1-Person Households | - | 7 (13.2%) |
| 2-Person Households | 22 (41.5%) | 3 (5.7%) |
| 3-Person Households | 12 (22.6%) | 0 (0.0%) |
| 4-Person Households | 4 (7.5%) | 2 (3.8%) |
| 5-Person Households | 0 (0.0%) | 0 (0.0%) |
| 6-Person Households | 0 (0.0%) | 0 (0.0%) |
| 7+ Person Households | 3 (5.7%) | 0 (0.0%) |
| Total | 41 (77.4%) | 12 (22.6%) |
Female Fertility in Salem
Fertility by Age in Salem
Average fertility rate in Salem is 74.0 births per 1,000 women. Women in the age bracket of 20 to 34 years have the highest fertility rate with 250.0 births per 1,000 women. Women in the age bracket of 20 to 34 years acount for 100.0% of all women with births.
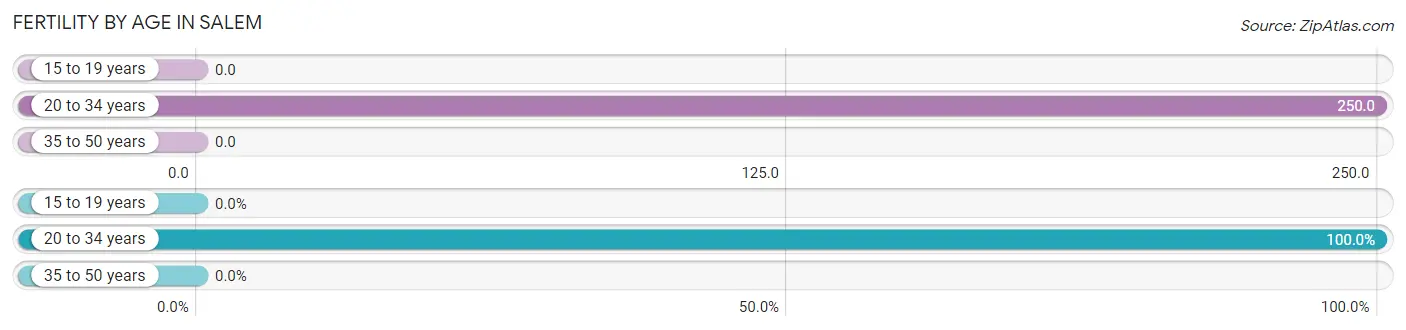
| Age Bracket | Women with Births | Births / 1,000 Women |
| 15 to 19 years | 0 (0.0%) | 0.0 |
| 20 to 34 years | 2 (100.0%) | 250.0 |
| 35 to 50 years | 0 (0.0%) | 0.0 |
| Total | 2 (100.0%) | 74.0 |
Fertility by Age by Marriage Status in Salem
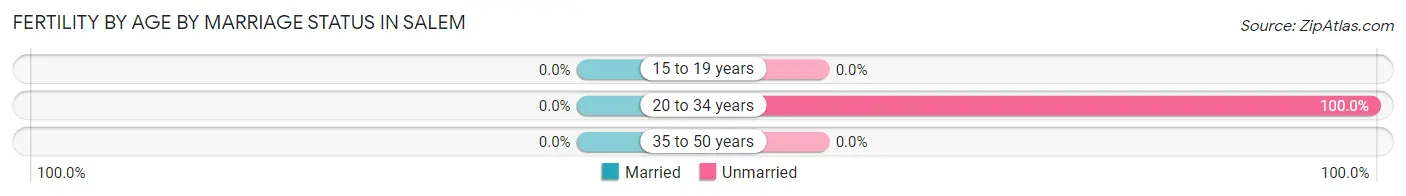
| Age Bracket | Married | Unmarried |
| 15 to 19 years | 0 (0.0%) | 0 (0.0%) |
| 20 to 34 years | 0 (0.0%) | 2 (100.0%) |
| 35 to 50 years | 0 (0.0%) | 0 (0.0%) |
| Total | 0 (0.0%) | 2 (100.0%) |
Fertility by Education in Salem
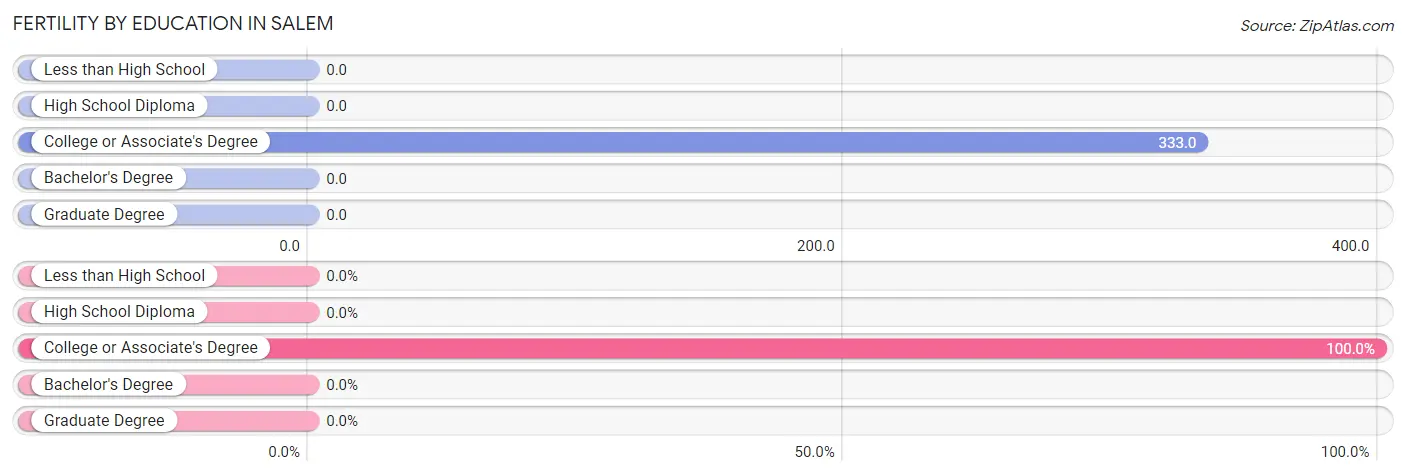
| Educational Attainment | Women with Births | Births / 1,000 Women |
| Less than High School | 0 (0.0%) | 0.0 |
| High School Diploma | 0 (0.0%) | 0.0 |
| College or Associate's Degree | 2 (100.0%) | 333.0 |
| Bachelor's Degree | 0 (0.0%) | 0.0 |
| Graduate Degree | 0 (0.0%) | 0.0 |
| Total | 2 (100.0%) | 74.0 |
Fertility by Education by Marriage Status in Salem
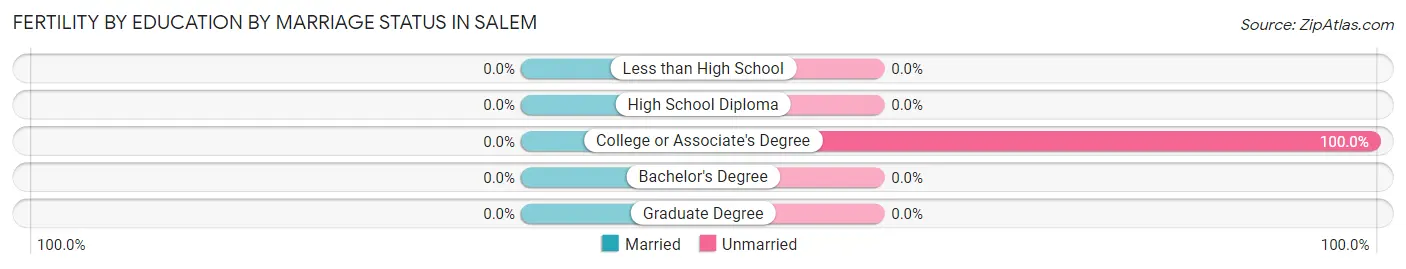
| Educational Attainment | Married | Unmarried |
| Less than High School | 0 (0.0%) | 0 (0.0%) |
| High School Diploma | 0 (0.0%) | 0 (0.0%) |
| College or Associate's Degree | 0 (0.0%) | 2 (100.0%) |
| Bachelor's Degree | 0 (0.0%) | 0 (0.0%) |
| Graduate Degree | 0 (0.0%) | 0 (0.0%) |
| Total | 0 (0.0%) | 2 (100.0%) |
Employment Characteristics in Salem
Employment by Class of Employer in Salem
Among the 50 employed individuals in Salem, private company employees (40 | 80.0%), local government employees (4 | 8.0%), and self-employed (incorporated) (2 | 4.0%) make up the most common classes of employment.
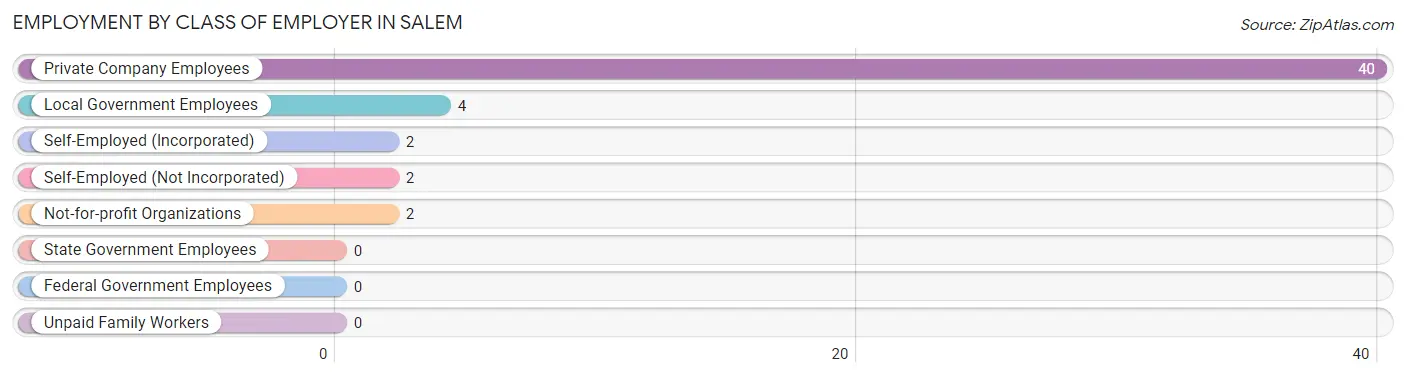
| Employer Class | # Employees | % Employees |
| Private Company Employees | 40 | 80.0% |
| Self-Employed (Incorporated) | 2 | 4.0% |
| Self-Employed (Not Incorporated) | 2 | 4.0% |
| Not-for-profit Organizations | 2 | 4.0% |
| Local Government Employees | 4 | 8.0% |
| State Government Employees | 0 | 0.0% |
| Federal Government Employees | 0 | 0.0% |
| Unpaid Family Workers | 0 | 0.0% |
| Total | 50 | 100.0% |
Employment Status by Age in Salem
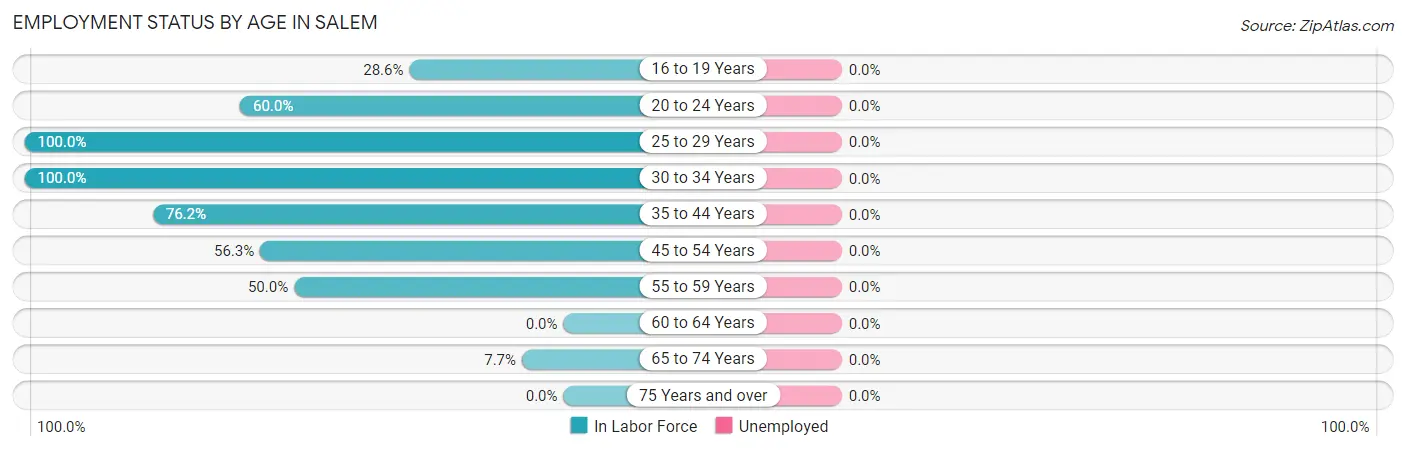
| Age Bracket | In Labor Force | Unemployed |
| 16 to 19 Years | 2 (28.6%) | 0 (0.0%) |
| 20 to 24 Years | 3 (60.0%) | 0 (0.0%) |
| 25 to 29 Years | 7 (100.0%) | 0 (0.0%) |
| 30 to 34 Years | 5 (100.0%) | 0 (0.0%) |
| 35 to 44 Years | 16 (76.2%) | 0 (0.0%) |
| 45 to 54 Years | 9 (56.3%) | 0 (0.0%) |
| 55 to 59 Years | 8 (50.0%) | 0 (0.0%) |
| 60 to 64 Years | 0 (0.0%) | 0 (0.0%) |
| 65 to 74 Years | 1 (7.7%) | 0 (0.0%) |
| 75 Years and over | 0 (0.0%) | 0 (0.0%) |
| Total | 51 (44.0%) | 0 (0.0%) |
Employment Status by Educational Attainment in Salem
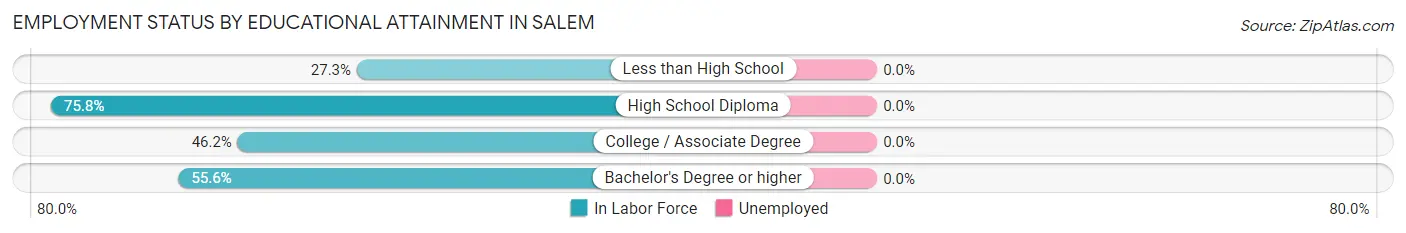
| Educational Attainment | In Labor Force | Unemployed |
| Less than High School | 3 (27.3%) | 0 (0.0%) |
| High School Diploma | 25 (75.8%) | 0 (0.0%) |
| College / Associate Degree | 12 (46.2%) | 0 (0.0%) |
| Bachelor's Degree or higher | 5 (55.6%) | 0 (0.0%) |
| Total | 45 (57.0%) | 0 (0.0%) |
Employment Occupations by Sex in Salem
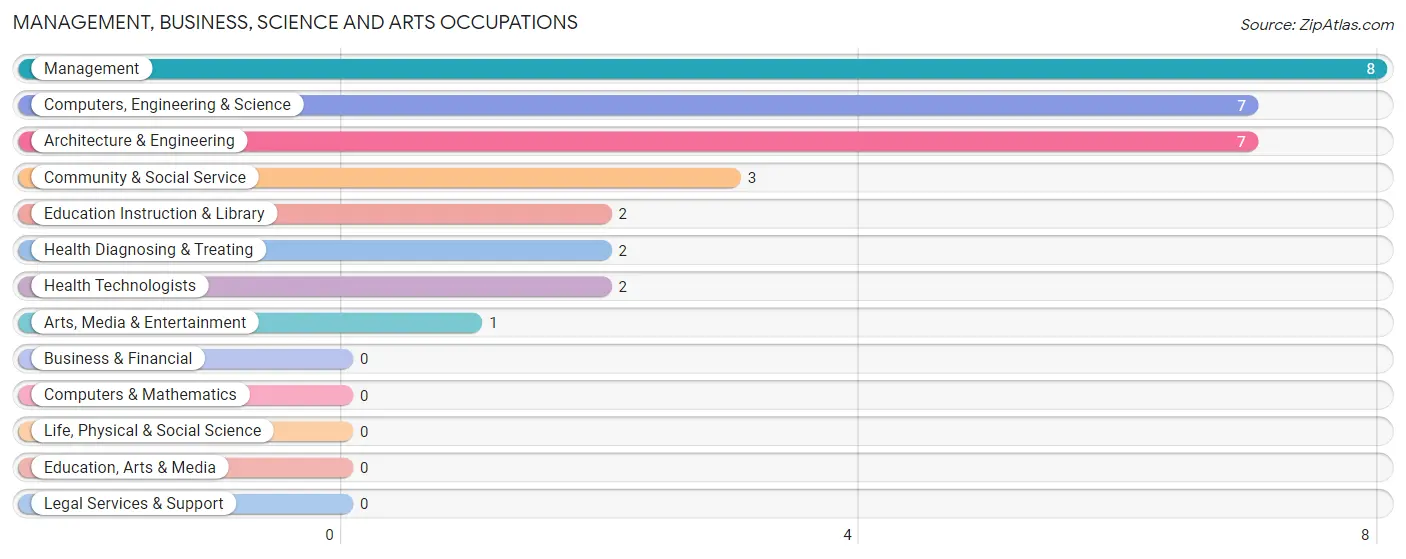
Management, Business, Science and Arts Occupations
The most common Management, Business, Science and Arts occupations in Salem are Management (8 | 15.7%), Computers, Engineering & Science (7 | 13.7%), Architecture & Engineering (7 | 13.7%), Community & Social Service (3 | 5.9%), and Education Instruction & Library (2 | 3.9%).
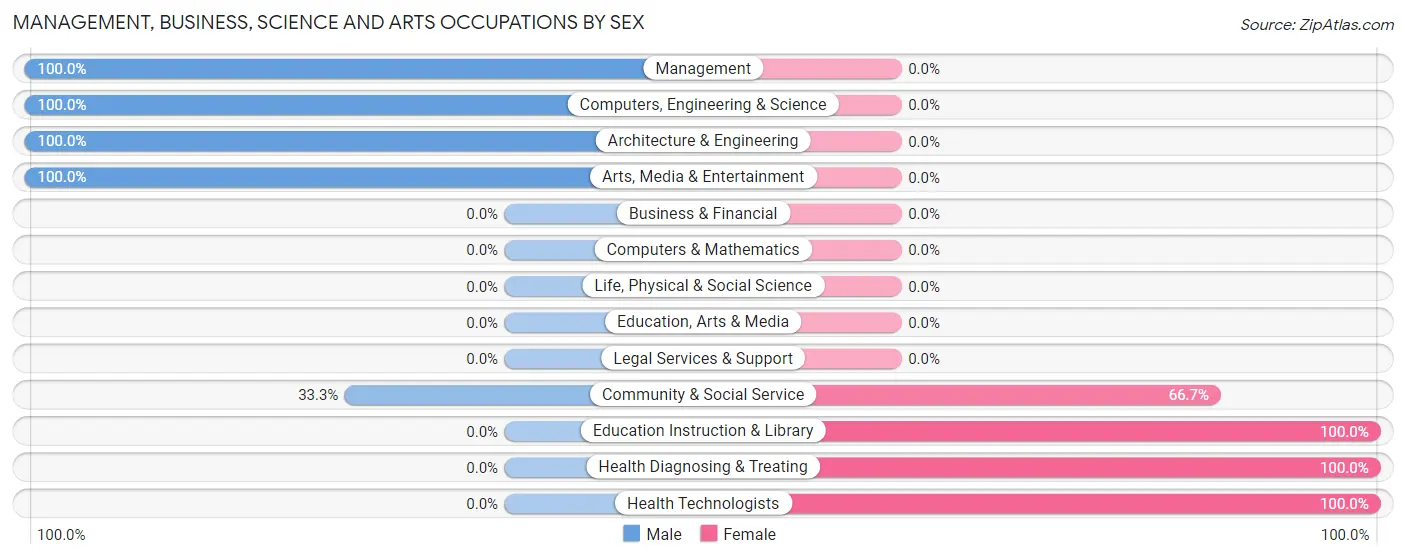
Management, Business, Science and Arts Occupations by Sex
Within the Management, Business, Science and Arts occupations in Salem, the most male-oriented occupations are Management (100.0%), Computers, Engineering & Science (100.0%), and Architecture & Engineering (100.0%), while the most female-oriented occupations are Education Instruction & Library (100.0%), Health Diagnosing & Treating (100.0%), and Health Technologists (100.0%).
| Occupation | Male | Female |
| Management | 8 (100.0%) | 0 (0.0%) |
| Business & Financial | 0 (0.0%) | 0 (0.0%) |
| Computers, Engineering & Science | 7 (100.0%) | 0 (0.0%) |
| Computers & Mathematics | 0 (0.0%) | 0 (0.0%) |
| Architecture & Engineering | 7 (100.0%) | 0 (0.0%) |
| Life, Physical & Social Science | 0 (0.0%) | 0 (0.0%) |
| Community & Social Service | 1 (33.3%) | 2 (66.7%) |
| Education, Arts & Media | 0 (0.0%) | 0 (0.0%) |
| Legal Services & Support | 0 (0.0%) | 0 (0.0%) |
| Education Instruction & Library | 0 (0.0%) | 2 (100.0%) |
| Arts, Media & Entertainment | 1 (100.0%) | 0 (0.0%) |
| Health Diagnosing & Treating | 0 (0.0%) | 2 (100.0%) |
| Health Technologists | 0 (0.0%) | 2 (100.0%) |
| Total (Category) | 16 (80.0%) | 4 (20.0%) |
| Total (Overall) | 30 (58.8%) | 21 (41.2%) |
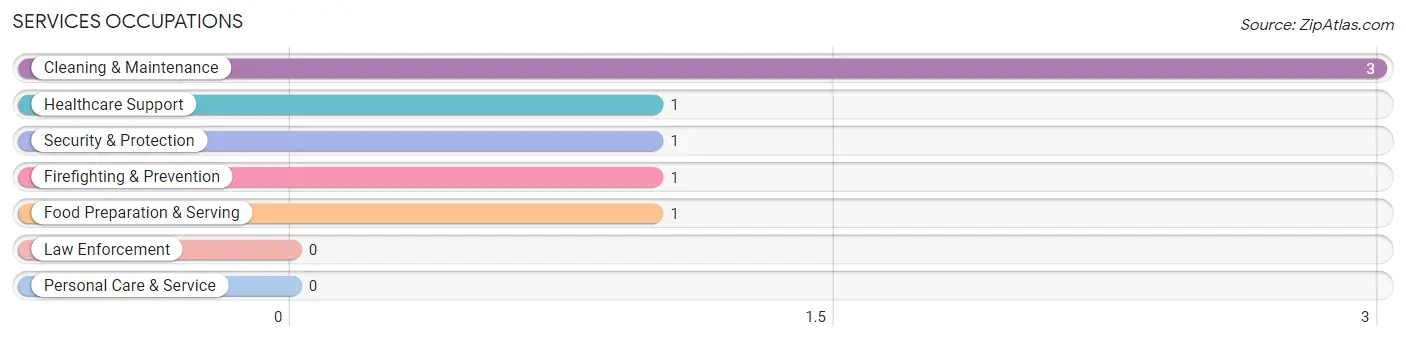
Services Occupations
The most common Services occupations in Salem are Cleaning & Maintenance (3 | 5.9%), Healthcare Support (1 | 2.0%), Security & Protection (1 | 2.0%), Firefighting & Prevention (1 | 2.0%), and Food Preparation & Serving (1 | 2.0%).
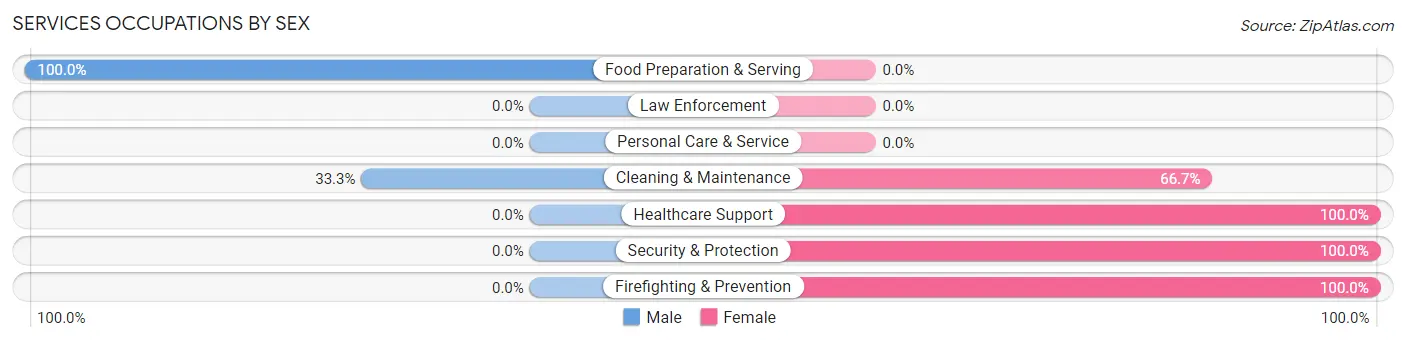
Services Occupations by Sex
Within the Services occupations in Salem, the most male-oriented occupations are Food Preparation & Serving (100.0%), and Cleaning & Maintenance (33.3%), while the most female-oriented occupations are Healthcare Support (100.0%), Security & Protection (100.0%), and Firefighting & Prevention (100.0%).
| Occupation | Male | Female |
| Healthcare Support | 0 (0.0%) | 1 (100.0%) |
| Security & Protection | 0 (0.0%) | 1 (100.0%) |
| Firefighting & Prevention | 0 (0.0%) | 1 (100.0%) |
| Law Enforcement | 0 (0.0%) | 0 (0.0%) |
| Food Preparation & Serving | 1 (100.0%) | 0 (0.0%) |
| Cleaning & Maintenance | 1 (33.3%) | 2 (66.7%) |
| Personal Care & Service | 0 (0.0%) | 0 (0.0%) |
| Total (Category) | 2 (33.3%) | 4 (66.7%) |
| Total (Overall) | 30 (58.8%) | 21 (41.2%) |
Sales and Office Occupations
The most common Sales and Office occupations in Salem are Office & Administration (4 | 7.8%), and Sales & Related (3 | 5.9%).
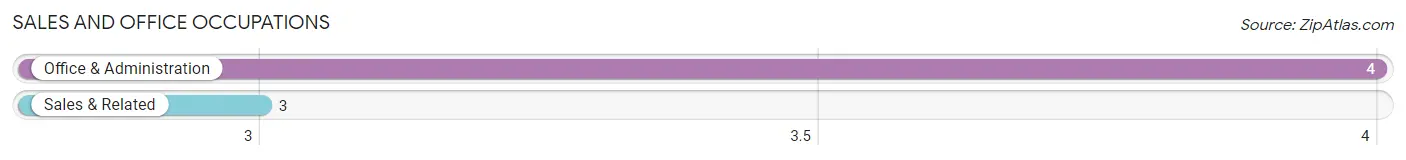
Sales and Office Occupations by Sex
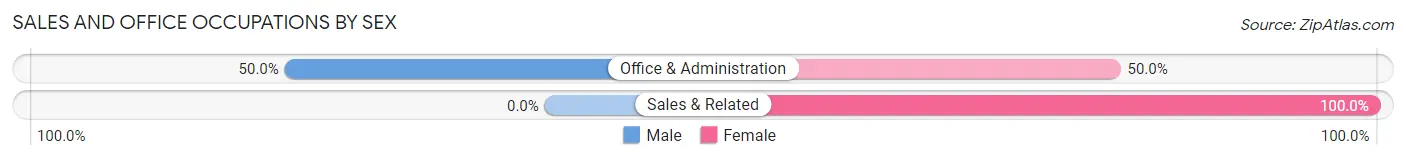
| Occupation | Male | Female |
| Sales & Related | 0 (0.0%) | 3 (100.0%) |
| Office & Administration | 2 (50.0%) | 2 (50.0%) |
| Total (Category) | 2 (28.6%) | 5 (71.4%) |
| Total (Overall) | 30 (58.8%) | 21 (41.2%) |
Natural Resources, Construction and Maintenance Occupations
The most common Natural Resources, Construction and Maintenance occupations in Salem are Construction & Extraction (6 | 11.8%), and Installation, Maintenance & Repair (2 | 3.9%).
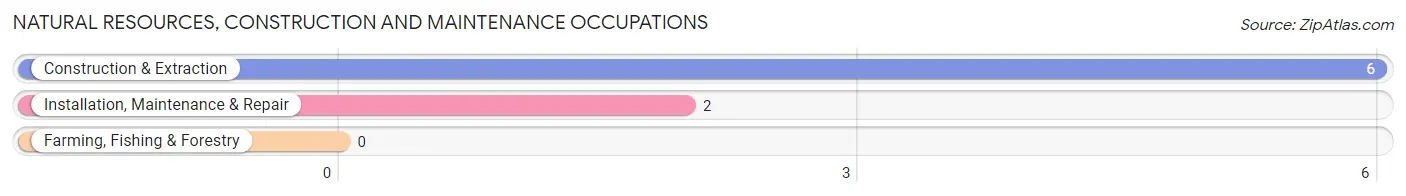
Natural Resources, Construction and Maintenance Occupations by Sex
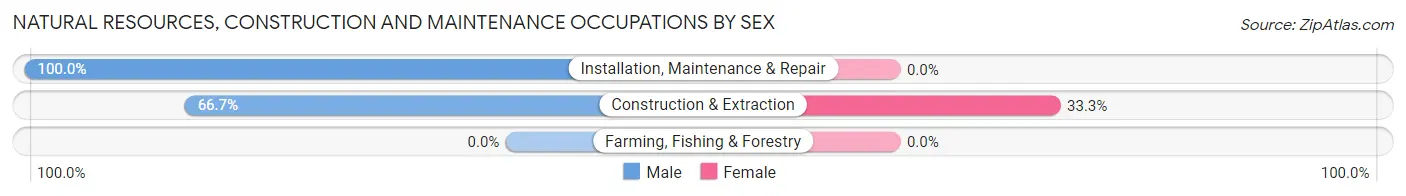
| Occupation | Male | Female |
| Farming, Fishing & Forestry | 0 (0.0%) | 0 (0.0%) |
| Construction & Extraction | 4 (66.7%) | 2 (33.3%) |
| Installation, Maintenance & Repair | 2 (100.0%) | 0 (0.0%) |
| Total (Category) | 6 (75.0%) | 2 (25.0%) |
| Total (Overall) | 30 (58.8%) | 21 (41.2%) |
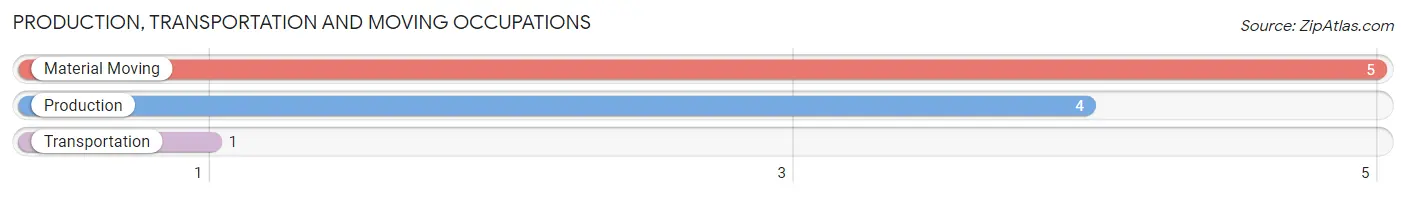
Production, Transportation and Moving Occupations
The most common Production, Transportation and Moving occupations in Salem are Material Moving (5 | 9.8%), Production (4 | 7.8%), and Transportation (1 | 2.0%).
Production, Transportation and Moving Occupations by Sex
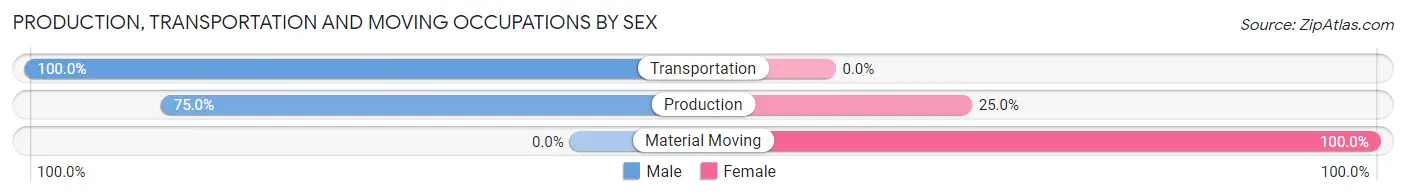
| Occupation | Male | Female |
| Production | 3 (75.0%) | 1 (25.0%) |
| Transportation | 1 (100.0%) | 0 (0.0%) |
| Material Moving | 0 (0.0%) | 5 (100.0%) |
| Total (Category) | 4 (40.0%) | 6 (60.0%) |
| Total (Overall) | 30 (58.8%) | 21 (41.2%) |
Employment Industries by Sex in Salem
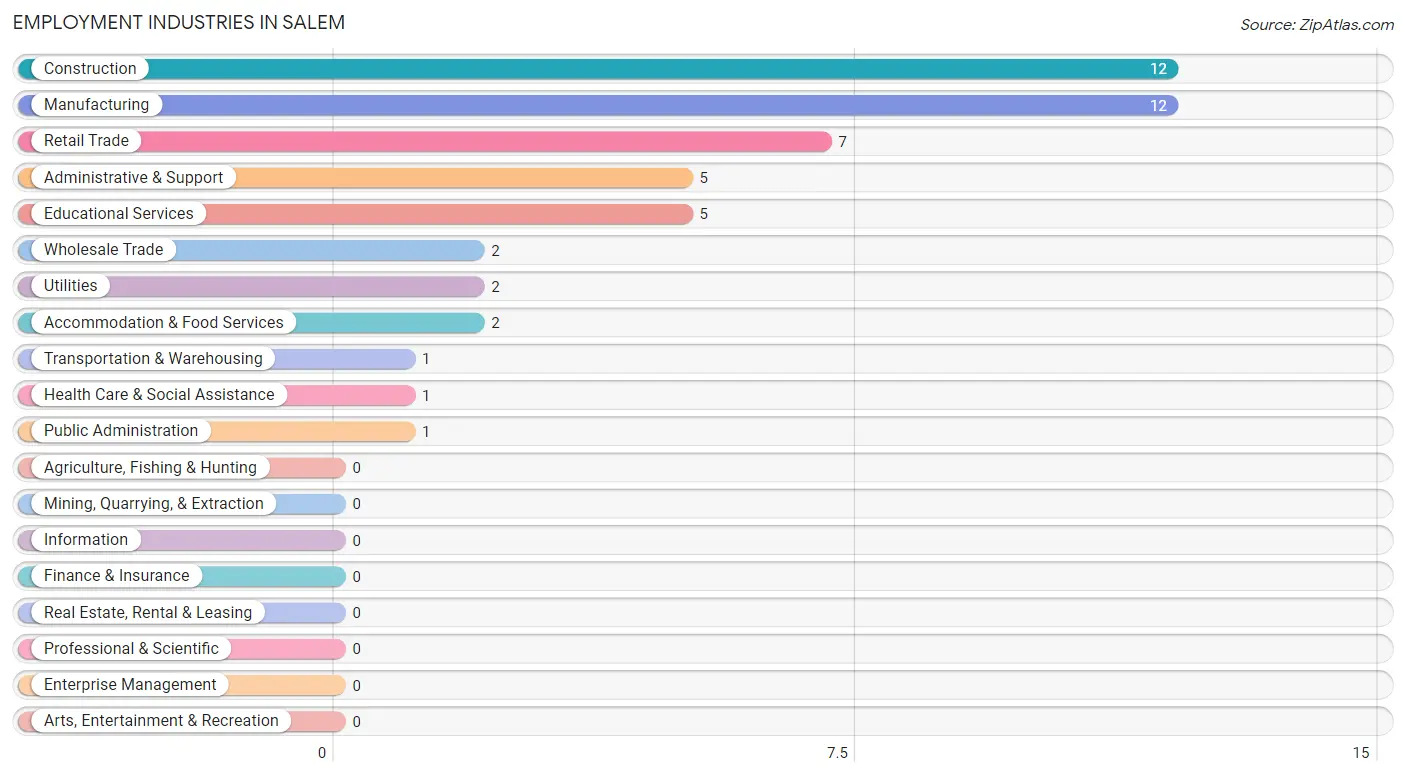
Employment Industries in Salem
The major employment industries in Salem include Construction (12 | 23.5%), Manufacturing (12 | 23.5%), Retail Trade (7 | 13.7%), Administrative & Support (5 | 9.8%), and Educational Services (5 | 9.8%).
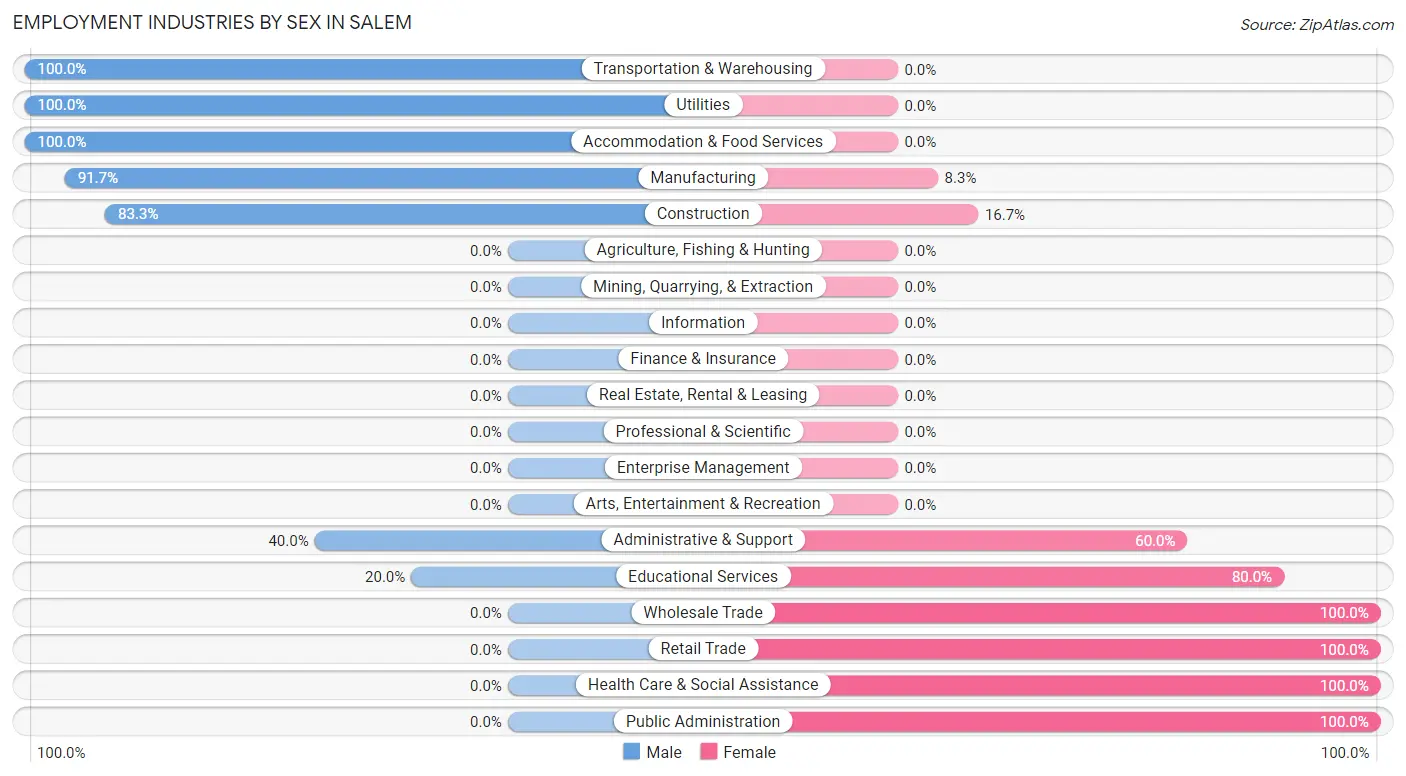
Employment Industries by Sex in Salem
The Salem industries that see more men than women are Transportation & Warehousing (100.0%), Utilities (100.0%), and Accommodation & Food Services (100.0%), whereas the industries that tend to have a higher number of women are Wholesale Trade (100.0%), Retail Trade (100.0%), and Health Care & Social Assistance (100.0%).
| Industry | Male | Female |
| Agriculture, Fishing & Hunting | 0 (0.0%) | 0 (0.0%) |
| Mining, Quarrying, & Extraction | 0 (0.0%) | 0 (0.0%) |
| Construction | 10 (83.3%) | 2 (16.7%) |
| Manufacturing | 11 (91.7%) | 1 (8.3%) |
| Wholesale Trade | 0 (0.0%) | 2 (100.0%) |
| Retail Trade | 0 (0.0%) | 7 (100.0%) |
| Transportation & Warehousing | 1 (100.0%) | 0 (0.0%) |
| Utilities | 2 (100.0%) | 0 (0.0%) |
| Information | 0 (0.0%) | 0 (0.0%) |
| Finance & Insurance | 0 (0.0%) | 0 (0.0%) |
| Real Estate, Rental & Leasing | 0 (0.0%) | 0 (0.0%) |
| Professional & Scientific | 0 (0.0%) | 0 (0.0%) |
| Enterprise Management | 0 (0.0%) | 0 (0.0%) |
| Administrative & Support | 2 (40.0%) | 3 (60.0%) |
| Educational Services | 1 (20.0%) | 4 (80.0%) |
| Health Care & Social Assistance | 0 (0.0%) | 1 (100.0%) |
| Arts, Entertainment & Recreation | 0 (0.0%) | 0 (0.0%) |
| Accommodation & Food Services | 2 (100.0%) | 0 (0.0%) |
| Public Administration | 0 (0.0%) | 1 (100.0%) |
| Total | 30 (58.8%) | 21 (41.2%) |
Education in Salem
School Enrollment in Salem
The most common levels of schooling among the 23 students in Salem are middle school (11 | 47.8%), nursery / preschool (5 | 21.7%), and elementary school (5 | 21.7%).
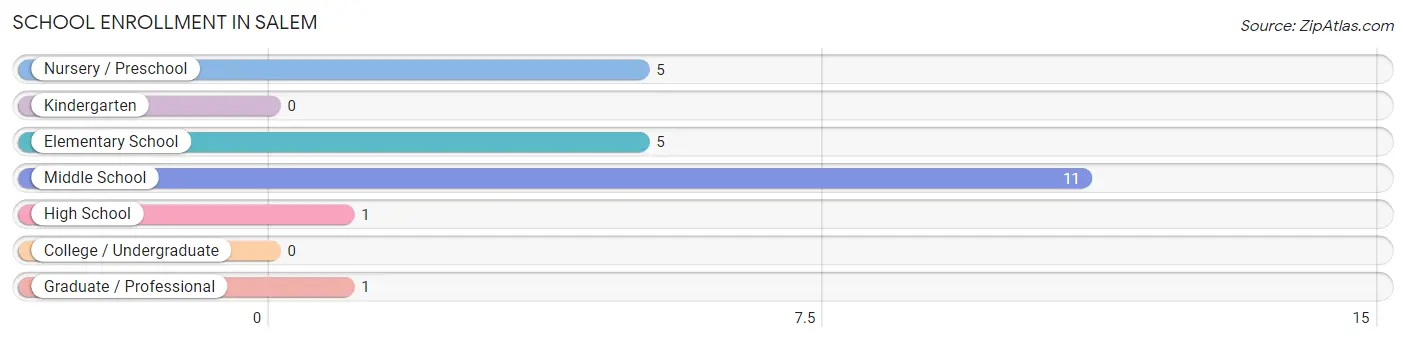
| School Level | # Students | % Students |
| Nursery / Preschool | 5 | 21.7% |
| Kindergarten | 0 | 0.0% |
| Elementary School | 5 | 21.7% |
| Middle School | 11 | 47.8% |
| High School | 1 | 4.3% |
| College / Undergraduate | 0 | 0.0% |
| Graduate / Professional | 1 | 4.3% |
| Total | 23 | 100.0% |
School Enrollment by Age by Funding Source in Salem
Out of a total of 23 students who are enrolled in schools in Salem, 8 (34.8%) attend a private institution, while the remaining 15 (65.2%) are enrolled in public schools. The age group of 3 to 4 year olds has the highest likelihood of being enrolled in private schools, with 5 (100.0% in the age bracket) enrolled. Conversely, the age group of 15 to 17 year olds has the lowest likelihood of being enrolled in a private school, with 1 (100.0% in the age bracket) attending a public institution.
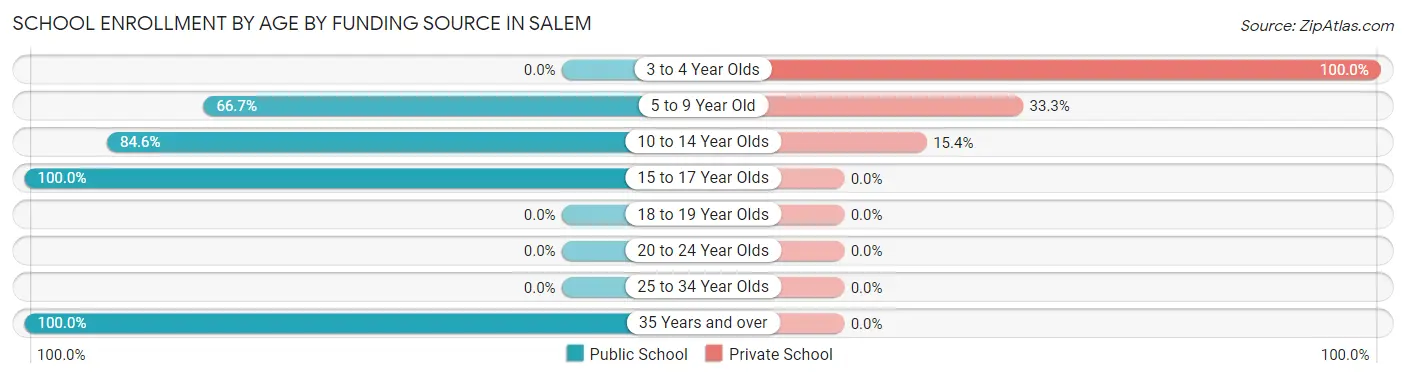
| Age Bracket | Public School | Private School |
| 3 to 4 Year Olds | 0 (0.0%) | 5 (100.0%) |
| 5 to 9 Year Old | 2 (66.7%) | 1 (33.3%) |
| 10 to 14 Year Olds | 11 (84.6%) | 2 (15.4%) |
| 15 to 17 Year Olds | 1 (100.0%) | 0 (0.0%) |
| 18 to 19 Year Olds | 0 (0.0%) | 0 (0.0%) |
| 20 to 24 Year Olds | 0 (0.0%) | 0 (0.0%) |
| 25 to 34 Year Olds | 0 (0.0%) | 0 (0.0%) |
| 35 Years and over | 1 (100.0%) | 0 (0.0%) |
| Total | 15 (65.2%) | 8 (34.8%) |
Educational Attainment by Field of Study in Salem
Education (4 | 44.4%), science & technology (2 | 22.2%), visual & performing arts (2 | 22.2%), and bio, nature & agricultural (1 | 11.1%) are the most common fields of study among 9 individuals in Salem who have obtained a bachelor's degree or higher.
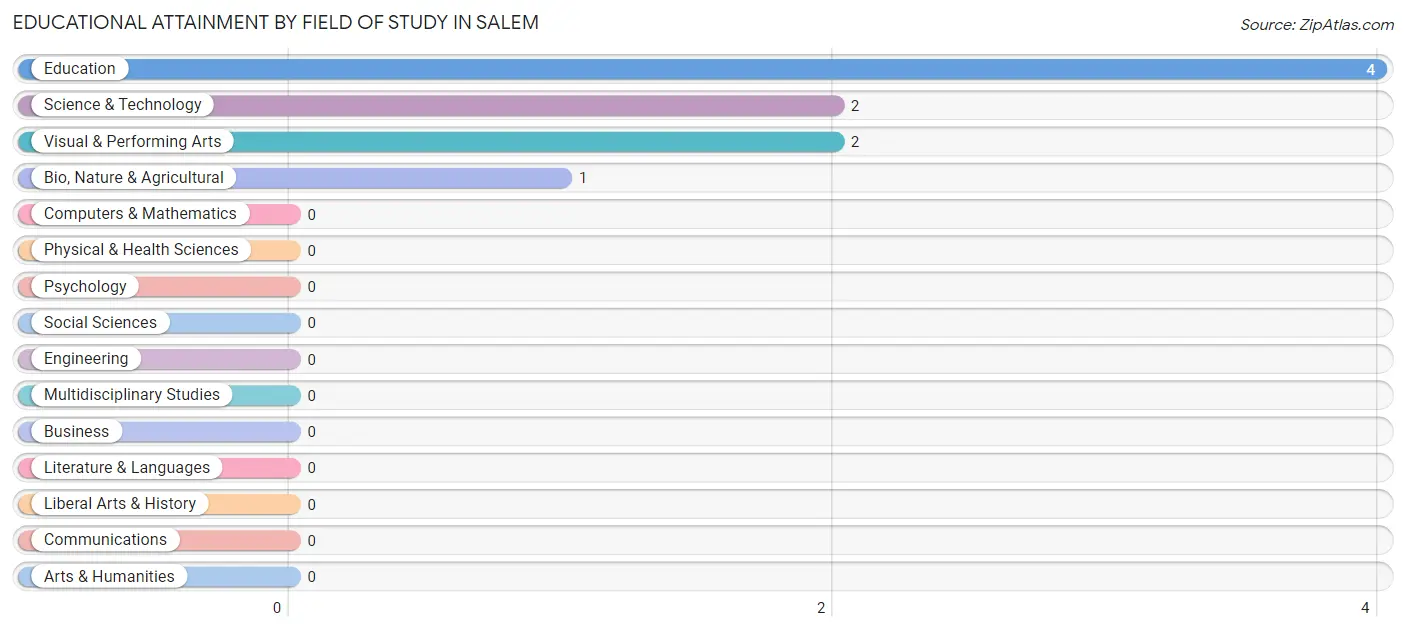
| Field of Study | # Graduates | % Graduates |
| Computers & Mathematics | 0 | 0.0% |
| Bio, Nature & Agricultural | 1 | 11.1% |
| Physical & Health Sciences | 0 | 0.0% |
| Psychology | 0 | 0.0% |
| Social Sciences | 0 | 0.0% |
| Engineering | 0 | 0.0% |
| Multidisciplinary Studies | 0 | 0.0% |
| Science & Technology | 2 | 22.2% |
| Business | 0 | 0.0% |
| Education | 4 | 44.4% |
| Literature & Languages | 0 | 0.0% |
| Liberal Arts & History | 0 | 0.0% |
| Visual & Performing Arts | 2 | 22.2% |
| Communications | 0 | 0.0% |
| Arts & Humanities | 0 | 0.0% |
| Total | 9 | 100.0% |
Transportation & Commute in Salem
Vehicle Availability by Sex in Salem
The most prevalent vehicle ownership categories in Salem are males with 5 or more vehicles (14, accounting for 48.3%) and females with 5 or more vehicles (7, making up 66.7%).
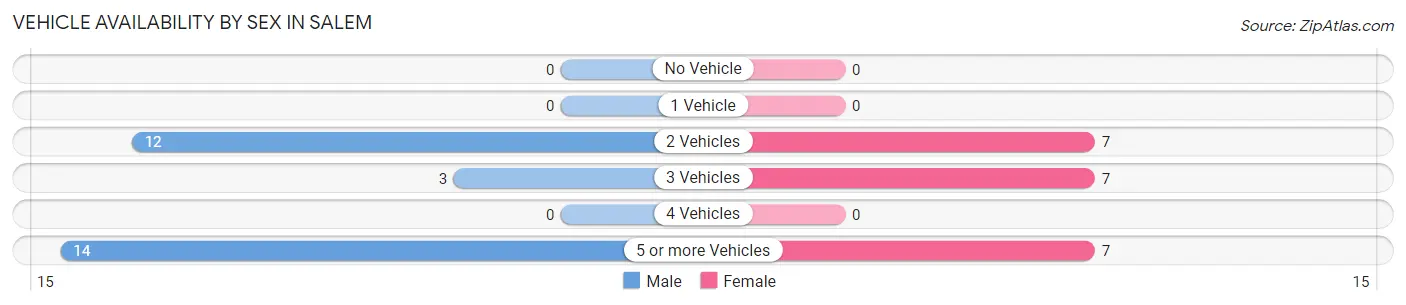
| Vehicles Available | Male | Female |
| No Vehicle | 0 (0.0%) | 0 (0.0%) |
| 1 Vehicle | 0 (0.0%) | 0 (0.0%) |
| 2 Vehicles | 12 (41.4%) | 7 (33.3%) |
| 3 Vehicles | 3 (10.3%) | 7 (33.3%) |
| 4 Vehicles | 0 (0.0%) | 0 (0.0%) |
| 5 or more Vehicles | 14 (48.3%) | 7 (33.3%) |
| Total | 29 (100.0%) | 21 (100.0%) |
Commute Time in Salem
The most frequently occuring commute durations in Salem are 25 to 29 minutes (13 commuters, 26.5%), 30 to 34 minutes (11 commuters, 22.5%), and 20 to 24 minutes (9 commuters, 18.4%).
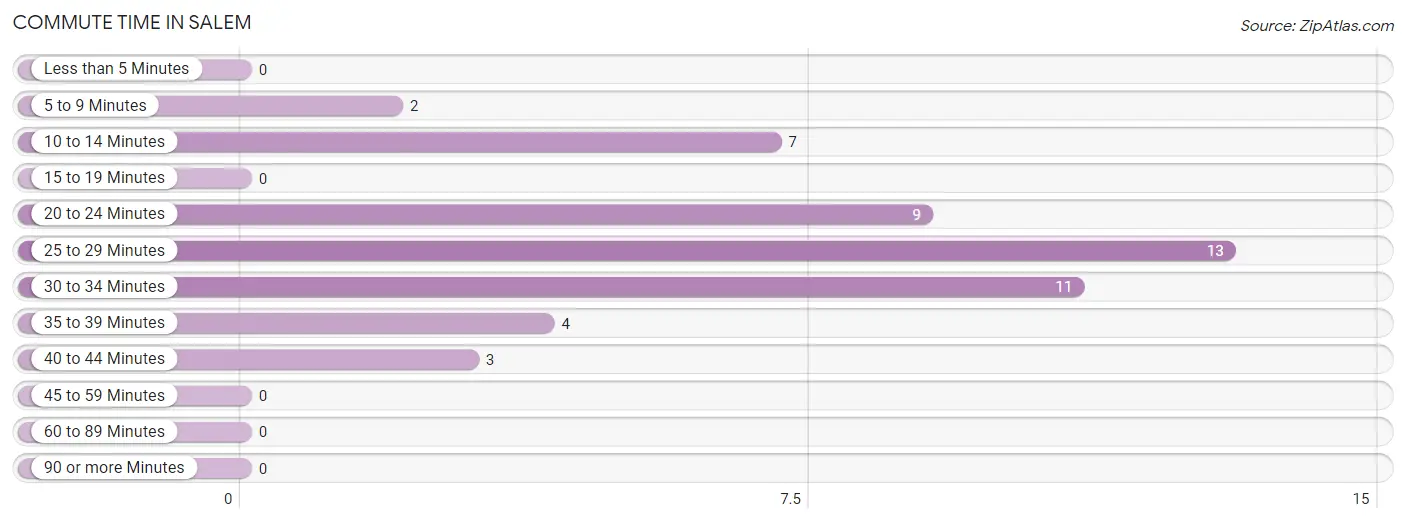
| Commute Time | # Commuters | % Commuters |
| Less than 5 Minutes | 0 | 0.0% |
| 5 to 9 Minutes | 2 | 4.1% |
| 10 to 14 Minutes | 7 | 14.3% |
| 15 to 19 Minutes | 0 | 0.0% |
| 20 to 24 Minutes | 9 | 18.4% |
| 25 to 29 Minutes | 13 | 26.5% |
| 30 to 34 Minutes | 11 | 22.5% |
| 35 to 39 Minutes | 4 | 8.2% |
| 40 to 44 Minutes | 3 | 6.1% |
| 45 to 59 Minutes | 0 | 0.0% |
| 60 to 89 Minutes | 0 | 0.0% |
| 90 or more Minutes | 0 | 0.0% |
Commute Time by Sex in Salem
The most common commute times in Salem are 30 to 34 minutes (9 commuters, 31.0%) for males and 20 to 24 minutes (6 commuters, 30.0%) for females.
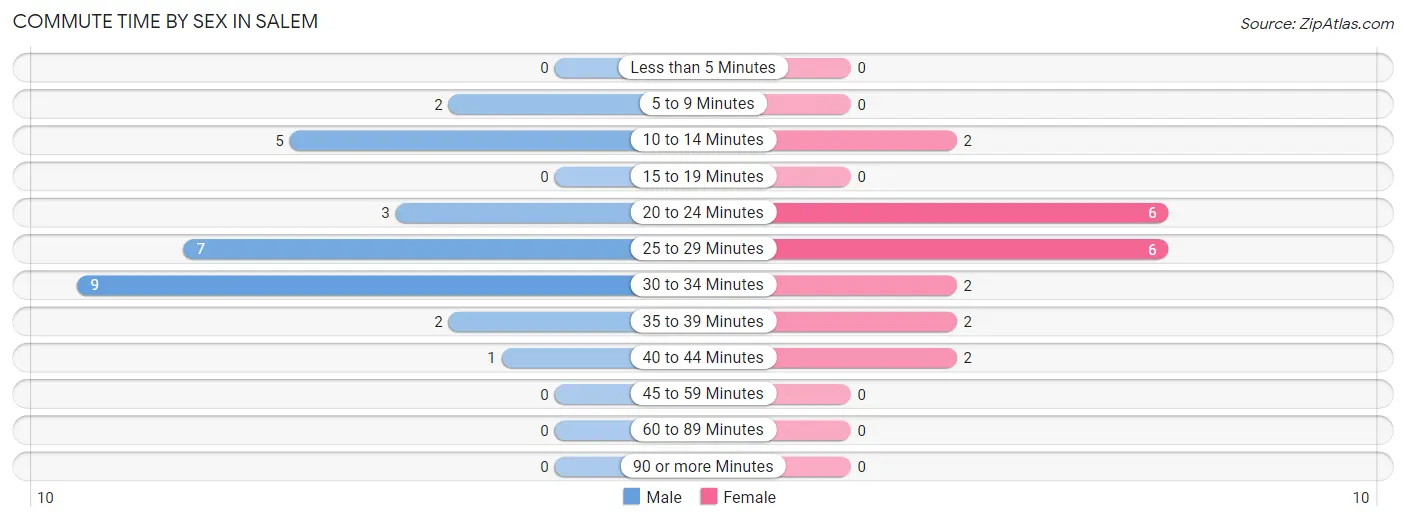
| Commute Time | Male | Female |
| Less than 5 Minutes | 0 (0.0%) | 0 (0.0%) |
| 5 to 9 Minutes | 2 (6.9%) | 0 (0.0%) |
| 10 to 14 Minutes | 5 (17.2%) | 2 (10.0%) |
| 15 to 19 Minutes | 0 (0.0%) | 0 (0.0%) |
| 20 to 24 Minutes | 3 (10.3%) | 6 (30.0%) |
| 25 to 29 Minutes | 7 (24.1%) | 6 (30.0%) |
| 30 to 34 Minutes | 9 (31.0%) | 2 (10.0%) |
| 35 to 39 Minutes | 2 (6.9%) | 2 (10.0%) |
| 40 to 44 Minutes | 1 (3.5%) | 2 (10.0%) |
| 45 to 59 Minutes | 0 (0.0%) | 0 (0.0%) |
| 60 to 89 Minutes | 0 (0.0%) | 0 (0.0%) |
| 90 or more Minutes | 0 (0.0%) | 0 (0.0%) |
Time of Departure to Work by Sex in Salem
The most frequent times of departure to work in Salem are 4:00 PM to 11:59 PM (7, 24.1%) for males and 4:00 PM to 11:59 PM (6, 30.0%) for females.
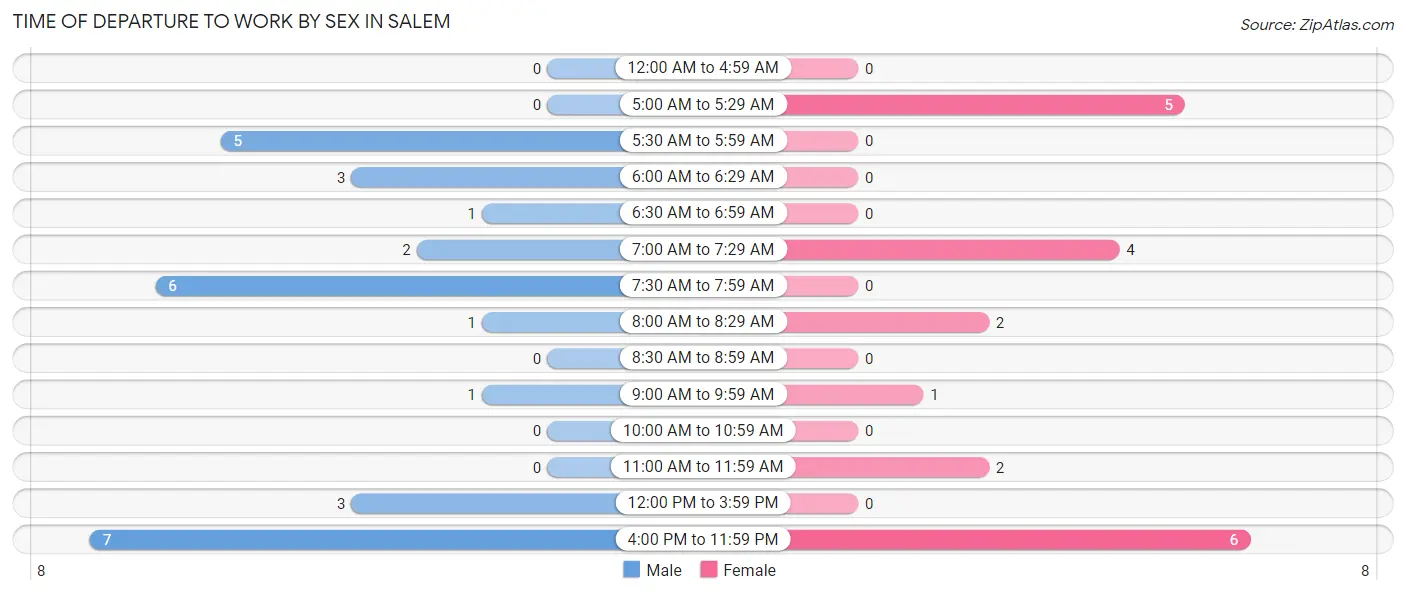
| Time of Departure | Male | Female |
| 12:00 AM to 4:59 AM | 0 (0.0%) | 0 (0.0%) |
| 5:00 AM to 5:29 AM | 0 (0.0%) | 5 (25.0%) |
| 5:30 AM to 5:59 AM | 5 (17.2%) | 0 (0.0%) |
| 6:00 AM to 6:29 AM | 3 (10.3%) | 0 (0.0%) |
| 6:30 AM to 6:59 AM | 1 (3.5%) | 0 (0.0%) |
| 7:00 AM to 7:29 AM | 2 (6.9%) | 4 (20.0%) |
| 7:30 AM to 7:59 AM | 6 (20.7%) | 0 (0.0%) |
| 8:00 AM to 8:29 AM | 1 (3.5%) | 2 (10.0%) |
| 8:30 AM to 8:59 AM | 0 (0.0%) | 0 (0.0%) |
| 9:00 AM to 9:59 AM | 1 (3.5%) | 1 (5.0%) |
| 10:00 AM to 10:59 AM | 0 (0.0%) | 0 (0.0%) |
| 11:00 AM to 11:59 AM | 0 (0.0%) | 2 (10.0%) |
| 12:00 PM to 3:59 PM | 3 (10.3%) | 0 (0.0%) |
| 4:00 PM to 11:59 PM | 7 (24.1%) | 6 (30.0%) |
| Total | 29 (100.0%) | 20 (100.0%) |
Housing Occupancy in Salem
Occupancy by Ownership in Salem
Of the total 53 dwellings in Salem, owner-occupied units account for 49 (92.4%), while renter-occupied units make up 4 (7.5%).
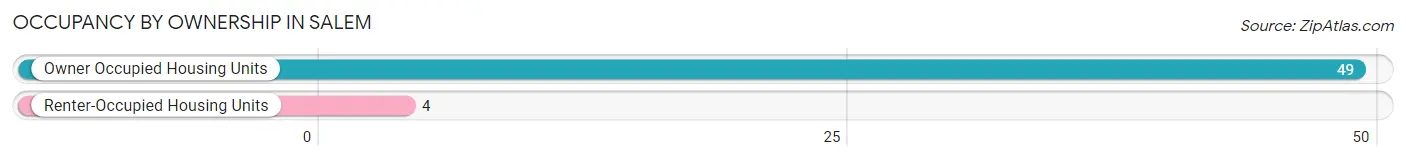
| Occupancy | # Housing Units | % Housing Units |
| Owner Occupied Housing Units | 49 | 92.4% |
| Renter-Occupied Housing Units | 4 | 7.5% |
| Total Occupied Housing Units | 53 | 100.0% |
Occupancy by Household Size in Salem
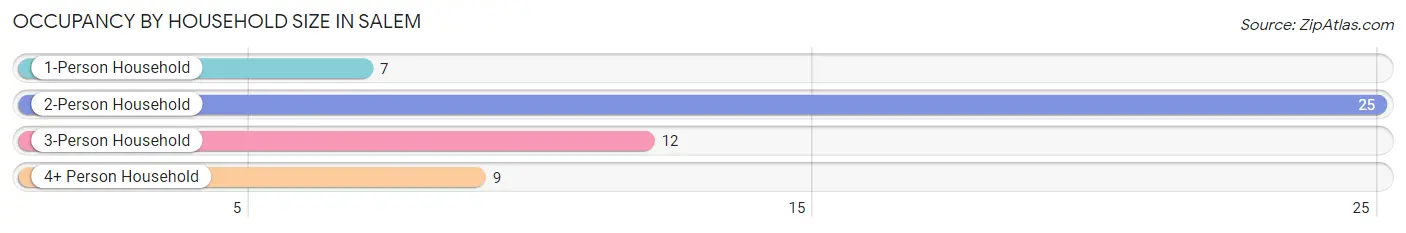
| Household Size | # Housing Units | % Housing Units |
| 1-Person Household | 7 | 13.2% |
| 2-Person Household | 25 | 47.2% |
| 3-Person Household | 12 | 22.6% |
| 4+ Person Household | 9 | 17.0% |
| Total Housing Units | 53 | 100.0% |
Occupancy by Ownership by Household Size in Salem
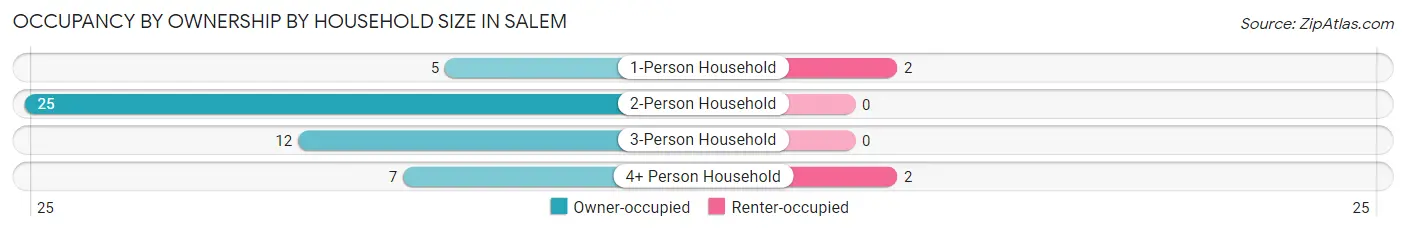
| Household Size | Owner-occupied | Renter-occupied |
| 1-Person Household | 5 (71.4%) | 2 (28.6%) |
| 2-Person Household | 25 (100.0%) | 0 (0.0%) |
| 3-Person Household | 12 (100.0%) | 0 (0.0%) |
| 4+ Person Household | 7 (77.8%) | 2 (22.2%) |
| Total Housing Units | 49 (92.4%) | 4 (7.5%) |
Occupancy by Educational Attainment in Salem
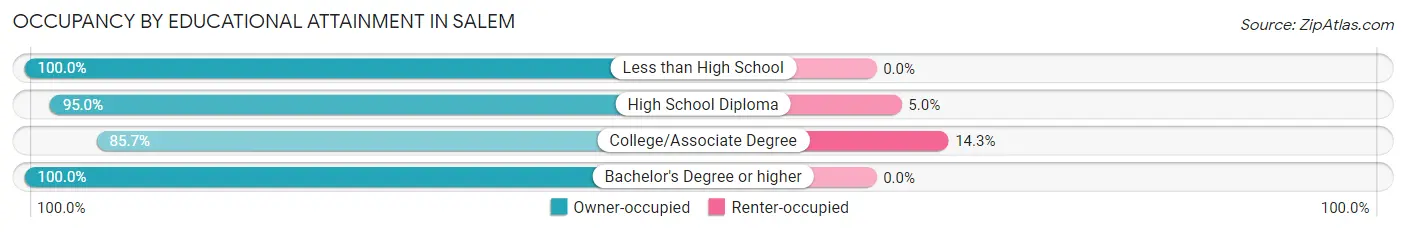
| Household Size | Owner-occupied | Renter-occupied |
| Less than High School | 4 (100.0%) | 0 (0.0%) |
| High School Diploma | 19 (95.0%) | 1 (5.0%) |
| College/Associate Degree | 18 (85.7%) | 3 (14.3%) |
| Bachelor's Degree or higher | 8 (100.0%) | 0 (0.0%) |
Occupancy by Age of Householder in Salem
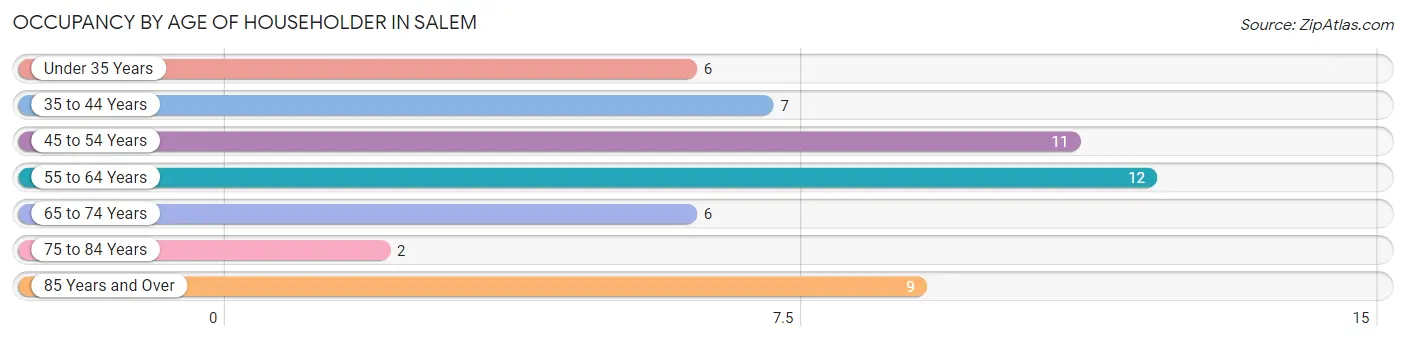
| Age Bracket | # Households | % Households |
| Under 35 Years | 6 | 11.3% |
| 35 to 44 Years | 7 | 13.2% |
| 45 to 54 Years | 11 | 20.7% |
| 55 to 64 Years | 12 | 22.6% |
| 65 to 74 Years | 6 | 11.3% |
| 75 to 84 Years | 2 | 3.8% |
| 85 Years and Over | 9 | 17.0% |
| Total | 53 | 100.0% |
Housing Finances in Salem
Median Income by Occupancy in Salem
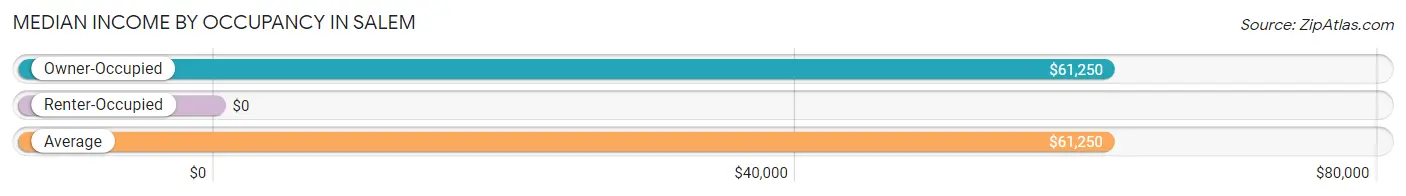
| Occupancy Type | # Households | Median Income |
| Owner-Occupied | 49 (92.4%) | $61,250 |
| Renter-Occupied | 4 (7.5%) | $0 |
| Average | 53 (100.0%) | $61,250 |
Occupancy by Householder Income Bracket in Salem
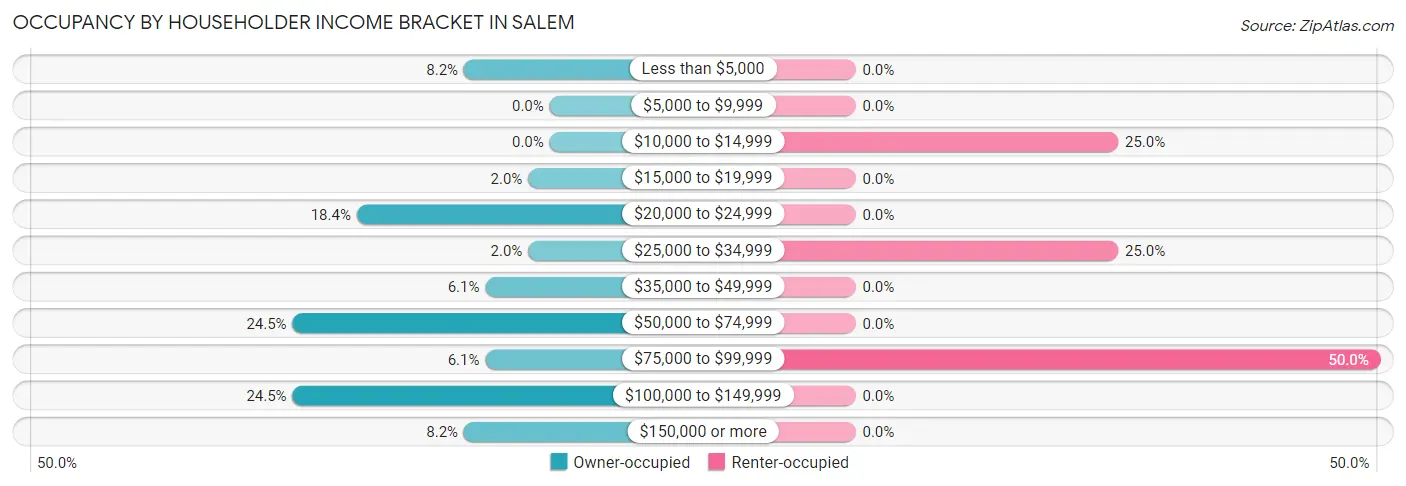
| Income Bracket | Owner-occupied | Renter-occupied |
| Less than $5,000 | 4 (8.2%) | 0 (0.0%) |
| $5,000 to $9,999 | 0 (0.0%) | 0 (0.0%) |
| $10,000 to $14,999 | 0 (0.0%) | 1 (25.0%) |
| $15,000 to $19,999 | 1 (2.0%) | 0 (0.0%) |
| $20,000 to $24,999 | 9 (18.4%) | 0 (0.0%) |
| $25,000 to $34,999 | 1 (2.0%) | 1 (25.0%) |
| $35,000 to $49,999 | 3 (6.1%) | 0 (0.0%) |
| $50,000 to $74,999 | 12 (24.5%) | 0 (0.0%) |
| $75,000 to $99,999 | 3 (6.1%) | 2 (50.0%) |
| $100,000 to $149,999 | 12 (24.5%) | 0 (0.0%) |
| $150,000 or more | 4 (8.2%) | 0 (0.0%) |
| Total | 49 (100.0%) | 4 (100.0%) |
Monthly Housing Cost Tiers in Salem
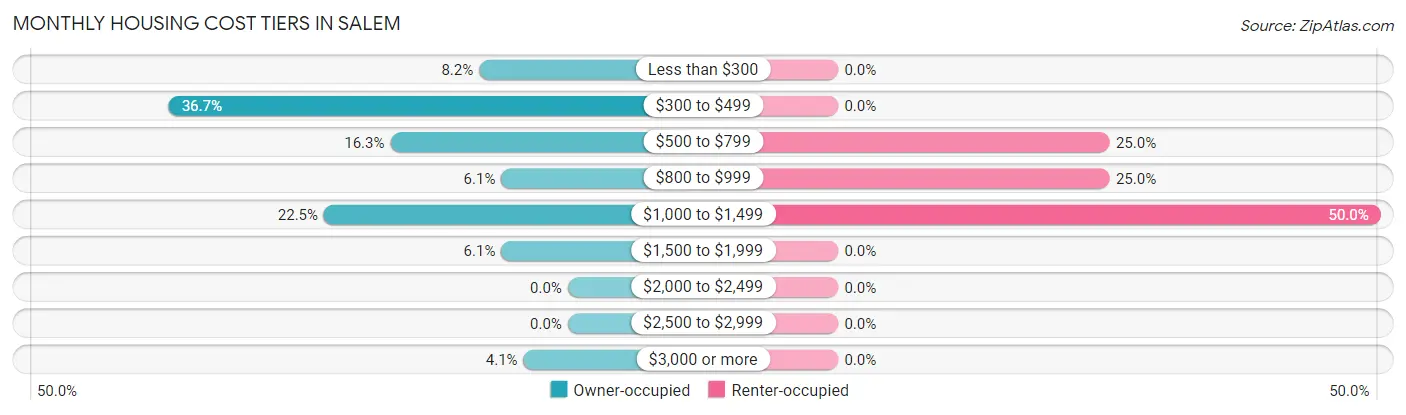
| Monthly Cost | Owner-occupied | Renter-occupied |
| Less than $300 | 4 (8.2%) | 0 (0.0%) |
| $300 to $499 | 18 (36.7%) | 0 (0.0%) |
| $500 to $799 | 8 (16.3%) | 1 (25.0%) |
| $800 to $999 | 3 (6.1%) | 1 (25.0%) |
| $1,000 to $1,499 | 11 (22.5%) | 2 (50.0%) |
| $1,500 to $1,999 | 3 (6.1%) | 0 (0.0%) |
| $2,000 to $2,499 | 0 (0.0%) | 0 (0.0%) |
| $2,500 to $2,999 | 0 (0.0%) | 0 (0.0%) |
| $3,000 or more | 2 (4.1%) | 0 (0.0%) |
| Total | 49 (100.0%) | 4 (100.0%) |
Physical Housing Characteristics in Salem
Housing Structures in Salem
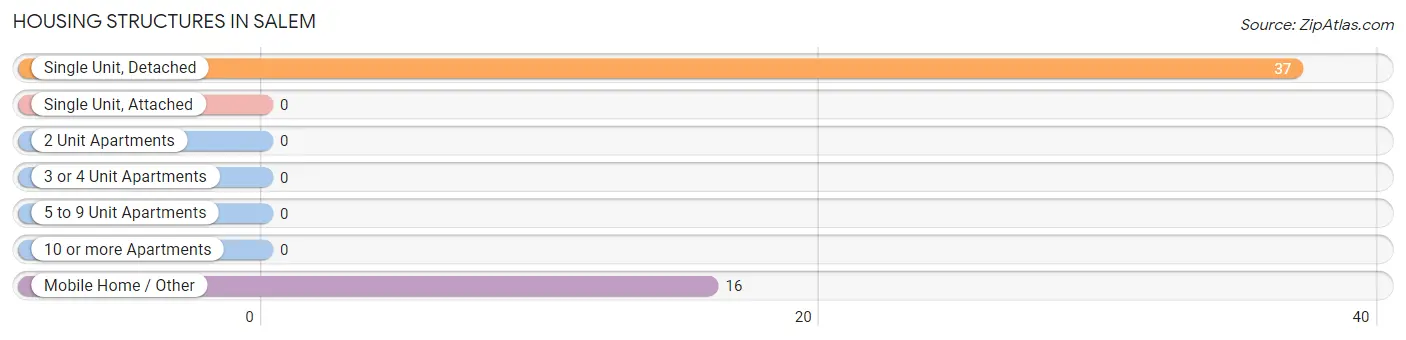
| Structure Type | # Housing Units | % Housing Units |
| Single Unit, Detached | 37 | 69.8% |
| Single Unit, Attached | 0 | 0.0% |
| 2 Unit Apartments | 0 | 0.0% |
| 3 or 4 Unit Apartments | 0 | 0.0% |
| 5 to 9 Unit Apartments | 0 | 0.0% |
| 10 or more Apartments | 0 | 0.0% |
| Mobile Home / Other | 16 | 30.2% |
| Total | 53 | 100.0% |
Housing Structures by Occupancy in Salem
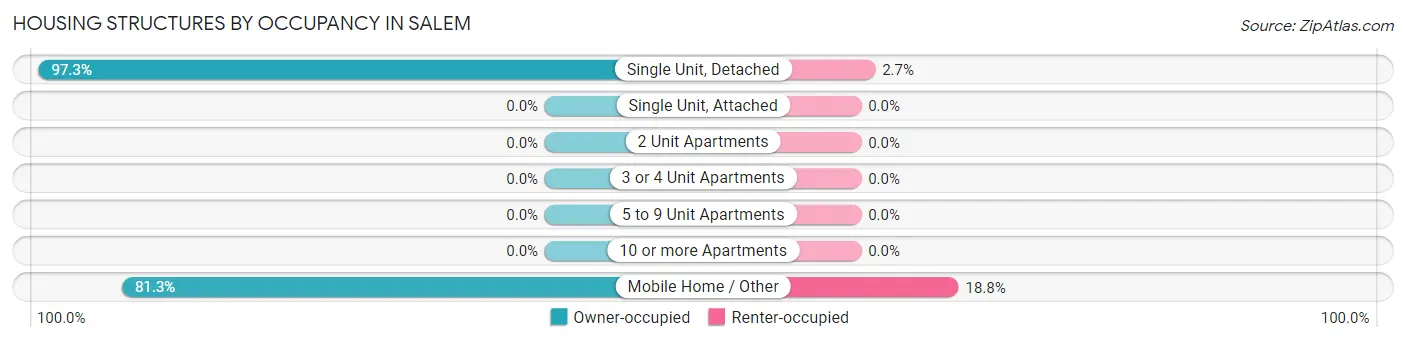
| Structure Type | Owner-occupied | Renter-occupied |
| Single Unit, Detached | 36 (97.3%) | 1 (2.7%) |
| Single Unit, Attached | 0 (0.0%) | 0 (0.0%) |
| 2 Unit Apartments | 0 (0.0%) | 0 (0.0%) |
| 3 or 4 Unit Apartments | 0 (0.0%) | 0 (0.0%) |
| 5 to 9 Unit Apartments | 0 (0.0%) | 0 (0.0%) |
| 10 or more Apartments | 0 (0.0%) | 0 (0.0%) |
| Mobile Home / Other | 13 (81.2%) | 3 (18.8%) |
| Total | 49 (92.4%) | 4 (7.5%) |
Housing Structures by Number of Rooms in Salem
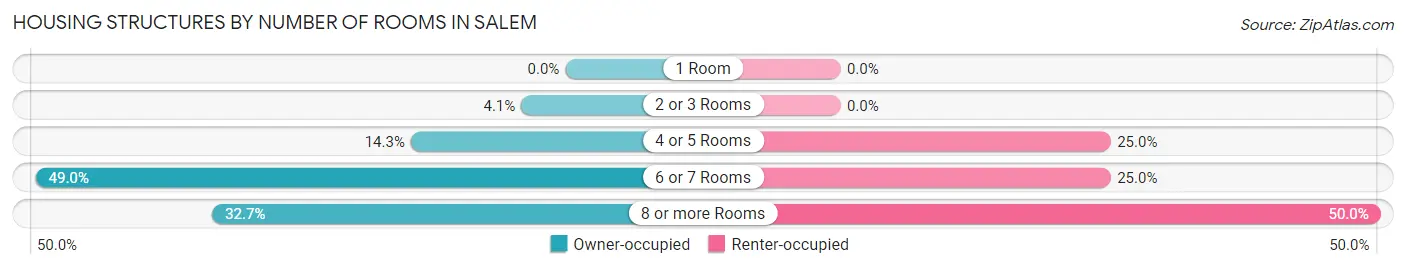
| Number of Rooms | Owner-occupied | Renter-occupied |
| 1 Room | 0 (0.0%) | 0 (0.0%) |
| 2 or 3 Rooms | 2 (4.1%) | 0 (0.0%) |
| 4 or 5 Rooms | 7 (14.3%) | 1 (25.0%) |
| 6 or 7 Rooms | 24 (49.0%) | 1 (25.0%) |
| 8 or more Rooms | 16 (32.7%) | 2 (50.0%) |
| Total | 49 (100.0%) | 4 (100.0%) |
Housing Structure by Heating Type in Salem
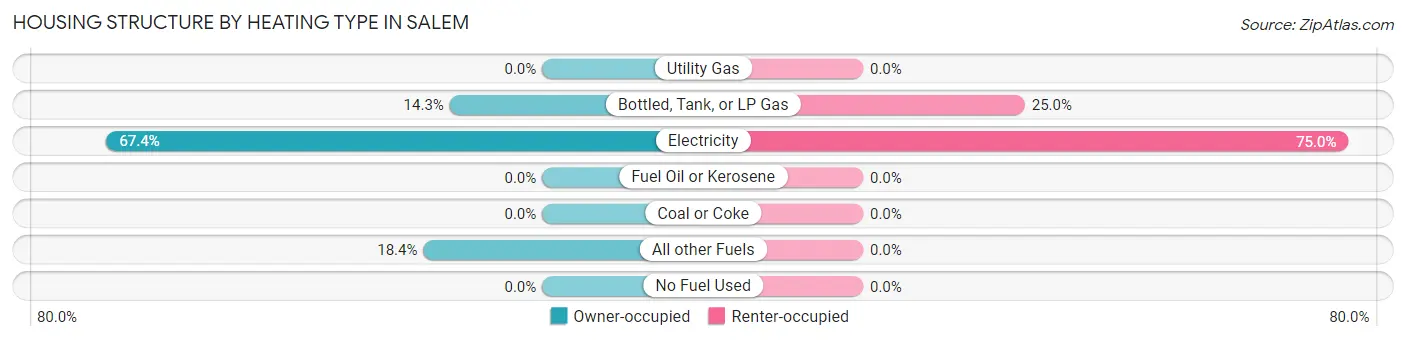
| Heating Type | Owner-occupied | Renter-occupied |
| Utility Gas | 0 (0.0%) | 0 (0.0%) |
| Bottled, Tank, or LP Gas | 7 (14.3%) | 1 (25.0%) |
| Electricity | 33 (67.3%) | 3 (75.0%) |
| Fuel Oil or Kerosene | 0 (0.0%) | 0 (0.0%) |
| Coal or Coke | 0 (0.0%) | 0 (0.0%) |
| All other Fuels | 9 (18.4%) | 0 (0.0%) |
| No Fuel Used | 0 (0.0%) | 0 (0.0%) |
| Total | 49 (100.0%) | 4 (100.0%) |
Household Vehicle Usage in Salem
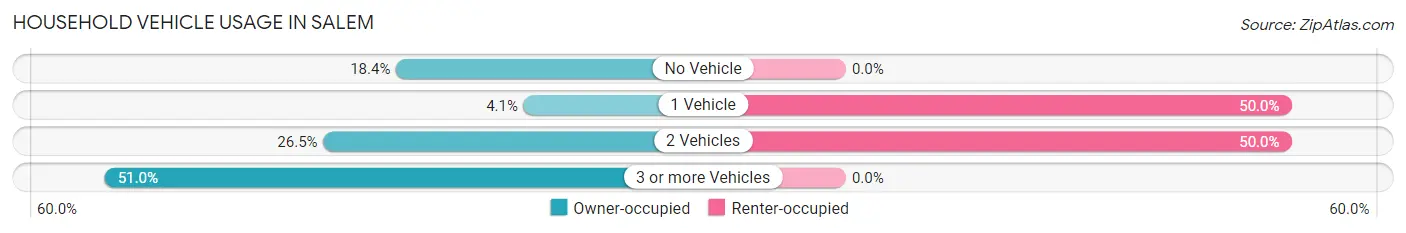
| Vehicles per Household | Owner-occupied | Renter-occupied |
| No Vehicle | 9 (18.4%) | 0 (0.0%) |
| 1 Vehicle | 2 (4.1%) | 2 (50.0%) |
| 2 Vehicles | 13 (26.5%) | 2 (50.0%) |
| 3 or more Vehicles | 25 (51.0%) | 0 (0.0%) |
| Total | 49 (100.0%) | 4 (100.0%) |
Real Estate & Mortgages in Salem
Real Estate and Mortgage Overview in Salem
| Characteristic | Without Mortgage | With Mortgage |
| Housing Units | 30 | 19 |
| Median Property Value | $166,700 | $137,500 |
| Median Household Income | - | - |
| Monthly Housing Costs | $392 | $2 |
| Real Estate Taxes | $625 | $0 |
Property Value by Mortgage Status in Salem
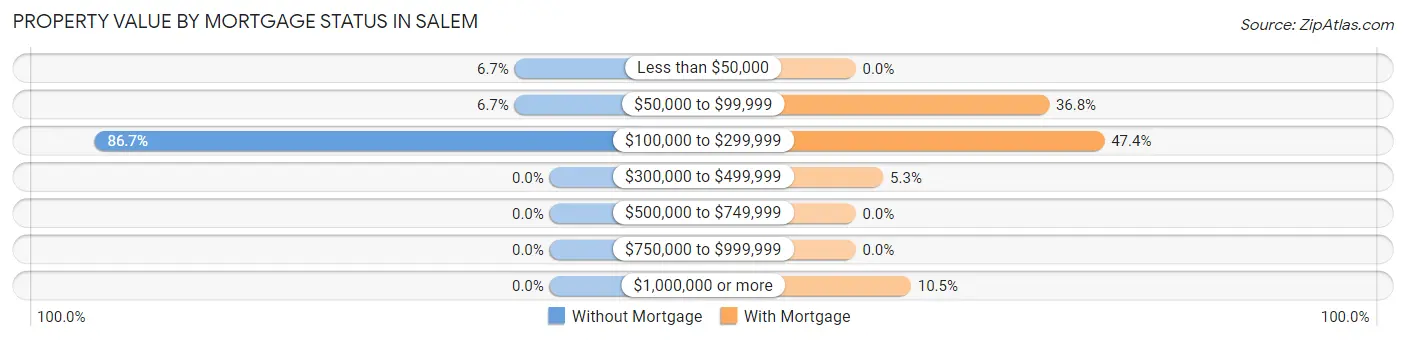
| Property Value | Without Mortgage | With Mortgage |
| Less than $50,000 | 2 (6.7%) | 0 (0.0%) |
| $50,000 to $99,999 | 2 (6.7%) | 7 (36.8%) |
| $100,000 to $299,999 | 26 (86.7%) | 9 (47.4%) |
| $300,000 to $499,999 | 0 (0.0%) | 1 (5.3%) |
| $500,000 to $749,999 | 0 (0.0%) | 0 (0.0%) |
| $750,000 to $999,999 | 0 (0.0%) | 0 (0.0%) |
| $1,000,000 or more | 0 (0.0%) | 2 (10.5%) |
| Total | 30 (100.0%) | 19 (100.0%) |
Household Income by Mortgage Status in Salem
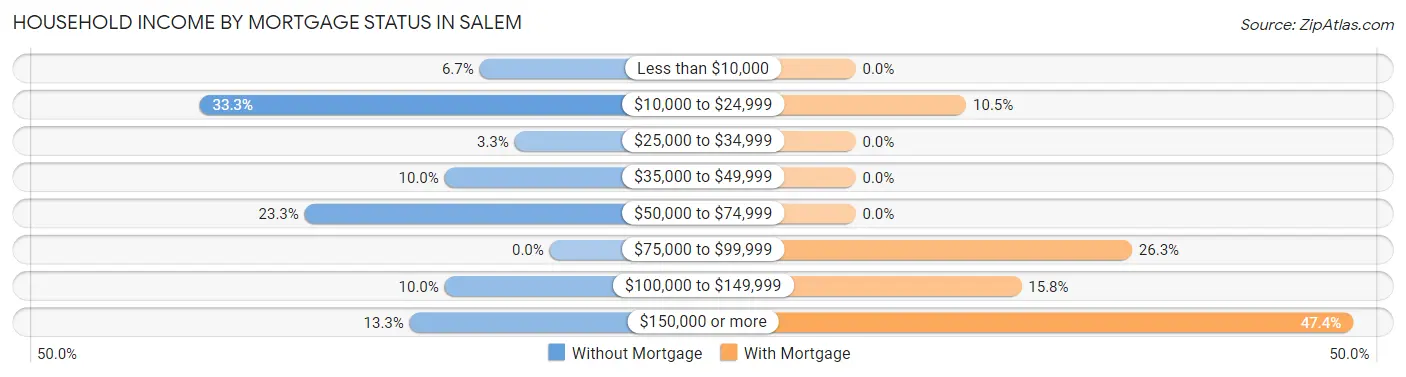
| Household Income | Without Mortgage | With Mortgage |
| Less than $10,000 | 2 (6.7%) | 0 (0.0%) |
| $10,000 to $24,999 | 10 (33.3%) | 2 (10.5%) |
| $25,000 to $34,999 | 1 (3.3%) | 0 (0.0%) |
| $35,000 to $49,999 | 3 (10.0%) | 0 (0.0%) |
| $50,000 to $74,999 | 7 (23.3%) | 0 (0.0%) |
| $75,000 to $99,999 | 0 (0.0%) | 5 (26.3%) |
| $100,000 to $149,999 | 3 (10.0%) | 3 (15.8%) |
| $150,000 or more | 4 (13.3%) | 9 (47.4%) |
| Total | 30 (100.0%) | 19 (100.0%) |
Property Value to Household Income Ratio in Salem
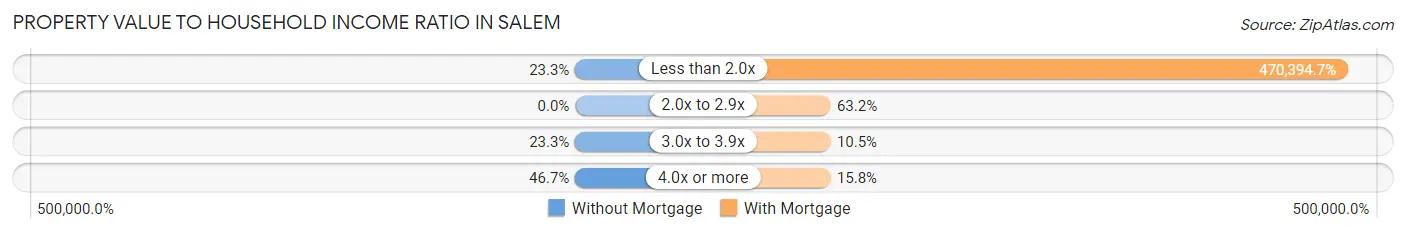
| Value-to-Income Ratio | Without Mortgage | With Mortgage |
| Less than 2.0x | 7 (23.3%) | 89,375 (470,394.7%) |
| 2.0x to 2.9x | 0 (0.0%) | 12 (63.2%) |
| 3.0x to 3.9x | 7 (23.3%) | 2 (10.5%) |
| 4.0x or more | 14 (46.7%) | 3 (15.8%) |
| Total | 30 (100.0%) | 19 (100.0%) |
Real Estate Taxes by Mortgage Status in Salem
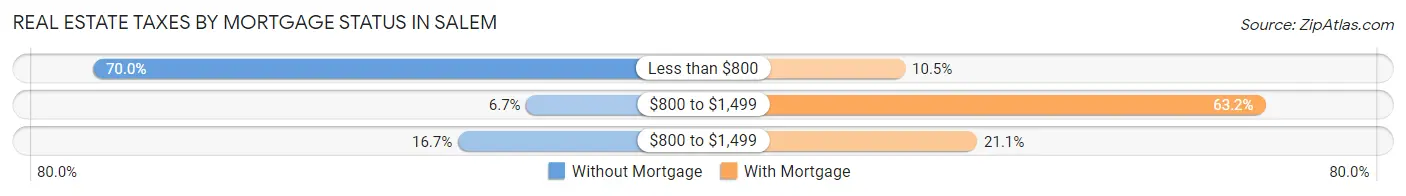
| Property Taxes | Without Mortgage | With Mortgage |
| Less than $800 | 21 (70.0%) | 2 (10.5%) |
| $800 to $1,499 | 2 (6.7%) | 12 (63.2%) |
| $800 to $1,499 | 5 (16.7%) | 4 (21.0%) |
| Total | 30 (100.0%) | 19 (100.0%) |
Health & Disability in Salem
Health Insurance Coverage by Age in Salem
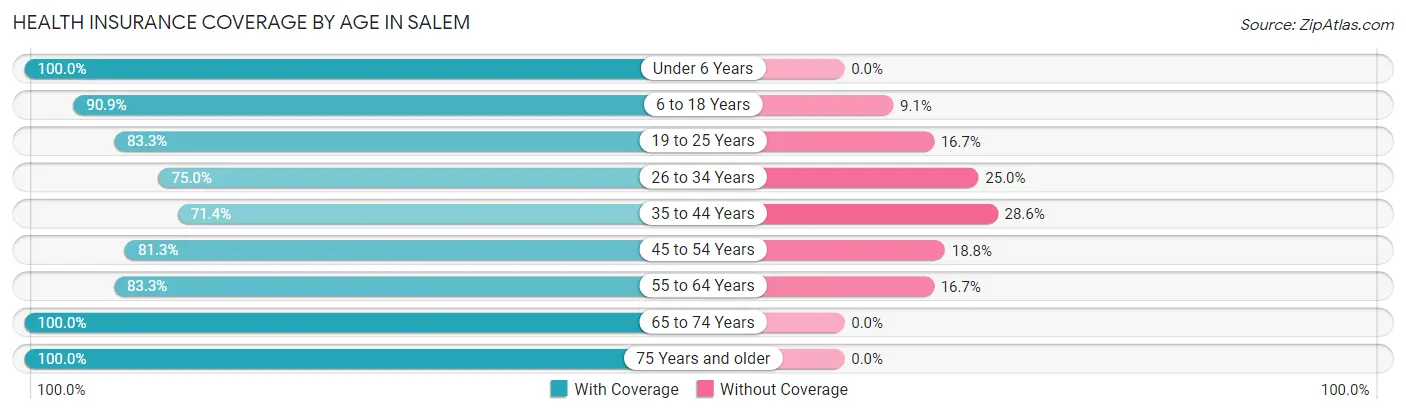
| Age Bracket | With Coverage | Without Coverage |
| Under 6 Years | 13 (100.0%) | 0 (0.0%) |
| 6 to 18 Years | 20 (90.9%) | 2 (9.1%) |
| 19 to 25 Years | 5 (83.3%) | 1 (16.7%) |
| 26 to 34 Years | 9 (75.0%) | 3 (25.0%) |
| 35 to 44 Years | 15 (71.4%) | 6 (28.6%) |
| 45 to 54 Years | 13 (81.2%) | 3 (18.8%) |
| 55 to 64 Years | 25 (83.3%) | 5 (16.7%) |
| 65 to 74 Years | 13 (100.0%) | 0 (0.0%) |
| 75 Years and older | 12 (100.0%) | 0 (0.0%) |
| Total | 125 (86.2%) | 20 (13.8%) |
Health Insurance Coverage by Citizenship Status in Salem
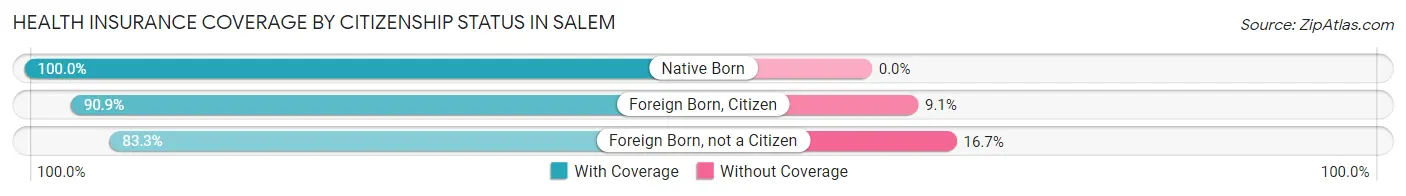
| Citizenship Status | With Coverage | Without Coverage |
| Native Born | 13 (100.0%) | 0 (0.0%) |
| Foreign Born, Citizen | 20 (90.9%) | 2 (9.1%) |
| Foreign Born, not a Citizen | 5 (83.3%) | 1 (16.7%) |
Health Insurance Coverage by Household Income in Salem
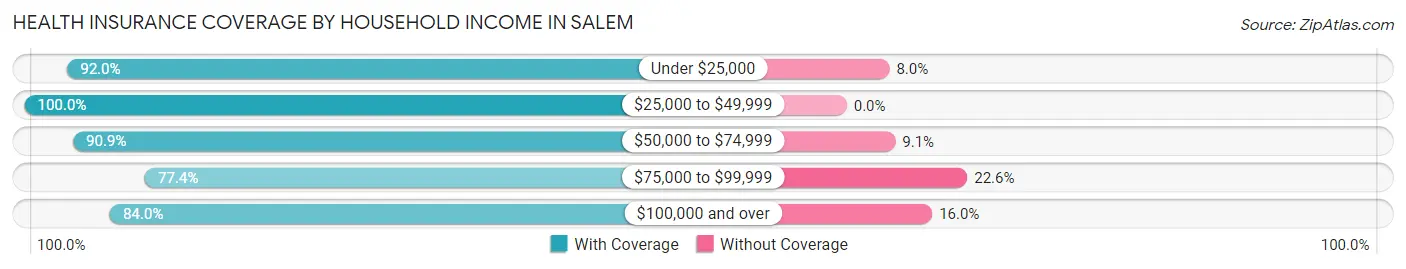
| Household Income | With Coverage | Without Coverage |
| Under $25,000 | 23 (92.0%) | 2 (8.0%) |
| $25,000 to $49,999 | 6 (100.0%) | 0 (0.0%) |
| $50,000 to $74,999 | 30 (90.9%) | 3 (9.1%) |
| $75,000 to $99,999 | 24 (77.4%) | 7 (22.6%) |
| $100,000 and over | 42 (84.0%) | 8 (16.0%) |
Public vs Private Health Insurance Coverage by Age in Salem
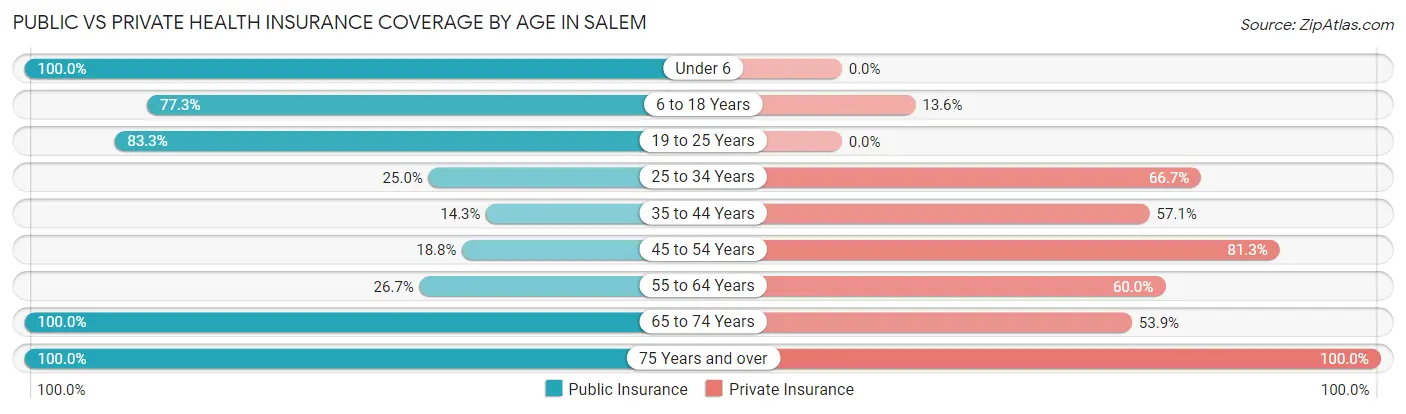
| Age Bracket | Public Insurance | Private Insurance |
| Under 6 | 13 (100.0%) | 0 (0.0%) |
| 6 to 18 Years | 17 (77.3%) | 3 (13.6%) |
| 19 to 25 Years | 5 (83.3%) | 0 (0.0%) |
| 25 to 34 Years | 3 (25.0%) | 8 (66.7%) |
| 35 to 44 Years | 3 (14.3%) | 12 (57.1%) |
| 45 to 54 Years | 3 (18.8%) | 13 (81.2%) |
| 55 to 64 Years | 8 (26.7%) | 18 (60.0%) |
| 65 to 74 Years | 13 (100.0%) | 7 (53.8%) |
| 75 Years and over | 12 (100.0%) | 12 (100.0%) |
| Total | 77 (53.1%) | 73 (50.3%) |
Disability Status by Sex by Age in Salem
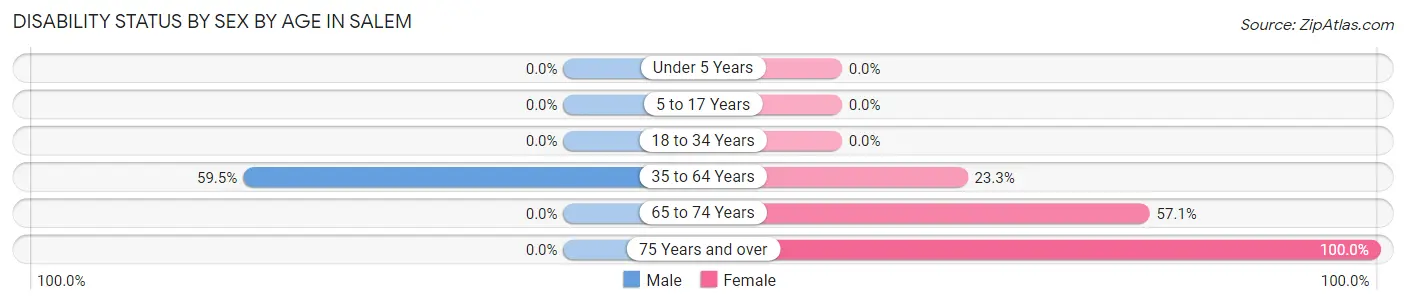
| Age Bracket | Male | Female |
| Under 5 Years | 0 (0.0%) | 0 (0.0%) |
| 5 to 17 Years | 0 (0.0%) | 0 (0.0%) |
| 18 to 34 Years | 0 (0.0%) | 0 (0.0%) |
| 35 to 64 Years | 22 (59.5%) | 7 (23.3%) |
| 65 to 74 Years | 0 (0.0%) | 4 (57.1%) |
| 75 Years and over | 0 (0.0%) | 12 (100.0%) |
Disability Class by Sex by Age in Salem
Disability Class: Hearing Difficulty
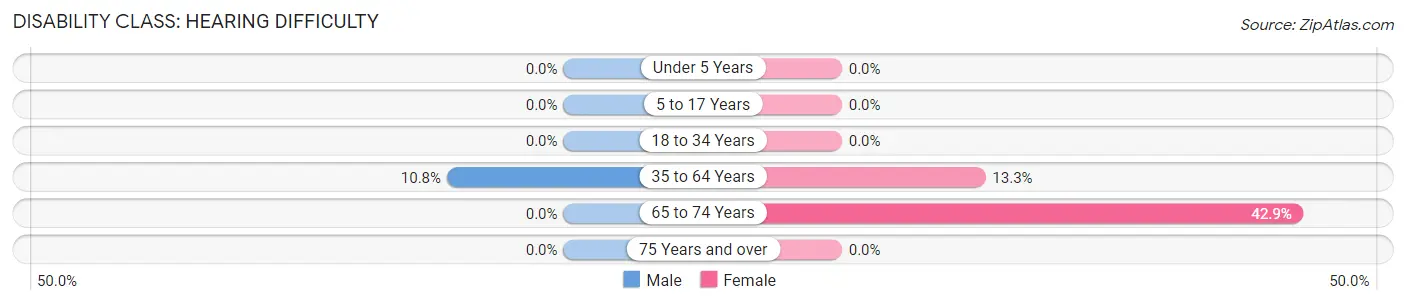
| Age Bracket | Male | Female |
| Under 5 Years | 0 (0.0%) | 0 (0.0%) |
| 5 to 17 Years | 0 (0.0%) | 0 (0.0%) |
| 18 to 34 Years | 0 (0.0%) | 0 (0.0%) |
| 35 to 64 Years | 4 (10.8%) | 4 (13.3%) |
| 65 to 74 Years | 0 (0.0%) | 3 (42.9%) |
| 75 Years and over | 0 (0.0%) | 0 (0.0%) |
Disability Class: Vision Difficulty
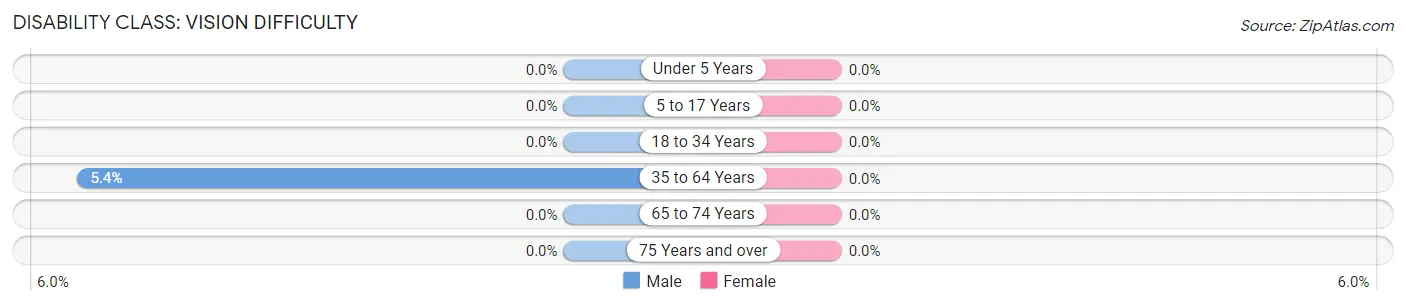
| Age Bracket | Male | Female |
| Under 5 Years | 0 (0.0%) | 0 (0.0%) |
| 5 to 17 Years | 0 (0.0%) | 0 (0.0%) |
| 18 to 34 Years | 0 (0.0%) | 0 (0.0%) |
| 35 to 64 Years | 2 (5.4%) | 0 (0.0%) |
| 65 to 74 Years | 0 (0.0%) | 0 (0.0%) |
| 75 Years and over | 0 (0.0%) | 0 (0.0%) |
Disability Class: Cognitive Difficulty
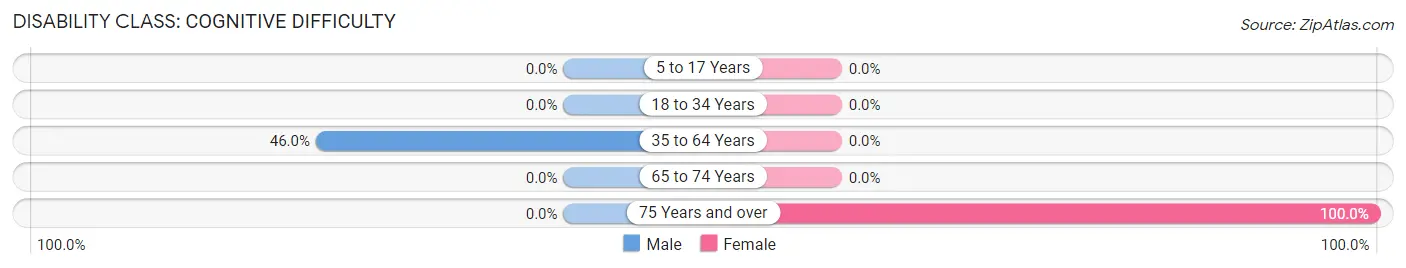
| Age Bracket | Male | Female |
| 5 to 17 Years | 0 (0.0%) | 0 (0.0%) |
| 18 to 34 Years | 0 (0.0%) | 0 (0.0%) |
| 35 to 64 Years | 17 (46.0%) | 0 (0.0%) |
| 65 to 74 Years | 0 (0.0%) | 0 (0.0%) |
| 75 Years and over | 0 (0.0%) | 12 (100.0%) |
Disability Class: Ambulatory Difficulty
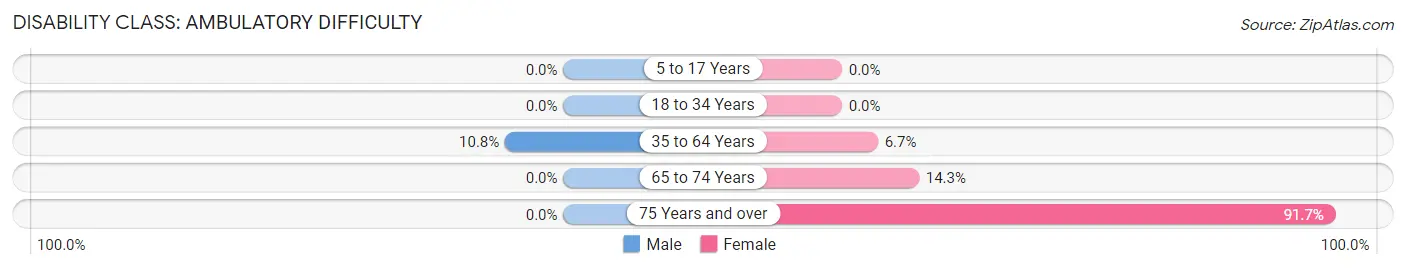
| Age Bracket | Male | Female |
| 5 to 17 Years | 0 (0.0%) | 0 (0.0%) |
| 18 to 34 Years | 0 (0.0%) | 0 (0.0%) |
| 35 to 64 Years | 4 (10.8%) | 2 (6.7%) |
| 65 to 74 Years | 0 (0.0%) | 1 (14.3%) |
| 75 Years and over | 0 (0.0%) | 11 (91.7%) |
Disability Class: Self-Care Difficulty
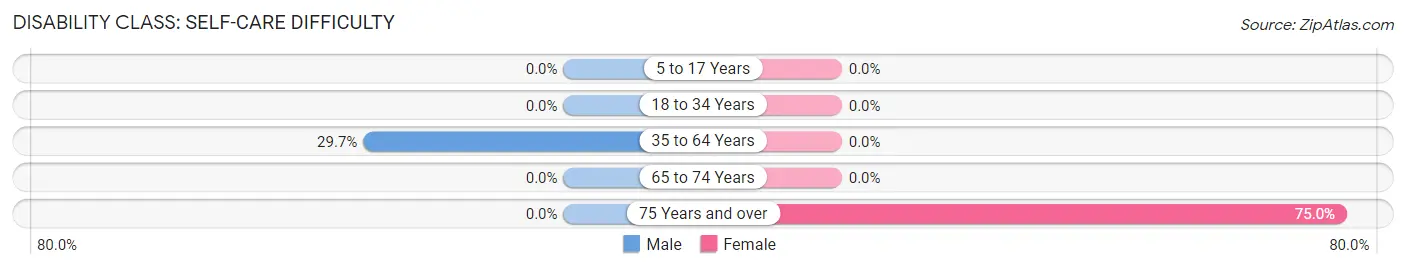
| Age Bracket | Male | Female |
| 5 to 17 Years | 0 (0.0%) | 0 (0.0%) |
| 18 to 34 Years | 0 (0.0%) | 0 (0.0%) |
| 35 to 64 Years | 11 (29.7%) | 0 (0.0%) |
| 65 to 74 Years | 0 (0.0%) | 0 (0.0%) |
| 75 Years and over | 0 (0.0%) | 9 (75.0%) |
Technology Access in Salem
Computing Device Access in Salem
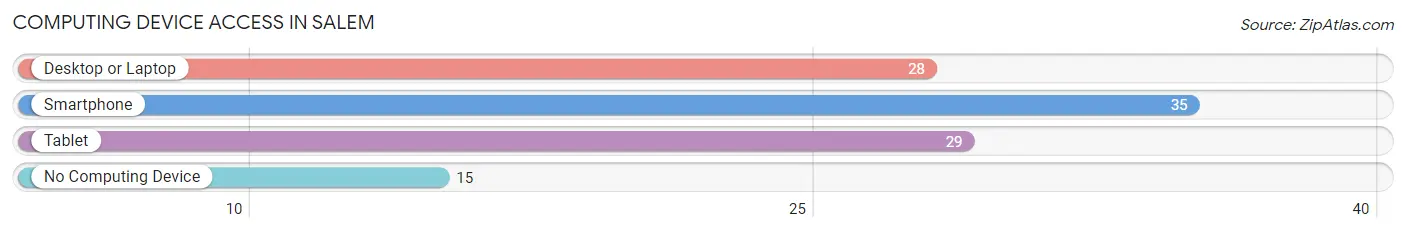
| Device Type | # Households | % Households |
| Desktop or Laptop | 28 | 52.8% |
| Smartphone | 35 | 66.0% |
| Tablet | 29 | 54.7% |
| No Computing Device | 15 | 28.3% |
| Total | 53 | 100.0% |
Internet Access in Salem
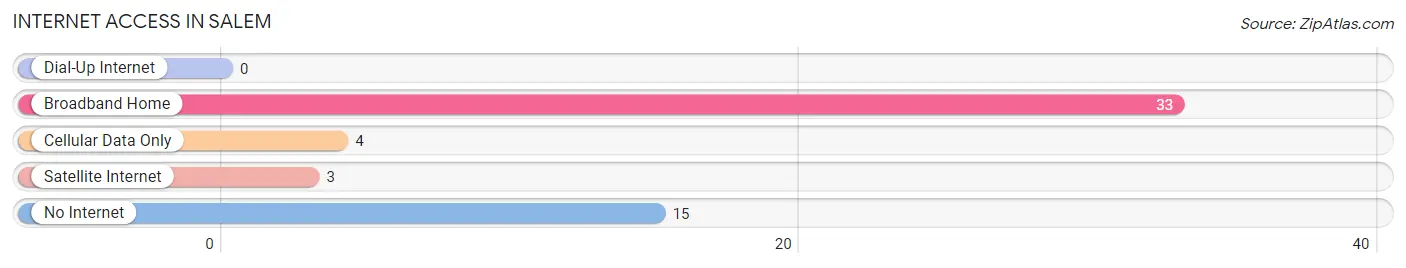
| Internet Type | # Households | % Households |
| Dial-Up Internet | 0 | 0.0% |
| Broadband Home | 33 | 62.3% |
| Cellular Data Only | 4 | 7.5% |
| Satellite Internet | 3 | 5.7% |
| No Internet | 15 | 28.3% |
| Total | 53 | 100.0% |
Salem Summary
Salem, South Carolina is a small town located in the northwestern corner of the state, near the border of North Carolina. It is part of the Greenville-Spartanburg-Anderson metropolitan area, and is situated in the foothills of the Blue Ridge Mountains. The town has a population of approximately 1,500 people, and is known for its rural charm and small-town atmosphere.
Geography
Salem is located in the northwestern corner of South Carolina, near the border of North Carolina. It is situated in the foothills of the Blue Ridge Mountains, and is part of the Greenville-Spartanburg-Anderson metropolitan area. The town is located in the Piedmont region of the state, and is surrounded by rolling hills and forests. The town is situated on the banks of the Broad River, which flows through the town and provides a scenic backdrop.
Economy
The economy of Salem is largely based on agriculture and tourism. The town is home to several farms, which produce a variety of crops, including corn, soybeans, and wheat. The town is also home to several wineries, which produce a variety of wines. Tourism is also an important part of the local economy, as the town is home to several historic sites, including the Salem Historic District, which is listed on the National Register of Historic Places.
Demographics
As of the 2010 census, the population of Salem was 1,500 people. The racial makeup of the town was 94.7% White, 2.7% African American, 0.3% Native American, 0.3% Asian, 0.7% from other races, and 1.3% from two or more races. The median household income was $37,500, and the median family income was $45,000.
History
Salem was first settled in the late 1700s by settlers from North Carolina. The town was originally known as Salem Crossroads, and was named after the nearby Salem Presbyterian Church. The town was incorporated in 1891, and was named after the church. The town grew steadily throughout the 19th century, and by the early 20th century, it had become a thriving agricultural center. The town was also home to several mills, which produced a variety of goods, including textiles and furniture.
In the late 20th century, Salem began to experience a decline in population, as many of its residents moved away in search of better economic opportunities. However, in recent years, the town has seen a resurgence in population, as many people have moved back to the area in search of a more rural lifestyle. Today, Salem is a thriving small town, with a strong sense of community and a vibrant economy.
Common Questions
What is Per Capita Income in Salem?
Per Capita income in Salem is $25,185.
What is the Median Family Income in Salem?
Median Family Income in Salem is $72,917.
What is the Median Household income in Salem?
Median Household Income in Salem is $61,250.
What is Inequality or Gini Index in Salem?
Inequality or Gini Index in Salem is 0.40.
What is the Total Population of Salem?
Total Population of Salem is 145.
What is the Total Male Population of Salem?
Total Male Population of Salem is 69.
What is the Total Female Population of Salem?
Total Female Population of Salem is 76.
What is the Ratio of Males per 100 Females in Salem?
There are 90.79 Males per 100 Females in Salem.
What is the Ratio of Females per 100 Males in Salem?
There are 110.14 Females per 100 Males in Salem.
What is the Median Population Age in Salem?
Median Population Age in Salem is 44.6 Years.
What is the Average Family Size in Salem
Average Family Size in Salem is 3.0 People.
What is the Average Household Size in Salem
Average Household Size in Salem is 2.7 People.
How Large is the Labor Force in Salem?
There are 51 People in the Labor Forcein in Salem.
What is the Percentage of People in the Labor Force in Salem?
44.0% of People are in the Labor Force in Salem.