Clearwater, SC Map & Demographics
Clearwater Map
Clearwater Overview
$28,445
PER CAPITA INCOME
$58,023
AVG FAMILY INCOME
$52,991
AVG HOUSEHOLD INCOME
62.7%
WAGE / INCOME GAP [ % ]
37.3¢/ $1
WAGE / INCOME GAP [ $ ]
0.39
INEQUALITY / GINI INDEX
3,403
TOTAL POPULATION
1,603
MALE POPULATION
1,800
FEMALE POPULATION
89.06
MALES / 100 FEMALES
112.29
FEMALES / 100 MALES
41.1
MEDIAN AGE
2.9
AVG FAMILY SIZE
2.4
AVG HOUSEHOLD SIZE
1,919
LABOR FORCE [ PEOPLE ]
67.7%
PERCENT IN LABOR FORCE
13.2%
UNEMPLOYMENT RATE
Clearwater Area Codes
Income in Clearwater
Income Overview in Clearwater
Per Capita Income in Clearwater is $28,445, while median incomes of families and households are $58,023 and $52,991 respectively.
| Characteristic | Number | Measure |
| Per Capita Income | 3,403 | $28,445 |
| Median Family Income | 976 | $58,023 |
| Mean Family Income | 976 | $74,352 |
| Median Household Income | 1,395 | $52,991 |
| Mean Household Income | 1,395 | $65,654 |
| Income Deficit | 976 | $0 |
| Wage / Income Gap (%) | 3,403 | 62.67% |
| Wage / Income Gap ($) | 3,403 | 37.33¢ per $1 |
| Gini / Inequality Index | 3,403 | 0.39 |
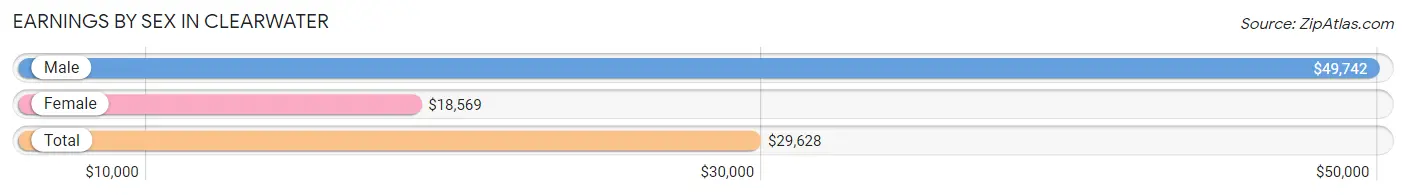
Earnings by Sex in Clearwater
Average Earnings in Clearwater are $29,628, $49,742 for men and $18,569 for women, a difference of 62.7%.
| Sex | Number | Average Earnings |
| Male | 909 (45.1%) | $49,742 |
| Female | 1,107 (54.9%) | $18,569 |
| Total | 2,016 (100.0%) | $29,628 |
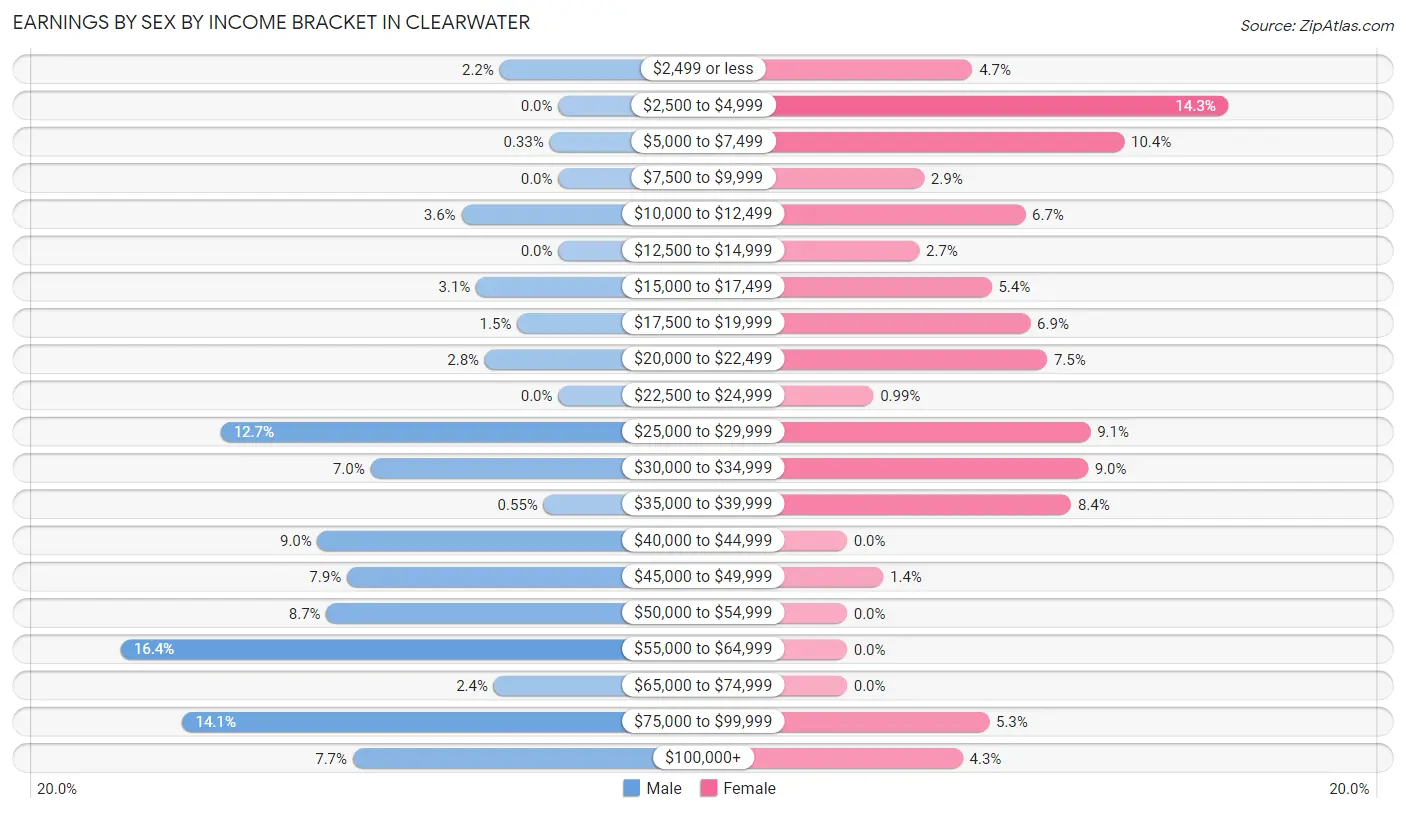
Earnings by Sex by Income Bracket in Clearwater
The most common earnings brackets in Clearwater are $55,000 to $64,999 for men (149 | 16.4%) and $2,500 to $4,999 for women (158 | 14.3%).
| Income | Male | Female |
| $2,499 or less | 20 (2.2%) | 52 (4.7%) |
| $2,500 to $4,999 | 0 (0.0%) | 158 (14.3%) |
| $5,000 to $7,499 | 3 (0.3%) | 115 (10.4%) |
| $7,500 to $9,999 | 0 (0.0%) | 32 (2.9%) |
| $10,000 to $12,499 | 33 (3.6%) | 74 (6.7%) |
| $12,500 to $14,999 | 0 (0.0%) | 30 (2.7%) |
| $15,000 to $17,499 | 28 (3.1%) | 60 (5.4%) |
| $17,500 to $19,999 | 14 (1.5%) | 76 (6.9%) |
| $20,000 to $22,499 | 25 (2.8%) | 83 (7.5%) |
| $22,500 to $24,999 | 0 (0.0%) | 11 (1.0%) |
| $25,000 to $29,999 | 115 (12.7%) | 101 (9.1%) |
| $30,000 to $34,999 | 64 (7.0%) | 100 (9.0%) |
| $35,000 to $39,999 | 5 (0.5%) | 93 (8.4%) |
| $40,000 to $44,999 | 82 (9.0%) | 0 (0.0%) |
| $45,000 to $49,999 | 72 (7.9%) | 15 (1.4%) |
| $50,000 to $54,999 | 79 (8.7%) | 0 (0.0%) |
| $55,000 to $64,999 | 149 (16.4%) | 0 (0.0%) |
| $65,000 to $74,999 | 22 (2.4%) | 0 (0.0%) |
| $75,000 to $99,999 | 128 (14.1%) | 59 (5.3%) |
| $100,000+ | 70 (7.7%) | 48 (4.3%) |
| Total | 909 (100.0%) | 1,107 (100.0%) |
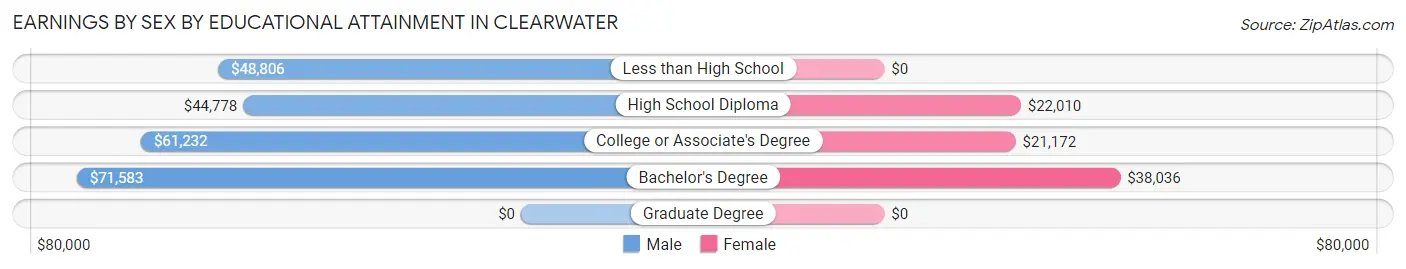
Earnings by Sex by Educational Attainment in Clearwater
Average earnings in Clearwater are $60,292 for men and $25,078 for women, a difference of 58.4%. Men with an educational attainment of bachelor's degree enjoy the highest average annual earnings of $71,583, while those with high school diploma education earn the least with $44,778. Women with an educational attainment of bachelor's degree earn the most with the average annual earnings of $38,036, while those with college or associate's degree education have the smallest earnings of $21,172.
| Educational Attainment | Male Income | Female Income |
| Less than High School | $48,806 | $0 |
| High School Diploma | $44,778 | $22,010 |
| College or Associate's Degree | $61,232 | $21,172 |
| Bachelor's Degree | $71,583 | $38,036 |
| Graduate Degree | - | - |
| Total | $60,292 | $25,078 |
Family Income in Clearwater
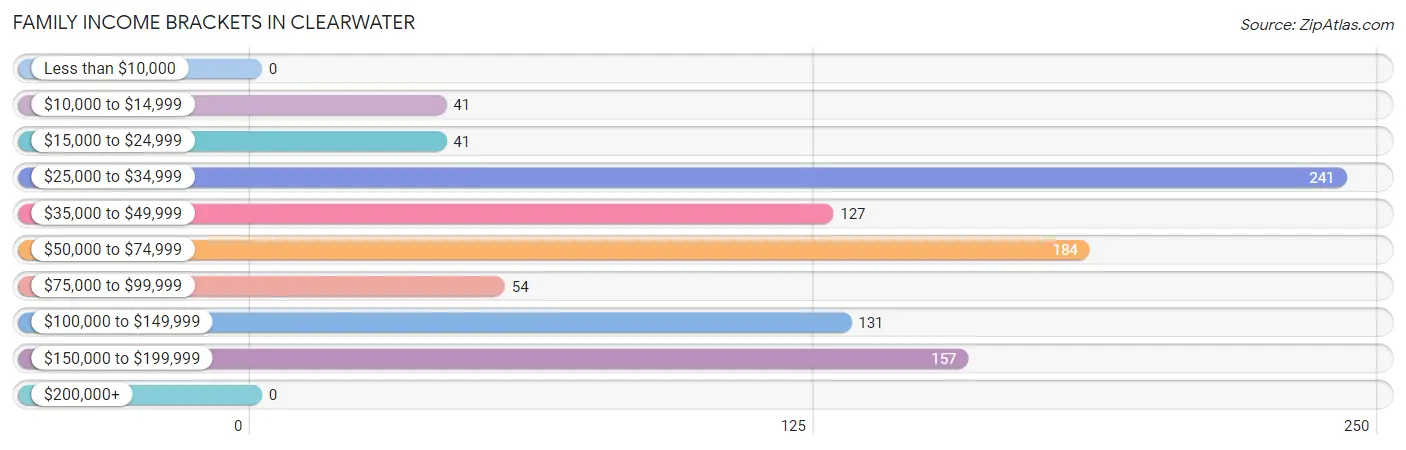
Family Income Brackets in Clearwater
According to the Clearwater family income data, there are 241 families falling into the $25,000 to $34,999 income range, which is the most common income bracket and makes up 24.7% of all families.
| Income Bracket | # Families | % Families |
| Less than $10,000 | 0 | 0.0% |
| $10,000 to $14,999 | 41 | 4.2% |
| $15,000 to $24,999 | 41 | 4.2% |
| $25,000 to $34,999 | 241 | 24.7% |
| $35,000 to $49,999 | 127 | 13.0% |
| $50,000 to $74,999 | 184 | 18.9% |
| $75,000 to $99,999 | 54 | 5.5% |
| $100,000 to $149,999 | 131 | 13.4% |
| $150,000 to $199,999 | 157 | 16.1% |
| $200,000+ | 0 | 0.0% |
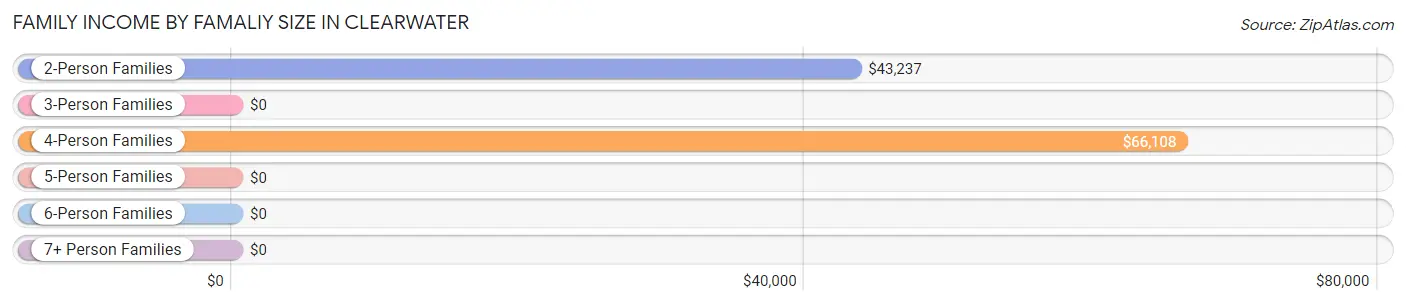
Family Income by Famaliy Size in Clearwater
4-person families (227 | 23.3%) account for the highest median family income in Clearwater with $66,108 per family, while 2-person families (477 | 48.9%) have the highest median income of $21,618 per family member.
| Income Bracket | # Families | Median Income |
| 2-Person Families | 477 (48.9%) | $43,237 |
| 3-Person Families | 272 (27.9%) | $0 |
| 4-Person Families | 227 (23.3%) | $66,108 |
| 5-Person Families | 0 (0.0%) | $0 |
| 6-Person Families | 0 (0.0%) | $0 |
| 7+ Person Families | 0 (0.0%) | $0 |
| Total | 976 (100.0%) | $58,023 |
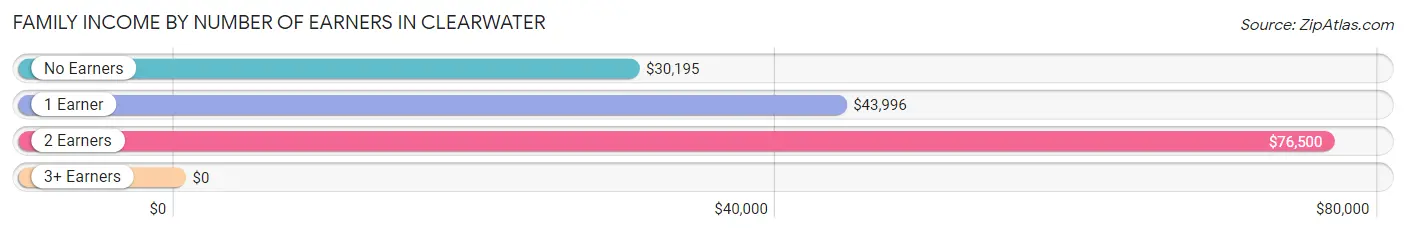
Family Income by Number of Earners in Clearwater
| Number of Earners | # Families | Median Income |
| No Earners | 159 (16.3%) | $30,195 |
| 1 Earner | 409 (41.9%) | $43,996 |
| 2 Earners | 244 (25.0%) | $76,500 |
| 3+ Earners | 164 (16.8%) | $0 |
| Total | 976 (100.0%) | $58,023 |
Household Income in Clearwater
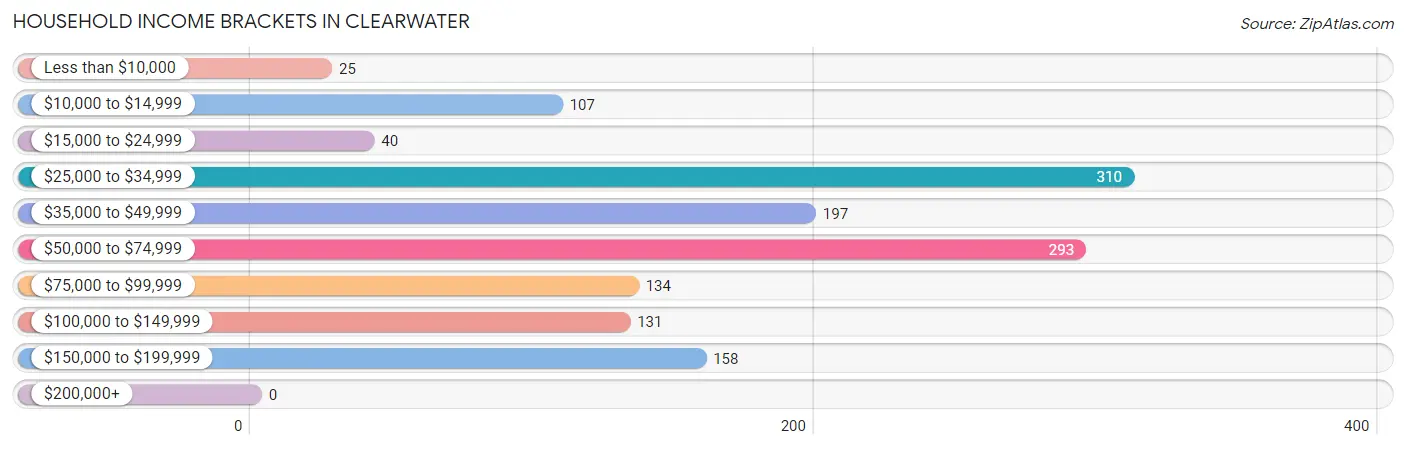
Household Income Brackets in Clearwater
With 310 households falling in the category, the $25,000 to $34,999 income range is the most frequent in Clearwater, accounting for 22.2% of all households.
| Income Bracket | # Households | % Households |
| Less than $10,000 | 25 | 1.8% |
| $10,000 to $14,999 | 107 | 7.7% |
| $15,000 to $24,999 | 40 | 2.9% |
| $25,000 to $34,999 | 310 | 22.2% |
| $35,000 to $49,999 | 197 | 14.1% |
| $50,000 to $74,999 | 293 | 21.0% |
| $75,000 to $99,999 | 134 | 9.6% |
| $100,000 to $149,999 | 131 | 9.4% |
| $150,000 to $199,999 | 158 | 11.3% |
| $200,000+ | 0 | 0.0% |
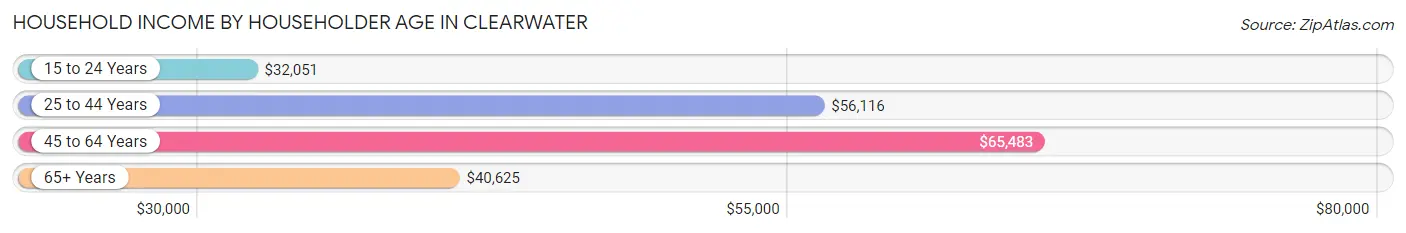
Household Income by Householder Age in Clearwater
The median household income in Clearwater is $52,991, with the highest median household income of $65,483 found in the 45 to 64 years age bracket for the primary householder. A total of 477 households (34.2%) fall into this category. Meanwhile, the 15 to 24 years age bracket for the primary householder has the lowest median household income of $32,051, with 105 households (7.5%) in this group.
| Income Bracket | # Households | Median Income |
| 15 to 24 Years | 105 (7.5%) | $32,051 |
| 25 to 44 Years | 495 (35.5%) | $56,116 |
| 45 to 64 Years | 477 (34.2%) | $65,483 |
| 65+ Years | 318 (22.8%) | $40,625 |
| Total | 1,395 (100.0%) | $52,991 |
Poverty in Clearwater
Income Below Poverty by Sex and Age in Clearwater
With 6.7% poverty level for males and 17.2% for females among the residents of Clearwater, 5 year old males and 12 to 14 year old females are the most vulnerable to poverty, with 13 males (100.0%) and 22 females (100.0%) in their respective age groups living below the poverty level.
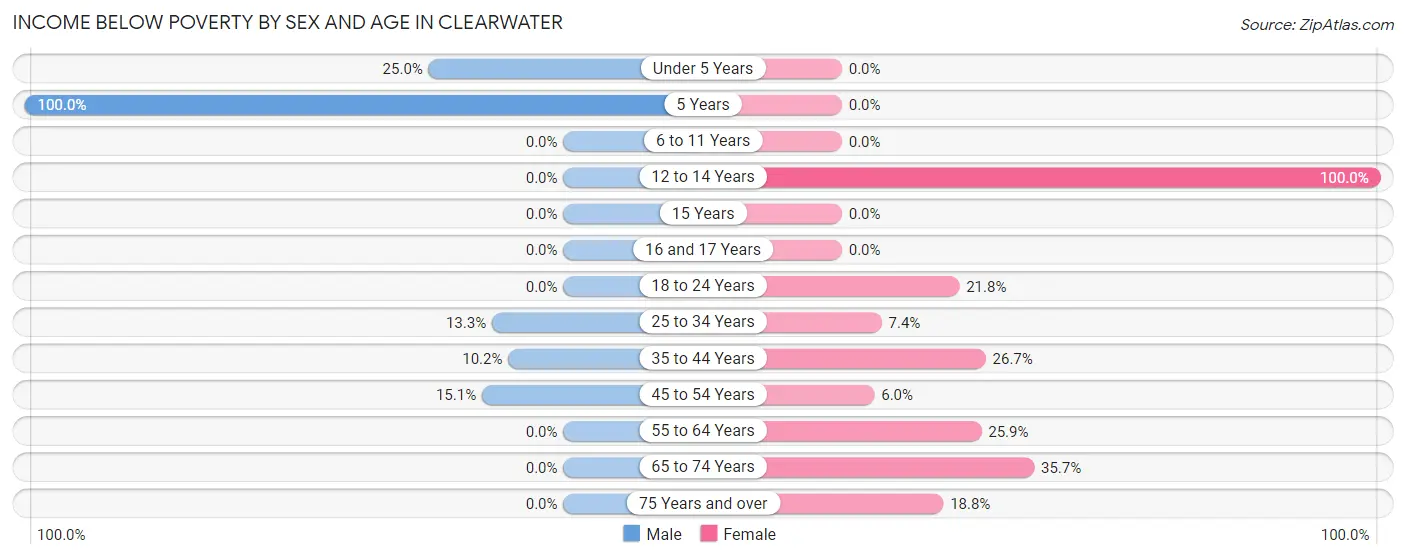
| Age Bracket | Male | Female |
| Under 5 Years | 15 (25.0%) | 0 (0.0%) |
| 5 Years | 13 (100.0%) | 0 (0.0%) |
| 6 to 11 Years | 0 (0.0%) | 0 (0.0%) |
| 12 to 14 Years | 0 (0.0%) | 22 (100.0%) |
| 15 Years | 0 (0.0%) | 0 (0.0%) |
| 16 and 17 Years | 0 (0.0%) | 0 (0.0%) |
| 18 to 24 Years | 0 (0.0%) | 58 (21.8%) |
| 25 to 34 Years | 11 (13.3%) | 15 (7.4%) |
| 35 to 44 Years | 28 (10.2%) | 47 (26.7%) |
| 45 to 54 Years | 37 (15.1%) | 17 (6.0%) |
| 55 to 64 Years | 0 (0.0%) | 58 (25.9%) |
| 65 to 74 Years | 0 (0.0%) | 76 (35.7%) |
| 75 Years and over | 0 (0.0%) | 16 (18.8%) |
| Total | 104 (6.7%) | 309 (17.2%) |
Income Above Poverty by Sex and Age in Clearwater
According to the poverty statistics in Clearwater, males aged 6 to 11 years and females aged under 5 years are the age groups that are most secure financially, with 100.0% of males and 100.0% of females in these age groups living above the poverty line.
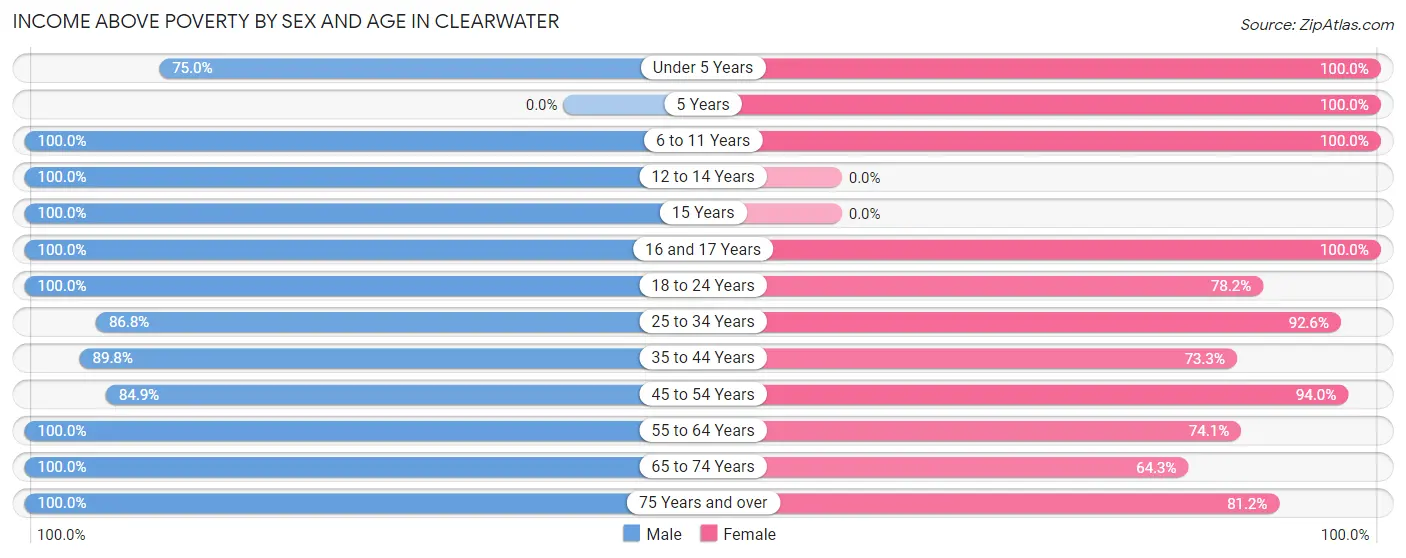
| Age Bracket | Male | Female |
| Under 5 Years | 45 (75.0%) | 30 (100.0%) |
| 5 Years | 0 (0.0%) | 13 (100.0%) |
| 6 to 11 Years | 47 (100.0%) | 204 (100.0%) |
| 12 to 14 Years | 83 (100.0%) | 0 (0.0%) |
| 15 Years | 63 (100.0%) | 0 (0.0%) |
| 16 and 17 Years | 74 (100.0%) | 82 (100.0%) |
| 18 to 24 Years | 233 (100.0%) | 208 (78.2%) |
| 25 to 34 Years | 72 (86.8%) | 188 (92.6%) |
| 35 to 44 Years | 246 (89.8%) | 129 (73.3%) |
| 45 to 54 Years | 208 (84.9%) | 265 (94.0%) |
| 55 to 64 Years | 220 (100.0%) | 166 (74.1%) |
| 65 to 74 Years | 90 (100.0%) | 137 (64.3%) |
| 75 Years and over | 73 (100.0%) | 69 (81.2%) |
| Total | 1,454 (93.3%) | 1,491 (82.8%) |
Income Below Poverty Among Married-Couple Families in Clearwater
The poverty statistics for married-couple families in Clearwater show that 2.7% or 15 of the total 552 families live below the poverty line. Families with 1 or 2 children have the highest poverty rate of 6.7%, comprising of 15 families. On the other hand, families with no children have the lowest poverty rate of 0.0%, which includes 0 families.
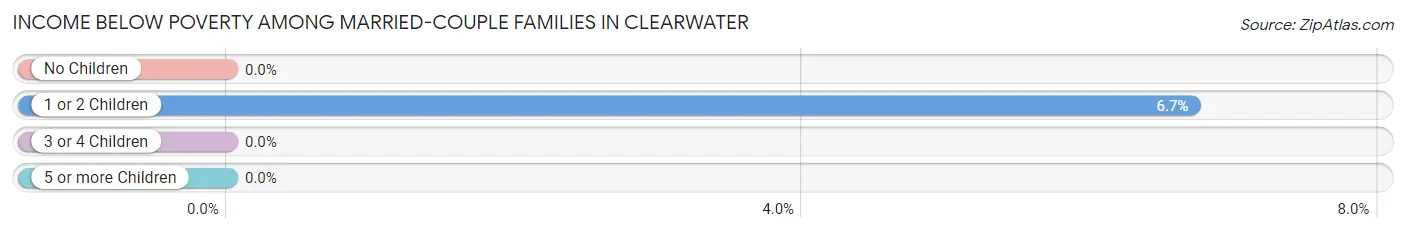
| Children | Above Poverty | Below Poverty |
| No Children | 328 (100.0%) | 0 (0.0%) |
| 1 or 2 Children | 209 (93.3%) | 15 (6.7%) |
| 3 or 4 Children | 0 (0.0%) | 0 (0.0%) |
| 5 or more Children | 0 (0.0%) | 0 (0.0%) |
| Total | 537 (97.3%) | 15 (2.7%) |
Income Below Poverty Among Single-Parent Households in Clearwater
According to the poverty data in Clearwater, 27.5% or 28 single-father households and 8.1% or 26 single-mother households are living below the poverty line. Among single-father households, those with 1 or 2 children have the highest poverty rate, with 28 households (30.1%) experiencing poverty. Likewise, among single-mother households, those with no children have the highest poverty rate, with 26 households (27.7%) falling below the poverty line.
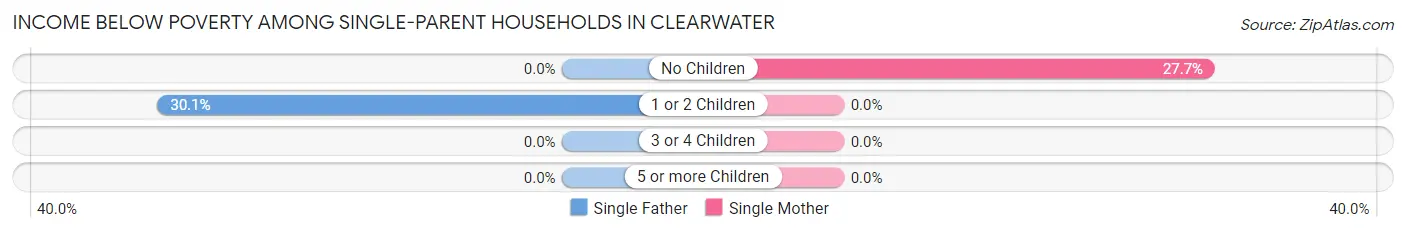
| Children | Single Father | Single Mother |
| No Children | 0 (0.0%) | 26 (27.7%) |
| 1 or 2 Children | 28 (30.1%) | 0 (0.0%) |
| 3 or 4 Children | 0 (0.0%) | 0 (0.0%) |
| 5 or more Children | 0 (0.0%) | 0 (0.0%) |
| Total | 28 (27.5%) | 26 (8.1%) |
Income Below Poverty Among Married-Couple vs Single-Parent Households in Clearwater
The poverty data for Clearwater shows that 15 of the married-couple family households (2.7%) and 54 of the single-parent households (12.7%) are living below the poverty level. Within the married-couple family households, those with 1 or 2 children have the highest poverty rate, with 15 households (6.7%) falling below the poverty line. Among the single-parent households, those with no children have the highest poverty rate, with 26 household (25.2%) living below poverty.
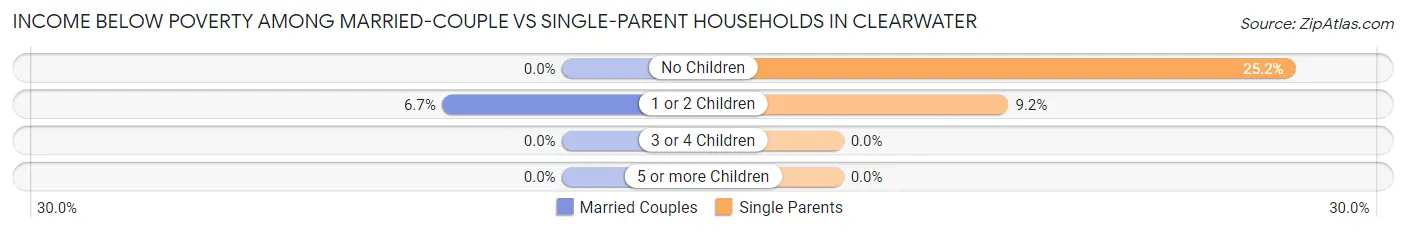
| Children | Married-Couple Families | Single-Parent Households |
| No Children | 0 (0.0%) | 26 (25.2%) |
| 1 or 2 Children | 15 (6.7%) | 28 (9.2%) |
| 3 or 4 Children | 0 (0.0%) | 0 (0.0%) |
| 5 or more Children | 0 (0.0%) | 0 (0.0%) |
| Total | 15 (2.7%) | 54 (12.7%) |
Race in Clearwater
The most populous races in Clearwater are White / Caucasian (2,304 | 67.7%), Black / African American (537 | 15.8%), and Two or more Races (508 | 14.9%).
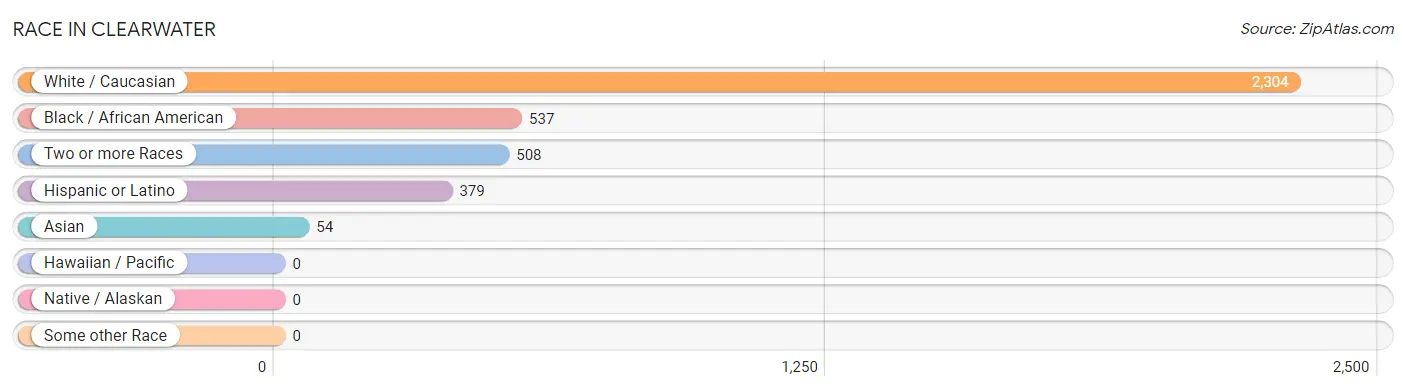
| Race | # Population | % Population |
| Asian | 54 | 1.6% |
| Black / African American | 537 | 15.8% |
| Hawaiian / Pacific | 0 | 0.0% |
| Hispanic or Latino | 379 | 11.1% |
| Native / Alaskan | 0 | 0.0% |
| White / Caucasian | 2,304 | 67.7% |
| Two or more Races | 508 | 14.9% |
| Some other Race | 0 | 0.0% |
| Total | 3,403 | 100.0% |
Ancestry in Clearwater
The most populous ancestries reported in Clearwater are American (516 | 15.2%), European (395 | 11.6%), English (300 | 8.8%), German (261 | 7.7%), and Irish (255 | 7.5%), together accounting for 50.7% of all Clearwater residents.
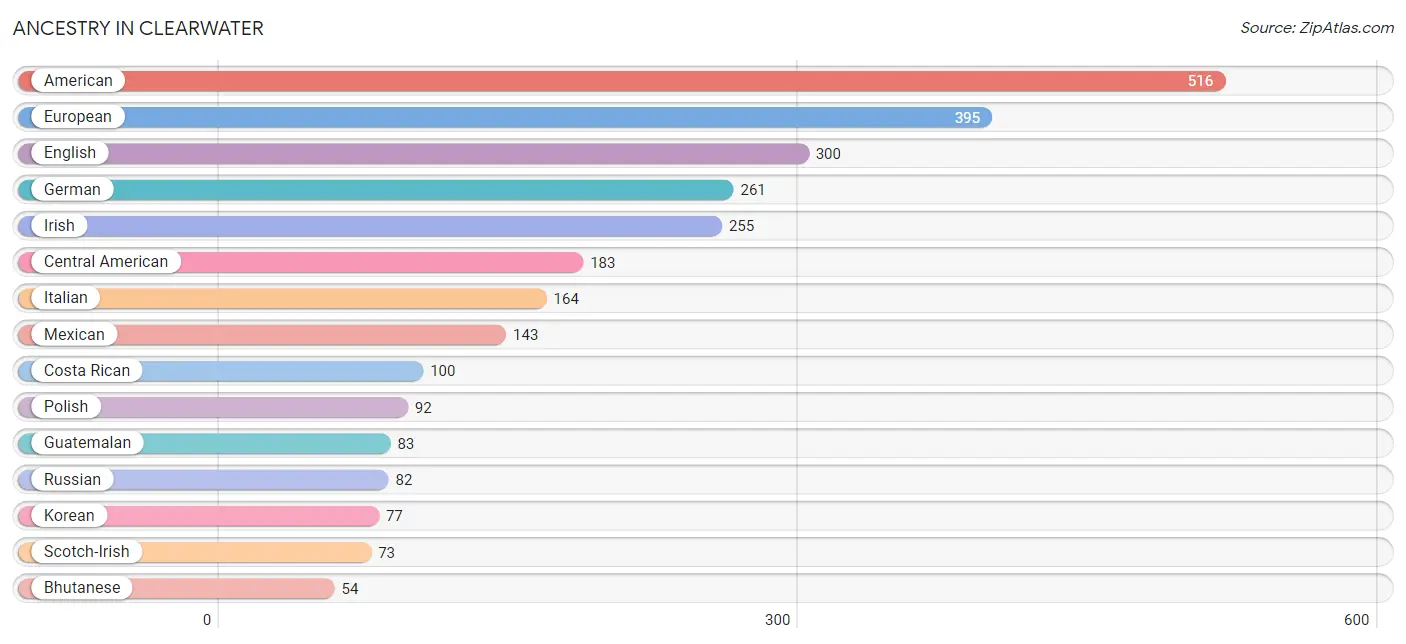
| Ancestry | # Population | % Population |
| American | 516 | 15.2% |
| Bhutanese | 54 | 1.6% |
| Brazilian | 49 | 1.4% |
| British | 36 | 1.1% |
| Central American | 183 | 5.4% |
| Central American Indian | 3 | 0.1% |
| Cherokee | 44 | 1.3% |
| Costa Rican | 100 | 2.9% |
| English | 300 | 8.8% |
| European | 395 | 11.6% |
| French | 32 | 0.9% |
| French Canadian | 4 | 0.1% |
| German | 261 | 7.7% |
| Greek | 17 | 0.5% |
| Guatemalan | 83 | 2.4% |
| Irish | 255 | 7.5% |
| Italian | 164 | 4.8% |
| Korean | 77 | 2.3% |
| Mexican | 143 | 4.2% |
| Polish | 92 | 2.7% |
| Puerto Rican | 39 | 1.1% |
| Russian | 82 | 2.4% |
| Scandinavian | 23 | 0.7% |
| Scotch-Irish | 73 | 2.1% |
| Scottish | 37 | 1.1% |
| Spanish | 14 | 0.4% |
| Welsh | 9 | 0.3% | View All 27 Rows |
Immigrants in Clearwater
The most numerous immigrant groups reported in Clearwater came from Latin America (167 | 4.9%), Central America (118 | 3.5%), Costa Rica (56 | 1.7%), Brazil (49 | 1.4%), and South America (49 | 1.4%), together accounting for 12.9% of all Clearwater residents.
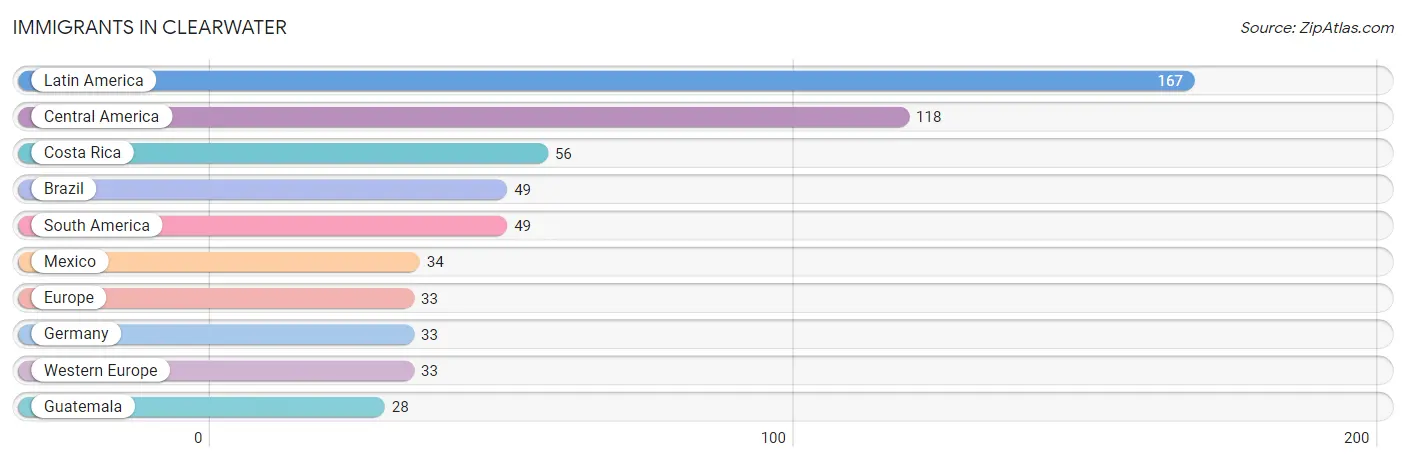
| Immigration Origin | # Population | % Population |
| Brazil | 49 | 1.4% |
| Central America | 118 | 3.5% |
| Costa Rica | 56 | 1.7% |
| Europe | 33 | 1.0% |
| Germany | 33 | 1.0% |
| Guatemala | 28 | 0.8% |
| Latin America | 167 | 4.9% |
| Mexico | 34 | 1.0% |
| South America | 49 | 1.4% |
| Western Europe | 33 | 1.0% | View All 10 Rows |
Sex and Age in Clearwater
Sex and Age in Clearwater
The most populous age groups in Clearwater are 20 to 24 Years (210 | 13.1%) for men and 20 to 24 Years (245 | 13.6%) for women.
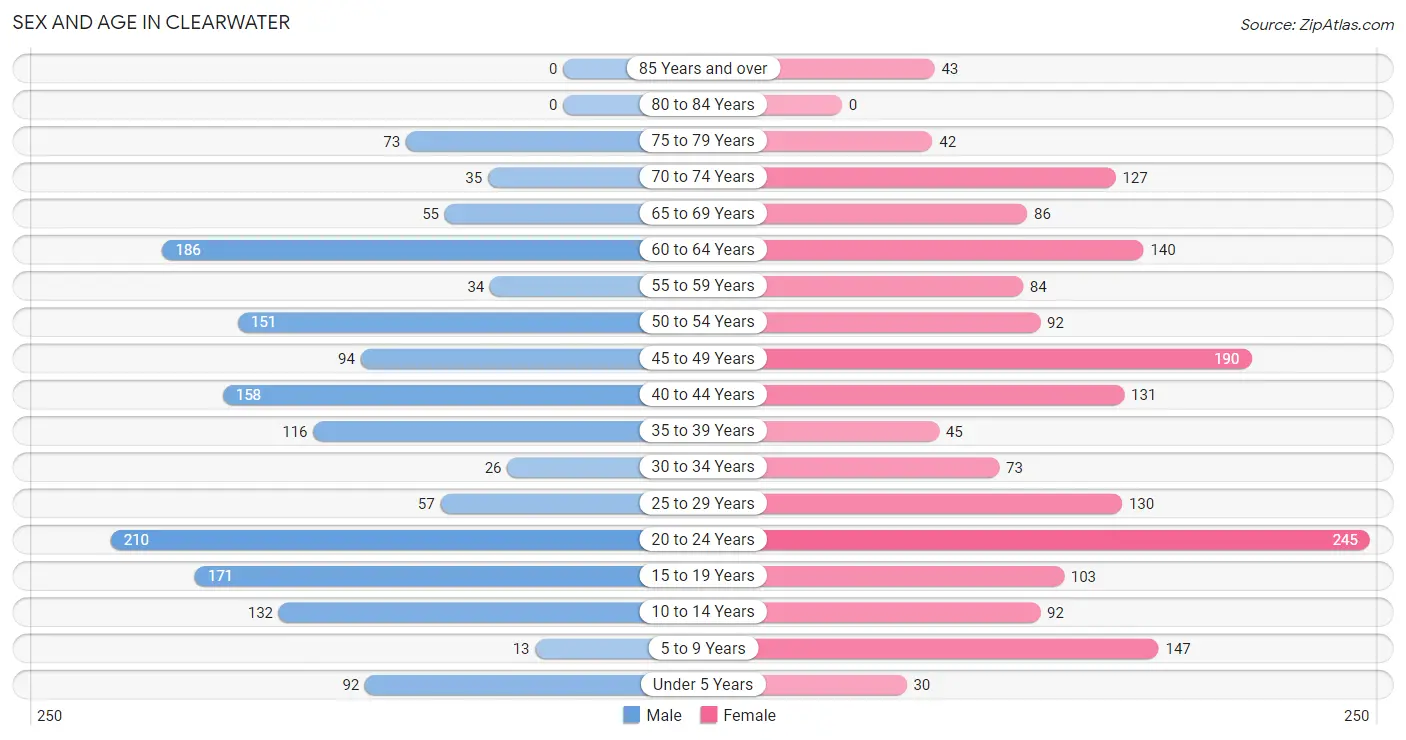
| Age Bracket | Male | Female |
| Under 5 Years | 92 (5.7%) | 30 (1.7%) |
| 5 to 9 Years | 13 (0.8%) | 147 (8.2%) |
| 10 to 14 Years | 132 (8.2%) | 92 (5.1%) |
| 15 to 19 Years | 171 (10.7%) | 103 (5.7%) |
| 20 to 24 Years | 210 (13.1%) | 245 (13.6%) |
| 25 to 29 Years | 57 (3.6%) | 130 (7.2%) |
| 30 to 34 Years | 26 (1.6%) | 73 (4.1%) |
| 35 to 39 Years | 116 (7.2%) | 45 (2.5%) |
| 40 to 44 Years | 158 (9.9%) | 131 (7.3%) |
| 45 to 49 Years | 94 (5.9%) | 190 (10.6%) |
| 50 to 54 Years | 151 (9.4%) | 92 (5.1%) |
| 55 to 59 Years | 34 (2.1%) | 84 (4.7%) |
| 60 to 64 Years | 186 (11.6%) | 140 (7.8%) |
| 65 to 69 Years | 55 (3.4%) | 86 (4.8%) |
| 70 to 74 Years | 35 (2.2%) | 127 (7.1%) |
| 75 to 79 Years | 73 (4.5%) | 42 (2.3%) |
| 80 to 84 Years | 0 (0.0%) | 0 (0.0%) |
| 85 Years and over | 0 (0.0%) | 43 (2.4%) |
| Total | 1,603 (100.0%) | 1,800 (100.0%) |
Families and Households in Clearwater
Median Family Size in Clearwater
The median family size in Clearwater is 2.85 persons per family, with married-couple families (552 | 56.6%) accounting for the largest median family size of 3.06 persons per family. On the other hand, single male/father families (102 | 10.4%) represent the smallest median family size with 1.95 persons per family.
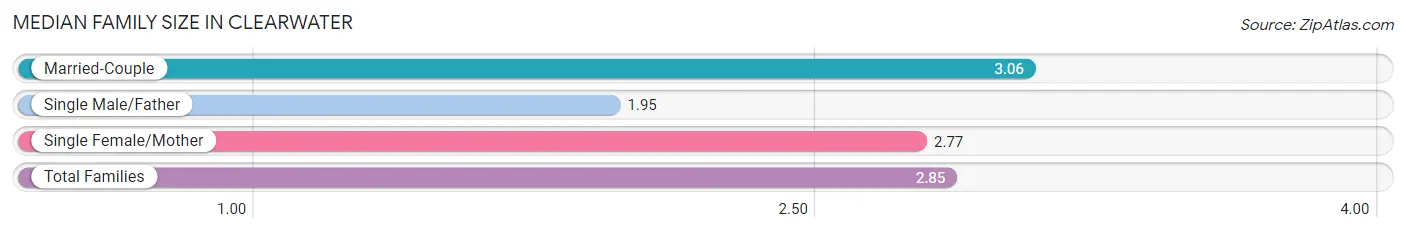
| Family Type | # Families | Family Size |
| Married-Couple | 552 (56.6%) | 3.06 |
| Single Male/Father | 102 (10.4%) | 1.95 |
| Single Female/Mother | 322 (33.0%) | 2.77 |
| Total Families | 976 (100.0%) | 2.85 |
Median Household Size in Clearwater
The median household size in Clearwater is 2.43 persons per household, with married-couple households (552 | 39.6%) accounting for the largest median household size of 3.09 persons per household. non-family households (419 | 30.0%) represent the smallest median household size with 1.29 persons per household.
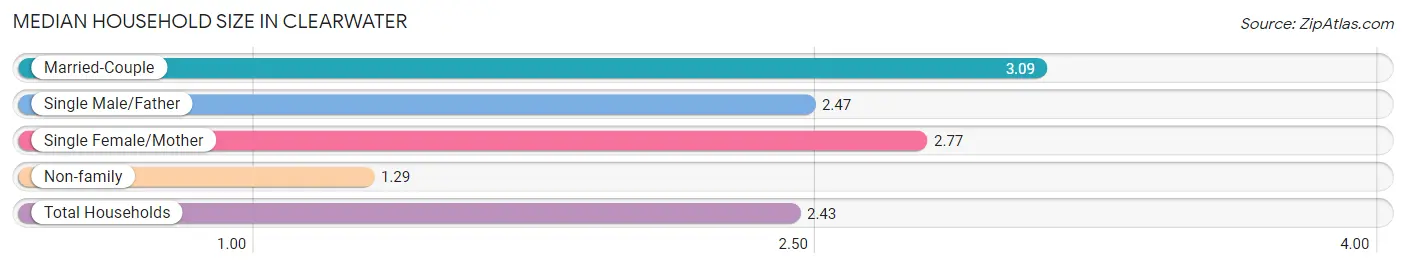
| Household Type | # Households | Household Size |
| Married-Couple | 552 (39.6%) | 3.09 |
| Single Male/Father | 102 (7.3%) | 2.47 |
| Single Female/Mother | 322 (23.1%) | 2.77 |
| Non-family | 419 (30.0%) | 1.29 |
| Total Households | 1,395 (100.0%) | 2.43 |
Household Size by Marriage Status in Clearwater
Out of a total of 1,395 households in Clearwater, 976 (70.0%) are family households, while 419 (30.0%) are nonfamily households. The most numerous type of family households are 2-person households, comprising 434, and the most common type of nonfamily households are 1-person households, comprising 307.
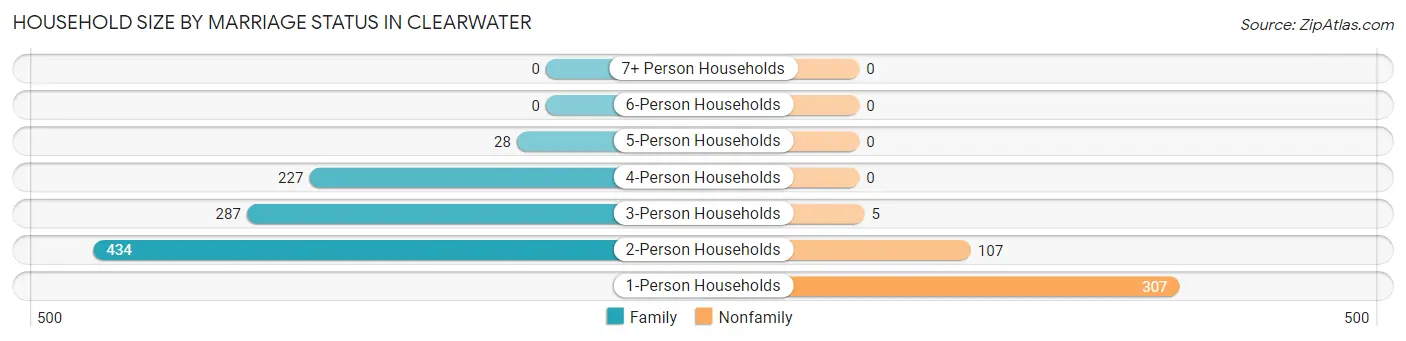
| Household Size | Family Households | Nonfamily Households |
| 1-Person Households | - | 307 (22.0%) |
| 2-Person Households | 434 (31.1%) | 107 (7.7%) |
| 3-Person Households | 287 (20.6%) | 5 (0.4%) |
| 4-Person Households | 227 (16.3%) | 0 (0.0%) |
| 5-Person Households | 28 (2.0%) | 0 (0.0%) |
| 6-Person Households | 0 (0.0%) | 0 (0.0%) |
| 7+ Person Households | 0 (0.0%) | 0 (0.0%) |
| Total | 976 (70.0%) | 419 (30.0%) |
Female Fertility in Clearwater
Fertility by Age in Clearwater
Average fertility rate in Clearwater is 47.0 births per 1,000 women. Women in the age bracket of 20 to 34 years have the highest fertility rate with 100.0 births per 1,000 women. Women in the age bracket of 20 to 34 years acount for 100.0% of all women with births.
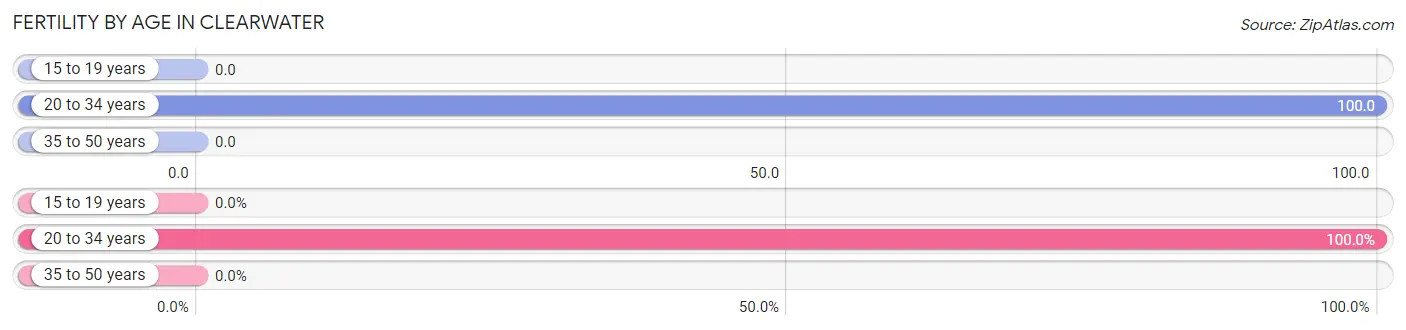
| Age Bracket | Women with Births | Births / 1,000 Women |
| 15 to 19 years | 0 (0.0%) | 0.0 |
| 20 to 34 years | 45 (100.0%) | 100.0 |
| 35 to 50 years | 0 (0.0%) | 0.0 |
| Total | 45 (100.0%) | 47.0 |
Fertility by Age by Marriage Status in Clearwater
40.0% of women with births (45) in Clearwater are married. The highest percentage of unmarried women with births falls into 20 to 34 years age bracket with 60.0% of them unmarried at the time of birth, while the lowest percentage of unmarried women with births belong to 20 to 34 years age bracket with 60.0% of them unmarried.
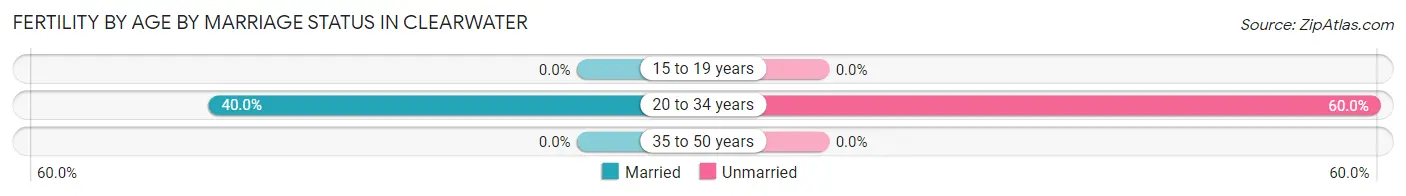
| Age Bracket | Married | Unmarried |
| 15 to 19 years | 0 (0.0%) | 0 (0.0%) |
| 20 to 34 years | 18 (40.0%) | 27 (60.0%) |
| 35 to 50 years | 0 (0.0%) | 0 (0.0%) |
| Total | 18 (40.0%) | 27 (60.0%) |
Fertility by Education in Clearwater
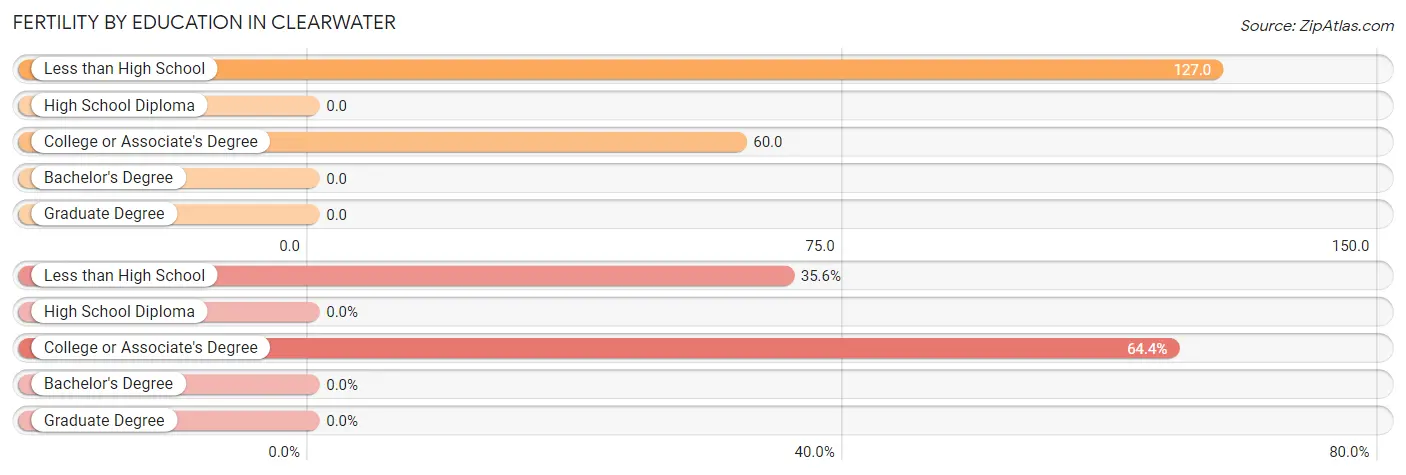
| Educational Attainment | Women with Births | Births / 1,000 Women |
| Less than High School | 16 (35.6%) | 127.0 |
| High School Diploma | 0 (0.0%) | 0.0 |
| College or Associate's Degree | 29 (64.4%) | 60.0 |
| Bachelor's Degree | 0 (0.0%) | 0.0 |
| Graduate Degree | 0 (0.0%) | 0.0 |
| Total | 45 (100.0%) | 47.0 |
Fertility by Education by Marriage Status in Clearwater
60.0% of women with births in Clearwater are unmarried. Women with the educational attainment of college or associate's degree are most likely to be married with 62.1% of them married at childbirth, while women with the educational attainment of less than high school are least likely to be married with 100.0% of them unmarried at childbirth.
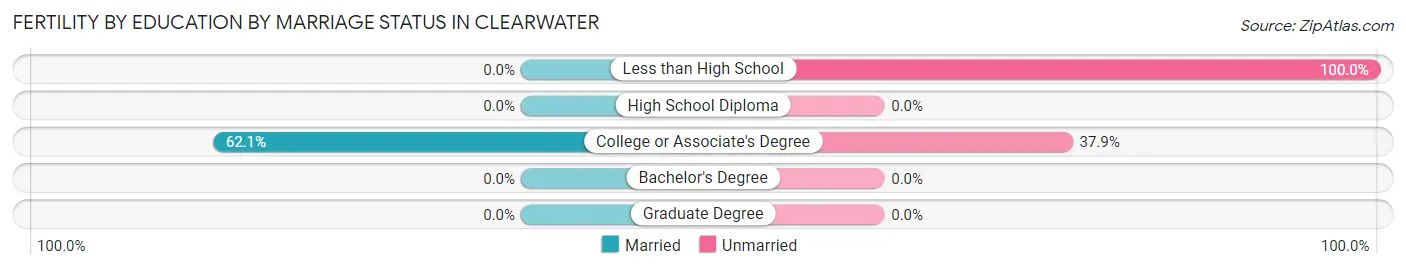
| Educational Attainment | Married | Unmarried |
| Less than High School | 0 (0.0%) | 16 (100.0%) |
| High School Diploma | 0 (0.0%) | 0 (0.0%) |
| College or Associate's Degree | 18 (62.1%) | 11 (37.9%) |
| Bachelor's Degree | 0 (0.0%) | 0 (0.0%) |
| Graduate Degree | 0 (0.0%) | 0 (0.0%) |
| Total | 18 (40.0%) | 27 (60.0%) |
Employment Characteristics in Clearwater
Employment by Class of Employer in Clearwater
Among the 1,621 employed individuals in Clearwater, private company employees (1,258 | 77.6%), local government employees (86 | 5.3%), and federal government employees (67 | 4.1%) make up the most common classes of employment.
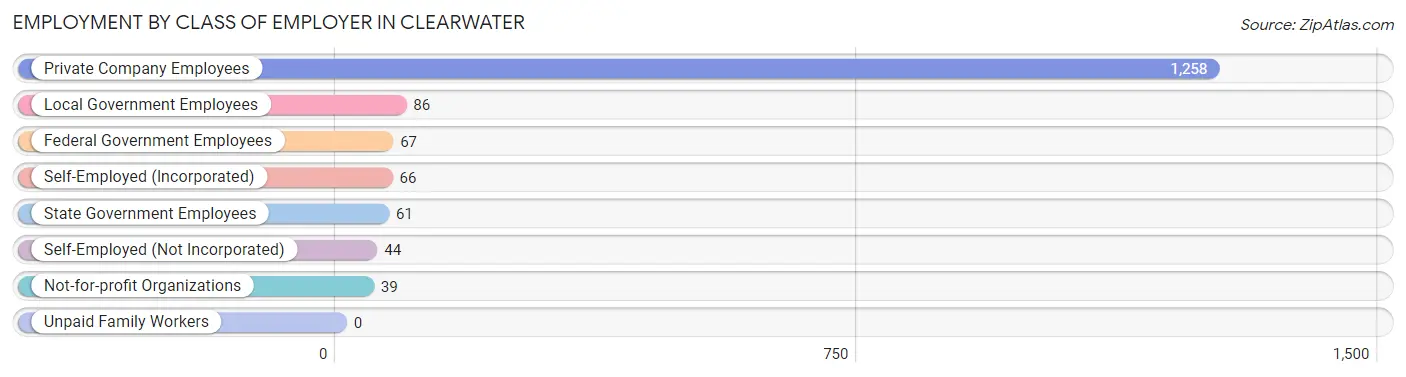
| Employer Class | # Employees | % Employees |
| Private Company Employees | 1,258 | 77.6% |
| Self-Employed (Incorporated) | 66 | 4.1% |
| Self-Employed (Not Incorporated) | 44 | 2.7% |
| Not-for-profit Organizations | 39 | 2.4% |
| Local Government Employees | 86 | 5.3% |
| State Government Employees | 61 | 3.8% |
| Federal Government Employees | 67 | 4.1% |
| Unpaid Family Workers | 0 | 0.0% |
| Total | 1,621 | 100.0% |
Employment Status by Age in Clearwater
According to the labor force statistics for Clearwater, out of the total population over 16 years of age (2,834), 67.7% or 1,919 individuals are in the labor force, with 13.2% or 253 of them unemployed. The age group with the highest labor force participation rate is 20 to 24 years, with 99.3% or 452 individuals in the labor force. Within the labor force, the 75 years and over age range has the highest percentage of unemployed individuals, with 100.0% or 16 of them being unemployed.
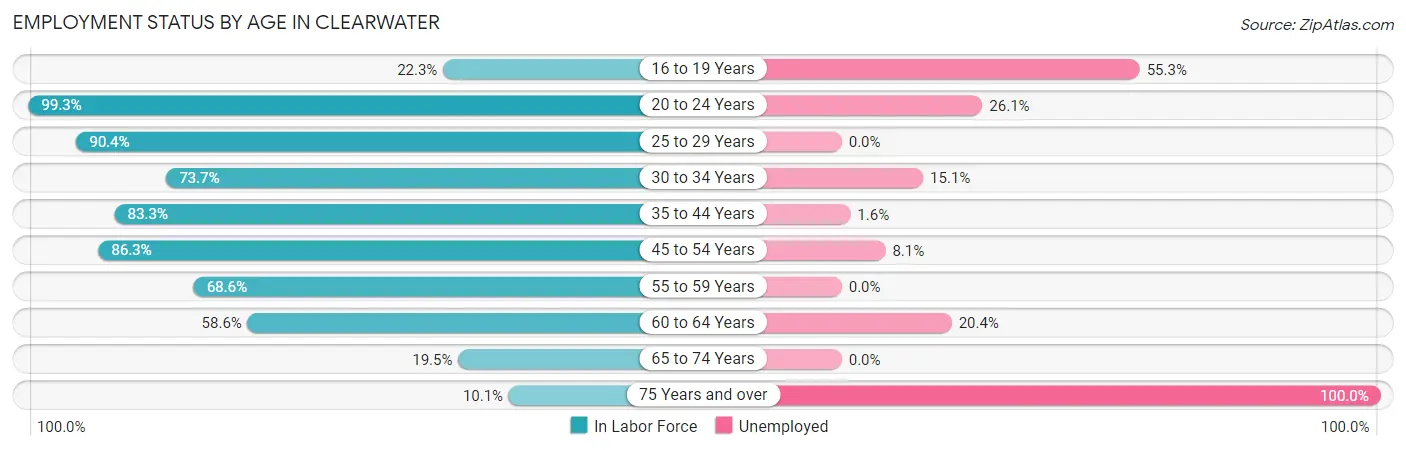
| Age Bracket | In Labor Force | Unemployed |
| 16 to 19 Years | 47 (22.3%) | 26 (55.3%) |
| 20 to 24 Years | 452 (99.3%) | 118 (26.1%) |
| 25 to 29 Years | 169 (90.4%) | 0 (0.0%) |
| 30 to 34 Years | 73 (73.7%) | 11 (15.1%) |
| 35 to 44 Years | 375 (83.3%) | 6 (1.6%) |
| 45 to 54 Years | 455 (86.3%) | 37 (8.1%) |
| 55 to 59 Years | 81 (68.6%) | 0 (0.0%) |
| 60 to 64 Years | 191 (58.6%) | 39 (20.4%) |
| 65 to 74 Years | 59 (19.5%) | 0 (0.0%) |
| 75 Years and over | 16 (10.1%) | 16 (100.0%) |
| Total | 1,919 (67.7%) | 253 (13.2%) |
Employment Status by Educational Attainment in Clearwater
According to labor force statistics for Clearwater, 78.7% of individuals (1,343) out of the total population between 25 and 64 years of age (1,707) are in the labor force, with 6.9% or 93 of them being unemployed. The group with the highest labor force participation rate are those with the educational attainment of less than high school, with 96.8% or 149 individuals in the labor force. Within the labor force, individuals with high school diploma education have the highest percentage of unemployment, with 9.8% or 48 of them being unemployed.
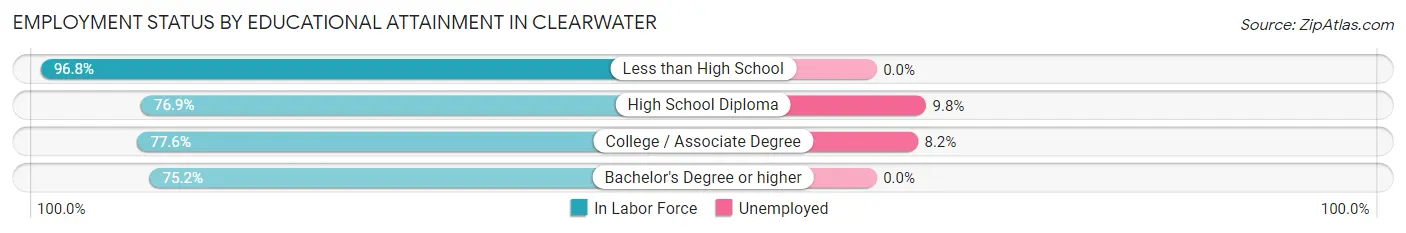
| Educational Attainment | In Labor Force | Unemployed |
| Less than High School | 149 (96.8%) | 0 (0.0%) |
| High School Diploma | 488 (76.9%) | 62 (9.8%) |
| College / Associate Degree | 546 (77.6%) | 58 (8.2%) |
| Bachelor's Degree or higher | 161 (75.2%) | 0 (0.0%) |
| Total | 1,343 (78.7%) | 118 (6.9%) |
Employment Occupations by Sex in Clearwater
Management, Business, Science and Arts Occupations
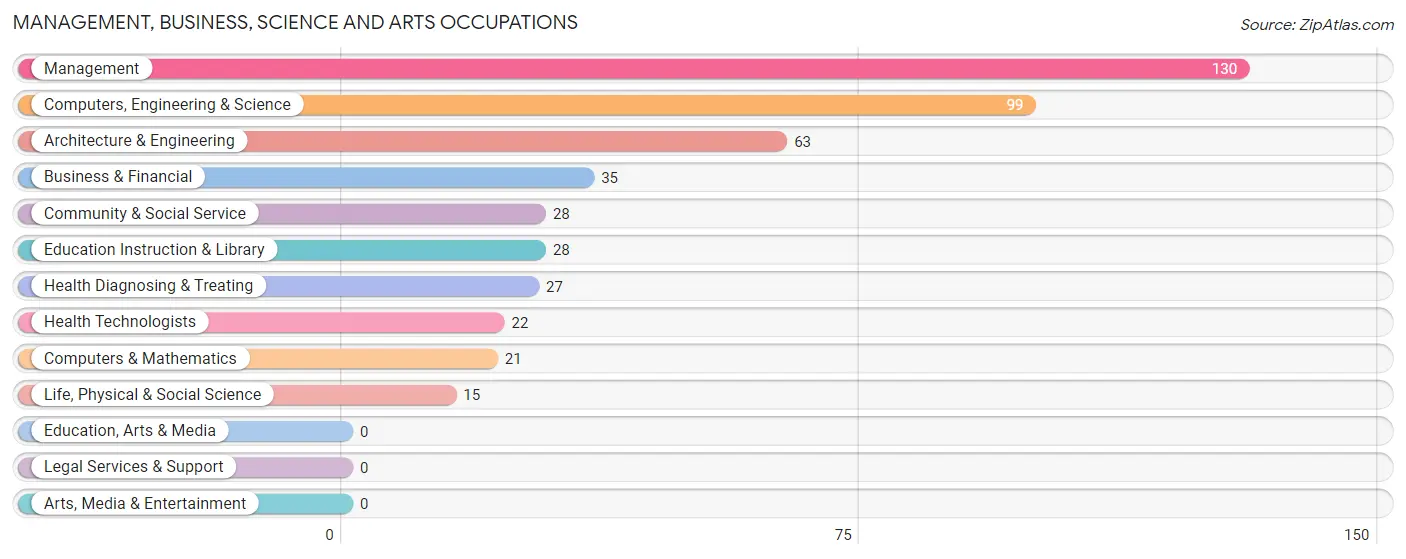
The most common Management, Business, Science and Arts occupations in Clearwater are Management (130 | 7.8%), Computers, Engineering & Science (99 | 5.9%), Architecture & Engineering (63 | 3.8%), Business & Financial (35 | 2.1%), and Community & Social Service (28 | 1.7%).
Management, Business, Science and Arts Occupations by Sex
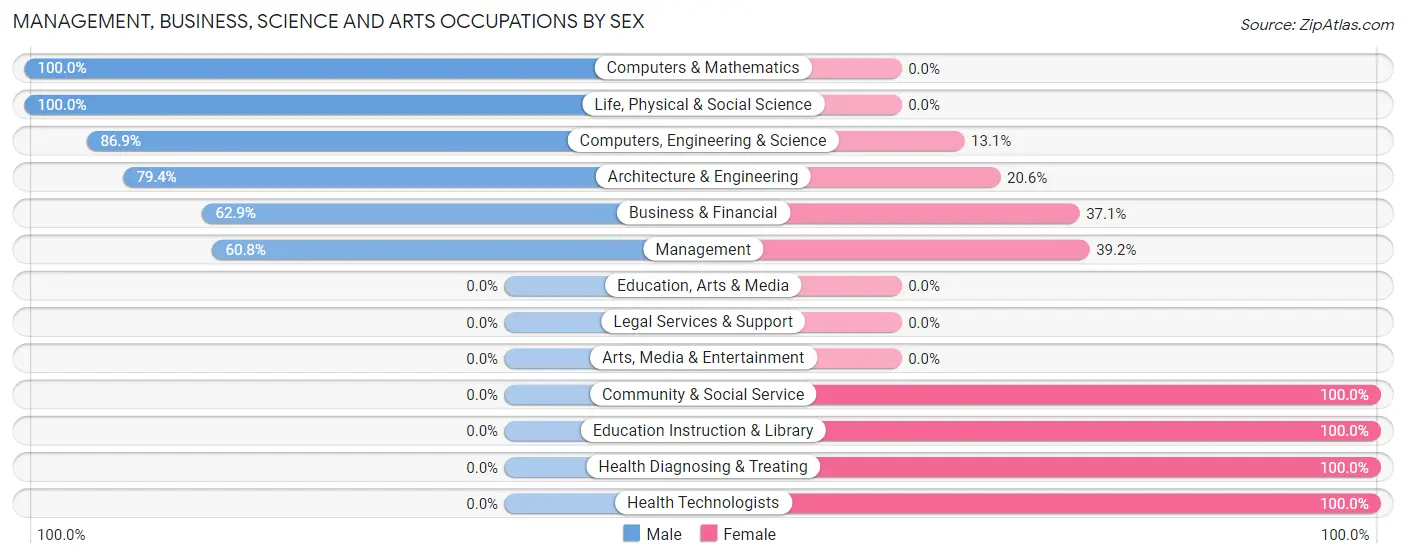
Within the Management, Business, Science and Arts occupations in Clearwater, the most male-oriented occupations are Computers & Mathematics (100.0%), Life, Physical & Social Science (100.0%), and Computers, Engineering & Science (86.9%), while the most female-oriented occupations are Community & Social Service (100.0%), Education Instruction & Library (100.0%), and Health Diagnosing & Treating (100.0%).
| Occupation | Male | Female |
| Management | 79 (60.8%) | 51 (39.2%) |
| Business & Financial | 22 (62.9%) | 13 (37.1%) |
| Computers, Engineering & Science | 86 (86.9%) | 13 (13.1%) |
| Computers & Mathematics | 21 (100.0%) | 0 (0.0%) |
| Architecture & Engineering | 50 (79.4%) | 13 (20.6%) |
| Life, Physical & Social Science | 15 (100.0%) | 0 (0.0%) |
| Community & Social Service | 0 (0.0%) | 28 (100.0%) |
| Education, Arts & Media | 0 (0.0%) | 0 (0.0%) |
| Legal Services & Support | 0 (0.0%) | 0 (0.0%) |
| Education Instruction & Library | 0 (0.0%) | 28 (100.0%) |
| Arts, Media & Entertainment | 0 (0.0%) | 0 (0.0%) |
| Health Diagnosing & Treating | 0 (0.0%) | 27 (100.0%) |
| Health Technologists | 0 (0.0%) | 22 (100.0%) |
| Total (Category) | 187 (58.6%) | 132 (41.4%) |
| Total (Overall) | 802 (48.2%) | 863 (51.8%) |
Services Occupations
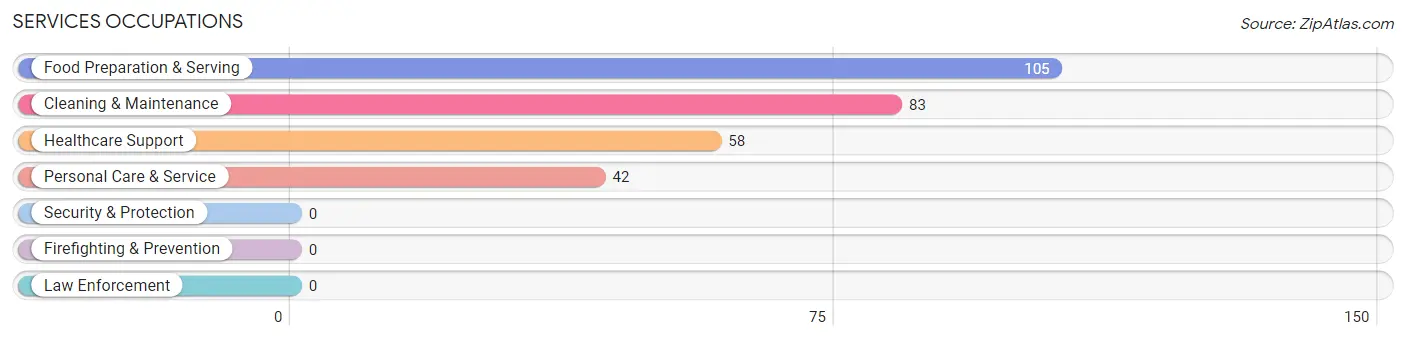
The most common Services occupations in Clearwater are Food Preparation & Serving (105 | 6.3%), Cleaning & Maintenance (83 | 5.0%), Healthcare Support (58 | 3.5%), and Personal Care & Service (42 | 2.5%).
Services Occupations by Sex
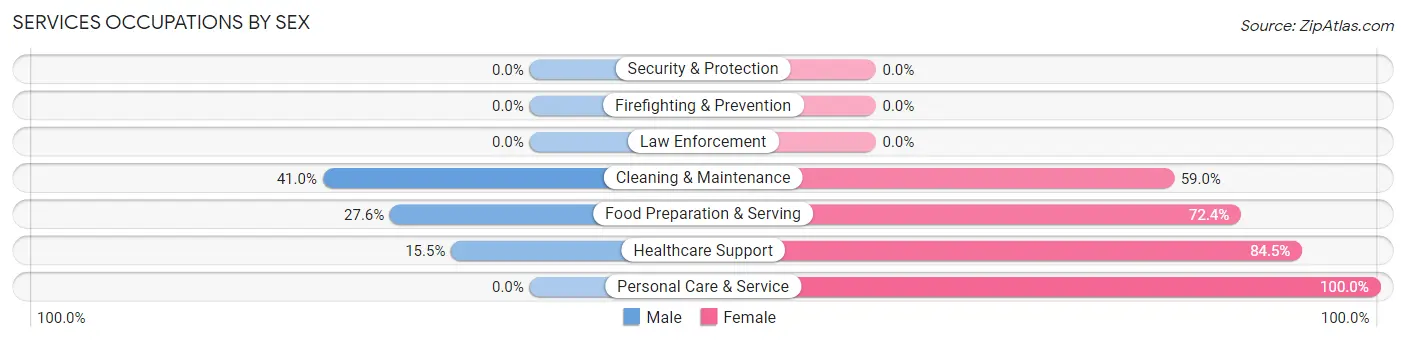
Within the Services occupations in Clearwater, the most male-oriented occupations are Cleaning & Maintenance (41.0%), Food Preparation & Serving (27.6%), and Healthcare Support (15.5%), while the most female-oriented occupations are Personal Care & Service (100.0%), Healthcare Support (84.5%), and Food Preparation & Serving (72.4%).
| Occupation | Male | Female |
| Healthcare Support | 9 (15.5%) | 49 (84.5%) |
| Security & Protection | 0 (0.0%) | 0 (0.0%) |
| Firefighting & Prevention | 0 (0.0%) | 0 (0.0%) |
| Law Enforcement | 0 (0.0%) | 0 (0.0%) |
| Food Preparation & Serving | 29 (27.6%) | 76 (72.4%) |
| Cleaning & Maintenance | 34 (41.0%) | 49 (59.0%) |
| Personal Care & Service | 0 (0.0%) | 42 (100.0%) |
| Total (Category) | 72 (25.0%) | 216 (75.0%) |
| Total (Overall) | 802 (48.2%) | 863 (51.8%) |
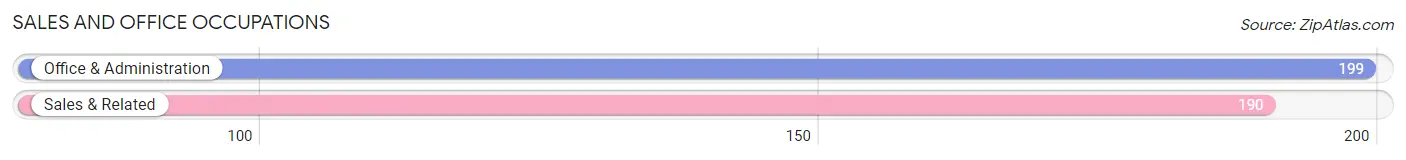
Sales and Office Occupations
The most common Sales and Office occupations in Clearwater are Office & Administration (199 | 11.9%), and Sales & Related (190 | 11.4%).
Sales and Office Occupations by Sex
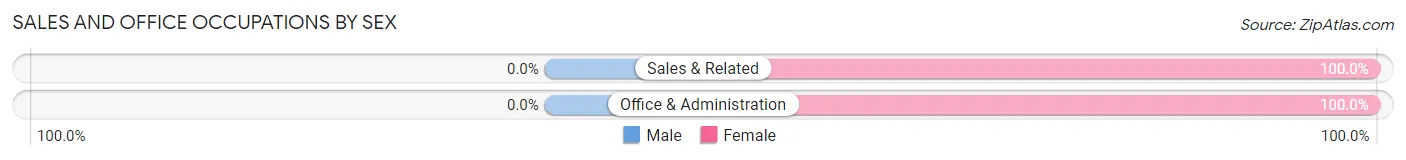
| Occupation | Male | Female |
| Sales & Related | 0 (0.0%) | 190 (100.0%) |
| Office & Administration | 0 (0.0%) | 199 (100.0%) |
| Total (Category) | 0 (0.0%) | 389 (100.0%) |
| Total (Overall) | 802 (48.2%) | 863 (51.8%) |
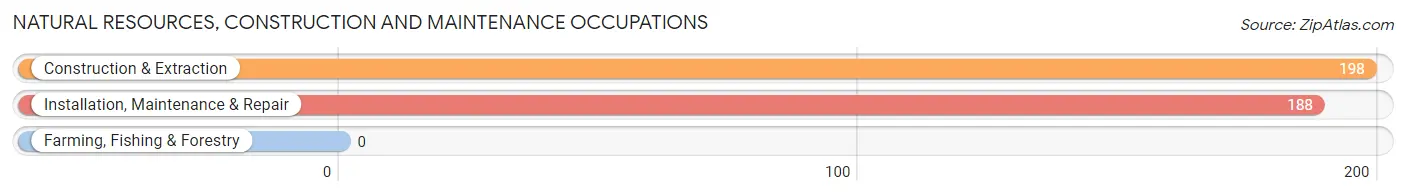
Natural Resources, Construction and Maintenance Occupations
The most common Natural Resources, Construction and Maintenance occupations in Clearwater are Construction & Extraction (198 | 11.9%), and Installation, Maintenance & Repair (188 | 11.3%).
Natural Resources, Construction and Maintenance Occupations by Sex
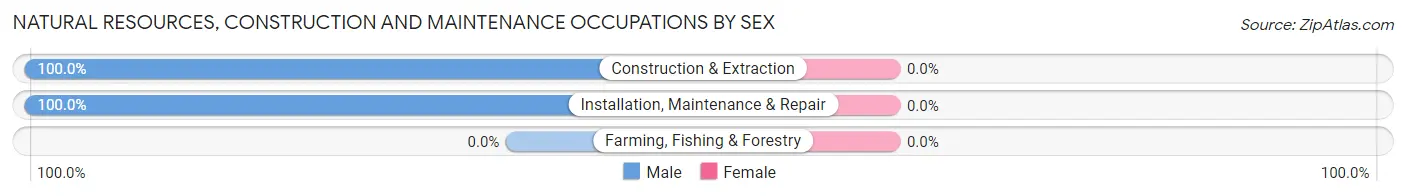
| Occupation | Male | Female |
| Farming, Fishing & Forestry | 0 (0.0%) | 0 (0.0%) |
| Construction & Extraction | 198 (100.0%) | 0 (0.0%) |
| Installation, Maintenance & Repair | 188 (100.0%) | 0 (0.0%) |
| Total (Category) | 386 (100.0%) | 0 (0.0%) |
| Total (Overall) | 802 (48.2%) | 863 (51.8%) |
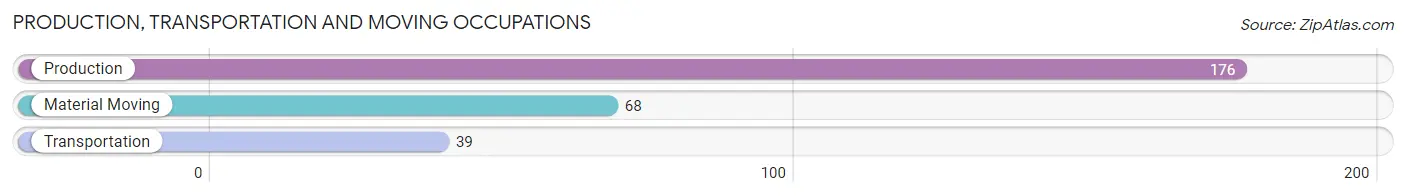
Production, Transportation and Moving Occupations
The most common Production, Transportation and Moving occupations in Clearwater are Production (176 | 10.6%), Material Moving (68 | 4.1%), and Transportation (39 | 2.3%).
Production, Transportation and Moving Occupations by Sex
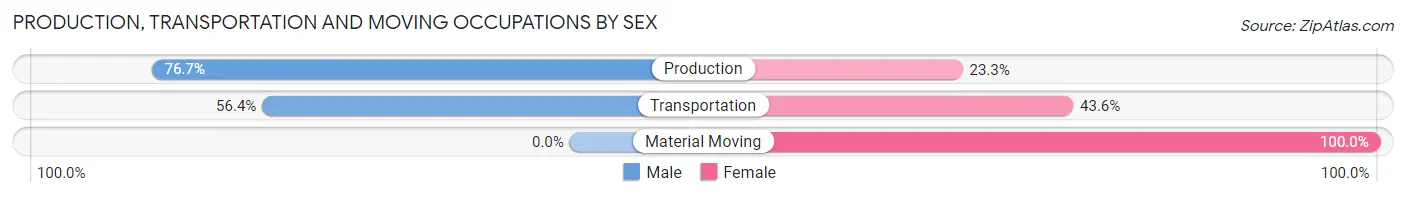
| Occupation | Male | Female |
| Production | 135 (76.7%) | 41 (23.3%) |
| Transportation | 22 (56.4%) | 17 (43.6%) |
| Material Moving | 0 (0.0%) | 68 (100.0%) |
| Total (Category) | 157 (55.5%) | 126 (44.5%) |
| Total (Overall) | 802 (48.2%) | 863 (51.8%) |
Employment Industries by Sex in Clearwater
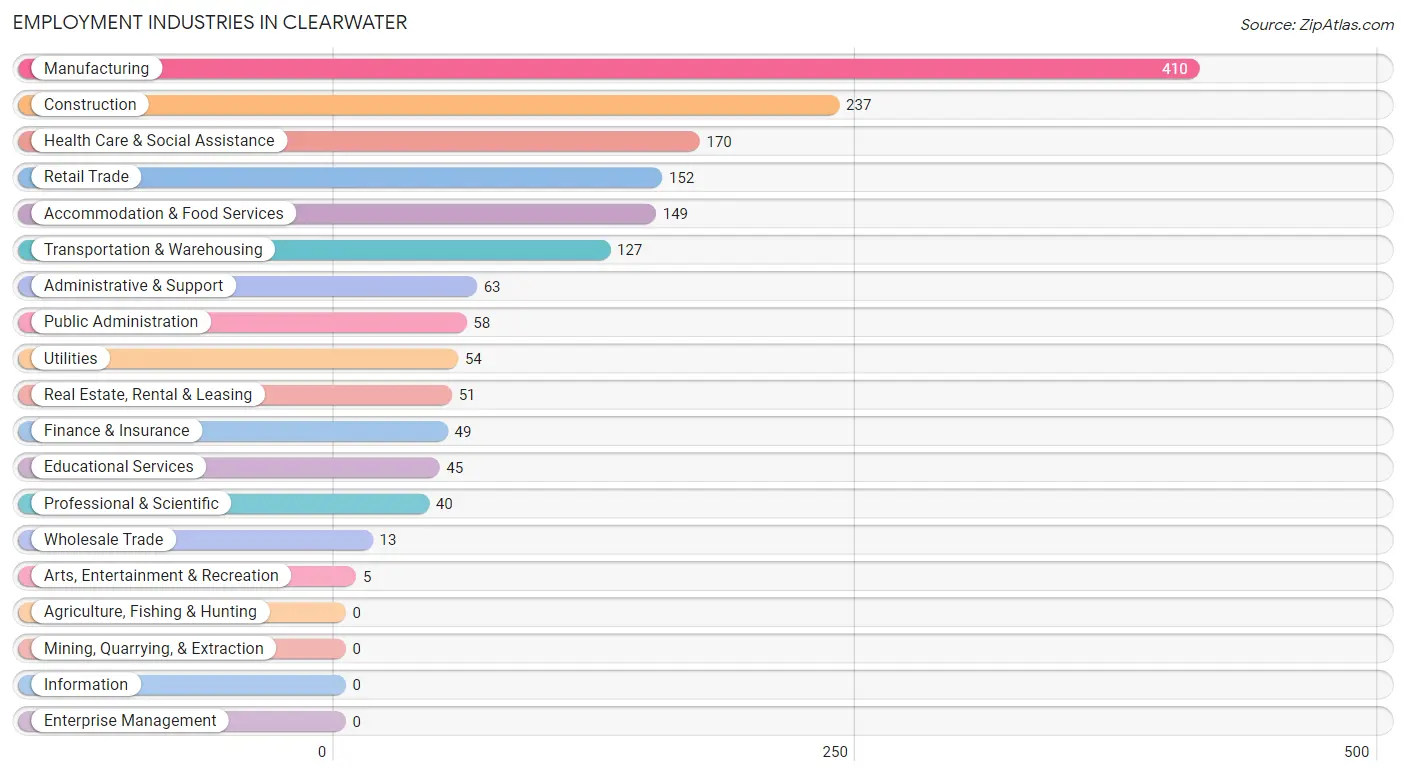
Employment Industries in Clearwater
The major employment industries in Clearwater include Manufacturing (410 | 24.6%), Construction (237 | 14.2%), Health Care & Social Assistance (170 | 10.2%), Retail Trade (152 | 9.1%), and Accommodation & Food Services (149 | 8.9%).
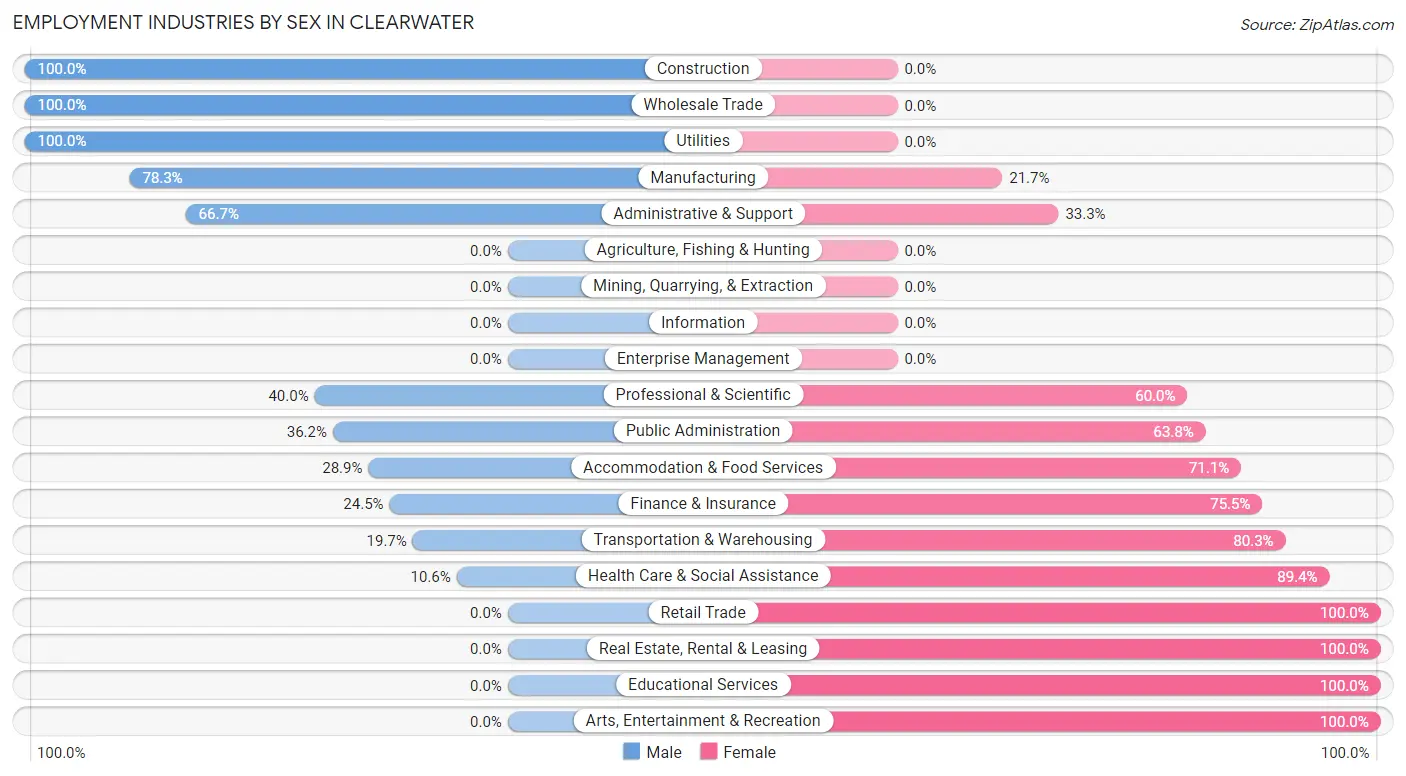
Employment Industries by Sex in Clearwater
The Clearwater industries that see more men than women are Construction (100.0%), Wholesale Trade (100.0%), and Utilities (100.0%), whereas the industries that tend to have a higher number of women are Retail Trade (100.0%), Real Estate, Rental & Leasing (100.0%), and Educational Services (100.0%).
| Industry | Male | Female |
| Agriculture, Fishing & Hunting | 0 (0.0%) | 0 (0.0%) |
| Mining, Quarrying, & Extraction | 0 (0.0%) | 0 (0.0%) |
| Construction | 237 (100.0%) | 0 (0.0%) |
| Manufacturing | 321 (78.3%) | 89 (21.7%) |
| Wholesale Trade | 13 (100.0%) | 0 (0.0%) |
| Retail Trade | 0 (0.0%) | 152 (100.0%) |
| Transportation & Warehousing | 25 (19.7%) | 102 (80.3%) |
| Utilities | 54 (100.0%) | 0 (0.0%) |
| Information | 0 (0.0%) | 0 (0.0%) |
| Finance & Insurance | 12 (24.5%) | 37 (75.5%) |
| Real Estate, Rental & Leasing | 0 (0.0%) | 51 (100.0%) |
| Professional & Scientific | 16 (40.0%) | 24 (60.0%) |
| Enterprise Management | 0 (0.0%) | 0 (0.0%) |
| Administrative & Support | 42 (66.7%) | 21 (33.3%) |
| Educational Services | 0 (0.0%) | 45 (100.0%) |
| Health Care & Social Assistance | 18 (10.6%) | 152 (89.4%) |
| Arts, Entertainment & Recreation | 0 (0.0%) | 5 (100.0%) |
| Accommodation & Food Services | 43 (28.9%) | 106 (71.1%) |
| Public Administration | 21 (36.2%) | 37 (63.8%) |
| Total | 802 (48.2%) | 863 (51.8%) |
Education in Clearwater
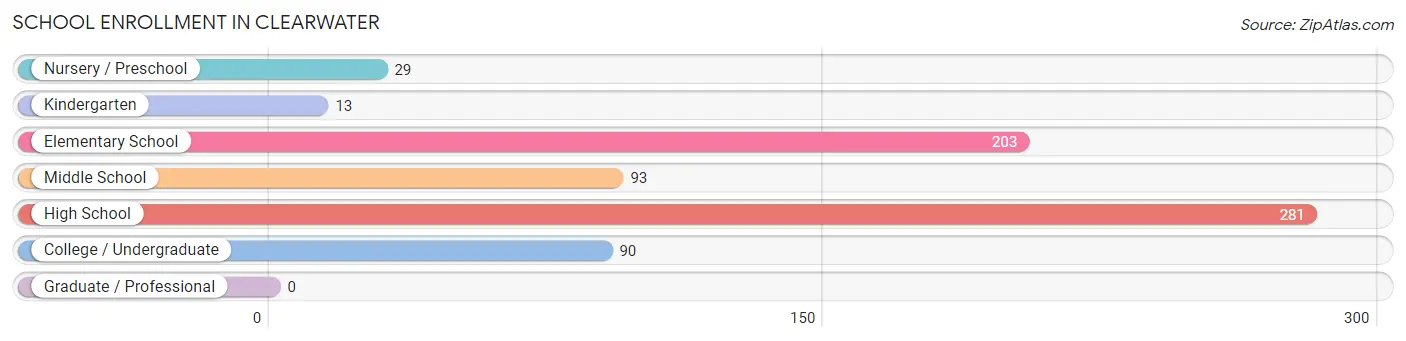
School Enrollment in Clearwater
The most common levels of schooling among the 709 students in Clearwater are high school (281 | 39.6%), elementary school (203 | 28.6%), and middle school (93 | 13.1%).
| School Level | # Students | % Students |
| Nursery / Preschool | 29 | 4.1% |
| Kindergarten | 13 | 1.8% |
| Elementary School | 203 | 28.6% |
| Middle School | 93 | 13.1% |
| High School | 281 | 39.6% |
| College / Undergraduate | 90 | 12.7% |
| Graduate / Professional | 0 | 0.0% |
| Total | 709 | 100.0% |
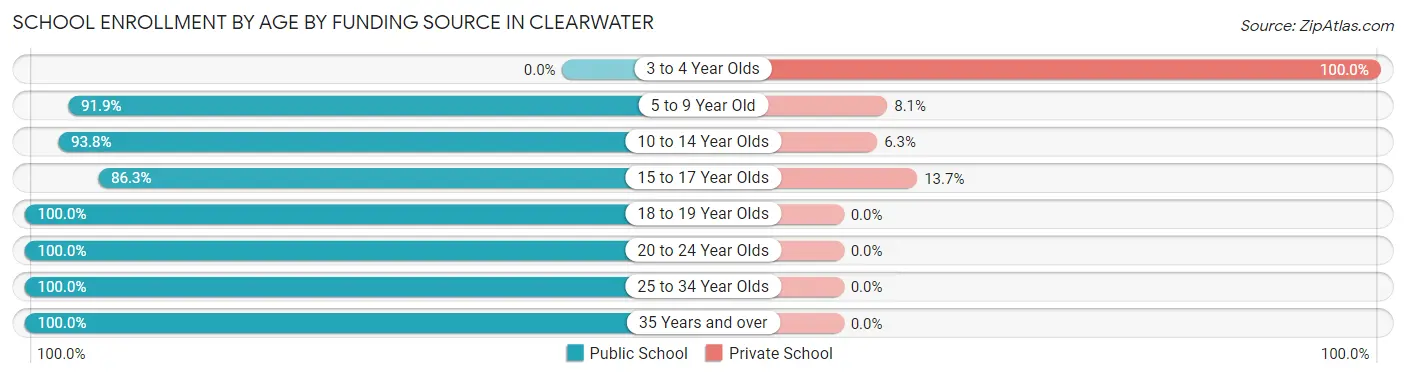
School Enrollment by Age by Funding Source in Clearwater
Out of a total of 709 students who are enrolled in schools in Clearwater, 73 (10.3%) attend a private institution, while the remaining 636 (89.7%) are enrolled in public schools. The age group of 3 to 4 year olds has the highest likelihood of being enrolled in private schools, with 16 (100.0% in the age bracket) enrolled. Conversely, the age group of 18 to 19 year olds has the lowest likelihood of being enrolled in a private school, with 8 (100.0% in the age bracket) attending a public institution.
| Age Bracket | Public School | Private School |
| 3 to 4 Year Olds | 0 (0.0%) | 16 (100.0%) |
| 5 to 9 Year Old | 147 (91.9%) | 13 (8.1%) |
| 10 to 14 Year Olds | 210 (93.8%) | 14 (6.2%) |
| 15 to 17 Year Olds | 189 (86.3%) | 30 (13.7%) |
| 18 to 19 Year Olds | 8 (100.0%) | 0 (0.0%) |
| 20 to 24 Year Olds | 37 (100.0%) | 0 (0.0%) |
| 25 to 34 Year Olds | 28 (100.0%) | 0 (0.0%) |
| 35 Years and over | 17 (100.0%) | 0 (0.0%) |
| Total | 636 (89.7%) | 73 (10.3%) |
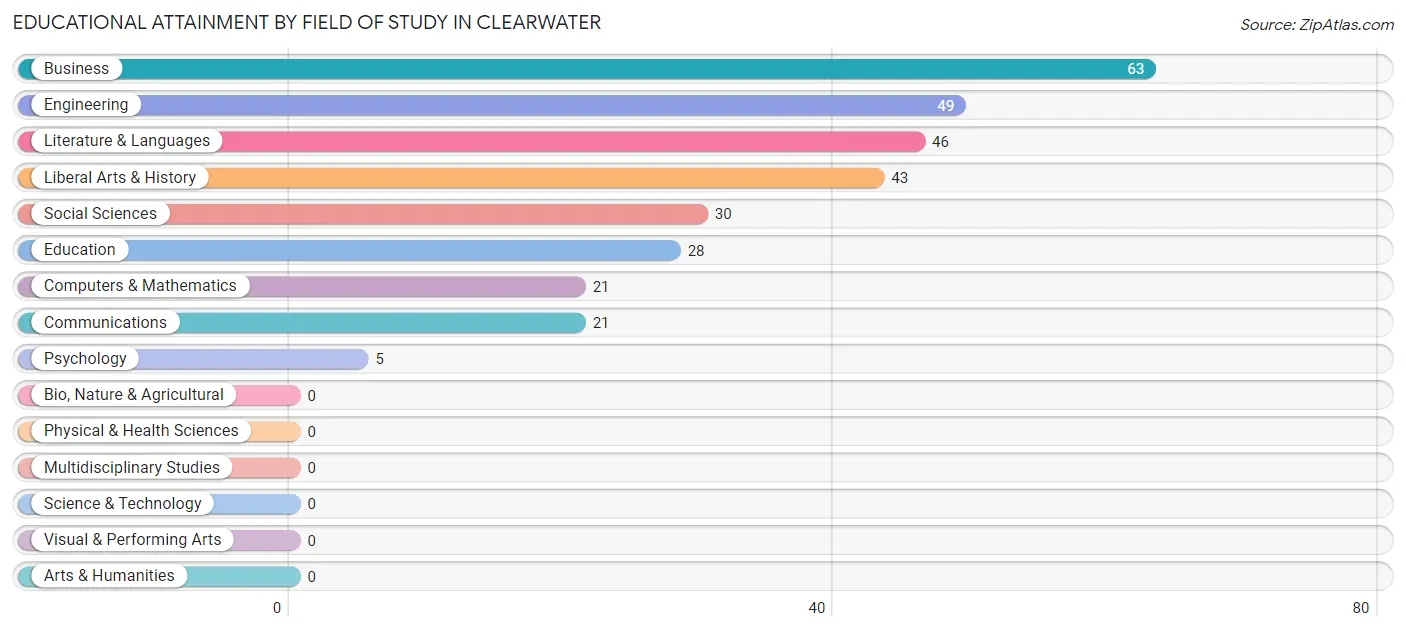
Educational Attainment by Field of Study in Clearwater
Business (63 | 20.6%), engineering (49 | 16.0%), literature & languages (46 | 15.0%), liberal arts & history (43 | 14.1%), and social sciences (30 | 9.8%) are the most common fields of study among 306 individuals in Clearwater who have obtained a bachelor's degree or higher.
| Field of Study | # Graduates | % Graduates |
| Computers & Mathematics | 21 | 6.9% |
| Bio, Nature & Agricultural | 0 | 0.0% |
| Physical & Health Sciences | 0 | 0.0% |
| Psychology | 5 | 1.6% |
| Social Sciences | 30 | 9.8% |
| Engineering | 49 | 16.0% |
| Multidisciplinary Studies | 0 | 0.0% |
| Science & Technology | 0 | 0.0% |
| Business | 63 | 20.6% |
| Education | 28 | 9.1% |
| Literature & Languages | 46 | 15.0% |
| Liberal Arts & History | 43 | 14.1% |
| Visual & Performing Arts | 0 | 0.0% |
| Communications | 21 | 6.9% |
| Arts & Humanities | 0 | 0.0% |
| Total | 306 | 100.0% |
Transportation & Commute in Clearwater
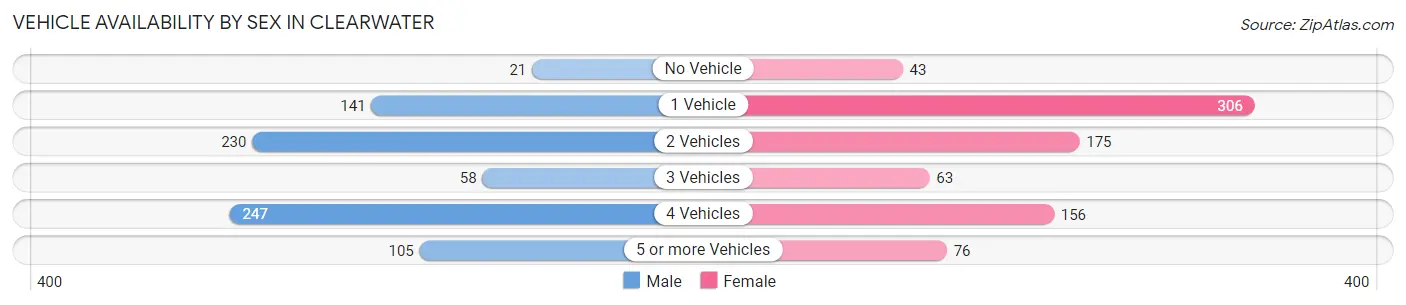
Vehicle Availability by Sex in Clearwater
The most prevalent vehicle ownership categories in Clearwater are males with 4 vehicles (247, accounting for 30.8%) and females with 4 vehicles (156, making up 30.2%).
| Vehicles Available | Male | Female |
| No Vehicle | 21 (2.6%) | 43 (5.2%) |
| 1 Vehicle | 141 (17.6%) | 306 (37.4%) |
| 2 Vehicles | 230 (28.7%) | 175 (21.4%) |
| 3 Vehicles | 58 (7.2%) | 63 (7.7%) |
| 4 Vehicles | 247 (30.8%) | 156 (19.1%) |
| 5 or more Vehicles | 105 (13.1%) | 76 (9.3%) |
| Total | 802 (100.0%) | 819 (100.0%) |
Commute Time in Clearwater
The most frequently occuring commute durations in Clearwater are 15 to 19 minutes (333 commuters, 21.8%), 30 to 34 minutes (306 commuters, 20.1%), and 20 to 24 minutes (301 commuters, 19.8%).
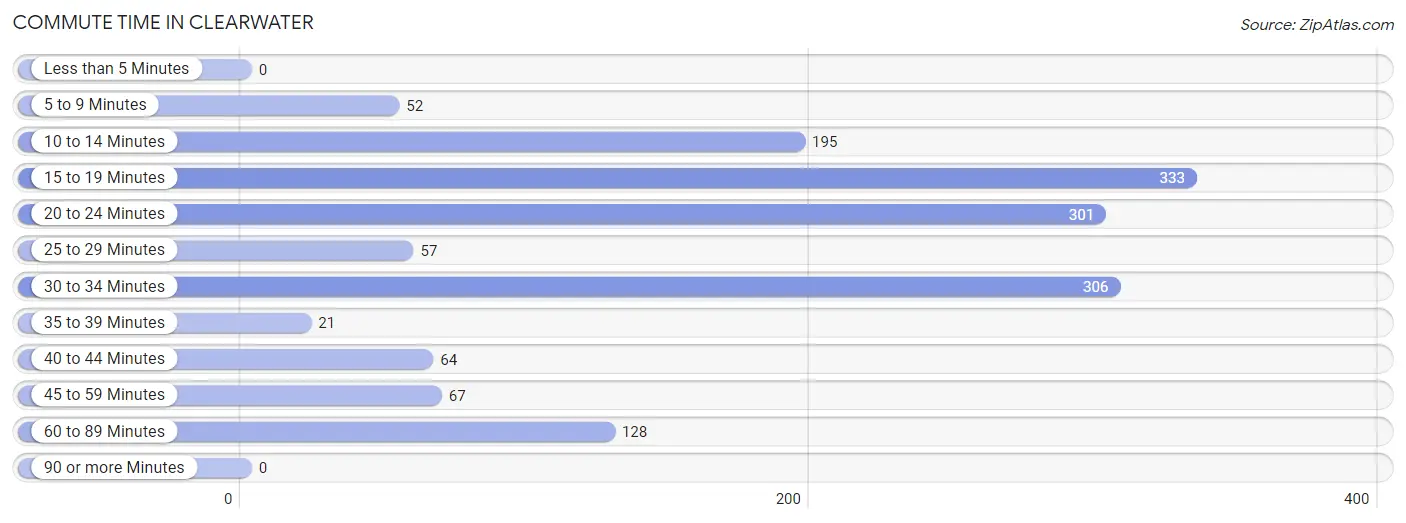
| Commute Time | # Commuters | % Commuters |
| Less than 5 Minutes | 0 | 0.0% |
| 5 to 9 Minutes | 52 | 3.4% |
| 10 to 14 Minutes | 195 | 12.8% |
| 15 to 19 Minutes | 333 | 21.8% |
| 20 to 24 Minutes | 301 | 19.8% |
| 25 to 29 Minutes | 57 | 3.7% |
| 30 to 34 Minutes | 306 | 20.1% |
| 35 to 39 Minutes | 21 | 1.4% |
| 40 to 44 Minutes | 64 | 4.2% |
| 45 to 59 Minutes | 67 | 4.4% |
| 60 to 89 Minutes | 128 | 8.4% |
| 90 or more Minutes | 0 | 0.0% |
Commute Time by Sex in Clearwater
The most common commute times in Clearwater are 20 to 24 minutes (178 commuters, 23.6%) for males and 15 to 19 minutes (282 commuters, 36.6%) for females.
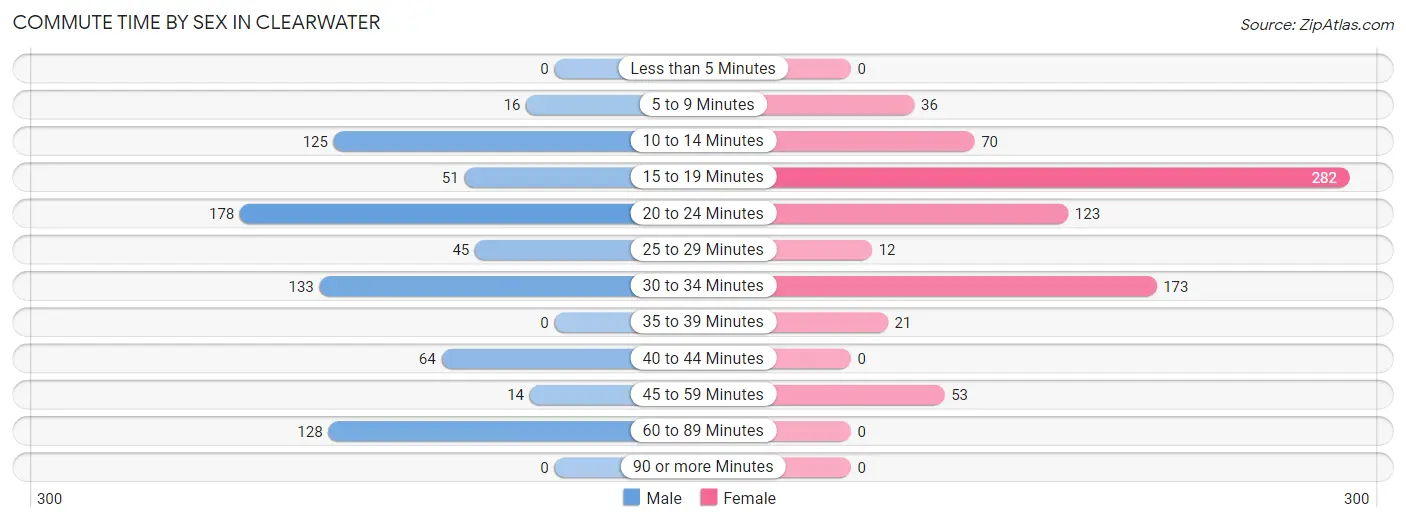
| Commute Time | Male | Female |
| Less than 5 Minutes | 0 (0.0%) | 0 (0.0%) |
| 5 to 9 Minutes | 16 (2.1%) | 36 (4.7%) |
| 10 to 14 Minutes | 125 (16.6%) | 70 (9.1%) |
| 15 to 19 Minutes | 51 (6.8%) | 282 (36.6%) |
| 20 to 24 Minutes | 178 (23.6%) | 123 (16.0%) |
| 25 to 29 Minutes | 45 (6.0%) | 12 (1.6%) |
| 30 to 34 Minutes | 133 (17.6%) | 173 (22.5%) |
| 35 to 39 Minutes | 0 (0.0%) | 21 (2.7%) |
| 40 to 44 Minutes | 64 (8.5%) | 0 (0.0%) |
| 45 to 59 Minutes | 14 (1.9%) | 53 (6.9%) |
| 60 to 89 Minutes | 128 (17.0%) | 0 (0.0%) |
| 90 or more Minutes | 0 (0.0%) | 0 (0.0%) |
Time of Departure to Work by Sex in Clearwater
The most frequent times of departure to work in Clearwater are 6:00 AM to 6:29 AM (246, 32.6%) for males and 7:30 AM to 7:59 AM (178, 23.1%) for females.
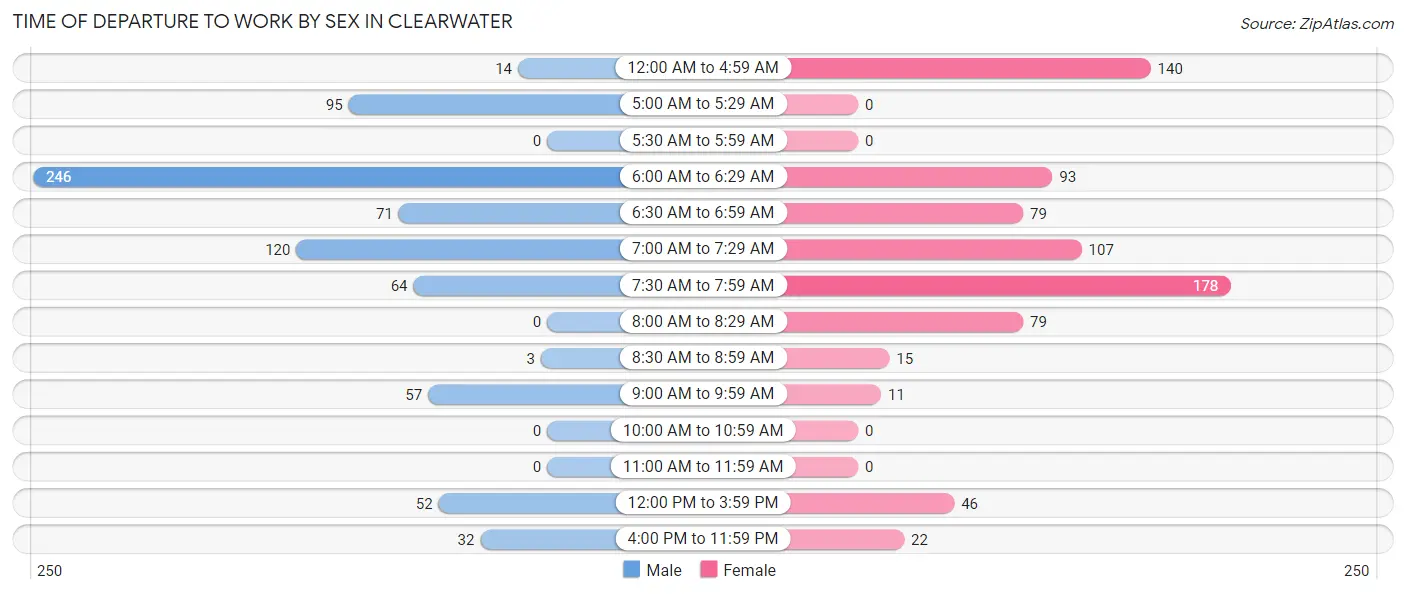
| Time of Departure | Male | Female |
| 12:00 AM to 4:59 AM | 14 (1.9%) | 140 (18.2%) |
| 5:00 AM to 5:29 AM | 95 (12.6%) | 0 (0.0%) |
| 5:30 AM to 5:59 AM | 0 (0.0%) | 0 (0.0%) |
| 6:00 AM to 6:29 AM | 246 (32.6%) | 93 (12.1%) |
| 6:30 AM to 6:59 AM | 71 (9.4%) | 79 (10.3%) |
| 7:00 AM to 7:29 AM | 120 (15.9%) | 107 (13.9%) |
| 7:30 AM to 7:59 AM | 64 (8.5%) | 178 (23.1%) |
| 8:00 AM to 8:29 AM | 0 (0.0%) | 79 (10.3%) |
| 8:30 AM to 8:59 AM | 3 (0.4%) | 15 (1.9%) |
| 9:00 AM to 9:59 AM | 57 (7.6%) | 11 (1.4%) |
| 10:00 AM to 10:59 AM | 0 (0.0%) | 0 (0.0%) |
| 11:00 AM to 11:59 AM | 0 (0.0%) | 0 (0.0%) |
| 12:00 PM to 3:59 PM | 52 (6.9%) | 46 (6.0%) |
| 4:00 PM to 11:59 PM | 32 (4.2%) | 22 (2.9%) |
| Total | 754 (100.0%) | 770 (100.0%) |
Housing Occupancy in Clearwater
Occupancy by Ownership in Clearwater
Of the total 1,395 dwellings in Clearwater, owner-occupied units account for 806 (57.8%), while renter-occupied units make up 589 (42.2%).
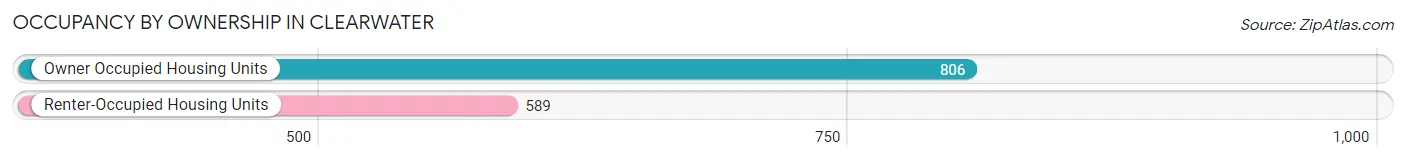
| Occupancy | # Housing Units | % Housing Units |
| Owner Occupied Housing Units | 806 | 57.8% |
| Renter-Occupied Housing Units | 589 | 42.2% |
| Total Occupied Housing Units | 1,395 | 100.0% |
Occupancy by Household Size in Clearwater
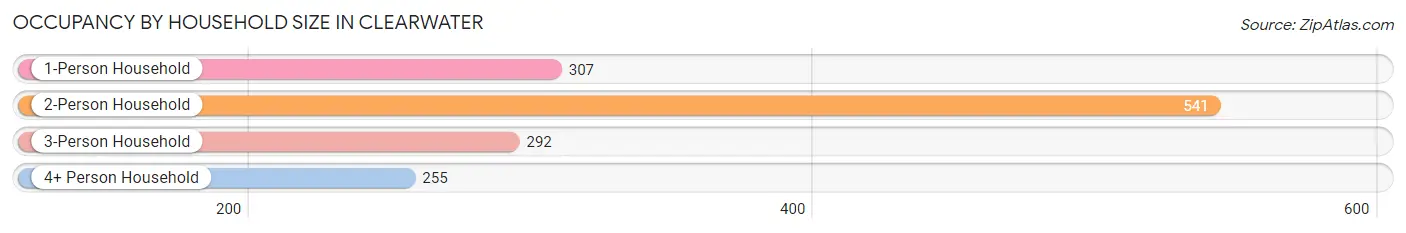
| Household Size | # Housing Units | % Housing Units |
| 1-Person Household | 307 | 22.0% |
| 2-Person Household | 541 | 38.8% |
| 3-Person Household | 292 | 20.9% |
| 4+ Person Household | 255 | 18.3% |
| Total Housing Units | 1,395 | 100.0% |
Occupancy by Ownership by Household Size in Clearwater
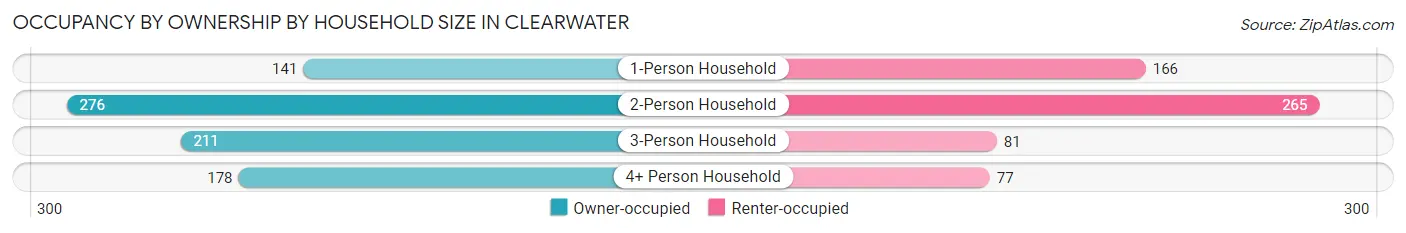
| Household Size | Owner-occupied | Renter-occupied |
| 1-Person Household | 141 (45.9%) | 166 (54.1%) |
| 2-Person Household | 276 (51.0%) | 265 (49.0%) |
| 3-Person Household | 211 (72.3%) | 81 (27.7%) |
| 4+ Person Household | 178 (69.8%) | 77 (30.2%) |
| Total Housing Units | 806 (57.8%) | 589 (42.2%) |
Occupancy by Educational Attainment in Clearwater
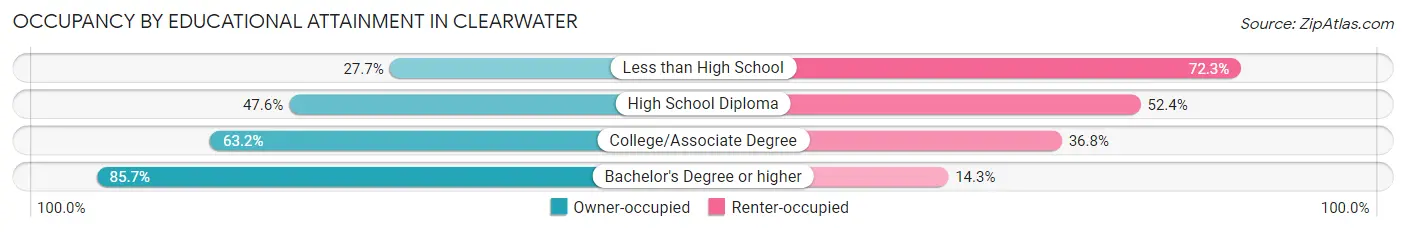
| Household Size | Owner-occupied | Renter-occupied |
| Less than High School | 13 (27.7%) | 34 (72.3%) |
| High School Diploma | 295 (47.6%) | 325 (52.4%) |
| College/Associate Degree | 354 (63.2%) | 206 (36.8%) |
| Bachelor's Degree or higher | 144 (85.7%) | 24 (14.3%) |
Occupancy by Age of Householder in Clearwater
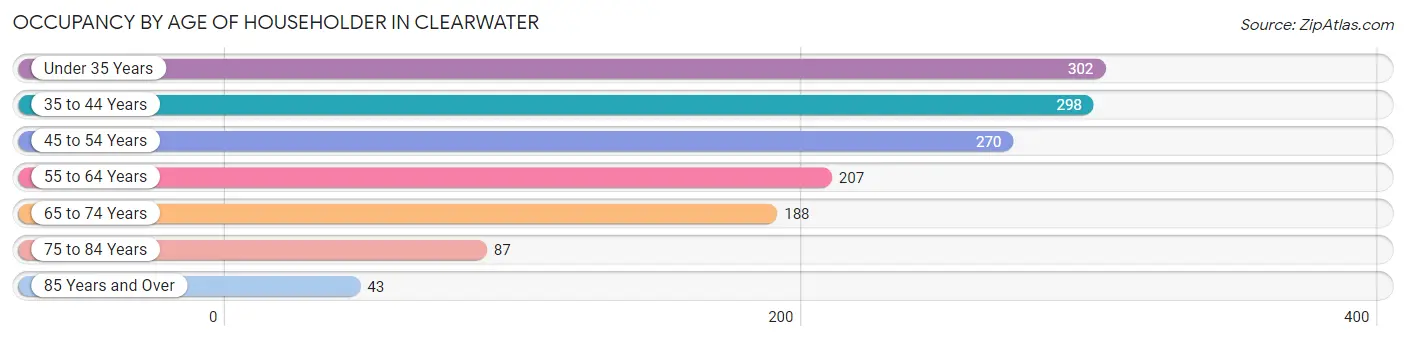
| Age Bracket | # Households | % Households |
| Under 35 Years | 302 | 21.6% |
| 35 to 44 Years | 298 | 21.4% |
| 45 to 54 Years | 270 | 19.4% |
| 55 to 64 Years | 207 | 14.8% |
| 65 to 74 Years | 188 | 13.5% |
| 75 to 84 Years | 87 | 6.2% |
| 85 Years and Over | 43 | 3.1% |
| Total | 1,395 | 100.0% |
Housing Finances in Clearwater
Median Income by Occupancy in Clearwater
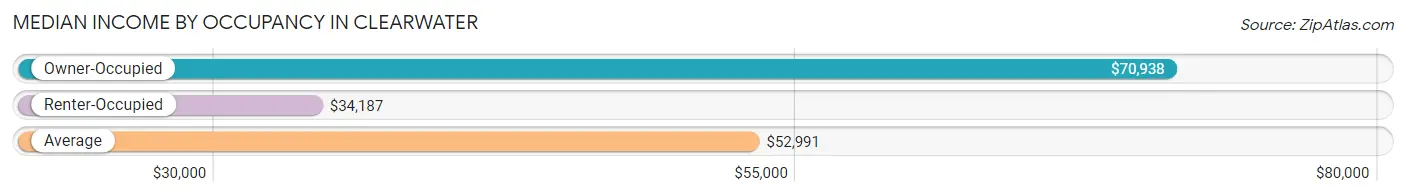
| Occupancy Type | # Households | Median Income |
| Owner-Occupied | 806 (57.8%) | $70,938 |
| Renter-Occupied | 589 (42.2%) | $34,187 |
| Average | 1,395 (100.0%) | $52,991 |
Occupancy by Householder Income Bracket in Clearwater
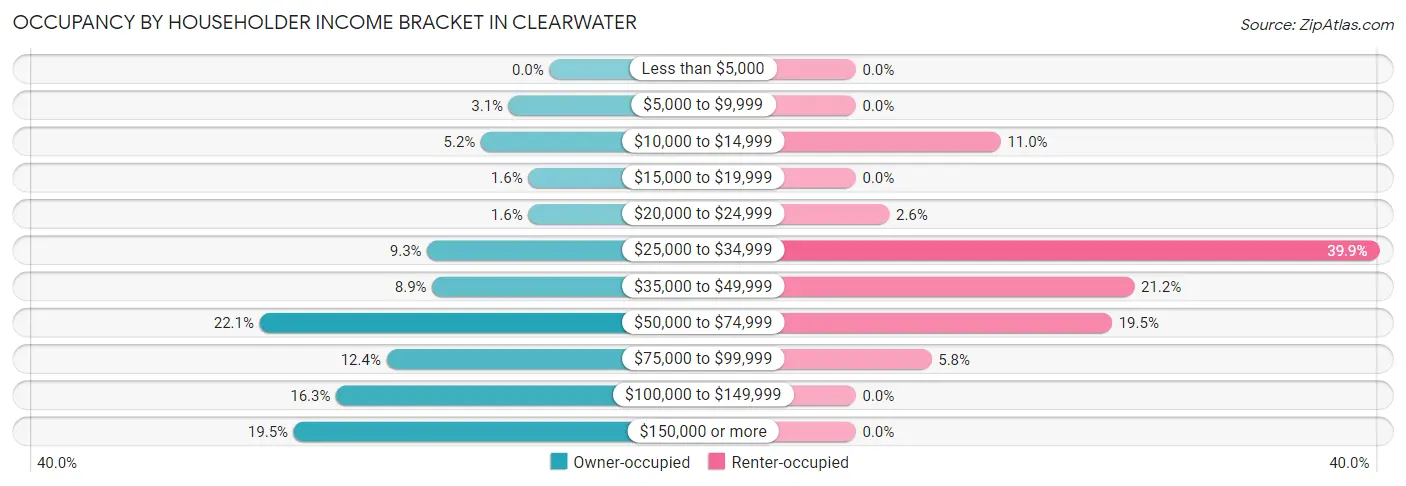
| Income Bracket | Owner-occupied | Renter-occupied |
| Less than $5,000 | 0 (0.0%) | 0 (0.0%) |
| $5,000 to $9,999 | 25 (3.1%) | 0 (0.0%) |
| $10,000 to $14,999 | 42 (5.2%) | 65 (11.0%) |
| $15,000 to $19,999 | 13 (1.6%) | 0 (0.0%) |
| $20,000 to $24,999 | 13 (1.6%) | 15 (2.5%) |
| $25,000 to $34,999 | 75 (9.3%) | 235 (39.9%) |
| $35,000 to $49,999 | 72 (8.9%) | 125 (21.2%) |
| $50,000 to $74,999 | 178 (22.1%) | 115 (19.5%) |
| $75,000 to $99,999 | 100 (12.4%) | 34 (5.8%) |
| $100,000 to $149,999 | 131 (16.3%) | 0 (0.0%) |
| $150,000 or more | 157 (19.5%) | 0 (0.0%) |
| Total | 806 (100.0%) | 589 (100.0%) |
Monthly Housing Cost Tiers in Clearwater
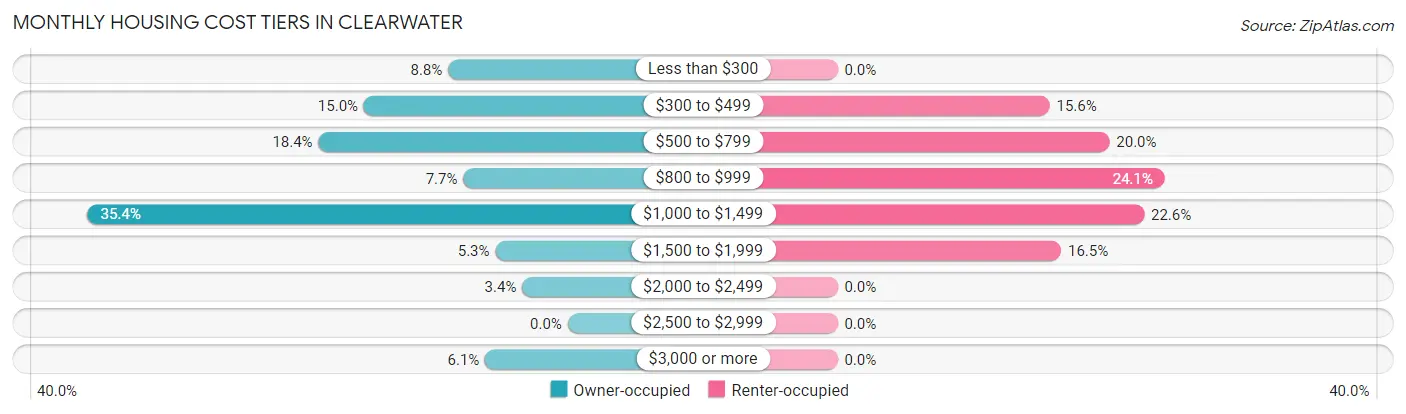
| Monthly Cost | Owner-occupied | Renter-occupied |
| Less than $300 | 71 (8.8%) | 0 (0.0%) |
| $300 to $499 | 121 (15.0%) | 92 (15.6%) |
| $500 to $799 | 148 (18.4%) | 118 (20.0%) |
| $800 to $999 | 62 (7.7%) | 142 (24.1%) |
| $1,000 to $1,499 | 285 (35.4%) | 133 (22.6%) |
| $1,500 to $1,999 | 43 (5.3%) | 97 (16.5%) |
| $2,000 to $2,499 | 27 (3.4%) | 0 (0.0%) |
| $2,500 to $2,999 | 0 (0.0%) | 0 (0.0%) |
| $3,000 or more | 49 (6.1%) | 0 (0.0%) |
| Total | 806 (100.0%) | 589 (100.0%) |
Physical Housing Characteristics in Clearwater
Housing Structures in Clearwater
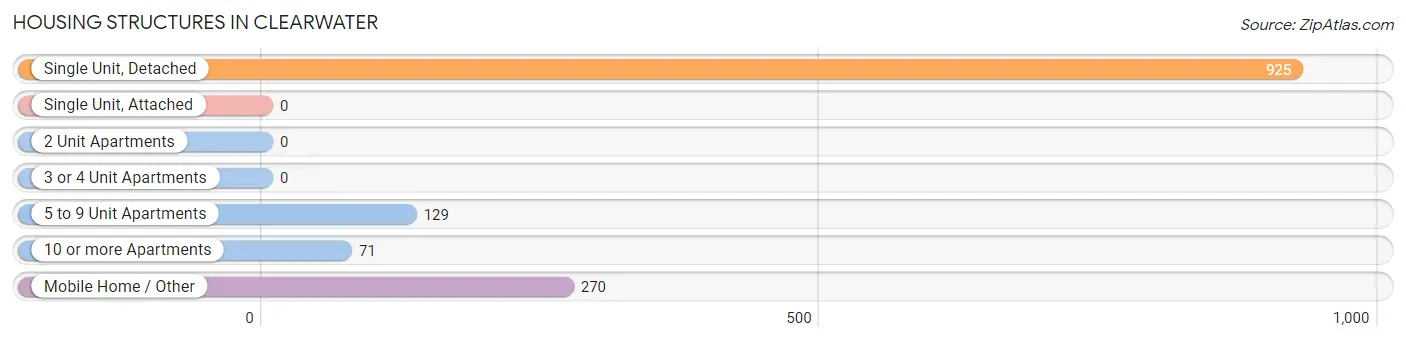
| Structure Type | # Housing Units | % Housing Units |
| Single Unit, Detached | 925 | 66.3% |
| Single Unit, Attached | 0 | 0.0% |
| 2 Unit Apartments | 0 | 0.0% |
| 3 or 4 Unit Apartments | 0 | 0.0% |
| 5 to 9 Unit Apartments | 129 | 9.2% |
| 10 or more Apartments | 71 | 5.1% |
| Mobile Home / Other | 270 | 19.4% |
| Total | 1,395 | 100.0% |
Housing Structures by Occupancy in Clearwater
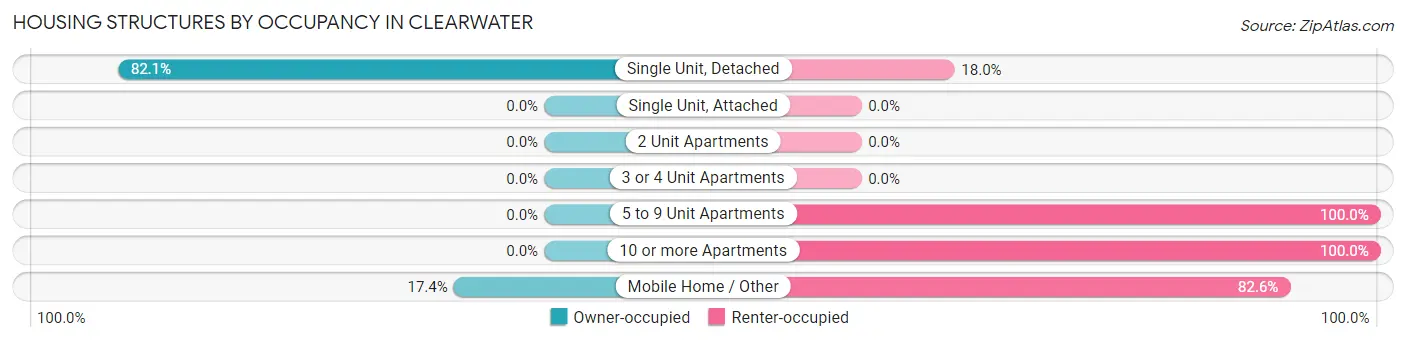
| Structure Type | Owner-occupied | Renter-occupied |
| Single Unit, Detached | 759 (82.1%) | 166 (17.9%) |
| Single Unit, Attached | 0 (0.0%) | 0 (0.0%) |
| 2 Unit Apartments | 0 (0.0%) | 0 (0.0%) |
| 3 or 4 Unit Apartments | 0 (0.0%) | 0 (0.0%) |
| 5 to 9 Unit Apartments | 0 (0.0%) | 129 (100.0%) |
| 10 or more Apartments | 0 (0.0%) | 71 (100.0%) |
| Mobile Home / Other | 47 (17.4%) | 223 (82.6%) |
| Total | 806 (57.8%) | 589 (42.2%) |
Housing Structures by Number of Rooms in Clearwater
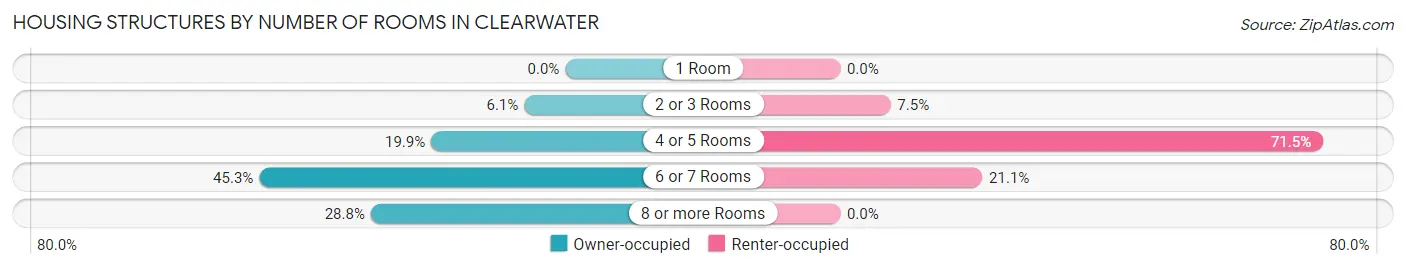
| Number of Rooms | Owner-occupied | Renter-occupied |
| 1 Room | 0 (0.0%) | 0 (0.0%) |
| 2 or 3 Rooms | 49 (6.1%) | 44 (7.5%) |
| 4 or 5 Rooms | 160 (19.9%) | 421 (71.5%) |
| 6 or 7 Rooms | 365 (45.3%) | 124 (21.0%) |
| 8 or more Rooms | 232 (28.8%) | 0 (0.0%) |
| Total | 806 (100.0%) | 589 (100.0%) |
Housing Structure by Heating Type in Clearwater
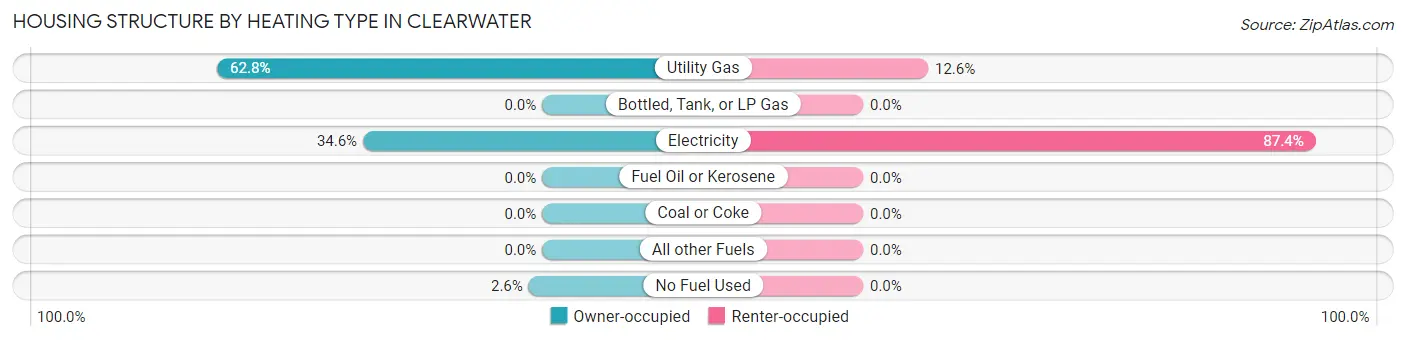
| Heating Type | Owner-occupied | Renter-occupied |
| Utility Gas | 506 (62.8%) | 74 (12.6%) |
| Bottled, Tank, or LP Gas | 0 (0.0%) | 0 (0.0%) |
| Electricity | 279 (34.6%) | 515 (87.4%) |
| Fuel Oil or Kerosene | 0 (0.0%) | 0 (0.0%) |
| Coal or Coke | 0 (0.0%) | 0 (0.0%) |
| All other Fuels | 0 (0.0%) | 0 (0.0%) |
| No Fuel Used | 21 (2.6%) | 0 (0.0%) |
| Total | 806 (100.0%) | 589 (100.0%) |
Household Vehicle Usage in Clearwater
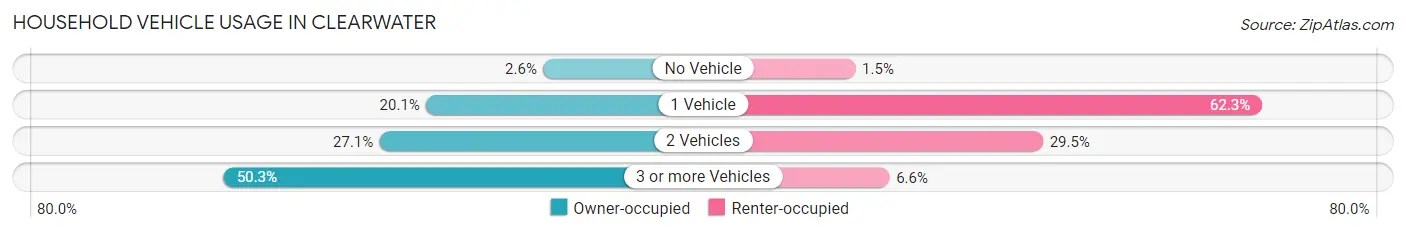
| Vehicles per Household | Owner-occupied | Renter-occupied |
| No Vehicle | 21 (2.6%) | 9 (1.5%) |
| 1 Vehicle | 162 (20.1%) | 367 (62.3%) |
| 2 Vehicles | 218 (27.1%) | 174 (29.5%) |
| 3 or more Vehicles | 405 (50.2%) | 39 (6.6%) |
| Total | 806 (100.0%) | 589 (100.0%) |
Real Estate & Mortgages in Clearwater
Real Estate and Mortgage Overview in Clearwater
| Characteristic | Without Mortgage | With Mortgage |
| Housing Units | 241 | 565 |
| Median Property Value | $171,000 | $152,200 |
| Median Household Income | $55,134 | $114 |
| Monthly Housing Costs | $403 | $49 |
| Real Estate Taxes | $581 | $0 |
Property Value by Mortgage Status in Clearwater
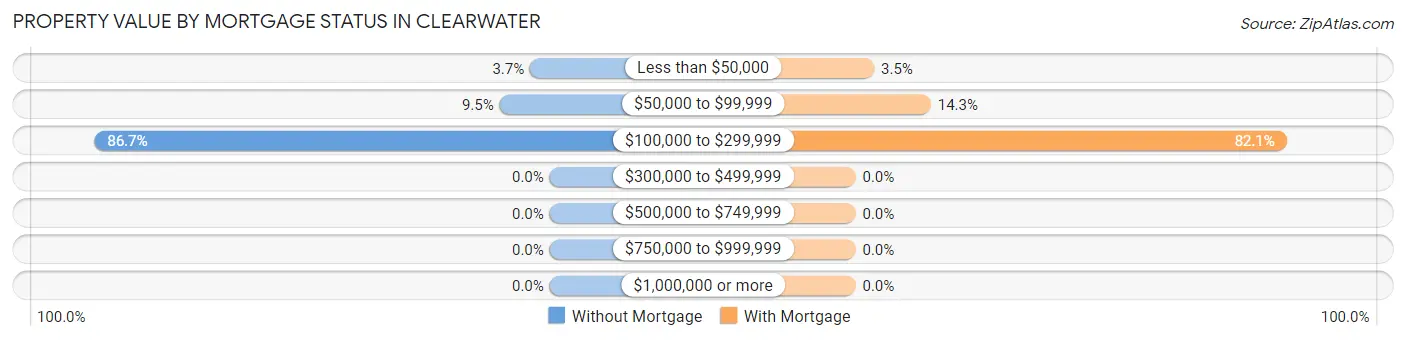
| Property Value | Without Mortgage | With Mortgage |
| Less than $50,000 | 9 (3.7%) | 20 (3.5%) |
| $50,000 to $99,999 | 23 (9.5%) | 81 (14.3%) |
| $100,000 to $299,999 | 209 (86.7%) | 464 (82.1%) |
| $300,000 to $499,999 | 0 (0.0%) | 0 (0.0%) |
| $500,000 to $749,999 | 0 (0.0%) | 0 (0.0%) |
| $750,000 to $999,999 | 0 (0.0%) | 0 (0.0%) |
| $1,000,000 or more | 0 (0.0%) | 0 (0.0%) |
| Total | 241 (100.0%) | 565 (100.0%) |
Household Income by Mortgage Status in Clearwater
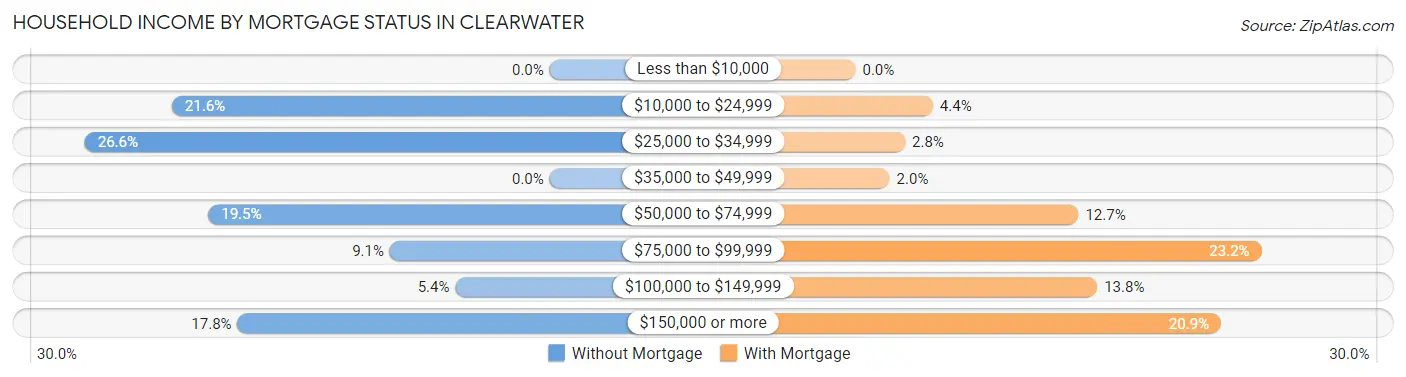
| Household Income | Without Mortgage | With Mortgage |
| Less than $10,000 | 0 (0.0%) | 0 (0.0%) |
| $10,000 to $24,999 | 52 (21.6%) | 25 (4.4%) |
| $25,000 to $34,999 | 64 (26.6%) | 16 (2.8%) |
| $35,000 to $49,999 | 0 (0.0%) | 11 (1.9%) |
| $50,000 to $74,999 | 47 (19.5%) | 72 (12.7%) |
| $75,000 to $99,999 | 22 (9.1%) | 131 (23.2%) |
| $100,000 to $149,999 | 13 (5.4%) | 78 (13.8%) |
| $150,000 or more | 43 (17.8%) | 118 (20.9%) |
| Total | 241 (100.0%) | 565 (100.0%) |
Property Value to Household Income Ratio in Clearwater
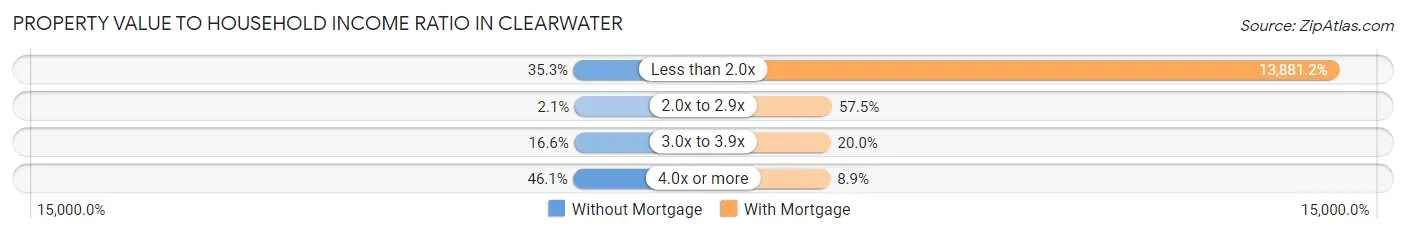
| Value-to-Income Ratio | Without Mortgage | With Mortgage |
| Less than 2.0x | 85 (35.3%) | 78,429 (13,881.2%) |
| 2.0x to 2.9x | 5 (2.1%) | 325 (57.5%) |
| 3.0x to 3.9x | 40 (16.6%) | 113 (20.0%) |
| 4.0x or more | 111 (46.1%) | 50 (8.8%) |
| Total | 241 (100.0%) | 565 (100.0%) |
Real Estate Taxes by Mortgage Status in Clearwater
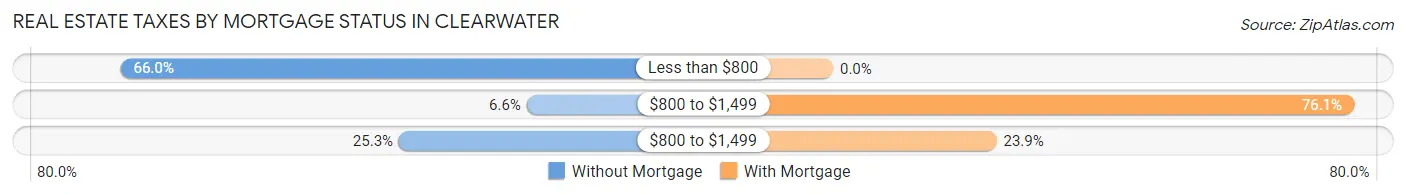
| Property Taxes | Without Mortgage | With Mortgage |
| Less than $800 | 159 (66.0%) | 0 (0.0%) |
| $800 to $1,499 | 16 (6.6%) | 430 (76.1%) |
| $800 to $1,499 | 61 (25.3%) | 135 (23.9%) |
| Total | 241 (100.0%) | 565 (100.0%) |
Health & Disability in Clearwater
Health Insurance Coverage by Age in Clearwater
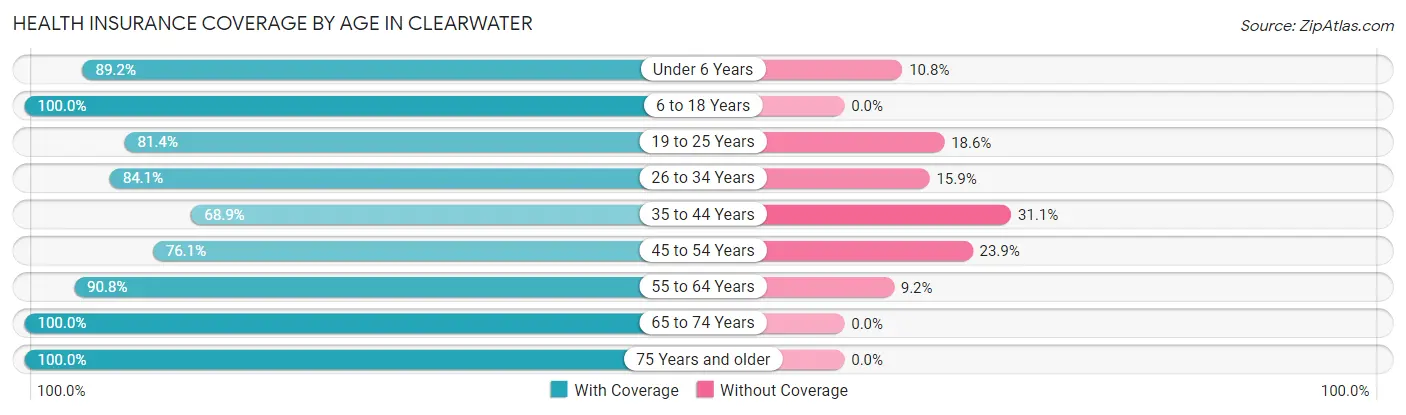
| Age Bracket | With Coverage | Without Coverage |
| Under 6 Years | 132 (89.2%) | 16 (10.8%) |
| 6 to 18 Years | 630 (100.0%) | 0 (0.0%) |
| 19 to 25 Years | 393 (81.4%) | 90 (18.6%) |
| 26 to 34 Years | 217 (84.1%) | 41 (15.9%) |
| 35 to 44 Years | 310 (68.9%) | 140 (31.1%) |
| 45 to 54 Years | 401 (76.1%) | 126 (23.9%) |
| 55 to 64 Years | 403 (90.8%) | 41 (9.2%) |
| 65 to 74 Years | 303 (100.0%) | 0 (0.0%) |
| 75 Years and older | 158 (100.0%) | 0 (0.0%) |
| Total | 2,947 (86.7%) | 454 (13.4%) |
Health Insurance Coverage by Citizenship Status in Clearwater
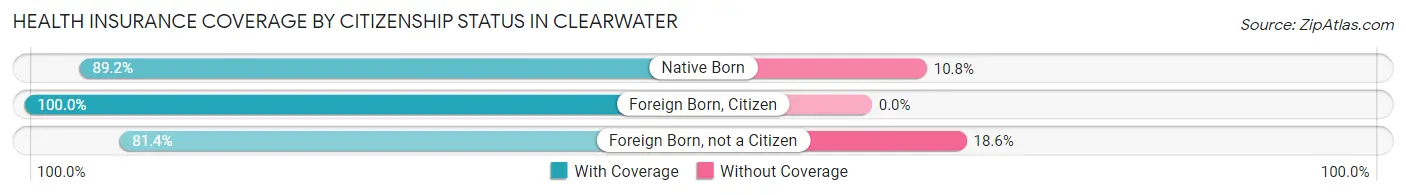
| Citizenship Status | With Coverage | Without Coverage |
| Native Born | 132 (89.2%) | 16 (10.8%) |
| Foreign Born, Citizen | 630 (100.0%) | 0 (0.0%) |
| Foreign Born, not a Citizen | 393 (81.4%) | 90 (18.6%) |
Health Insurance Coverage by Household Income in Clearwater
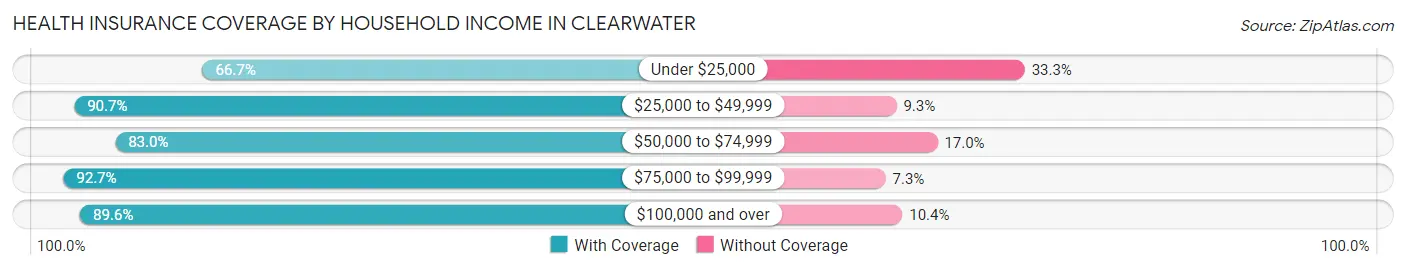
| Household Income | With Coverage | Without Coverage |
| Under $25,000 | 198 (66.7%) | 99 (33.3%) |
| $25,000 to $49,999 | 995 (90.7%) | 102 (9.3%) |
| $50,000 to $74,999 | 660 (83.0%) | 135 (17.0%) |
| $75,000 to $99,999 | 204 (92.7%) | 16 (7.3%) |
| $100,000 and over | 879 (89.6%) | 102 (10.4%) |
Public vs Private Health Insurance Coverage by Age in Clearwater
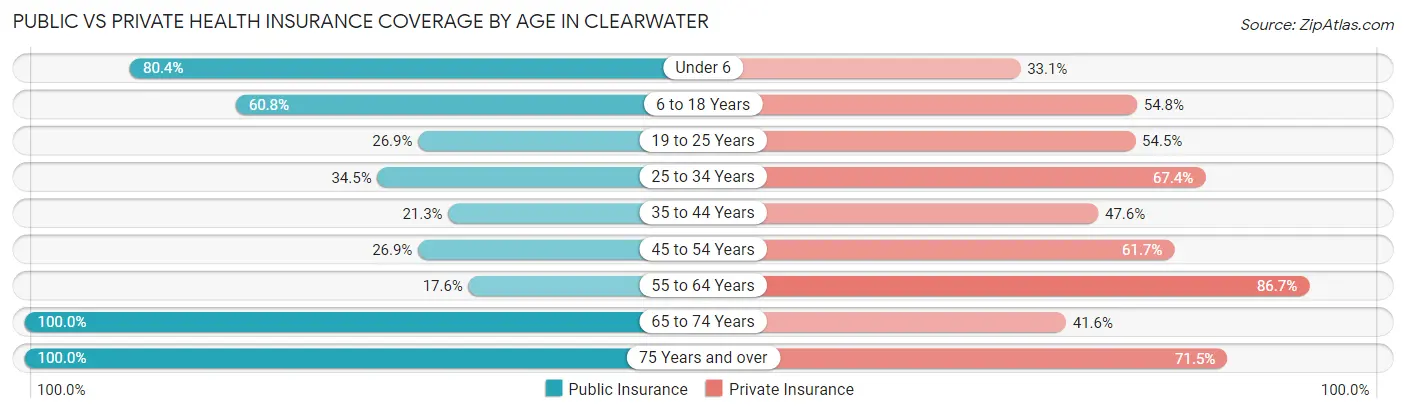
| Age Bracket | Public Insurance | Private Insurance |
| Under 6 | 119 (80.4%) | 49 (33.1%) |
| 6 to 18 Years | 383 (60.8%) | 345 (54.8%) |
| 19 to 25 Years | 130 (26.9%) | 263 (54.4%) |
| 25 to 34 Years | 89 (34.5%) | 174 (67.4%) |
| 35 to 44 Years | 96 (21.3%) | 214 (47.6%) |
| 45 to 54 Years | 142 (26.9%) | 325 (61.7%) |
| 55 to 64 Years | 78 (17.6%) | 385 (86.7%) |
| 65 to 74 Years | 303 (100.0%) | 126 (41.6%) |
| 75 Years and over | 158 (100.0%) | 113 (71.5%) |
| Total | 1,498 (44.1%) | 1,994 (58.6%) |
Disability Status by Sex by Age in Clearwater
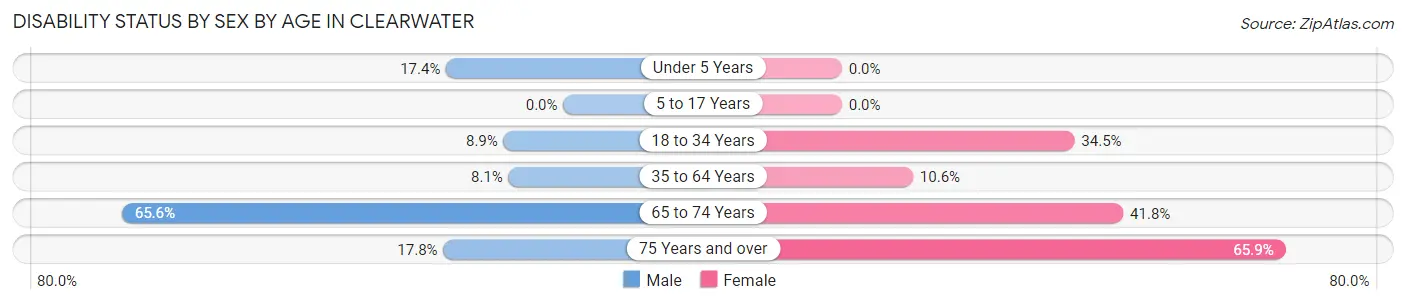
| Age Bracket | Male | Female |
| Under 5 Years | 16 (17.4%) | 0 (0.0%) |
| 5 to 17 Years | 0 (0.0%) | 0 (0.0%) |
| 18 to 34 Years | 29 (8.9%) | 162 (34.5%) |
| 35 to 64 Years | 60 (8.1%) | 72 (10.6%) |
| 65 to 74 Years | 59 (65.6%) | 89 (41.8%) |
| 75 Years and over | 13 (17.8%) | 56 (65.9%) |
Disability Class by Sex by Age in Clearwater
Disability Class: Hearing Difficulty
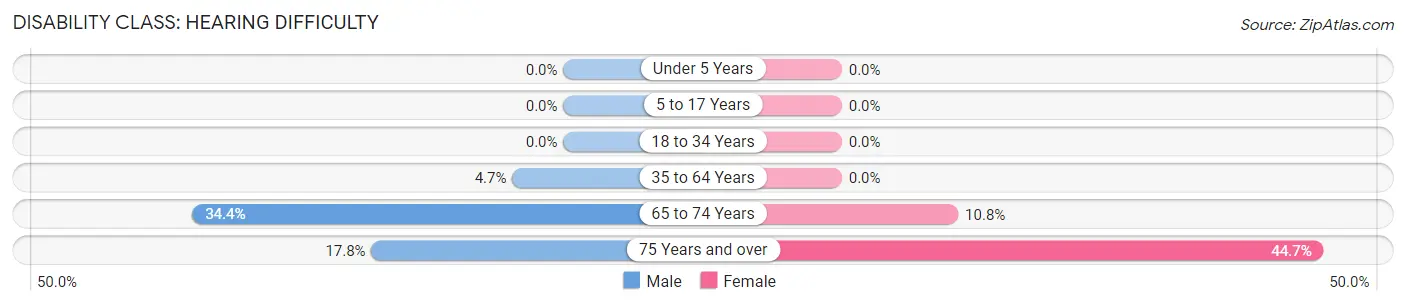
| Age Bracket | Male | Female |
| Under 5 Years | 0 (0.0%) | 0 (0.0%) |
| 5 to 17 Years | 0 (0.0%) | 0 (0.0%) |
| 18 to 34 Years | 0 (0.0%) | 0 (0.0%) |
| 35 to 64 Years | 35 (4.7%) | 0 (0.0%) |
| 65 to 74 Years | 31 (34.4%) | 23 (10.8%) |
| 75 Years and over | 13 (17.8%) | 38 (44.7%) |
Disability Class: Vision Difficulty
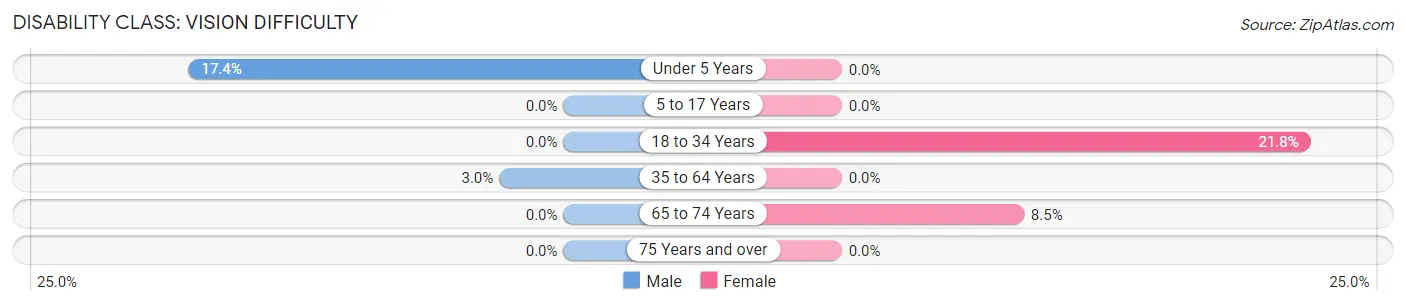
| Age Bracket | Male | Female |
| Under 5 Years | 16 (17.4%) | 0 (0.0%) |
| 5 to 17 Years | 0 (0.0%) | 0 (0.0%) |
| 18 to 34 Years | 0 (0.0%) | 102 (21.7%) |
| 35 to 64 Years | 22 (3.0%) | 0 (0.0%) |
| 65 to 74 Years | 0 (0.0%) | 18 (8.5%) |
| 75 Years and over | 0 (0.0%) | 0 (0.0%) |
Disability Class: Cognitive Difficulty
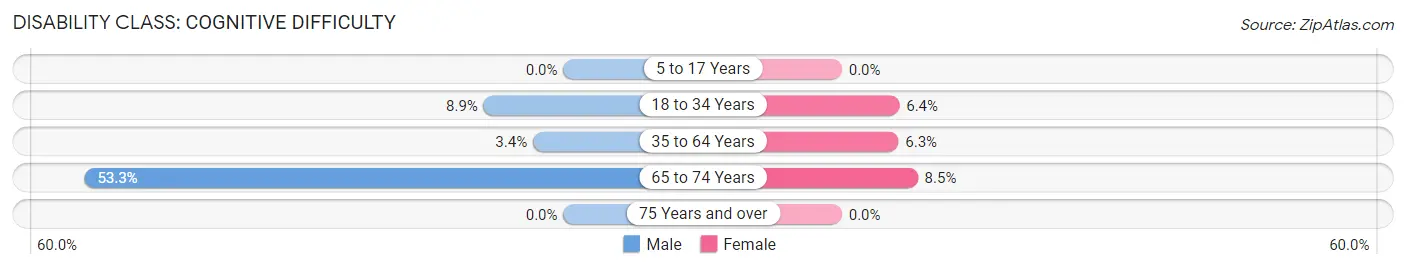
| Age Bracket | Male | Female |
| 5 to 17 Years | 0 (0.0%) | 0 (0.0%) |
| 18 to 34 Years | 29 (8.9%) | 30 (6.4%) |
| 35 to 64 Years | 25 (3.4%) | 43 (6.3%) |
| 65 to 74 Years | 48 (53.3%) | 18 (8.5%) |
| 75 Years and over | 0 (0.0%) | 0 (0.0%) |
Disability Class: Ambulatory Difficulty
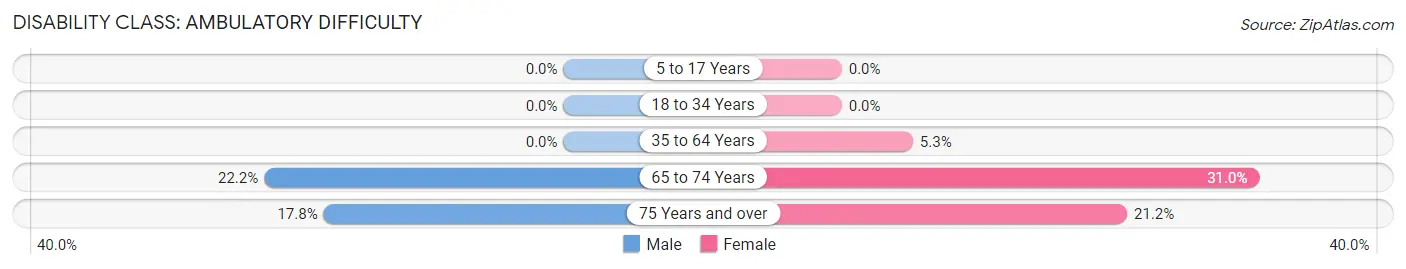
| Age Bracket | Male | Female |
| 5 to 17 Years | 0 (0.0%) | 0 (0.0%) |
| 18 to 34 Years | 0 (0.0%) | 0 (0.0%) |
| 35 to 64 Years | 0 (0.0%) | 36 (5.3%) |
| 65 to 74 Years | 20 (22.2%) | 66 (31.0%) |
| 75 Years and over | 13 (17.8%) | 18 (21.2%) |
Disability Class: Self-Care Difficulty
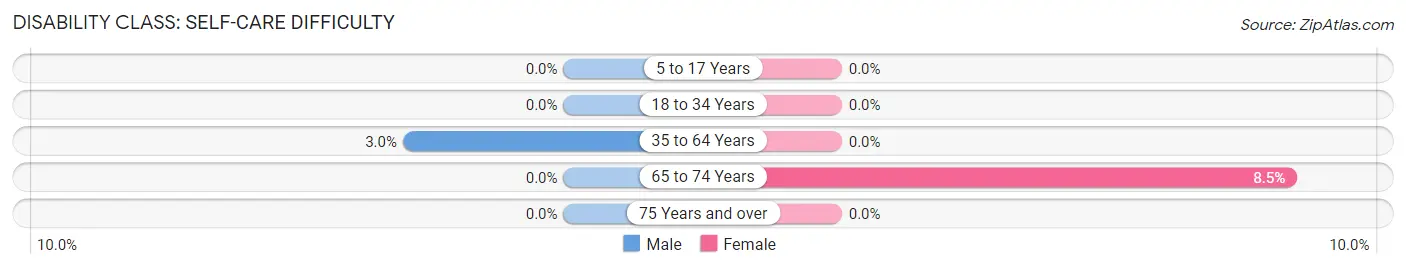
| Age Bracket | Male | Female |
| 5 to 17 Years | 0 (0.0%) | 0 (0.0%) |
| 18 to 34 Years | 0 (0.0%) | 0 (0.0%) |
| 35 to 64 Years | 22 (3.0%) | 0 (0.0%) |
| 65 to 74 Years | 0 (0.0%) | 18 (8.5%) |
| 75 Years and over | 0 (0.0%) | 0 (0.0%) |
Technology Access in Clearwater
Computing Device Access in Clearwater
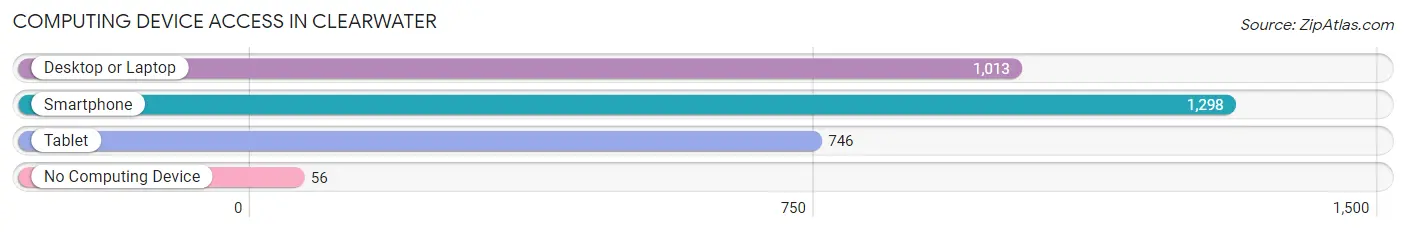
| Device Type | # Households | % Households |
| Desktop or Laptop | 1,013 | 72.6% |
| Smartphone | 1,298 | 93.0% |
| Tablet | 746 | 53.5% |
| No Computing Device | 56 | 4.0% |
| Total | 1,395 | 100.0% |
Internet Access in Clearwater
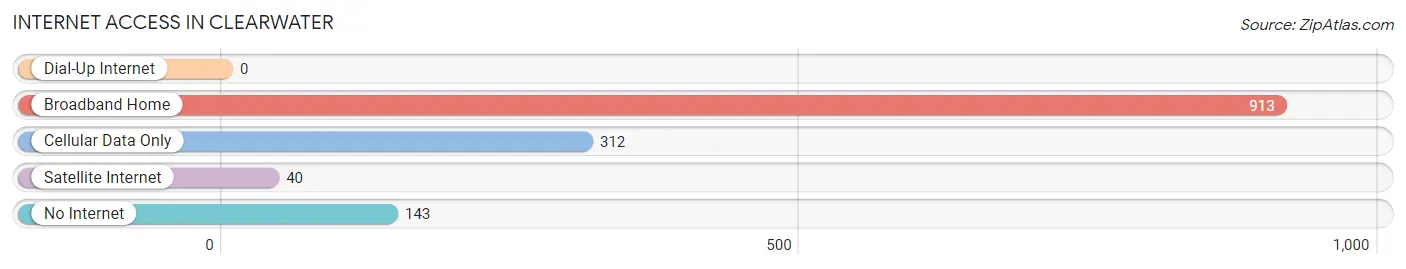
| Internet Type | # Households | % Households |
| Dial-Up Internet | 0 | 0.0% |
| Broadband Home | 913 | 65.4% |
| Cellular Data Only | 312 | 22.4% |
| Satellite Internet | 40 | 2.9% |
| No Internet | 143 | 10.2% |
| Total | 1,395 | 100.0% |
Clearwater Summary
Clearwater is a small town located in the state of South Carolina, United States. It is situated in the northern part of the state, in the Piedmont region, and is part of the greater Columbia metropolitan area. The town has a population of approximately 1,500 people, and is located in Richland County.
History
Clearwater was founded in 1883 by a group of settlers from the nearby town of Columbia. The town was named after the nearby Clearwater Creek, which was named for its crystal-clear waters. The town was originally a farming community, and the main crops grown were cotton, corn, and tobacco. The town was also home to a number of small businesses, including a general store, a blacksmith shop, and a sawmill.
In the early 1900s, the town began to grow and develop. The first school was built in 1910, and the first post office was established in 1911. The town also had a number of churches, including the Clearwater Baptist Church, which was founded in 1912.
In the 1920s, the town began to experience a period of growth and prosperity. The population increased from around 500 in 1920 to over 1,000 by 1930. During this time, the town was home to a number of businesses, including a bank, a movie theater, and a number of stores.
Geography
Clearwater is located in the northern part of South Carolina, in the Piedmont region. The town is situated in Richland County, and is part of the greater Columbia metropolitan area. The town is located on the banks of the Congaree River, and is surrounded by rolling hills and forests. The town is located approximately 20 miles from the city of Columbia.
The climate in Clearwater is humid subtropical, with hot, humid summers and mild winters. The average annual temperature is around 70 degrees Fahrenheit, and the average annual precipitation is around 45 inches.
Economy
The economy of Clearwater is largely based on agriculture. The town is home to a number of farms, which produce a variety of crops, including cotton, corn, and tobacco. The town is also home to a number of small businesses, including a general store, a blacksmith shop, and a sawmill.
Demographics
As of the 2010 census, the population of Clearwater was 1,500. The racial makeup of the town was 79.3% White, 17.3% African American, 0.7% Native American, 0.3% Asian, and 2.3% from other races. The median household income was $35,000, and the median family income was $41,000. The per capita income was $17,000.
Conclusion
Clearwater is a small town located in the northern part of South Carolina, in the Piedmont region. The town has a population of approximately 1,500 people, and is part of the greater Columbia metropolitan area. The town was founded in 1883, and was originally a farming community. The economy of Clearwater is largely based on agriculture, and the town is home to a number of small businesses. The population of Clearwater is predominantly White, with a small African American population. The median household income is $35,000, and the per capita income is $17,000.
Common Questions
What is Per Capita Income in Clearwater?
Per Capita income in Clearwater is $28,445.
What is the Median Family Income in Clearwater?
Median Family Income in Clearwater is $58,023.
What is the Median Household income in Clearwater?
Median Household Income in Clearwater is $52,991.
What is Income or Wage Gap in Clearwater?
Income or Wage Gap in Clearwater is 62.7%.
Women in Clearwater earn 37.3 cents for every dollar earned by a man.
What is Inequality or Gini Index in Clearwater?
Inequality or Gini Index in Clearwater is 0.39.
What is the Total Population of Clearwater?
Total Population of Clearwater is 3,403.
What is the Total Male Population of Clearwater?
Total Male Population of Clearwater is 1,603.
What is the Total Female Population of Clearwater?
Total Female Population of Clearwater is 1,800.
What is the Ratio of Males per 100 Females in Clearwater?
There are 89.06 Males per 100 Females in Clearwater.
What is the Ratio of Females per 100 Males in Clearwater?
There are 112.29 Females per 100 Males in Clearwater.
What is the Median Population Age in Clearwater?
Median Population Age in Clearwater is 41.1 Years.
What is the Average Family Size in Clearwater
Average Family Size in Clearwater is 2.9 People.
What is the Average Household Size in Clearwater
Average Household Size in Clearwater is 2.4 People.
How Large is the Labor Force in Clearwater?
There are 1,919 People in the Labor Forcein in Clearwater.
What is the Percentage of People in the Labor Force in Clearwater?
67.7% of People are in the Labor Force in Clearwater.
What is the Unemployment Rate in Clearwater?
Unemployment Rate in Clearwater is 13.2%.