Paxville, SC Map & Demographics
Paxville Map
Paxville Overview
$26,765
PER CAPITA INCOME
$53,000
AVG HOUSEHOLD INCOME
0.40
INEQUALITY / GINI INDEX
342
TOTAL POPULATION
174
MALE POPULATION
168
FEMALE POPULATION
103.57
MALES / 100 FEMALES
96.55
FEMALES / 100 MALES
45.6
MEDIAN AGE
3.5
AVG FAMILY SIZE
2.5
AVG HOUSEHOLD SIZE
182
LABOR FORCE [ PEOPLE ]
62.5%
PERCENT IN LABOR FORCE
6.6%
UNEMPLOYMENT RATE
Paxville Area Codes
Income in Paxville
Income Overview in Paxville
| Characteristic | Number | Measure |
| Per Capita Income | 342 | $26,765 |
| Median Family Income | 79 | $0 |
| Mean Family Income | 79 | $81,030 |
| Median Household Income | 136 | $53,000 |
| Mean Household Income | 136 | $63,746 |
| Income Deficit | 79 | $0 |
| Wage / Income Gap (%) | 342 | 0.00% |
| Wage / Income Gap ($) | 342 | 100.00¢ per $1 |
| Gini / Inequality Index | 342 | 0.40 |
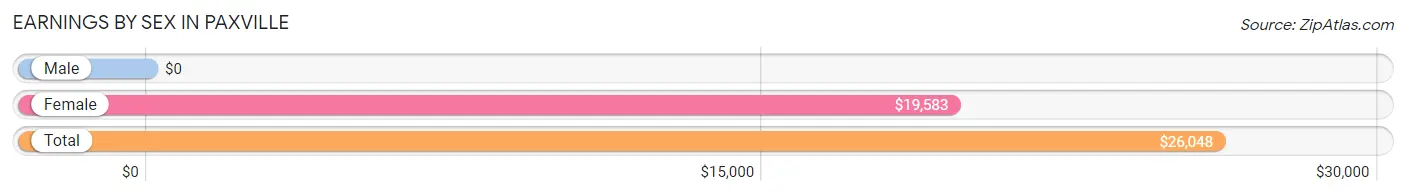
Earnings by Sex in Paxville
| Sex | Number | Average Earnings |
| Male | 93 (51.7%) | $0 |
| Female | 87 (48.3%) | $19,583 |
| Total | 180 (100.0%) | $26,048 |
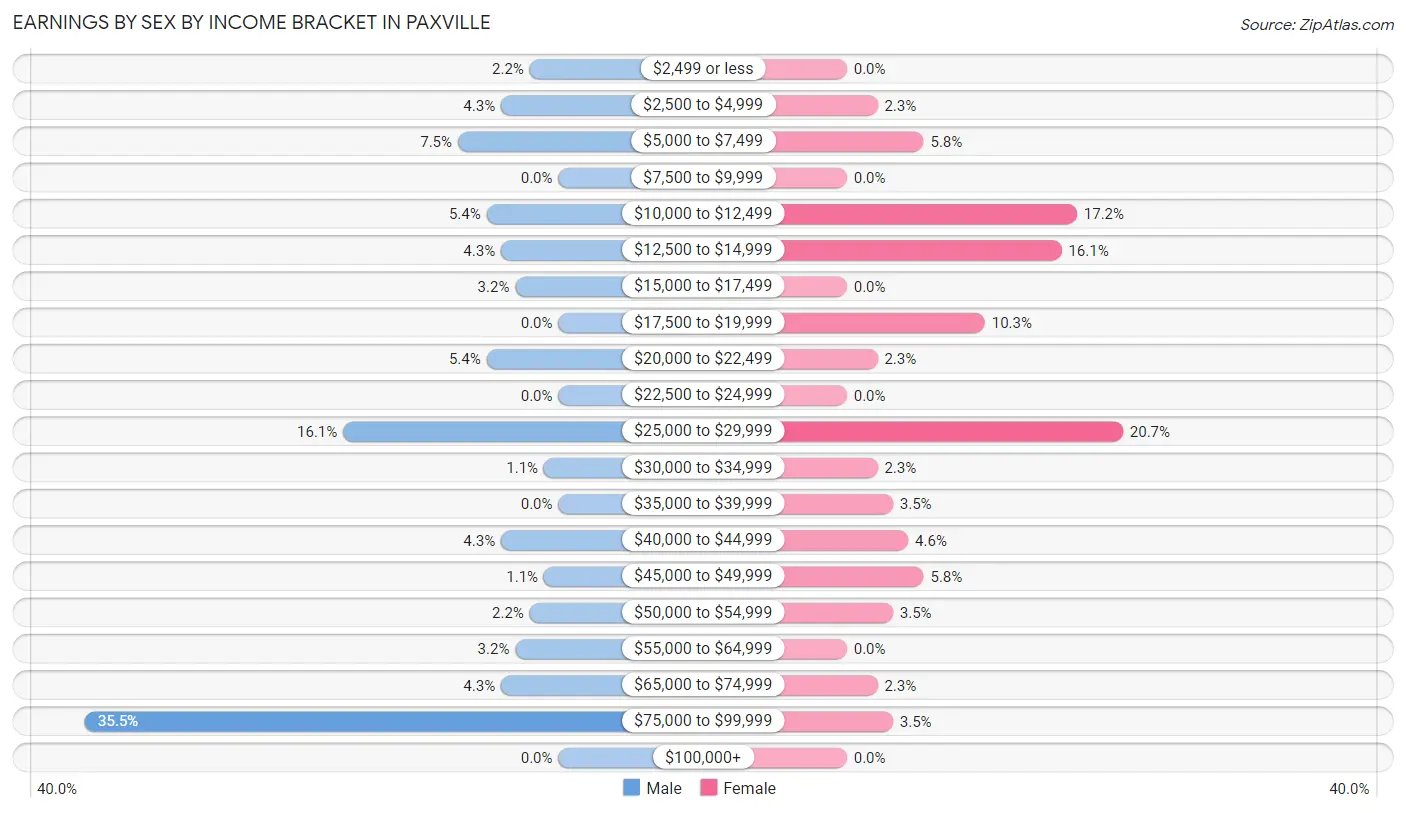
Earnings by Sex by Income Bracket in Paxville
The most common earnings brackets in Paxville are $75,000 to $99,999 for men (33 | 35.5%) and $25,000 to $29,999 for women (18 | 20.7%).
| Income | Male | Female |
| $2,499 or less | 2 (2.1%) | 0 (0.0%) |
| $2,500 to $4,999 | 4 (4.3%) | 2 (2.3%) |
| $5,000 to $7,499 | 7 (7.5%) | 5 (5.8%) |
| $7,500 to $9,999 | 0 (0.0%) | 0 (0.0%) |
| $10,000 to $12,499 | 5 (5.4%) | 15 (17.2%) |
| $12,500 to $14,999 | 4 (4.3%) | 14 (16.1%) |
| $15,000 to $17,499 | 3 (3.2%) | 0 (0.0%) |
| $17,500 to $19,999 | 0 (0.0%) | 9 (10.3%) |
| $20,000 to $22,499 | 5 (5.4%) | 2 (2.3%) |
| $22,500 to $24,999 | 0 (0.0%) | 0 (0.0%) |
| $25,000 to $29,999 | 15 (16.1%) | 18 (20.7%) |
| $30,000 to $34,999 | 1 (1.1%) | 2 (2.3%) |
| $35,000 to $39,999 | 0 (0.0%) | 3 (3.5%) |
| $40,000 to $44,999 | 4 (4.3%) | 4 (4.6%) |
| $45,000 to $49,999 | 1 (1.1%) | 5 (5.8%) |
| $50,000 to $54,999 | 2 (2.1%) | 3 (3.5%) |
| $55,000 to $64,999 | 3 (3.2%) | 0 (0.0%) |
| $65,000 to $74,999 | 4 (4.3%) | 2 (2.3%) |
| $75,000 to $99,999 | 33 (35.5%) | 3 (3.5%) |
| $100,000+ | 0 (0.0%) | 0 (0.0%) |
| Total | 93 (100.0%) | 87 (100.0%) |
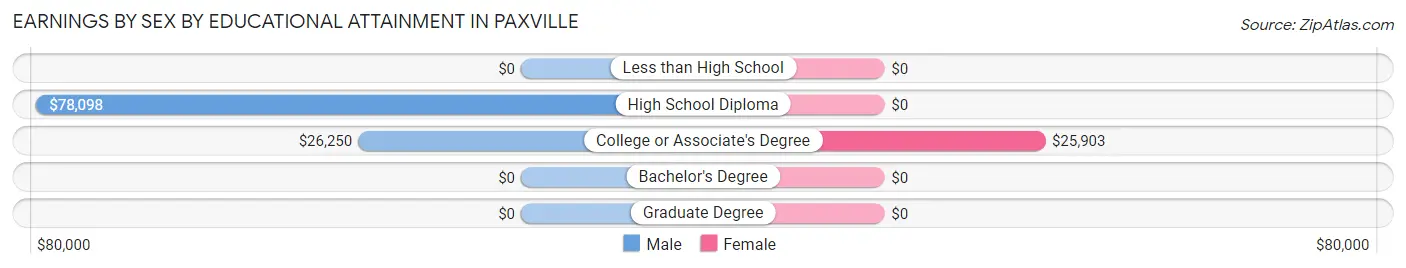
Earnings by Sex by Educational Attainment in Paxville
Average earnings in Paxville are $57,917 for men and $25,833 for women, a difference of 55.4%. Men with an educational attainment of high school diploma enjoy the highest average annual earnings of $78,098, while those with college or associate's degree education earn the least with $26,250. Women with an educational attainment of college or associate's degree earn the most with the average annual earnings of $25,903, while those with college or associate's degree education have the smallest earnings of $25,903.
| Educational Attainment | Male Income | Female Income |
| Less than High School | - | - |
| High School Diploma | $78,098 | $0 |
| College or Associate's Degree | $26,250 | $25,903 |
| Bachelor's Degree | - | - |
| Graduate Degree | - | - |
| Total | $57,917 | $25,833 |
Family Income in Paxville
Family Income Brackets in Paxville
According to the Paxville family income data, there are 21 families falling into the $100,000 to $149,999 income range, which is the most common income bracket and makes up 26.6% of all families.
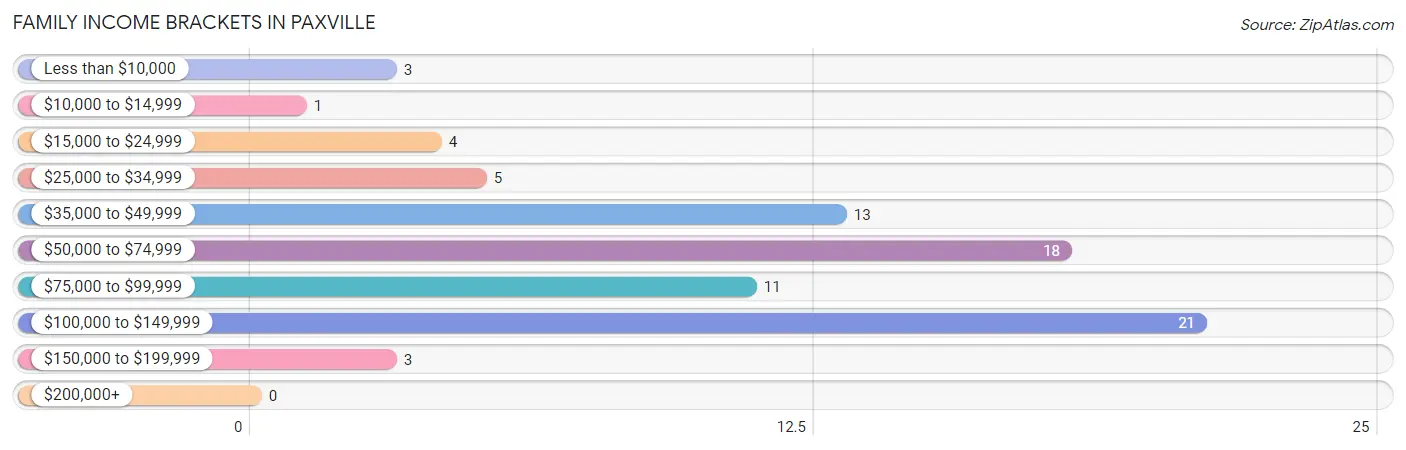
| Income Bracket | # Families | % Families |
| Less than $10,000 | 3 | 3.8% |
| $10,000 to $14,999 | 1 | 1.3% |
| $15,000 to $24,999 | 4 | 5.1% |
| $25,000 to $34,999 | 5 | 6.3% |
| $35,000 to $49,999 | 13 | 16.5% |
| $50,000 to $74,999 | 18 | 22.8% |
| $75,000 to $99,999 | 11 | 13.9% |
| $100,000 to $149,999 | 21 | 26.6% |
| $150,000 to $199,999 | 3 | 3.8% |
| $200,000+ | 0 | 0.0% |
Family Income by Famaliy Size in Paxville
4-person families (27 | 34.2%) account for the highest median family income in Paxville with $145,625 per family, while 4-person families (27 | 34.2%) have the highest median income of $36,406 per family member.
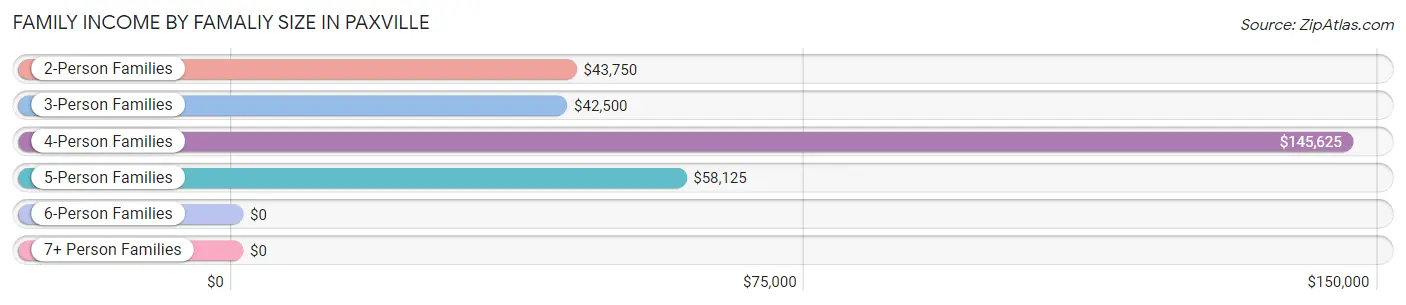
| Income Bracket | # Families | Median Income |
| 2-Person Families | 23 (29.1%) | $43,750 |
| 3-Person Families | 14 (17.7%) | $42,500 |
| 4-Person Families | 27 (34.2%) | $145,625 |
| 5-Person Families | 15 (19.0%) | $58,125 |
| 6-Person Families | 0 (0.0%) | $0 |
| 7+ Person Families | 0 (0.0%) | $0 |
| Total | 79 (100.0%) | $0 |
Family Income by Number of Earners in Paxville
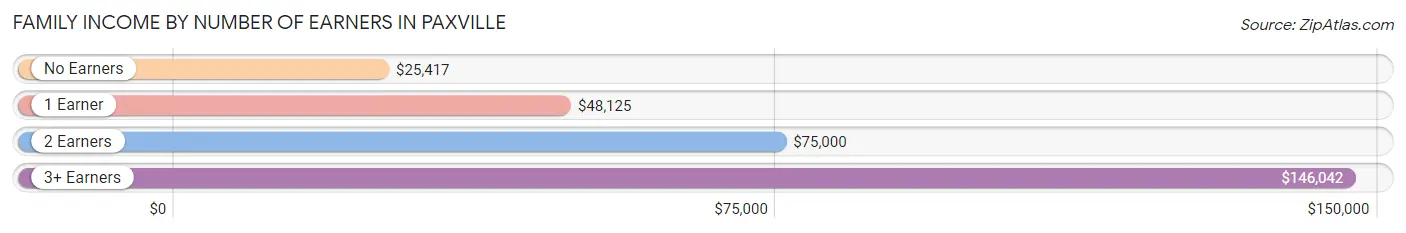
| Number of Earners | # Families | Median Income |
| No Earners | 15 (19.0%) | $25,417 |
| 1 Earner | 17 (21.5%) | $48,125 |
| 2 Earners | 22 (27.9%) | $75,000 |
| 3+ Earners | 25 (31.7%) | $146,042 |
| Total | 79 (100.0%) | $0 |
Household Income in Paxville
Household Income Brackets in Paxville
With 28 households falling in the category, the $50,000 to $74,999 income range is the most frequent in Paxville, accounting for 20.6% of all households.
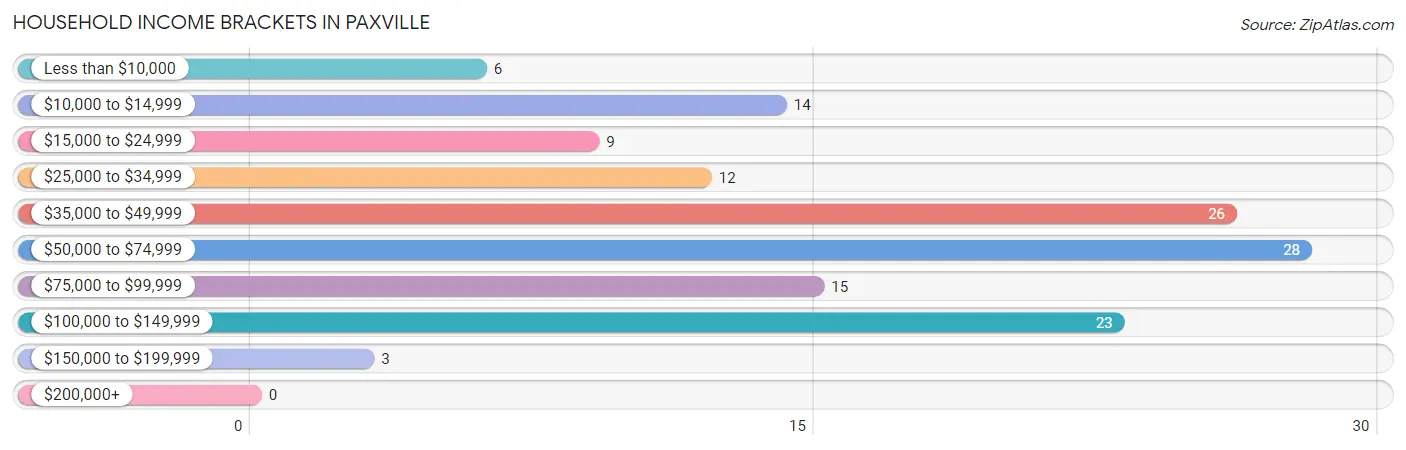
| Income Bracket | # Households | % Households |
| Less than $10,000 | 6 | 4.4% |
| $10,000 to $14,999 | 14 | 10.3% |
| $15,000 to $24,999 | 9 | 6.6% |
| $25,000 to $34,999 | 12 | 8.8% |
| $35,000 to $49,999 | 26 | 19.1% |
| $50,000 to $74,999 | 28 | 20.6% |
| $75,000 to $99,999 | 15 | 11.0% |
| $100,000 to $149,999 | 23 | 16.9% |
| $150,000 to $199,999 | 3 | 2.2% |
| $200,000+ | 0 | 0.0% |
Household Income by Householder Age in Paxville
The median household income in Paxville is $53,000, with the highest median household income of $55,417 found in the 65+ years age bracket for the primary householder. A total of 68 households (50.0%) fall into this category.
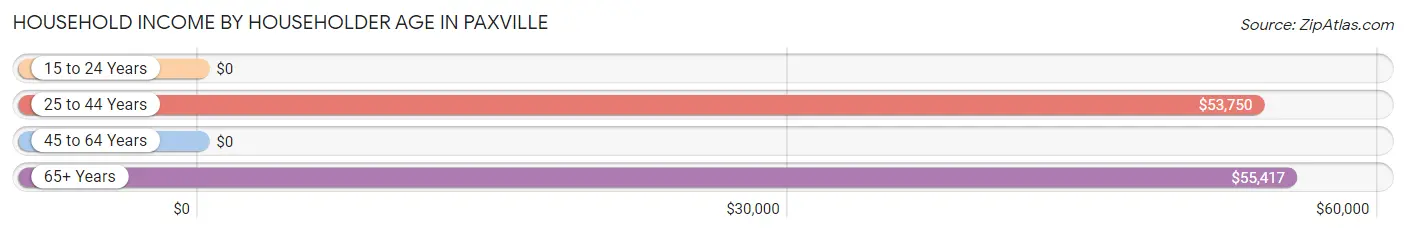
| Income Bracket | # Households | Median Income |
| 15 to 24 Years | 0 (0.0%) | $0 |
| 25 to 44 Years | 27 (19.9%) | $53,750 |
| 45 to 64 Years | 41 (30.1%) | $0 |
| 65+ Years | 68 (50.0%) | $55,417 |
| Total | 136 (100.0%) | $53,000 |
Poverty in Paxville
Income Below Poverty by Sex and Age in Paxville
With 15.5% poverty level for males and 14.3% for females among the residents of Paxville, 16 and 17 year old males and 75 year old and over females are the most vulnerable to poverty, with 11 males (78.6%) and 5 females (41.7%) in their respective age groups living below the poverty level.
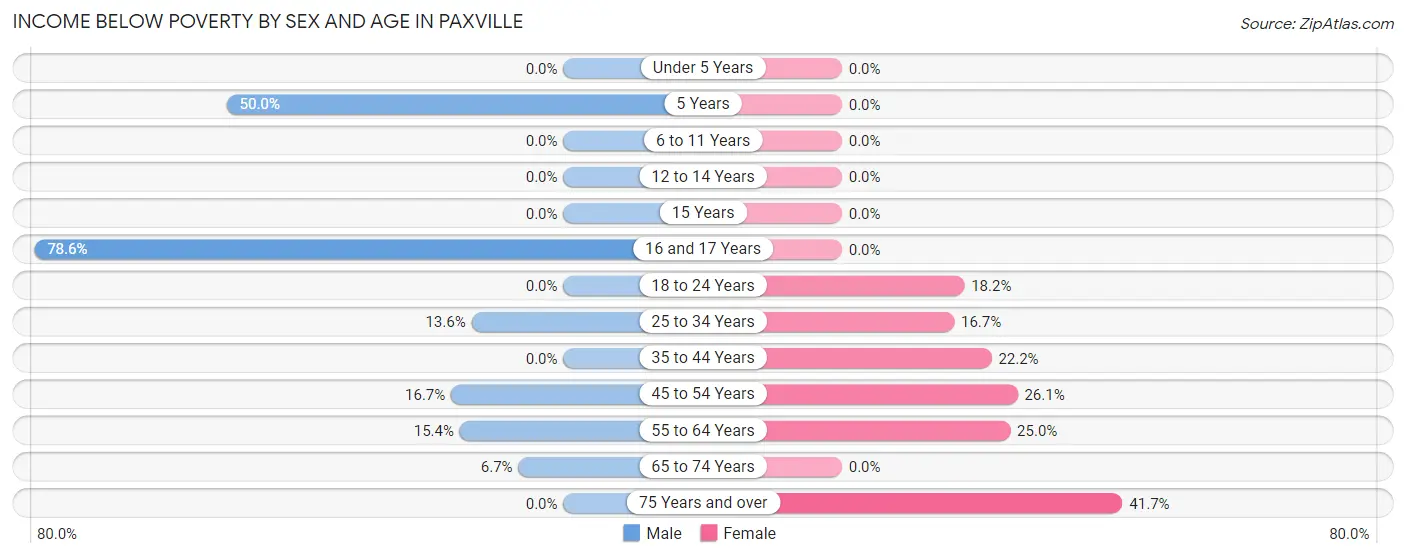
| Age Bracket | Male | Female |
| Under 5 Years | 0 (0.0%) | 0 (0.0%) |
| 5 Years | 2 (50.0%) | 0 (0.0%) |
| 6 to 11 Years | 0 (0.0%) | 0 (0.0%) |
| 12 to 14 Years | 0 (0.0%) | 0 (0.0%) |
| 15 Years | 0 (0.0%) | 0 (0.0%) |
| 16 and 17 Years | 11 (78.6%) | 0 (0.0%) |
| 18 to 24 Years | 0 (0.0%) | 4 (18.2%) |
| 25 to 34 Years | 3 (13.6%) | 3 (16.7%) |
| 35 to 44 Years | 0 (0.0%) | 2 (22.2%) |
| 45 to 54 Years | 7 (16.7%) | 6 (26.1%) |
| 55 to 64 Years | 2 (15.4%) | 4 (25.0%) |
| 65 to 74 Years | 2 (6.7%) | 0 (0.0%) |
| 75 Years and over | 0 (0.0%) | 5 (41.7%) |
| Total | 27 (15.5%) | 24 (14.3%) |
Income Above Poverty by Sex and Age in Paxville
According to the poverty statistics in Paxville, males aged under 5 years and females aged under 5 years are the age groups that are most secure financially, with 100.0% of males and 100.0% of females in these age groups living above the poverty line.
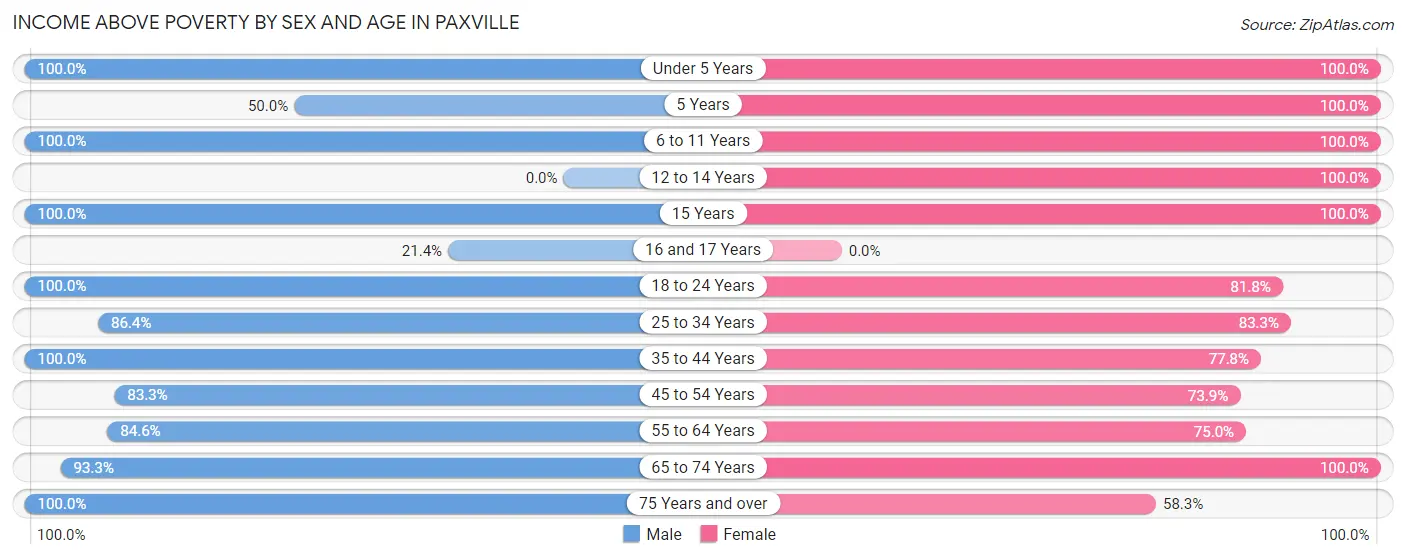
| Age Bracket | Male | Female |
| Under 5 Years | 9 (100.0%) | 5 (100.0%) |
| 5 Years | 2 (50.0%) | 1 (100.0%) |
| 6 to 11 Years | 3 (100.0%) | 14 (100.0%) |
| 12 to 14 Years | 0 (0.0%) | 2 (100.0%) |
| 15 Years | 8 (100.0%) | 5 (100.0%) |
| 16 and 17 Years | 3 (21.4%) | 0 (0.0%) |
| 18 to 24 Years | 14 (100.0%) | 18 (81.8%) |
| 25 to 34 Years | 19 (86.4%) | 15 (83.3%) |
| 35 to 44 Years | 6 (100.0%) | 7 (77.8%) |
| 45 to 54 Years | 35 (83.3%) | 17 (73.9%) |
| 55 to 64 Years | 11 (84.6%) | 12 (75.0%) |
| 65 to 74 Years | 28 (93.3%) | 41 (100.0%) |
| 75 Years and over | 9 (100.0%) | 7 (58.3%) |
| Total | 147 (84.5%) | 144 (85.7%) |
Income Below Poverty Among Married-Couple Families in Paxville
The poverty statistics for married-couple families in Paxville show that 9.7% or 6 of the total 62 families live below the poverty line. Families with no children have the highest poverty rate of 16.7%, comprising of 4 families. On the other hand, families with 3 or 4 children have the lowest poverty rate of 0.0%, which includes 0 families.
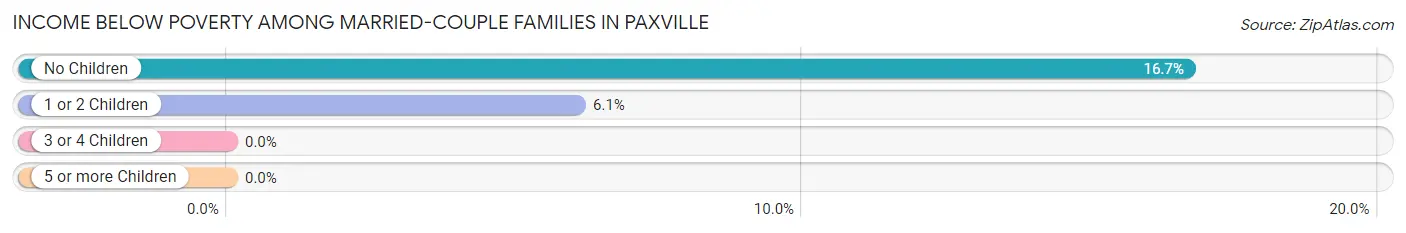
| Children | Above Poverty | Below Poverty |
| No Children | 20 (83.3%) | 4 (16.7%) |
| 1 or 2 Children | 31 (93.9%) | 2 (6.1%) |
| 3 or 4 Children | 5 (100.0%) | 0 (0.0%) |
| 5 or more Children | 0 (0.0%) | 0 (0.0%) |
| Total | 56 (90.3%) | 6 (9.7%) |
Income Below Poverty Among Single-Parent Households in Paxville
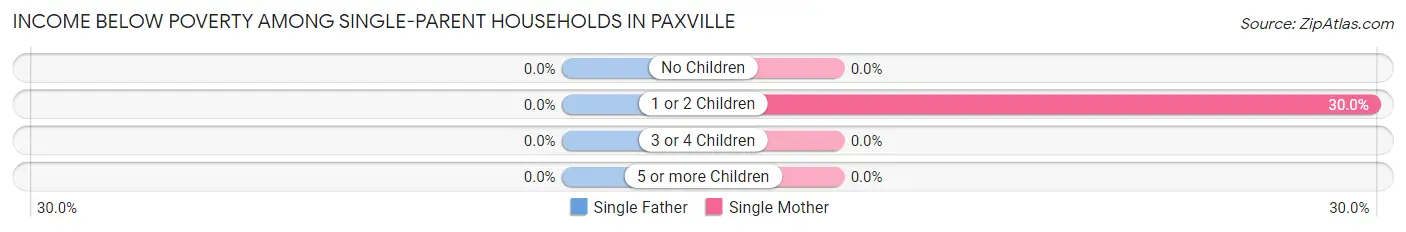
| Children | Single Father | Single Mother |
| No Children | 0 (0.0%) | 0 (0.0%) |
| 1 or 2 Children | 0 (0.0%) | 3 (30.0%) |
| 3 or 4 Children | 0 (0.0%) | 0 (0.0%) |
| 5 or more Children | 0 (0.0%) | 0 (0.0%) |
| Total | 0 (0.0%) | 3 (18.8%) |
Income Below Poverty Among Married-Couple vs Single-Parent Households in Paxville
The poverty data for Paxville shows that 6 of the married-couple family households (9.7%) and 3 of the single-parent households (17.6%) are living below the poverty level. Within the married-couple family households, those with no children have the highest poverty rate, with 4 households (16.7%) falling below the poverty line. Among the single-parent households, those with 1 or 2 children have the highest poverty rate, with 3 household (27.3%) living below poverty.
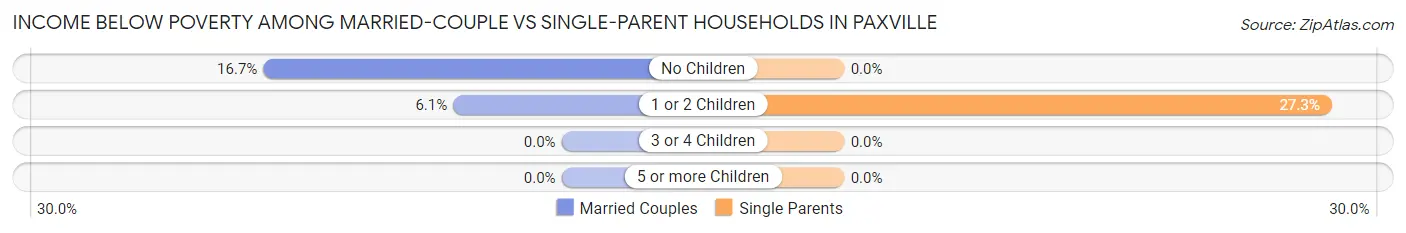
| Children | Married-Couple Families | Single-Parent Households |
| No Children | 4 (16.7%) | 0 (0.0%) |
| 1 or 2 Children | 2 (6.1%) | 3 (27.3%) |
| 3 or 4 Children | 0 (0.0%) | 0 (0.0%) |
| 5 or more Children | 0 (0.0%) | 0 (0.0%) |
| Total | 6 (9.7%) | 3 (17.6%) |
Race in Paxville
The most populous races in Paxville are Black / African American (162 | 47.4%), White / Caucasian (153 | 44.7%), and Two or more Races (18 | 5.3%).
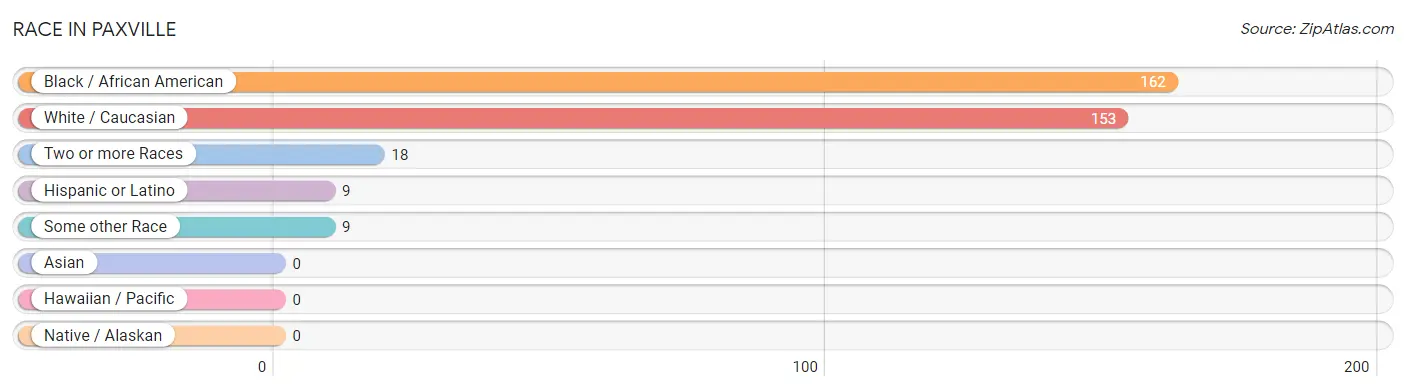
| Race | # Population | % Population |
| Asian | 0 | 0.0% |
| Black / African American | 162 | 47.4% |
| Hawaiian / Pacific | 0 | 0.0% |
| Hispanic or Latino | 9 | 2.6% |
| Native / Alaskan | 0 | 0.0% |
| White / Caucasian | 153 | 44.7% |
| Two or more Races | 18 | 5.3% |
| Some other Race | 9 | 2.6% |
| Total | 342 | 100.0% |
Ancestry in Paxville
The most populous ancestries reported in Paxville are English (82 | 24.0%), Scottish (44 | 12.9%), Irish (17 | 5.0%), Cherokee (16 | 4.7%), and Puerto Rican (9 | 2.6%), together accounting for 49.1% of all Paxville residents.
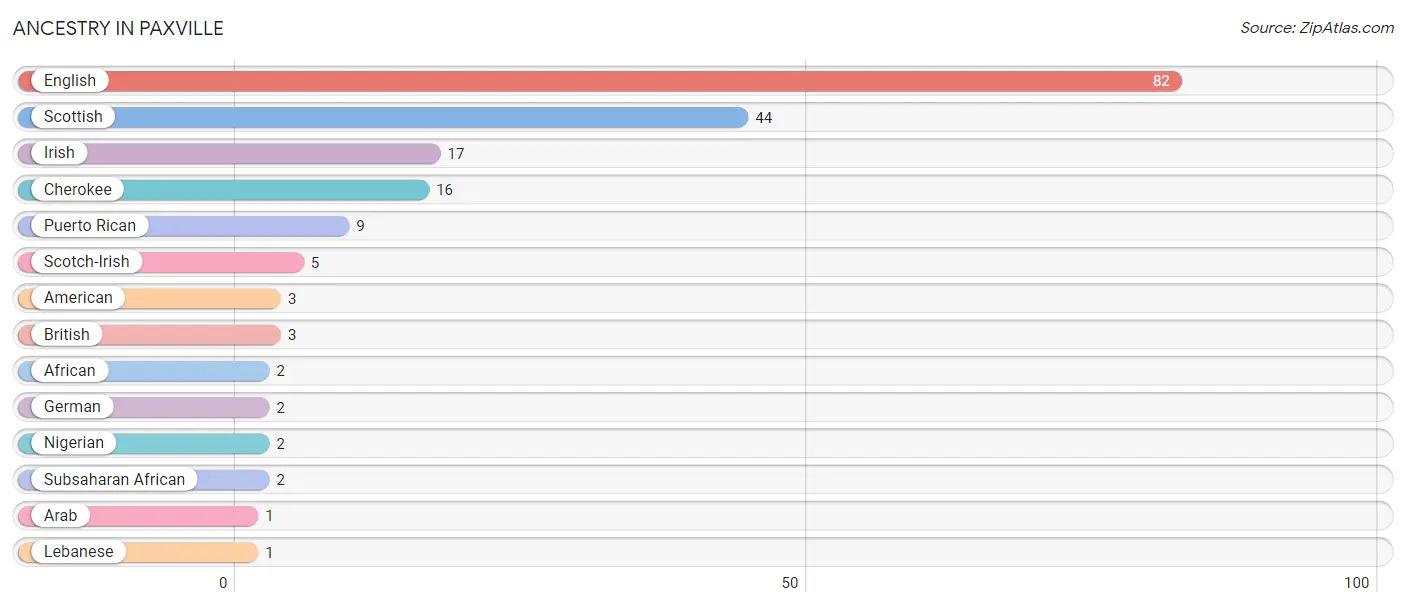
| Ancestry | # Population | % Population |
| African | 2 | 0.6% |
| American | 3 | 0.9% |
| Arab | 1 | 0.3% |
| British | 3 | 0.9% |
| Cherokee | 16 | 4.7% |
| English | 82 | 24.0% |
| German | 2 | 0.6% |
| Irish | 17 | 5.0% |
| Lebanese | 1 | 0.3% |
| Nigerian | 2 | 0.6% |
| Puerto Rican | 9 | 2.6% |
| Scotch-Irish | 5 | 1.5% |
| Scottish | 44 | 12.9% |
| Subsaharan African | 2 | 0.6% | View All 14 Rows |
Immigrants in Paxville

| Immigration Origin | # Population | % Population | View All 0 Rows |
Sex and Age in Paxville
Sex and Age in Paxville
The most populous age groups in Paxville are 45 to 49 Years (33 | 19.0%) for men and 65 to 69 Years (31 | 18.4%) for women.
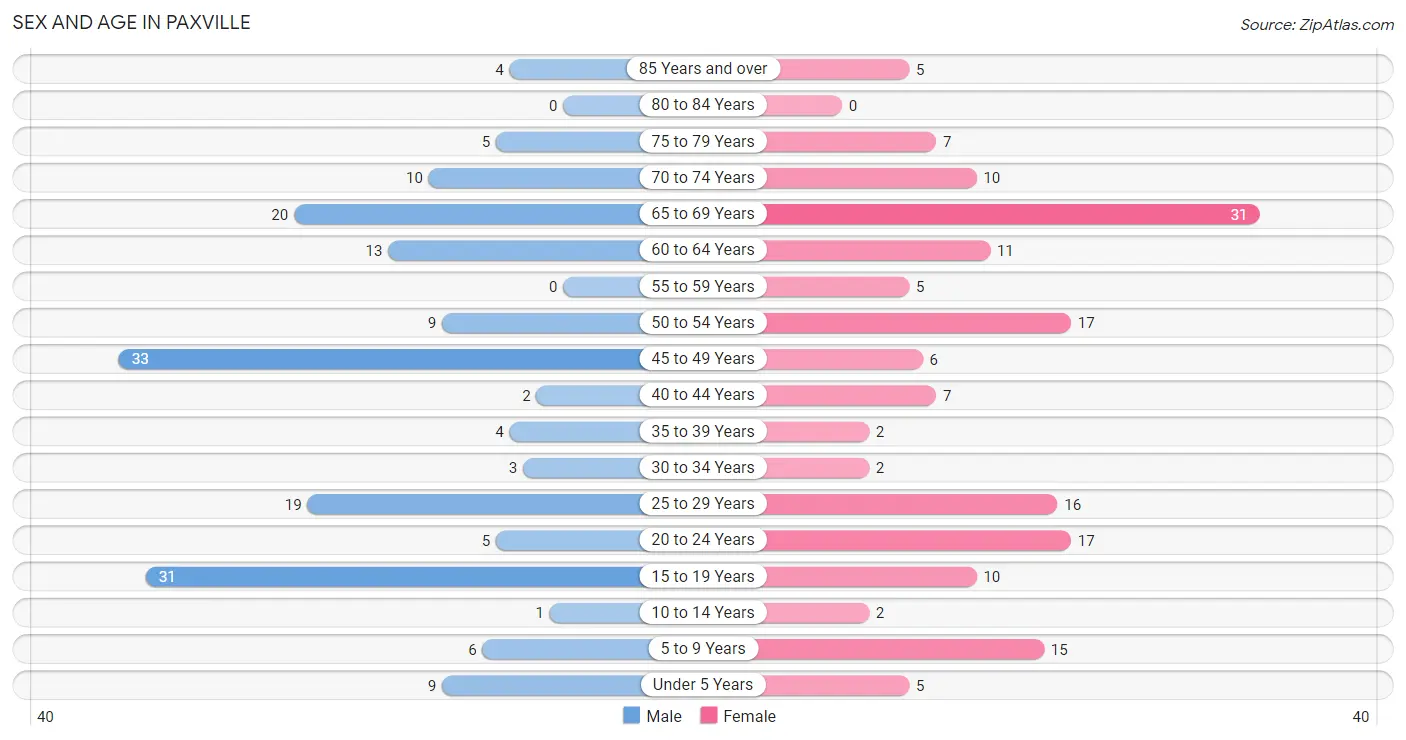
| Age Bracket | Male | Female |
| Under 5 Years | 9 (5.2%) | 5 (3.0%) |
| 5 to 9 Years | 6 (3.5%) | 15 (8.9%) |
| 10 to 14 Years | 1 (0.6%) | 2 (1.2%) |
| 15 to 19 Years | 31 (17.8%) | 10 (5.9%) |
| 20 to 24 Years | 5 (2.9%) | 17 (10.1%) |
| 25 to 29 Years | 19 (10.9%) | 16 (9.5%) |
| 30 to 34 Years | 3 (1.7%) | 2 (1.2%) |
| 35 to 39 Years | 4 (2.3%) | 2 (1.2%) |
| 40 to 44 Years | 2 (1.1%) | 7 (4.2%) |
| 45 to 49 Years | 33 (19.0%) | 6 (3.6%) |
| 50 to 54 Years | 9 (5.2%) | 17 (10.1%) |
| 55 to 59 Years | 0 (0.0%) | 5 (3.0%) |
| 60 to 64 Years | 13 (7.5%) | 11 (6.6%) |
| 65 to 69 Years | 20 (11.5%) | 31 (18.4%) |
| 70 to 74 Years | 10 (5.8%) | 10 (5.9%) |
| 75 to 79 Years | 5 (2.9%) | 7 (4.2%) |
| 80 to 84 Years | 0 (0.0%) | 0 (0.0%) |
| 85 Years and over | 4 (2.3%) | 5 (3.0%) |
| Total | 174 (100.0%) | 168 (100.0%) |
Families and Households in Paxville
Median Family Size in Paxville
The median family size in Paxville is 3.52 persons per family, with single male/father families (1 | 1.3%) accounting for the largest median family size of 4 persons per family. On the other hand, single female/mother families (16 | 20.3%) represent the smallest median family size with 3.50 persons per family.
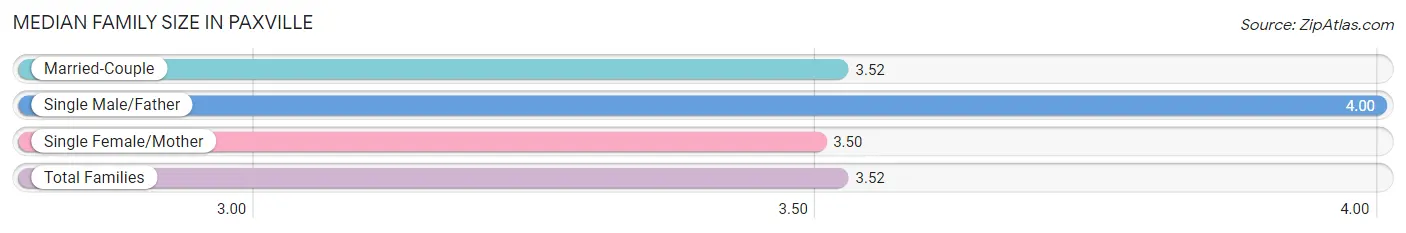
| Family Type | # Families | Family Size |
| Married-Couple | 62 (78.5%) | 3.52 |
| Single Male/Father | 1 (1.3%) | 4.00 |
| Single Female/Mother | 16 (20.3%) | 3.50 |
| Total Families | 79 (100.0%) | 3.52 |
Median Household Size in Paxville
The median household size in Paxville is 2.51 persons per household, with single male/father households (1 | 0.7%) accounting for the largest median household size of 4 persons per household. non-family households (57 | 41.9%) represent the smallest median household size with 1.11 persons per household.
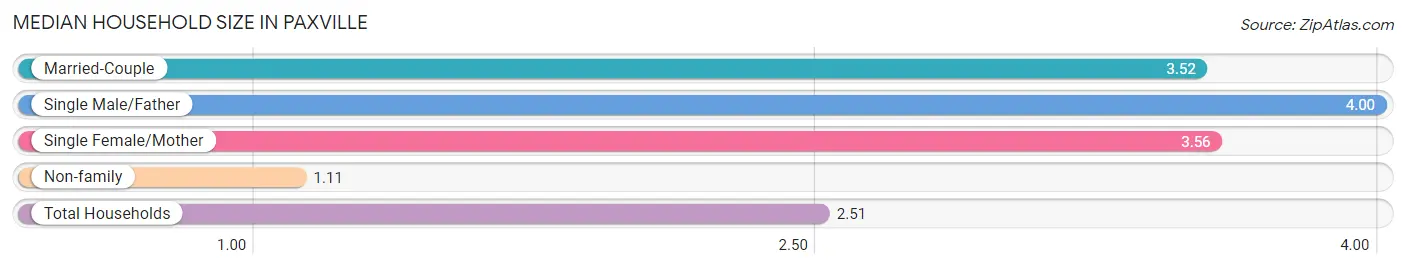
| Household Type | # Households | Household Size |
| Married-Couple | 62 (45.6%) | 3.52 |
| Single Male/Father | 1 (0.7%) | 4.00 |
| Single Female/Mother | 16 (11.8%) | 3.56 |
| Non-family | 57 (41.9%) | 1.11 |
| Total Households | 136 (100.0%) | 2.51 |
Household Size by Marriage Status in Paxville
Out of a total of 136 households in Paxville, 79 (58.1%) are family households, while 57 (41.9%) are nonfamily households. The most numerous type of family households are 4-person households, comprising 27, and the most common type of nonfamily households are 1-person households, comprising 54.
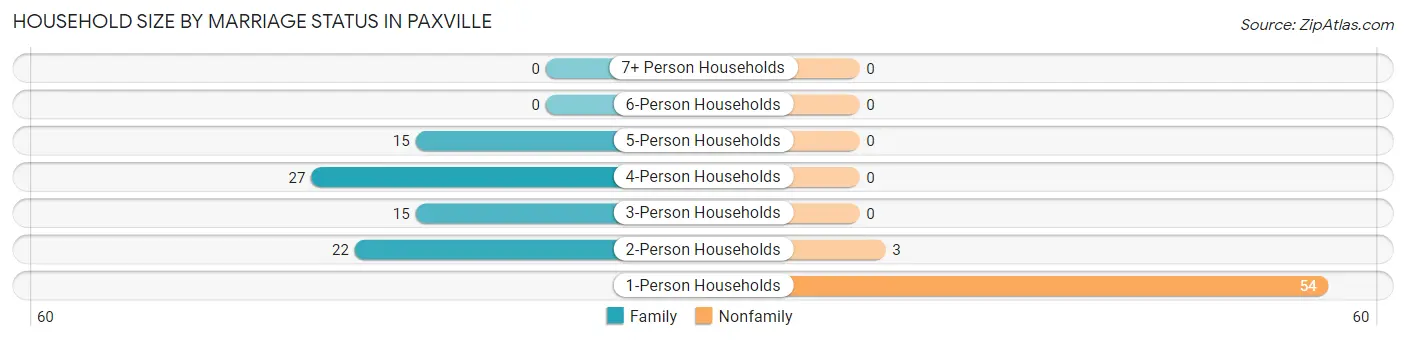
| Household Size | Family Households | Nonfamily Households |
| 1-Person Households | - | 54 (39.7%) |
| 2-Person Households | 22 (16.2%) | 3 (2.2%) |
| 3-Person Households | 15 (11.0%) | 0 (0.0%) |
| 4-Person Households | 27 (19.9%) | 0 (0.0%) |
| 5-Person Households | 15 (11.0%) | 0 (0.0%) |
| 6-Person Households | 0 (0.0%) | 0 (0.0%) |
| 7+ Person Households | 0 (0.0%) | 0 (0.0%) |
| Total | 79 (58.1%) | 57 (41.9%) |
Female Fertility in Paxville
Fertility by Age in Paxville
Average fertility rate in Paxville is 33.0 births per 1,000 women. Women in the age bracket of 35 to 50 years have the highest fertility rate with 133.0 births per 1,000 women. Women in the age bracket of 35 to 50 years acount for 100.0% of all women with births.
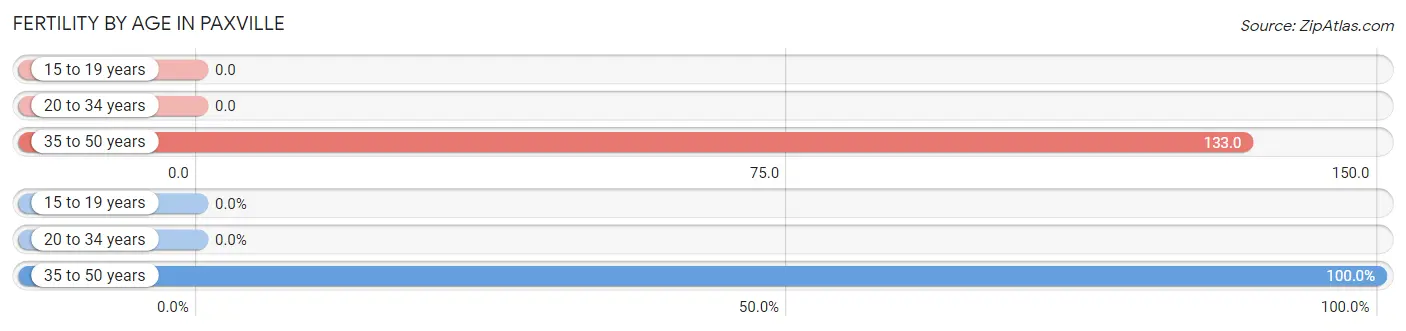
| Age Bracket | Women with Births | Births / 1,000 Women |
| 15 to 19 years | 0 (0.0%) | 0.0 |
| 20 to 34 years | 0 (0.0%) | 0.0 |
| 35 to 50 years | 2 (100.0%) | 133.0 |
| Total | 2 (100.0%) | 33.0 |
Fertility by Age by Marriage Status in Paxville
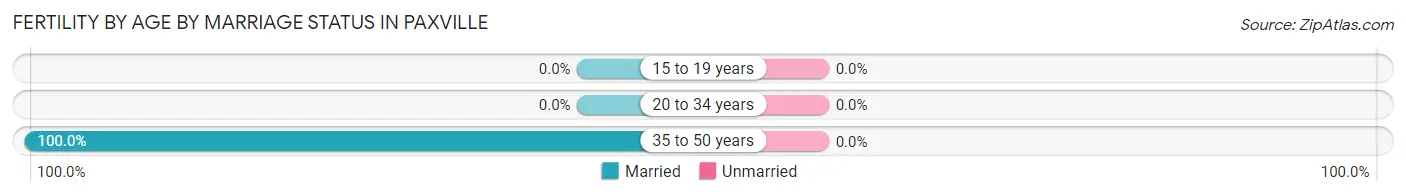
| Age Bracket | Married | Unmarried |
| 15 to 19 years | 0 (0.0%) | 0 (0.0%) |
| 20 to 34 years | 0 (0.0%) | 0 (0.0%) |
| 35 to 50 years | 2 (100.0%) | 0 (0.0%) |
| Total | 2 (100.0%) | 0 (0.0%) |
Fertility by Education in Paxville
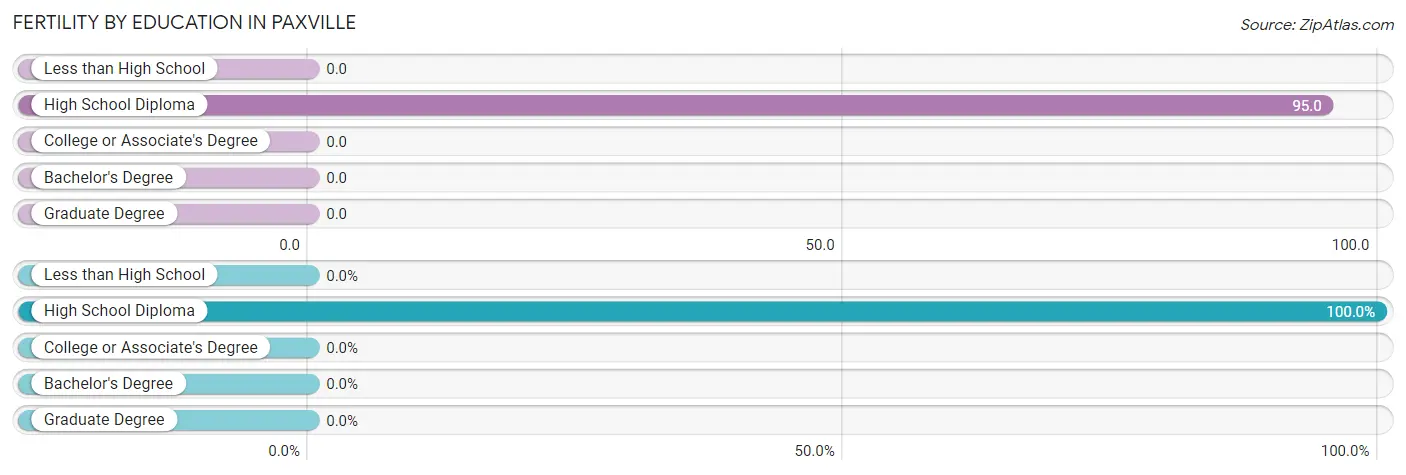
| Educational Attainment | Women with Births | Births / 1,000 Women |
| Less than High School | 0 (0.0%) | 0.0 |
| High School Diploma | 2 (100.0%) | 95.0 |
| College or Associate's Degree | 0 (0.0%) | 0.0 |
| Bachelor's Degree | 0 (0.0%) | 0.0 |
| Graduate Degree | 0 (0.0%) | 0.0 |
| Total | 2 (100.0%) | 33.0 |
Fertility by Education by Marriage Status in Paxville
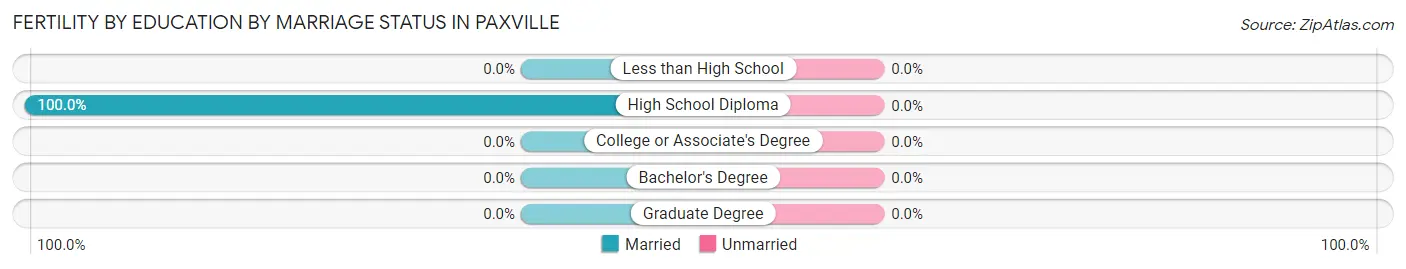
| Educational Attainment | Married | Unmarried |
| Less than High School | 0 (0.0%) | 0 (0.0%) |
| High School Diploma | 2 (100.0%) | 0 (0.0%) |
| College or Associate's Degree | 0 (0.0%) | 0 (0.0%) |
| Bachelor's Degree | 0 (0.0%) | 0 (0.0%) |
| Graduate Degree | 0 (0.0%) | 0 (0.0%) |
| Total | 2 (100.0%) | 0 (0.0%) |
Employment Characteristics in Paxville
Employment by Class of Employer in Paxville
Among the 170 employed individuals in Paxville, private company employees (105 | 61.8%), state government employees (28 | 16.5%), and self-employed (not incorporated) (19 | 11.2%) make up the most common classes of employment.
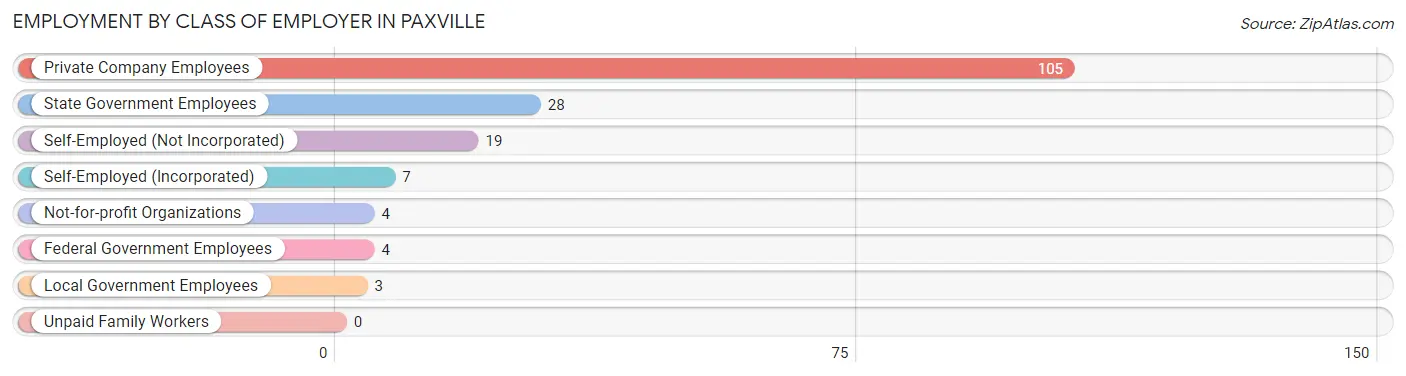
| Employer Class | # Employees | % Employees |
| Private Company Employees | 105 | 61.8% |
| Self-Employed (Incorporated) | 7 | 4.1% |
| Self-Employed (Not Incorporated) | 19 | 11.2% |
| Not-for-profit Organizations | 4 | 2.4% |
| Local Government Employees | 3 | 1.8% |
| State Government Employees | 28 | 16.5% |
| Federal Government Employees | 4 | 2.4% |
| Unpaid Family Workers | 0 | 0.0% |
| Total | 170 | 100.0% |
Employment Status by Age in Paxville
According to the labor force statistics for Paxville, out of the total population over 16 years of age (291), 62.5% or 182 individuals are in the labor force, with 6.6% or 12 of them unemployed. The age group with the highest labor force participation rate is 25 to 29 years, with 88.6% or 31 individuals in the labor force. Within the labor force, the 25 to 29 years age range has the highest percentage of unemployed individuals, with 12.9% or 4 of them being unemployed.
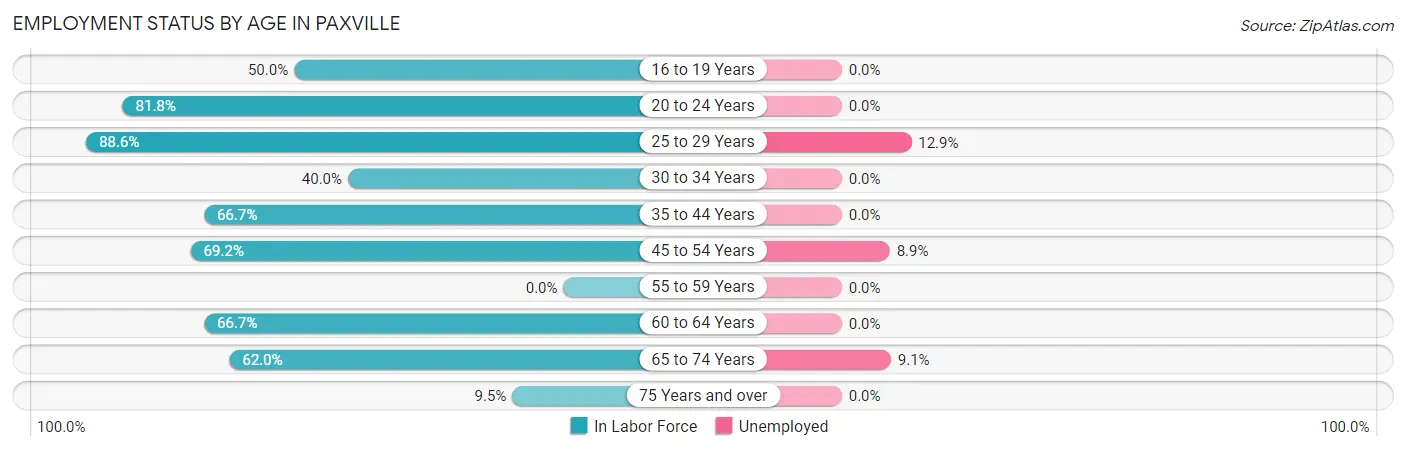
| Age Bracket | In Labor Force | Unemployed |
| 16 to 19 Years | 14 (50.0%) | 0 (0.0%) |
| 20 to 24 Years | 18 (81.8%) | 0 (0.0%) |
| 25 to 29 Years | 31 (88.6%) | 4 (12.9%) |
| 30 to 34 Years | 2 (40.0%) | 0 (0.0%) |
| 35 to 44 Years | 10 (66.7%) | 0 (0.0%) |
| 45 to 54 Years | 45 (69.2%) | 4 (8.9%) |
| 55 to 59 Years | 0 (0.0%) | 0 (0.0%) |
| 60 to 64 Years | 16 (66.7%) | 0 (0.0%) |
| 65 to 74 Years | 44 (62.0%) | 4 (9.1%) |
| 75 Years and over | 2 (9.5%) | 0 (0.0%) |
| Total | 182 (62.5%) | 12 (6.6%) |
Employment Status by Educational Attainment in Paxville
According to labor force statistics for Paxville, 69.8% of individuals (104) out of the total population between 25 and 64 years of age (149) are in the labor force, with 7.7% or 8 of them being unemployed. The group with the highest labor force participation rate are those with the educational attainment of college / associate degree, with 91.9% or 34 individuals in the labor force. Within the labor force, individuals with college / associate degree education have the highest percentage of unemployment, with 11.8% or 4 of them being unemployed.
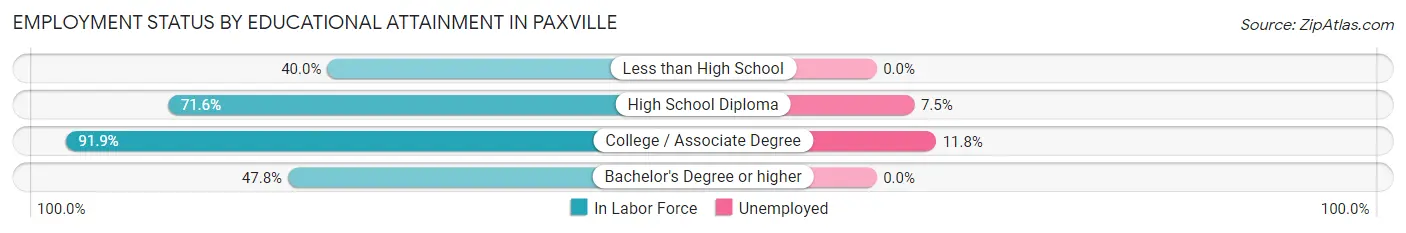
| Educational Attainment | In Labor Force | Unemployed |
| Less than High School | 6 (40.0%) | 0 (0.0%) |
| High School Diploma | 53 (71.6%) | 6 (7.5%) |
| College / Associate Degree | 34 (91.9%) | 4 (11.8%) |
| Bachelor's Degree or higher | 11 (47.8%) | 0 (0.0%) |
| Total | 104 (69.8%) | 11 (7.7%) |
Employment Occupations by Sex in Paxville
Management, Business, Science and Arts Occupations
The most common Management, Business, Science and Arts occupations in Paxville are Health Diagnosing & Treating (18 | 10.6%), Health Technologists (18 | 10.6%), Community & Social Service (11 | 6.5%), Education Instruction & Library (7 | 4.1%), and Management (4 | 2.4%).
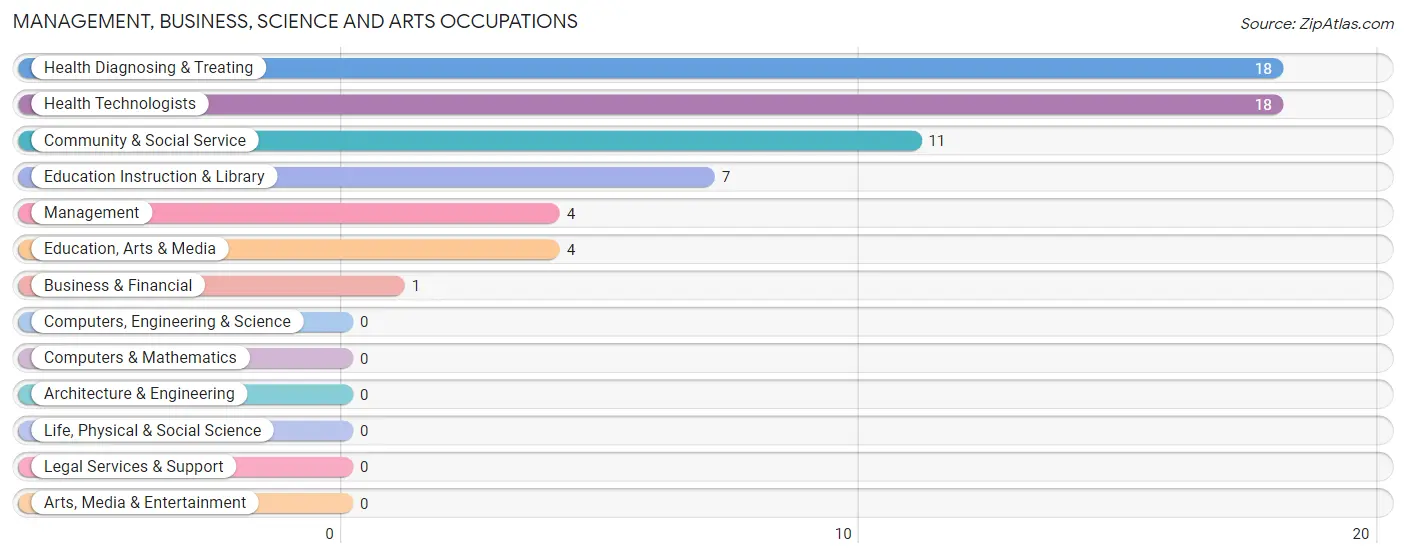
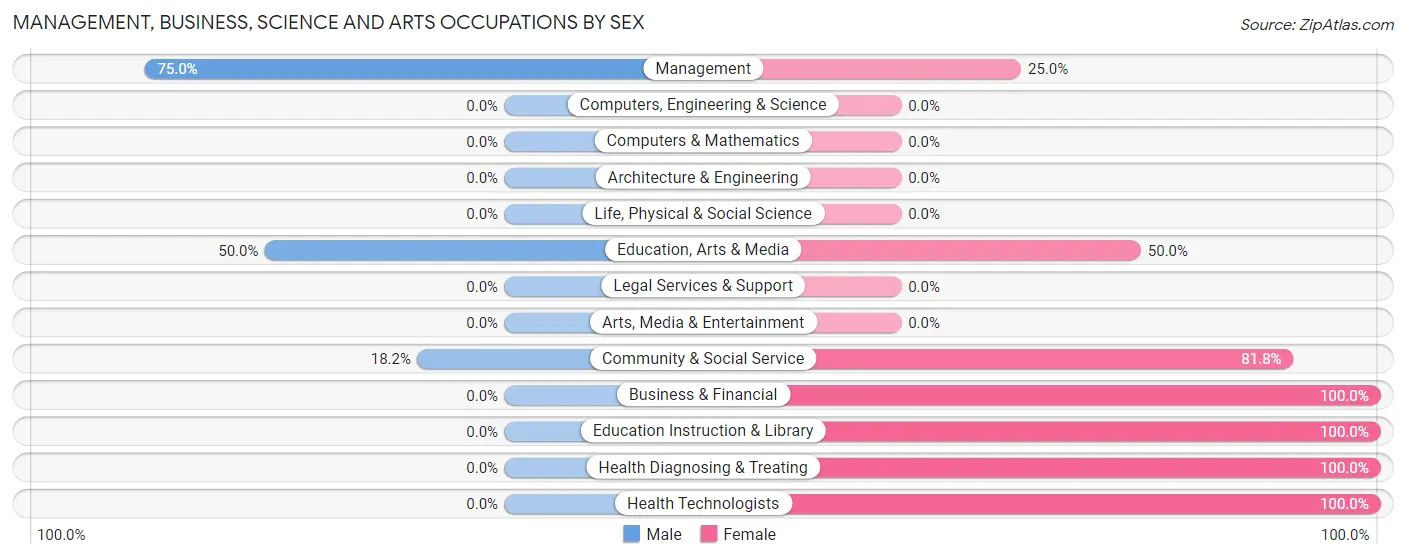
Management, Business, Science and Arts Occupations by Sex
Within the Management, Business, Science and Arts occupations in Paxville, the most male-oriented occupations are Management (75.0%), Education, Arts & Media (50.0%), and Community & Social Service (18.2%), while the most female-oriented occupations are Business & Financial (100.0%), Education Instruction & Library (100.0%), and Health Diagnosing & Treating (100.0%).
| Occupation | Male | Female |
| Management | 3 (75.0%) | 1 (25.0%) |
| Business & Financial | 0 (0.0%) | 1 (100.0%) |
| Computers, Engineering & Science | 0 (0.0%) | 0 (0.0%) |
| Computers & Mathematics | 0 (0.0%) | 0 (0.0%) |
| Architecture & Engineering | 0 (0.0%) | 0 (0.0%) |
| Life, Physical & Social Science | 0 (0.0%) | 0 (0.0%) |
| Community & Social Service | 2 (18.2%) | 9 (81.8%) |
| Education, Arts & Media | 2 (50.0%) | 2 (50.0%) |
| Legal Services & Support | 0 (0.0%) | 0 (0.0%) |
| Education Instruction & Library | 0 (0.0%) | 7 (100.0%) |
| Arts, Media & Entertainment | 0 (0.0%) | 0 (0.0%) |
| Health Diagnosing & Treating | 0 (0.0%) | 18 (100.0%) |
| Health Technologists | 0 (0.0%) | 18 (100.0%) |
| Total (Category) | 5 (14.7%) | 29 (85.3%) |
| Total (Overall) | 89 (52.3%) | 81 (47.6%) |
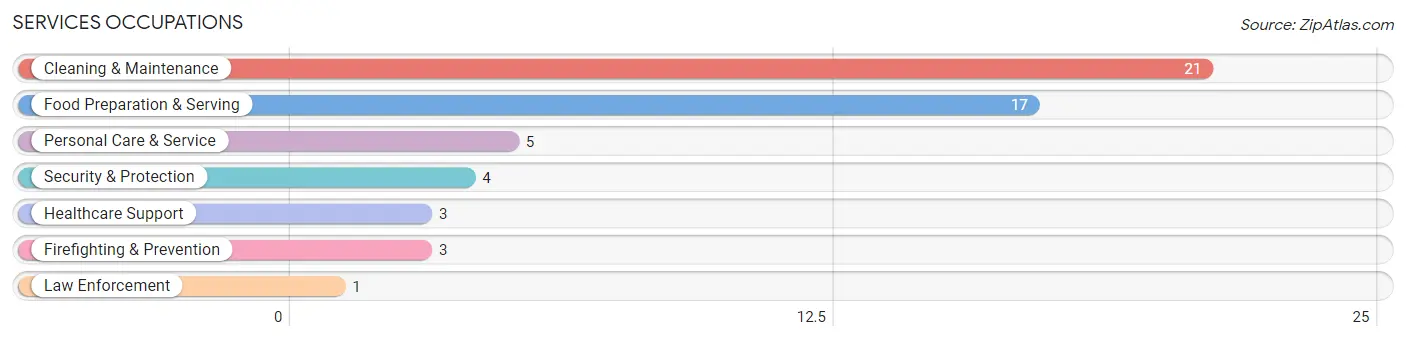
Services Occupations
The most common Services occupations in Paxville are Cleaning & Maintenance (21 | 12.3%), Food Preparation & Serving (17 | 10.0%), Personal Care & Service (5 | 2.9%), Security & Protection (4 | 2.4%), and Healthcare Support (3 | 1.8%).
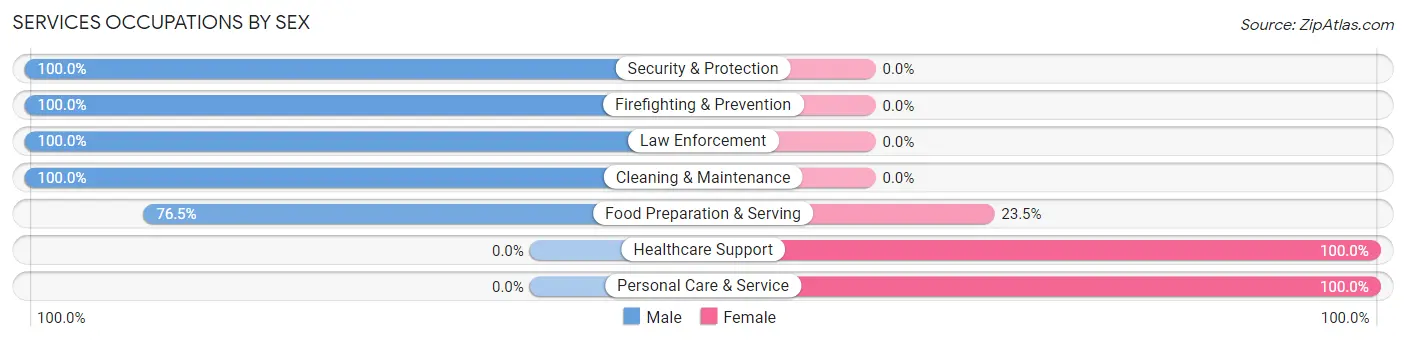
Services Occupations by Sex
Within the Services occupations in Paxville, the most male-oriented occupations are Security & Protection (100.0%), Firefighting & Prevention (100.0%), and Law Enforcement (100.0%), while the most female-oriented occupations are Healthcare Support (100.0%), Personal Care & Service (100.0%), and Food Preparation & Serving (23.5%).
| Occupation | Male | Female |
| Healthcare Support | 0 (0.0%) | 3 (100.0%) |
| Security & Protection | 4 (100.0%) | 0 (0.0%) |
| Firefighting & Prevention | 3 (100.0%) | 0 (0.0%) |
| Law Enforcement | 1 (100.0%) | 0 (0.0%) |
| Food Preparation & Serving | 13 (76.5%) | 4 (23.5%) |
| Cleaning & Maintenance | 21 (100.0%) | 0 (0.0%) |
| Personal Care & Service | 0 (0.0%) | 5 (100.0%) |
| Total (Category) | 38 (76.0%) | 12 (24.0%) |
| Total (Overall) | 89 (52.3%) | 81 (47.6%) |
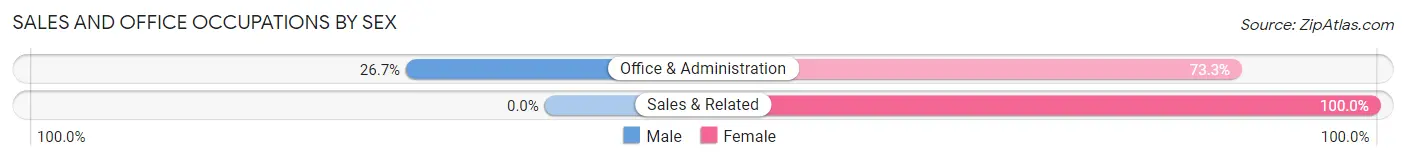
Sales and Office Occupations
The most common Sales and Office occupations in Paxville are Sales & Related (16 | 9.4%), and Office & Administration (15 | 8.8%).

Sales and Office Occupations by Sex
| Occupation | Male | Female |
| Sales & Related | 0 (0.0%) | 16 (100.0%) |
| Office & Administration | 4 (26.7%) | 11 (73.3%) |
| Total (Category) | 4 (12.9%) | 27 (87.1%) |
| Total (Overall) | 89 (52.3%) | 81 (47.6%) |
Natural Resources, Construction and Maintenance Occupations
The most common Natural Resources, Construction and Maintenance occupations in Paxville are Construction & Extraction (30 | 17.6%), and Installation, Maintenance & Repair (2 | 1.2%).
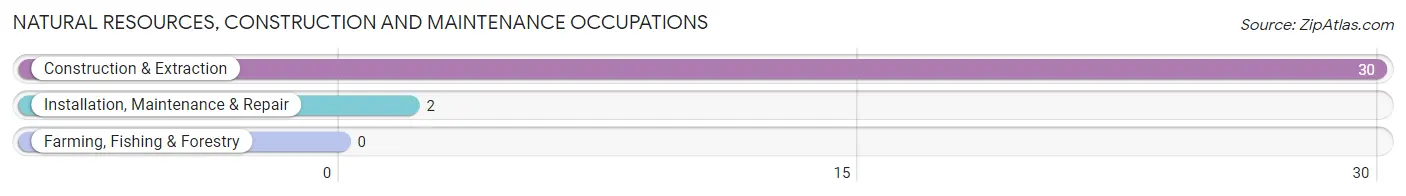
Natural Resources, Construction and Maintenance Occupations by Sex

| Occupation | Male | Female |
| Farming, Fishing & Forestry | 0 (0.0%) | 0 (0.0%) |
| Construction & Extraction | 30 (100.0%) | 0 (0.0%) |
| Installation, Maintenance & Repair | 2 (100.0%) | 0 (0.0%) |
| Total (Category) | 32 (100.0%) | 0 (0.0%) |
| Total (Overall) | 89 (52.3%) | 81 (47.6%) |
Production, Transportation and Moving Occupations
The most common Production, Transportation and Moving occupations in Paxville are Production (18 | 10.6%), and Transportation (5 | 2.9%).
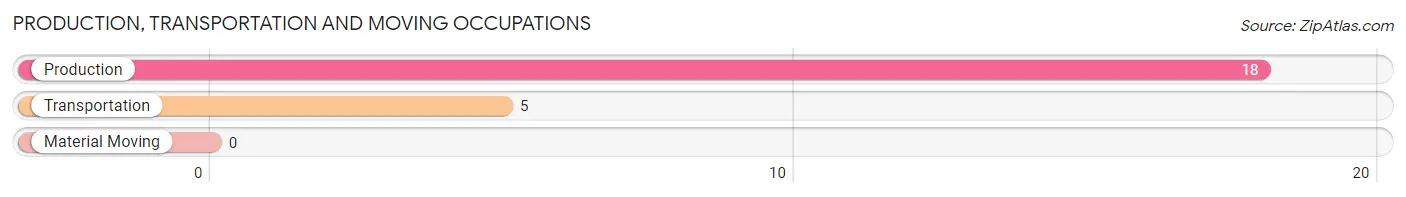
Production, Transportation and Moving Occupations by Sex
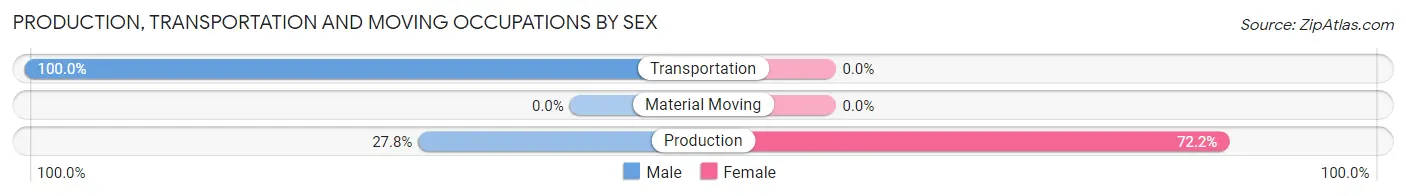
| Occupation | Male | Female |
| Production | 5 (27.8%) | 13 (72.2%) |
| Transportation | 5 (100.0%) | 0 (0.0%) |
| Material Moving | 0 (0.0%) | 0 (0.0%) |
| Total (Category) | 10 (43.5%) | 13 (56.5%) |
| Total (Overall) | 89 (52.3%) | 81 (47.6%) |
Employment Industries by Sex in Paxville
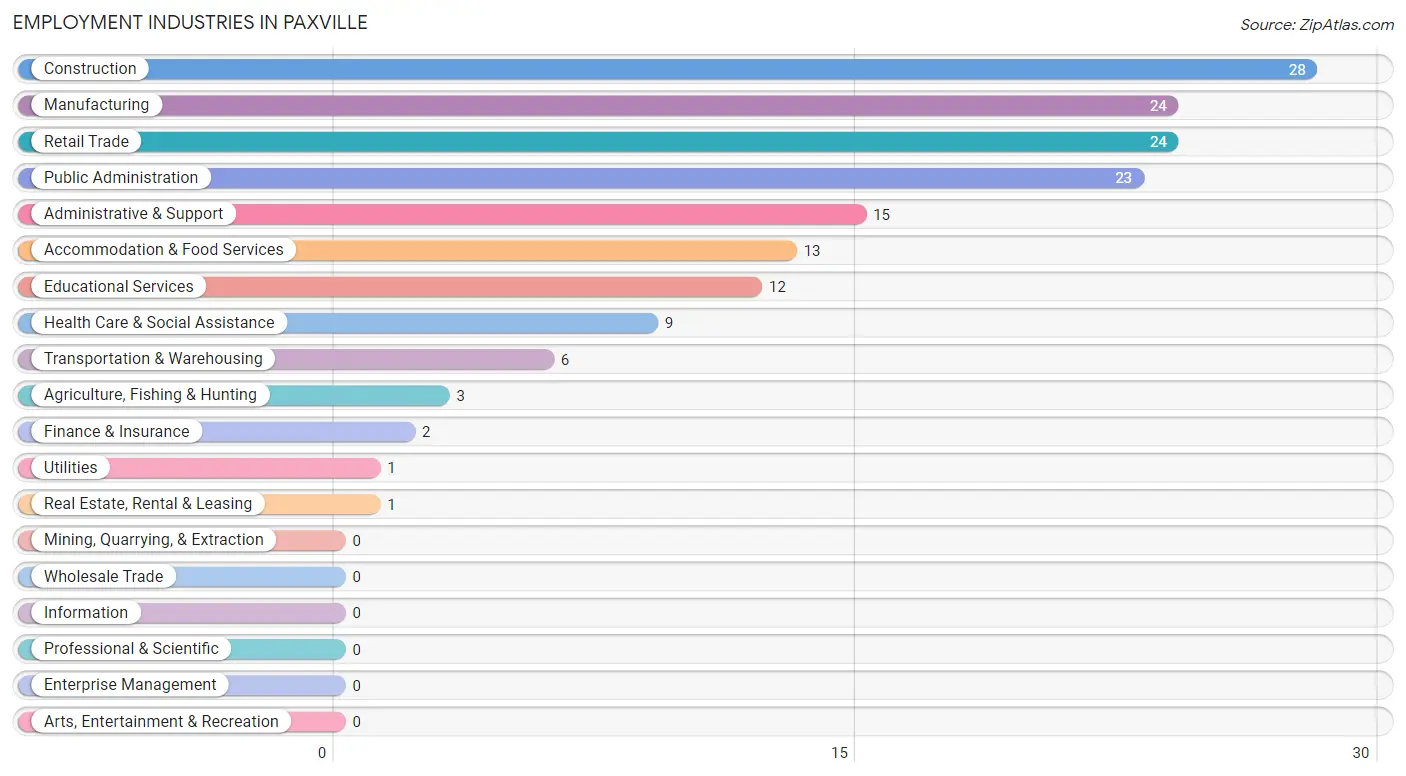
Employment Industries in Paxville
The major employment industries in Paxville include Construction (28 | 16.5%), Manufacturing (24 | 14.1%), Retail Trade (24 | 14.1%), Public Administration (23 | 13.5%), and Administrative & Support (15 | 8.8%).
Employment Industries by Sex in Paxville
The Paxville industries that see more men than women are Agriculture, Fishing & Hunting (100.0%), Construction (100.0%), and Accommodation & Food Services (100.0%), whereas the industries that tend to have a higher number of women are Utilities (100.0%), Finance & Insurance (100.0%), and Real Estate, Rental & Leasing (100.0%).
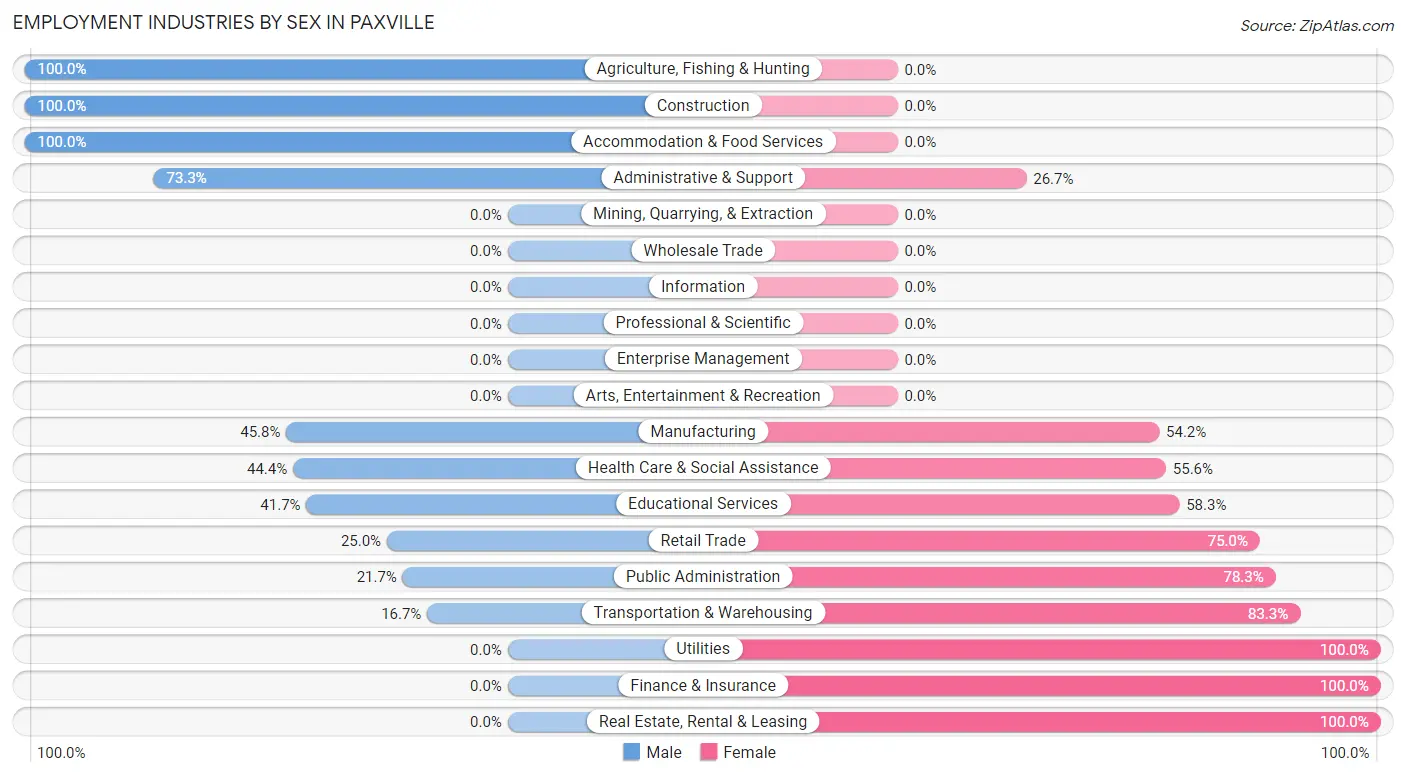
| Industry | Male | Female |
| Agriculture, Fishing & Hunting | 3 (100.0%) | 0 (0.0%) |
| Mining, Quarrying, & Extraction | 0 (0.0%) | 0 (0.0%) |
| Construction | 28 (100.0%) | 0 (0.0%) |
| Manufacturing | 11 (45.8%) | 13 (54.2%) |
| Wholesale Trade | 0 (0.0%) | 0 (0.0%) |
| Retail Trade | 6 (25.0%) | 18 (75.0%) |
| Transportation & Warehousing | 1 (16.7%) | 5 (83.3%) |
| Utilities | 0 (0.0%) | 1 (100.0%) |
| Information | 0 (0.0%) | 0 (0.0%) |
| Finance & Insurance | 0 (0.0%) | 2 (100.0%) |
| Real Estate, Rental & Leasing | 0 (0.0%) | 1 (100.0%) |
| Professional & Scientific | 0 (0.0%) | 0 (0.0%) |
| Enterprise Management | 0 (0.0%) | 0 (0.0%) |
| Administrative & Support | 11 (73.3%) | 4 (26.7%) |
| Educational Services | 5 (41.7%) | 7 (58.3%) |
| Health Care & Social Assistance | 4 (44.4%) | 5 (55.6%) |
| Arts, Entertainment & Recreation | 0 (0.0%) | 0 (0.0%) |
| Accommodation & Food Services | 13 (100.0%) | 0 (0.0%) |
| Public Administration | 5 (21.7%) | 18 (78.3%) |
| Total | 89 (52.3%) | 81 (47.6%) |
Education in Paxville
School Enrollment in Paxville
The most common levels of schooling among the 69 students in Paxville are high school (19 | 27.5%), college / undergraduate (17 | 24.6%), and elementary school (16 | 23.2%).
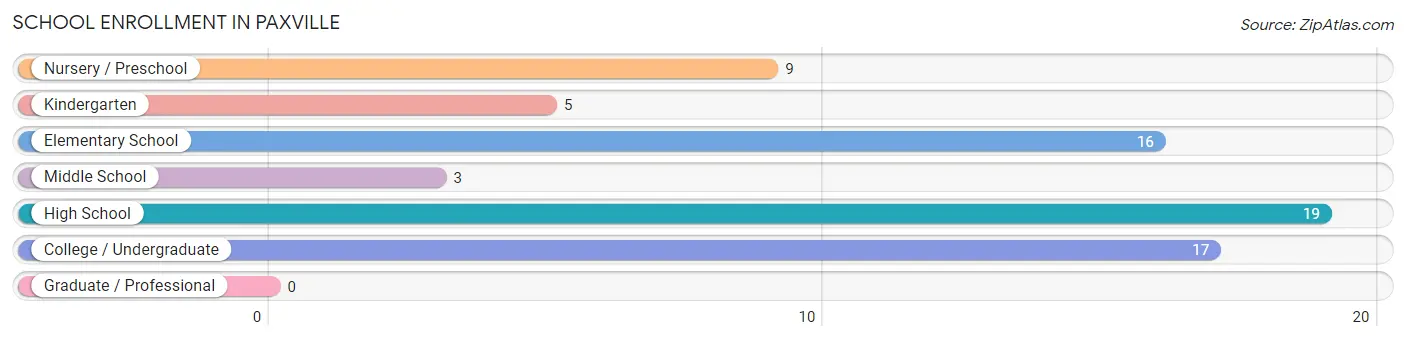
| School Level | # Students | % Students |
| Nursery / Preschool | 9 | 13.0% |
| Kindergarten | 5 | 7.2% |
| Elementary School | 16 | 23.2% |
| Middle School | 3 | 4.3% |
| High School | 19 | 27.5% |
| College / Undergraduate | 17 | 24.6% |
| Graduate / Professional | 0 | 0.0% |
| Total | 69 | 100.0% |
School Enrollment by Age by Funding Source in Paxville
Out of a total of 69 students who are enrolled in schools in Paxville, 9 (13.0%) attend a private institution, while the remaining 60 (87.0%) are enrolled in public schools. The age group of 10 to 14 year olds has the highest likelihood of being enrolled in private schools, with 1 (33.3% in the age bracket) enrolled. Conversely, the age group of 3 to 4 year olds has the lowest likelihood of being enrolled in a private school, with 9 (100.0% in the age bracket) attending a public institution.
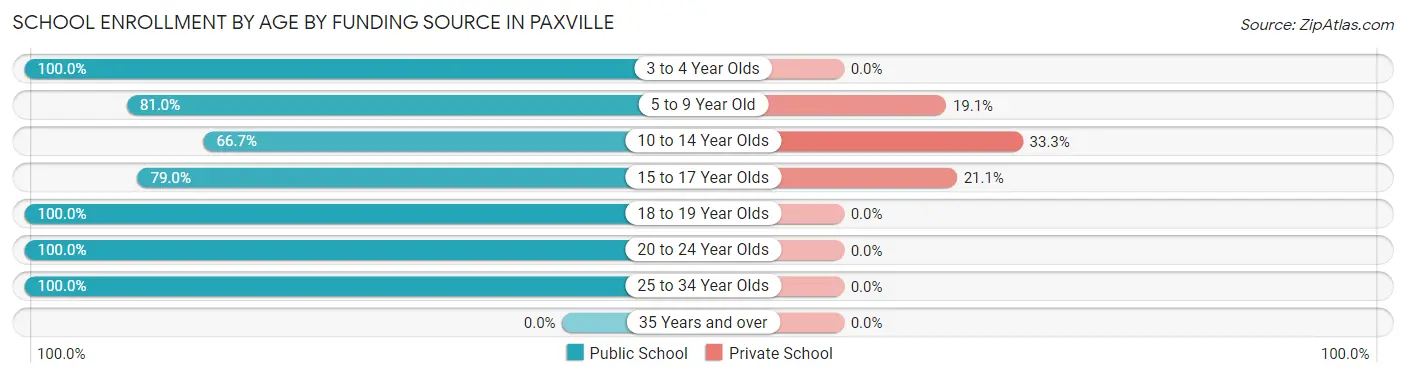
| Age Bracket | Public School | Private School |
| 3 to 4 Year Olds | 9 (100.0%) | 0 (0.0%) |
| 5 to 9 Year Old | 17 (80.9%) | 4 (19.1%) |
| 10 to 14 Year Olds | 2 (66.7%) | 1 (33.3%) |
| 15 to 17 Year Olds | 15 (78.9%) | 4 (21.0%) |
| 18 to 19 Year Olds | 10 (100.0%) | 0 (0.0%) |
| 20 to 24 Year Olds | 1 (100.0%) | 0 (0.0%) |
| 25 to 34 Year Olds | 6 (100.0%) | 0 (0.0%) |
| 35 Years and over | 0 (0.0%) | 0 (0.0%) |
| Total | 60 (87.0%) | 9 (13.0%) |
Educational Attainment by Field of Study in Paxville
Science & technology (10 | 27.0%), bio, nature & agricultural (6 | 16.2%), social sciences (5 | 13.5%), engineering (5 | 13.5%), and education (4 | 10.8%) are the most common fields of study among 37 individuals in Paxville who have obtained a bachelor's degree or higher.
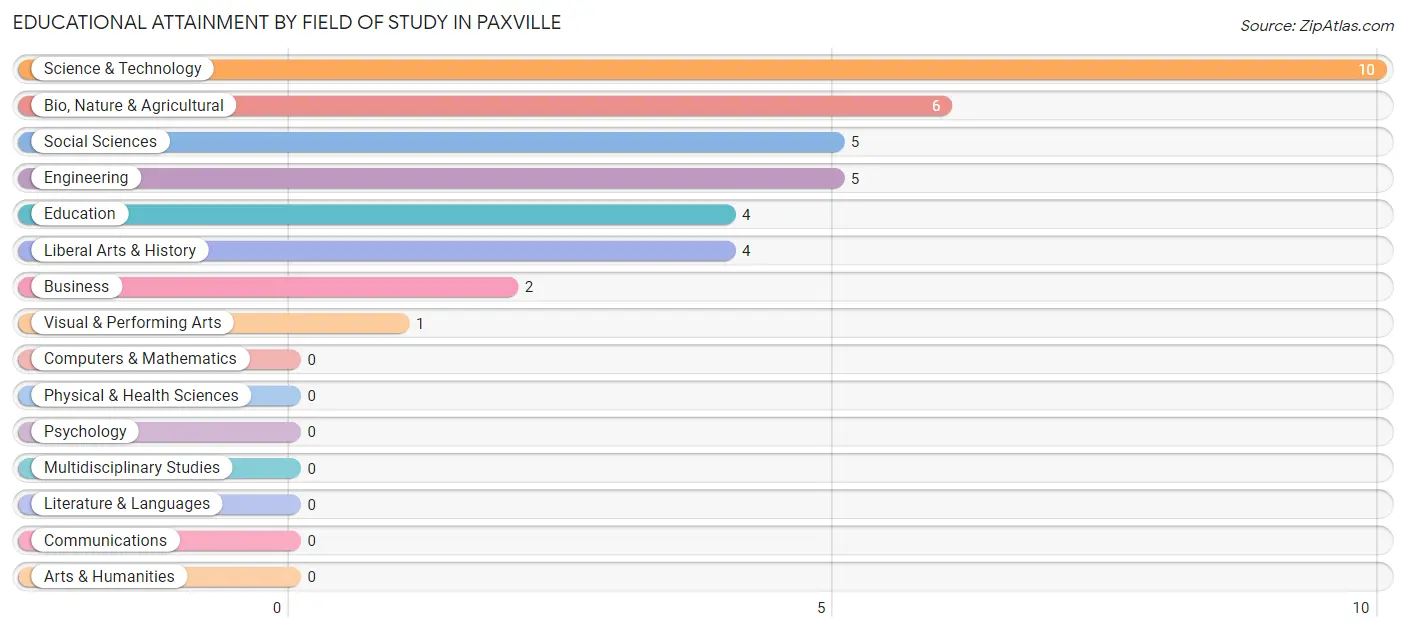
| Field of Study | # Graduates | % Graduates |
| Computers & Mathematics | 0 | 0.0% |
| Bio, Nature & Agricultural | 6 | 16.2% |
| Physical & Health Sciences | 0 | 0.0% |
| Psychology | 0 | 0.0% |
| Social Sciences | 5 | 13.5% |
| Engineering | 5 | 13.5% |
| Multidisciplinary Studies | 0 | 0.0% |
| Science & Technology | 10 | 27.0% |
| Business | 2 | 5.4% |
| Education | 4 | 10.8% |
| Literature & Languages | 0 | 0.0% |
| Liberal Arts & History | 4 | 10.8% |
| Visual & Performing Arts | 1 | 2.7% |
| Communications | 0 | 0.0% |
| Arts & Humanities | 0 | 0.0% |
| Total | 37 | 100.0% |
Transportation & Commute in Paxville
Vehicle Availability by Sex in Paxville
The most prevalent vehicle ownership categories in Paxville are males with 4 vehicles (48, accounting for 53.9%) and females with 4 vehicles (22, making up 59.3%).
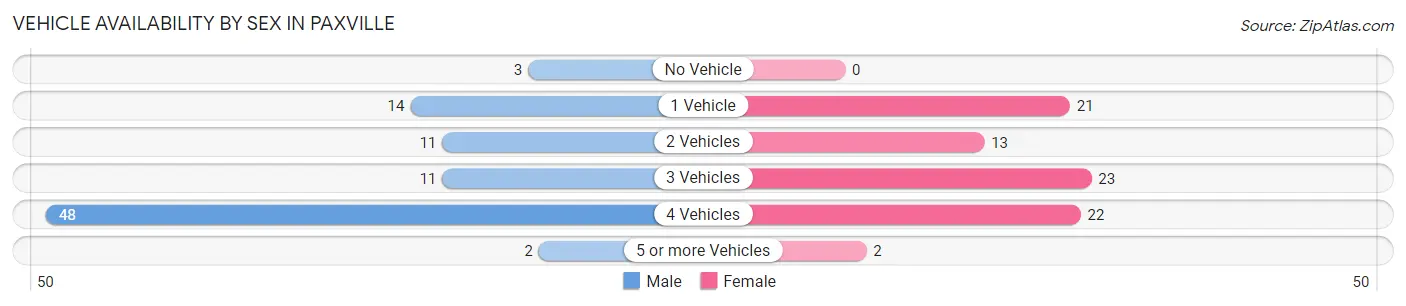
| Vehicles Available | Male | Female |
| No Vehicle | 3 (3.4%) | 0 (0.0%) |
| 1 Vehicle | 14 (15.7%) | 21 (25.9%) |
| 2 Vehicles | 11 (12.4%) | 13 (16.1%) |
| 3 Vehicles | 11 (12.4%) | 23 (28.4%) |
| 4 Vehicles | 48 (53.9%) | 22 (27.2%) |
| 5 or more Vehicles | 2 (2.2%) | 2 (2.5%) |
| Total | 89 (100.0%) | 81 (100.0%) |
Commute Time in Paxville
The most frequently occuring commute durations in Paxville are 30 to 34 minutes (59 commuters, 38.8%), 20 to 24 minutes (34 commuters, 22.4%), and 15 to 19 minutes (23 commuters, 15.1%).
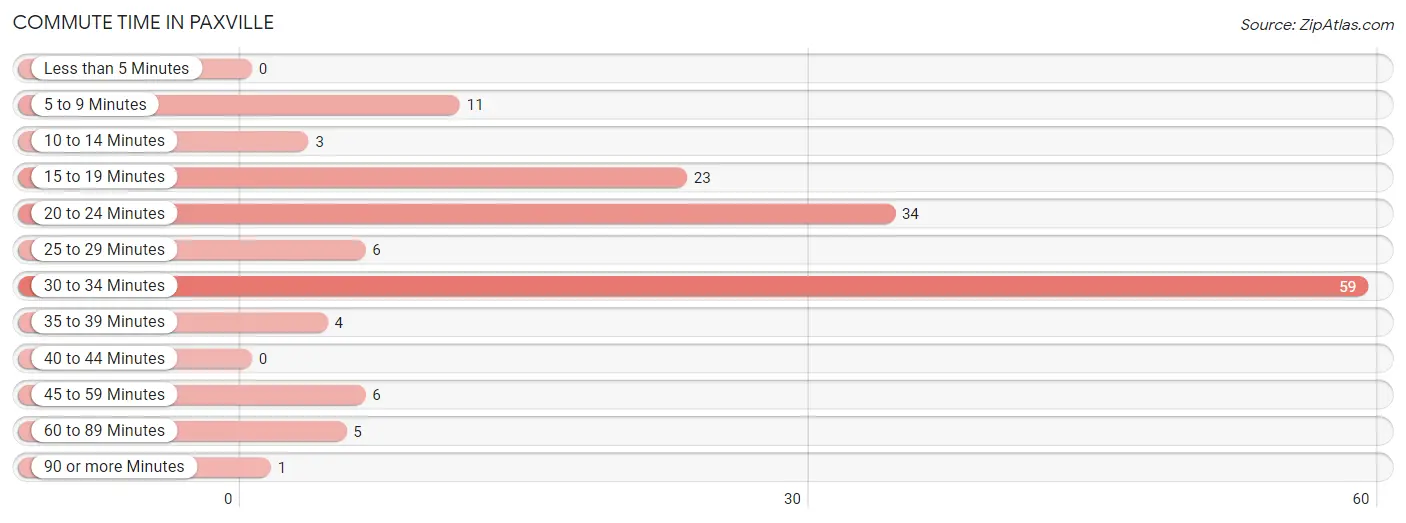
| Commute Time | # Commuters | % Commuters |
| Less than 5 Minutes | 0 | 0.0% |
| 5 to 9 Minutes | 11 | 7.2% |
| 10 to 14 Minutes | 3 | 2.0% |
| 15 to 19 Minutes | 23 | 15.1% |
| 20 to 24 Minutes | 34 | 22.4% |
| 25 to 29 Minutes | 6 | 4.0% |
| 30 to 34 Minutes | 59 | 38.8% |
| 35 to 39 Minutes | 4 | 2.6% |
| 40 to 44 Minutes | 0 | 0.0% |
| 45 to 59 Minutes | 6 | 4.0% |
| 60 to 89 Minutes | 5 | 3.3% |
| 90 or more Minutes | 1 | 0.7% |
Commute Time by Sex in Paxville
The most common commute times in Paxville are 30 to 34 minutes (26 commuters, 33.3%) for males and 30 to 34 minutes (33 commuters, 44.6%) for females.
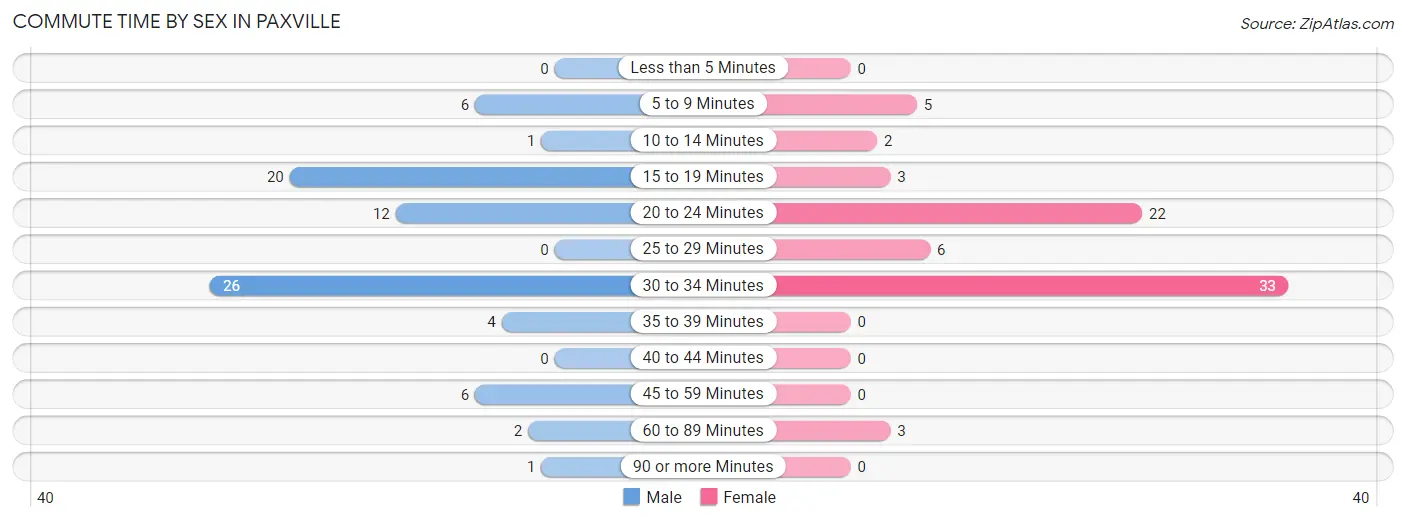
| Commute Time | Male | Female |
| Less than 5 Minutes | 0 (0.0%) | 0 (0.0%) |
| 5 to 9 Minutes | 6 (7.7%) | 5 (6.8%) |
| 10 to 14 Minutes | 1 (1.3%) | 2 (2.7%) |
| 15 to 19 Minutes | 20 (25.6%) | 3 (4.1%) |
| 20 to 24 Minutes | 12 (15.4%) | 22 (29.7%) |
| 25 to 29 Minutes | 0 (0.0%) | 6 (8.1%) |
| 30 to 34 Minutes | 26 (33.3%) | 33 (44.6%) |
| 35 to 39 Minutes | 4 (5.1%) | 0 (0.0%) |
| 40 to 44 Minutes | 0 (0.0%) | 0 (0.0%) |
| 45 to 59 Minutes | 6 (7.7%) | 0 (0.0%) |
| 60 to 89 Minutes | 2 (2.6%) | 3 (4.1%) |
| 90 or more Minutes | 1 (1.3%) | 0 (0.0%) |
Time of Departure to Work by Sex in Paxville
The most frequent times of departure to work in Paxville are 6:30 AM to 6:59 AM (33, 42.3%) for males and 8:00 AM to 8:29 AM (23, 31.1%) for females.
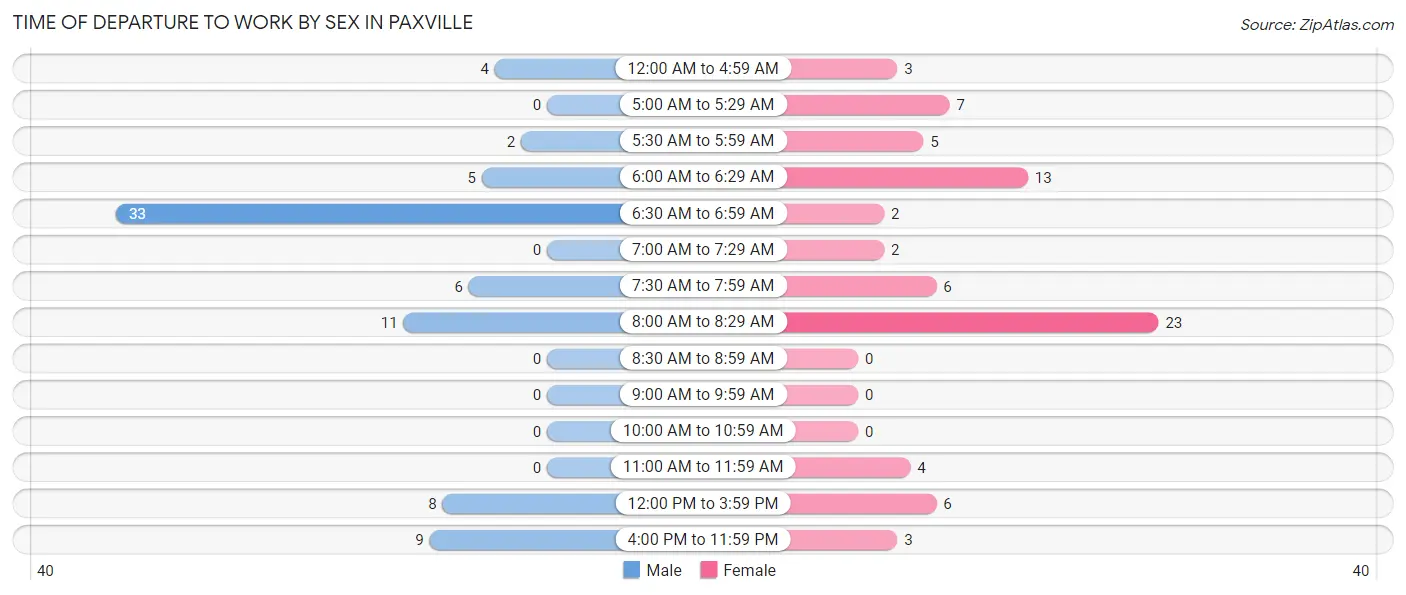
| Time of Departure | Male | Female |
| 12:00 AM to 4:59 AM | 4 (5.1%) | 3 (4.1%) |
| 5:00 AM to 5:29 AM | 0 (0.0%) | 7 (9.5%) |
| 5:30 AM to 5:59 AM | 2 (2.6%) | 5 (6.8%) |
| 6:00 AM to 6:29 AM | 5 (6.4%) | 13 (17.6%) |
| 6:30 AM to 6:59 AM | 33 (42.3%) | 2 (2.7%) |
| 7:00 AM to 7:29 AM | 0 (0.0%) | 2 (2.7%) |
| 7:30 AM to 7:59 AM | 6 (7.7%) | 6 (8.1%) |
| 8:00 AM to 8:29 AM | 11 (14.1%) | 23 (31.1%) |
| 8:30 AM to 8:59 AM | 0 (0.0%) | 0 (0.0%) |
| 9:00 AM to 9:59 AM | 0 (0.0%) | 0 (0.0%) |
| 10:00 AM to 10:59 AM | 0 (0.0%) | 0 (0.0%) |
| 11:00 AM to 11:59 AM | 0 (0.0%) | 4 (5.4%) |
| 12:00 PM to 3:59 PM | 8 (10.3%) | 6 (8.1%) |
| 4:00 PM to 11:59 PM | 9 (11.5%) | 3 (4.1%) |
| Total | 78 (100.0%) | 74 (100.0%) |
Housing Occupancy in Paxville
Occupancy by Ownership in Paxville
Of the total 136 dwellings in Paxville, owner-occupied units account for 87 (64.0%), while renter-occupied units make up 49 (36.0%).
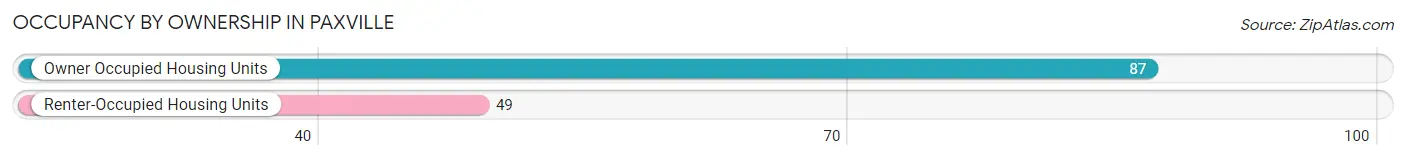
| Occupancy | # Housing Units | % Housing Units |
| Owner Occupied Housing Units | 87 | 64.0% |
| Renter-Occupied Housing Units | 49 | 36.0% |
| Total Occupied Housing Units | 136 | 100.0% |
Occupancy by Household Size in Paxville
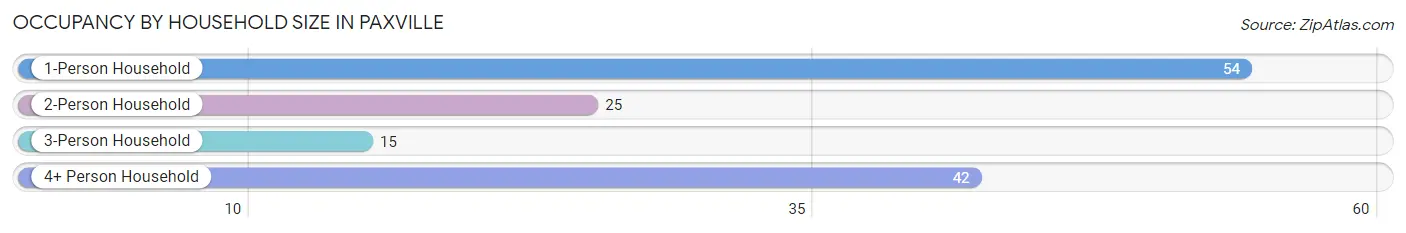
| Household Size | # Housing Units | % Housing Units |
| 1-Person Household | 54 | 39.7% |
| 2-Person Household | 25 | 18.4% |
| 3-Person Household | 15 | 11.0% |
| 4+ Person Household | 42 | 30.9% |
| Total Housing Units | 136 | 100.0% |
Occupancy by Ownership by Household Size in Paxville
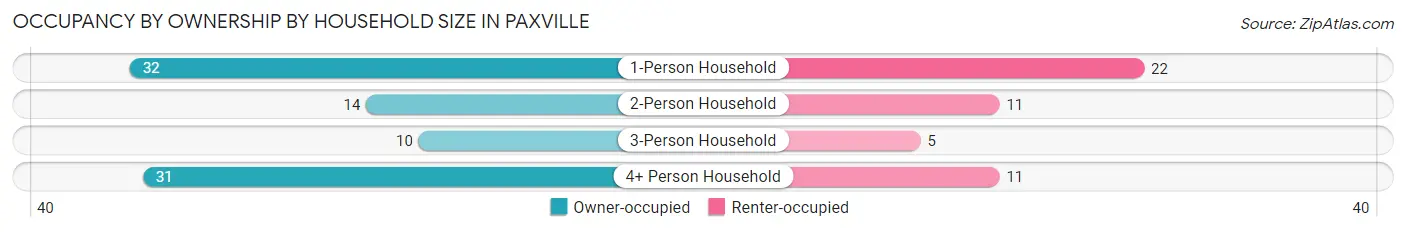
| Household Size | Owner-occupied | Renter-occupied |
| 1-Person Household | 32 (59.3%) | 22 (40.7%) |
| 2-Person Household | 14 (56.0%) | 11 (44.0%) |
| 3-Person Household | 10 (66.7%) | 5 (33.3%) |
| 4+ Person Household | 31 (73.8%) | 11 (26.2%) |
| Total Housing Units | 87 (64.0%) | 49 (36.0%) |
Occupancy by Educational Attainment in Paxville
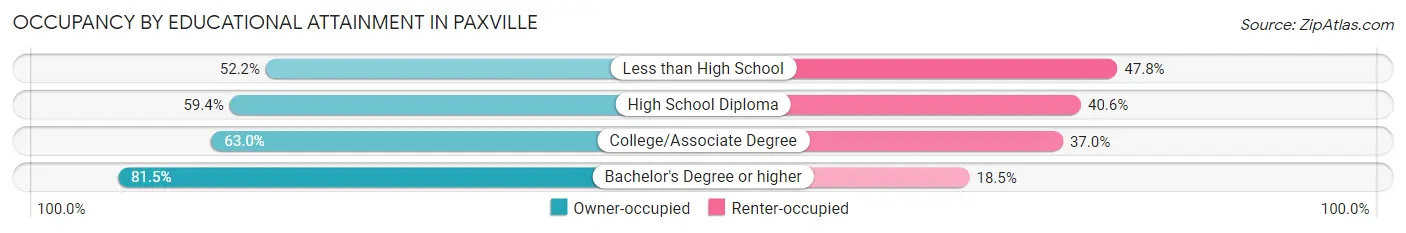
| Household Size | Owner-occupied | Renter-occupied |
| Less than High School | 12 (52.2%) | 11 (47.8%) |
| High School Diploma | 19 (59.4%) | 13 (40.6%) |
| College/Associate Degree | 34 (63.0%) | 20 (37.0%) |
| Bachelor's Degree or higher | 22 (81.5%) | 5 (18.5%) |
Occupancy by Age of Householder in Paxville
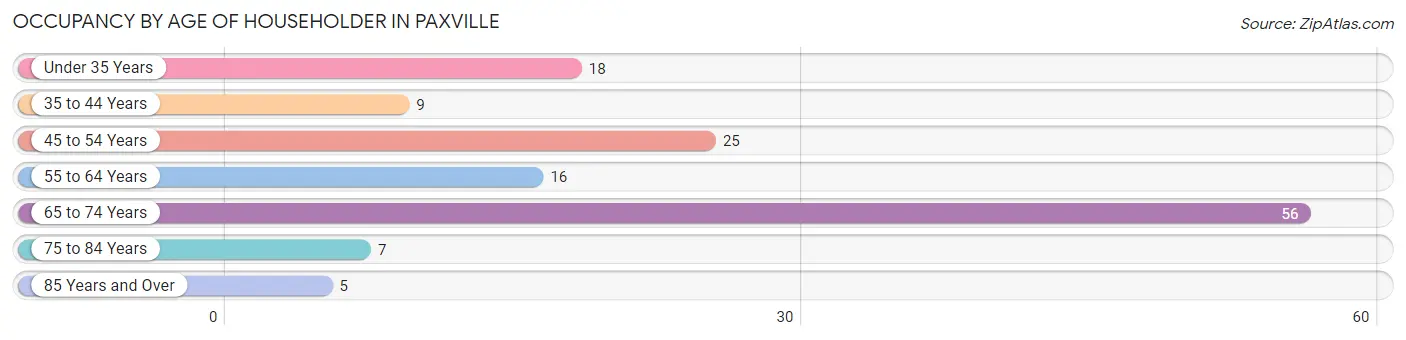
| Age Bracket | # Households | % Households |
| Under 35 Years | 18 | 13.2% |
| 35 to 44 Years | 9 | 6.6% |
| 45 to 54 Years | 25 | 18.4% |
| 55 to 64 Years | 16 | 11.8% |
| 65 to 74 Years | 56 | 41.2% |
| 75 to 84 Years | 7 | 5.1% |
| 85 Years and Over | 5 | 3.7% |
| Total | 136 | 100.0% |
Housing Finances in Paxville
Median Income by Occupancy in Paxville
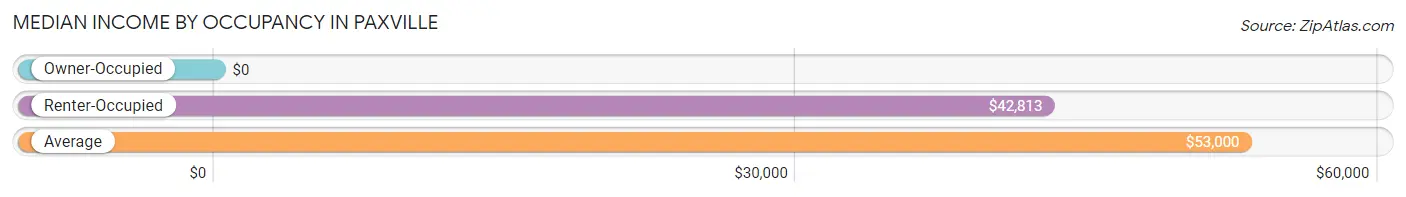
| Occupancy Type | # Households | Median Income |
| Owner-Occupied | 87 (64.0%) | $0 |
| Renter-Occupied | 49 (36.0%) | $42,813 |
| Average | 136 (100.0%) | $53,000 |
Occupancy by Householder Income Bracket in Paxville
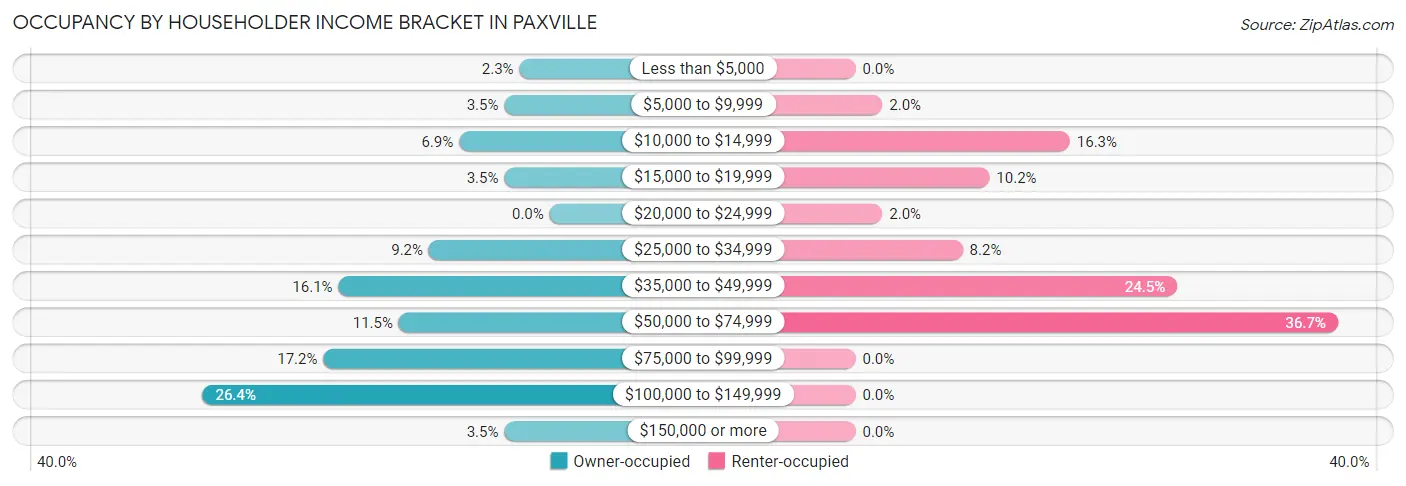
| Income Bracket | Owner-occupied | Renter-occupied |
| Less than $5,000 | 2 (2.3%) | 0 (0.0%) |
| $5,000 to $9,999 | 3 (3.5%) | 1 (2.0%) |
| $10,000 to $14,999 | 6 (6.9%) | 8 (16.3%) |
| $15,000 to $19,999 | 3 (3.5%) | 5 (10.2%) |
| $20,000 to $24,999 | 0 (0.0%) | 1 (2.0%) |
| $25,000 to $34,999 | 8 (9.2%) | 4 (8.2%) |
| $35,000 to $49,999 | 14 (16.1%) | 12 (24.5%) |
| $50,000 to $74,999 | 10 (11.5%) | 18 (36.7%) |
| $75,000 to $99,999 | 15 (17.2%) | 0 (0.0%) |
| $100,000 to $149,999 | 23 (26.4%) | 0 (0.0%) |
| $150,000 or more | 3 (3.5%) | 0 (0.0%) |
| Total | 87 (100.0%) | 49 (100.0%) |
Monthly Housing Cost Tiers in Paxville
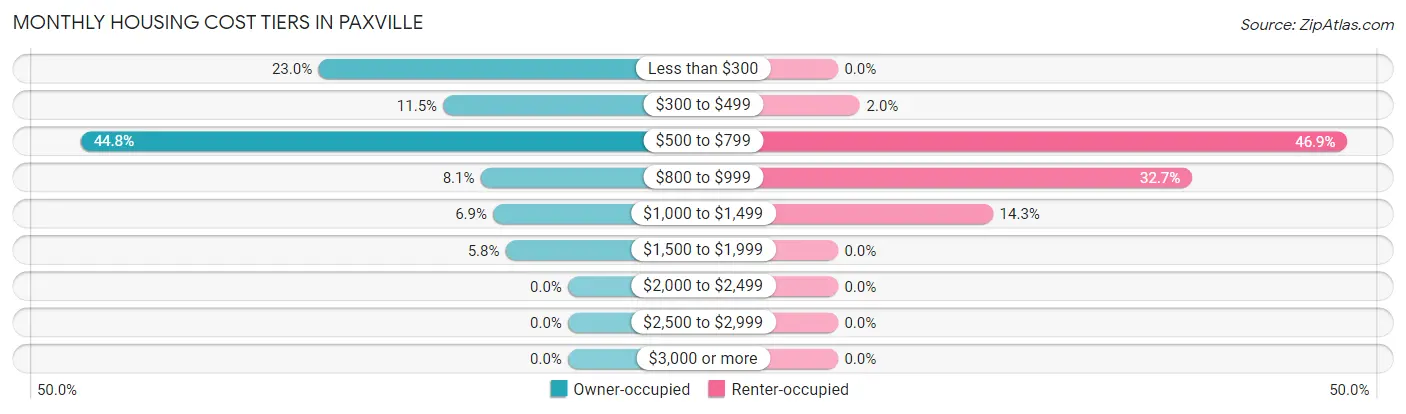
| Monthly Cost | Owner-occupied | Renter-occupied |
| Less than $300 | 20 (23.0%) | 0 (0.0%) |
| $300 to $499 | 10 (11.5%) | 1 (2.0%) |
| $500 to $799 | 39 (44.8%) | 23 (46.9%) |
| $800 to $999 | 7 (8.1%) | 16 (32.7%) |
| $1,000 to $1,499 | 6 (6.9%) | 7 (14.3%) |
| $1,500 to $1,999 | 5 (5.8%) | 0 (0.0%) |
| $2,000 to $2,499 | 0 (0.0%) | 0 (0.0%) |
| $2,500 to $2,999 | 0 (0.0%) | 0 (0.0%) |
| $3,000 or more | 0 (0.0%) | 0 (0.0%) |
| Total | 87 (100.0%) | 49 (100.0%) |
Physical Housing Characteristics in Paxville
Housing Structures in Paxville
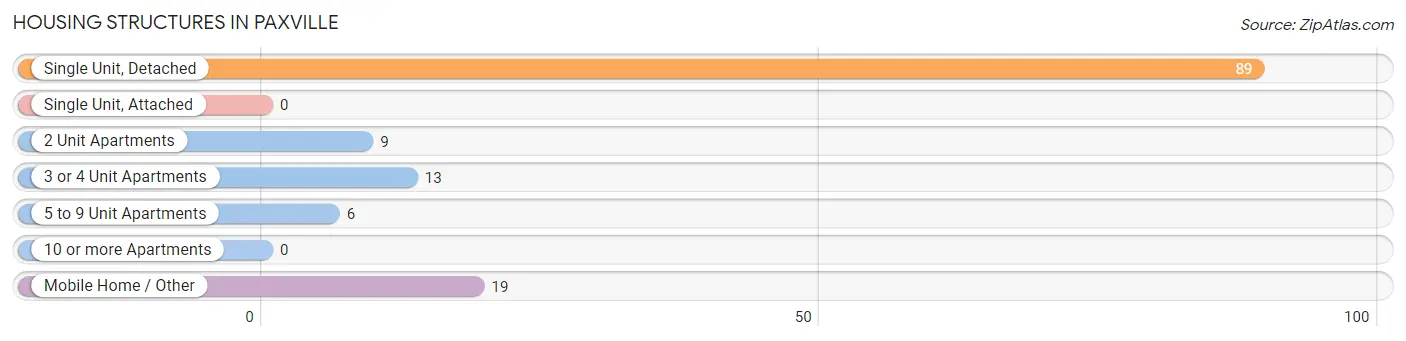
| Structure Type | # Housing Units | % Housing Units |
| Single Unit, Detached | 89 | 65.4% |
| Single Unit, Attached | 0 | 0.0% |
| 2 Unit Apartments | 9 | 6.6% |
| 3 or 4 Unit Apartments | 13 | 9.6% |
| 5 to 9 Unit Apartments | 6 | 4.4% |
| 10 or more Apartments | 0 | 0.0% |
| Mobile Home / Other | 19 | 14.0% |
| Total | 136 | 100.0% |
Housing Structures by Occupancy in Paxville
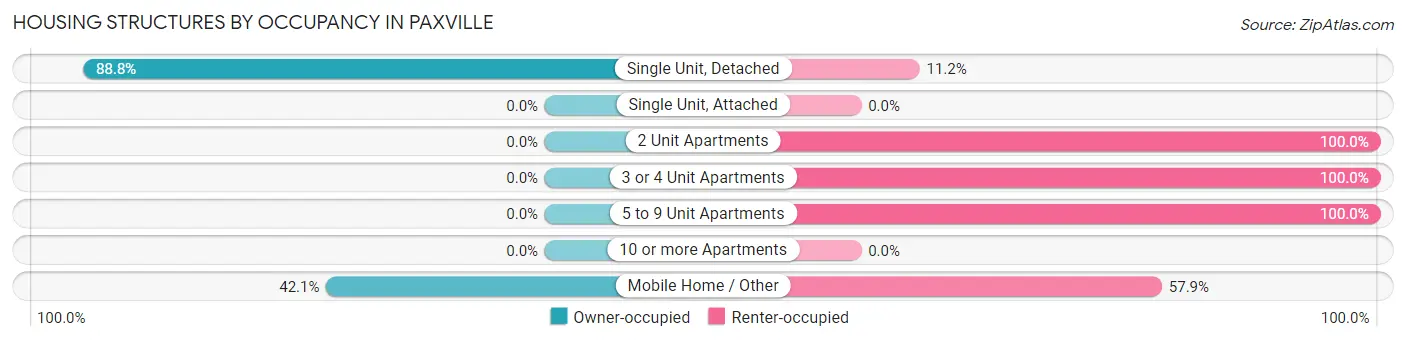
| Structure Type | Owner-occupied | Renter-occupied |
| Single Unit, Detached | 79 (88.8%) | 10 (11.2%) |
| Single Unit, Attached | 0 (0.0%) | 0 (0.0%) |
| 2 Unit Apartments | 0 (0.0%) | 9 (100.0%) |
| 3 or 4 Unit Apartments | 0 (0.0%) | 13 (100.0%) |
| 5 to 9 Unit Apartments | 0 (0.0%) | 6 (100.0%) |
| 10 or more Apartments | 0 (0.0%) | 0 (0.0%) |
| Mobile Home / Other | 8 (42.1%) | 11 (57.9%) |
| Total | 87 (64.0%) | 49 (36.0%) |
Housing Structures by Number of Rooms in Paxville
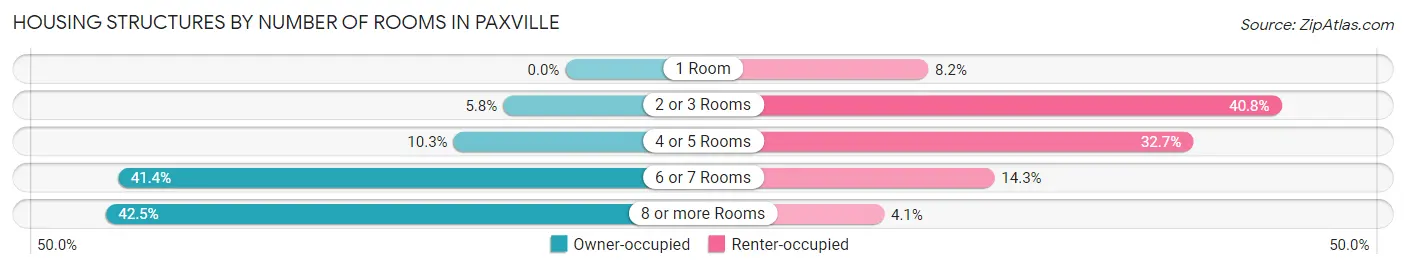
| Number of Rooms | Owner-occupied | Renter-occupied |
| 1 Room | 0 (0.0%) | 4 (8.2%) |
| 2 or 3 Rooms | 5 (5.8%) | 20 (40.8%) |
| 4 or 5 Rooms | 9 (10.3%) | 16 (32.7%) |
| 6 or 7 Rooms | 36 (41.4%) | 7 (14.3%) |
| 8 or more Rooms | 37 (42.5%) | 2 (4.1%) |
| Total | 87 (100.0%) | 49 (100.0%) |
Housing Structure by Heating Type in Paxville
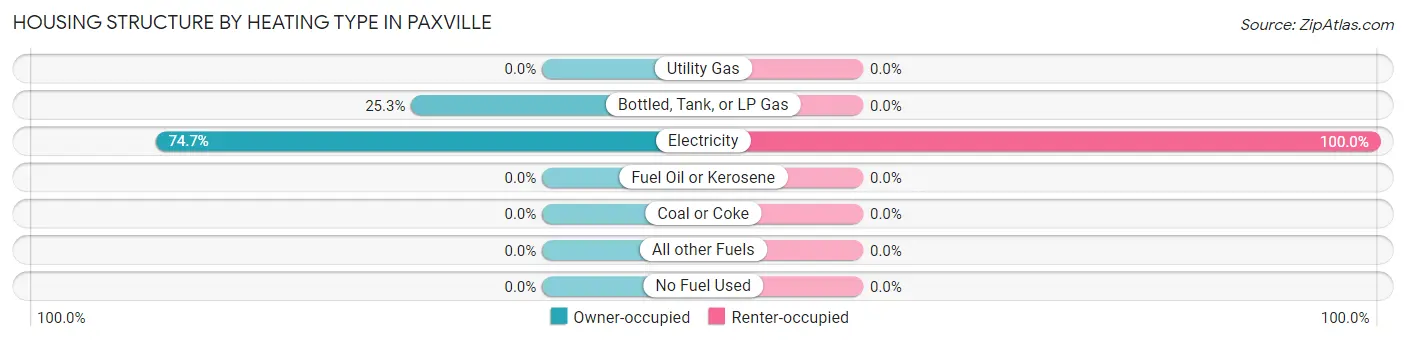
| Heating Type | Owner-occupied | Renter-occupied |
| Utility Gas | 0 (0.0%) | 0 (0.0%) |
| Bottled, Tank, or LP Gas | 22 (25.3%) | 0 (0.0%) |
| Electricity | 65 (74.7%) | 49 (100.0%) |
| Fuel Oil or Kerosene | 0 (0.0%) | 0 (0.0%) |
| Coal or Coke | 0 (0.0%) | 0 (0.0%) |
| All other Fuels | 0 (0.0%) | 0 (0.0%) |
| No Fuel Used | 0 (0.0%) | 0 (0.0%) |
| Total | 87 (100.0%) | 49 (100.0%) |
Household Vehicle Usage in Paxville
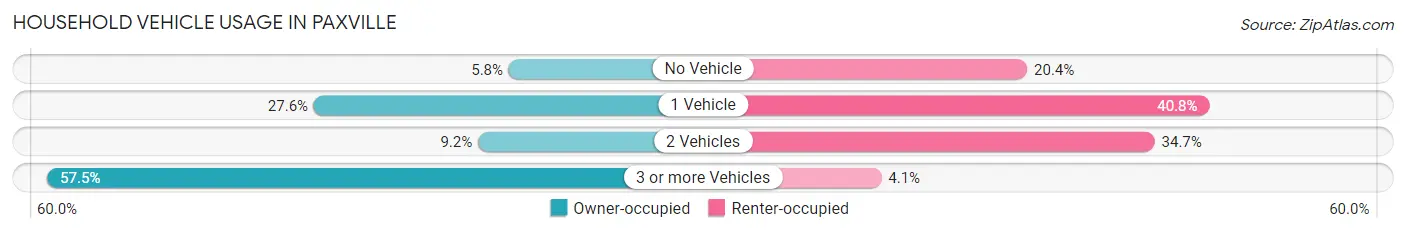
| Vehicles per Household | Owner-occupied | Renter-occupied |
| No Vehicle | 5 (5.8%) | 10 (20.4%) |
| 1 Vehicle | 24 (27.6%) | 20 (40.8%) |
| 2 Vehicles | 8 (9.2%) | 17 (34.7%) |
| 3 or more Vehicles | 50 (57.5%) | 2 (4.1%) |
| Total | 87 (100.0%) | 49 (100.0%) |
Real Estate & Mortgages in Paxville
Real Estate and Mortgage Overview in Paxville
| Characteristic | Without Mortgage | With Mortgage |
| Housing Units | 62 | 25 |
| Median Property Value | $180,600 | $181,300 |
| Median Household Income | $76,250 | $3 |
| Monthly Housing Costs | $504 | $0 |
| Real Estate Taxes | $661 | $2 |
Property Value by Mortgage Status in Paxville
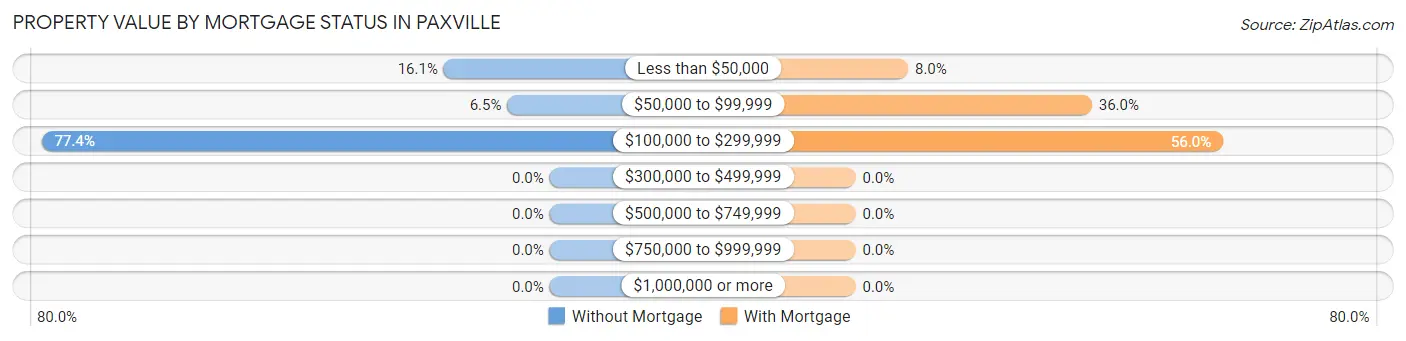
| Property Value | Without Mortgage | With Mortgage |
| Less than $50,000 | 10 (16.1%) | 2 (8.0%) |
| $50,000 to $99,999 | 4 (6.5%) | 9 (36.0%) |
| $100,000 to $299,999 | 48 (77.4%) | 14 (56.0%) |
| $300,000 to $499,999 | 0 (0.0%) | 0 (0.0%) |
| $500,000 to $749,999 | 0 (0.0%) | 0 (0.0%) |
| $750,000 to $999,999 | 0 (0.0%) | 0 (0.0%) |
| $1,000,000 or more | 0 (0.0%) | 0 (0.0%) |
| Total | 62 (100.0%) | 25 (100.0%) |
Household Income by Mortgage Status in Paxville
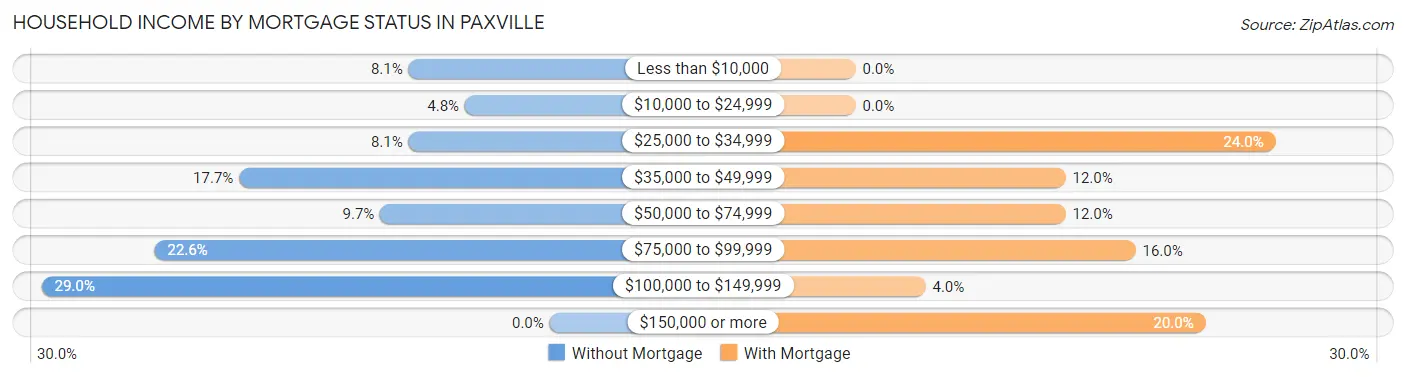
| Household Income | Without Mortgage | With Mortgage |
| Less than $10,000 | 5 (8.1%) | 0 (0.0%) |
| $10,000 to $24,999 | 3 (4.8%) | 0 (0.0%) |
| $25,000 to $34,999 | 5 (8.1%) | 6 (24.0%) |
| $35,000 to $49,999 | 11 (17.7%) | 3 (12.0%) |
| $50,000 to $74,999 | 6 (9.7%) | 3 (12.0%) |
| $75,000 to $99,999 | 14 (22.6%) | 4 (16.0%) |
| $100,000 to $149,999 | 18 (29.0%) | 1 (4.0%) |
| $150,000 or more | 0 (0.0%) | 5 (20.0%) |
| Total | 62 (100.0%) | 25 (100.0%) |
Property Value to Household Income Ratio in Paxville
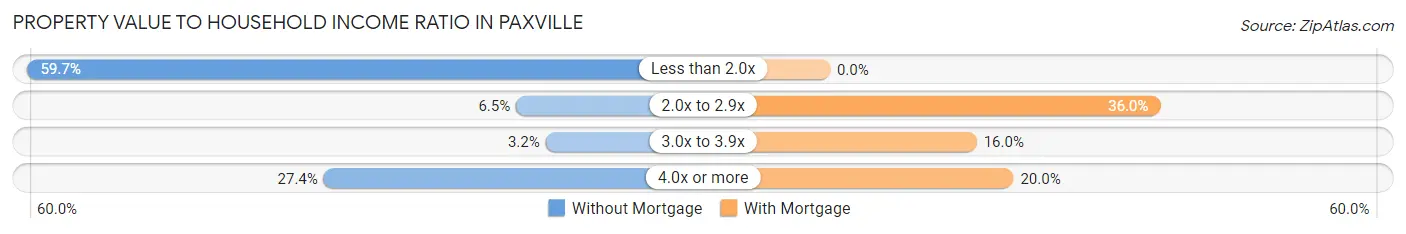
| Value-to-Income Ratio | Without Mortgage | With Mortgage |
| Less than 2.0x | 37 (59.7%) | 0 (0.0%) |
| 2.0x to 2.9x | 4 (6.5%) | 9 (36.0%) |
| 3.0x to 3.9x | 2 (3.2%) | 4 (16.0%) |
| 4.0x or more | 17 (27.4%) | 5 (20.0%) |
| Total | 62 (100.0%) | 25 (100.0%) |
Real Estate Taxes by Mortgage Status in Paxville
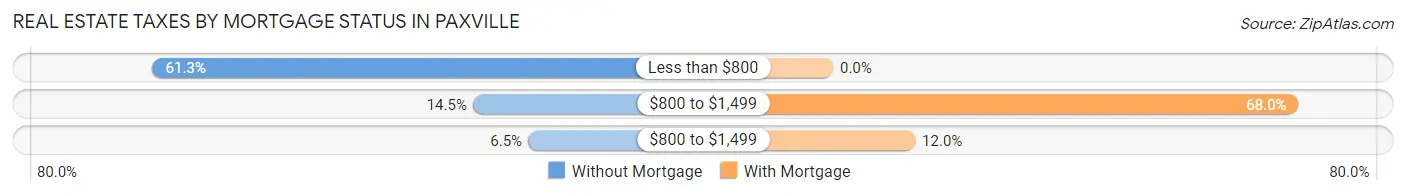
| Property Taxes | Without Mortgage | With Mortgage |
| Less than $800 | 38 (61.3%) | 0 (0.0%) |
| $800 to $1,499 | 9 (14.5%) | 17 (68.0%) |
| $800 to $1,499 | 4 (6.5%) | 3 (12.0%) |
| Total | 62 (100.0%) | 25 (100.0%) |
Health & Disability in Paxville
Health Insurance Coverage by Age in Paxville
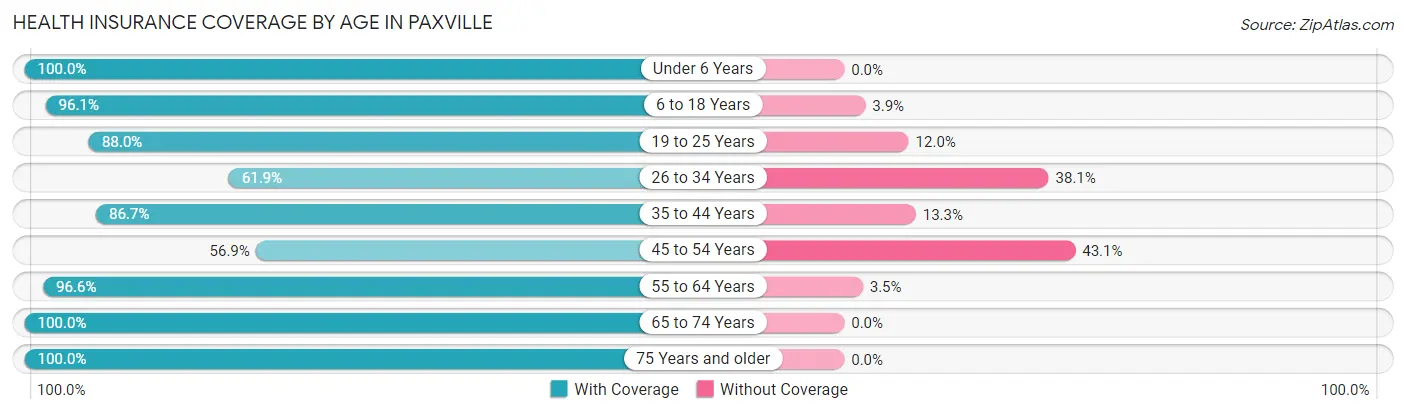
| Age Bracket | With Coverage | Without Coverage |
| Under 6 Years | 19 (100.0%) | 0 (0.0%) |
| 6 to 18 Years | 49 (96.1%) | 2 (3.9%) |
| 19 to 25 Years | 44 (88.0%) | 6 (12.0%) |
| 26 to 34 Years | 13 (61.9%) | 8 (38.1%) |
| 35 to 44 Years | 13 (86.7%) | 2 (13.3%) |
| 45 to 54 Years | 37 (56.9%) | 28 (43.1%) |
| 55 to 64 Years | 28 (96.6%) | 1 (3.5%) |
| 65 to 74 Years | 71 (100.0%) | 0 (0.0%) |
| 75 Years and older | 21 (100.0%) | 0 (0.0%) |
| Total | 295 (86.3%) | 47 (13.7%) |
Health Insurance Coverage by Citizenship Status in Paxville
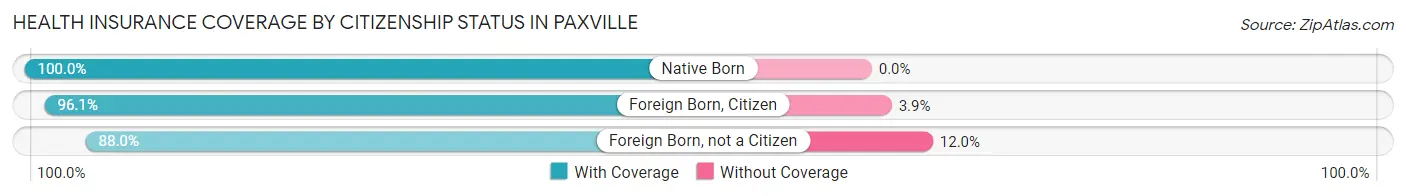
| Citizenship Status | With Coverage | Without Coverage |
| Native Born | 19 (100.0%) | 0 (0.0%) |
| Foreign Born, Citizen | 49 (96.1%) | 2 (3.9%) |
| Foreign Born, not a Citizen | 44 (88.0%) | 6 (12.0%) |
Health Insurance Coverage by Household Income in Paxville
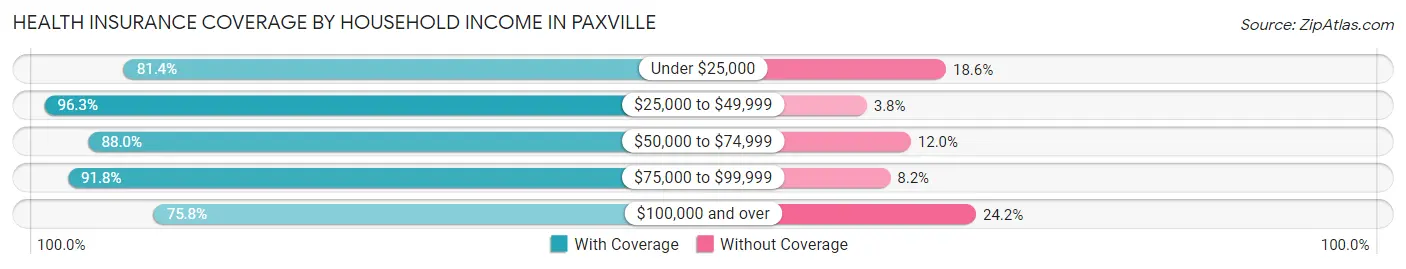
| Household Income | With Coverage | Without Coverage |
| Under $25,000 | 35 (81.4%) | 8 (18.6%) |
| $25,000 to $49,999 | 77 (96.3%) | 3 (3.7%) |
| $50,000 to $74,999 | 66 (88.0%) | 9 (12.0%) |
| $75,000 to $99,999 | 45 (91.8%) | 4 (8.2%) |
| $100,000 and over | 72 (75.8%) | 23 (24.2%) |
Public vs Private Health Insurance Coverage by Age in Paxville
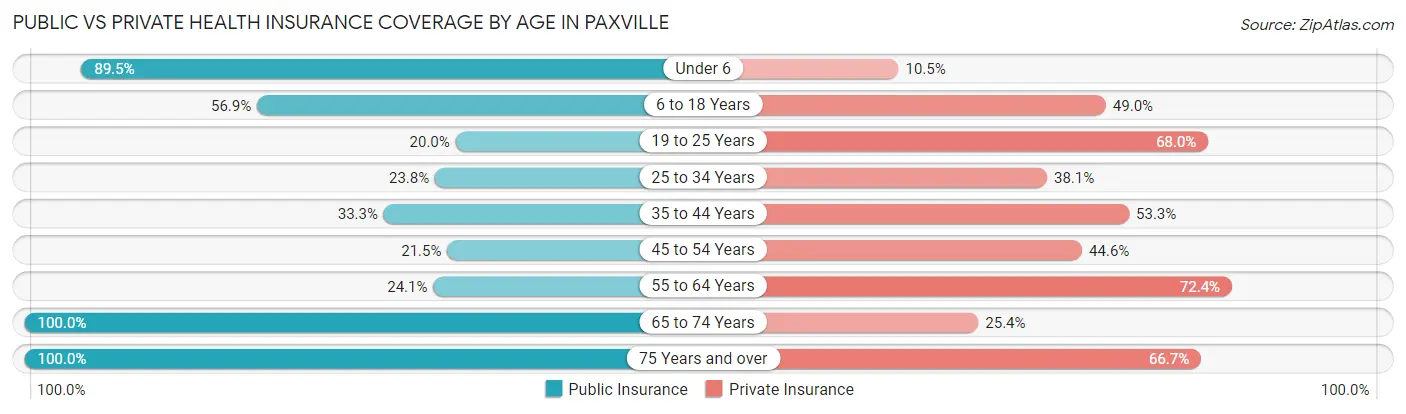
| Age Bracket | Public Insurance | Private Insurance |
| Under 6 | 17 (89.5%) | 2 (10.5%) |
| 6 to 18 Years | 29 (56.9%) | 25 (49.0%) |
| 19 to 25 Years | 10 (20.0%) | 34 (68.0%) |
| 25 to 34 Years | 5 (23.8%) | 8 (38.1%) |
| 35 to 44 Years | 5 (33.3%) | 8 (53.3%) |
| 45 to 54 Years | 14 (21.5%) | 29 (44.6%) |
| 55 to 64 Years | 7 (24.1%) | 21 (72.4%) |
| 65 to 74 Years | 71 (100.0%) | 18 (25.4%) |
| 75 Years and over | 21 (100.0%) | 14 (66.7%) |
| Total | 179 (52.3%) | 159 (46.5%) |
Disability Status by Sex by Age in Paxville
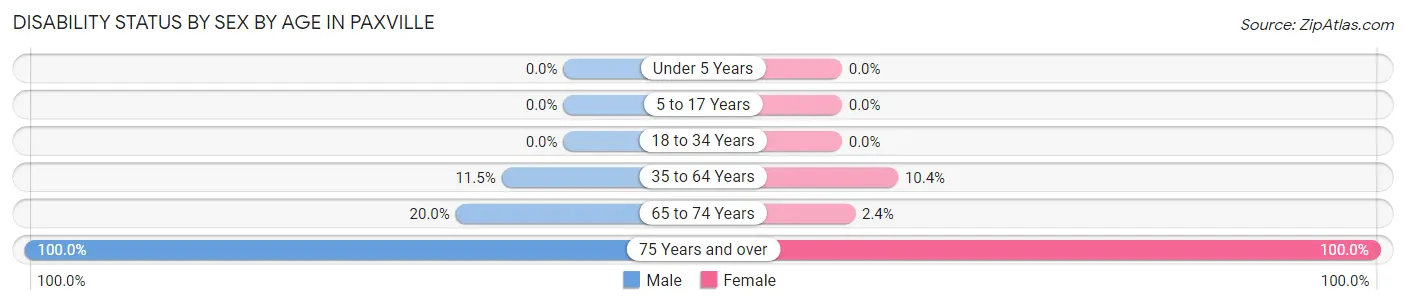
| Age Bracket | Male | Female |
| Under 5 Years | 0 (0.0%) | 0 (0.0%) |
| 5 to 17 Years | 0 (0.0%) | 0 (0.0%) |
| 18 to 34 Years | 0 (0.0%) | 0 (0.0%) |
| 35 to 64 Years | 7 (11.5%) | 5 (10.4%) |
| 65 to 74 Years | 6 (20.0%) | 1 (2.4%) |
| 75 Years and over | 9 (100.0%) | 12 (100.0%) |
Disability Class by Sex by Age in Paxville
Disability Class: Hearing Difficulty
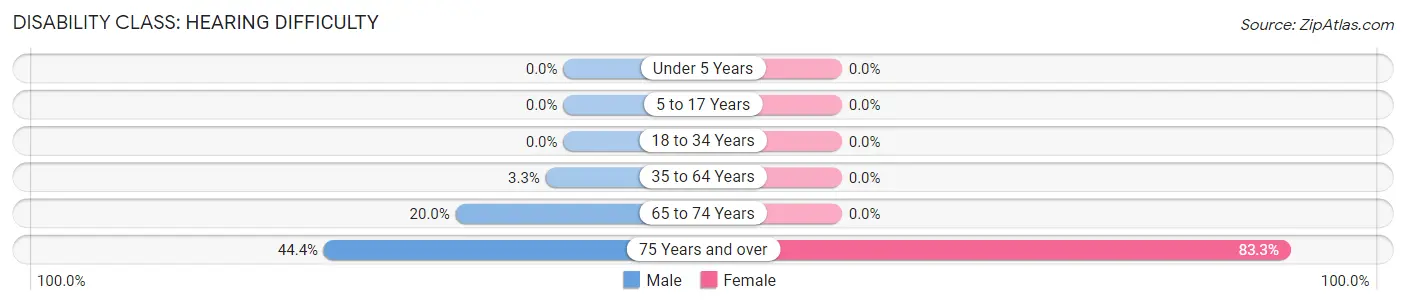
| Age Bracket | Male | Female |
| Under 5 Years | 0 (0.0%) | 0 (0.0%) |
| 5 to 17 Years | 0 (0.0%) | 0 (0.0%) |
| 18 to 34 Years | 0 (0.0%) | 0 (0.0%) |
| 35 to 64 Years | 2 (3.3%) | 0 (0.0%) |
| 65 to 74 Years | 6 (20.0%) | 0 (0.0%) |
| 75 Years and over | 4 (44.4%) | 10 (83.3%) |
Disability Class: Vision Difficulty
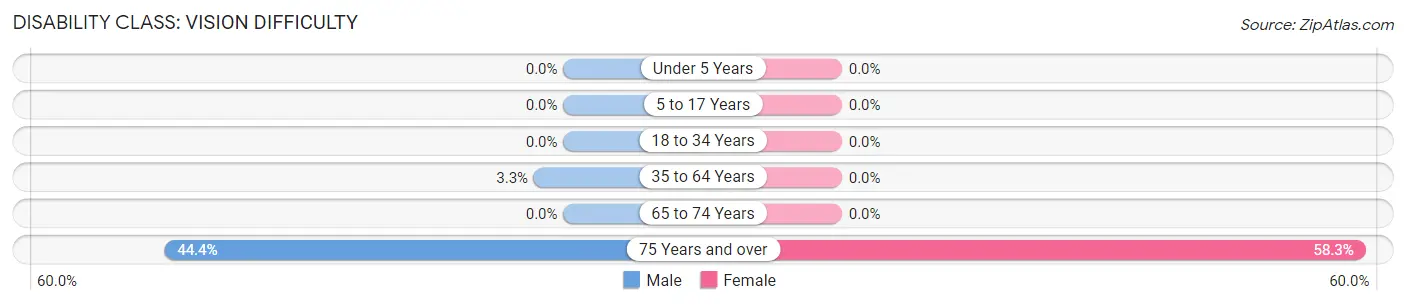
| Age Bracket | Male | Female |
| Under 5 Years | 0 (0.0%) | 0 (0.0%) |
| 5 to 17 Years | 0 (0.0%) | 0 (0.0%) |
| 18 to 34 Years | 0 (0.0%) | 0 (0.0%) |
| 35 to 64 Years | 2 (3.3%) | 0 (0.0%) |
| 65 to 74 Years | 0 (0.0%) | 0 (0.0%) |
| 75 Years and over | 4 (44.4%) | 7 (58.3%) |
Disability Class: Cognitive Difficulty
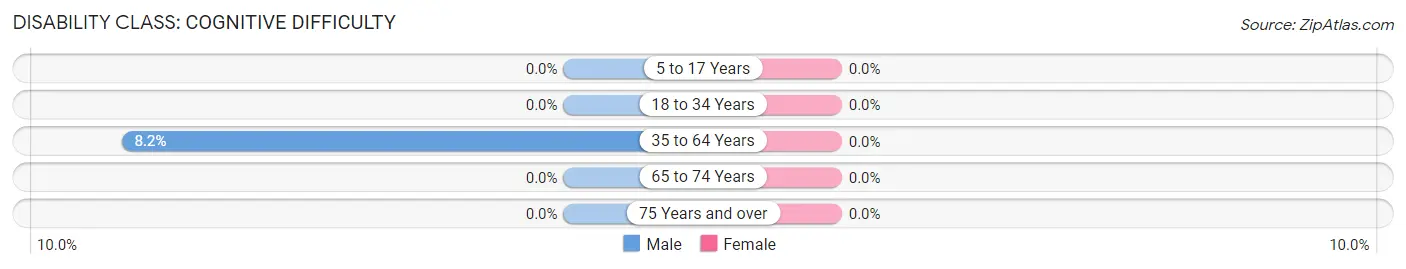
| Age Bracket | Male | Female |
| 5 to 17 Years | 0 (0.0%) | 0 (0.0%) |
| 18 to 34 Years | 0 (0.0%) | 0 (0.0%) |
| 35 to 64 Years | 5 (8.2%) | 0 (0.0%) |
| 65 to 74 Years | 0 (0.0%) | 0 (0.0%) |
| 75 Years and over | 0 (0.0%) | 0 (0.0%) |
Disability Class: Ambulatory Difficulty
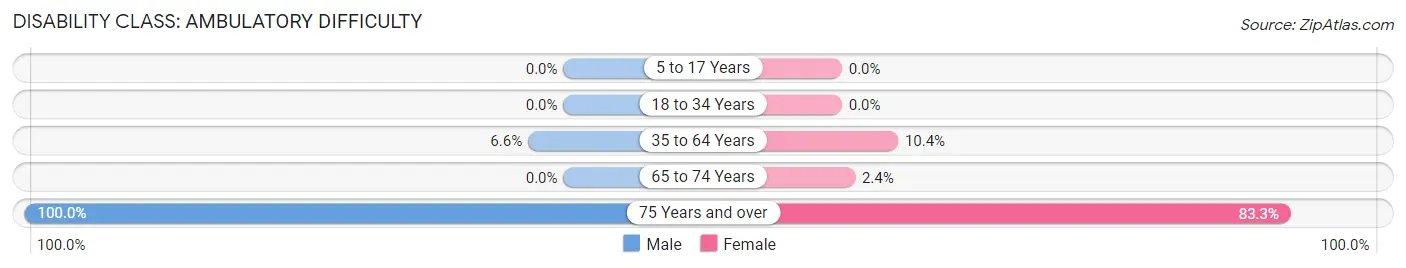
| Age Bracket | Male | Female |
| 5 to 17 Years | 0 (0.0%) | 0 (0.0%) |
| 18 to 34 Years | 0 (0.0%) | 0 (0.0%) |
| 35 to 64 Years | 4 (6.6%) | 5 (10.4%) |
| 65 to 74 Years | 0 (0.0%) | 1 (2.4%) |
| 75 Years and over | 9 (100.0%) | 10 (83.3%) |
Disability Class: Self-Care Difficulty
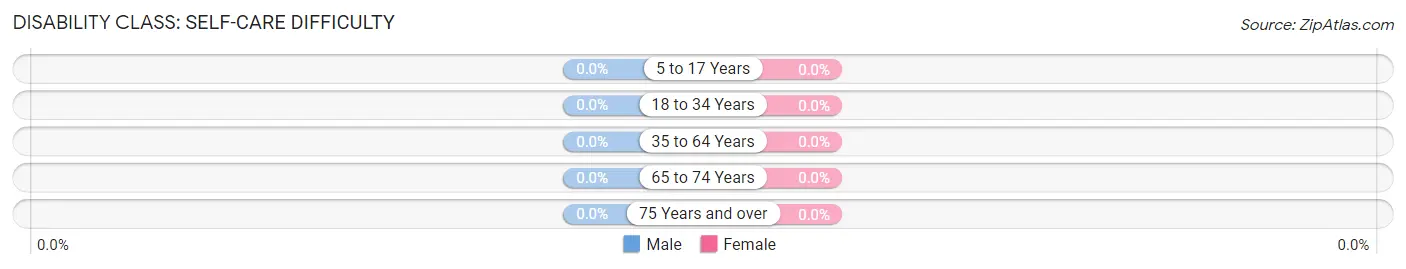
| Age Bracket | Male | Female |
| 5 to 17 Years | 0 (0.0%) | 0 (0.0%) |
| 18 to 34 Years | 0 (0.0%) | 0 (0.0%) |
| 35 to 64 Years | 0 (0.0%) | 0 (0.0%) |
| 65 to 74 Years | 0 (0.0%) | 0 (0.0%) |
| 75 Years and over | 0 (0.0%) | 0 (0.0%) |
Technology Access in Paxville
Computing Device Access in Paxville
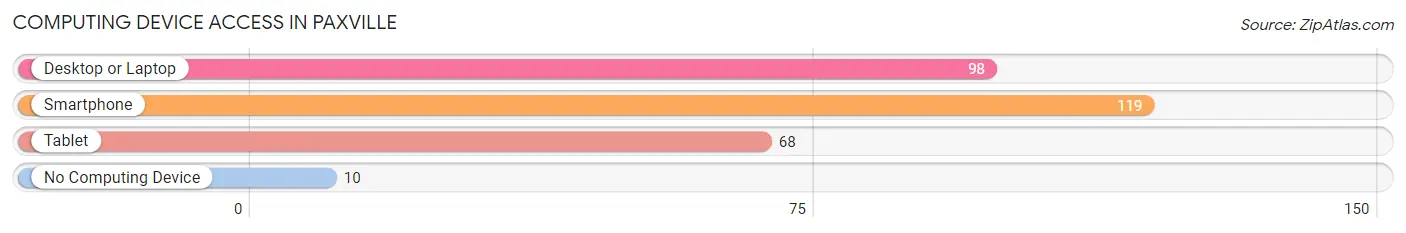
| Device Type | # Households | % Households |
| Desktop or Laptop | 98 | 72.1% |
| Smartphone | 119 | 87.5% |
| Tablet | 68 | 50.0% |
| No Computing Device | 10 | 7.3% |
| Total | 136 | 100.0% |
Internet Access in Paxville
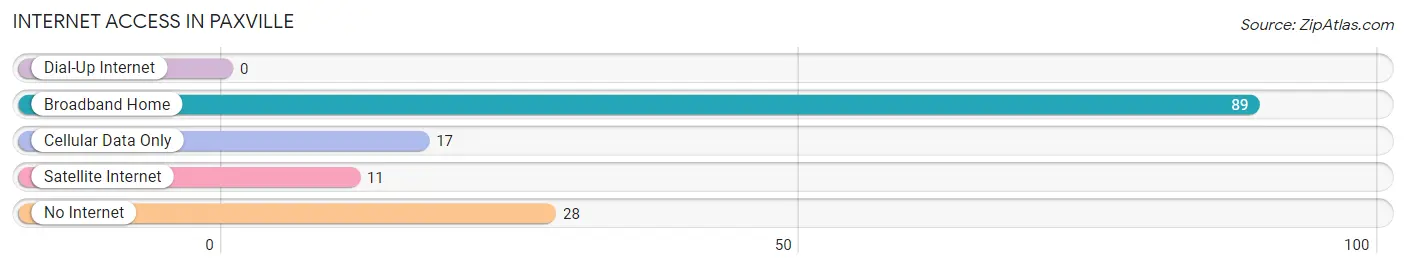
| Internet Type | # Households | % Households |
| Dial-Up Internet | 0 | 0.0% |
| Broadband Home | 89 | 65.4% |
| Cellular Data Only | 17 | 12.5% |
| Satellite Internet | 11 | 8.1% |
| No Internet | 28 | 20.6% |
| Total | 136 | 100.0% |
Paxville Summary
Paxville, South Carolina is a small town located in Orangeburg County, South Carolina. It is situated on the banks of the Edisto River, approximately 20 miles south of Orangeburg. The town was founded in 1820 and named after the Paxville family, who were among the first settlers in the area.
History
Paxville was founded in 1820 by the Paxville family, who were among the first settlers in the area. The town was originally known as Paxville Crossroads, as it was located at the intersection of two major roads. The town was officially incorporated in 1887.
In the late 19th century, Paxville was a thriving agricultural community, with cotton, corn, and tobacco being the main crops. The town also had a sawmill, gristmill, and a cotton gin.
In the early 20th century, Paxville began to experience a decline in population due to the Great Depression and the mechanization of farming. The town was also affected by the Civil Rights Movement, as many African Americans moved away from the area in search of better opportunities.
Geography
Paxville is located in Orangeburg County, South Carolina. It is situated on the banks of the Edisto River, approximately 20 miles south of Orangeburg. The town is located in the Piedmont region of South Carolina, which is characterized by rolling hills and flat plains. The town is surrounded by forests and wetlands, and is home to a variety of wildlife, including deer, wild turkeys, and bald eagles.
The climate in Paxville is humid subtropical, with hot, humid summers and mild winters. The average annual temperature is around 70 degrees Fahrenheit, and the average annual precipitation is around 50 inches.
Economy
The economy of Paxville is largely based on agriculture. The town is home to several farms, which produce a variety of crops, including cotton, corn, soybeans, and tobacco. The town also has a sawmill, gristmill, and a cotton gin.
In recent years, Paxville has seen an increase in tourism, as the town is located near several popular attractions, such as the Edisto River, the Santee National Wildlife Refuge, and the Congaree National Park. The town also has several restaurants, shops, and other businesses that cater to tourists.
Demographics
As of the 2010 census, the population of Paxville was 1,845. The racial makeup of the town was 79.3% White, 17.7% African American, 0.3% Native American, 0.2% Asian, 0.1% Pacific Islander, and 2.4% from other races. The median household income was $30,938, and the median family income was $37,813.
Paxville is a small, rural town with a close-knit community. The town is home to several churches, and the residents are very active in their local government. The town is also home to several schools, including Paxville Elementary School, Paxville Middle School, and Paxville High School.
Common Questions
What is Per Capita Income in Paxville?
Per Capita income in Paxville is $26,765.
What is the Median Household income in Paxville?
Median Household Income in Paxville is $53,000.
What is Inequality or Gini Index in Paxville?
Inequality or Gini Index in Paxville is 0.40.
What is the Total Population of Paxville?
Total Population of Paxville is 342.
What is the Total Male Population of Paxville?
Total Male Population of Paxville is 174.
What is the Total Female Population of Paxville?
Total Female Population of Paxville is 168.
What is the Ratio of Males per 100 Females in Paxville?
There are 103.57 Males per 100 Females in Paxville.
What is the Ratio of Females per 100 Males in Paxville?
There are 96.55 Females per 100 Males in Paxville.
What is the Median Population Age in Paxville?
Median Population Age in Paxville is 45.6 Years.
What is the Average Family Size in Paxville
Average Family Size in Paxville is 3.5 People.
What is the Average Household Size in Paxville
Average Household Size in Paxville is 2.5 People.
How Large is the Labor Force in Paxville?
There are 182 People in the Labor Forcein in Paxville.
What is the Percentage of People in the Labor Force in Paxville?
62.5% of People are in the Labor Force in Paxville.
What is the Unemployment Rate in Paxville?
Unemployment Rate in Paxville is 6.6%.