Belton, SC Map & Demographics
Belton Map
Belton Overview
$31,283
PER CAPITA INCOME
$67,990
AVG FAMILY INCOME
$46,713
AVG HOUSEHOLD INCOME
53.8%
WAGE / INCOME GAP [ % ]
46.2¢/ $1
WAGE / INCOME GAP [ $ ]
0.53
INEQUALITY / GINI INDEX
4,357
TOTAL POPULATION
1,819
MALE POPULATION
2,538
FEMALE POPULATION
71.67
MALES / 100 FEMALES
139.53
FEMALES / 100 MALES
34.9
MEDIAN AGE
3.5
AVG FAMILY SIZE
2.7
AVG HOUSEHOLD SIZE
2,170
LABOR FORCE [ PEOPLE ]
66.8%
PERCENT IN LABOR FORCE
5.0%
UNEMPLOYMENT RATE
Belton Zip Codes
Belton Area Codes
Income in Belton
Income Overview in Belton
Per Capita Income in Belton is $31,283, while median incomes of families and households are $67,990 and $46,713 respectively.
| Characteristic | Number | Measure |
| Per Capita Income | 4,357 | $31,283 |
| Median Family Income | 1,072 | $67,990 |
| Mean Family Income | 1,072 | $96,740 |
| Median Household Income | 1,617 | $46,713 |
| Mean Household Income | 1,617 | $76,516 |
| Income Deficit | 1,072 | $0 |
| Wage / Income Gap (%) | 4,357 | 53.76% |
| Wage / Income Gap ($) | 4,357 | 46.24¢ per $1 |
| Gini / Inequality Index | 4,357 | 0.53 |
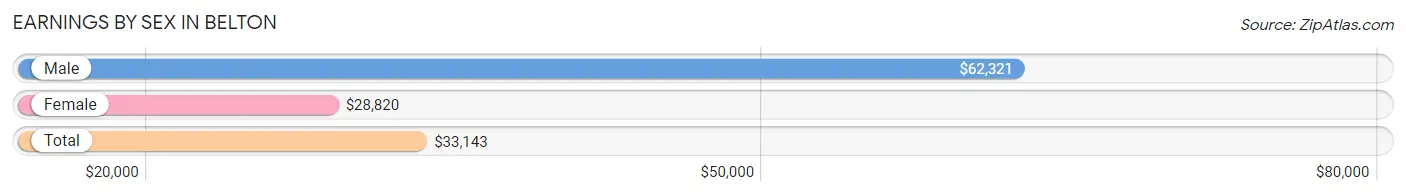
Earnings by Sex in Belton
Average Earnings in Belton are $33,143, $62,321 for men and $28,820 for women, a difference of 53.8%.
| Sex | Number | Average Earnings |
| Male | 939 (42.2%) | $62,321 |
| Female | 1,287 (57.8%) | $28,820 |
| Total | 2,226 (100.0%) | $33,143 |
Earnings by Sex by Income Bracket in Belton
The most common earnings brackets in Belton are $75,000 to $99,999 for men (206 | 21.9%) and $25,000 to $29,999 for women (349 | 27.1%).
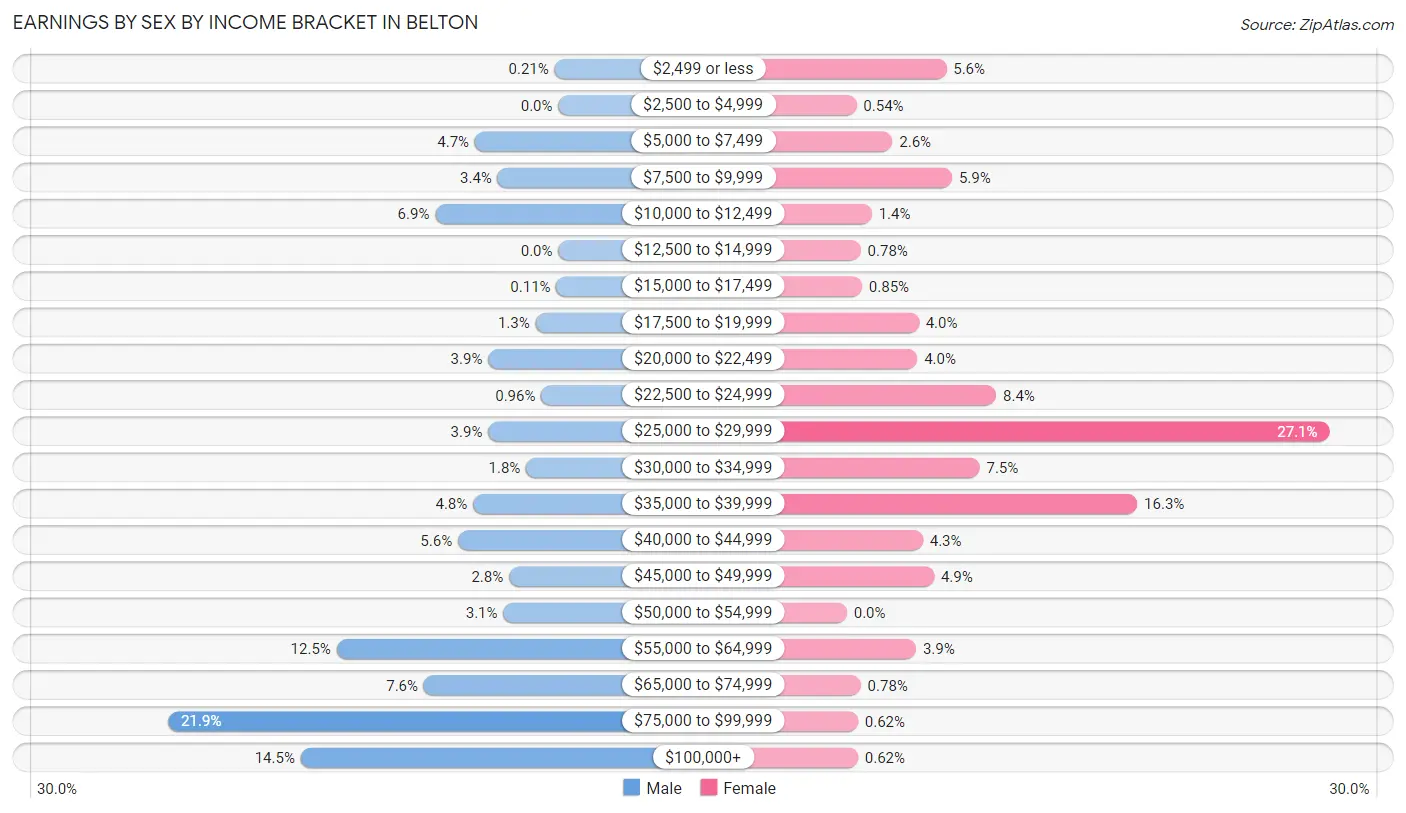
| Income | Male | Female |
| $2,499 or less | 2 (0.2%) | 72 (5.6%) |
| $2,500 to $4,999 | 0 (0.0%) | 7 (0.5%) |
| $5,000 to $7,499 | 44 (4.7%) | 33 (2.6%) |
| $7,500 to $9,999 | 32 (3.4%) | 76 (5.9%) |
| $10,000 to $12,499 | 65 (6.9%) | 18 (1.4%) |
| $12,500 to $14,999 | 0 (0.0%) | 10 (0.8%) |
| $15,000 to $17,499 | 1 (0.1%) | 11 (0.9%) |
| $17,500 to $19,999 | 12 (1.3%) | 52 (4.0%) |
| $20,000 to $22,499 | 37 (3.9%) | 51 (4.0%) |
| $22,500 to $24,999 | 9 (1.0%) | 108 (8.4%) |
| $25,000 to $29,999 | 37 (3.9%) | 349 (27.1%) |
| $30,000 to $34,999 | 17 (1.8%) | 96 (7.5%) |
| $35,000 to $39,999 | 45 (4.8%) | 210 (16.3%) |
| $40,000 to $44,999 | 53 (5.6%) | 55 (4.3%) |
| $45,000 to $49,999 | 26 (2.8%) | 63 (4.9%) |
| $50,000 to $54,999 | 29 (3.1%) | 0 (0.0%) |
| $55,000 to $64,999 | 117 (12.5%) | 50 (3.9%) |
| $65,000 to $74,999 | 71 (7.6%) | 10 (0.8%) |
| $75,000 to $99,999 | 206 (21.9%) | 8 (0.6%) |
| $100,000+ | 136 (14.5%) | 8 (0.6%) |
| Total | 939 (100.0%) | 1,287 (100.0%) |
Earnings by Sex by Educational Attainment in Belton
Average earnings in Belton are $63,955 for men and $28,890 for women, a difference of 54.8%. Men with an educational attainment of high school diploma enjoy the highest average annual earnings of $79,073, while those with college or associate's degree education earn the least with $47,375. Women with an educational attainment of bachelor's degree earn the most with the average annual earnings of $38,750, while those with less than high school education have the smallest earnings of $14,375.
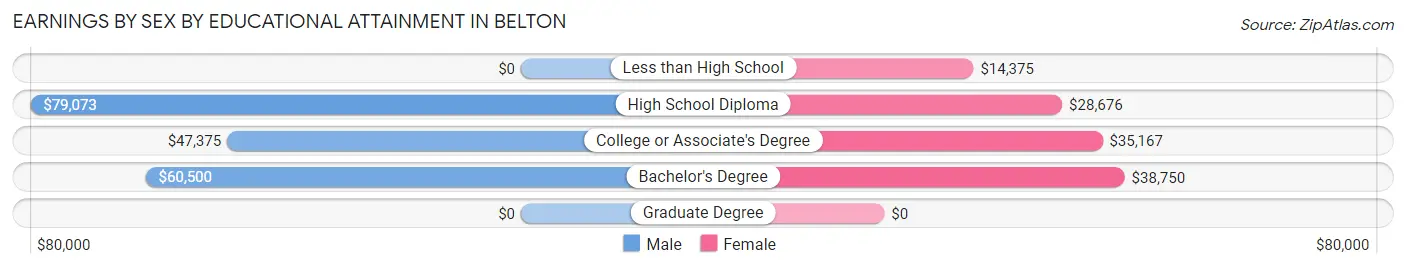
| Educational Attainment | Male Income | Female Income |
| Less than High School | - | - |
| High School Diploma | $79,073 | $28,676 |
| College or Associate's Degree | $47,375 | $35,167 |
| Bachelor's Degree | $60,500 | $38,750 |
| Graduate Degree | - | - |
| Total | $63,955 | $28,890 |
Family Income in Belton
Family Income Brackets in Belton
According to the Belton family income data, there are 215 families falling into the $50,000 to $74,999 income range, which is the most common income bracket and makes up 20.1% of all families.
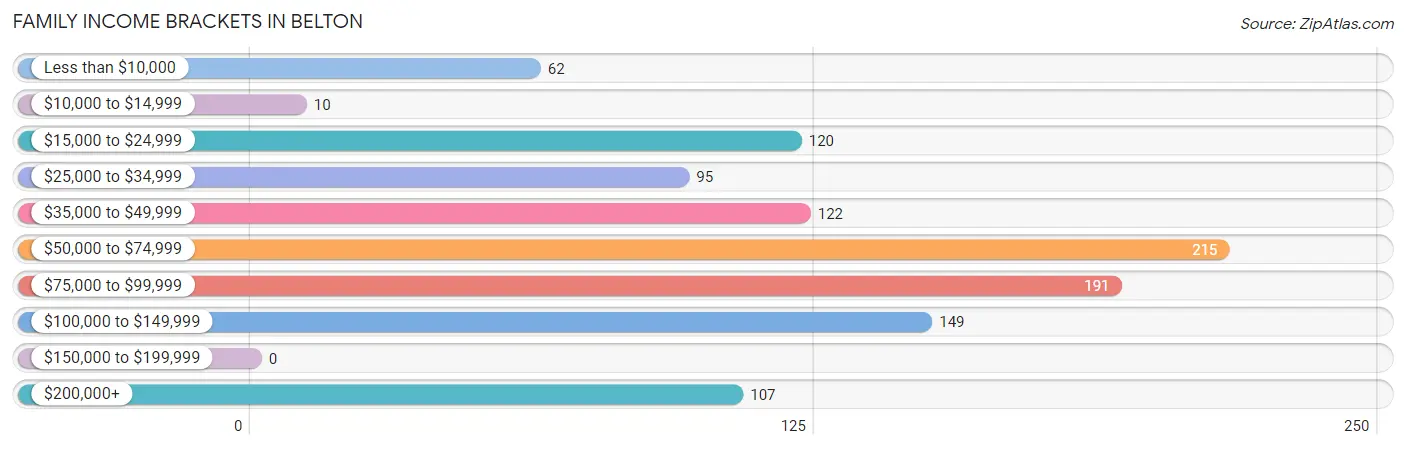
| Income Bracket | # Families | % Families |
| Less than $10,000 | 62 | 5.8% |
| $10,000 to $14,999 | 10 | 0.9% |
| $15,000 to $24,999 | 120 | 11.2% |
| $25,000 to $34,999 | 95 | 8.9% |
| $35,000 to $49,999 | 122 | 11.4% |
| $50,000 to $74,999 | 215 | 20.1% |
| $75,000 to $99,999 | 191 | 17.8% |
| $100,000 to $149,999 | 149 | 13.9% |
| $150,000 to $199,999 | 0 | 0.0% |
| $200,000+ | 107 | 10.0% |
Family Income by Famaliy Size in Belton
6-person families (138 | 12.9%) account for the highest median family income in Belton with $250,001 per family, while 6-person families (138 | 12.9%) have the highest median income of $41,667 per family member.
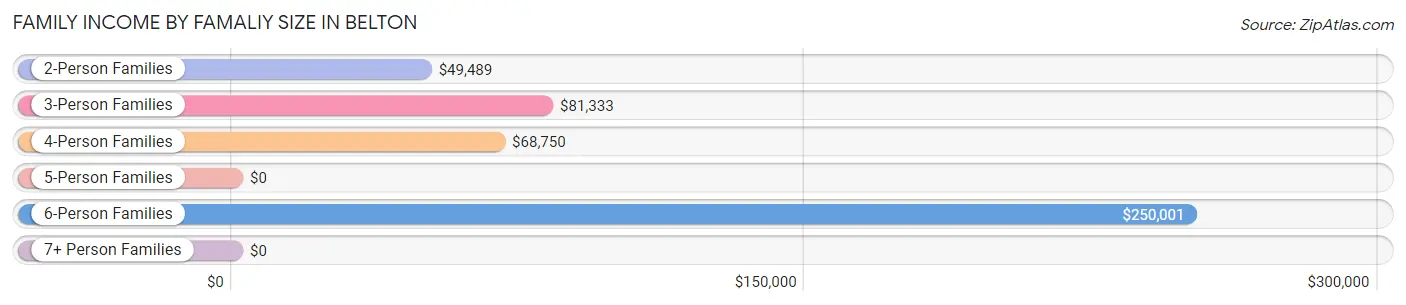
| Income Bracket | # Families | Median Income |
| 2-Person Families | 609 (56.8%) | $49,489 |
| 3-Person Families | 136 (12.7%) | $81,333 |
| 4-Person Families | 121 (11.3%) | $68,750 |
| 5-Person Families | 68 (6.3%) | $0 |
| 6-Person Families | 138 (12.9%) | $250,001 |
| 7+ Person Families | 0 (0.0%) | $0 |
| Total | 1,072 (100.0%) | $67,990 |
Family Income by Number of Earners in Belton
The median family income in Belton is $67,990, with families comprising 3+ earners (138) having the highest median family income of $250,001, while families with 1 earner (470) have the lowest median family income of $34,375, accounting for 12.9% and 43.8% of families, respectively.
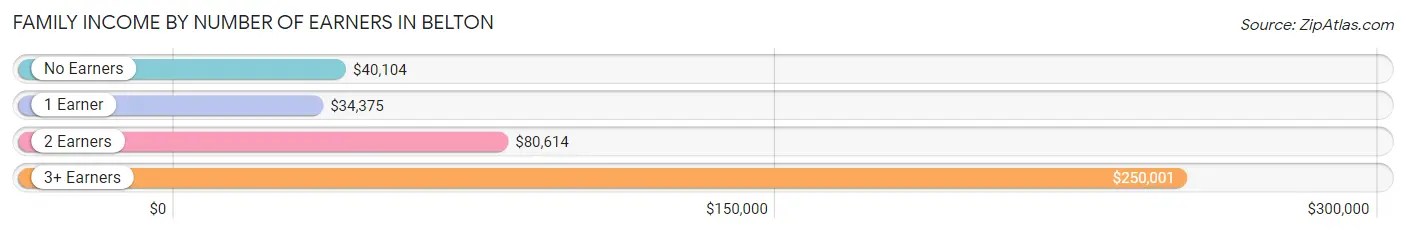
| Number of Earners | # Families | Median Income |
| No Earners | 140 (13.1%) | $40,104 |
| 1 Earner | 470 (43.8%) | $34,375 |
| 2 Earners | 324 (30.2%) | $80,614 |
| 3+ Earners | 138 (12.9%) | $250,001 |
| Total | 1,072 (100.0%) | $67,990 |
Household Income in Belton
Household Income Brackets in Belton
With 281 households falling in the category, the $15,000 to $24,999 income range is the most frequent in Belton, accounting for 17.4% of all households.
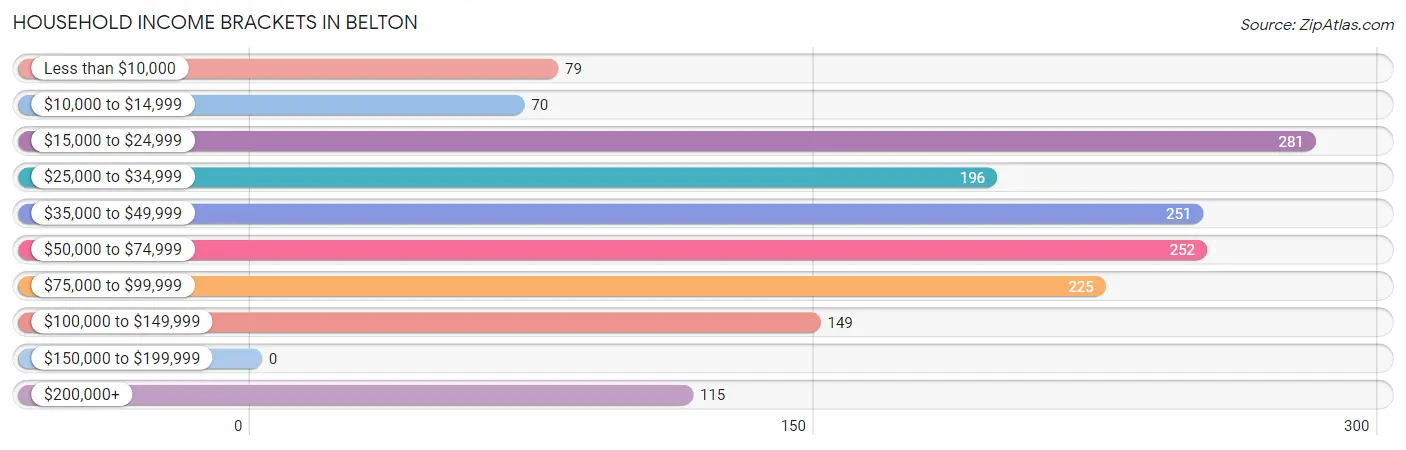
| Income Bracket | # Households | % Households |
| Less than $10,000 | 79 | 4.9% |
| $10,000 to $14,999 | 70 | 4.3% |
| $15,000 to $24,999 | 281 | 17.4% |
| $25,000 to $34,999 | 196 | 12.1% |
| $35,000 to $49,999 | 251 | 15.5% |
| $50,000 to $74,999 | 252 | 15.6% |
| $75,000 to $99,999 | 225 | 13.9% |
| $100,000 to $149,999 | 149 | 9.2% |
| $150,000 to $199,999 | 0 | 0.0% |
| $200,000+ | 115 | 7.1% |
Household Income by Householder Age in Belton
The median household income in Belton is $46,713, with the highest median household income of $67,981 found in the 25 to 44 years age bracket for the primary householder. A total of 441 households (27.3%) fall into this category. Meanwhile, the 65+ years age bracket for the primary householder has the lowest median household income of $37,011, with 504 households (31.2%) in this group.
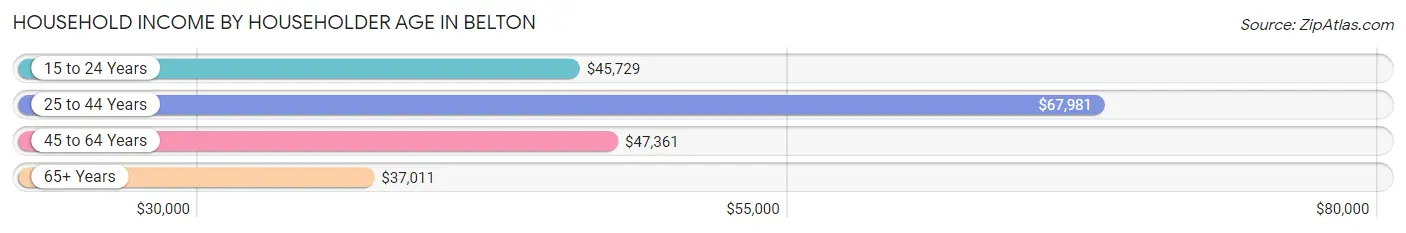
| Income Bracket | # Households | Median Income |
| 15 to 24 Years | 39 (2.4%) | $45,729 |
| 25 to 44 Years | 441 (27.3%) | $67,981 |
| 45 to 64 Years | 633 (39.2%) | $47,361 |
| 65+ Years | 504 (31.2%) | $37,011 |
| Total | 1,617 (100.0%) | $46,713 |
Poverty in Belton
Income Below Poverty by Sex and Age in Belton
With 14.3% poverty level for males and 13.6% for females among the residents of Belton, 5 year old males and 16 and 17 year old females are the most vulnerable to poverty, with 59 males (85.5%) and 33 females (75.0%) in their respective age groups living below the poverty level.
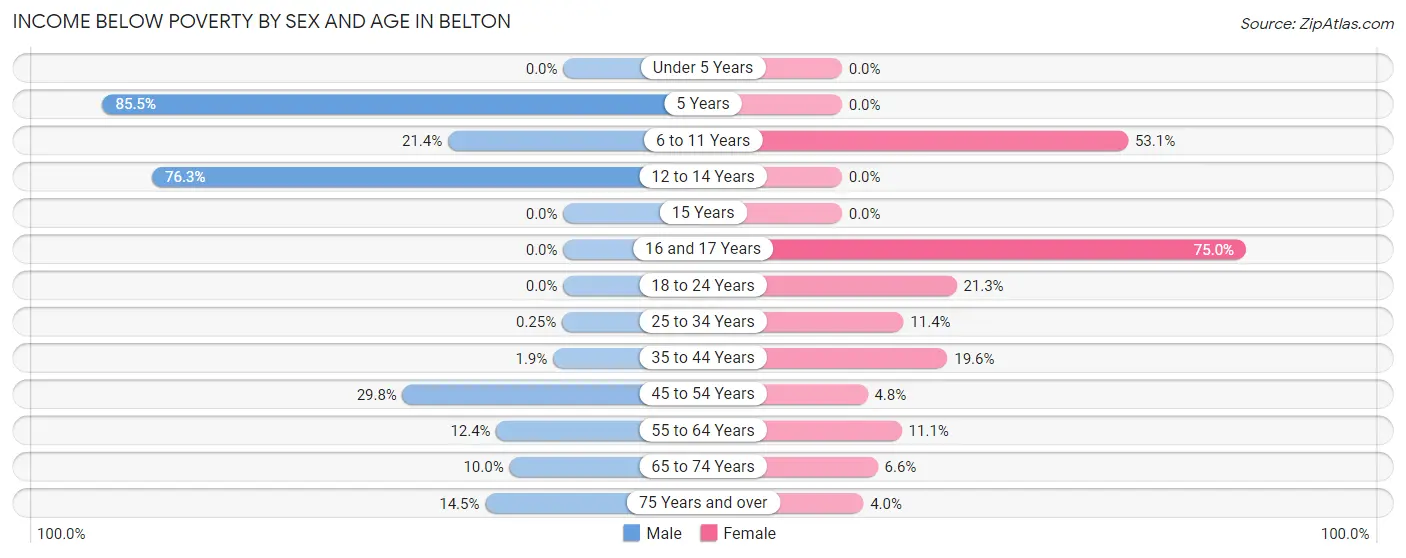
| Age Bracket | Male | Female |
| Under 5 Years | 0 (0.0%) | 0 (0.0%) |
| 5 Years | 59 (85.5%) | 0 (0.0%) |
| 6 to 11 Years | 55 (21.4%) | 136 (53.1%) |
| 12 to 14 Years | 29 (76.3%) | 0 (0.0%) |
| 15 Years | 0 (0.0%) | 0 (0.0%) |
| 16 and 17 Years | 0 (0.0%) | 33 (75.0%) |
| 18 to 24 Years | 0 (0.0%) | 20 (21.3%) |
| 25 to 34 Years | 1 (0.3%) | 54 (11.4%) |
| 35 to 44 Years | 2 (1.9%) | 29 (19.6%) |
| 45 to 54 Years | 34 (29.8%) | 17 (4.8%) |
| 55 to 64 Years | 39 (12.4%) | 28 (11.1%) |
| 65 to 74 Years | 21 (10.0%) | 19 (6.6%) |
| 75 Years and over | 20 (14.5%) | 10 (4.0%) |
| Total | 260 (14.3%) | 346 (13.6%) |
Income Above Poverty by Sex and Age in Belton
According to the poverty statistics in Belton, males aged under 5 years and females aged under 5 years are the age groups that are most secure financially, with 100.0% of males and 100.0% of females in these age groups living above the poverty line.
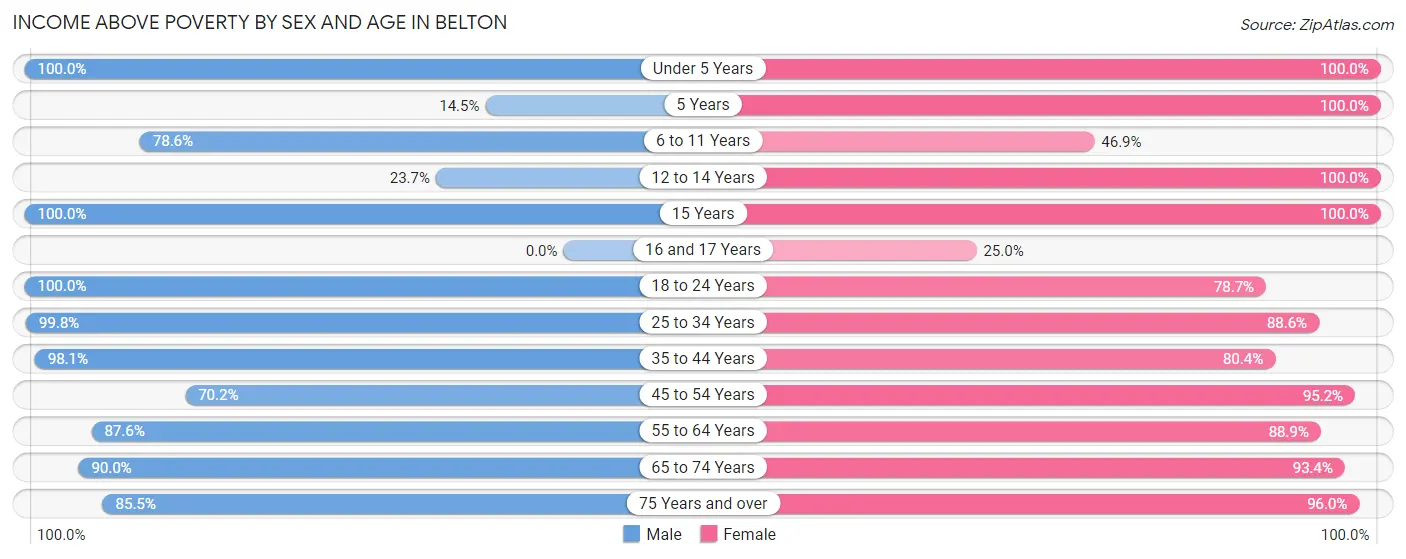
| Age Bracket | Male | Female |
| Under 5 Years | 102 (100.0%) | 218 (100.0%) |
| 5 Years | 10 (14.5%) | 74 (100.0%) |
| 6 to 11 Years | 202 (78.6%) | 120 (46.9%) |
| 12 to 14 Years | 9 (23.7%) | 74 (100.0%) |
| 15 Years | 10 (100.0%) | 11 (100.0%) |
| 16 and 17 Years | 0 (0.0%) | 11 (25.0%) |
| 18 to 24 Years | 67 (100.0%) | 74 (78.7%) |
| 25 to 34 Years | 394 (99.8%) | 418 (88.6%) |
| 35 to 44 Years | 103 (98.1%) | 119 (80.4%) |
| 45 to 54 Years | 80 (70.2%) | 340 (95.2%) |
| 55 to 64 Years | 275 (87.6%) | 224 (88.9%) |
| 65 to 74 Years | 189 (90.0%) | 267 (93.4%) |
| 75 Years and over | 118 (85.5%) | 242 (96.0%) |
| Total | 1,559 (85.7%) | 2,192 (86.4%) |
Income Below Poverty Among Married-Couple Families in Belton
The poverty statistics for married-couple families in Belton show that 1.4% or 11 of the total 786 families live below the poverty line. Families with no children have the highest poverty rate of 2.4%, comprising of 11 families. On the other hand, families with 1 or 2 children have the lowest poverty rate of 0.0%, which includes 0 families.
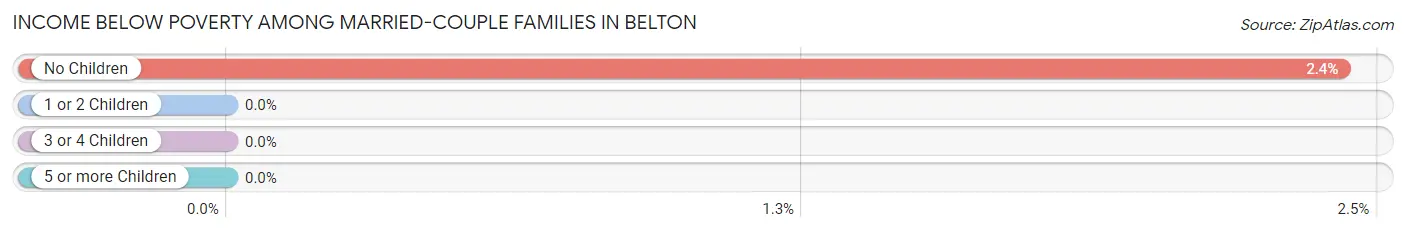
| Children | Above Poverty | Below Poverty |
| No Children | 443 (97.6%) | 11 (2.4%) |
| 1 or 2 Children | 277 (100.0%) | 0 (0.0%) |
| 3 or 4 Children | 55 (100.0%) | 0 (0.0%) |
| 5 or more Children | 0 (0.0%) | 0 (0.0%) |
| Total | 775 (98.6%) | 11 (1.4%) |
Income Below Poverty Among Single-Parent Households in Belton
According to the poverty data in Belton, 31.9% or 23 single-father households and 35.5% or 76 single-mother households are living below the poverty line. Among single-father households, those with 1 or 2 children have the highest poverty rate, with 15 households (75.0%) experiencing poverty. Likewise, among single-mother households, those with 5 or more children have the highest poverty rate, with 28 households (100.0%) falling below the poverty line.
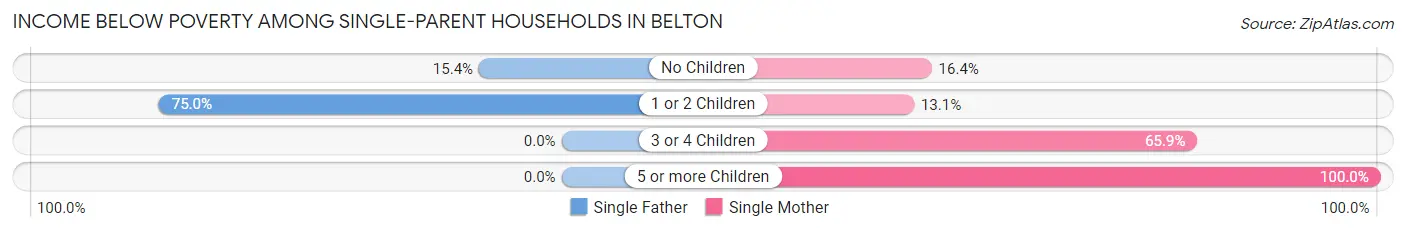
| Children | Single Father | Single Mother |
| No Children | 8 (15.4%) | 10 (16.4%) |
| 1 or 2 Children | 15 (75.0%) | 11 (13.1%) |
| 3 or 4 Children | 0 (0.0%) | 27 (65.8%) |
| 5 or more Children | 0 (0.0%) | 28 (100.0%) |
| Total | 23 (31.9%) | 76 (35.5%) |
Income Below Poverty Among Married-Couple vs Single-Parent Households in Belton
The poverty data for Belton shows that 11 of the married-couple family households (1.4%) and 99 of the single-parent households (34.6%) are living below the poverty level. Within the married-couple family households, those with no children have the highest poverty rate, with 11 households (2.4%) falling below the poverty line. Among the single-parent households, those with 5 or more children have the highest poverty rate, with 28 household (100.0%) living below poverty.
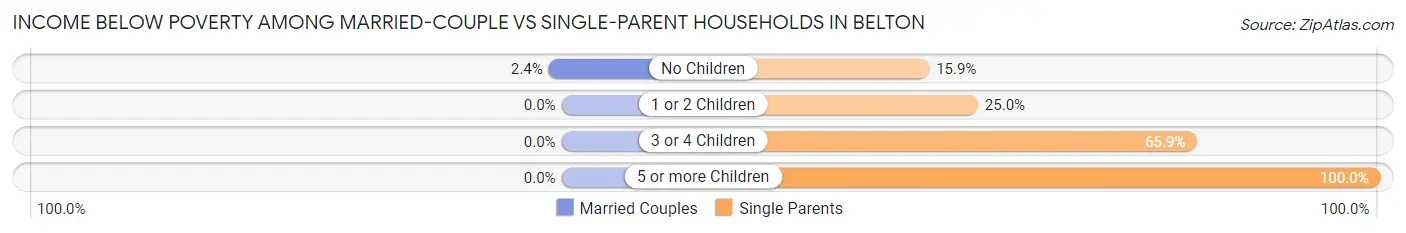
| Children | Married-Couple Families | Single-Parent Households |
| No Children | 11 (2.4%) | 18 (15.9%) |
| 1 or 2 Children | 0 (0.0%) | 26 (25.0%) |
| 3 or 4 Children | 0 (0.0%) | 27 (65.8%) |
| 5 or more Children | 0 (0.0%) | 28 (100.0%) |
| Total | 11 (1.4%) | 99 (34.6%) |
Race in Belton
The most populous races in Belton are White / Caucasian (3,394 | 77.9%), Black / African American (581 | 13.3%), and Two or more Races (344 | 7.9%).
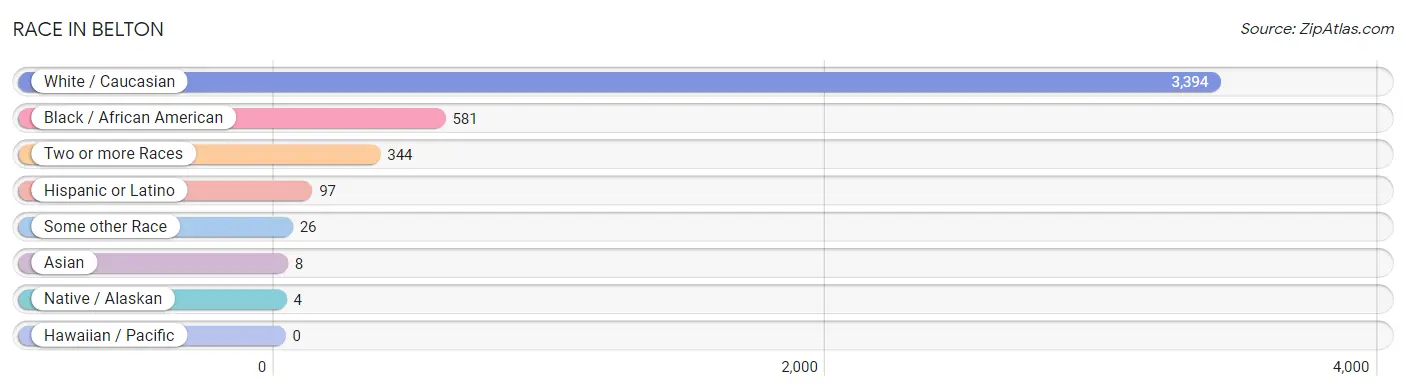
| Race | # Population | % Population |
| Asian | 8 | 0.2% |
| Black / African American | 581 | 13.3% |
| Hawaiian / Pacific | 0 | 0.0% |
| Hispanic or Latino | 97 | 2.2% |
| Native / Alaskan | 4 | 0.1% |
| White / Caucasian | 3,394 | 77.9% |
| Two or more Races | 344 | 7.9% |
| Some other Race | 26 | 0.6% |
| Total | 4,357 | 100.0% |
Ancestry in Belton
The most populous ancestries reported in Belton are Irish (1,219 | 28.0%), German (948 | 21.8%), English (374 | 8.6%), American (362 | 8.3%), and Italian (198 | 4.5%), together accounting for 71.2% of all Belton residents.
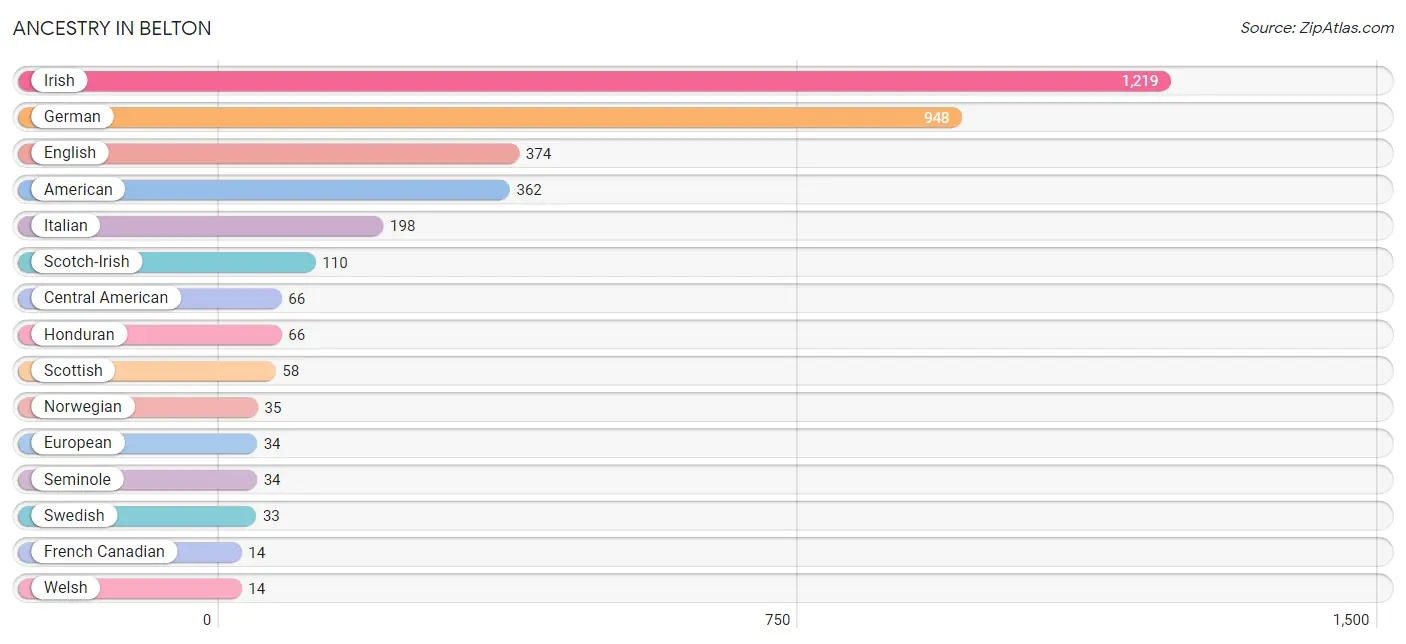
| Ancestry | # Population | % Population |
| American | 362 | 8.3% |
| British | 8 | 0.2% |
| Central American | 66 | 1.5% |
| Cherokee | 11 | 0.3% |
| Croatian | 11 | 0.3% |
| Czech | 10 | 0.2% |
| English | 374 | 8.6% |
| European | 34 | 0.8% |
| French | 8 | 0.2% |
| French Canadian | 14 | 0.3% |
| German | 948 | 21.8% |
| Honduran | 66 | 1.5% |
| Irish | 1,219 | 28.0% |
| Italian | 198 | 4.5% |
| Korean | 8 | 0.2% |
| Navajo | 1 | 0.0% |
| Norwegian | 35 | 0.8% |
| Pennsylvania German | 8 | 0.2% |
| Portuguese | 13 | 0.3% |
| Puerto Rican | 8 | 0.2% |
| Scotch-Irish | 110 | 2.5% |
| Scottish | 58 | 1.3% |
| Seminole | 34 | 0.8% |
| Serbian | 10 | 0.2% |
| Swedish | 33 | 0.8% |
| Welsh | 14 | 0.3% | View All 26 Rows |
Immigrants in Belton
The most numerous immigrant groups reported in Belton came from Canada (42 | 1.0%), Central America (38 | 0.9%), Honduras (38 | 0.9%), Latin America (38 | 0.9%), and Europe (18 | 0.4%), together accounting for 4.0% of all Belton residents.
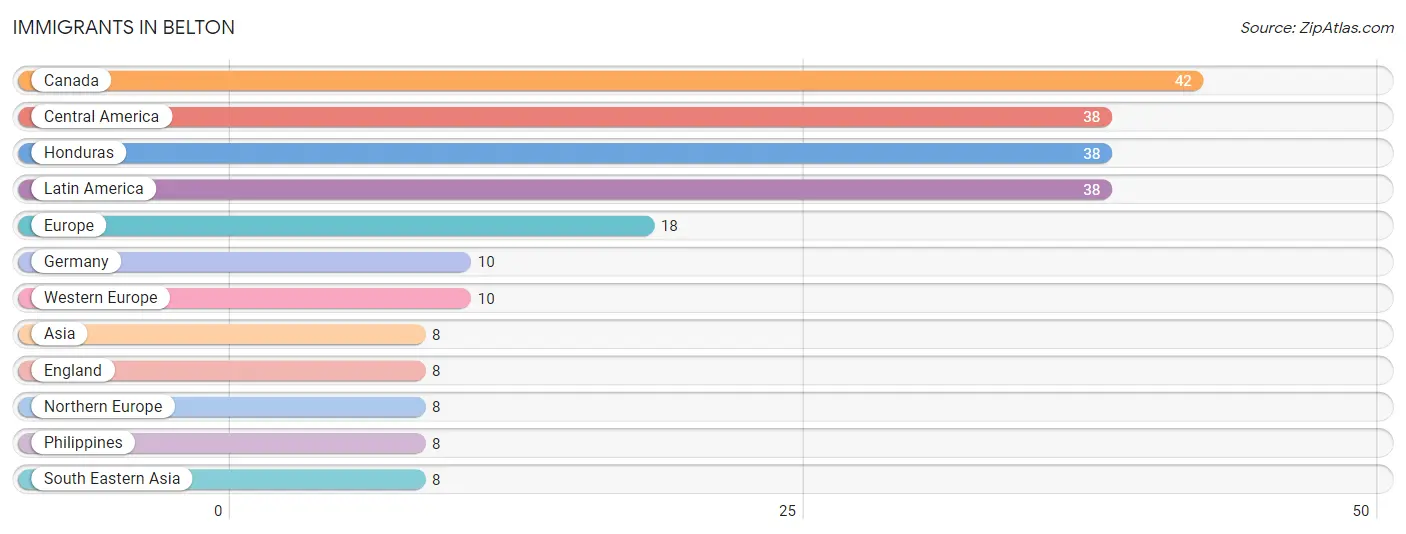
| Immigration Origin | # Population | % Population |
| Asia | 8 | 0.2% |
| Canada | 42 | 1.0% |
| Central America | 38 | 0.9% |
| England | 8 | 0.2% |
| Europe | 18 | 0.4% |
| Germany | 10 | 0.2% |
| Honduras | 38 | 0.9% |
| Latin America | 38 | 0.9% |
| Northern Europe | 8 | 0.2% |
| Philippines | 8 | 0.2% |
| South Eastern Asia | 8 | 0.2% |
| Western Europe | 10 | 0.2% | View All 12 Rows |
Sex and Age in Belton
Sex and Age in Belton
The most populous age groups in Belton are 5 to 9 Years (305 | 16.8%) for men and 25 to 29 Years (307 | 12.1%) for women.
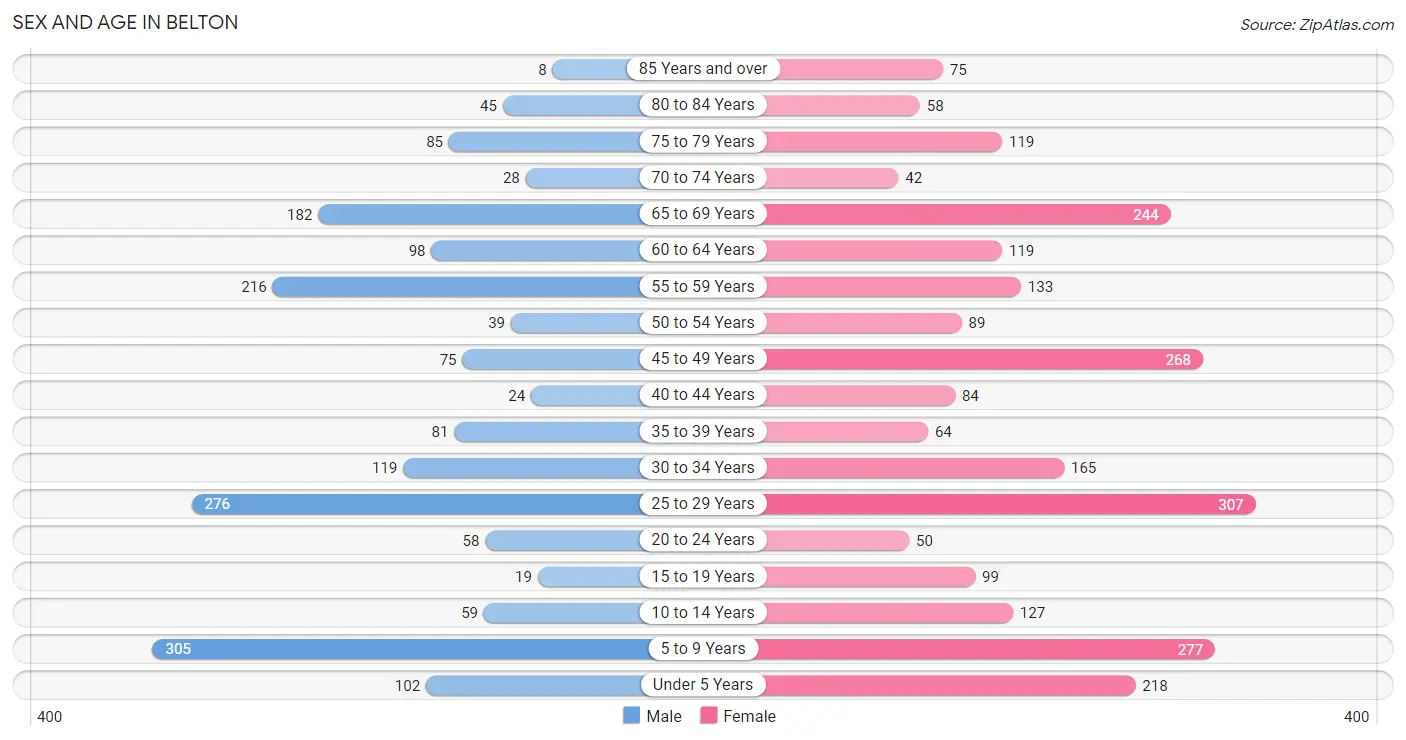
| Age Bracket | Male | Female |
| Under 5 Years | 102 (5.6%) | 218 (8.6%) |
| 5 to 9 Years | 305 (16.8%) | 277 (10.9%) |
| 10 to 14 Years | 59 (3.2%) | 127 (5.0%) |
| 15 to 19 Years | 19 (1.0%) | 99 (3.9%) |
| 20 to 24 Years | 58 (3.2%) | 50 (2.0%) |
| 25 to 29 Years | 276 (15.2%) | 307 (12.1%) |
| 30 to 34 Years | 119 (6.5%) | 165 (6.5%) |
| 35 to 39 Years | 81 (4.4%) | 64 (2.5%) |
| 40 to 44 Years | 24 (1.3%) | 84 (3.3%) |
| 45 to 49 Years | 75 (4.1%) | 268 (10.6%) |
| 50 to 54 Years | 39 (2.1%) | 89 (3.5%) |
| 55 to 59 Years | 216 (11.9%) | 133 (5.2%) |
| 60 to 64 Years | 98 (5.4%) | 119 (4.7%) |
| 65 to 69 Years | 182 (10.0%) | 244 (9.6%) |
| 70 to 74 Years | 28 (1.5%) | 42 (1.7%) |
| 75 to 79 Years | 85 (4.7%) | 119 (4.7%) |
| 80 to 84 Years | 45 (2.5%) | 58 (2.3%) |
| 85 Years and over | 8 (0.4%) | 75 (3.0%) |
| Total | 1,819 (100.0%) | 2,538 (100.0%) |
Families and Households in Belton
Median Family Size in Belton
The median family size in Belton is 3.45 persons per family, with married-couple families (786 | 73.3%) accounting for the largest median family size of 3.62 persons per family. On the other hand, single male/father families (72 | 6.7%) represent the smallest median family size with 2.26 persons per family.
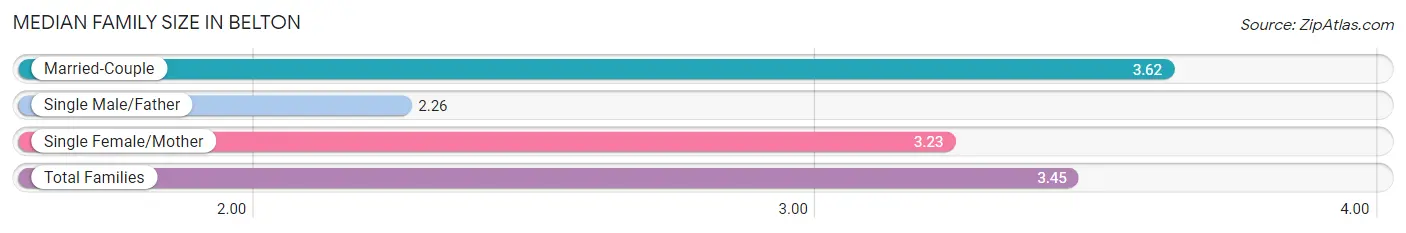
| Family Type | # Families | Family Size |
| Married-Couple | 786 (73.3%) | 3.62 |
| Single Male/Father | 72 (6.7%) | 2.26 |
| Single Female/Mother | 214 (20.0%) | 3.23 |
| Total Families | 1,072 (100.0%) | 3.45 |
Median Household Size in Belton
The median household size in Belton is 2.69 persons per household, with married-couple households (786 | 48.6%) accounting for the largest median household size of 3.64 persons per household. non-family households (545 | 33.7%) represent the smallest median household size with 1.02 persons per household.
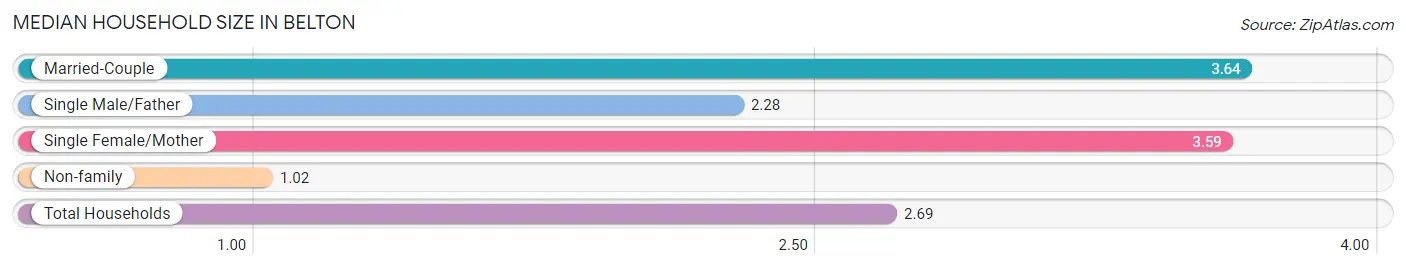
| Household Type | # Households | Household Size |
| Married-Couple | 786 (48.6%) | 3.64 |
| Single Male/Father | 72 (4.4%) | 2.28 |
| Single Female/Mother | 214 (13.2%) | 3.59 |
| Non-family | 545 (33.7%) | 1.02 |
| Total Households | 1,617 (100.0%) | 2.69 |
Household Size by Marriage Status in Belton
Out of a total of 1,617 households in Belton, 1,072 (66.3%) are family households, while 545 (33.7%) are nonfamily households. The most numerous type of family households are 2-person households, comprising 584, and the most common type of nonfamily households are 1-person households, comprising 530.
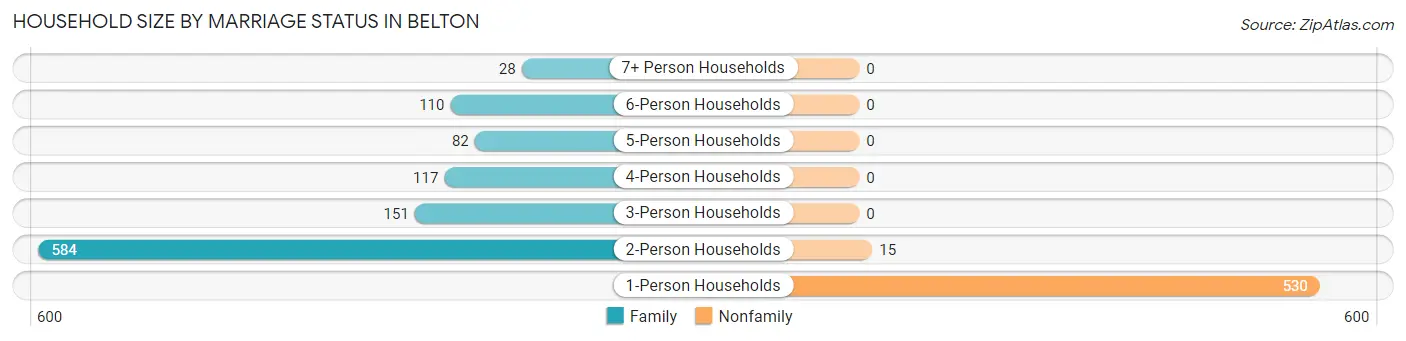
| Household Size | Family Households | Nonfamily Households |
| 1-Person Households | - | 530 (32.8%) |
| 2-Person Households | 584 (36.1%) | 15 (0.9%) |
| 3-Person Households | 151 (9.3%) | 0 (0.0%) |
| 4-Person Households | 117 (7.2%) | 0 (0.0%) |
| 5-Person Households | 82 (5.1%) | 0 (0.0%) |
| 6-Person Households | 110 (6.8%) | 0 (0.0%) |
| 7+ Person Households | 28 (1.7%) | 0 (0.0%) |
| Total | 1,072 (66.3%) | 545 (33.7%) |
Female Fertility in Belton
Fertility by Age in Belton
Average fertility rate in Belton is 188.0 births per 1,000 women. Women in the age bracket of 20 to 34 years have the highest fertility rate with 374.0 births per 1,000 women. Women in the age bracket of 20 to 34 years acount for 100.0% of all women with births.
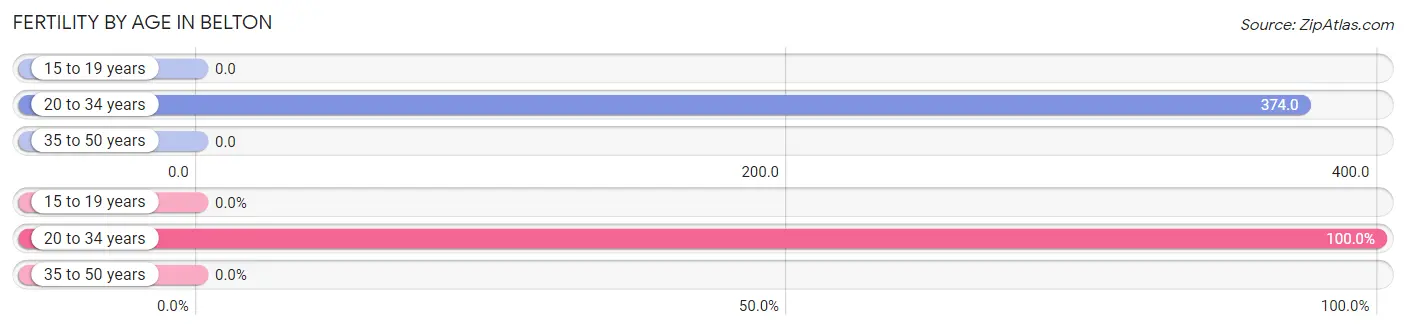
| Age Bracket | Women with Births | Births / 1,000 Women |
| 15 to 19 years | 0 (0.0%) | 0.0 |
| 20 to 34 years | 195 (100.0%) | 374.0 |
| 35 to 50 years | 0 (0.0%) | 0.0 |
| Total | 195 (100.0%) | 188.0 |
Fertility by Age by Marriage Status in Belton
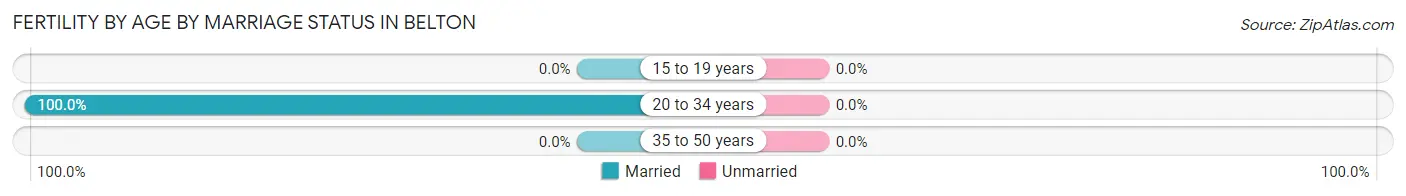
| Age Bracket | Married | Unmarried |
| 15 to 19 years | 0 (0.0%) | 0 (0.0%) |
| 20 to 34 years | 195 (100.0%) | 0 (0.0%) |
| 35 to 50 years | 0 (0.0%) | 0 (0.0%) |
| Total | 195 (100.0%) | 0 (0.0%) |
Fertility by Education in Belton
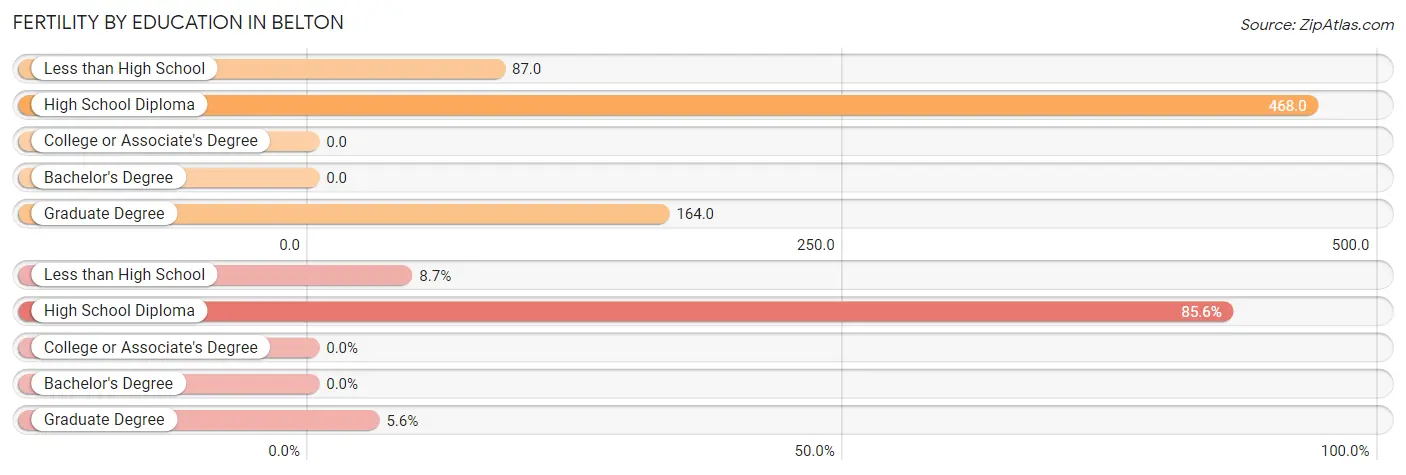
| Educational Attainment | Women with Births | Births / 1,000 Women |
| Less than High School | 17 (8.7%) | 87.0 |
| High School Diploma | 167 (85.6%) | 468.0 |
| College or Associate's Degree | 0 (0.0%) | 0.0 |
| Bachelor's Degree | 0 (0.0%) | 0.0 |
| Graduate Degree | 11 (5.6%) | 164.0 |
| Total | 195 (100.0%) | 188.0 |
Fertility by Education by Marriage Status in Belton
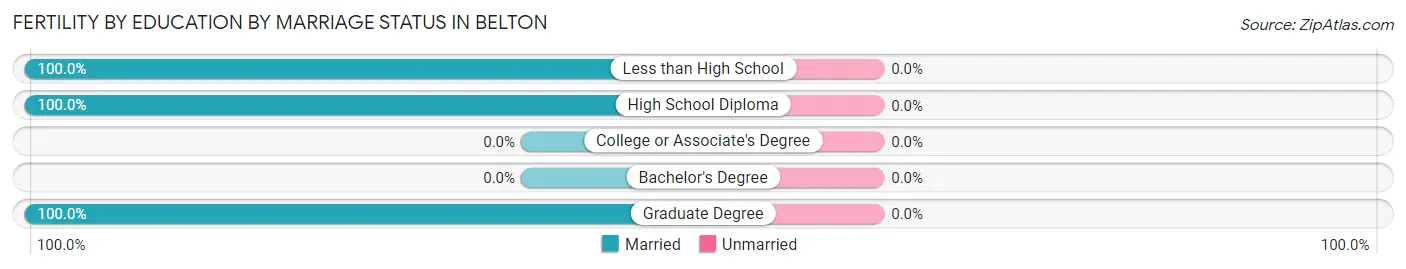
| Educational Attainment | Married | Unmarried |
| Less than High School | 17 (100.0%) | 0 (0.0%) |
| High School Diploma | 167 (100.0%) | 0 (0.0%) |
| College or Associate's Degree | 0 (0.0%) | 0 (0.0%) |
| Bachelor's Degree | 0 (0.0%) | 0 (0.0%) |
| Graduate Degree | 11 (100.0%) | 0 (0.0%) |
| Total | 195 (100.0%) | 0 (0.0%) |
Employment Characteristics in Belton
Employment by Class of Employer in Belton
Among the 2,051 employed individuals in Belton, private company employees (1,558 | 76.0%), self-employed (incorporated) (199 | 9.7%), and state government employees (94 | 4.6%) make up the most common classes of employment.
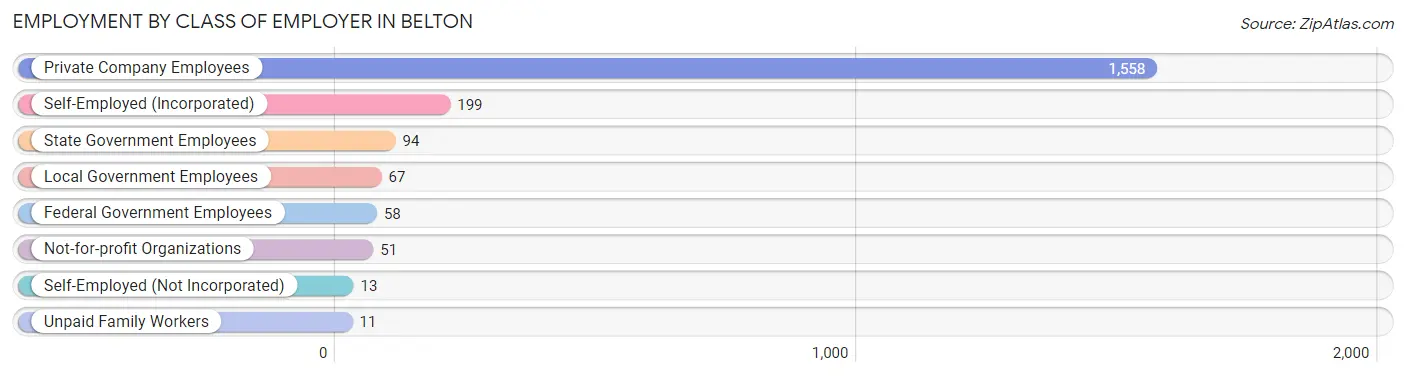
| Employer Class | # Employees | % Employees |
| Private Company Employees | 1,558 | 76.0% |
| Self-Employed (Incorporated) | 199 | 9.7% |
| Self-Employed (Not Incorporated) | 13 | 0.6% |
| Not-for-profit Organizations | 51 | 2.5% |
| Local Government Employees | 67 | 3.3% |
| State Government Employees | 94 | 4.6% |
| Federal Government Employees | 58 | 2.8% |
| Unpaid Family Workers | 11 | 0.5% |
| Total | 2,051 | 100.0% |
Employment Status by Age in Belton
According to the labor force statistics for Belton, out of the total population over 16 years of age (3,248), 66.8% or 2,170 individuals are in the labor force, with 5.0% or 108 of them unemployed. The age group with the highest labor force participation rate is 30 to 34 years, with 96.1% or 273 individuals in the labor force. Within the labor force, the 35 to 44 years age range has the highest percentage of unemployed individuals, with 17.0% or 41 of them being unemployed.
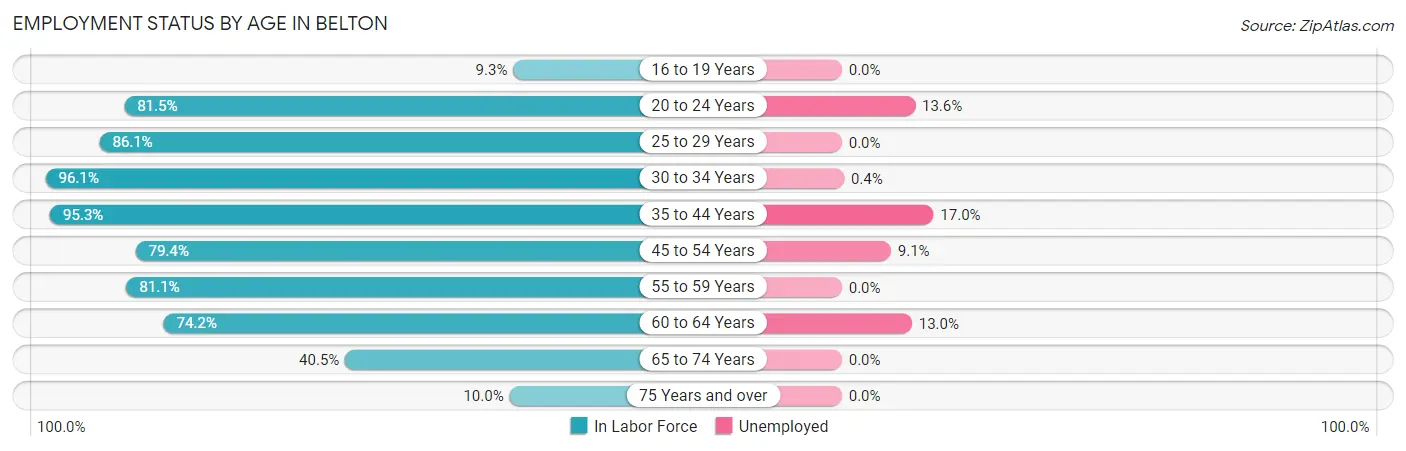
| Age Bracket | In Labor Force | Unemployed |
| 16 to 19 Years | 9 (9.3%) | 0 (0.0%) |
| 20 to 24 Years | 88 (81.5%) | 12 (13.6%) |
| 25 to 29 Years | 502 (86.1%) | 0 (0.0%) |
| 30 to 34 Years | 273 (96.1%) | 1 (0.4%) |
| 35 to 44 Years | 241 (95.3%) | 41 (17.0%) |
| 45 to 54 Years | 374 (79.4%) | 34 (9.1%) |
| 55 to 59 Years | 283 (81.1%) | 0 (0.0%) |
| 60 to 64 Years | 161 (74.2%) | 21 (13.0%) |
| 65 to 74 Years | 201 (40.5%) | 0 (0.0%) |
| 75 Years and over | 39 (10.0%) | 0 (0.0%) |
| Total | 2,170 (66.8%) | 108 (5.0%) |
Employment Status by Educational Attainment in Belton
According to labor force statistics for Belton, 85.0% of individuals (1,833) out of the total population between 25 and 64 years of age (2,157) are in the labor force, with 5.3% or 97 of them being unemployed. The group with the highest labor force participation rate are those with the educational attainment of high school diploma, with 94.7% or 792 individuals in the labor force. Within the labor force, individuals with high school diploma education have the highest percentage of unemployment, with 7.4% or 59 of them being unemployed.
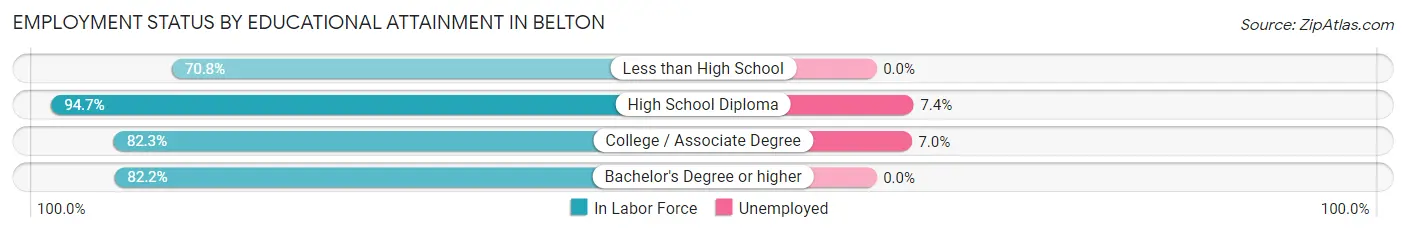
| Educational Attainment | In Labor Force | Unemployed |
| Less than High School | 276 (70.8%) | 0 (0.0%) |
| High School Diploma | 792 (94.7%) | 62 (7.4%) |
| College / Associate Degree | 545 (82.3%) | 46 (7.0%) |
| Bachelor's Degree or higher | 221 (82.2%) | 0 (0.0%) |
| Total | 1,833 (85.0%) | 114 (5.3%) |
Employment Occupations by Sex in Belton
Management, Business, Science and Arts Occupations
The most common Management, Business, Science and Arts occupations in Belton are Management (180 | 8.7%), Community & Social Service (137 | 6.6%), Education Instruction & Library (107 | 5.2%), Health Diagnosing & Treating (90 | 4.4%), and Health Technologists (69 | 3.4%).
Management, Business, Science and Arts Occupations by Sex
Within the Management, Business, Science and Arts occupations in Belton, the most male-oriented occupations are Architecture & Engineering (100.0%), Life, Physical & Social Science (100.0%), and Computers, Engineering & Science (71.8%), while the most female-oriented occupations are Computers & Mathematics (100.0%), Management (88.9%), and Health Diagnosing & Treating (77.8%).
| Occupation | Male | Female |
| Management | 20 (11.1%) | 160 (88.9%) |
| Business & Financial | 0 (0.0%) | 0 (0.0%) |
| Computers, Engineering & Science | 28 (71.8%) | 11 (28.2%) |
| Computers & Mathematics | 0 (0.0%) | 11 (100.0%) |
| Architecture & Engineering | 12 (100.0%) | 0 (0.0%) |
| Life, Physical & Social Science | 16 (100.0%) | 0 (0.0%) |
| Community & Social Service | 62 (45.3%) | 75 (54.7%) |
| Education, Arts & Media | 11 (36.7%) | 19 (63.3%) |
| Legal Services & Support | 0 (0.0%) | 0 (0.0%) |
| Education Instruction & Library | 51 (47.7%) | 56 (52.3%) |
| Arts, Media & Entertainment | 0 (0.0%) | 0 (0.0%) |
| Health Diagnosing & Treating | 20 (22.2%) | 70 (77.8%) |
| Health Technologists | 20 (29.0%) | 49 (71.0%) |
| Total (Category) | 130 (29.1%) | 316 (70.9%) |
| Total (Overall) | 836 (40.5%) | 1,226 (59.5%) |
Services Occupations
The most common Services occupations in Belton are Healthcare Support (266 | 12.9%), Food Preparation & Serving (80 | 3.9%), Cleaning & Maintenance (41 | 2.0%), Security & Protection (9 | 0.4%), and Firefighting & Prevention (9 | 0.4%).
Services Occupations by Sex
Within the Services occupations in Belton, the most male-oriented occupations are Cleaning & Maintenance (34.2%), and Food Preparation & Serving (15.0%), while the most female-oriented occupations are Healthcare Support (100.0%), Security & Protection (100.0%), and Firefighting & Prevention (100.0%).
| Occupation | Male | Female |
| Healthcare Support | 0 (0.0%) | 266 (100.0%) |
| Security & Protection | 0 (0.0%) | 9 (100.0%) |
| Firefighting & Prevention | 0 (0.0%) | 9 (100.0%) |
| Law Enforcement | 0 (0.0%) | 0 (0.0%) |
| Food Preparation & Serving | 12 (15.0%) | 68 (85.0%) |
| Cleaning & Maintenance | 14 (34.2%) | 27 (65.8%) |
| Personal Care & Service | 0 (0.0%) | 0 (0.0%) |
| Total (Category) | 26 (6.6%) | 370 (93.4%) |
| Total (Overall) | 836 (40.5%) | 1,226 (59.5%) |
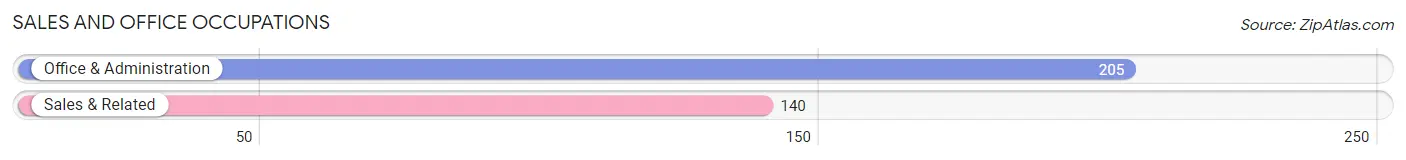
Sales and Office Occupations
The most common Sales and Office occupations in Belton are Office & Administration (205 | 9.9%), and Sales & Related (140 | 6.8%).
Sales and Office Occupations by Sex
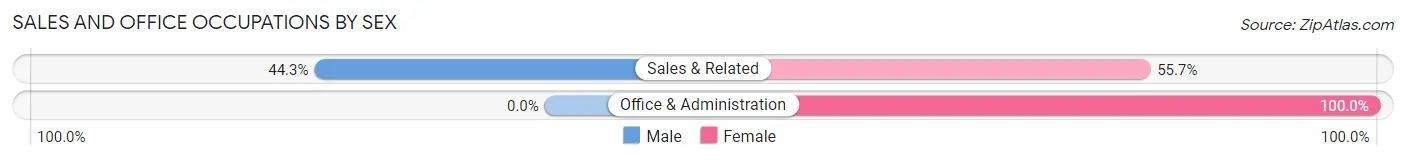
| Occupation | Male | Female |
| Sales & Related | 62 (44.3%) | 78 (55.7%) |
| Office & Administration | 0 (0.0%) | 205 (100.0%) |
| Total (Category) | 62 (18.0%) | 283 (82.0%) |
| Total (Overall) | 836 (40.5%) | 1,226 (59.5%) |
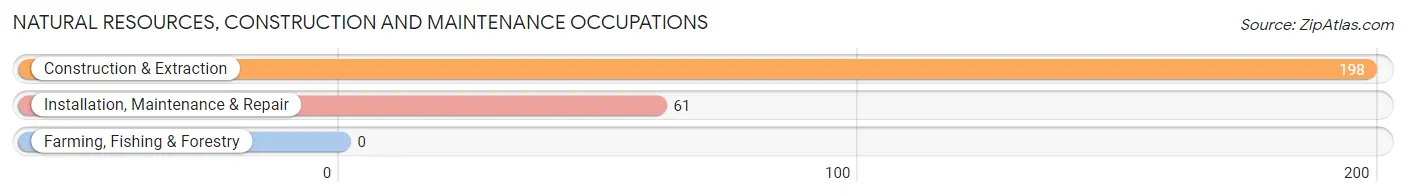
Natural Resources, Construction and Maintenance Occupations
The most common Natural Resources, Construction and Maintenance occupations in Belton are Construction & Extraction (198 | 9.6%), and Installation, Maintenance & Repair (61 | 3.0%).
Natural Resources, Construction and Maintenance Occupations by Sex
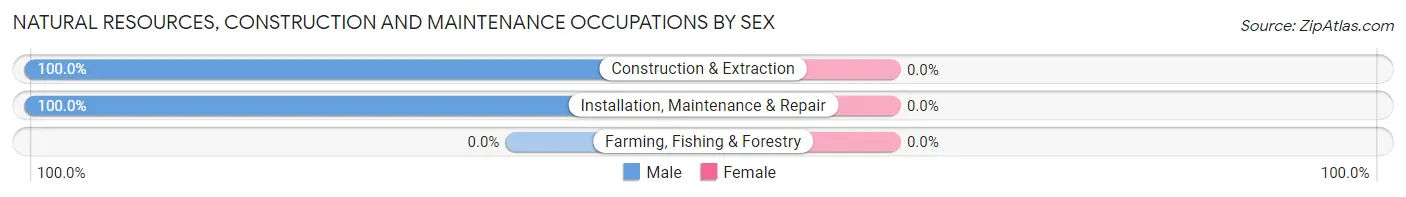
| Occupation | Male | Female |
| Farming, Fishing & Forestry | 0 (0.0%) | 0 (0.0%) |
| Construction & Extraction | 198 (100.0%) | 0 (0.0%) |
| Installation, Maintenance & Repair | 61 (100.0%) | 0 (0.0%) |
| Total (Category) | 259 (100.0%) | 0 (0.0%) |
| Total (Overall) | 836 (40.5%) | 1,226 (59.5%) |
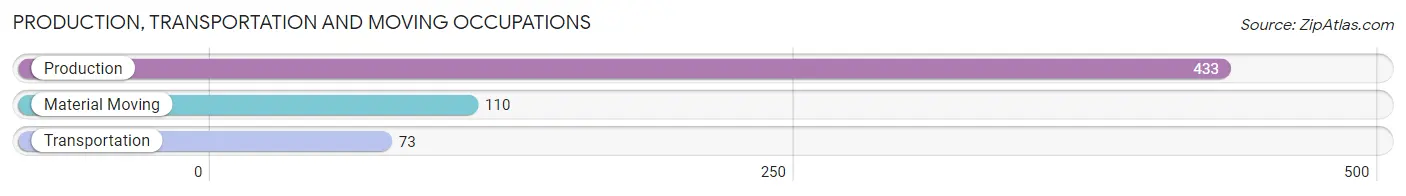
Production, Transportation and Moving Occupations
The most common Production, Transportation and Moving occupations in Belton are Production (433 | 21.0%), Material Moving (110 | 5.3%), and Transportation (73 | 3.5%).
Production, Transportation and Moving Occupations by Sex
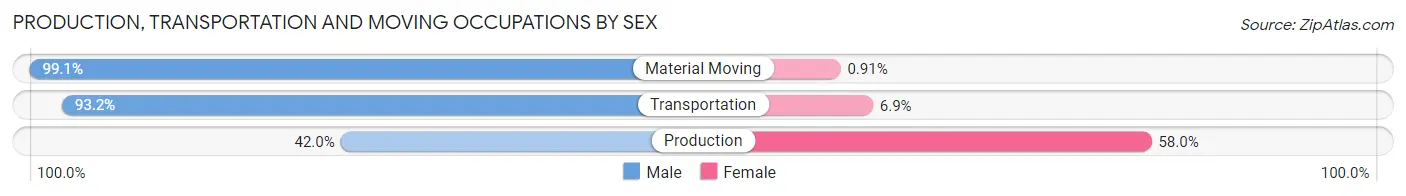
| Occupation | Male | Female |
| Production | 182 (42.0%) | 251 (58.0%) |
| Transportation | 68 (93.1%) | 5 (6.9%) |
| Material Moving | 109 (99.1%) | 1 (0.9%) |
| Total (Category) | 359 (58.3%) | 257 (41.7%) |
| Total (Overall) | 836 (40.5%) | 1,226 (59.5%) |
Employment Industries by Sex in Belton
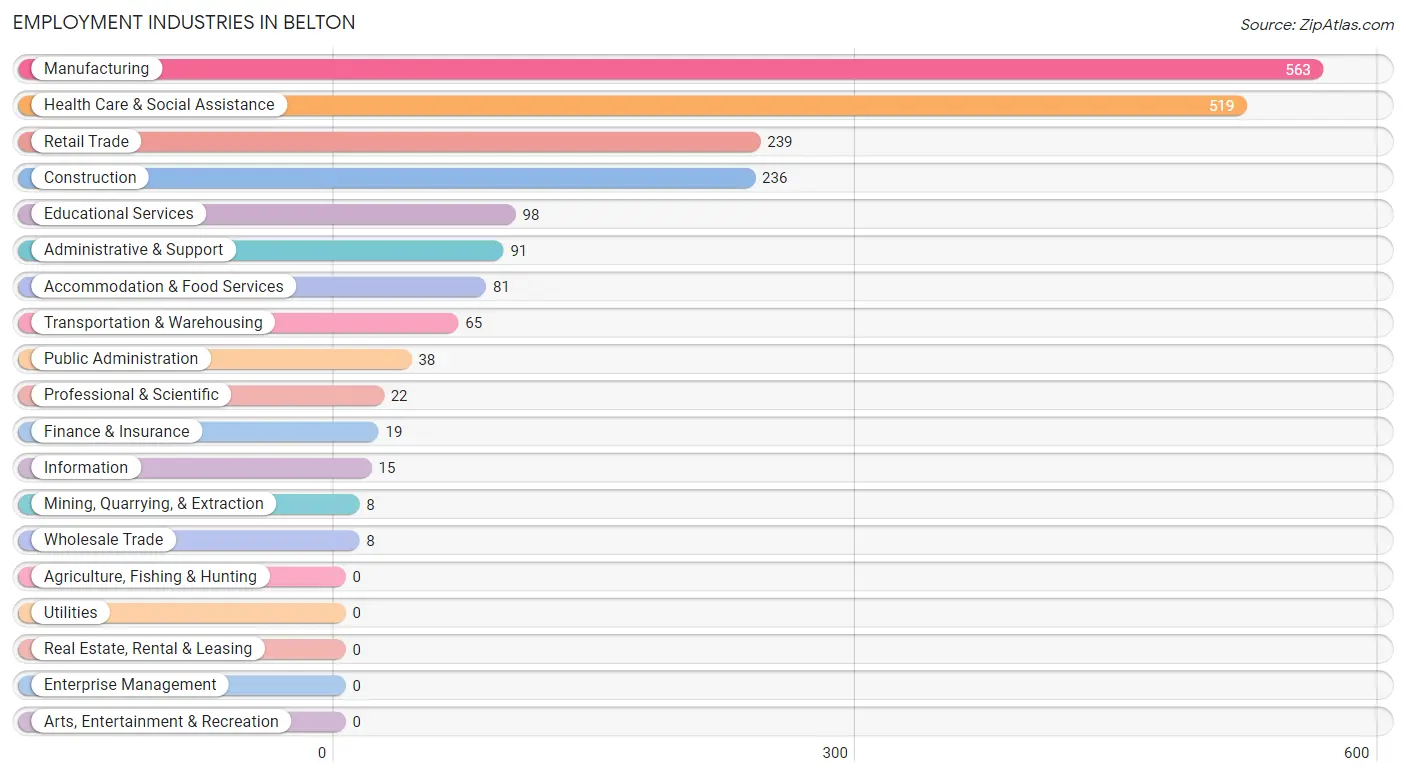
Employment Industries in Belton
The major employment industries in Belton include Manufacturing (563 | 27.3%), Health Care & Social Assistance (519 | 25.2%), Retail Trade (239 | 11.6%), Construction (236 | 11.5%), and Educational Services (98 | 4.8%).
Employment Industries by Sex in Belton
The Belton industries that see more men than women are Wholesale Trade (100.0%), Professional & Scientific (100.0%), and Construction (91.1%), whereas the industries that tend to have a higher number of women are Mining, Quarrying, & Extraction (100.0%), Finance & Insurance (100.0%), and Public Administration (100.0%).
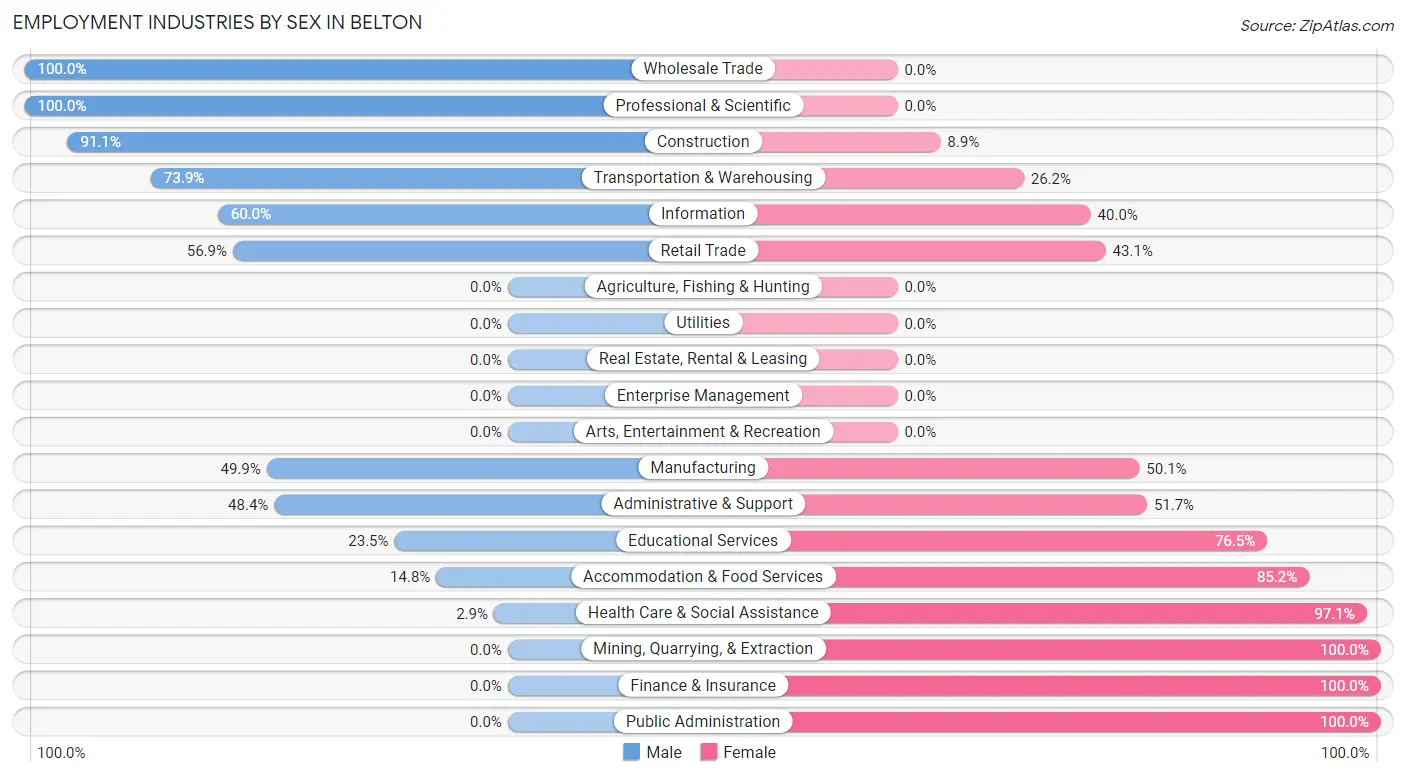
| Industry | Male | Female |
| Agriculture, Fishing & Hunting | 0 (0.0%) | 0 (0.0%) |
| Mining, Quarrying, & Extraction | 0 (0.0%) | 8 (100.0%) |
| Construction | 215 (91.1%) | 21 (8.9%) |
| Manufacturing | 281 (49.9%) | 282 (50.1%) |
| Wholesale Trade | 8 (100.0%) | 0 (0.0%) |
| Retail Trade | 136 (56.9%) | 103 (43.1%) |
| Transportation & Warehousing | 48 (73.9%) | 17 (26.2%) |
| Utilities | 0 (0.0%) | 0 (0.0%) |
| Information | 9 (60.0%) | 6 (40.0%) |
| Finance & Insurance | 0 (0.0%) | 19 (100.0%) |
| Real Estate, Rental & Leasing | 0 (0.0%) | 0 (0.0%) |
| Professional & Scientific | 22 (100.0%) | 0 (0.0%) |
| Enterprise Management | 0 (0.0%) | 0 (0.0%) |
| Administrative & Support | 44 (48.3%) | 47 (51.6%) |
| Educational Services | 23 (23.5%) | 75 (76.5%) |
| Health Care & Social Assistance | 15 (2.9%) | 504 (97.1%) |
| Arts, Entertainment & Recreation | 0 (0.0%) | 0 (0.0%) |
| Accommodation & Food Services | 12 (14.8%) | 69 (85.2%) |
| Public Administration | 0 (0.0%) | 38 (100.0%) |
| Total | 836 (40.5%) | 1,226 (59.5%) |
Education in Belton
School Enrollment in Belton
The most common levels of schooling among the 992 students in Belton are elementary school (471 | 47.5%), kindergarten (152 | 15.3%), and middle school (141 | 14.2%).
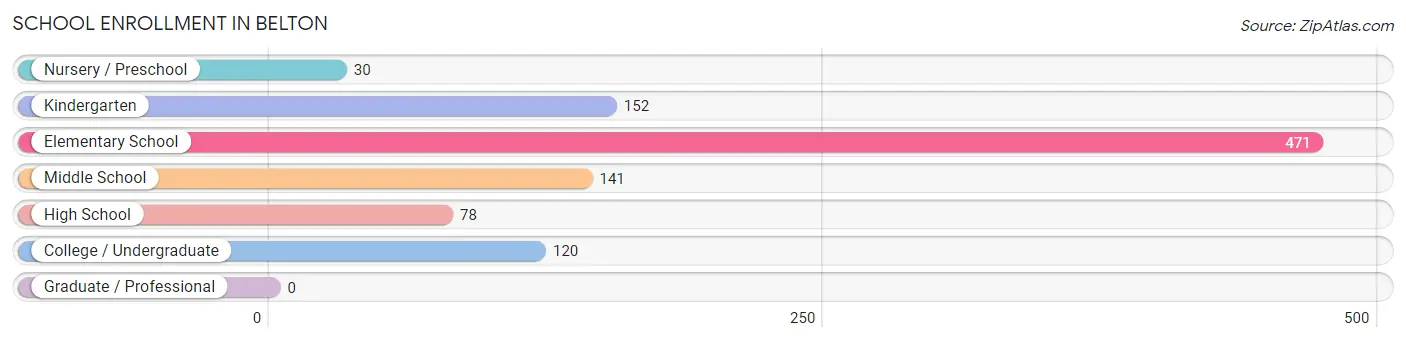
| School Level | # Students | % Students |
| Nursery / Preschool | 30 | 3.0% |
| Kindergarten | 152 | 15.3% |
| Elementary School | 471 | 47.5% |
| Middle School | 141 | 14.2% |
| High School | 78 | 7.9% |
| College / Undergraduate | 120 | 12.1% |
| Graduate / Professional | 0 | 0.0% |
| Total | 992 | 100.0% |
School Enrollment by Age by Funding Source in Belton
Out of a total of 992 students who are enrolled in schools in Belton, 203 (20.5%) attend a private institution, while the remaining 789 (79.5%) are enrolled in public schools. The age group of 20 to 24 year olds has the highest likelihood of being enrolled in private schools, with 8 (100.0% in the age bracket) enrolled. Conversely, the age group of 3 to 4 year olds has the lowest likelihood of being enrolled in a private school, with 39 (100.0% in the age bracket) attending a public institution.
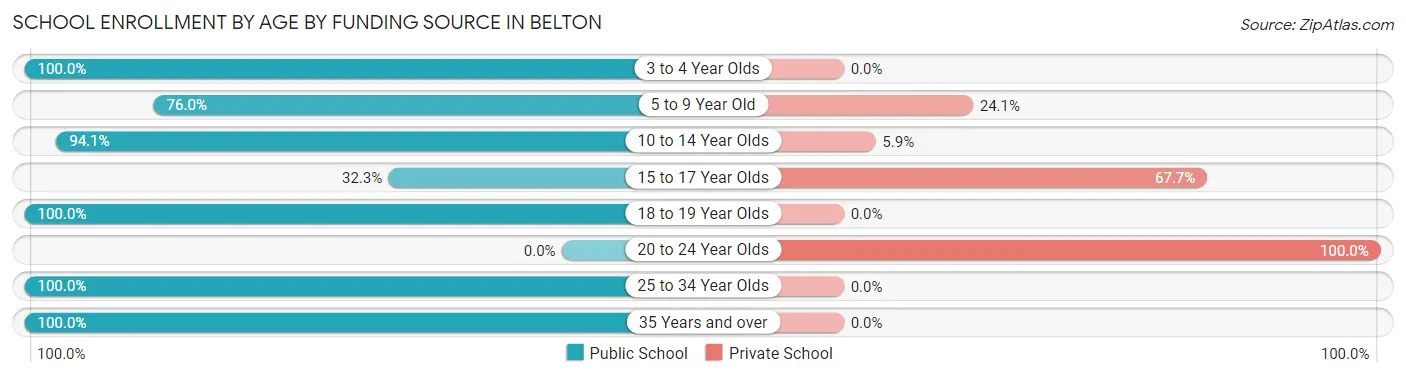
| Age Bracket | Public School | Private School |
| 3 to 4 Year Olds | 39 (100.0%) | 0 (0.0%) |
| 5 to 9 Year Old | 442 (75.9%) | 140 (24.0%) |
| 10 to 14 Year Olds | 175 (94.1%) | 11 (5.9%) |
| 15 to 17 Year Olds | 21 (32.3%) | 44 (67.7%) |
| 18 to 19 Year Olds | 44 (100.0%) | 0 (0.0%) |
| 20 to 24 Year Olds | 0 (0.0%) | 8 (100.0%) |
| 25 to 34 Year Olds | 46 (100.0%) | 0 (0.0%) |
| 35 Years and over | 22 (100.0%) | 0 (0.0%) |
| Total | 789 (79.5%) | 203 (20.5%) |
Educational Attainment by Field of Study in Belton
Business (131 | 33.3%), engineering (49 | 12.4%), education (40 | 10.2%), science & technology (37 | 9.4%), and communications (31 | 7.9%) are the most common fields of study among 394 individuals in Belton who have obtained a bachelor's degree or higher.
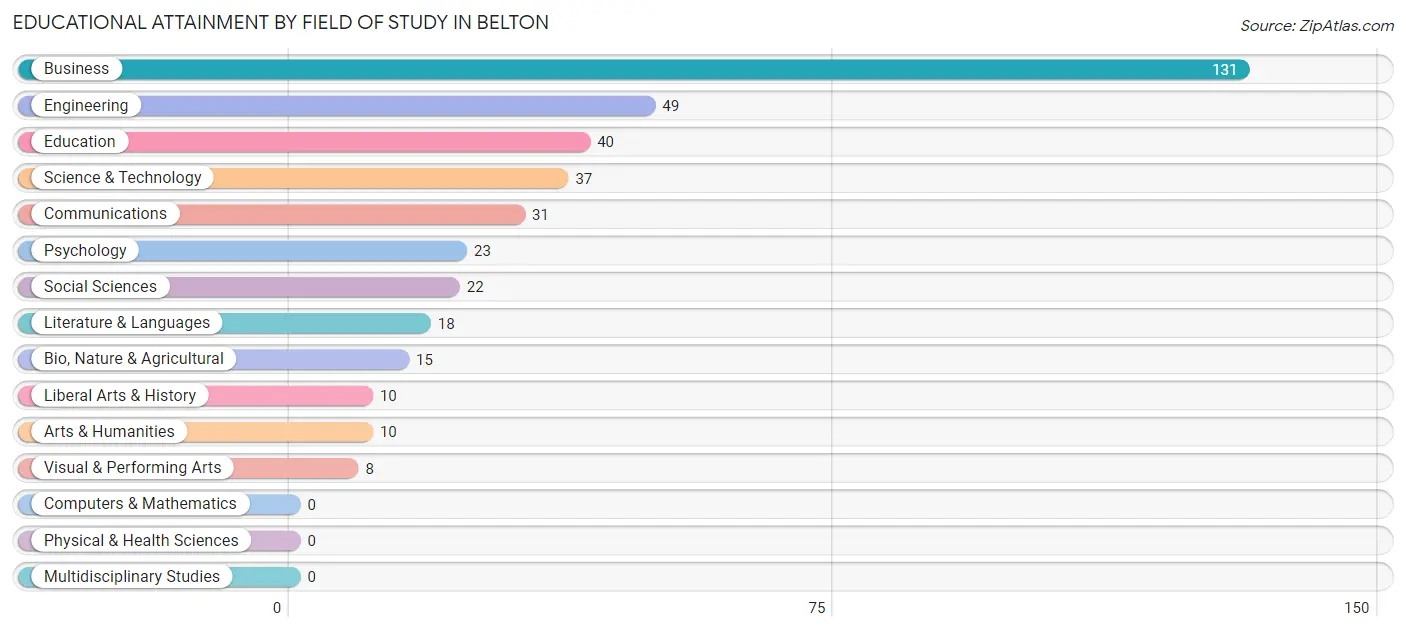
| Field of Study | # Graduates | % Graduates |
| Computers & Mathematics | 0 | 0.0% |
| Bio, Nature & Agricultural | 15 | 3.8% |
| Physical & Health Sciences | 0 | 0.0% |
| Psychology | 23 | 5.8% |
| Social Sciences | 22 | 5.6% |
| Engineering | 49 | 12.4% |
| Multidisciplinary Studies | 0 | 0.0% |
| Science & Technology | 37 | 9.4% |
| Business | 131 | 33.3% |
| Education | 40 | 10.2% |
| Literature & Languages | 18 | 4.6% |
| Liberal Arts & History | 10 | 2.5% |
| Visual & Performing Arts | 8 | 2.0% |
| Communications | 31 | 7.9% |
| Arts & Humanities | 10 | 2.5% |
| Total | 394 | 100.0% |
Transportation & Commute in Belton
Vehicle Availability by Sex in Belton
The most prevalent vehicle ownership categories in Belton are males with 2 vehicles (352, accounting for 42.1%) and females with 2 vehicles (366, making up 29.0%).
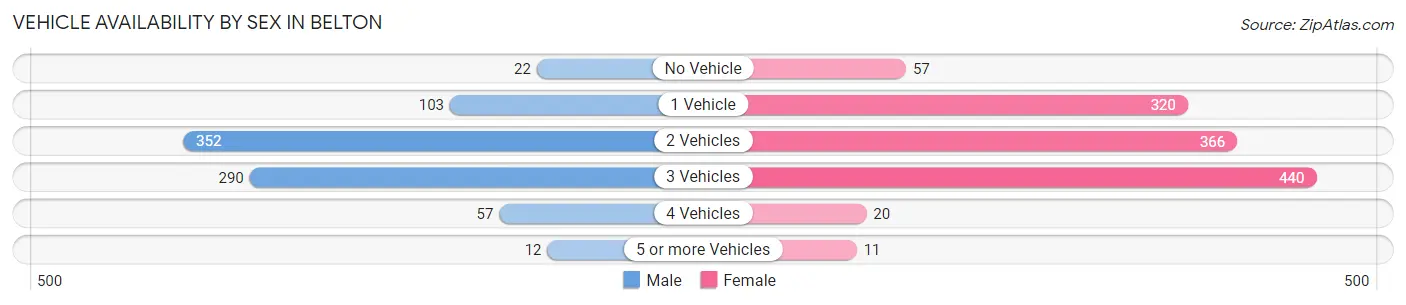
| Vehicles Available | Male | Female |
| No Vehicle | 22 (2.6%) | 57 (4.7%) |
| 1 Vehicle | 103 (12.3%) | 320 (26.4%) |
| 2 Vehicles | 352 (42.1%) | 366 (30.1%) |
| 3 Vehicles | 290 (34.7%) | 440 (36.2%) |
| 4 Vehicles | 57 (6.8%) | 20 (1.7%) |
| 5 or more Vehicles | 12 (1.4%) | 11 (0.9%) |
| Total | 836 (100.0%) | 1,214 (100.0%) |
Commute Time in Belton
The most frequently occuring commute durations in Belton are 35 to 39 minutes (461 commuters, 22.6%), 45 to 59 minutes (317 commuters, 15.5%), and 20 to 24 minutes (276 commuters, 13.5%).
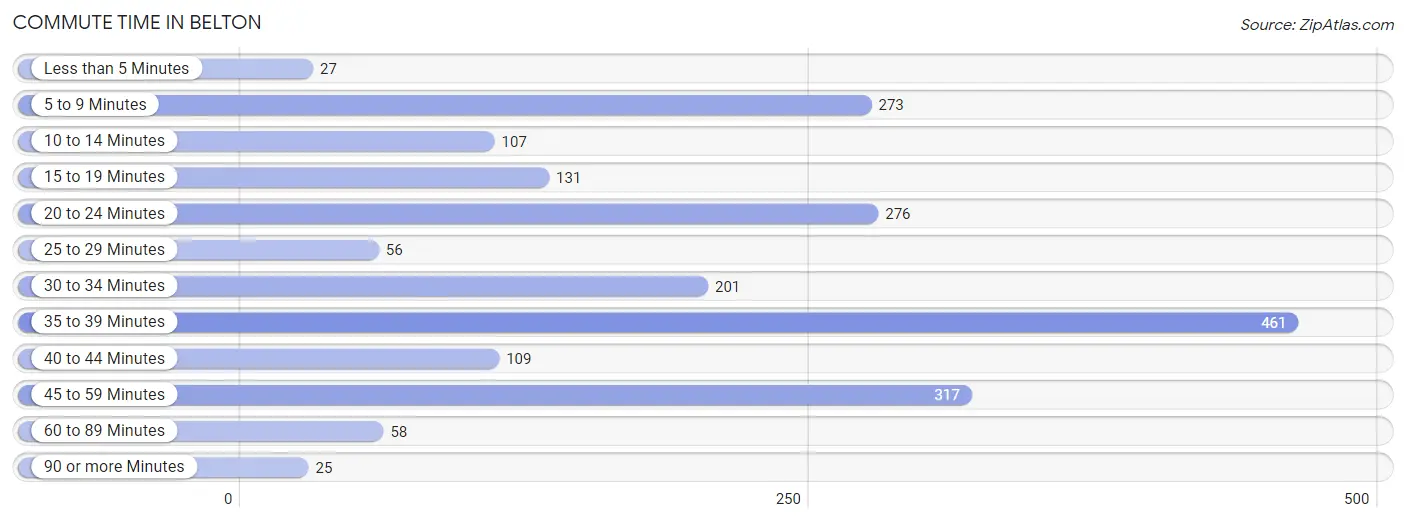
| Commute Time | # Commuters | % Commuters |
| Less than 5 Minutes | 27 | 1.3% |
| 5 to 9 Minutes | 273 | 13.4% |
| 10 to 14 Minutes | 107 | 5.2% |
| 15 to 19 Minutes | 131 | 6.4% |
| 20 to 24 Minutes | 276 | 13.5% |
| 25 to 29 Minutes | 56 | 2.7% |
| 30 to 34 Minutes | 201 | 9.9% |
| 35 to 39 Minutes | 461 | 22.6% |
| 40 to 44 Minutes | 109 | 5.3% |
| 45 to 59 Minutes | 317 | 15.5% |
| 60 to 89 Minutes | 58 | 2.8% |
| 90 or more Minutes | 25 | 1.2% |
Commute Time by Sex in Belton
The most common commute times in Belton are 35 to 39 minutes (255 commuters, 30.9%) for males and 5 to 9 minutes (241 commuters, 19.8%) for females.
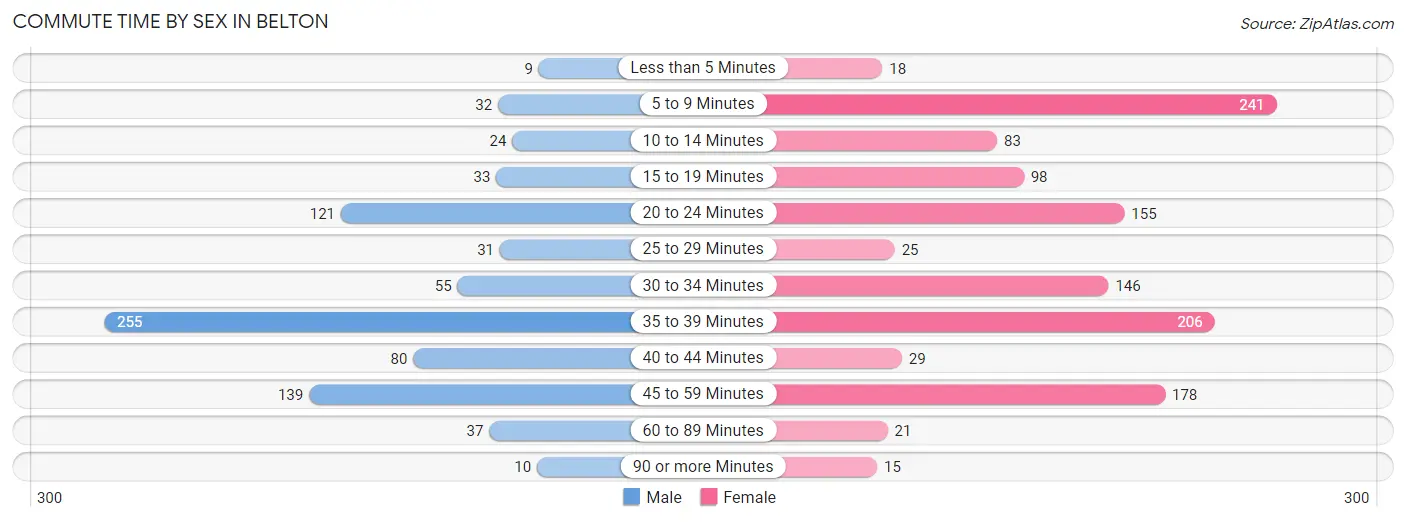
| Commute Time | Male | Female |
| Less than 5 Minutes | 9 (1.1%) | 18 (1.5%) |
| 5 to 9 Minutes | 32 (3.9%) | 241 (19.8%) |
| 10 to 14 Minutes | 24 (2.9%) | 83 (6.8%) |
| 15 to 19 Minutes | 33 (4.0%) | 98 (8.1%) |
| 20 to 24 Minutes | 121 (14.6%) | 155 (12.8%) |
| 25 to 29 Minutes | 31 (3.7%) | 25 (2.1%) |
| 30 to 34 Minutes | 55 (6.7%) | 146 (12.0%) |
| 35 to 39 Minutes | 255 (30.9%) | 206 (17.0%) |
| 40 to 44 Minutes | 80 (9.7%) | 29 (2.4%) |
| 45 to 59 Minutes | 139 (16.8%) | 178 (14.6%) |
| 60 to 89 Minutes | 37 (4.5%) | 21 (1.7%) |
| 90 or more Minutes | 10 (1.2%) | 15 (1.2%) |
Time of Departure to Work by Sex in Belton
The most frequent times of departure to work in Belton are 6:00 AM to 6:29 AM (225, 27.2%) for males and 4:00 PM to 11:59 PM (254, 20.9%) for females.
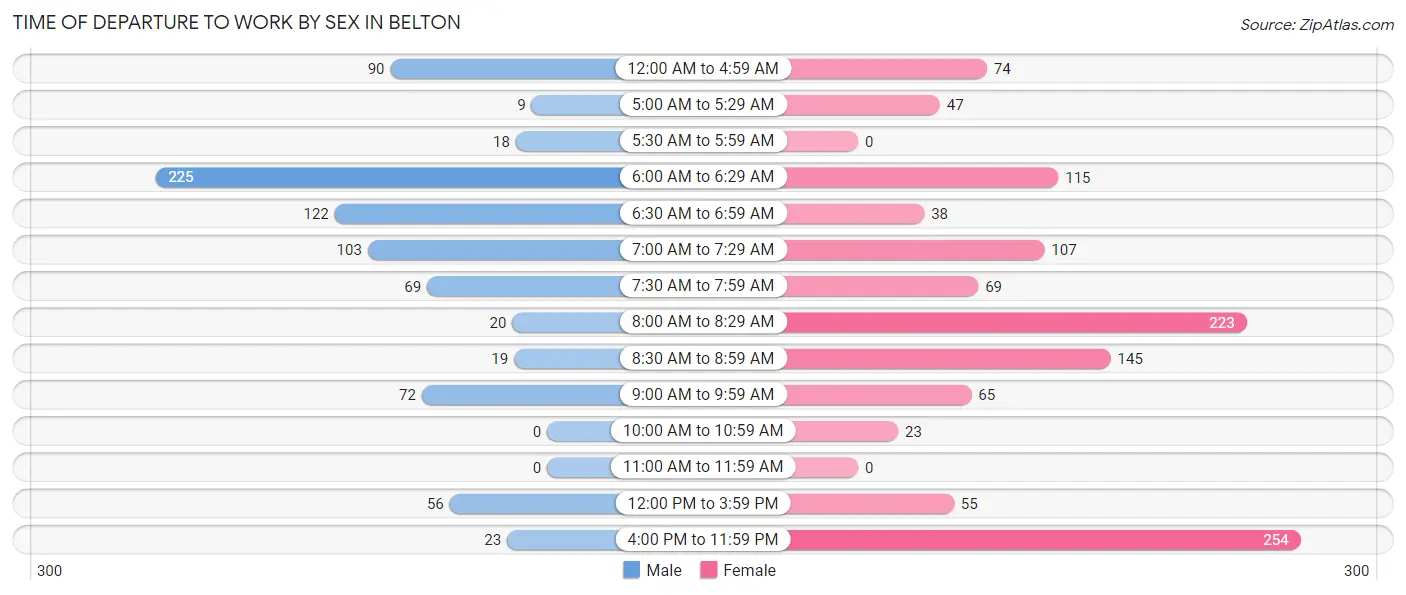
| Time of Departure | Male | Female |
| 12:00 AM to 4:59 AM | 90 (10.9%) | 74 (6.1%) |
| 5:00 AM to 5:29 AM | 9 (1.1%) | 47 (3.9%) |
| 5:30 AM to 5:59 AM | 18 (2.2%) | 0 (0.0%) |
| 6:00 AM to 6:29 AM | 225 (27.2%) | 115 (9.5%) |
| 6:30 AM to 6:59 AM | 122 (14.8%) | 38 (3.1%) |
| 7:00 AM to 7:29 AM | 103 (12.5%) | 107 (8.8%) |
| 7:30 AM to 7:59 AM | 69 (8.4%) | 69 (5.7%) |
| 8:00 AM to 8:29 AM | 20 (2.4%) | 223 (18.3%) |
| 8:30 AM to 8:59 AM | 19 (2.3%) | 145 (11.9%) |
| 9:00 AM to 9:59 AM | 72 (8.7%) | 65 (5.3%) |
| 10:00 AM to 10:59 AM | 0 (0.0%) | 23 (1.9%) |
| 11:00 AM to 11:59 AM | 0 (0.0%) | 0 (0.0%) |
| 12:00 PM to 3:59 PM | 56 (6.8%) | 55 (4.5%) |
| 4:00 PM to 11:59 PM | 23 (2.8%) | 254 (20.9%) |
| Total | 826 (100.0%) | 1,215 (100.0%) |
Housing Occupancy in Belton
Occupancy by Ownership in Belton
Of the total 1,617 dwellings in Belton, owner-occupied units account for 1,070 (66.2%), while renter-occupied units make up 547 (33.8%).
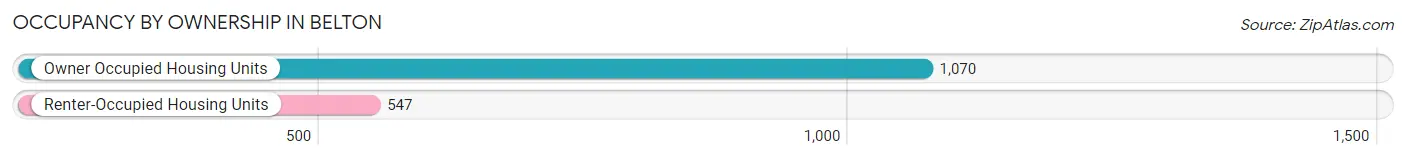
| Occupancy | # Housing Units | % Housing Units |
| Owner Occupied Housing Units | 1,070 | 66.2% |
| Renter-Occupied Housing Units | 547 | 33.8% |
| Total Occupied Housing Units | 1,617 | 100.0% |
Occupancy by Household Size in Belton
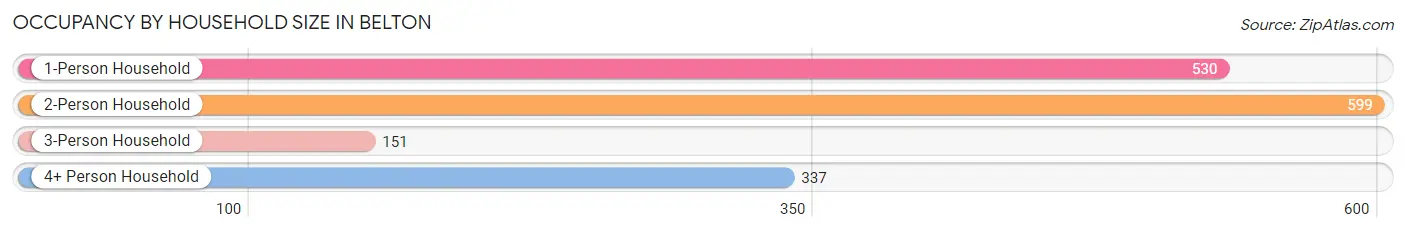
| Household Size | # Housing Units | % Housing Units |
| 1-Person Household | 530 | 32.8% |
| 2-Person Household | 599 | 37.0% |
| 3-Person Household | 151 | 9.3% |
| 4+ Person Household | 337 | 20.8% |
| Total Housing Units | 1,617 | 100.0% |
Occupancy by Ownership by Household Size in Belton
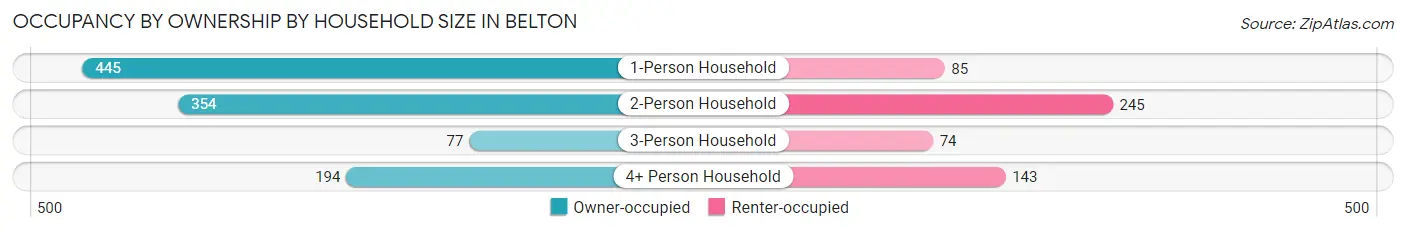
| Household Size | Owner-occupied | Renter-occupied |
| 1-Person Household | 445 (84.0%) | 85 (16.0%) |
| 2-Person Household | 354 (59.1%) | 245 (40.9%) |
| 3-Person Household | 77 (51.0%) | 74 (49.0%) |
| 4+ Person Household | 194 (57.6%) | 143 (42.4%) |
| Total Housing Units | 1,070 (66.2%) | 547 (33.8%) |
Occupancy by Educational Attainment in Belton
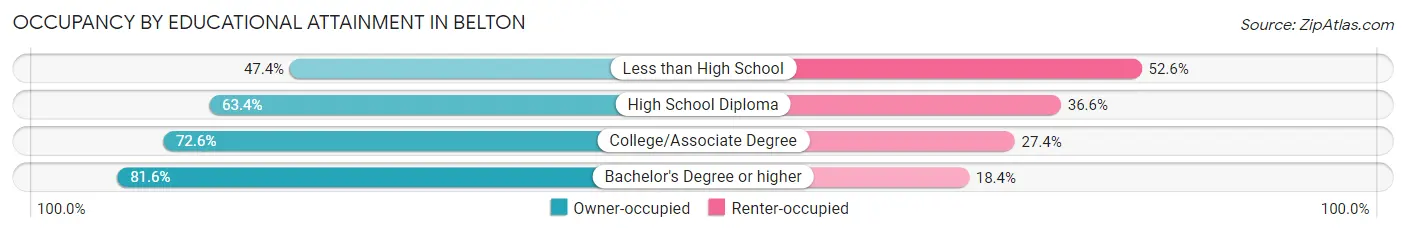
| Household Size | Owner-occupied | Renter-occupied |
| Less than High School | 136 (47.4%) | 151 (52.6%) |
| High School Diploma | 369 (63.4%) | 213 (36.6%) |
| College/Associate Degree | 365 (72.6%) | 138 (27.4%) |
| Bachelor's Degree or higher | 200 (81.6%) | 45 (18.4%) |
Occupancy by Age of Householder in Belton
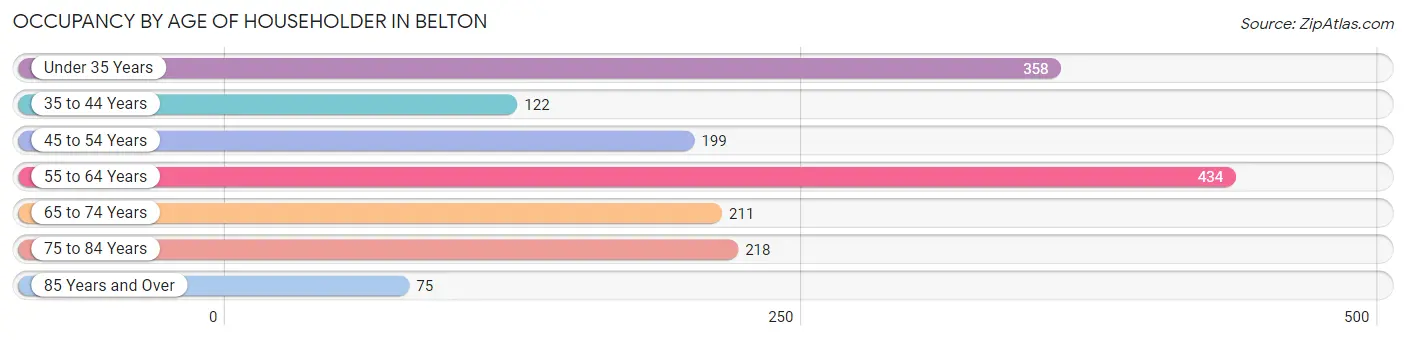
| Age Bracket | # Households | % Households |
| Under 35 Years | 358 | 22.1% |
| 35 to 44 Years | 122 | 7.5% |
| 45 to 54 Years | 199 | 12.3% |
| 55 to 64 Years | 434 | 26.8% |
| 65 to 74 Years | 211 | 13.1% |
| 75 to 84 Years | 218 | 13.5% |
| 85 Years and Over | 75 | 4.6% |
| Total | 1,617 | 100.0% |
Housing Finances in Belton
Median Income by Occupancy in Belton
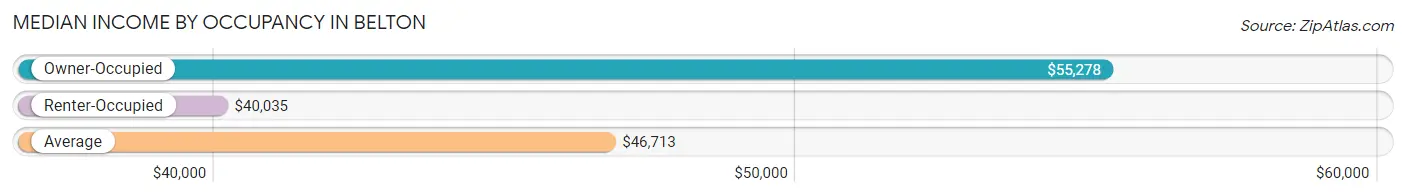
| Occupancy Type | # Households | Median Income |
| Owner-Occupied | 1,070 (66.2%) | $55,278 |
| Renter-Occupied | 547 (33.8%) | $40,035 |
| Average | 1,617 (100.0%) | $46,713 |
Occupancy by Householder Income Bracket in Belton
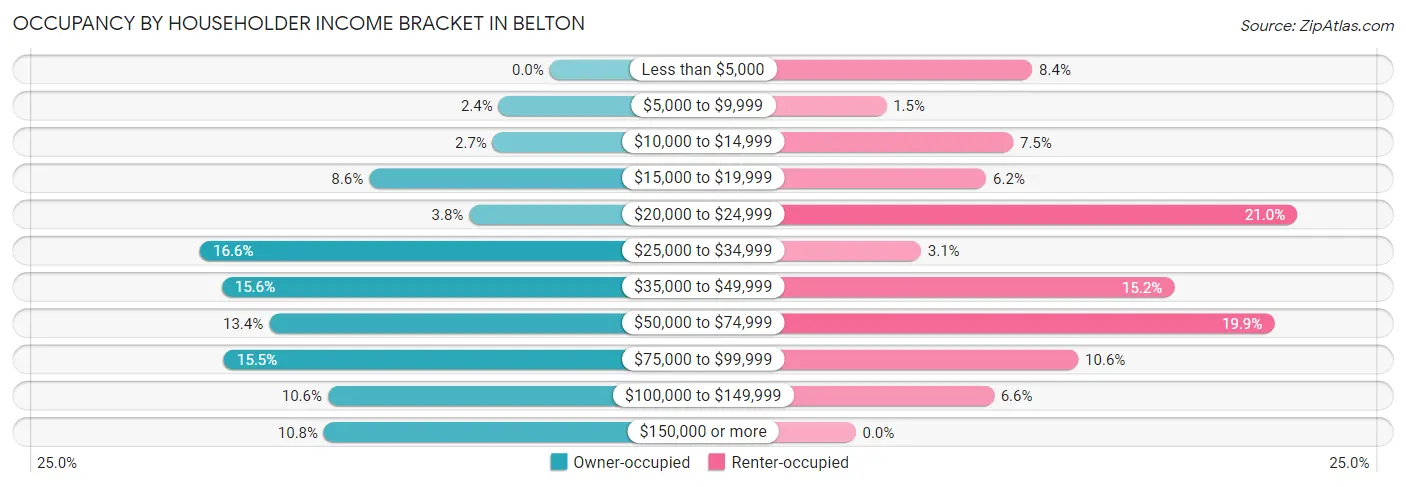
| Income Bracket | Owner-occupied | Renter-occupied |
| Less than $5,000 | 0 (0.0%) | 46 (8.4%) |
| $5,000 to $9,999 | 26 (2.4%) | 8 (1.5%) |
| $10,000 to $14,999 | 29 (2.7%) | 41 (7.5%) |
| $15,000 to $19,999 | 92 (8.6%) | 34 (6.2%) |
| $20,000 to $24,999 | 41 (3.8%) | 115 (21.0%) |
| $25,000 to $34,999 | 178 (16.6%) | 17 (3.1%) |
| $35,000 to $49,999 | 167 (15.6%) | 83 (15.2%) |
| $50,000 to $74,999 | 143 (13.4%) | 109 (19.9%) |
| $75,000 to $99,999 | 166 (15.5%) | 58 (10.6%) |
| $100,000 to $149,999 | 113 (10.6%) | 36 (6.6%) |
| $150,000 or more | 115 (10.7%) | 0 (0.0%) |
| Total | 1,070 (100.0%) | 547 (100.0%) |
Monthly Housing Cost Tiers in Belton
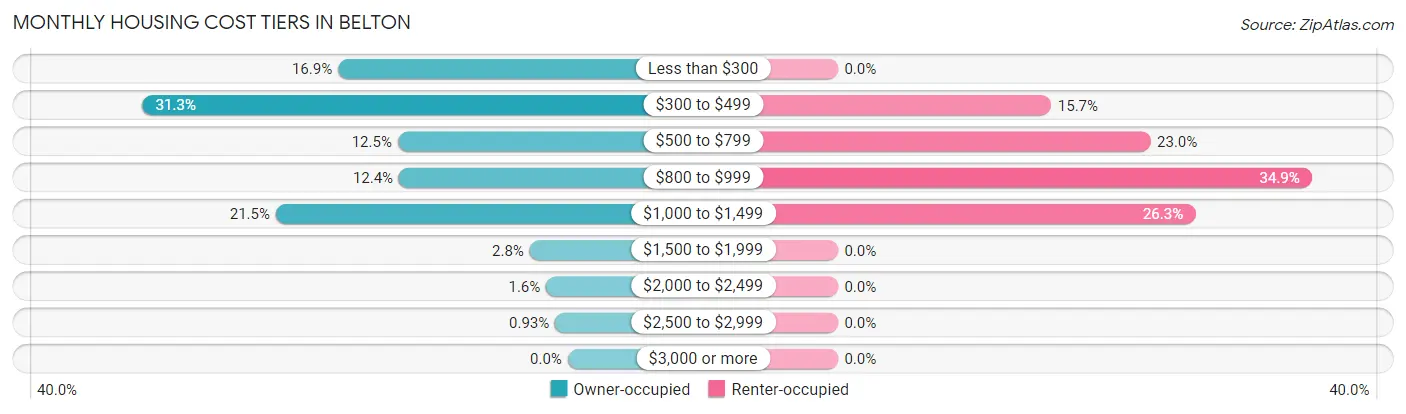
| Monthly Cost | Owner-occupied | Renter-occupied |
| Less than $300 | 181 (16.9%) | 0 (0.0%) |
| $300 to $499 | 335 (31.3%) | 86 (15.7%) |
| $500 to $799 | 134 (12.5%) | 126 (23.0%) |
| $800 to $999 | 133 (12.4%) | 191 (34.9%) |
| $1,000 to $1,499 | 230 (21.5%) | 144 (26.3%) |
| $1,500 to $1,999 | 30 (2.8%) | 0 (0.0%) |
| $2,000 to $2,499 | 17 (1.6%) | 0 (0.0%) |
| $2,500 to $2,999 | 10 (0.9%) | 0 (0.0%) |
| $3,000 or more | 0 (0.0%) | 0 (0.0%) |
| Total | 1,070 (100.0%) | 547 (100.0%) |
Physical Housing Characteristics in Belton
Housing Structures in Belton
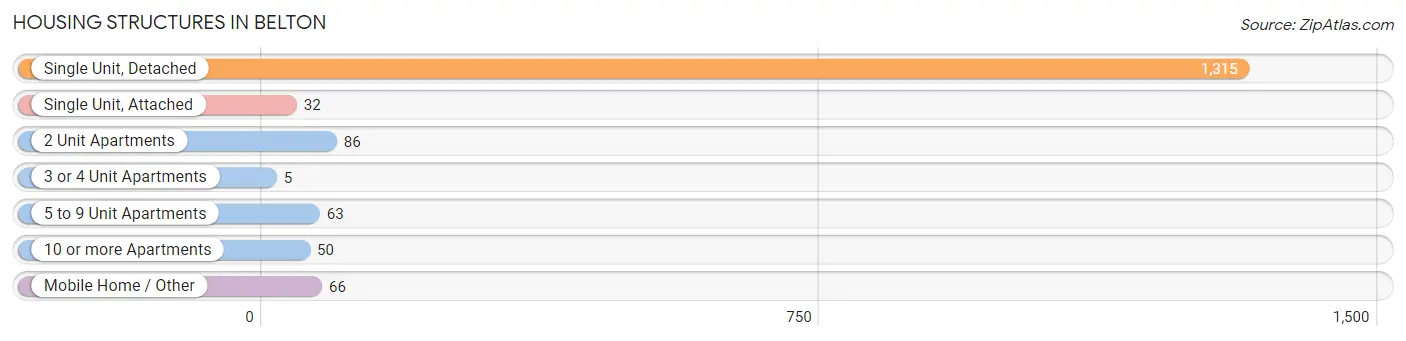
| Structure Type | # Housing Units | % Housing Units |
| Single Unit, Detached | 1,315 | 81.3% |
| Single Unit, Attached | 32 | 2.0% |
| 2 Unit Apartments | 86 | 5.3% |
| 3 or 4 Unit Apartments | 5 | 0.3% |
| 5 to 9 Unit Apartments | 63 | 3.9% |
| 10 or more Apartments | 50 | 3.1% |
| Mobile Home / Other | 66 | 4.1% |
| Total | 1,617 | 100.0% |
Housing Structures by Occupancy in Belton
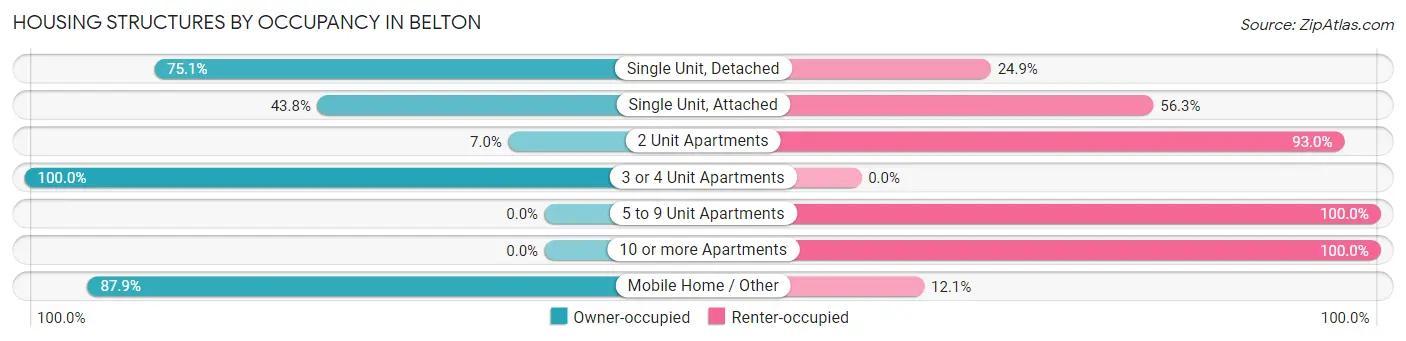
| Structure Type | Owner-occupied | Renter-occupied |
| Single Unit, Detached | 987 (75.1%) | 328 (24.9%) |
| Single Unit, Attached | 14 (43.8%) | 18 (56.2%) |
| 2 Unit Apartments | 6 (7.0%) | 80 (93.0%) |
| 3 or 4 Unit Apartments | 5 (100.0%) | 0 (0.0%) |
| 5 to 9 Unit Apartments | 0 (0.0%) | 63 (100.0%) |
| 10 or more Apartments | 0 (0.0%) | 50 (100.0%) |
| Mobile Home / Other | 58 (87.9%) | 8 (12.1%) |
| Total | 1,070 (66.2%) | 547 (33.8%) |
Housing Structures by Number of Rooms in Belton
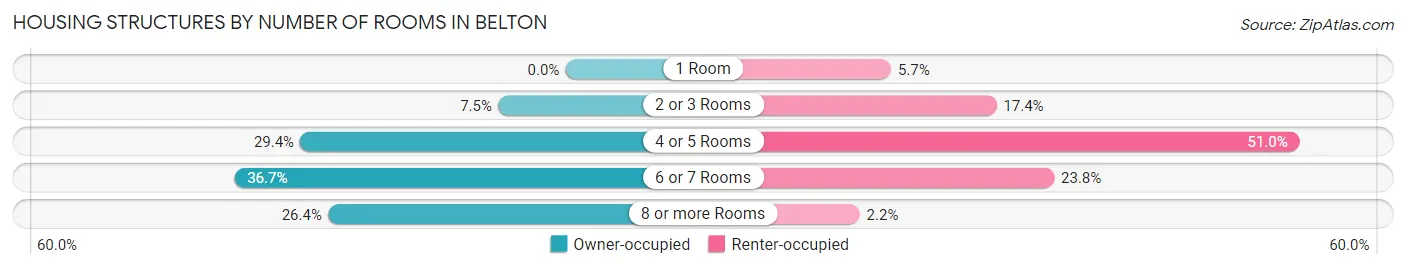
| Number of Rooms | Owner-occupied | Renter-occupied |
| 1 Room | 0 (0.0%) | 31 (5.7%) |
| 2 or 3 Rooms | 80 (7.5%) | 95 (17.4%) |
| 4 or 5 Rooms | 315 (29.4%) | 279 (51.0%) |
| 6 or 7 Rooms | 393 (36.7%) | 130 (23.8%) |
| 8 or more Rooms | 282 (26.4%) | 12 (2.2%) |
| Total | 1,070 (100.0%) | 547 (100.0%) |
Housing Structure by Heating Type in Belton
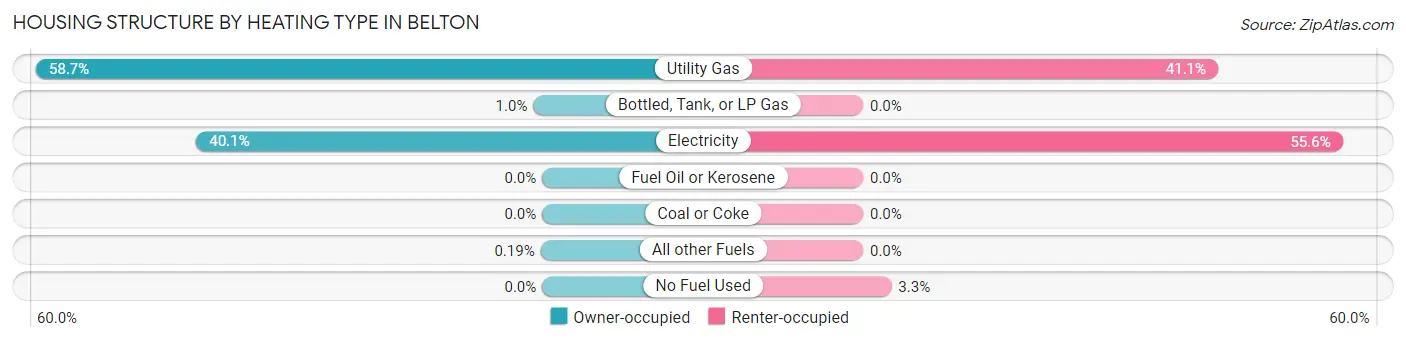
| Heating Type | Owner-occupied | Renter-occupied |
| Utility Gas | 628 (58.7%) | 225 (41.1%) |
| Bottled, Tank, or LP Gas | 11 (1.0%) | 0 (0.0%) |
| Electricity | 429 (40.1%) | 304 (55.6%) |
| Fuel Oil or Kerosene | 0 (0.0%) | 0 (0.0%) |
| Coal or Coke | 0 (0.0%) | 0 (0.0%) |
| All other Fuels | 2 (0.2%) | 0 (0.0%) |
| No Fuel Used | 0 (0.0%) | 18 (3.3%) |
| Total | 1,070 (100.0%) | 547 (100.0%) |
Household Vehicle Usage in Belton
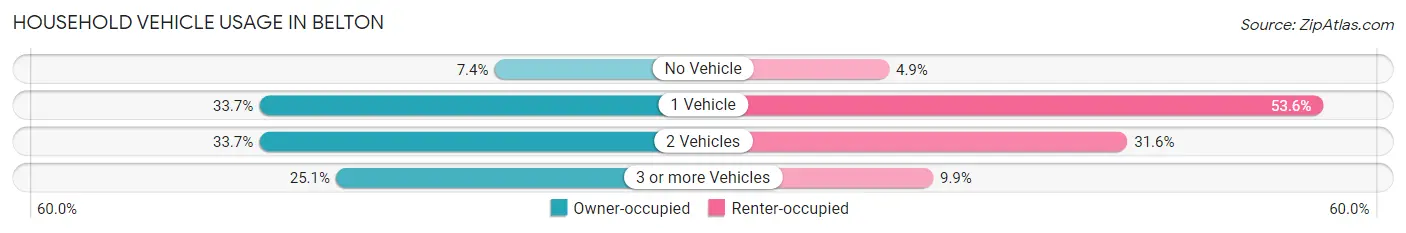
| Vehicles per Household | Owner-occupied | Renter-occupied |
| No Vehicle | 79 (7.4%) | 27 (4.9%) |
| 1 Vehicle | 361 (33.7%) | 293 (53.6%) |
| 2 Vehicles | 361 (33.7%) | 173 (31.6%) |
| 3 or more Vehicles | 269 (25.1%) | 54 (9.9%) |
| Total | 1,070 (100.0%) | 547 (100.0%) |
Real Estate & Mortgages in Belton
Real Estate and Mortgage Overview in Belton
| Characteristic | Without Mortgage | With Mortgage |
| Housing Units | 633 | 437 |
| Median Property Value | $96,100 | $149,000 |
| Median Household Income | $38,594 | $97 |
| Monthly Housing Costs | $342 | $0 |
| Real Estate Taxes | $650 | $5 |
Property Value by Mortgage Status in Belton
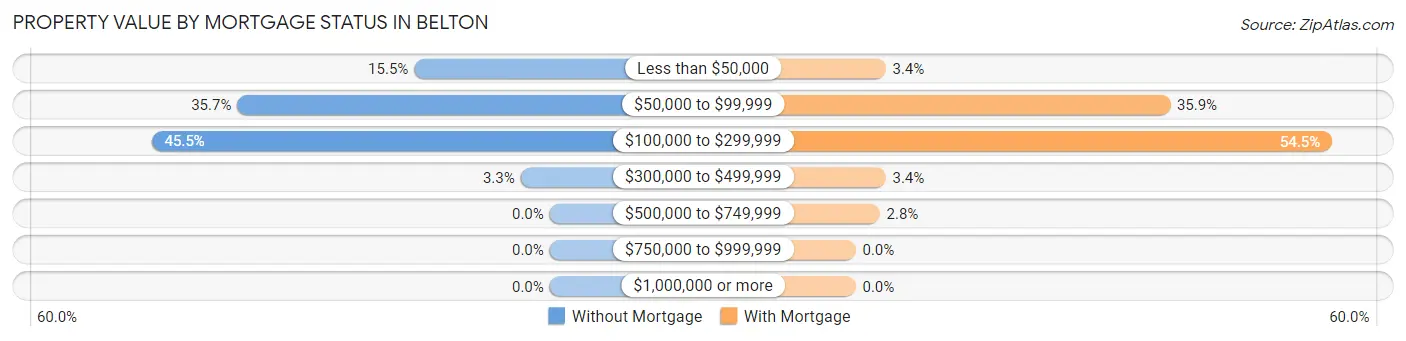
| Property Value | Without Mortgage | With Mortgage |
| Less than $50,000 | 98 (15.5%) | 15 (3.4%) |
| $50,000 to $99,999 | 226 (35.7%) | 157 (35.9%) |
| $100,000 to $299,999 | 288 (45.5%) | 238 (54.5%) |
| $300,000 to $499,999 | 21 (3.3%) | 15 (3.4%) |
| $500,000 to $749,999 | 0 (0.0%) | 12 (2.8%) |
| $750,000 to $999,999 | 0 (0.0%) | 0 (0.0%) |
| $1,000,000 or more | 0 (0.0%) | 0 (0.0%) |
| Total | 633 (100.0%) | 437 (100.0%) |
Household Income by Mortgage Status in Belton
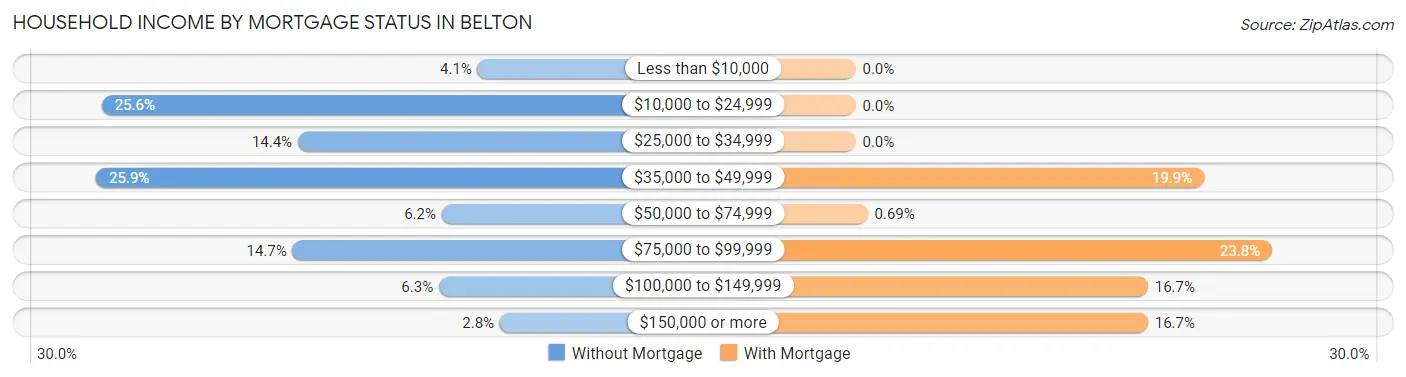
| Household Income | Without Mortgage | With Mortgage |
| Less than $10,000 | 26 (4.1%) | 0 (0.0%) |
| $10,000 to $24,999 | 162 (25.6%) | 0 (0.0%) |
| $25,000 to $34,999 | 91 (14.4%) | 0 (0.0%) |
| $35,000 to $49,999 | 164 (25.9%) | 87 (19.9%) |
| $50,000 to $74,999 | 39 (6.2%) | 3 (0.7%) |
| $75,000 to $99,999 | 93 (14.7%) | 104 (23.8%) |
| $100,000 to $149,999 | 40 (6.3%) | 73 (16.7%) |
| $150,000 or more | 18 (2.8%) | 73 (16.7%) |
| Total | 633 (100.0%) | 437 (100.0%) |
Property Value to Household Income Ratio in Belton
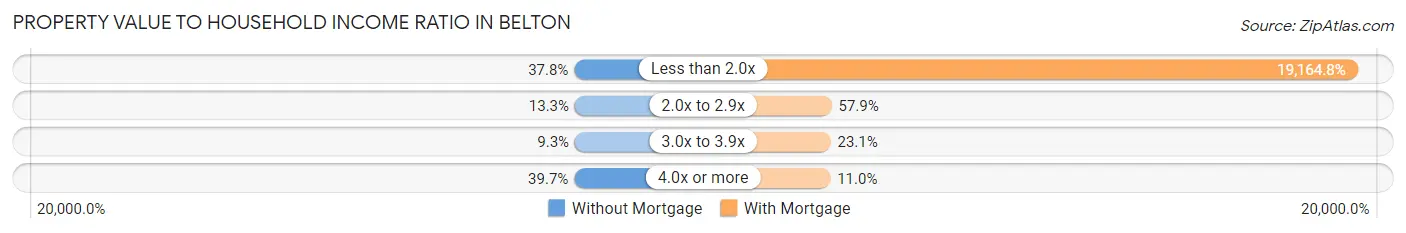
| Value-to-Income Ratio | Without Mortgage | With Mortgage |
| Less than 2.0x | 239 (37.8%) | 83,750 (19,164.8%) |
| 2.0x to 2.9x | 84 (13.3%) | 253 (57.9%) |
| 3.0x to 3.9x | 59 (9.3%) | 101 (23.1%) |
| 4.0x or more | 251 (39.7%) | 48 (11.0%) |
| Total | 633 (100.0%) | 437 (100.0%) |
Real Estate Taxes by Mortgage Status in Belton
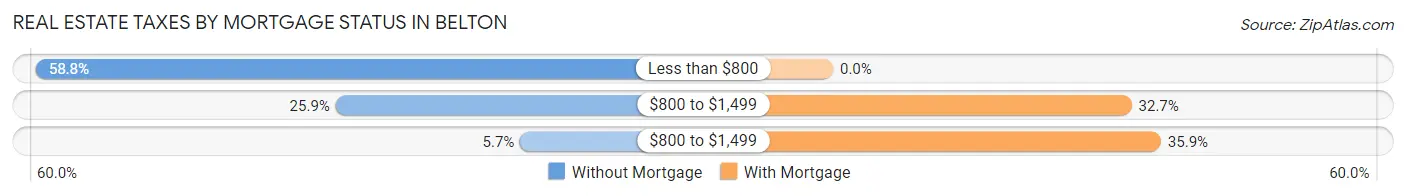
| Property Taxes | Without Mortgage | With Mortgage |
| Less than $800 | 372 (58.8%) | 0 (0.0%) |
| $800 to $1,499 | 164 (25.9%) | 143 (32.7%) |
| $800 to $1,499 | 36 (5.7%) | 157 (35.9%) |
| Total | 633 (100.0%) | 437 (100.0%) |
Health & Disability in Belton
Health Insurance Coverage by Age in Belton
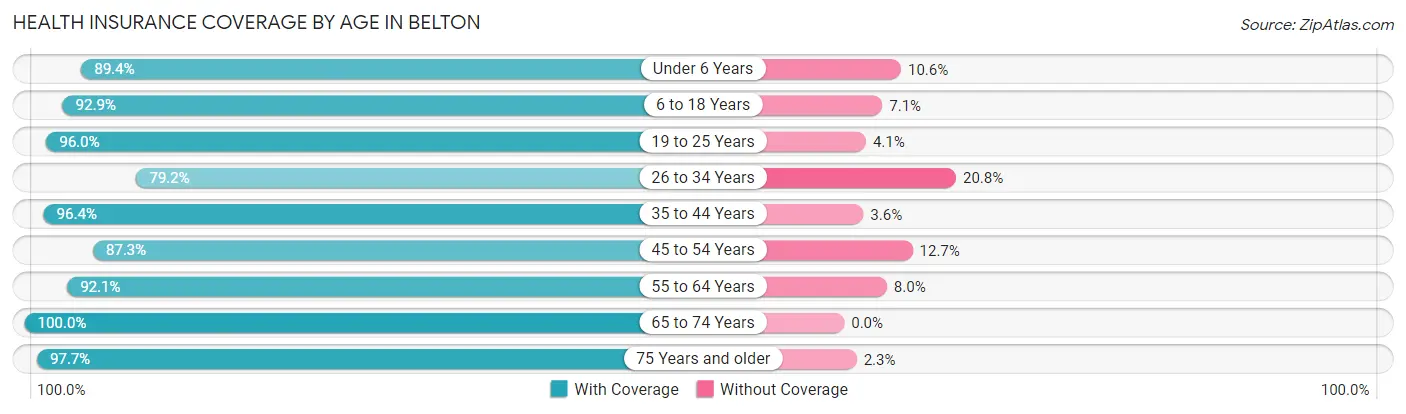
| Age Bracket | With Coverage | Without Coverage |
| Under 6 Years | 414 (89.4%) | 49 (10.6%) |
| 6 to 18 Years | 641 (92.9%) | 49 (7.1%) |
| 19 to 25 Years | 213 (96.0%) | 9 (4.1%) |
| 26 to 34 Years | 638 (79.2%) | 168 (20.8%) |
| 35 to 44 Years | 244 (96.4%) | 9 (3.6%) |
| 45 to 54 Years | 411 (87.3%) | 60 (12.7%) |
| 55 to 64 Years | 521 (92.0%) | 45 (8.0%) |
| 65 to 74 Years | 496 (100.0%) | 0 (0.0%) |
| 75 Years and older | 381 (97.7%) | 9 (2.3%) |
| Total | 3,959 (90.9%) | 398 (9.1%) |
Health Insurance Coverage by Citizenship Status in Belton
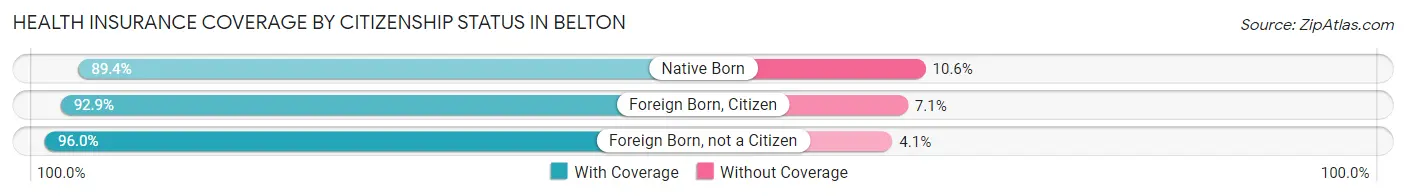
| Citizenship Status | With Coverage | Without Coverage |
| Native Born | 414 (89.4%) | 49 (10.6%) |
| Foreign Born, Citizen | 641 (92.9%) | 49 (7.1%) |
| Foreign Born, not a Citizen | 213 (96.0%) | 9 (4.1%) |
Health Insurance Coverage by Household Income in Belton
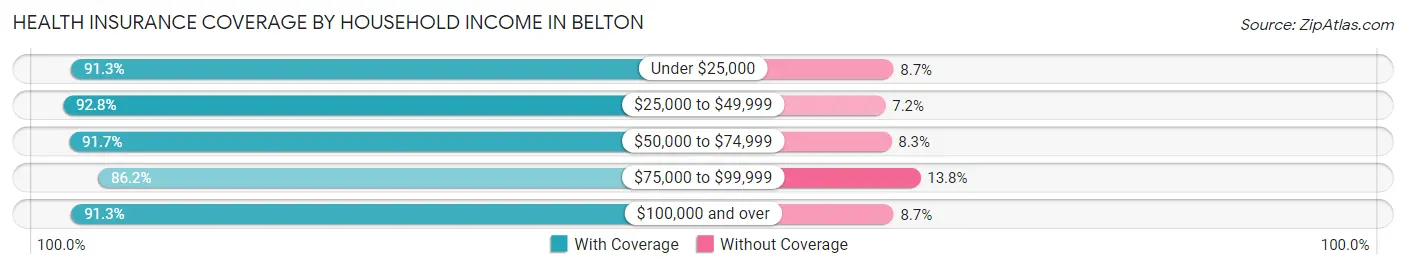
| Household Income | With Coverage | Without Coverage |
| Under $25,000 | 816 (91.3%) | 78 (8.7%) |
| $25,000 to $49,999 | 656 (92.8%) | 51 (7.2%) |
| $50,000 to $74,999 | 660 (91.7%) | 60 (8.3%) |
| $75,000 to $99,999 | 526 (86.2%) | 84 (13.8%) |
| $100,000 and over | 1,295 (91.3%) | 124 (8.7%) |
Public vs Private Health Insurance Coverage by Age in Belton
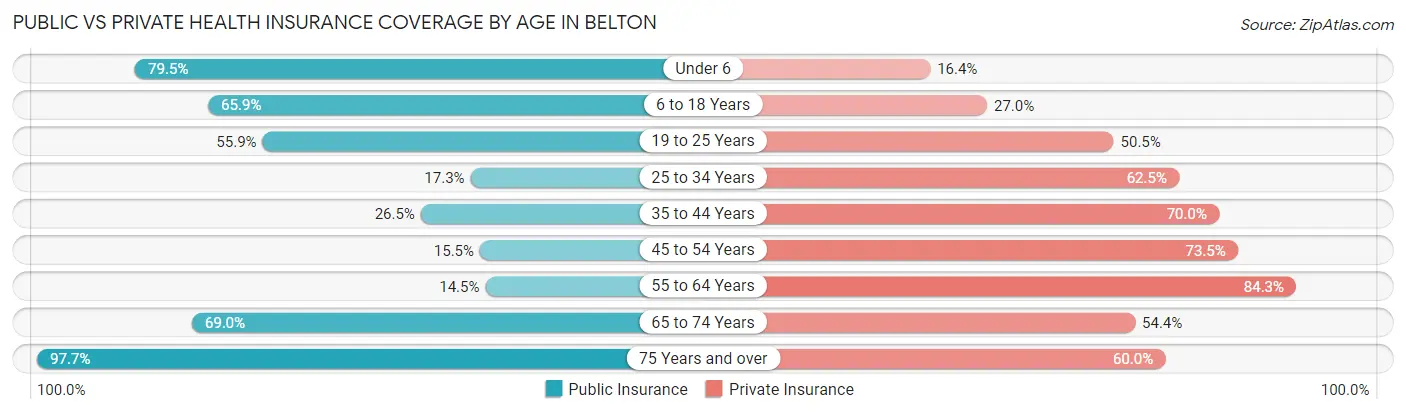
| Age Bracket | Public Insurance | Private Insurance |
| Under 6 | 368 (79.5%) | 76 (16.4%) |
| 6 to 18 Years | 455 (65.9%) | 186 (27.0%) |
| 19 to 25 Years | 124 (55.9%) | 112 (50.4%) |
| 25 to 34 Years | 139 (17.2%) | 504 (62.5%) |
| 35 to 44 Years | 67 (26.5%) | 177 (70.0%) |
| 45 to 54 Years | 73 (15.5%) | 346 (73.5%) |
| 55 to 64 Years | 82 (14.5%) | 477 (84.3%) |
| 65 to 74 Years | 342 (69.0%) | 270 (54.4%) |
| 75 Years and over | 381 (97.7%) | 234 (60.0%) |
| Total | 2,031 (46.6%) | 2,382 (54.7%) |
Disability Status by Sex by Age in Belton
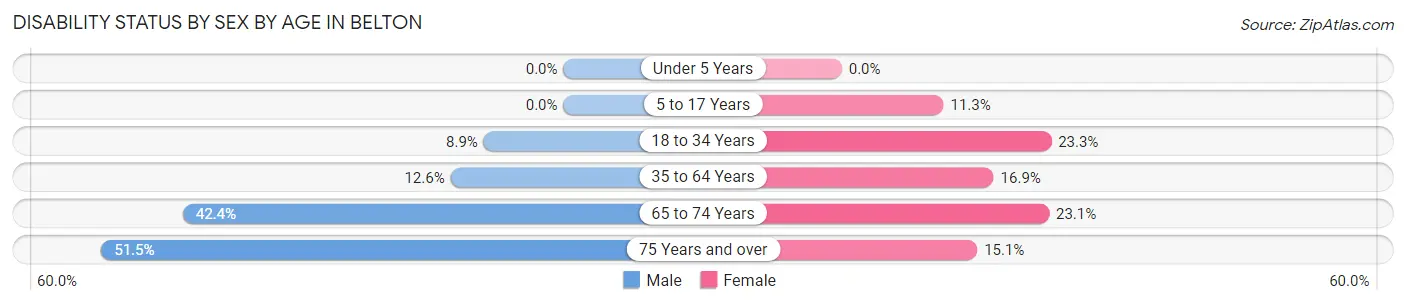
| Age Bracket | Male | Female |
| Under 5 Years | 0 (0.0%) | 0 (0.0%) |
| 5 to 17 Years | 0 (0.0%) | 52 (11.3%) |
| 18 to 34 Years | 41 (8.9%) | 132 (23.3%) |
| 35 to 64 Years | 67 (12.6%) | 128 (16.9%) |
| 65 to 74 Years | 89 (42.4%) | 66 (23.1%) |
| 75 Years and over | 71 (51.4%) | 38 (15.1%) |
Disability Class by Sex by Age in Belton
Disability Class: Hearing Difficulty
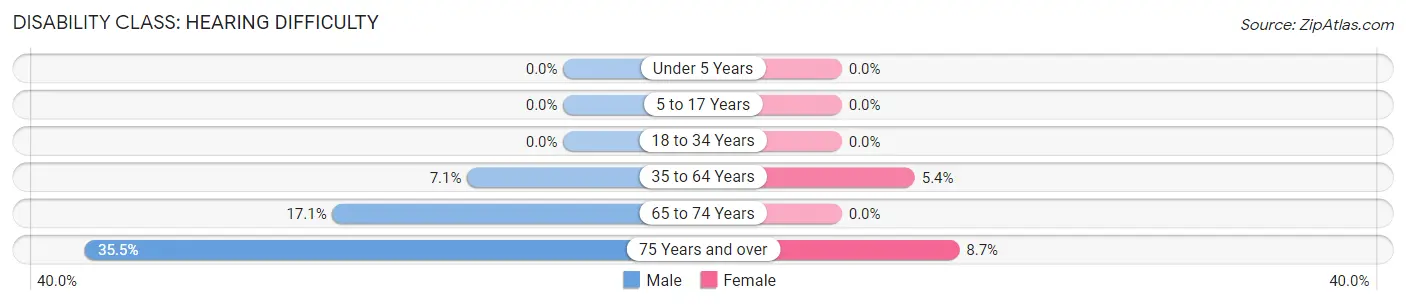
| Age Bracket | Male | Female |
| Under 5 Years | 0 (0.0%) | 0 (0.0%) |
| 5 to 17 Years | 0 (0.0%) | 0 (0.0%) |
| 18 to 34 Years | 0 (0.0%) | 0 (0.0%) |
| 35 to 64 Years | 38 (7.1%) | 41 (5.4%) |
| 65 to 74 Years | 36 (17.1%) | 0 (0.0%) |
| 75 Years and over | 49 (35.5%) | 22 (8.7%) |
Disability Class: Vision Difficulty
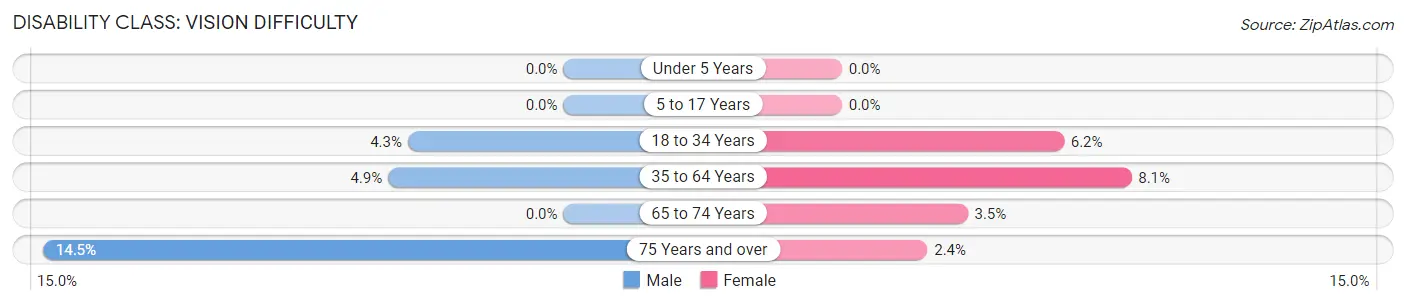
| Age Bracket | Male | Female |
| Under 5 Years | 0 (0.0%) | 0 (0.0%) |
| 5 to 17 Years | 0 (0.0%) | 0 (0.0%) |
| 18 to 34 Years | 20 (4.3%) | 35 (6.2%) |
| 35 to 64 Years | 26 (4.9%) | 61 (8.1%) |
| 65 to 74 Years | 0 (0.0%) | 10 (3.5%) |
| 75 Years and over | 20 (14.5%) | 6 (2.4%) |
Disability Class: Cognitive Difficulty
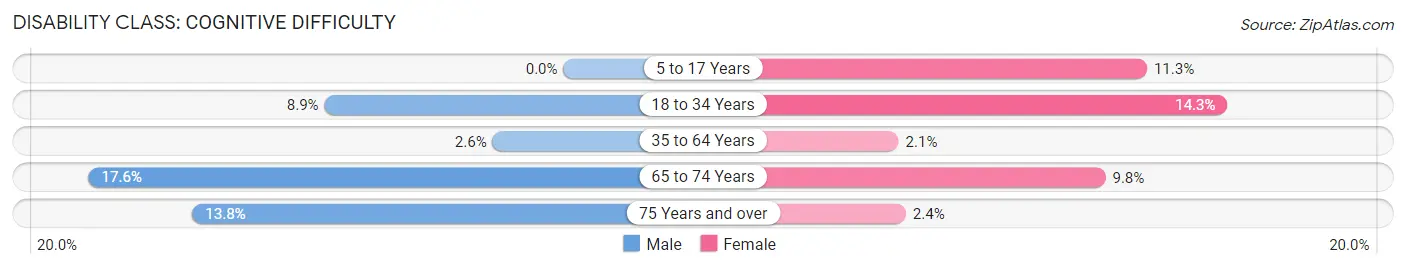
| Age Bracket | Male | Female |
| 5 to 17 Years | 0 (0.0%) | 52 (11.3%) |
| 18 to 34 Years | 41 (8.9%) | 81 (14.3%) |
| 35 to 64 Years | 14 (2.6%) | 16 (2.1%) |
| 65 to 74 Years | 37 (17.6%) | 28 (9.8%) |
| 75 Years and over | 19 (13.8%) | 6 (2.4%) |
Disability Class: Ambulatory Difficulty
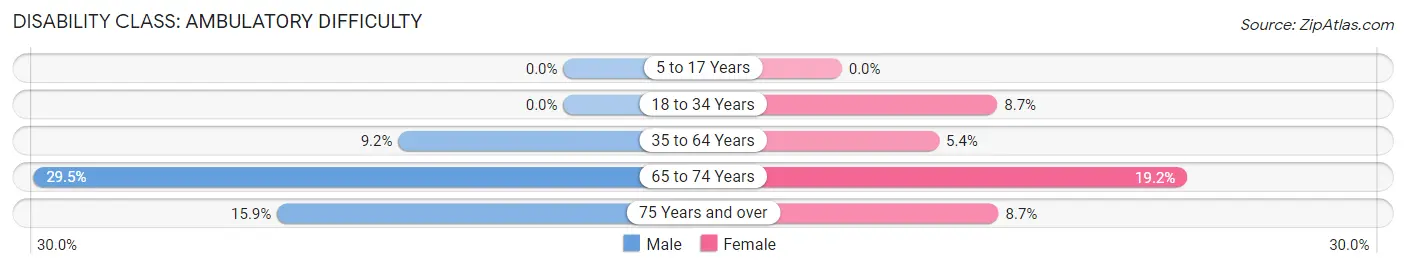
| Age Bracket | Male | Female |
| 5 to 17 Years | 0 (0.0%) | 0 (0.0%) |
| 18 to 34 Years | 0 (0.0%) | 49 (8.7%) |
| 35 to 64 Years | 49 (9.2%) | 41 (5.4%) |
| 65 to 74 Years | 62 (29.5%) | 55 (19.2%) |
| 75 Years and over | 22 (15.9%) | 22 (8.7%) |
Disability Class: Self-Care Difficulty
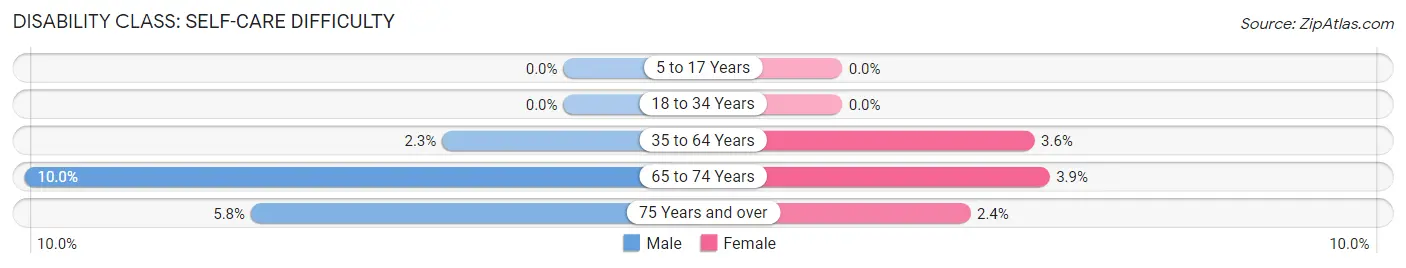
| Age Bracket | Male | Female |
| 5 to 17 Years | 0 (0.0%) | 0 (0.0%) |
| 18 to 34 Years | 0 (0.0%) | 0 (0.0%) |
| 35 to 64 Years | 12 (2.2%) | 27 (3.6%) |
| 65 to 74 Years | 21 (10.0%) | 11 (3.8%) |
| 75 Years and over | 8 (5.8%) | 6 (2.4%) |
Technology Access in Belton
Computing Device Access in Belton
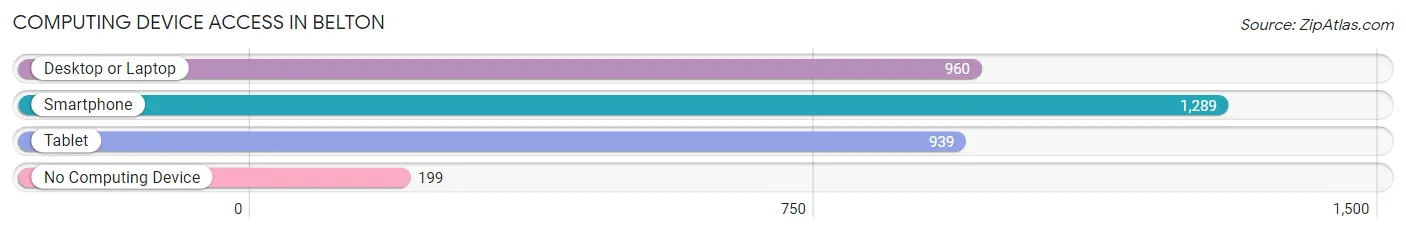
| Device Type | # Households | % Households |
| Desktop or Laptop | 960 | 59.4% |
| Smartphone | 1,289 | 79.7% |
| Tablet | 939 | 58.1% |
| No Computing Device | 199 | 12.3% |
| Total | 1,617 | 100.0% |
Internet Access in Belton
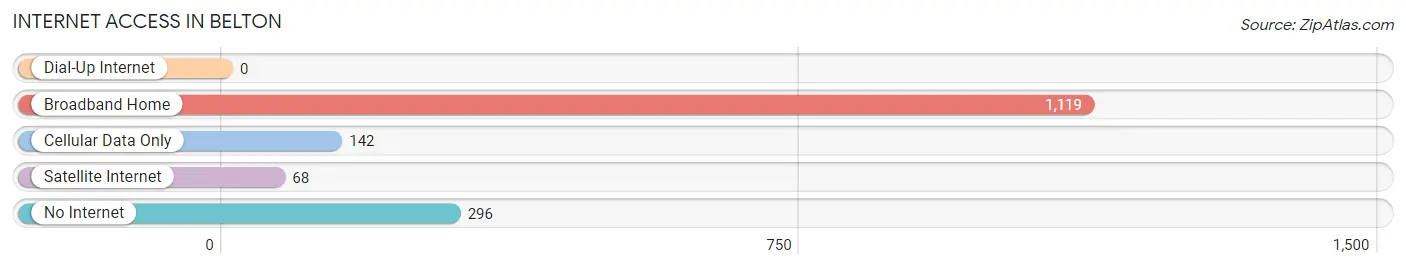
| Internet Type | # Households | % Households |
| Dial-Up Internet | 0 | 0.0% |
| Broadband Home | 1,119 | 69.2% |
| Cellular Data Only | 142 | 8.8% |
| Satellite Internet | 68 | 4.2% |
| No Internet | 296 | 18.3% |
| Total | 1,617 | 100.0% |
Belton Summary
Belton, South Carolina is a small town located in Anderson County, South Carolina. It is situated in the foothills of the Blue Ridge Mountains and is part of the Upstate region of the state. The town has a population of approximately 4,500 people and is the county seat of Anderson County.
Geography
Belton is located in the foothills of the Blue Ridge Mountains in the Upstate region of South Carolina. The town is situated on the banks of the Saluda River, which is a tributary of the Savannah River. The town is located at an elevation of 830 feet above sea level. The town is located approximately 25 miles from the city of Greenville and is approximately 90 miles from the state capital of Columbia.
The town is located in a humid subtropical climate zone, with hot summers and mild winters. The average annual temperature is around 64 degrees Fahrenheit, with an average high of around 87 degrees Fahrenheit in the summer and an average low of around 41 degrees Fahrenheit in the winter. The town receives an average of 48 inches of precipitation per year, with most of it falling in the form of rain.
Economy
Belton’s economy is largely based on agriculture and manufacturing. The town is home to several large agricultural operations, including poultry farms, dairy farms, and vegetable farms. The town is also home to several manufacturing companies, including a paper mill, a textile mill, and a furniture factory.
The town is also home to several retail stores, restaurants, and other businesses. The town is served by several major highways, including Interstate 85, US Route 76, and US Route 25.
Demographics
As of the 2010 census, Belton had a population of 4,500 people. The racial makeup of the town was 79.2% White, 16.2% African American, 0.4% Native American, 0.7% Asian, 0.1% Pacific Islander, 1.2% from other races, and 2.2% from two or more races. Hispanic or Latino of any race were 3.2% of the population.
The median income for a household in Belton was $35,000, and the median income for a family was $41,000. The per capita income for the town was $17,000. About 17.2% of families and 20.2% of the population were below the poverty line, including 28.2% of those under age 18 and 11.2% of those age 65 or over.
Belton is served by the Anderson County School District, which includes four elementary schools, one middle school, and one high school. The town is also home to several churches, including Baptist, Methodist, and Presbyterian.
Belton is a small town with a rich history and a vibrant economy. The town is home to several agricultural and manufacturing operations, as well as several retail stores, restaurants, and other businesses. The town is served by several major highways and is part of the Anderson County School District. The town has a population of approximately 4,500 people and is the county seat of Anderson County.
Common Questions
What is Per Capita Income in Belton?
Per Capita income in Belton is $31,283.
What is the Median Family Income in Belton?
Median Family Income in Belton is $67,990.
What is the Median Household income in Belton?
Median Household Income in Belton is $46,713.
What is Income or Wage Gap in Belton?
Income or Wage Gap in Belton is 53.8%.
Women in Belton earn 46.2 cents for every dollar earned by a man.
What is Inequality or Gini Index in Belton?
Inequality or Gini Index in Belton is 0.53.
What is the Total Population of Belton?
Total Population of Belton is 4,357.
What is the Total Male Population of Belton?
Total Male Population of Belton is 1,819.
What is the Total Female Population of Belton?
Total Female Population of Belton is 2,538.
What is the Ratio of Males per 100 Females in Belton?
There are 71.67 Males per 100 Females in Belton.
What is the Ratio of Females per 100 Males in Belton?
There are 139.53 Females per 100 Males in Belton.
What is the Median Population Age in Belton?
Median Population Age in Belton is 34.9 Years.
What is the Average Family Size in Belton
Average Family Size in Belton is 3.5 People.
What is the Average Household Size in Belton
Average Household Size in Belton is 2.7 People.
How Large is the Labor Force in Belton?
There are 2,170 People in the Labor Forcein in Belton.
What is the Percentage of People in the Labor Force in Belton?
66.8% of People are in the Labor Force in Belton.
What is the Unemployment Rate in Belton?
Unemployment Rate in Belton is 5.0%.