Fort Lawn, SC Map & Demographics
Fort Lawn Map
Fort Lawn Overview
$26,774
PER CAPITA INCOME
$51,953
AVG FAMILY INCOME
$49,844
AVG HOUSEHOLD INCOME
40.9%
WAGE / INCOME GAP [ % ]
59.1¢/ $1
WAGE / INCOME GAP [ $ ]
0.51
INEQUALITY / GINI INDEX
1,149
TOTAL POPULATION
539
MALE POPULATION
610
FEMALE POPULATION
88.36
MALES / 100 FEMALES
113.17
FEMALES / 100 MALES
31.3
MEDIAN AGE
3.4
AVG FAMILY SIZE
3.0
AVG HOUSEHOLD SIZE
531
LABOR FORCE [ PEOPLE ]
67.5%
PERCENT IN LABOR FORCE
9.0%
UNEMPLOYMENT RATE
Fort Lawn Zip Codes
Fort Lawn Area Codes
Income in Fort Lawn
Income Overview in Fort Lawn
Per Capita Income in Fort Lawn is $26,774, while median incomes of families and households are $51,953 and $49,844 respectively.
| Characteristic | Number | Measure |
| Per Capita Income | 1,149 | $26,774 |
| Median Family Income | 311 | $51,953 |
| Mean Family Income | 311 | $68,948 |
| Median Household Income | 384 | $49,844 |
| Mean Household Income | 384 | $80,036 |
| Income Deficit | 311 | $0 |
| Wage / Income Gap (%) | 1,149 | 40.90% |
| Wage / Income Gap ($) | 1,149 | 59.10¢ per $1 |
| Gini / Inequality Index | 1,149 | 0.51 |
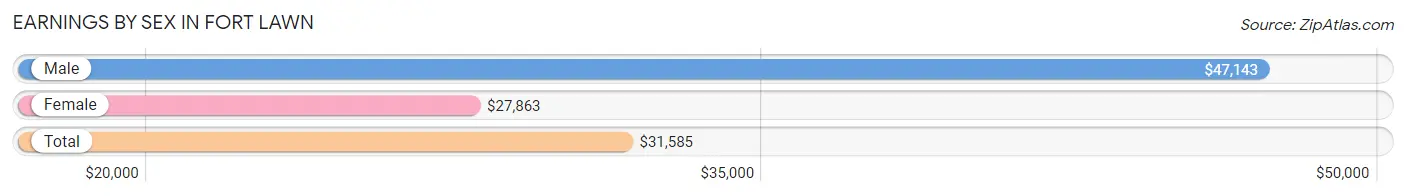
Earnings by Sex in Fort Lawn
Average Earnings in Fort Lawn are $31,585, $47,143 for men and $27,863 for women, a difference of 40.9%.
| Sex | Number | Average Earnings |
| Male | 240 (45.4%) | $47,143 |
| Female | 289 (54.6%) | $27,863 |
| Total | 529 (100.0%) | $31,585 |
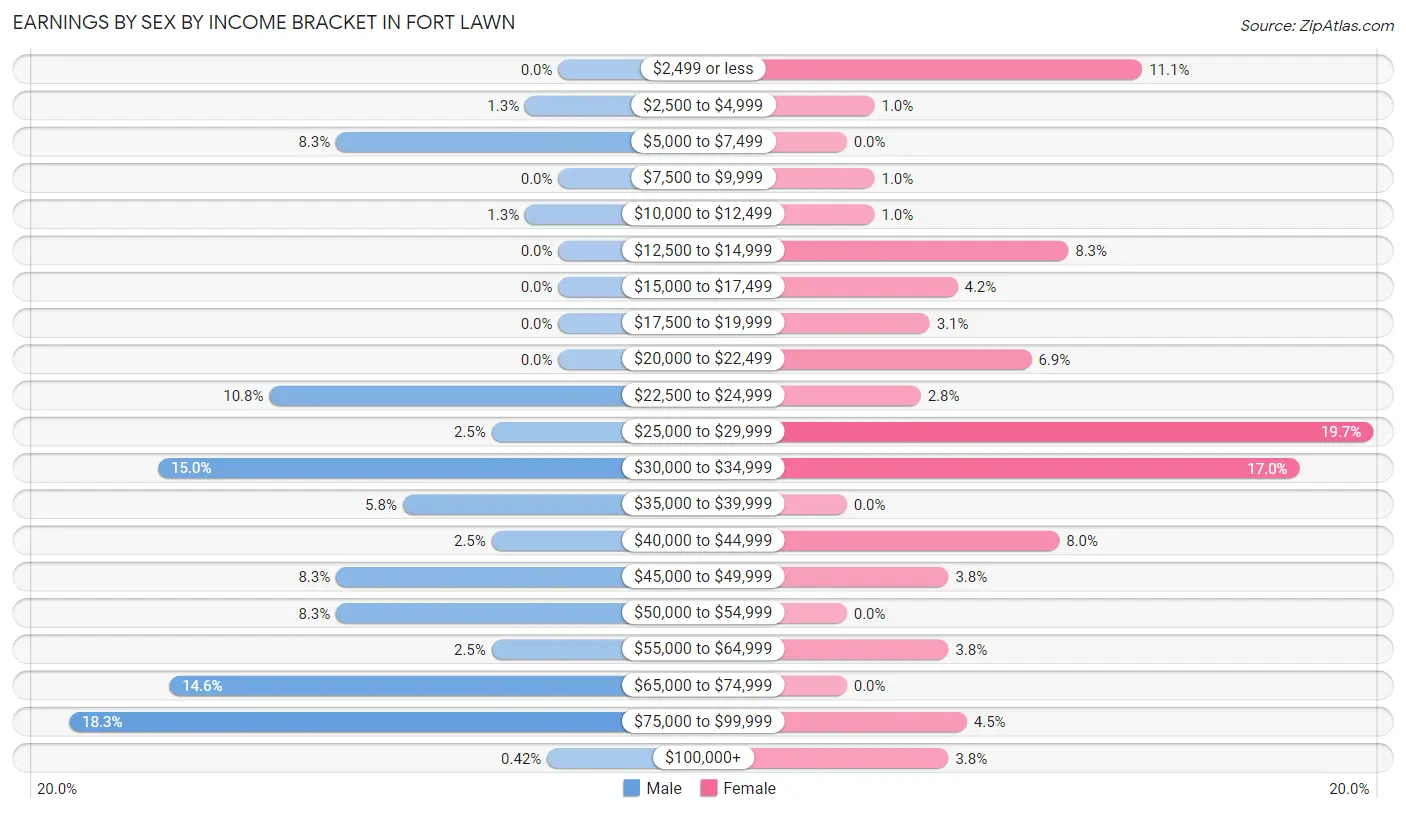
Earnings by Sex by Income Bracket in Fort Lawn
The most common earnings brackets in Fort Lawn are $75,000 to $99,999 for men (44 | 18.3%) and $25,000 to $29,999 for women (57 | 19.7%).
| Income | Male | Female |
| $2,499 or less | 0 (0.0%) | 32 (11.1%) |
| $2,500 to $4,999 | 3 (1.3%) | 3 (1.0%) |
| $5,000 to $7,499 | 20 (8.3%) | 0 (0.0%) |
| $7,500 to $9,999 | 0 (0.0%) | 3 (1.0%) |
| $10,000 to $12,499 | 3 (1.3%) | 3 (1.0%) |
| $12,500 to $14,999 | 0 (0.0%) | 24 (8.3%) |
| $15,000 to $17,499 | 0 (0.0%) | 12 (4.2%) |
| $17,500 to $19,999 | 0 (0.0%) | 9 (3.1%) |
| $20,000 to $22,499 | 0 (0.0%) | 20 (6.9%) |
| $22,500 to $24,999 | 26 (10.8%) | 8 (2.8%) |
| $25,000 to $29,999 | 6 (2.5%) | 57 (19.7%) |
| $30,000 to $34,999 | 36 (15.0%) | 49 (17.0%) |
| $35,000 to $39,999 | 14 (5.8%) | 0 (0.0%) |
| $40,000 to $44,999 | 6 (2.5%) | 23 (8.0%) |
| $45,000 to $49,999 | 20 (8.3%) | 11 (3.8%) |
| $50,000 to $54,999 | 20 (8.3%) | 0 (0.0%) |
| $55,000 to $64,999 | 6 (2.5%) | 11 (3.8%) |
| $65,000 to $74,999 | 35 (14.6%) | 0 (0.0%) |
| $75,000 to $99,999 | 44 (18.3%) | 13 (4.5%) |
| $100,000+ | 1 (0.4%) | 11 (3.8%) |
| Total | 240 (100.0%) | 289 (100.0%) |
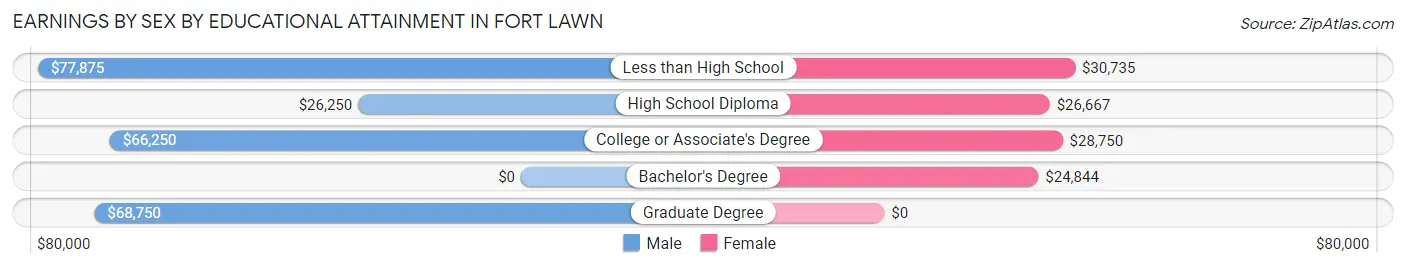
Earnings by Sex by Educational Attainment in Fort Lawn
Average earnings in Fort Lawn are $49,904 for men and $28,992 for women, a difference of 41.9%. Men with an educational attainment of less than high school enjoy the highest average annual earnings of $77,875, while those with high school diploma education earn the least with $26,250. Women with an educational attainment of less than high school earn the most with the average annual earnings of $30,735, while those with bachelor's degree education have the smallest earnings of $24,844.
| Educational Attainment | Male Income | Female Income |
| Less than High School | $77,875 | $30,735 |
| High School Diploma | $26,250 | $26,667 |
| College or Associate's Degree | $66,250 | $28,750 |
| Bachelor's Degree | - | - |
| Graduate Degree | $68,750 | $0 |
| Total | $49,904 | $28,992 |
Family Income in Fort Lawn
Family Income Brackets in Fort Lawn
According to the Fort Lawn family income data, there are 63 families falling into the $50,000 to $74,999 income range, which is the most common income bracket and makes up 20.3% of all families.
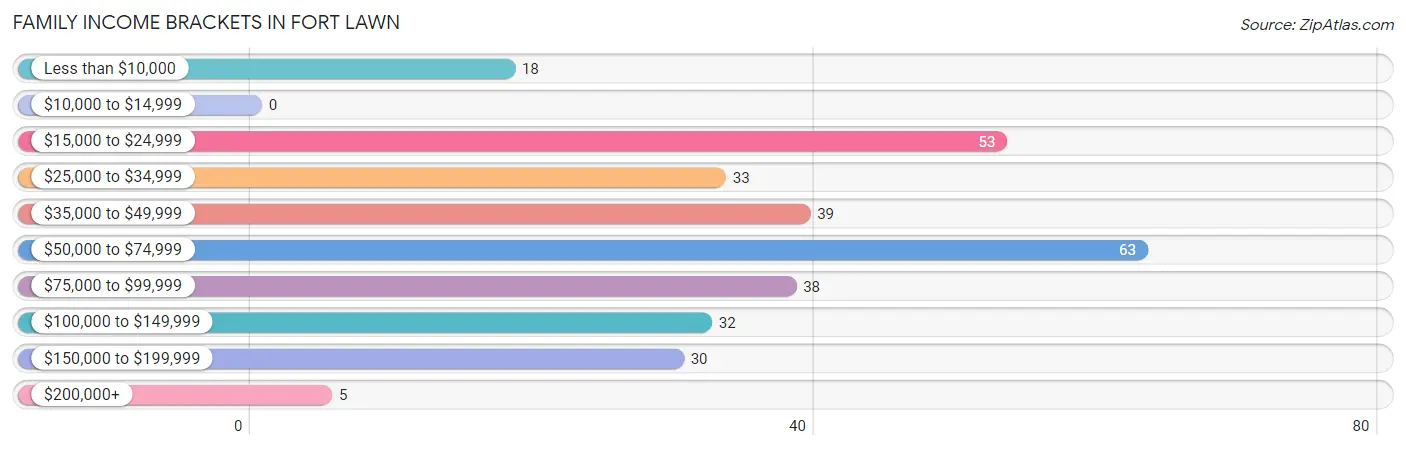
| Income Bracket | # Families | % Families |
| Less than $10,000 | 18 | 5.8% |
| $10,000 to $14,999 | 0 | 0.0% |
| $15,000 to $24,999 | 53 | 17.0% |
| $25,000 to $34,999 | 33 | 10.6% |
| $35,000 to $49,999 | 39 | 12.5% |
| $50,000 to $74,999 | 63 | 20.3% |
| $75,000 to $99,999 | 38 | 12.2% |
| $100,000 to $149,999 | 32 | 10.3% |
| $150,000 to $199,999 | 30 | 9.6% |
| $200,000+ | 5 | 1.6% |
Family Income by Famaliy Size in Fort Lawn
4-person families (38 | 12.2%) account for the highest median family income in Fort Lawn with $81,154 per family, while 2-person families (132 | 42.4%) have the highest median income of $20,357 per family member.
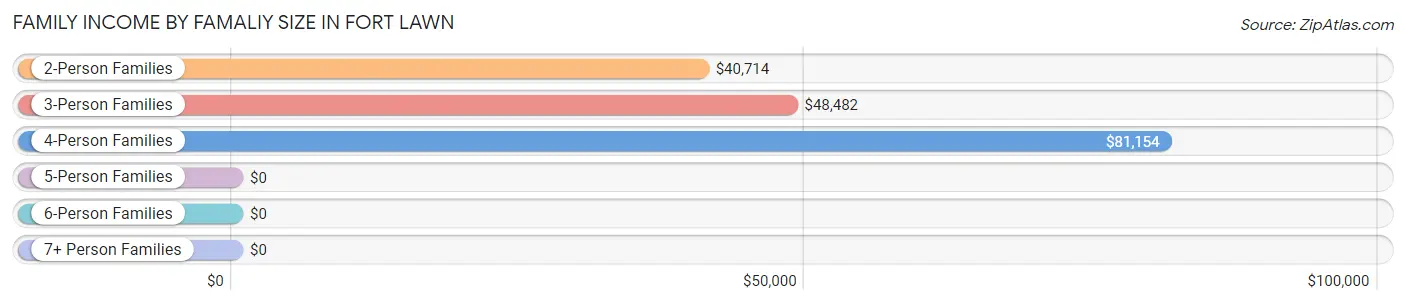
| Income Bracket | # Families | Median Income |
| 2-Person Families | 132 (42.4%) | $40,714 |
| 3-Person Families | 93 (29.9%) | $48,482 |
| 4-Person Families | 38 (12.2%) | $81,154 |
| 5-Person Families | 43 (13.8%) | $0 |
| 6-Person Families | 5 (1.6%) | $0 |
| 7+ Person Families | 0 (0.0%) | $0 |
| Total | 311 (100.0%) | $51,953 |
Family Income by Number of Earners in Fort Lawn
The median family income in Fort Lawn is $51,953, with families comprising 3+ earners (27) having the highest median family income of $166,597, while families with 1 earner (125) have the lowest median family income of $29,563, accounting for 8.7% and 40.2% of families, respectively.
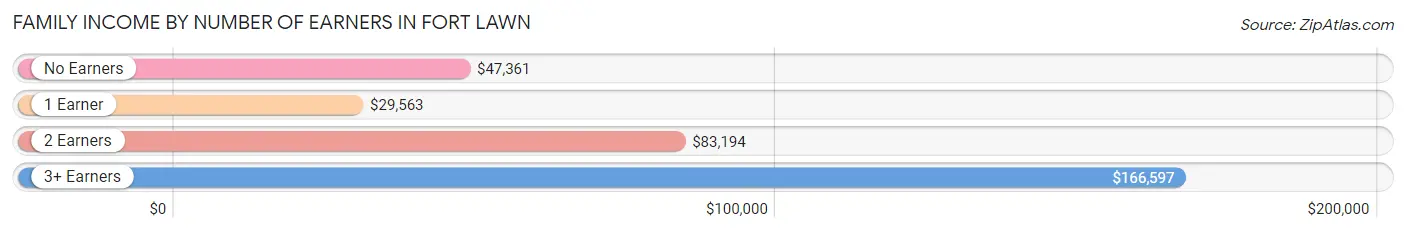
| Number of Earners | # Families | Median Income |
| No Earners | 45 (14.5%) | $47,361 |
| 1 Earner | 125 (40.2%) | $29,563 |
| 2 Earners | 114 (36.7%) | $83,194 |
| 3+ Earners | 27 (8.7%) | $166,597 |
| Total | 311 (100.0%) | $51,953 |
Household Income in Fort Lawn
Household Income Brackets in Fort Lawn
With 79 households falling in the category, the $50,000 to $74,999 income range is the most frequent in Fort Lawn, accounting for 20.6% of all households. In contrast, only 3 households (0.8%) fall into the $10,000 to $14,999 income bracket, making it the least populous group.
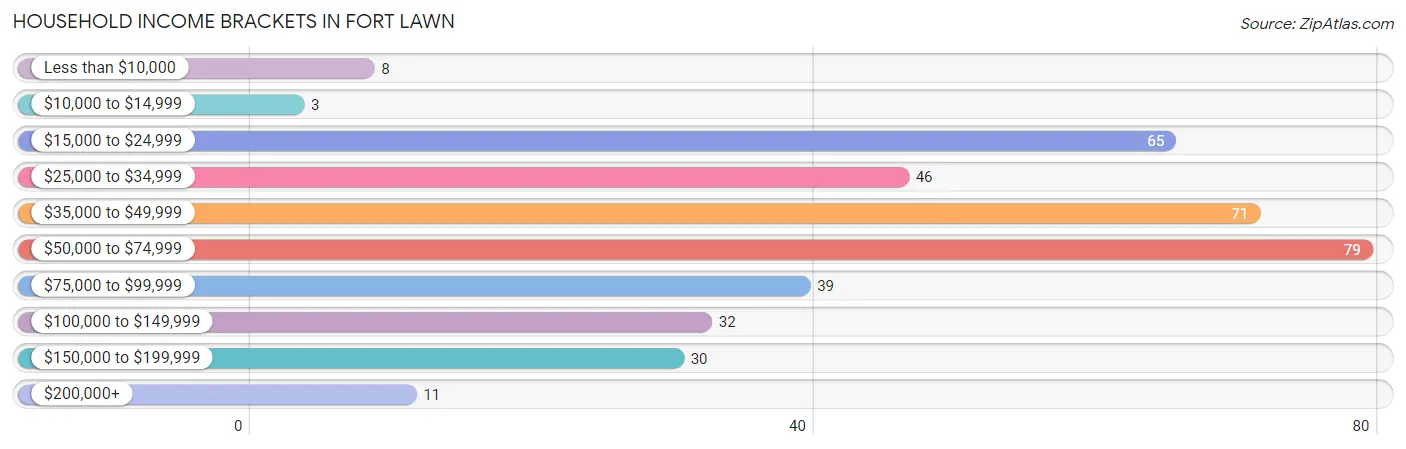
| Income Bracket | # Households | % Households |
| Less than $10,000 | 8 | 2.1% |
| $10,000 to $14,999 | 3 | 0.8% |
| $15,000 to $24,999 | 65 | 16.9% |
| $25,000 to $34,999 | 46 | 12.0% |
| $35,000 to $49,999 | 71 | 18.5% |
| $50,000 to $74,999 | 79 | 20.6% |
| $75,000 to $99,999 | 39 | 10.2% |
| $100,000 to $149,999 | 32 | 8.3% |
| $150,000 to $199,999 | 30 | 7.8% |
| $200,000+ | 11 | 2.9% |
Household Income by Householder Age in Fort Lawn
The median household income in Fort Lawn is $49,844, with the highest median household income of $66,667 found in the 45 to 64 years age bracket for the primary householder. A total of 118 households (30.7%) fall into this category. Meanwhile, the 15 to 24 years age bracket for the primary householder has the lowest median household income of $0, with 20 households (5.2%) in this group.
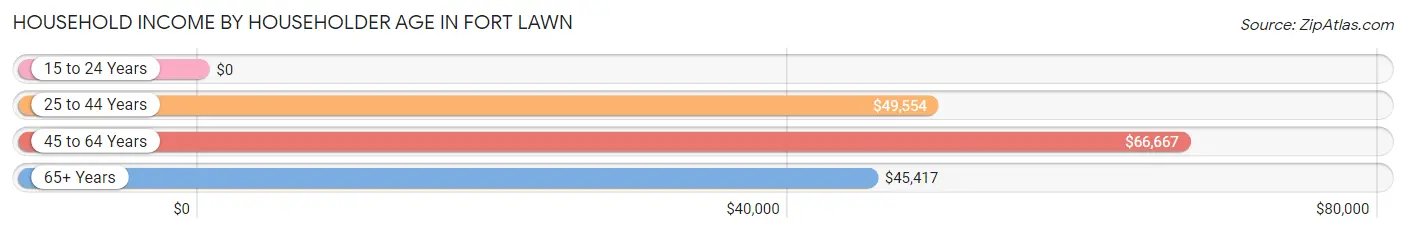
| Income Bracket | # Households | Median Income |
| 15 to 24 Years | 20 (5.2%) | $0 |
| 25 to 44 Years | 163 (42.4%) | $49,554 |
| 45 to 64 Years | 118 (30.7%) | $66,667 |
| 65+ Years | 83 (21.6%) | $45,417 |
| Total | 384 (100.0%) | $49,844 |
Poverty in Fort Lawn
Income Below Poverty by Sex and Age in Fort Lawn
With 11.1% poverty level for males and 11.3% for females among the residents of Fort Lawn, 15 year old males and 25 to 34 year old females are the most vulnerable to poverty, with 11 males (57.9%) and 25 females (25.5%) in their respective age groups living below the poverty level.
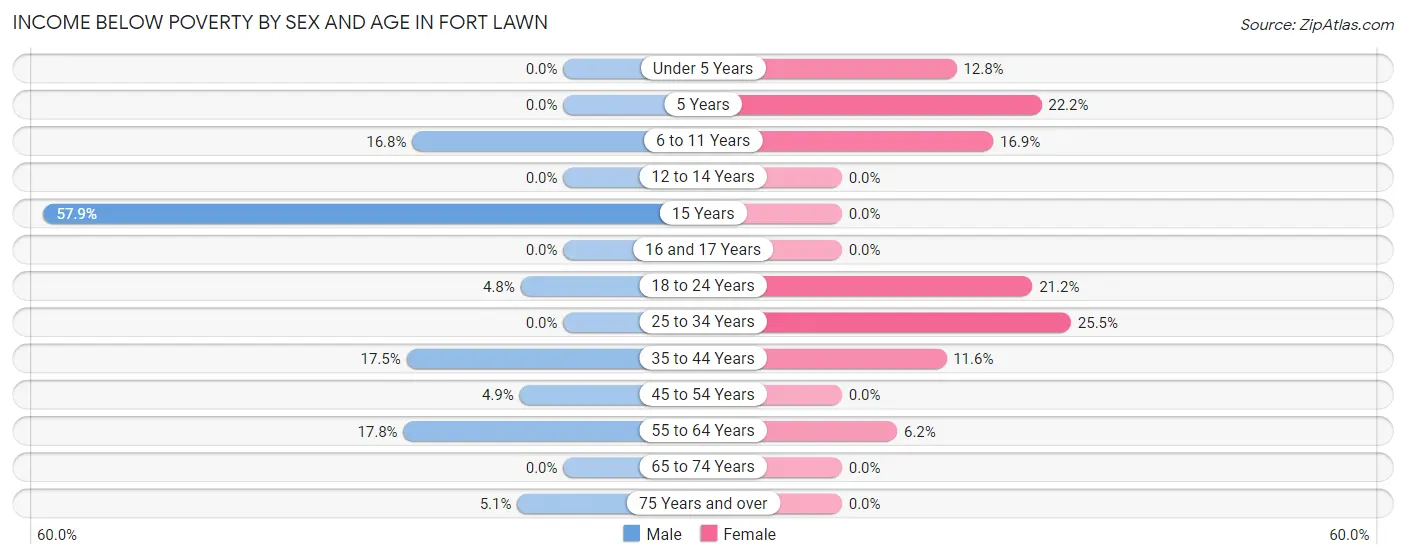
| Age Bracket | Male | Female |
| Under 5 Years | 0 (0.0%) | 6 (12.8%) |
| 5 Years | 0 (0.0%) | 2 (22.2%) |
| 6 to 11 Years | 18 (16.8%) | 15 (16.9%) |
| 12 to 14 Years | 0 (0.0%) | 0 (0.0%) |
| 15 Years | 11 (57.9%) | 0 (0.0%) |
| 16 and 17 Years | 0 (0.0%) | 0 (0.0%) |
| 18 to 24 Years | 3 (4.8%) | 7 (21.2%) |
| 25 to 34 Years | 0 (0.0%) | 25 (25.5%) |
| 35 to 44 Years | 11 (17.5%) | 10 (11.6%) |
| 45 to 54 Years | 2 (4.9%) | 0 (0.0%) |
| 55 to 64 Years | 13 (17.8%) | 4 (6.1%) |
| 65 to 74 Years | 0 (0.0%) | 0 (0.0%) |
| 75 Years and over | 2 (5.1%) | 0 (0.0%) |
| Total | 60 (11.1%) | 69 (11.3%) |
Income Above Poverty by Sex and Age in Fort Lawn
According to the poverty statistics in Fort Lawn, males aged under 5 years and females aged 12 to 14 years are the age groups that are most secure financially, with 100.0% of males and 100.0% of females in these age groups living above the poverty line.
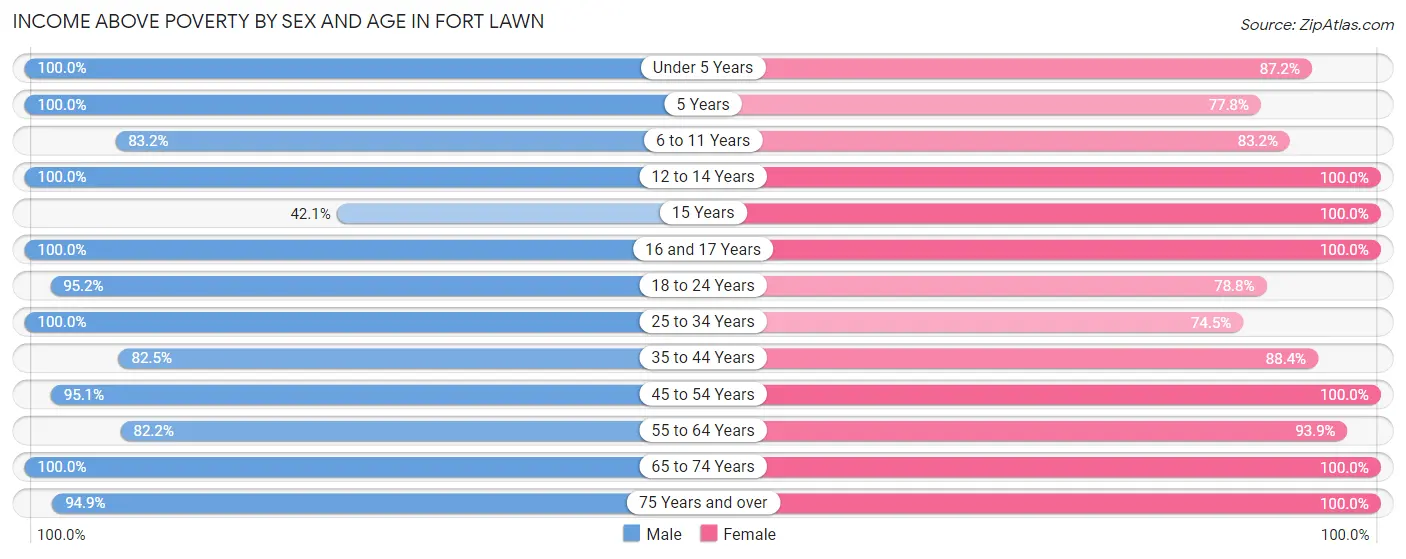
| Age Bracket | Male | Female |
| Under 5 Years | 18 (100.0%) | 41 (87.2%) |
| 5 Years | 21 (100.0%) | 7 (77.8%) |
| 6 to 11 Years | 89 (83.2%) | 74 (83.2%) |
| 12 to 14 Years | 16 (100.0%) | 20 (100.0%) |
| 15 Years | 8 (42.1%) | 16 (100.0%) |
| 16 and 17 Years | 3 (100.0%) | 9 (100.0%) |
| 18 to 24 Years | 60 (95.2%) | 26 (78.8%) |
| 25 to 34 Years | 65 (100.0%) | 73 (74.5%) |
| 35 to 44 Years | 52 (82.5%) | 76 (88.4%) |
| 45 to 54 Years | 39 (95.1%) | 65 (100.0%) |
| 55 to 64 Years | 60 (82.2%) | 61 (93.9%) |
| 65 to 74 Years | 11 (100.0%) | 20 (100.0%) |
| 75 Years and over | 37 (94.9%) | 53 (100.0%) |
| Total | 479 (88.9%) | 541 (88.7%) |
Income Below Poverty Among Married-Couple Families in Fort Lawn
The poverty statistics for married-couple families in Fort Lawn show that 2.3% or 4 of the total 172 families live below the poverty line. Families with no children have the highest poverty rate of 3.5%, comprising of 4 families. On the other hand, families with 1 or 2 children have the lowest poverty rate of 0.0%, which includes 0 families.
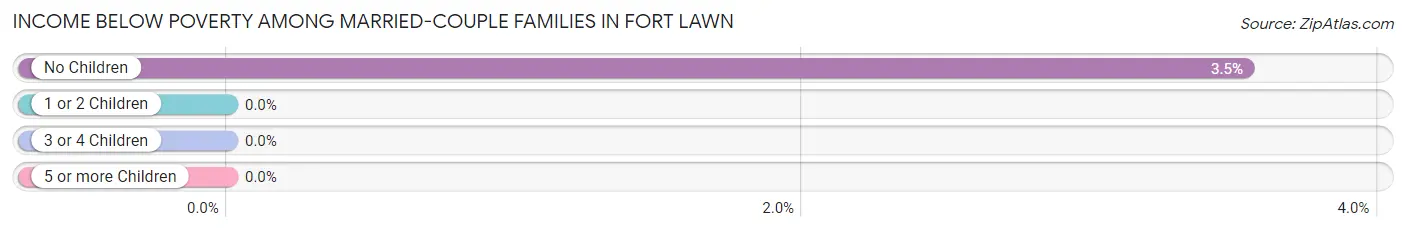
| Children | Above Poverty | Below Poverty |
| No Children | 109 (96.5%) | 4 (3.5%) |
| 1 or 2 Children | 46 (100.0%) | 0 (0.0%) |
| 3 or 4 Children | 13 (100.0%) | 0 (0.0%) |
| 5 or more Children | 0 (0.0%) | 0 (0.0%) |
| Total | 168 (97.7%) | 4 (2.3%) |
Income Below Poverty Among Single-Parent Households in Fort Lawn
According to the poverty data in Fort Lawn, 13.3% or 2 single-father households and 26.6% or 33 single-mother households are living below the poverty line. Among single-father households, those with no children have the highest poverty rate, with 2 households (20.0%) experiencing poverty. Likewise, among single-mother households, those with 3 or 4 children have the highest poverty rate, with 9 households (64.3%) falling below the poverty line.
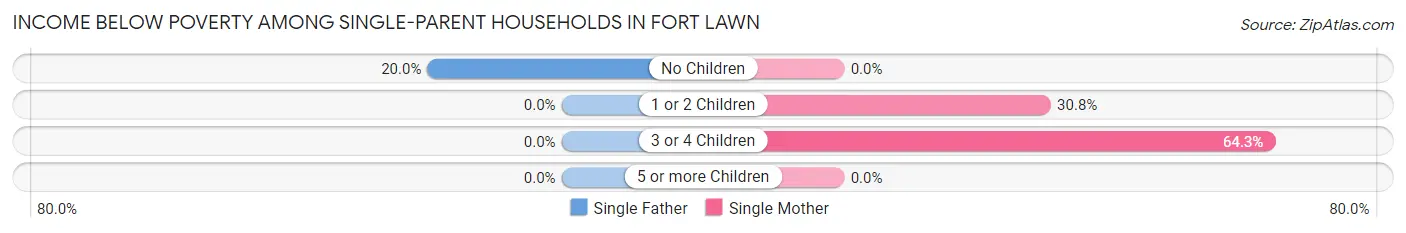
| Children | Single Father | Single Mother |
| No Children | 2 (20.0%) | 0 (0.0%) |
| 1 or 2 Children | 0 (0.0%) | 24 (30.8%) |
| 3 or 4 Children | 0 (0.0%) | 9 (64.3%) |
| 5 or more Children | 0 (0.0%) | 0 (0.0%) |
| Total | 2 (13.3%) | 33 (26.6%) |
Income Below Poverty Among Married-Couple vs Single-Parent Households in Fort Lawn
The poverty data for Fort Lawn shows that 4 of the married-couple family households (2.3%) and 35 of the single-parent households (25.2%) are living below the poverty level. Within the married-couple family households, those with no children have the highest poverty rate, with 4 households (3.5%) falling below the poverty line. Among the single-parent households, those with 3 or 4 children have the highest poverty rate, with 9 household (64.3%) living below poverty.
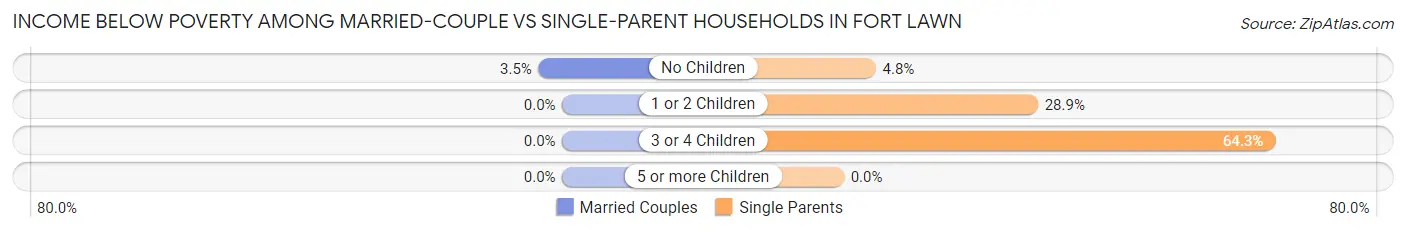
| Children | Married-Couple Families | Single-Parent Households |
| No Children | 4 (3.5%) | 2 (4.8%) |
| 1 or 2 Children | 0 (0.0%) | 24 (28.9%) |
| 3 or 4 Children | 0 (0.0%) | 9 (64.3%) |
| 5 or more Children | 0 (0.0%) | 0 (0.0%) |
| Total | 4 (2.3%) | 35 (25.2%) |
Race in Fort Lawn
The most populous races in Fort Lawn are White / Caucasian (630 | 54.8%), Black / African American (460 | 40.0%), and Two or more Races (59 | 5.1%).
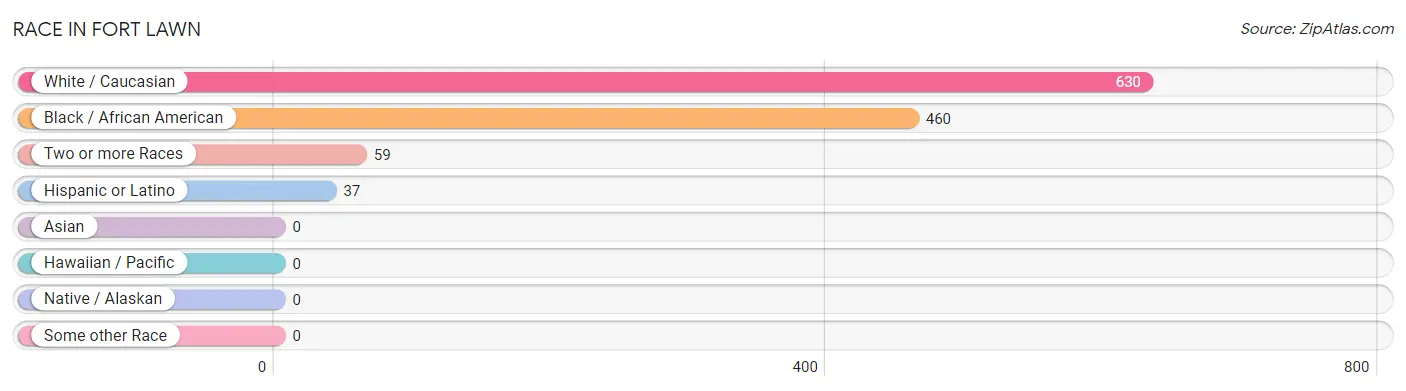
| Race | # Population | % Population |
| Asian | 0 | 0.0% |
| Black / African American | 460 | 40.0% |
| Hawaiian / Pacific | 0 | 0.0% |
| Hispanic or Latino | 37 | 3.2% |
| Native / Alaskan | 0 | 0.0% |
| White / Caucasian | 630 | 54.8% |
| Two or more Races | 59 | 5.1% |
| Some other Race | 0 | 0.0% |
| Total | 1,149 | 100.0% |
Ancestry in Fort Lawn
The most populous ancestries reported in Fort Lawn are American (175 | 15.2%), English (105 | 9.1%), German (99 | 8.6%), Central American Indian (31 | 2.7%), and Puerto Rican (31 | 2.7%), together accounting for 38.4% of all Fort Lawn residents.
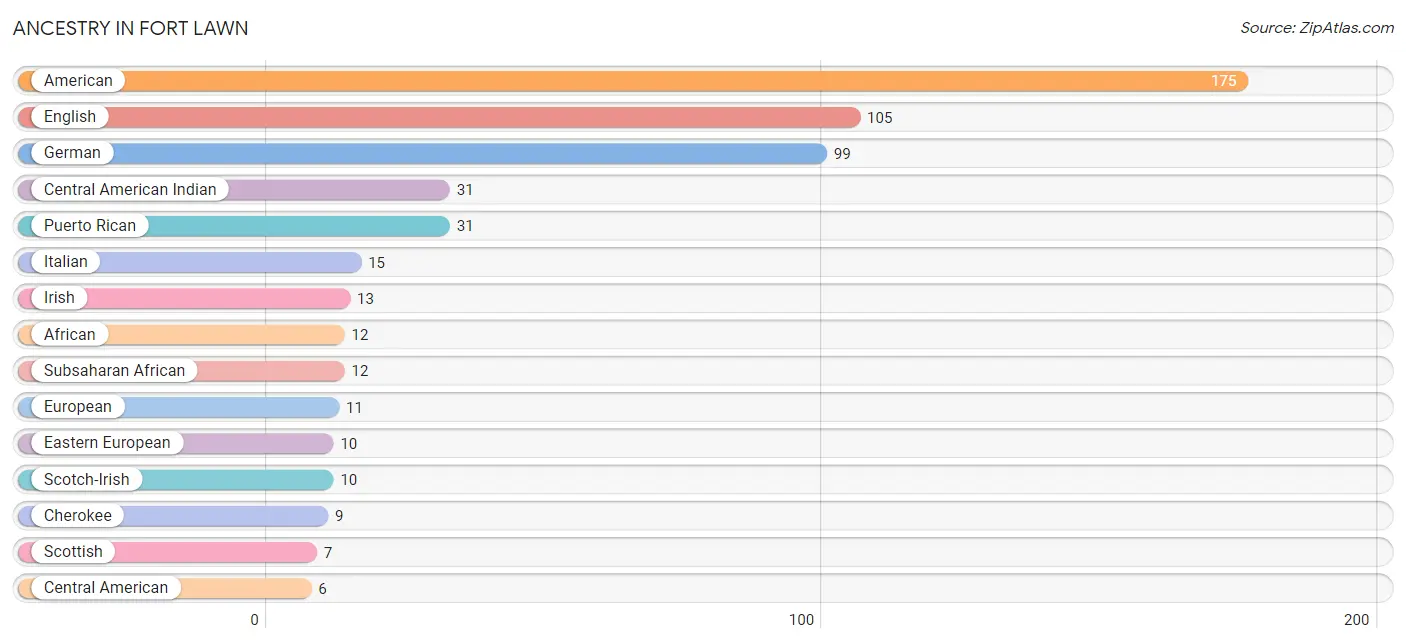
| Ancestry | # Population | % Population |
| African | 12 | 1.0% |
| American | 175 | 15.2% |
| Central American | 6 | 0.5% |
| Central American Indian | 31 | 2.7% |
| Cherokee | 9 | 0.8% |
| Eastern European | 10 | 0.9% |
| English | 105 | 9.1% |
| European | 11 | 1.0% |
| French | 3 | 0.3% |
| French Canadian | 1 | 0.1% |
| German | 99 | 8.6% |
| Greek | 2 | 0.2% |
| Guatemalan | 6 | 0.5% |
| Irish | 13 | 1.1% |
| Italian | 15 | 1.3% |
| Polish | 6 | 0.5% |
| Puerto Rican | 31 | 2.7% |
| Scotch-Irish | 10 | 0.9% |
| Scottish | 7 | 0.6% |
| Subsaharan African | 12 | 1.0% |
| Welsh | 3 | 0.3% | View All 21 Rows |
Immigrants in Fort Lawn
The most numerous immigrant groups reported in Fort Lawn came from Asia (4 | 0.4%), South Eastern Asia (4 | 0.4%), Thailand (4 | 0.4%), Europe (2 | 0.2%), and Greece (2 | 0.2%), together accounting for 1.4% of all Fort Lawn residents.
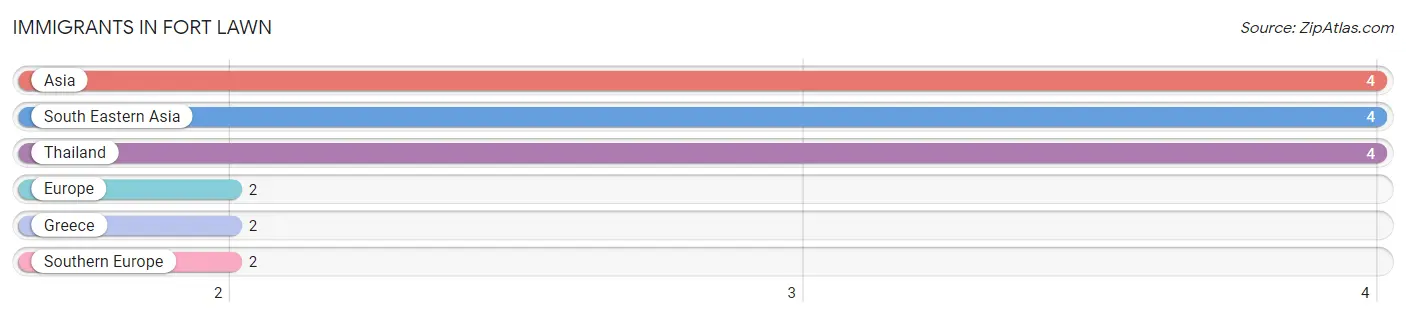
| Immigration Origin | # Population | % Population |
| Asia | 4 | 0.4% |
| Europe | 2 | 0.2% |
| Greece | 2 | 0.2% |
| South Eastern Asia | 4 | 0.4% |
| Southern Europe | 2 | 0.2% |
| Thailand | 4 | 0.4% | View All 6 Rows |
Sex and Age in Fort Lawn
Sex and Age in Fort Lawn
The most populous age groups in Fort Lawn are 5 to 9 Years (101 | 18.7%) for men and 30 to 34 Years (81 | 13.3%) for women.
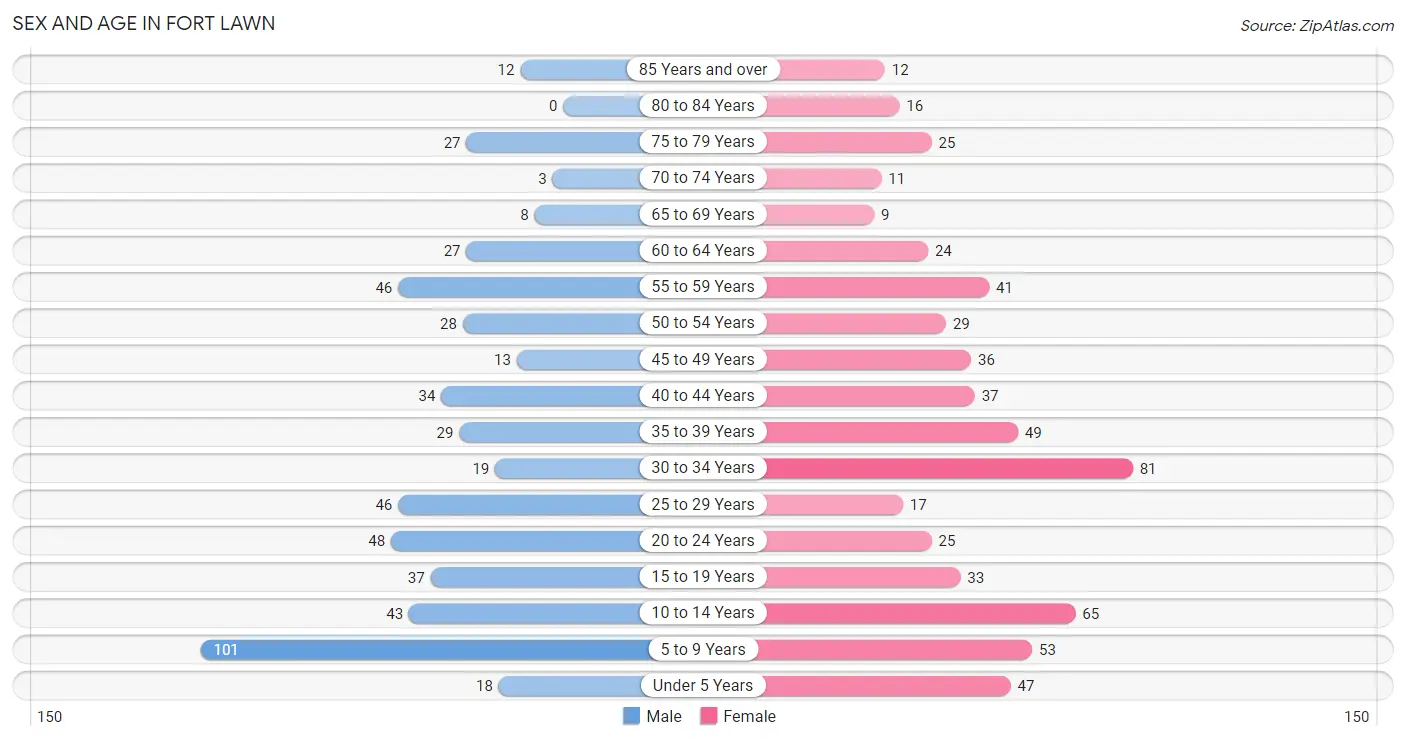
| Age Bracket | Male | Female |
| Under 5 Years | 18 (3.3%) | 47 (7.7%) |
| 5 to 9 Years | 101 (18.7%) | 53 (8.7%) |
| 10 to 14 Years | 43 (8.0%) | 65 (10.7%) |
| 15 to 19 Years | 37 (6.9%) | 33 (5.4%) |
| 20 to 24 Years | 48 (8.9%) | 25 (4.1%) |
| 25 to 29 Years | 46 (8.5%) | 17 (2.8%) |
| 30 to 34 Years | 19 (3.5%) | 81 (13.3%) |
| 35 to 39 Years | 29 (5.4%) | 49 (8.0%) |
| 40 to 44 Years | 34 (6.3%) | 37 (6.1%) |
| 45 to 49 Years | 13 (2.4%) | 36 (5.9%) |
| 50 to 54 Years | 28 (5.2%) | 29 (4.8%) |
| 55 to 59 Years | 46 (8.5%) | 41 (6.7%) |
| 60 to 64 Years | 27 (5.0%) | 24 (3.9%) |
| 65 to 69 Years | 8 (1.5%) | 9 (1.5%) |
| 70 to 74 Years | 3 (0.6%) | 11 (1.8%) |
| 75 to 79 Years | 27 (5.0%) | 25 (4.1%) |
| 80 to 84 Years | 0 (0.0%) | 16 (2.6%) |
| 85 Years and over | 12 (2.2%) | 12 (2.0%) |
| Total | 539 (100.0%) | 610 (100.0%) |
Families and Households in Fort Lawn
Median Family Size in Fort Lawn
The median family size in Fort Lawn is 3.35 persons per family, with single female/mother families (124 | 39.9%) accounting for the largest median family size of 3.47 persons per family. On the other hand, single male/father families (15 | 4.8%) represent the smallest median family size with 1.93 persons per family.
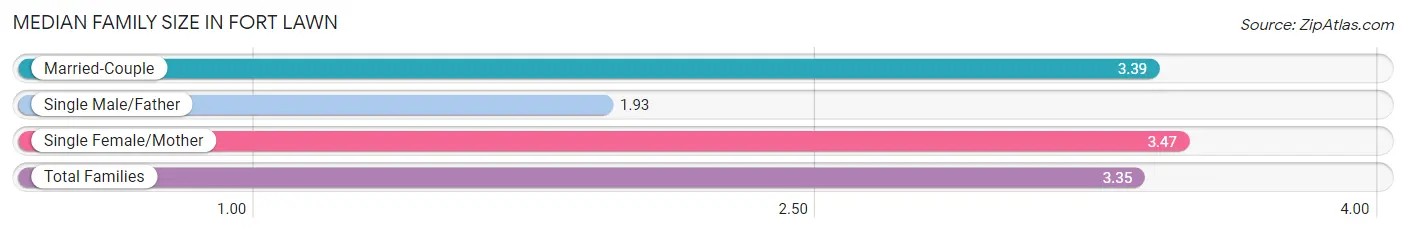
| Family Type | # Families | Family Size |
| Married-Couple | 172 (55.3%) | 3.39 |
| Single Male/Father | 15 (4.8%) | 1.93 |
| Single Female/Mother | 124 (39.9%) | 3.47 |
| Total Families | 311 (100.0%) | 3.35 |
Median Household Size in Fort Lawn
The median household size in Fort Lawn is 2.99 persons per household, with single female/mother households (124 | 32.3%) accounting for the largest median household size of 3.57 persons per household. non-family households (73 | 19.0%) represent the smallest median household size with 1.15 persons per household.
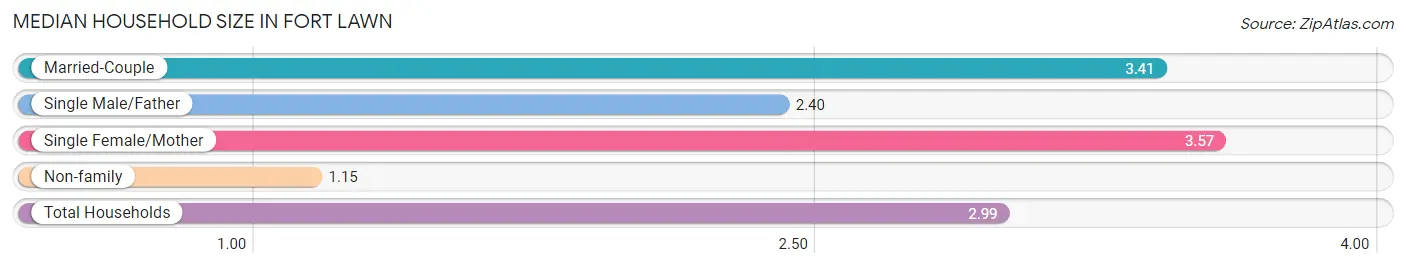
| Household Type | # Households | Household Size |
| Married-Couple | 172 (44.8%) | 3.41 |
| Single Male/Father | 15 (3.9%) | 2.40 |
| Single Female/Mother | 124 (32.3%) | 3.57 |
| Non-family | 73 (19.0%) | 1.15 |
| Total Households | 384 (100.0%) | 2.99 |
Household Size by Marriage Status in Fort Lawn
Out of a total of 384 households in Fort Lawn, 311 (81.0%) are family households, while 73 (19.0%) are nonfamily households. The most numerous type of family households are 2-person households, comprising 124, and the most common type of nonfamily households are 1-person households, comprising 62.
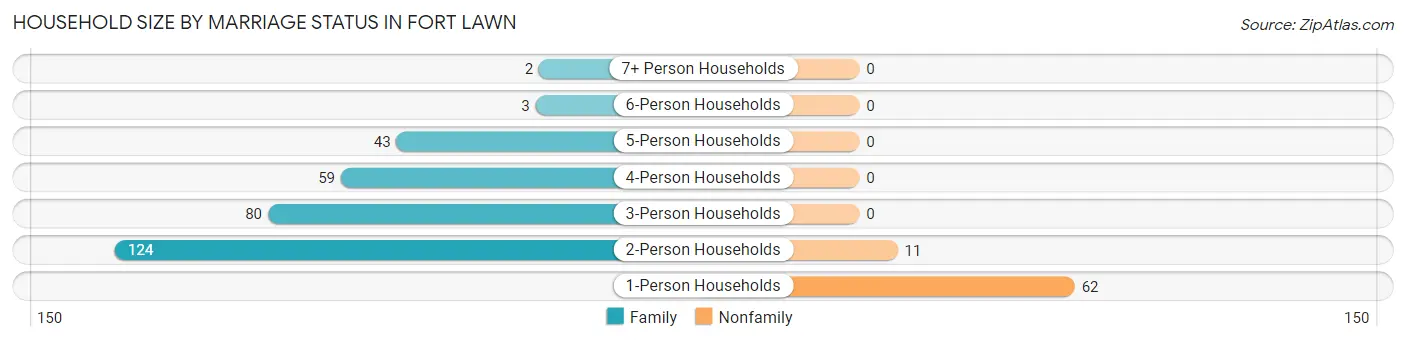
| Household Size | Family Households | Nonfamily Households |
| 1-Person Households | - | 62 (16.2%) |
| 2-Person Households | 124 (32.3%) | 11 (2.9%) |
| 3-Person Households | 80 (20.8%) | 0 (0.0%) |
| 4-Person Households | 59 (15.4%) | 0 (0.0%) |
| 5-Person Households | 43 (11.2%) | 0 (0.0%) |
| 6-Person Households | 3 (0.8%) | 0 (0.0%) |
| 7+ Person Households | 2 (0.5%) | 0 (0.0%) |
| Total | 311 (81.0%) | 73 (19.0%) |
Female Fertility in Fort Lawn
Fertility by Age in Fort Lawn
Average fertility rate in Fort Lawn is 25.0 births per 1,000 women. Women in the age bracket of 35 to 50 years have the highest fertility rate with 31.0 births per 1,000 women. Women in the age bracket of 35 to 50 years acount for 57.1% of all women with births.
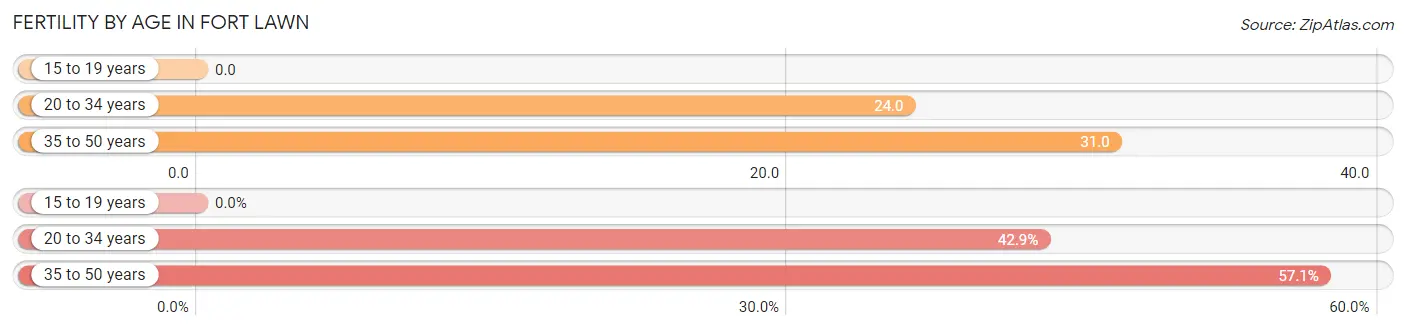
| Age Bracket | Women with Births | Births / 1,000 Women |
| 15 to 19 years | 0 (0.0%) | 0.0 |
| 20 to 34 years | 3 (42.9%) | 24.0 |
| 35 to 50 years | 4 (57.1%) | 31.0 |
| Total | 7 (100.0%) | 25.0 |
Fertility by Age by Marriage Status in Fort Lawn
57.1% of women with births (7) in Fort Lawn are married. The highest percentage of unmarried women with births falls into 20 to 34 years age bracket with 100.0% of them unmarried at the time of birth, while the lowest percentage of unmarried women with births belong to 35 to 50 years age bracket with 0.0% of them unmarried.
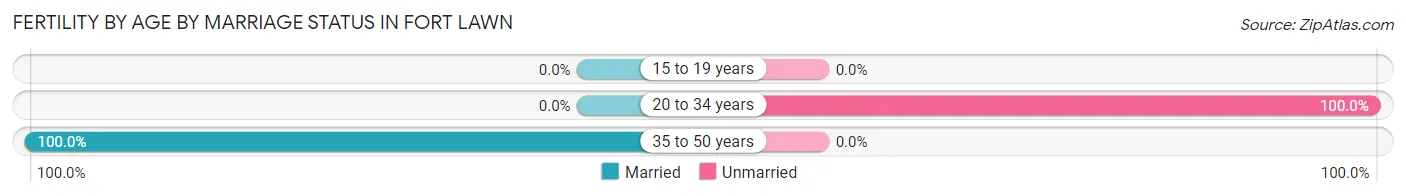
| Age Bracket | Married | Unmarried |
| 15 to 19 years | 0 (0.0%) | 0 (0.0%) |
| 20 to 34 years | 0 (0.0%) | 3 (100.0%) |
| 35 to 50 years | 4 (100.0%) | 0 (0.0%) |
| Total | 4 (57.1%) | 3 (42.9%) |
Fertility by Education in Fort Lawn
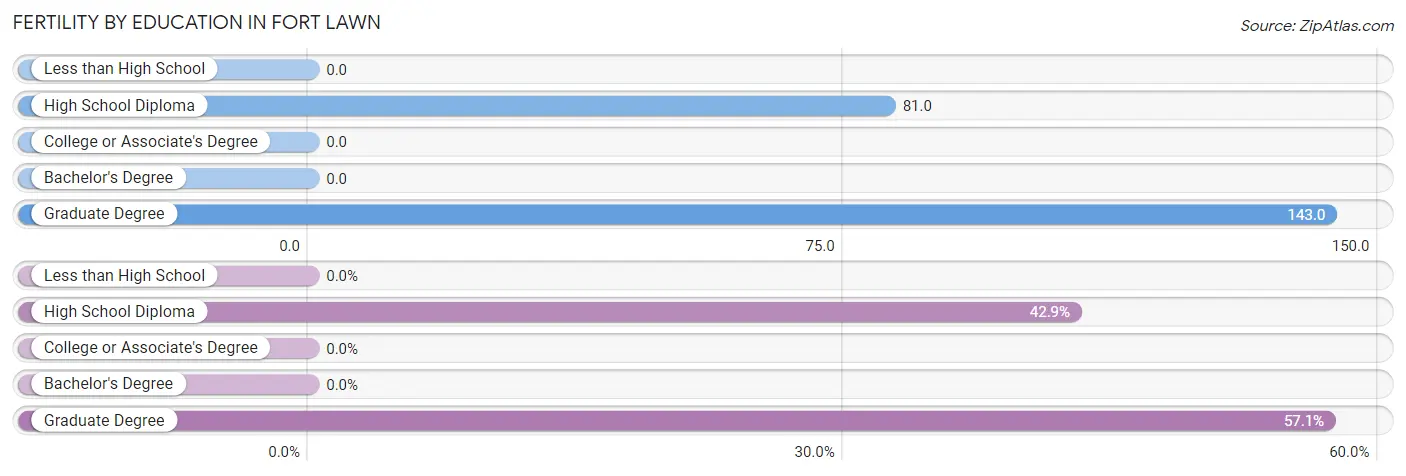
| Educational Attainment | Women with Births | Births / 1,000 Women |
| Less than High School | 0 (0.0%) | 0.0 |
| High School Diploma | 3 (42.9%) | 81.0 |
| College or Associate's Degree | 0 (0.0%) | 0.0 |
| Bachelor's Degree | 0 (0.0%) | 0.0 |
| Graduate Degree | 4 (57.1%) | 143.0 |
| Total | 7 (100.0%) | 25.0 |
Fertility by Education by Marriage Status in Fort Lawn
42.9% of women with births in Fort Lawn are unmarried. Women with the educational attainment of graduate degree are most likely to be married with 100.0% of them married at childbirth, while women with the educational attainment of high school diploma are least likely to be married with 100.0% of them unmarried at childbirth.
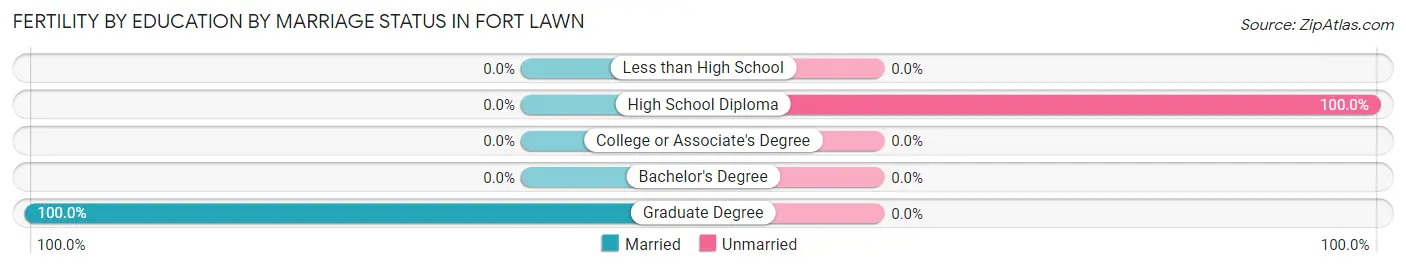
| Educational Attainment | Married | Unmarried |
| Less than High School | 0 (0.0%) | 0 (0.0%) |
| High School Diploma | 0 (0.0%) | 3 (100.0%) |
| College or Associate's Degree | 0 (0.0%) | 0 (0.0%) |
| Bachelor's Degree | 0 (0.0%) | 0 (0.0%) |
| Graduate Degree | 4 (100.0%) | 0 (0.0%) |
| Total | 4 (57.1%) | 3 (42.9%) |
Employment Characteristics in Fort Lawn
Employment by Class of Employer in Fort Lawn
Among the 470 employed individuals in Fort Lawn, private company employees (340 | 72.3%), state government employees (37 | 7.9%), and self-employed (not incorporated) (27 | 5.7%) make up the most common classes of employment.
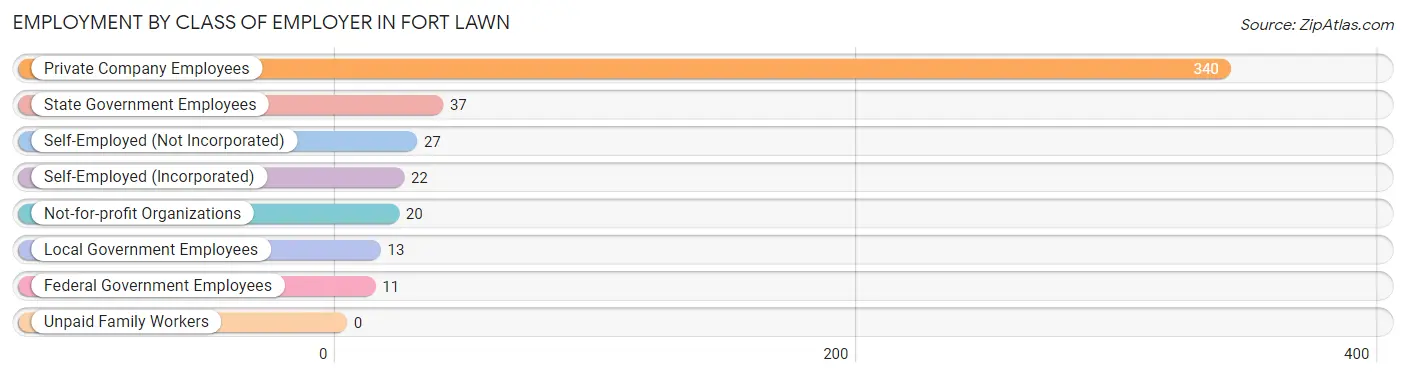
| Employer Class | # Employees | % Employees |
| Private Company Employees | 340 | 72.3% |
| Self-Employed (Incorporated) | 22 | 4.7% |
| Self-Employed (Not Incorporated) | 27 | 5.7% |
| Not-for-profit Organizations | 20 | 4.3% |
| Local Government Employees | 13 | 2.8% |
| State Government Employees | 37 | 7.9% |
| Federal Government Employees | 11 | 2.3% |
| Unpaid Family Workers | 0 | 0.0% |
| Total | 470 | 100.0% |
Employment Status by Age in Fort Lawn
According to the labor force statistics for Fort Lawn, out of the total population over 16 years of age (787), 67.5% or 531 individuals are in the labor force, with 9.0% or 48 of them unemployed. The age group with the highest labor force participation rate is 20 to 24 years, with 90.4% or 66 individuals in the labor force. Within the labor force, the 16 to 19 years age range has the highest percentage of unemployed individuals, with 81.3% or 13 of them being unemployed.
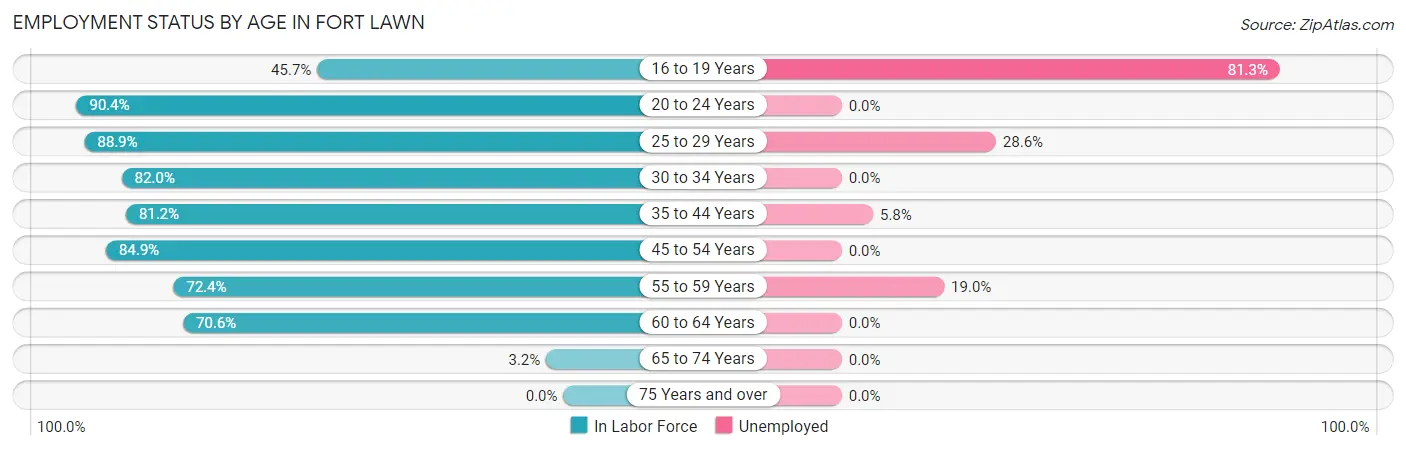
| Age Bracket | In Labor Force | Unemployed |
| 16 to 19 Years | 16 (45.7%) | 13 (81.3%) |
| 20 to 24 Years | 66 (90.4%) | 0 (0.0%) |
| 25 to 29 Years | 56 (88.9%) | 16 (28.6%) |
| 30 to 34 Years | 82 (82.0%) | 0 (0.0%) |
| 35 to 44 Years | 121 (81.2%) | 7 (5.8%) |
| 45 to 54 Years | 90 (84.9%) | 0 (0.0%) |
| 55 to 59 Years | 63 (72.4%) | 12 (19.0%) |
| 60 to 64 Years | 36 (70.6%) | 0 (0.0%) |
| 65 to 74 Years | 1 (3.2%) | 0 (0.0%) |
| 75 Years and over | 0 (0.0%) | 0 (0.0%) |
| Total | 531 (67.5%) | 48 (9.0%) |
Employment Status by Educational Attainment in Fort Lawn
According to labor force statistics for Fort Lawn, 80.6% of individuals (448) out of the total population between 25 and 64 years of age (556) are in the labor force, with 7.8% or 35 of them being unemployed. The group with the highest labor force participation rate are those with the educational attainment of less than high school, with 86.8% or 79 individuals in the labor force. Within the labor force, individuals with high school diploma education have the highest percentage of unemployment, with 23.0% or 35 of them being unemployed.
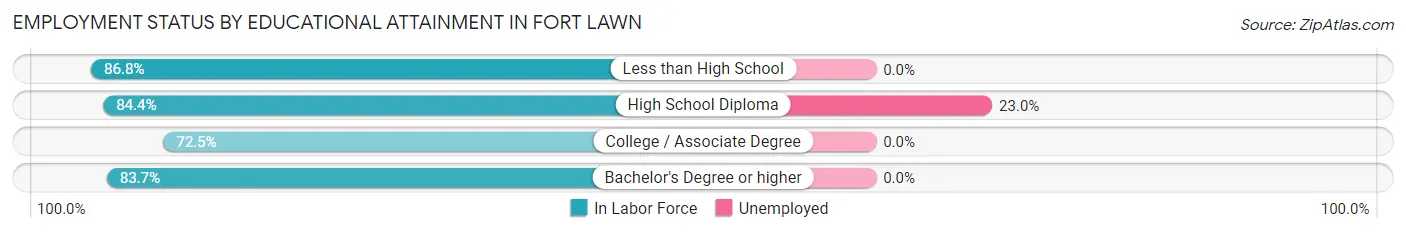
| Educational Attainment | In Labor Force | Unemployed |
| Less than High School | 79 (86.8%) | 0 (0.0%) |
| High School Diploma | 152 (84.4%) | 41 (23.0%) |
| College / Associate Degree | 140 (72.5%) | 0 (0.0%) |
| Bachelor's Degree or higher | 77 (83.7%) | 0 (0.0%) |
| Total | 448 (80.6%) | 43 (7.8%) |
Employment Occupations by Sex in Fort Lawn
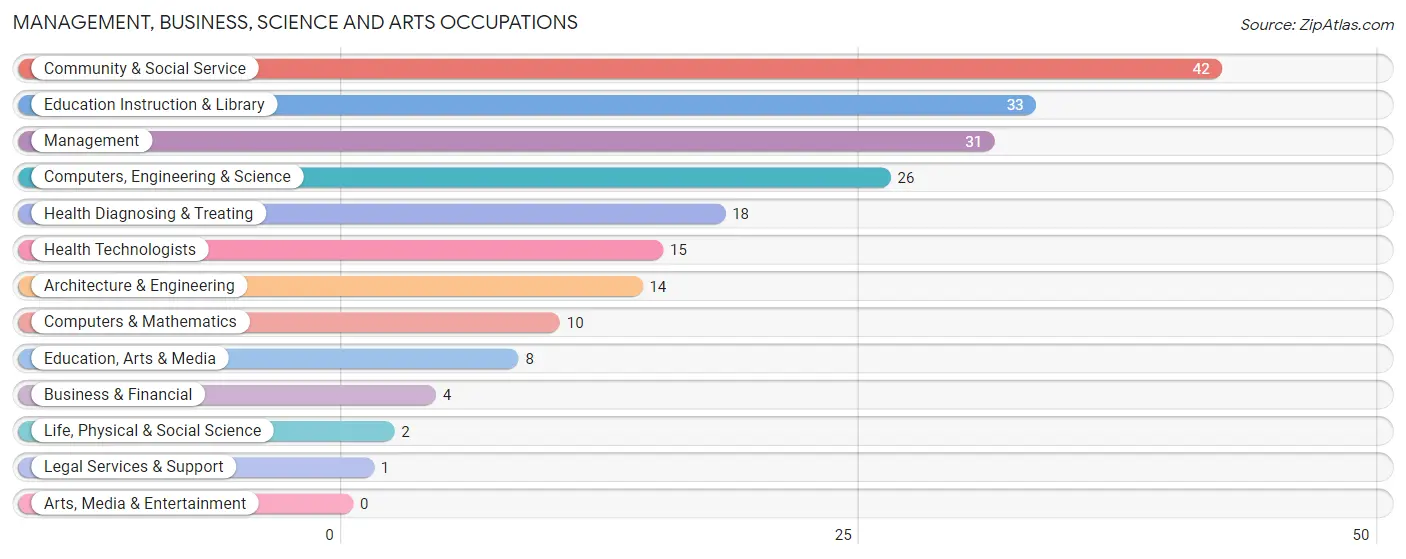
Management, Business, Science and Arts Occupations
The most common Management, Business, Science and Arts occupations in Fort Lawn are Community & Social Service (42 | 8.7%), Education Instruction & Library (33 | 6.8%), Management (31 | 6.4%), Computers, Engineering & Science (26 | 5.4%), and Health Diagnosing & Treating (18 | 3.7%).
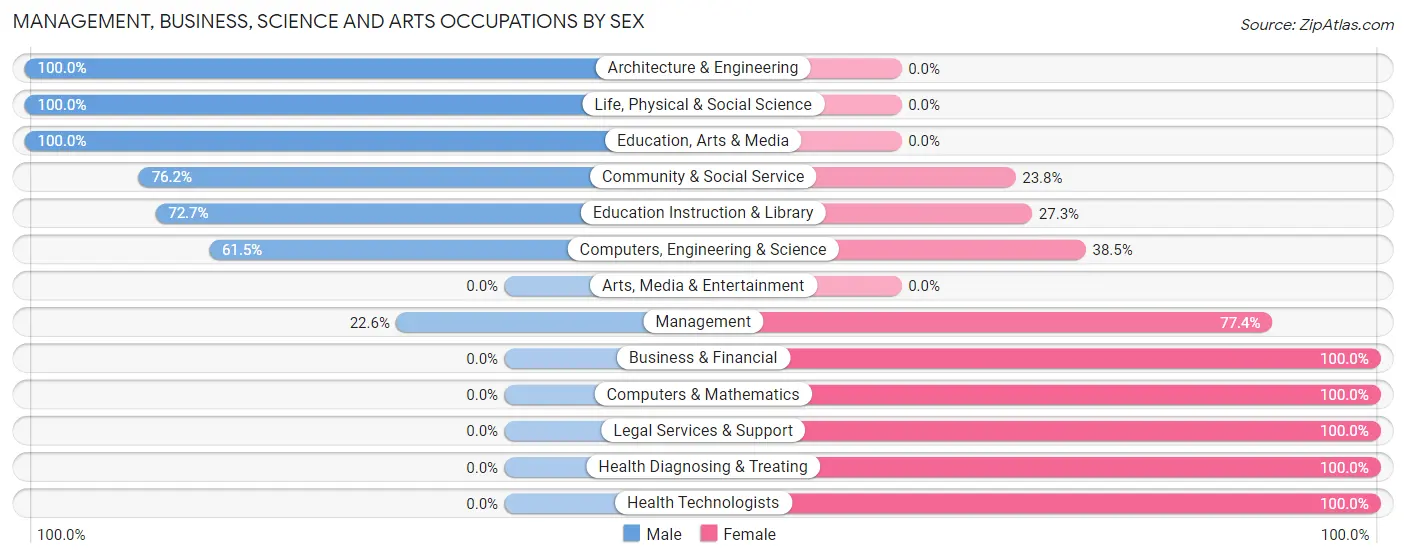
Management, Business, Science and Arts Occupations by Sex
Within the Management, Business, Science and Arts occupations in Fort Lawn, the most male-oriented occupations are Architecture & Engineering (100.0%), Life, Physical & Social Science (100.0%), and Education, Arts & Media (100.0%), while the most female-oriented occupations are Business & Financial (100.0%), Computers & Mathematics (100.0%), and Legal Services & Support (100.0%).
| Occupation | Male | Female |
| Management | 7 (22.6%) | 24 (77.4%) |
| Business & Financial | 0 (0.0%) | 4 (100.0%) |
| Computers, Engineering & Science | 16 (61.5%) | 10 (38.5%) |
| Computers & Mathematics | 0 (0.0%) | 10 (100.0%) |
| Architecture & Engineering | 14 (100.0%) | 0 (0.0%) |
| Life, Physical & Social Science | 2 (100.0%) | 0 (0.0%) |
| Community & Social Service | 32 (76.2%) | 10 (23.8%) |
| Education, Arts & Media | 8 (100.0%) | 0 (0.0%) |
| Legal Services & Support | 0 (0.0%) | 1 (100.0%) |
| Education Instruction & Library | 24 (72.7%) | 9 (27.3%) |
| Arts, Media & Entertainment | 0 (0.0%) | 0 (0.0%) |
| Health Diagnosing & Treating | 0 (0.0%) | 18 (100.0%) |
| Health Technologists | 0 (0.0%) | 15 (100.0%) |
| Total (Category) | 55 (45.5%) | 66 (54.5%) |
| Total (Overall) | 215 (44.5%) | 268 (55.5%) |
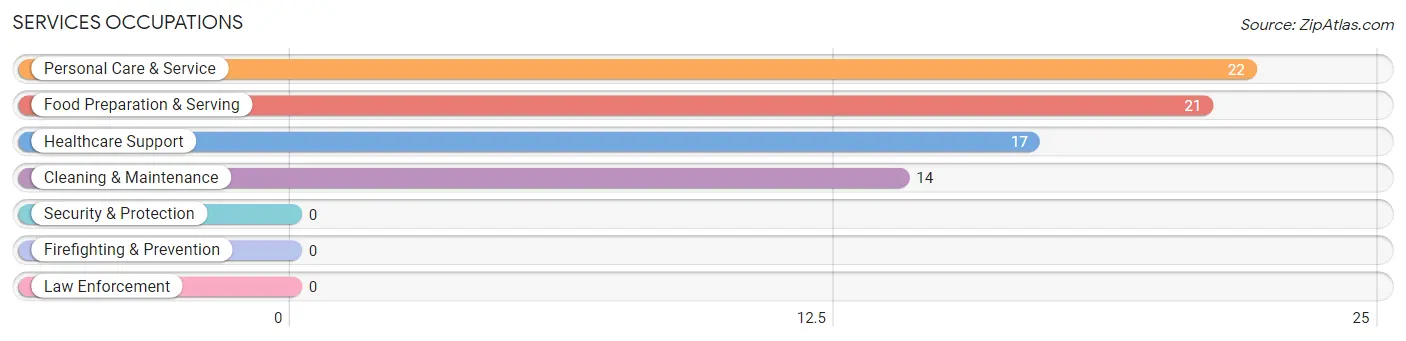
Services Occupations
The most common Services occupations in Fort Lawn are Personal Care & Service (22 | 4.5%), Food Preparation & Serving (21 | 4.3%), Healthcare Support (17 | 3.5%), and Cleaning & Maintenance (14 | 2.9%).
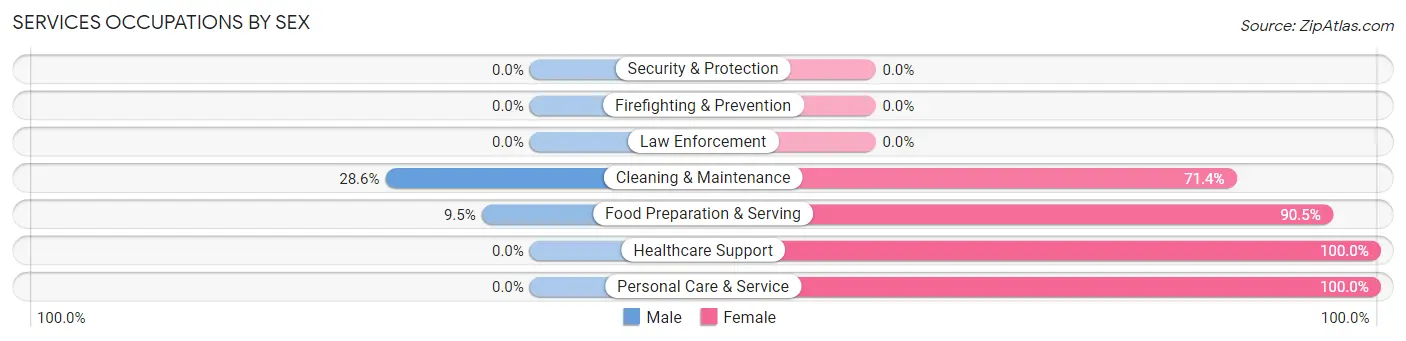
Services Occupations by Sex
Within the Services occupations in Fort Lawn, the most male-oriented occupations are Cleaning & Maintenance (28.6%), and Food Preparation & Serving (9.5%), while the most female-oriented occupations are Healthcare Support (100.0%), Personal Care & Service (100.0%), and Food Preparation & Serving (90.5%).
| Occupation | Male | Female |
| Healthcare Support | 0 (0.0%) | 17 (100.0%) |
| Security & Protection | 0 (0.0%) | 0 (0.0%) |
| Firefighting & Prevention | 0 (0.0%) | 0 (0.0%) |
| Law Enforcement | 0 (0.0%) | 0 (0.0%) |
| Food Preparation & Serving | 2 (9.5%) | 19 (90.5%) |
| Cleaning & Maintenance | 4 (28.6%) | 10 (71.4%) |
| Personal Care & Service | 0 (0.0%) | 22 (100.0%) |
| Total (Category) | 6 (8.1%) | 68 (91.9%) |
| Total (Overall) | 215 (44.5%) | 268 (55.5%) |
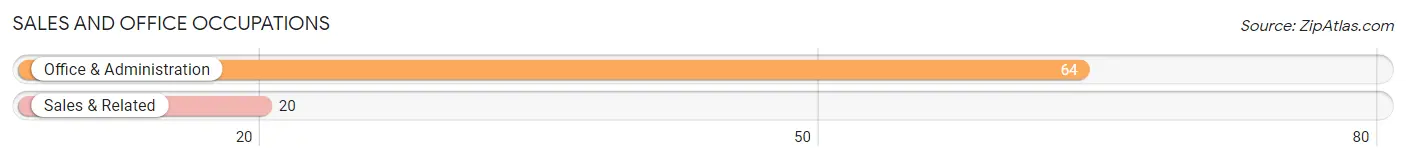
Sales and Office Occupations
The most common Sales and Office occupations in Fort Lawn are Office & Administration (64 | 13.3%), and Sales & Related (20 | 4.1%).
Sales and Office Occupations by Sex
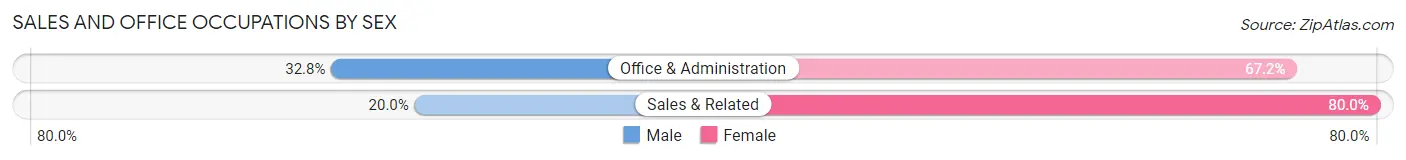
| Occupation | Male | Female |
| Sales & Related | 4 (20.0%) | 16 (80.0%) |
| Office & Administration | 21 (32.8%) | 43 (67.2%) |
| Total (Category) | 25 (29.8%) | 59 (70.2%) |
| Total (Overall) | 215 (44.5%) | 268 (55.5%) |
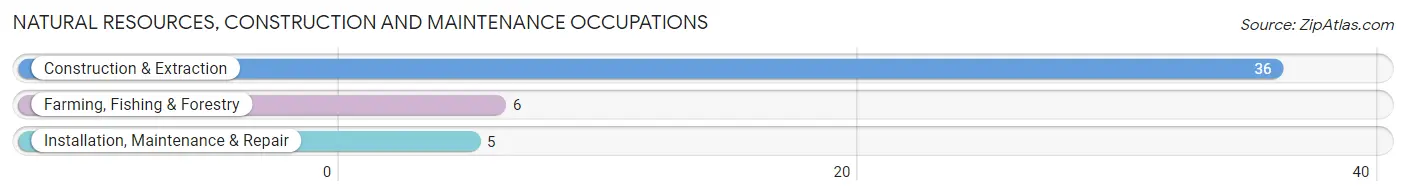
Natural Resources, Construction and Maintenance Occupations
The most common Natural Resources, Construction and Maintenance occupations in Fort Lawn are Construction & Extraction (36 | 7.4%), Farming, Fishing & Forestry (6 | 1.2%), and Installation, Maintenance & Repair (5 | 1.0%).
Natural Resources, Construction and Maintenance Occupations by Sex
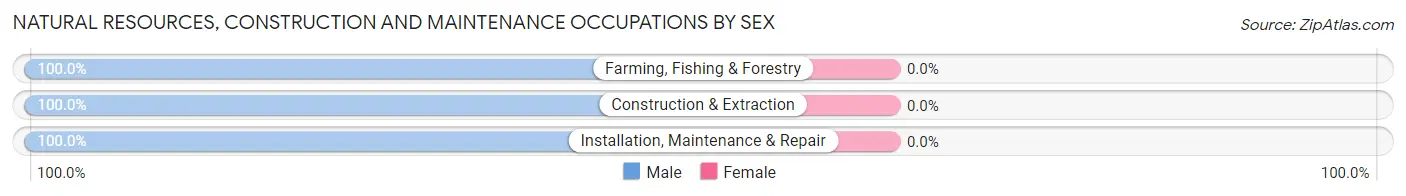
| Occupation | Male | Female |
| Farming, Fishing & Forestry | 6 (100.0%) | 0 (0.0%) |
| Construction & Extraction | 36 (100.0%) | 0 (0.0%) |
| Installation, Maintenance & Repair | 5 (100.0%) | 0 (0.0%) |
| Total (Category) | 47 (100.0%) | 0 (0.0%) |
| Total (Overall) | 215 (44.5%) | 268 (55.5%) |
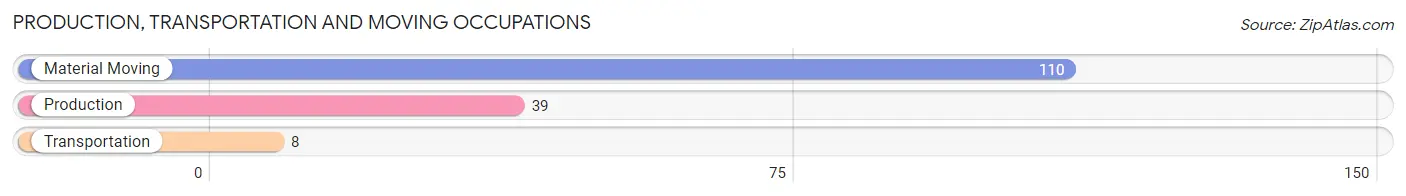
Production, Transportation and Moving Occupations
The most common Production, Transportation and Moving occupations in Fort Lawn are Material Moving (110 | 22.8%), Production (39 | 8.1%), and Transportation (8 | 1.7%).
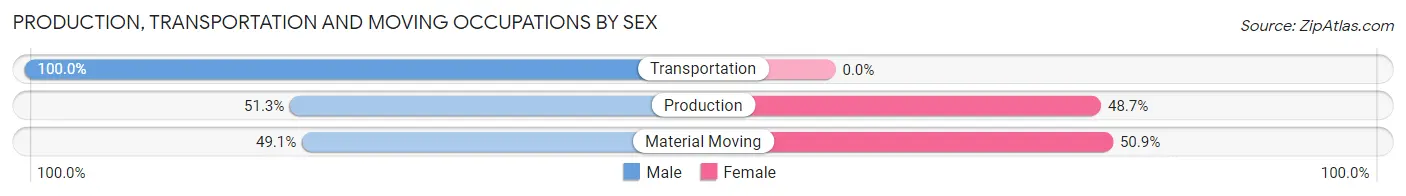
Production, Transportation and Moving Occupations by Sex
| Occupation | Male | Female |
| Production | 20 (51.3%) | 19 (48.7%) |
| Transportation | 8 (100.0%) | 0 (0.0%) |
| Material Moving | 54 (49.1%) | 56 (50.9%) |
| Total (Category) | 82 (52.2%) | 75 (47.8%) |
| Total (Overall) | 215 (44.5%) | 268 (55.5%) |
Employment Industries by Sex in Fort Lawn
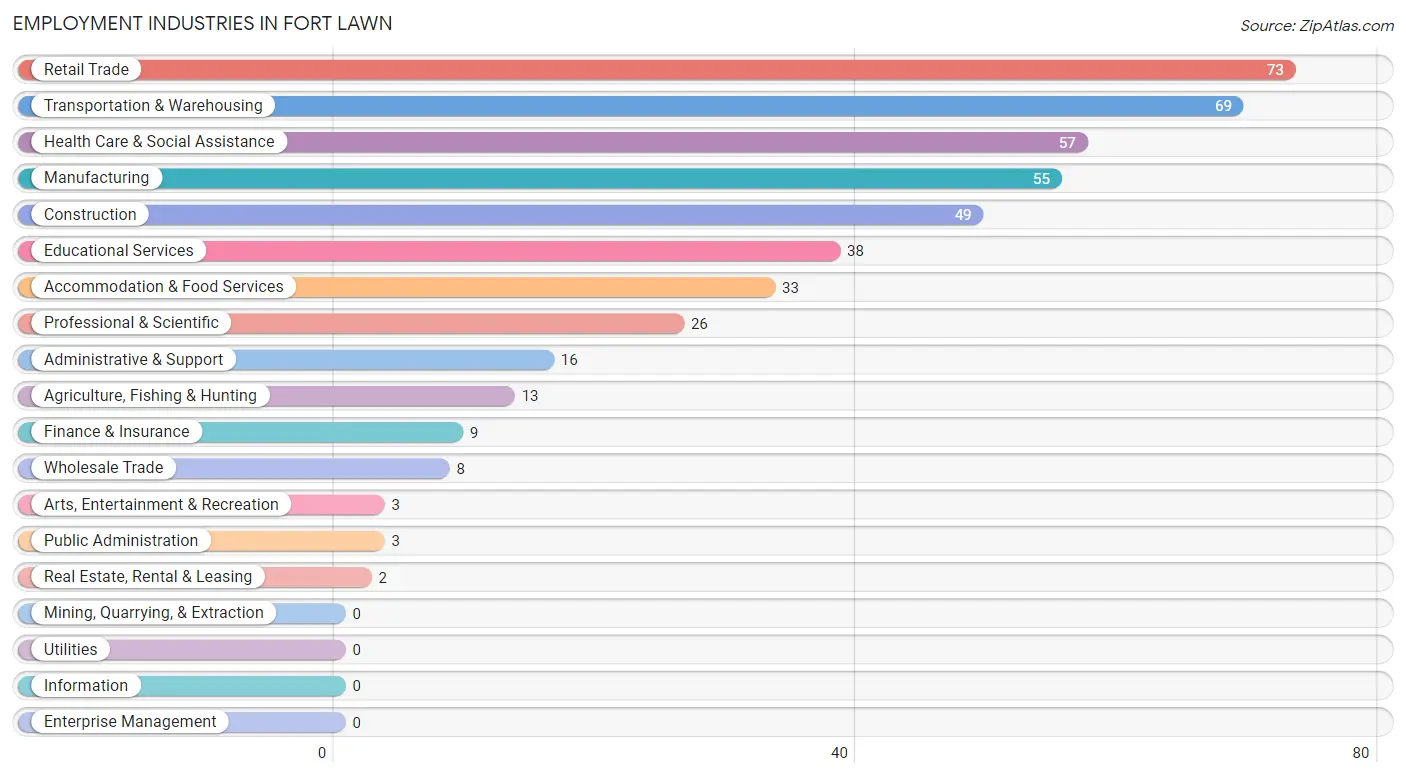
Employment Industries in Fort Lawn
The major employment industries in Fort Lawn include Retail Trade (73 | 15.1%), Transportation & Warehousing (69 | 14.3%), Health Care & Social Assistance (57 | 11.8%), Manufacturing (55 | 11.4%), and Construction (49 | 10.1%).
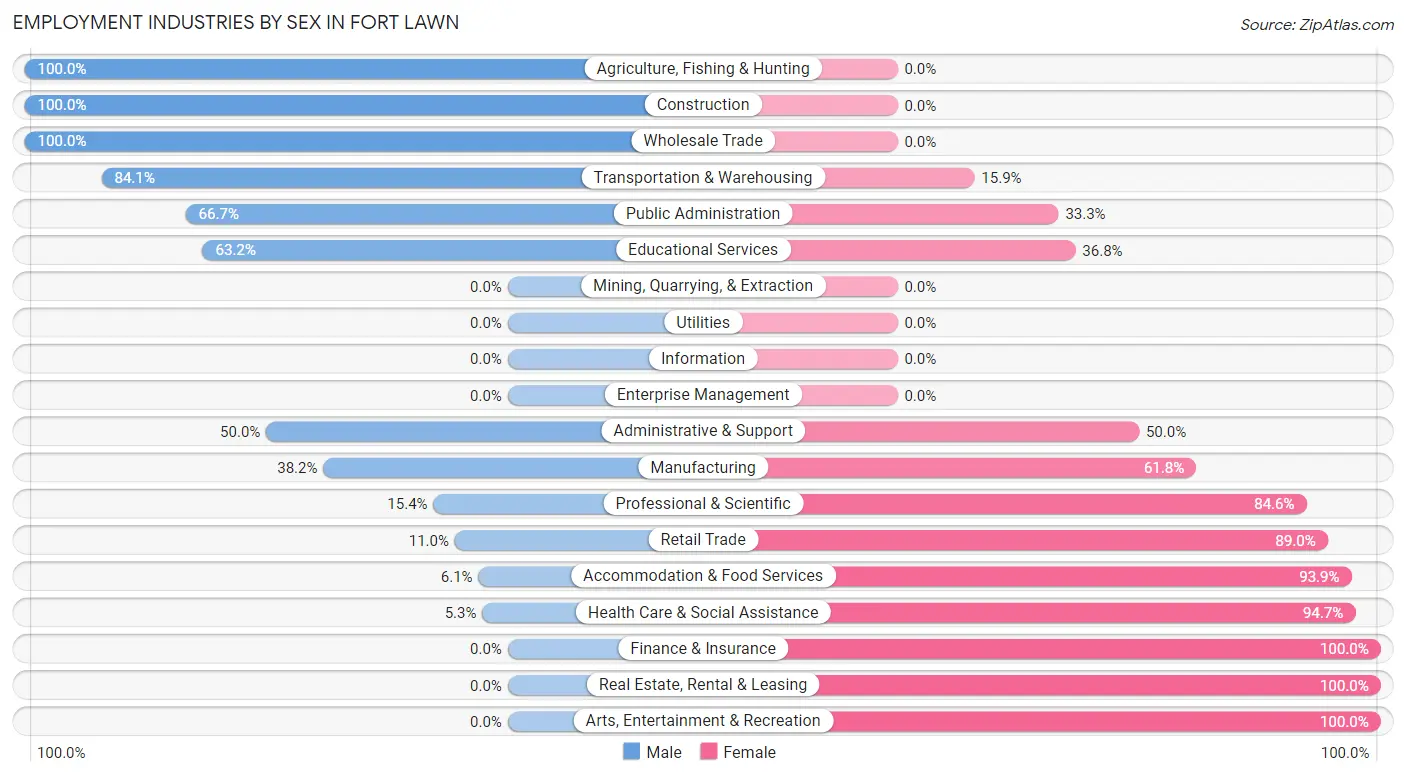
Employment Industries by Sex in Fort Lawn
The Fort Lawn industries that see more men than women are Agriculture, Fishing & Hunting (100.0%), Construction (100.0%), and Wholesale Trade (100.0%), whereas the industries that tend to have a higher number of women are Finance & Insurance (100.0%), Real Estate, Rental & Leasing (100.0%), and Arts, Entertainment & Recreation (100.0%).
| Industry | Male | Female |
| Agriculture, Fishing & Hunting | 13 (100.0%) | 0 (0.0%) |
| Mining, Quarrying, & Extraction | 0 (0.0%) | 0 (0.0%) |
| Construction | 49 (100.0%) | 0 (0.0%) |
| Manufacturing | 21 (38.2%) | 34 (61.8%) |
| Wholesale Trade | 8 (100.0%) | 0 (0.0%) |
| Retail Trade | 8 (11.0%) | 65 (89.0%) |
| Transportation & Warehousing | 58 (84.1%) | 11 (15.9%) |
| Utilities | 0 (0.0%) | 0 (0.0%) |
| Information | 0 (0.0%) | 0 (0.0%) |
| Finance & Insurance | 0 (0.0%) | 9 (100.0%) |
| Real Estate, Rental & Leasing | 0 (0.0%) | 2 (100.0%) |
| Professional & Scientific | 4 (15.4%) | 22 (84.6%) |
| Enterprise Management | 0 (0.0%) | 0 (0.0%) |
| Administrative & Support | 8 (50.0%) | 8 (50.0%) |
| Educational Services | 24 (63.2%) | 14 (36.8%) |
| Health Care & Social Assistance | 3 (5.3%) | 54 (94.7%) |
| Arts, Entertainment & Recreation | 0 (0.0%) | 3 (100.0%) |
| Accommodation & Food Services | 2 (6.1%) | 31 (93.9%) |
| Public Administration | 2 (66.7%) | 1 (33.3%) |
| Total | 215 (44.5%) | 268 (55.5%) |
Education in Fort Lawn
School Enrollment in Fort Lawn
The most common levels of schooling among the 366 students in Fort Lawn are elementary school (135 | 36.9%), middle school (92 | 25.1%), and high school (57 | 15.6%).
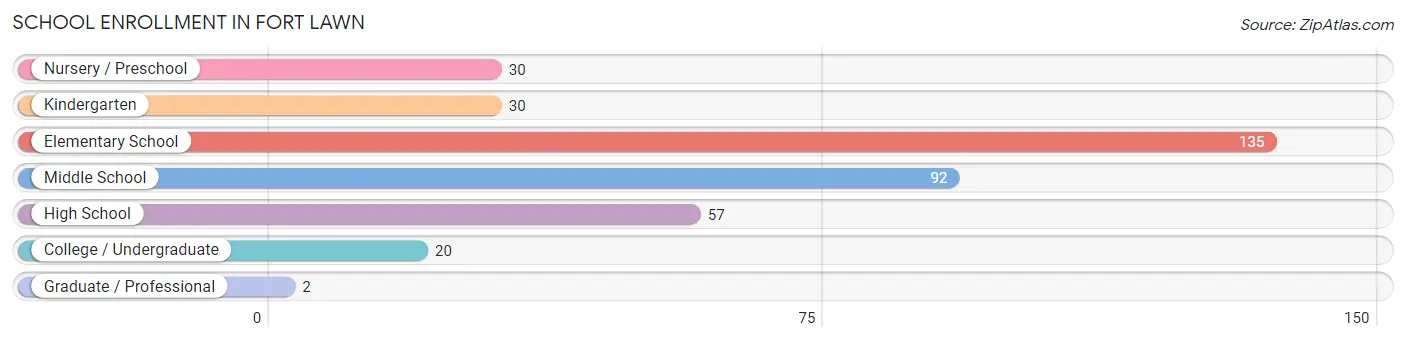
| School Level | # Students | % Students |
| Nursery / Preschool | 30 | 8.2% |
| Kindergarten | 30 | 8.2% |
| Elementary School | 135 | 36.9% |
| Middle School | 92 | 25.1% |
| High School | 57 | 15.6% |
| College / Undergraduate | 20 | 5.5% |
| Graduate / Professional | 2 | 0.5% |
| Total | 366 | 100.0% |
School Enrollment by Age by Funding Source in Fort Lawn
Out of a total of 366 students who are enrolled in schools in Fort Lawn, 9 (2.5%) attend a private institution, while the remaining 357 (97.5%) are enrolled in public schools. The age group of 20 to 24 year olds has the highest likelihood of being enrolled in private schools, with 2 (40.0% in the age bracket) enrolled. Conversely, the age group of 3 to 4 year olds has the lowest likelihood of being enrolled in a private school, with 25 (100.0% in the age bracket) attending a public institution.
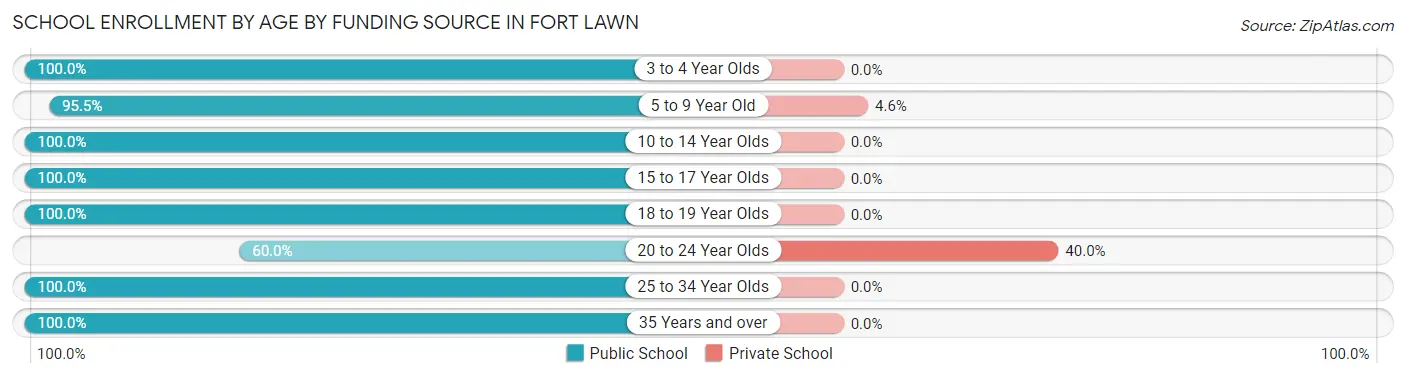
| Age Bracket | Public School | Private School |
| 3 to 4 Year Olds | 25 (100.0%) | 0 (0.0%) |
| 5 to 9 Year Old | 147 (95.5%) | 7 (4.5%) |
| 10 to 14 Year Olds | 108 (100.0%) | 0 (0.0%) |
| 15 to 17 Year Olds | 47 (100.0%) | 0 (0.0%) |
| 18 to 19 Year Olds | 10 (100.0%) | 0 (0.0%) |
| 20 to 24 Year Olds | 3 (60.0%) | 2 (40.0%) |
| 25 to 34 Year Olds | 13 (100.0%) | 0 (0.0%) |
| 35 Years and over | 4 (100.0%) | 0 (0.0%) |
| Total | 357 (97.5%) | 9 (2.5%) |
Educational Attainment by Field of Study in Fort Lawn
Science & technology (28 | 23.7%), education (18 | 15.2%), liberal arts & history (14 | 11.9%), bio, nature & agricultural (13 | 11.0%), and visual & performing arts (13 | 11.0%) are the most common fields of study among 118 individuals in Fort Lawn who have obtained a bachelor's degree or higher.
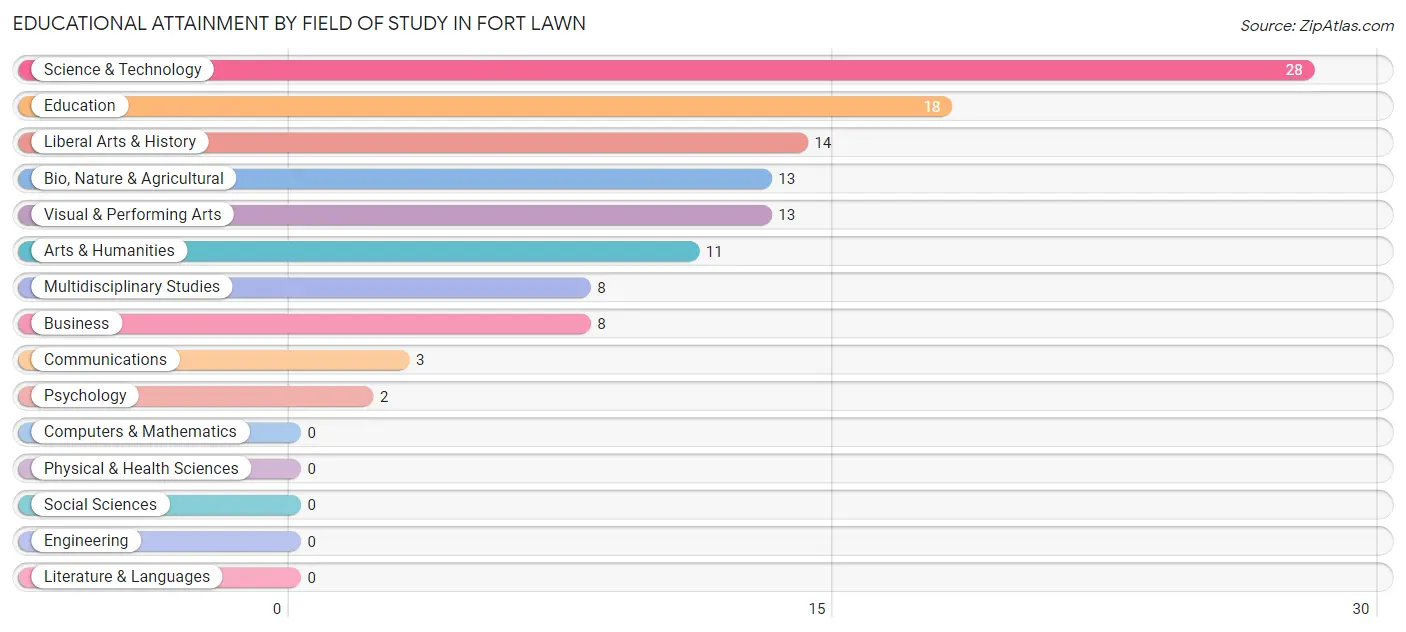
| Field of Study | # Graduates | % Graduates |
| Computers & Mathematics | 0 | 0.0% |
| Bio, Nature & Agricultural | 13 | 11.0% |
| Physical & Health Sciences | 0 | 0.0% |
| Psychology | 2 | 1.7% |
| Social Sciences | 0 | 0.0% |
| Engineering | 0 | 0.0% |
| Multidisciplinary Studies | 8 | 6.8% |
| Science & Technology | 28 | 23.7% |
| Business | 8 | 6.8% |
| Education | 18 | 15.2% |
| Literature & Languages | 0 | 0.0% |
| Liberal Arts & History | 14 | 11.9% |
| Visual & Performing Arts | 13 | 11.0% |
| Communications | 3 | 2.5% |
| Arts & Humanities | 11 | 9.3% |
| Total | 118 | 100.0% |
Transportation & Commute in Fort Lawn
Vehicle Availability by Sex in Fort Lawn
The most prevalent vehicle ownership categories in Fort Lawn are males with 2 vehicles (101, accounting for 47.0%) and females with 2 vehicles (102, making up 39.6%).
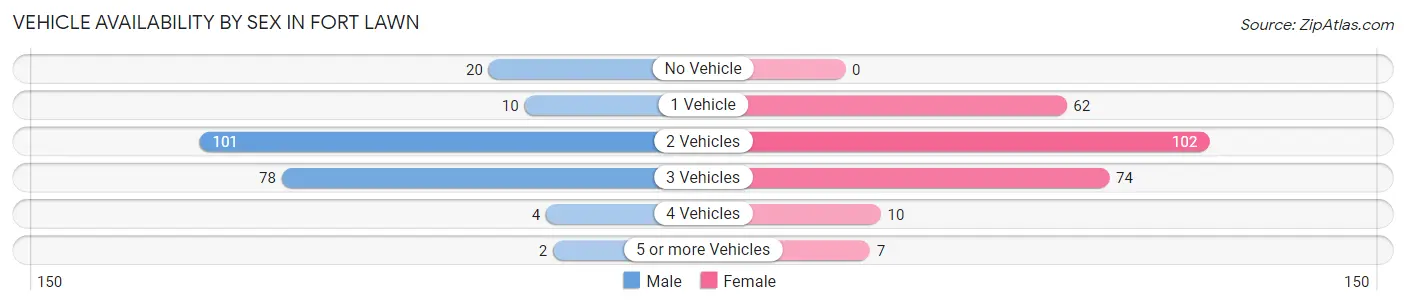
| Vehicles Available | Male | Female |
| No Vehicle | 20 (9.3%) | 0 (0.0%) |
| 1 Vehicle | 10 (4.6%) | 62 (24.3%) |
| 2 Vehicles | 101 (47.0%) | 102 (40.0%) |
| 3 Vehicles | 78 (36.3%) | 74 (29.0%) |
| 4 Vehicles | 4 (1.9%) | 10 (3.9%) |
| 5 or more Vehicles | 2 (0.9%) | 7 (2.8%) |
| Total | 215 (100.0%) | 255 (100.0%) |
Commute Time in Fort Lawn
The most frequently occuring commute durations in Fort Lawn are 30 to 34 minutes (134 commuters, 29.1%), 15 to 19 minutes (104 commuters, 22.6%), and 20 to 24 minutes (55 commuters, 12.0%).
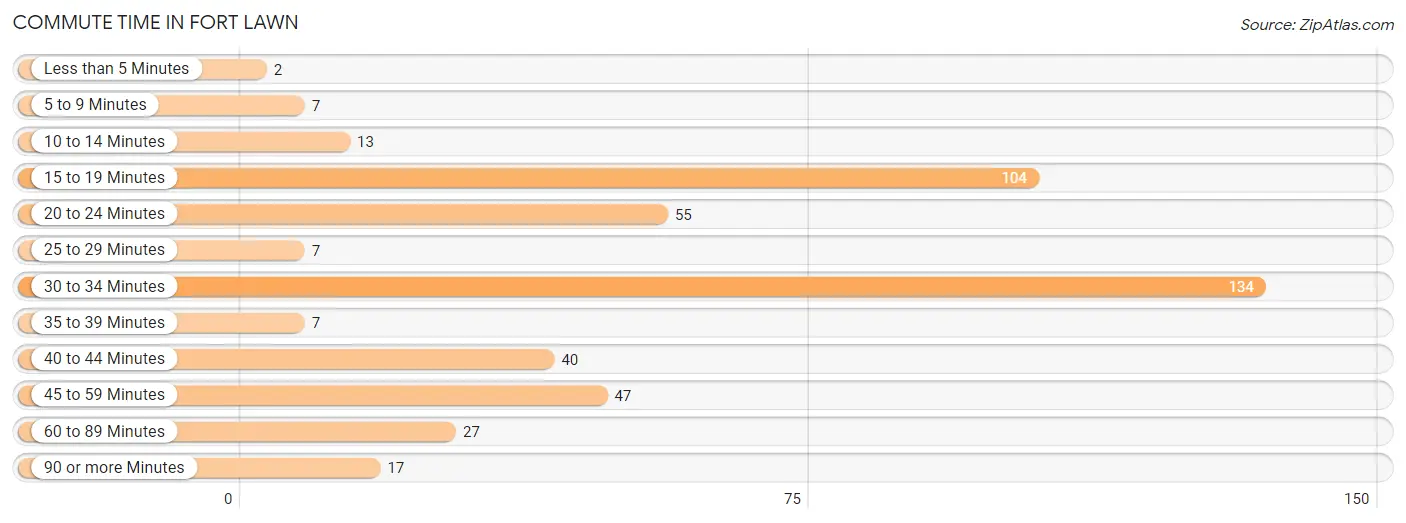
| Commute Time | # Commuters | % Commuters |
| Less than 5 Minutes | 2 | 0.4% |
| 5 to 9 Minutes | 7 | 1.5% |
| 10 to 14 Minutes | 13 | 2.8% |
| 15 to 19 Minutes | 104 | 22.6% |
| 20 to 24 Minutes | 55 | 12.0% |
| 25 to 29 Minutes | 7 | 1.5% |
| 30 to 34 Minutes | 134 | 29.1% |
| 35 to 39 Minutes | 7 | 1.5% |
| 40 to 44 Minutes | 40 | 8.7% |
| 45 to 59 Minutes | 47 | 10.2% |
| 60 to 89 Minutes | 27 | 5.9% |
| 90 or more Minutes | 17 | 3.7% |
Commute Time by Sex in Fort Lawn
The most common commute times in Fort Lawn are 15 to 19 minutes (57 commuters, 26.5%) for males and 30 to 34 minutes (91 commuters, 37.1%) for females.
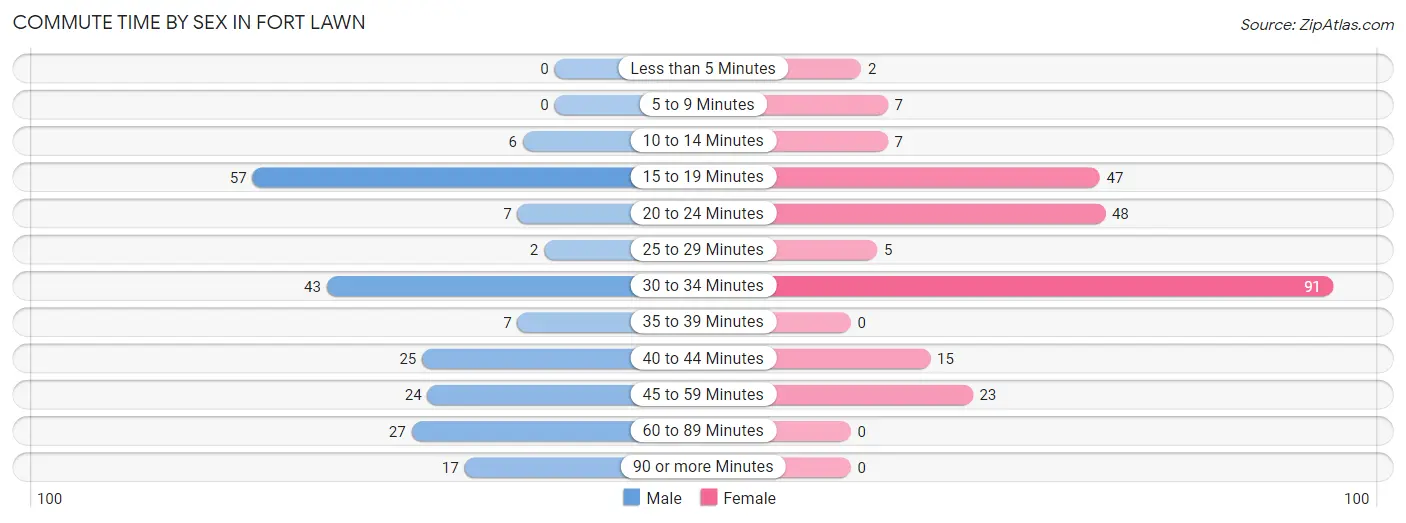
| Commute Time | Male | Female |
| Less than 5 Minutes | 0 (0.0%) | 2 (0.8%) |
| 5 to 9 Minutes | 0 (0.0%) | 7 (2.9%) |
| 10 to 14 Minutes | 6 (2.8%) | 7 (2.9%) |
| 15 to 19 Minutes | 57 (26.5%) | 47 (19.2%) |
| 20 to 24 Minutes | 7 (3.3%) | 48 (19.6%) |
| 25 to 29 Minutes | 2 (0.9%) | 5 (2.0%) |
| 30 to 34 Minutes | 43 (20.0%) | 91 (37.1%) |
| 35 to 39 Minutes | 7 (3.3%) | 0 (0.0%) |
| 40 to 44 Minutes | 25 (11.6%) | 15 (6.1%) |
| 45 to 59 Minutes | 24 (11.2%) | 23 (9.4%) |
| 60 to 89 Minutes | 27 (12.6%) | 0 (0.0%) |
| 90 or more Minutes | 17 (7.9%) | 0 (0.0%) |
Time of Departure to Work by Sex in Fort Lawn
The most frequent times of departure to work in Fort Lawn are 5:30 AM to 5:59 AM (48, 22.3%) for males and 7:00 AM to 7:29 AM (76, 31.0%) for females.
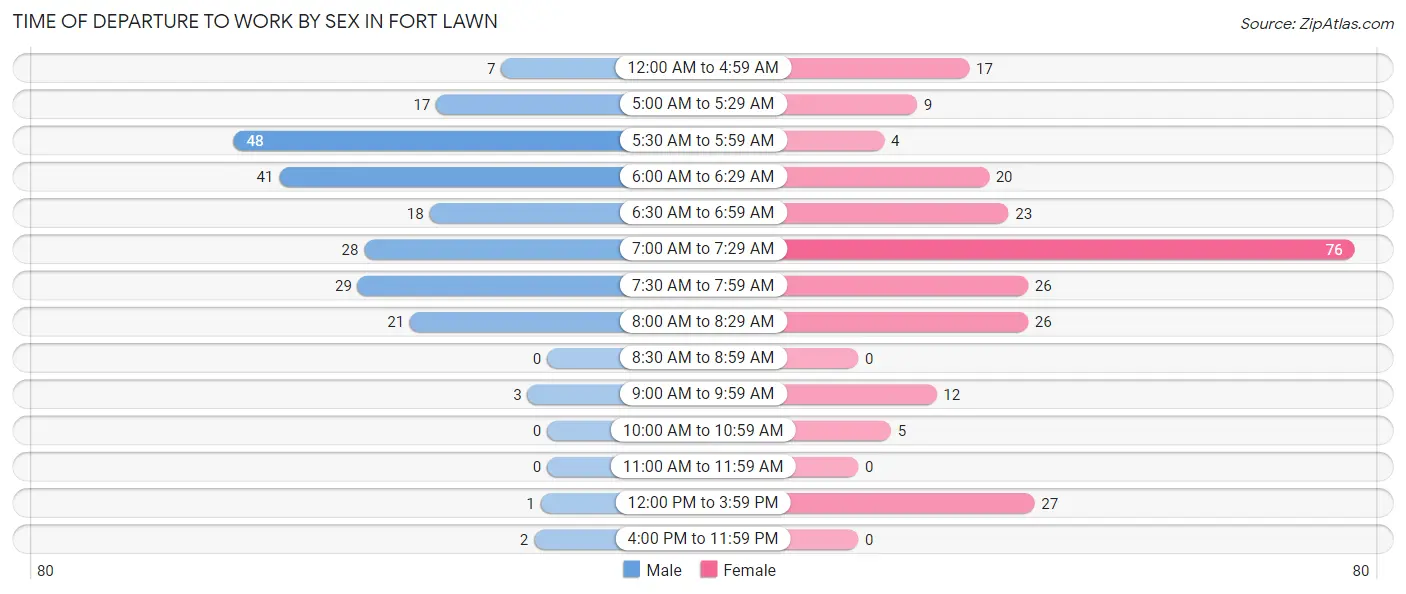
| Time of Departure | Male | Female |
| 12:00 AM to 4:59 AM | 7 (3.3%) | 17 (6.9%) |
| 5:00 AM to 5:29 AM | 17 (7.9%) | 9 (3.7%) |
| 5:30 AM to 5:59 AM | 48 (22.3%) | 4 (1.6%) |
| 6:00 AM to 6:29 AM | 41 (19.1%) | 20 (8.2%) |
| 6:30 AM to 6:59 AM | 18 (8.4%) | 23 (9.4%) |
| 7:00 AM to 7:29 AM | 28 (13.0%) | 76 (31.0%) |
| 7:30 AM to 7:59 AM | 29 (13.5%) | 26 (10.6%) |
| 8:00 AM to 8:29 AM | 21 (9.8%) | 26 (10.6%) |
| 8:30 AM to 8:59 AM | 0 (0.0%) | 0 (0.0%) |
| 9:00 AM to 9:59 AM | 3 (1.4%) | 12 (4.9%) |
| 10:00 AM to 10:59 AM | 0 (0.0%) | 5 (2.0%) |
| 11:00 AM to 11:59 AM | 0 (0.0%) | 0 (0.0%) |
| 12:00 PM to 3:59 PM | 1 (0.5%) | 27 (11.0%) |
| 4:00 PM to 11:59 PM | 2 (0.9%) | 0 (0.0%) |
| Total | 215 (100.0%) | 245 (100.0%) |
Housing Occupancy in Fort Lawn
Occupancy by Ownership in Fort Lawn
Of the total 384 dwellings in Fort Lawn, owner-occupied units account for 248 (64.6%), while renter-occupied units make up 136 (35.4%).
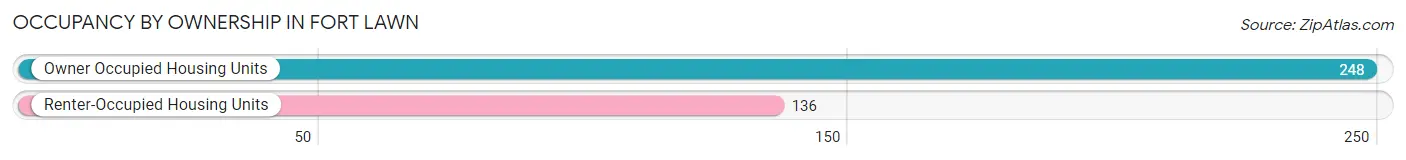
| Occupancy | # Housing Units | % Housing Units |
| Owner Occupied Housing Units | 248 | 64.6% |
| Renter-Occupied Housing Units | 136 | 35.4% |
| Total Occupied Housing Units | 384 | 100.0% |
Occupancy by Household Size in Fort Lawn
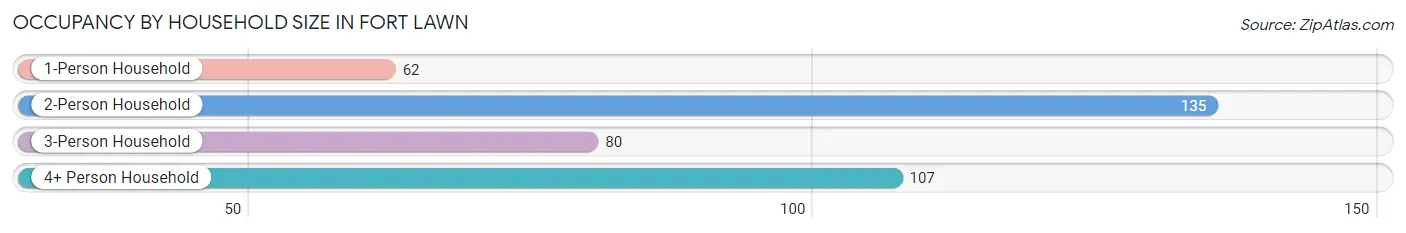
| Household Size | # Housing Units | % Housing Units |
| 1-Person Household | 62 | 16.2% |
| 2-Person Household | 135 | 35.2% |
| 3-Person Household | 80 | 20.8% |
| 4+ Person Household | 107 | 27.9% |
| Total Housing Units | 384 | 100.0% |
Occupancy by Ownership by Household Size in Fort Lawn
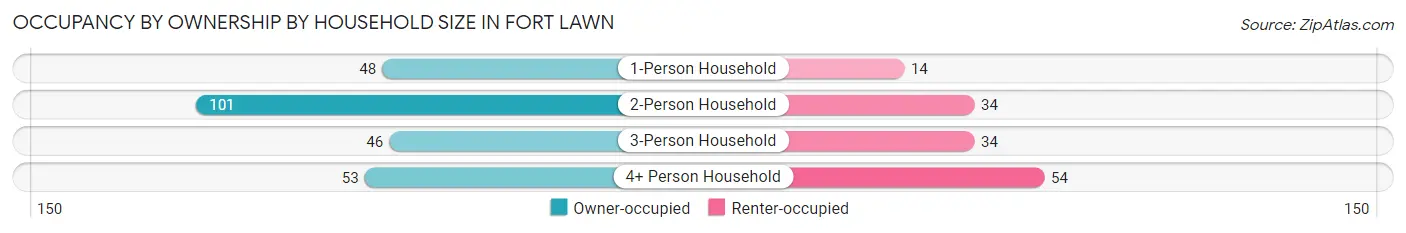
| Household Size | Owner-occupied | Renter-occupied |
| 1-Person Household | 48 (77.4%) | 14 (22.6%) |
| 2-Person Household | 101 (74.8%) | 34 (25.2%) |
| 3-Person Household | 46 (57.5%) | 34 (42.5%) |
| 4+ Person Household | 53 (49.5%) | 54 (50.5%) |
| Total Housing Units | 248 (64.6%) | 136 (35.4%) |
Occupancy by Educational Attainment in Fort Lawn
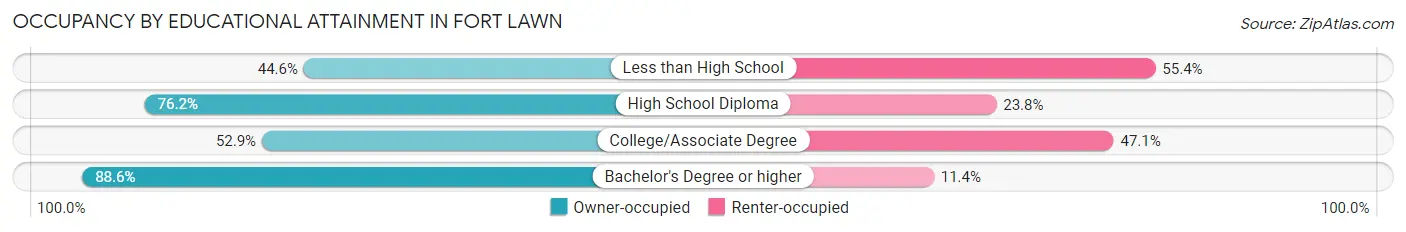
| Household Size | Owner-occupied | Renter-occupied |
| Less than High School | 25 (44.6%) | 31 (55.4%) |
| High School Diploma | 80 (76.2%) | 25 (23.8%) |
| College/Associate Degree | 81 (52.9%) | 72 (47.1%) |
| Bachelor's Degree or higher | 62 (88.6%) | 8 (11.4%) |
Occupancy by Age of Householder in Fort Lawn
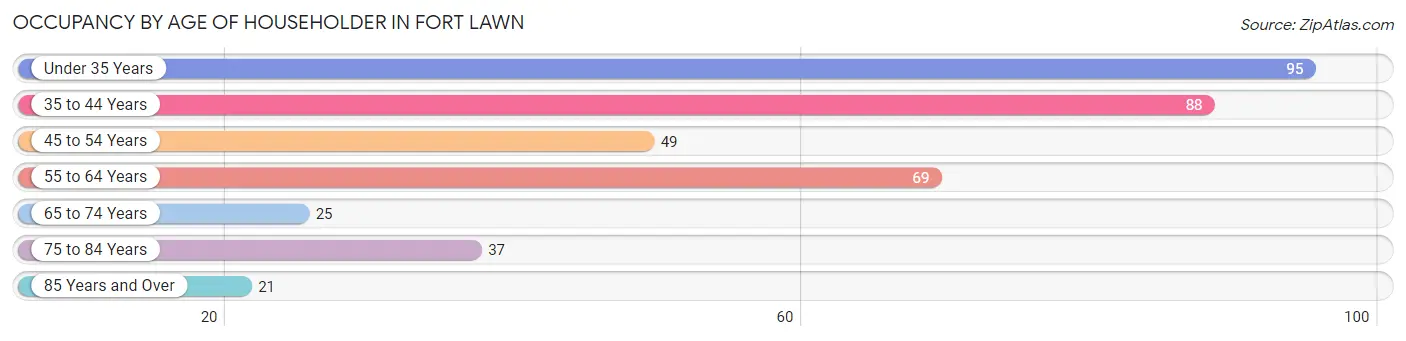
| Age Bracket | # Households | % Households |
| Under 35 Years | 95 | 24.7% |
| 35 to 44 Years | 88 | 22.9% |
| 45 to 54 Years | 49 | 12.8% |
| 55 to 64 Years | 69 | 18.0% |
| 65 to 74 Years | 25 | 6.5% |
| 75 to 84 Years | 37 | 9.6% |
| 85 Years and Over | 21 | 5.5% |
| Total | 384 | 100.0% |
Housing Finances in Fort Lawn
Median Income by Occupancy in Fort Lawn
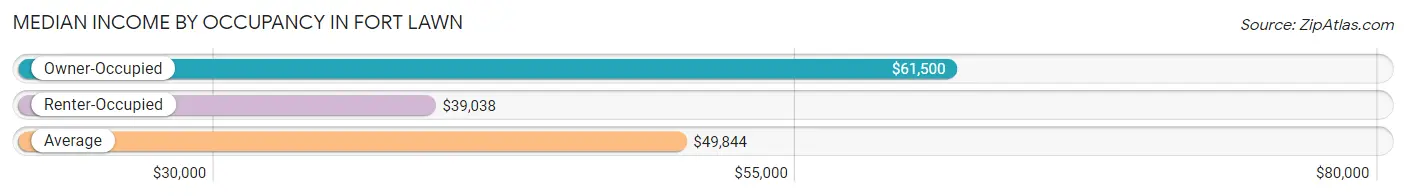
| Occupancy Type | # Households | Median Income |
| Owner-Occupied | 248 (64.6%) | $61,500 |
| Renter-Occupied | 136 (35.4%) | $39,038 |
| Average | 384 (100.0%) | $49,844 |
Occupancy by Householder Income Bracket in Fort Lawn
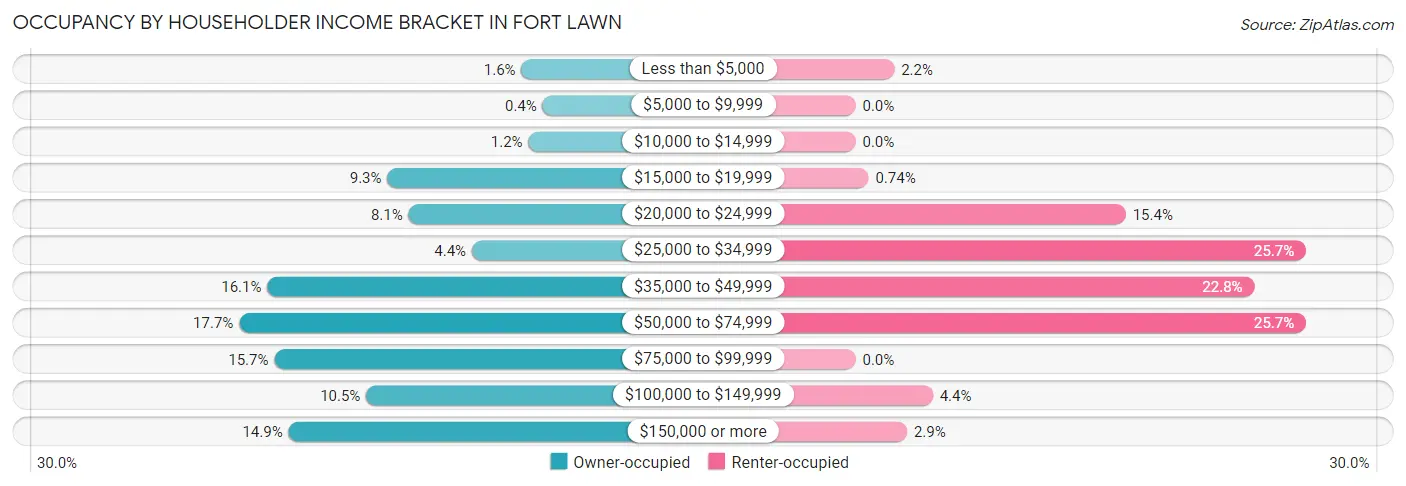
| Income Bracket | Owner-occupied | Renter-occupied |
| Less than $5,000 | 4 (1.6%) | 3 (2.2%) |
| $5,000 to $9,999 | 1 (0.4%) | 0 (0.0%) |
| $10,000 to $14,999 | 3 (1.2%) | 0 (0.0%) |
| $15,000 to $19,999 | 23 (9.3%) | 1 (0.7%) |
| $20,000 to $24,999 | 20 (8.1%) | 21 (15.4%) |
| $25,000 to $34,999 | 11 (4.4%) | 35 (25.7%) |
| $35,000 to $49,999 | 40 (16.1%) | 31 (22.8%) |
| $50,000 to $74,999 | 44 (17.7%) | 35 (25.7%) |
| $75,000 to $99,999 | 39 (15.7%) | 0 (0.0%) |
| $100,000 to $149,999 | 26 (10.5%) | 6 (4.4%) |
| $150,000 or more | 37 (14.9%) | 4 (2.9%) |
| Total | 248 (100.0%) | 136 (100.0%) |
Monthly Housing Cost Tiers in Fort Lawn
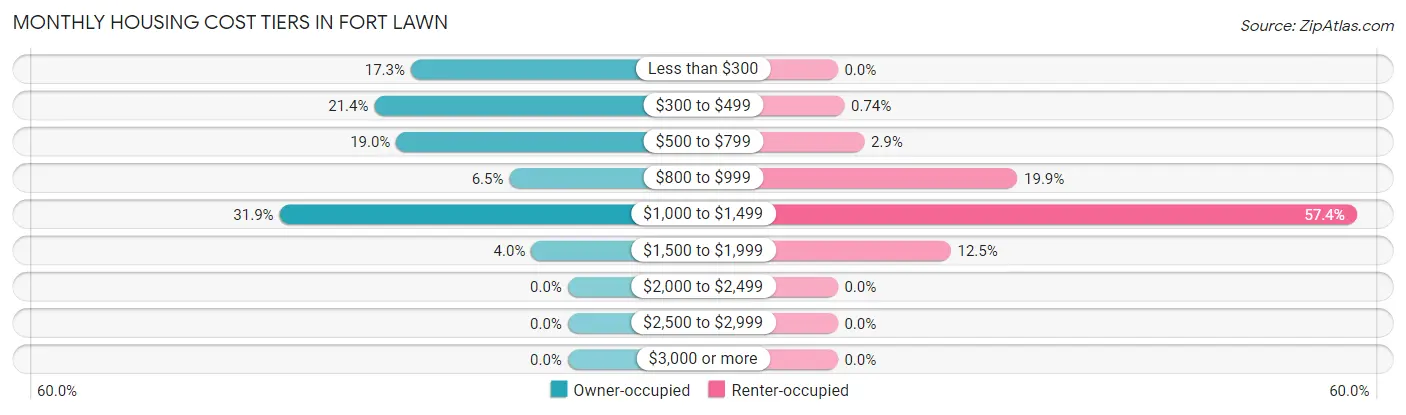
| Monthly Cost | Owner-occupied | Renter-occupied |
| Less than $300 | 43 (17.3%) | 0 (0.0%) |
| $300 to $499 | 53 (21.4%) | 1 (0.7%) |
| $500 to $799 | 47 (19.0%) | 4 (2.9%) |
| $800 to $999 | 16 (6.5%) | 27 (19.9%) |
| $1,000 to $1,499 | 79 (31.9%) | 78 (57.4%) |
| $1,500 to $1,999 | 10 (4.0%) | 17 (12.5%) |
| $2,000 to $2,499 | 0 (0.0%) | 0 (0.0%) |
| $2,500 to $2,999 | 0 (0.0%) | 0 (0.0%) |
| $3,000 or more | 0 (0.0%) | 0 (0.0%) |
| Total | 248 (100.0%) | 136 (100.0%) |
Physical Housing Characteristics in Fort Lawn
Housing Structures in Fort Lawn
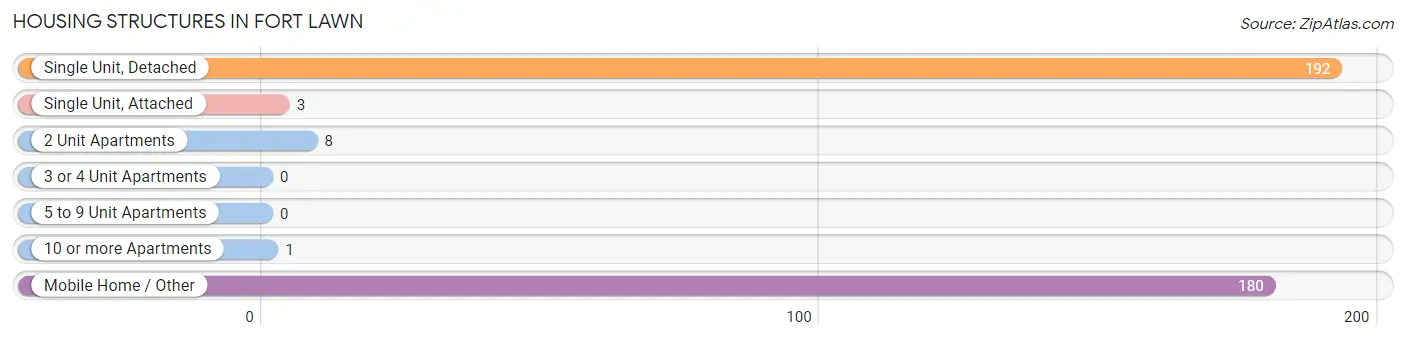
| Structure Type | # Housing Units | % Housing Units |
| Single Unit, Detached | 192 | 50.0% |
| Single Unit, Attached | 3 | 0.8% |
| 2 Unit Apartments | 8 | 2.1% |
| 3 or 4 Unit Apartments | 0 | 0.0% |
| 5 to 9 Unit Apartments | 0 | 0.0% |
| 10 or more Apartments | 1 | 0.3% |
| Mobile Home / Other | 180 | 46.9% |
| Total | 384 | 100.0% |
Housing Structures by Occupancy in Fort Lawn
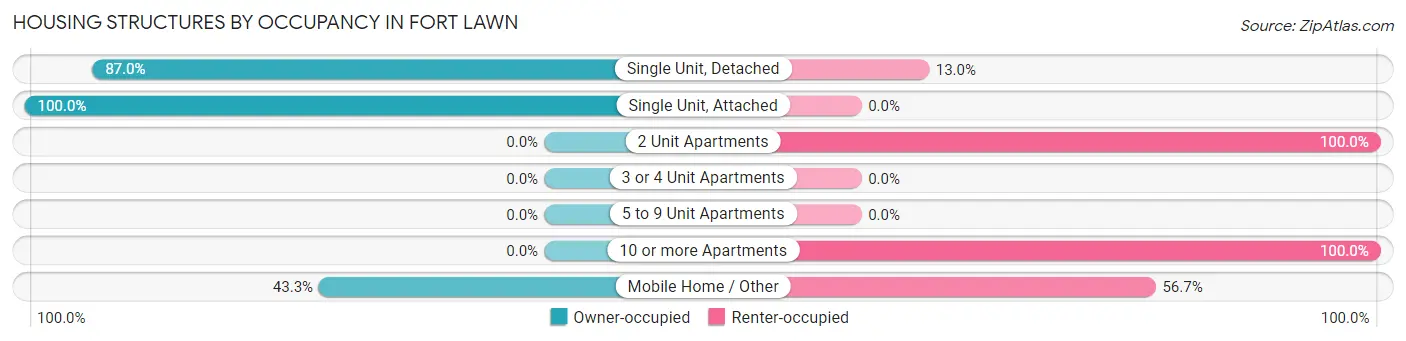
| Structure Type | Owner-occupied | Renter-occupied |
| Single Unit, Detached | 167 (87.0%) | 25 (13.0%) |
| Single Unit, Attached | 3 (100.0%) | 0 (0.0%) |
| 2 Unit Apartments | 0 (0.0%) | 8 (100.0%) |
| 3 or 4 Unit Apartments | 0 (0.0%) | 0 (0.0%) |
| 5 to 9 Unit Apartments | 0 (0.0%) | 0 (0.0%) |
| 10 or more Apartments | 0 (0.0%) | 1 (100.0%) |
| Mobile Home / Other | 78 (43.3%) | 102 (56.7%) |
| Total | 248 (64.6%) | 136 (35.4%) |
Housing Structures by Number of Rooms in Fort Lawn
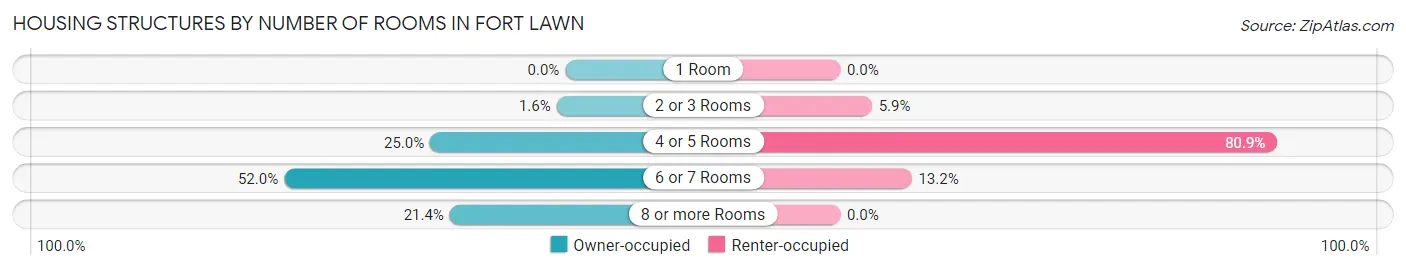
| Number of Rooms | Owner-occupied | Renter-occupied |
| 1 Room | 0 (0.0%) | 0 (0.0%) |
| 2 or 3 Rooms | 4 (1.6%) | 8 (5.9%) |
| 4 or 5 Rooms | 62 (25.0%) | 110 (80.9%) |
| 6 or 7 Rooms | 129 (52.0%) | 18 (13.2%) |
| 8 or more Rooms | 53 (21.4%) | 0 (0.0%) |
| Total | 248 (100.0%) | 136 (100.0%) |
Housing Structure by Heating Type in Fort Lawn
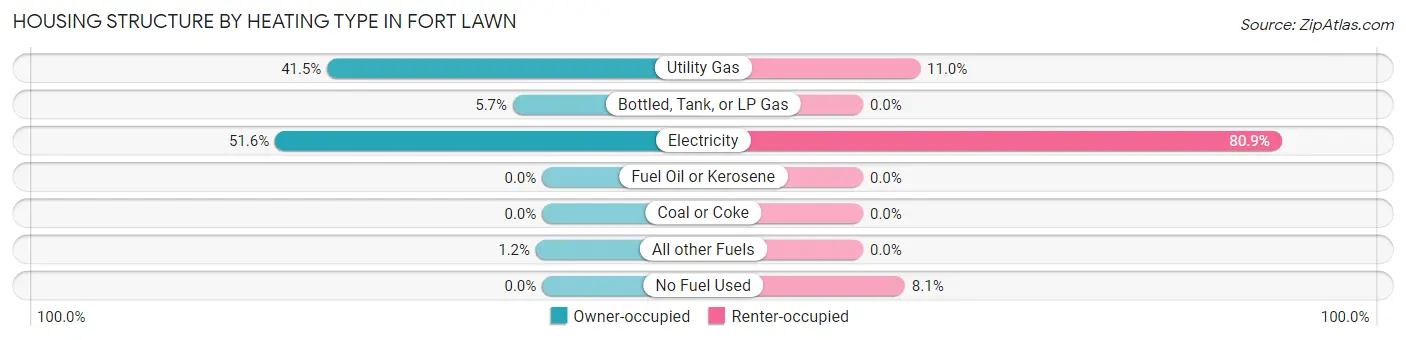
| Heating Type | Owner-occupied | Renter-occupied |
| Utility Gas | 103 (41.5%) | 15 (11.0%) |
| Bottled, Tank, or LP Gas | 14 (5.7%) | 0 (0.0%) |
| Electricity | 128 (51.6%) | 110 (80.9%) |
| Fuel Oil or Kerosene | 0 (0.0%) | 0 (0.0%) |
| Coal or Coke | 0 (0.0%) | 0 (0.0%) |
| All other Fuels | 3 (1.2%) | 0 (0.0%) |
| No Fuel Used | 0 (0.0%) | 11 (8.1%) |
| Total | 248 (100.0%) | 136 (100.0%) |
Household Vehicle Usage in Fort Lawn
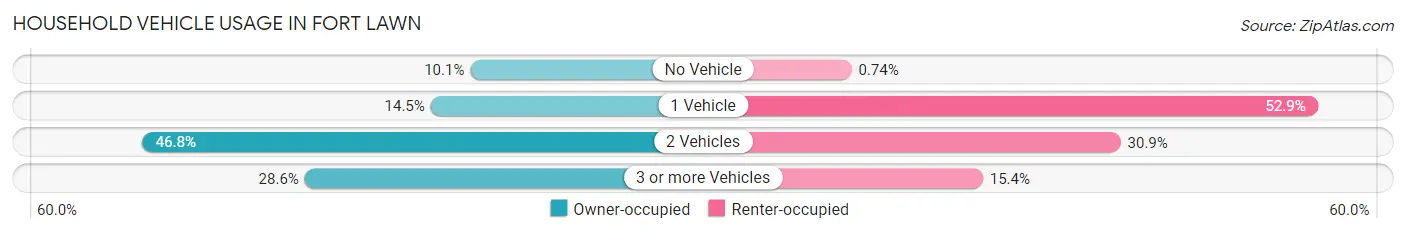
| Vehicles per Household | Owner-occupied | Renter-occupied |
| No Vehicle | 25 (10.1%) | 1 (0.7%) |
| 1 Vehicle | 36 (14.5%) | 72 (52.9%) |
| 2 Vehicles | 116 (46.8%) | 42 (30.9%) |
| 3 or more Vehicles | 71 (28.6%) | 21 (15.4%) |
| Total | 248 (100.0%) | 136 (100.0%) |
Real Estate & Mortgages in Fort Lawn
Real Estate and Mortgage Overview in Fort Lawn
| Characteristic | Without Mortgage | With Mortgage |
| Housing Units | 120 | 128 |
| Median Property Value | $146,900 | $158,300 |
| Median Household Income | $46,667 | $22 |
| Monthly Housing Costs | $359 | $0 |
| Real Estate Taxes | $426 | $4 |
Property Value by Mortgage Status in Fort Lawn
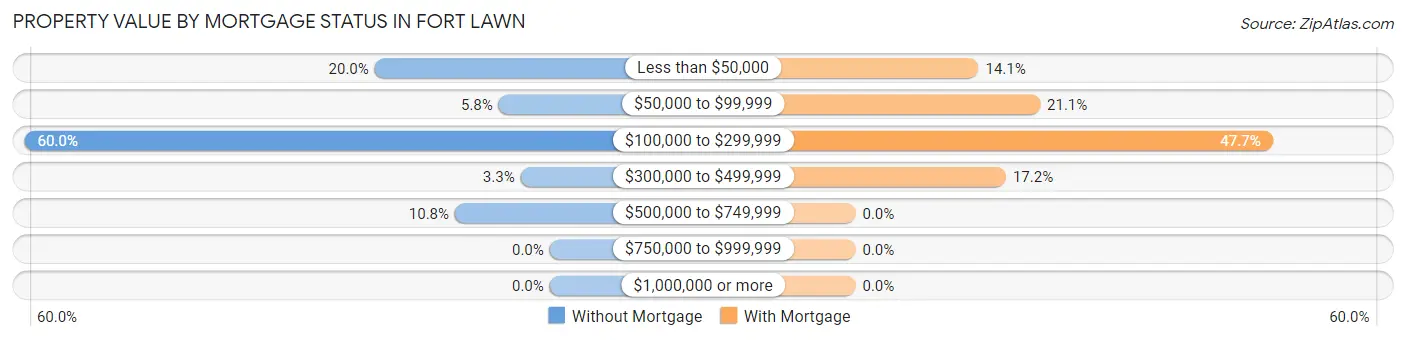
| Property Value | Without Mortgage | With Mortgage |
| Less than $50,000 | 24 (20.0%) | 18 (14.1%) |
| $50,000 to $99,999 | 7 (5.8%) | 27 (21.1%) |
| $100,000 to $299,999 | 72 (60.0%) | 61 (47.7%) |
| $300,000 to $499,999 | 4 (3.3%) | 22 (17.2%) |
| $500,000 to $749,999 | 13 (10.8%) | 0 (0.0%) |
| $750,000 to $999,999 | 0 (0.0%) | 0 (0.0%) |
| $1,000,000 or more | 0 (0.0%) | 0 (0.0%) |
| Total | 120 (100.0%) | 128 (100.0%) |
Household Income by Mortgage Status in Fort Lawn
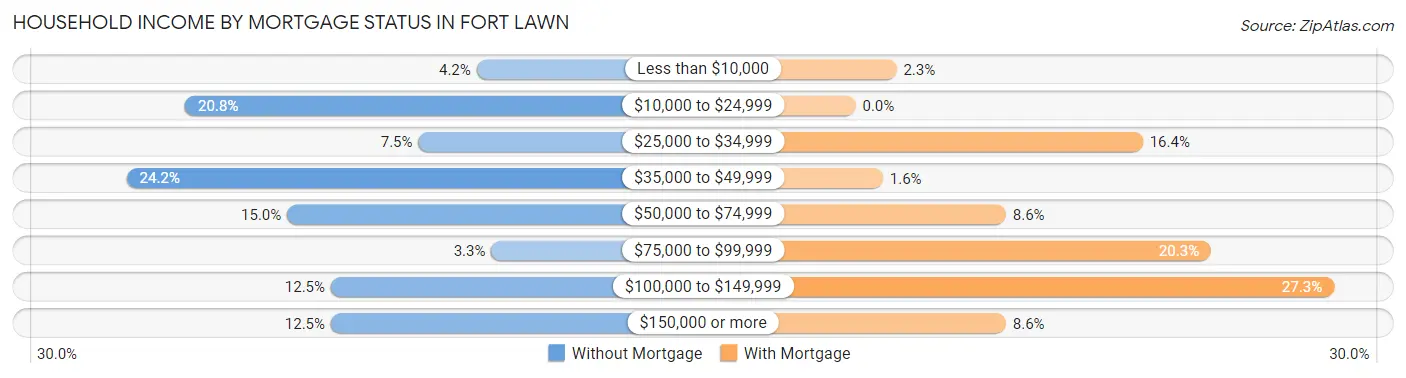
| Household Income | Without Mortgage | With Mortgage |
| Less than $10,000 | 5 (4.2%) | 3 (2.3%) |
| $10,000 to $24,999 | 25 (20.8%) | 0 (0.0%) |
| $25,000 to $34,999 | 9 (7.5%) | 21 (16.4%) |
| $35,000 to $49,999 | 29 (24.2%) | 2 (1.6%) |
| $50,000 to $74,999 | 18 (15.0%) | 11 (8.6%) |
| $75,000 to $99,999 | 4 (3.3%) | 26 (20.3%) |
| $100,000 to $149,999 | 15 (12.5%) | 35 (27.3%) |
| $150,000 or more | 15 (12.5%) | 11 (8.6%) |
| Total | 120 (100.0%) | 128 (100.0%) |
Property Value to Household Income Ratio in Fort Lawn
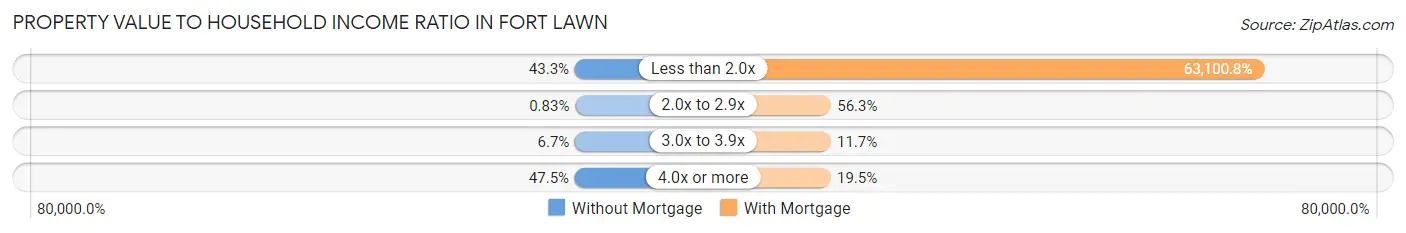
| Value-to-Income Ratio | Without Mortgage | With Mortgage |
| Less than 2.0x | 52 (43.3%) | 80,769 (63,100.8%) |
| 2.0x to 2.9x | 1 (0.8%) | 72 (56.2%) |
| 3.0x to 3.9x | 8 (6.7%) | 15 (11.7%) |
| 4.0x or more | 57 (47.5%) | 25 (19.5%) |
| Total | 120 (100.0%) | 128 (100.0%) |
Real Estate Taxes by Mortgage Status in Fort Lawn
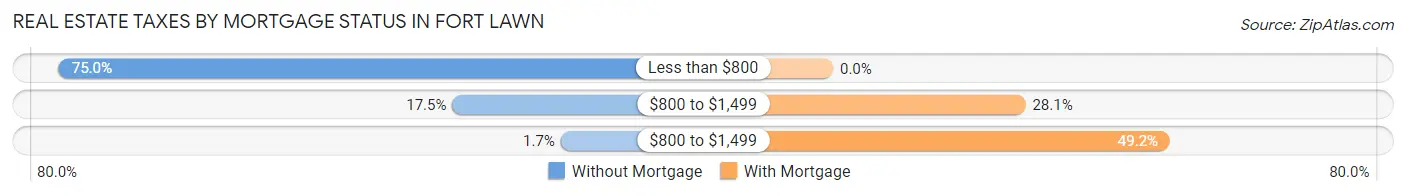
| Property Taxes | Without Mortgage | With Mortgage |
| Less than $800 | 90 (75.0%) | 0 (0.0%) |
| $800 to $1,499 | 21 (17.5%) | 36 (28.1%) |
| $800 to $1,499 | 2 (1.7%) | 63 (49.2%) |
| Total | 120 (100.0%) | 128 (100.0%) |
Health & Disability in Fort Lawn
Health Insurance Coverage by Age in Fort Lawn
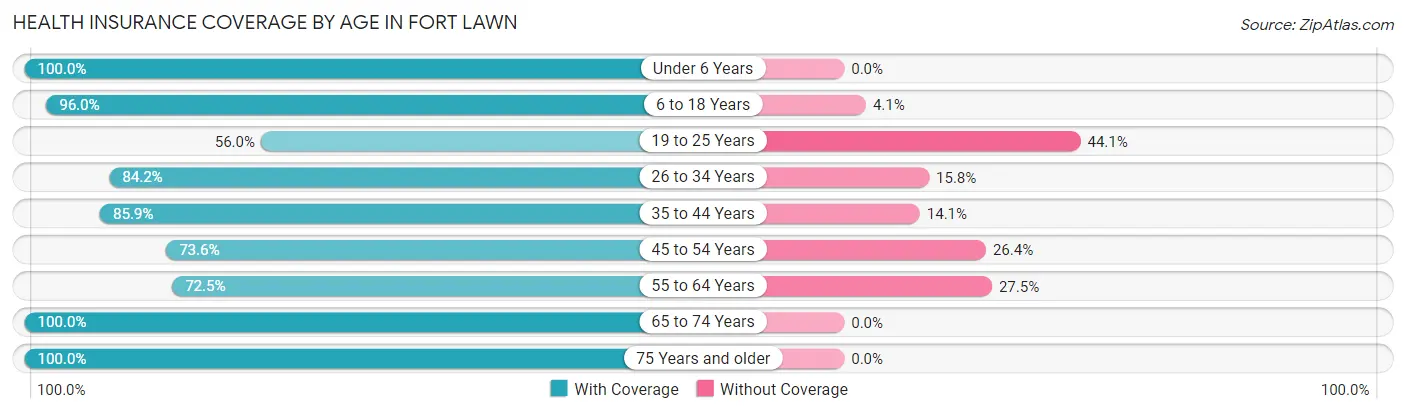
| Age Bracket | With Coverage | Without Coverage |
| Under 6 Years | 95 (100.0%) | 0 (0.0%) |
| 6 to 18 Years | 284 (96.0%) | 12 (4.1%) |
| 19 to 25 Years | 47 (55.9%) | 37 (44.1%) |
| 26 to 34 Years | 133 (84.2%) | 25 (15.8%) |
| 35 to 44 Years | 128 (85.9%) | 21 (14.1%) |
| 45 to 54 Years | 78 (73.6%) | 28 (26.4%) |
| 55 to 64 Years | 100 (72.5%) | 38 (27.5%) |
| 65 to 74 Years | 31 (100.0%) | 0 (0.0%) |
| 75 Years and older | 92 (100.0%) | 0 (0.0%) |
| Total | 988 (86.0%) | 161 (14.0%) |
Health Insurance Coverage by Citizenship Status in Fort Lawn
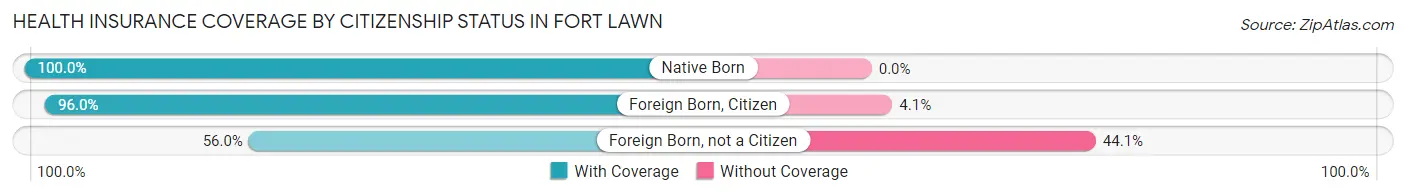
| Citizenship Status | With Coverage | Without Coverage |
| Native Born | 95 (100.0%) | 0 (0.0%) |
| Foreign Born, Citizen | 284 (96.0%) | 12 (4.1%) |
| Foreign Born, not a Citizen | 47 (55.9%) | 37 (44.1%) |
Health Insurance Coverage by Household Income in Fort Lawn
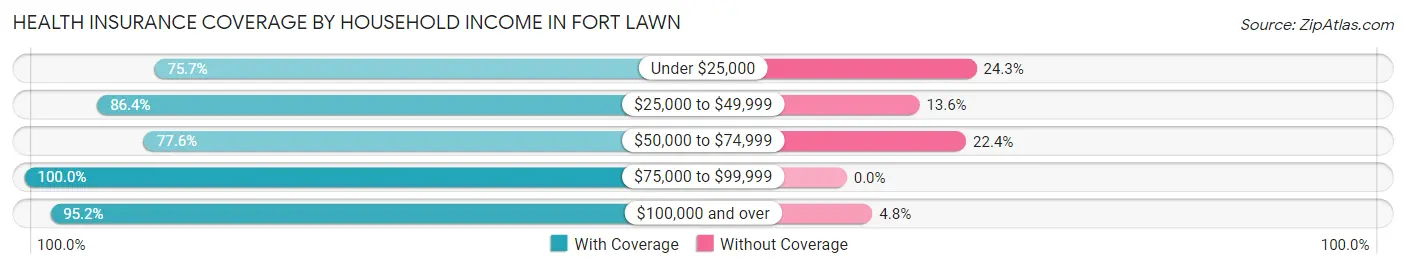
| Household Income | With Coverage | Without Coverage |
| Under $25,000 | 109 (75.7%) | 35 (24.3%) |
| $25,000 to $49,999 | 273 (86.4%) | 43 (13.6%) |
| $50,000 to $74,999 | 243 (77.6%) | 70 (22.4%) |
| $75,000 to $99,999 | 105 (100.0%) | 0 (0.0%) |
| $100,000 and over | 258 (95.2%) | 13 (4.8%) |
Public vs Private Health Insurance Coverage by Age in Fort Lawn
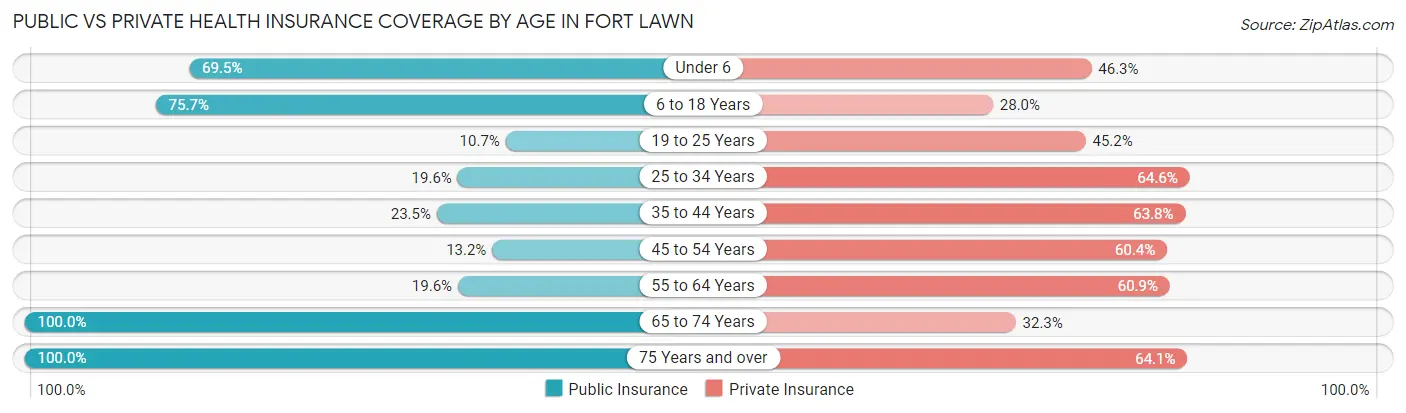
| Age Bracket | Public Insurance | Private Insurance |
| Under 6 | 66 (69.5%) | 44 (46.3%) |
| 6 to 18 Years | 224 (75.7%) | 83 (28.0%) |
| 19 to 25 Years | 9 (10.7%) | 38 (45.2%) |
| 25 to 34 Years | 31 (19.6%) | 102 (64.6%) |
| 35 to 44 Years | 35 (23.5%) | 95 (63.8%) |
| 45 to 54 Years | 14 (13.2%) | 64 (60.4%) |
| 55 to 64 Years | 27 (19.6%) | 84 (60.9%) |
| 65 to 74 Years | 31 (100.0%) | 10 (32.3%) |
| 75 Years and over | 92 (100.0%) | 59 (64.1%) |
| Total | 529 (46.0%) | 579 (50.4%) |
Disability Status by Sex by Age in Fort Lawn
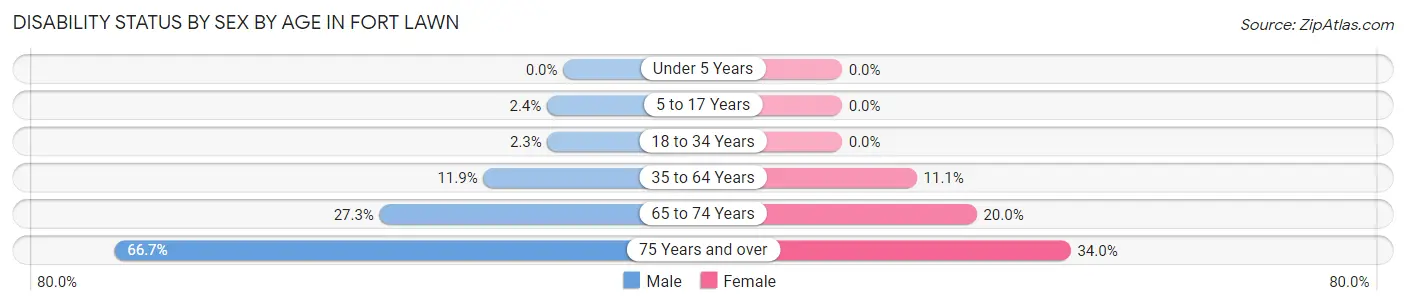
| Age Bracket | Male | Female |
| Under 5 Years | 0 (0.0%) | 0 (0.0%) |
| 5 to 17 Years | 4 (2.4%) | 0 (0.0%) |
| 18 to 34 Years | 3 (2.3%) | 0 (0.0%) |
| 35 to 64 Years | 21 (11.9%) | 24 (11.1%) |
| 65 to 74 Years | 3 (27.3%) | 4 (20.0%) |
| 75 Years and over | 26 (66.7%) | 18 (34.0%) |
Disability Class by Sex by Age in Fort Lawn
Disability Class: Hearing Difficulty
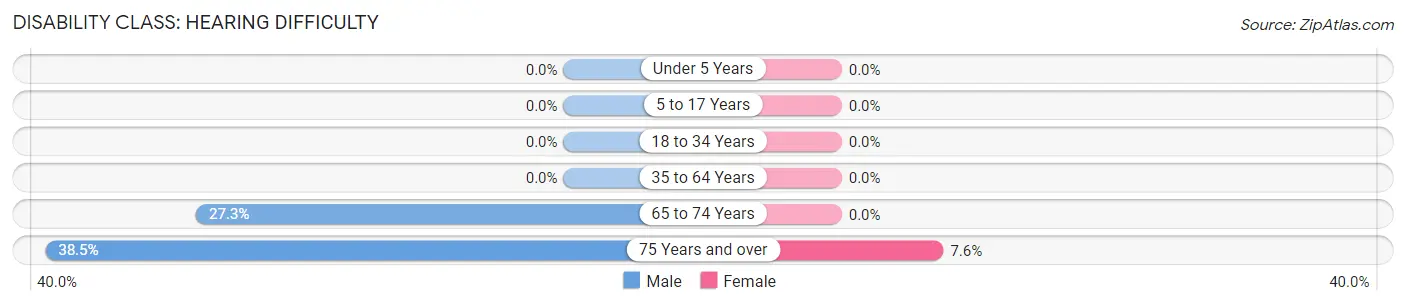
| Age Bracket | Male | Female |
| Under 5 Years | 0 (0.0%) | 0 (0.0%) |
| 5 to 17 Years | 0 (0.0%) | 0 (0.0%) |
| 18 to 34 Years | 0 (0.0%) | 0 (0.0%) |
| 35 to 64 Years | 0 (0.0%) | 0 (0.0%) |
| 65 to 74 Years | 3 (27.3%) | 0 (0.0%) |
| 75 Years and over | 15 (38.5%) | 4 (7.5%) |
Disability Class: Vision Difficulty
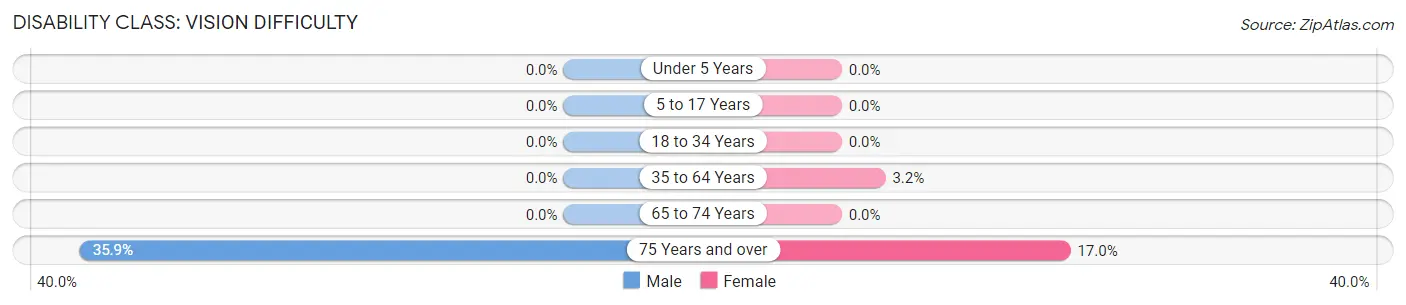
| Age Bracket | Male | Female |
| Under 5 Years | 0 (0.0%) | 0 (0.0%) |
| 5 to 17 Years | 0 (0.0%) | 0 (0.0%) |
| 18 to 34 Years | 0 (0.0%) | 0 (0.0%) |
| 35 to 64 Years | 0 (0.0%) | 7 (3.2%) |
| 65 to 74 Years | 0 (0.0%) | 0 (0.0%) |
| 75 Years and over | 14 (35.9%) | 9 (17.0%) |
Disability Class: Cognitive Difficulty
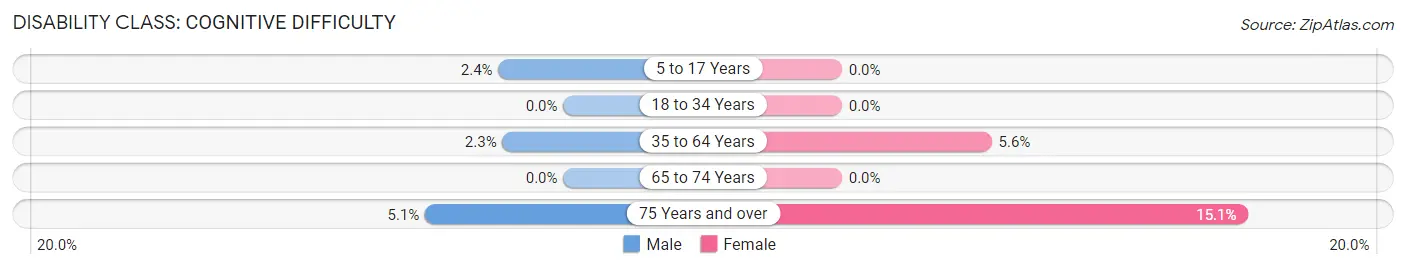
| Age Bracket | Male | Female |
| 5 to 17 Years | 4 (2.4%) | 0 (0.0%) |
| 18 to 34 Years | 0 (0.0%) | 0 (0.0%) |
| 35 to 64 Years | 4 (2.3%) | 12 (5.6%) |
| 65 to 74 Years | 0 (0.0%) | 0 (0.0%) |
| 75 Years and over | 2 (5.1%) | 8 (15.1%) |
Disability Class: Ambulatory Difficulty
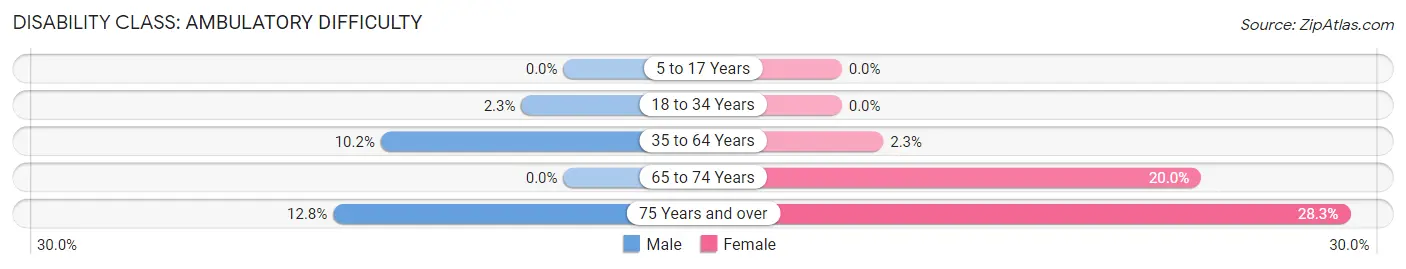
| Age Bracket | Male | Female |
| 5 to 17 Years | 0 (0.0%) | 0 (0.0%) |
| 18 to 34 Years | 3 (2.3%) | 0 (0.0%) |
| 35 to 64 Years | 18 (10.2%) | 5 (2.3%) |
| 65 to 74 Years | 0 (0.0%) | 4 (20.0%) |
| 75 Years and over | 5 (12.8%) | 15 (28.3%) |
Disability Class: Self-Care Difficulty
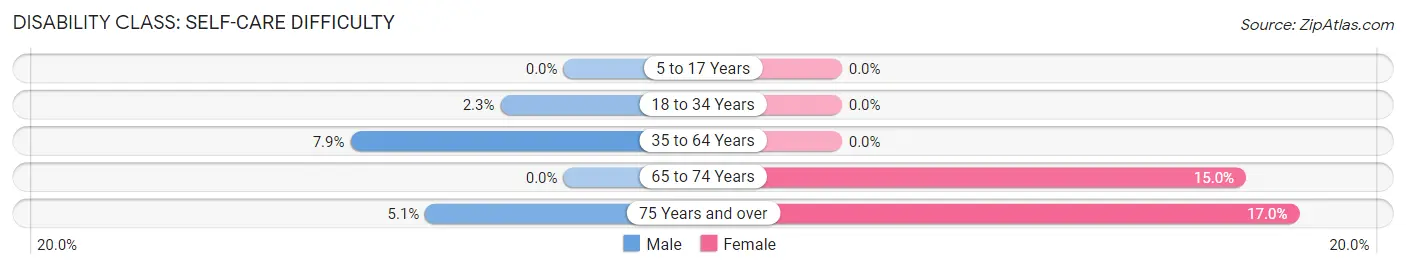
| Age Bracket | Male | Female |
| 5 to 17 Years | 0 (0.0%) | 0 (0.0%) |
| 18 to 34 Years | 3 (2.3%) | 0 (0.0%) |
| 35 to 64 Years | 14 (7.9%) | 0 (0.0%) |
| 65 to 74 Years | 0 (0.0%) | 3 (15.0%) |
| 75 Years and over | 2 (5.1%) | 9 (17.0%) |
Technology Access in Fort Lawn
Computing Device Access in Fort Lawn
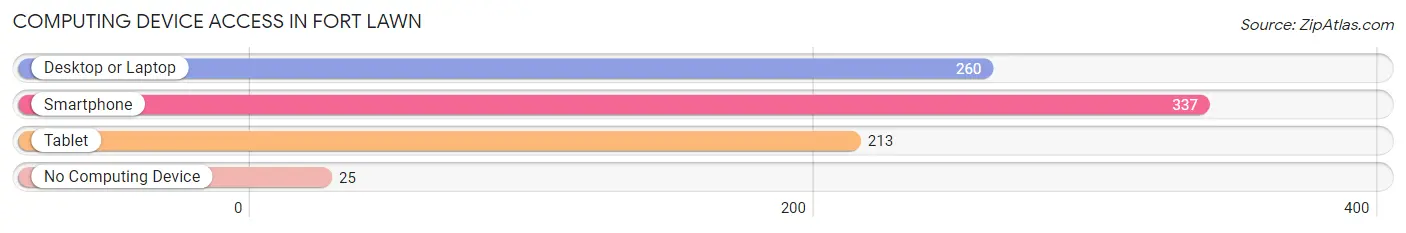
| Device Type | # Households | % Households |
| Desktop or Laptop | 260 | 67.7% |
| Smartphone | 337 | 87.8% |
| Tablet | 213 | 55.5% |
| No Computing Device | 25 | 6.5% |
| Total | 384 | 100.0% |
Internet Access in Fort Lawn
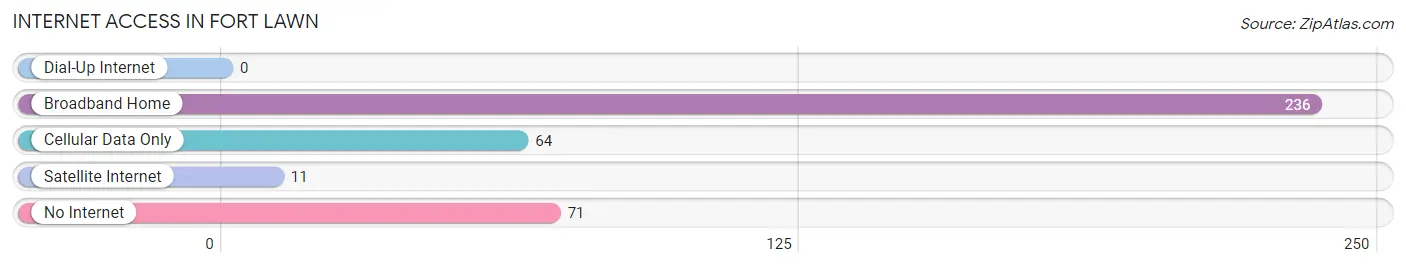
| Internet Type | # Households | % Households |
| Dial-Up Internet | 0 | 0.0% |
| Broadband Home | 236 | 61.5% |
| Cellular Data Only | 64 | 16.7% |
| Satellite Internet | 11 | 2.9% |
| No Internet | 71 | 18.5% |
| Total | 384 | 100.0% |
Fort Lawn Summary
History
Fort Lawn is a small town located in Chester County, South Carolina. It is situated on the Catawba River, approximately 25 miles south of Charlotte, North Carolina. The town was founded in 1845 by a group of settlers from North Carolina, who named it after a nearby fort. The fort was built by the British during the Revolutionary War and was used to protect the settlers from Indian attacks.
The town grew slowly over the years, but it was not until the late 19th century that it began to experience significant growth. In 1887, the Catawba River Railroad was built, connecting Fort Lawn to Charlotte and other nearby towns. This allowed for the transportation of goods and people, and the town began to thrive.
In the early 20th century, Fort Lawn was a popular destination for tourists. The town was known for its beautiful scenery, and it was a popular spot for fishing and hunting. In the 1920s, the town was home to a number of resorts, including the Catawba River Inn and the Fort Lawn Hotel.
In the 1950s, the town began to experience a decline in population. This was due to the construction of the nearby Lake Wylie Dam, which flooded much of the town. The town was eventually able to recover, and today it is a small but thriving community.
Geography
Fort Lawn is located in Chester County, South Carolina. It is situated on the Catawba River, approximately 25 miles south of Charlotte, North Carolina. The town is located in the Piedmont region of the state, and it is surrounded by rolling hills and forests. The town is located at an elevation of approximately 500 feet above sea level.
The climate in Fort Lawn is humid subtropical, with hot, humid summers and mild winters. The average annual temperature is around 70 degrees Fahrenheit, and the average annual precipitation is around 45 inches.
Economy
The economy of Fort Lawn is largely based on agriculture and tourism. The town is home to several farms, which produce a variety of crops, including corn, soybeans, and wheat. The town is also home to several wineries, which produce a variety of wines.
Tourism is also an important part of the economy. The town is home to several resorts, including the Catawba River Inn and the Fort Lawn Hotel. The town is also home to several parks, including the Catawba River State Park and the Fort Lawn State Park.
Demographics
As of the 2010 census, the population of Fort Lawn was 1,845. The racial makeup of the town was 94.3% White, 3.2% African American, 0.3% Native American, 0.2% Asian, 0.1% Pacific Islander, and 1.9% from other races. The median household income was $37,917, and the median family income was $45,625. The per capita income was $19,845.
Conclusion
Fort Lawn is a small town located in Chester County, South Carolina. It is situated on the Catawba River, approximately 25 miles south of Charlotte, North Carolina. The town was founded in 1845 by a group of settlers from North Carolina, and it has since grown into a small but thriving community. The economy of Fort Lawn is largely based on agriculture and tourism, and the town is home to several farms, wineries, resorts, and parks. As of the 2010 census, the population of Fort Lawn was 1,845, and the median household income was $37,917.
Common Questions
What is Per Capita Income in Fort Lawn?
Per Capita income in Fort Lawn is $26,774.
What is the Median Family Income in Fort Lawn?
Median Family Income in Fort Lawn is $51,953.
What is the Median Household income in Fort Lawn?
Median Household Income in Fort Lawn is $49,844.
What is Income or Wage Gap in Fort Lawn?
Income or Wage Gap in Fort Lawn is 40.9%.
Women in Fort Lawn earn 59.1 cents for every dollar earned by a man.
What is Inequality or Gini Index in Fort Lawn?
Inequality or Gini Index in Fort Lawn is 0.51.
What is the Total Population of Fort Lawn?
Total Population of Fort Lawn is 1,149.
What is the Total Male Population of Fort Lawn?
Total Male Population of Fort Lawn is 539.
What is the Total Female Population of Fort Lawn?
Total Female Population of Fort Lawn is 610.
What is the Ratio of Males per 100 Females in Fort Lawn?
There are 88.36 Males per 100 Females in Fort Lawn.
What is the Ratio of Females per 100 Males in Fort Lawn?
There are 113.17 Females per 100 Males in Fort Lawn.
What is the Median Population Age in Fort Lawn?
Median Population Age in Fort Lawn is 31.3 Years.
What is the Average Family Size in Fort Lawn
Average Family Size in Fort Lawn is 3.4 People.
What is the Average Household Size in Fort Lawn
Average Household Size in Fort Lawn is 3.0 People.
How Large is the Labor Force in Fort Lawn?
There are 531 People in the Labor Forcein in Fort Lawn.
What is the Percentage of People in the Labor Force in Fort Lawn?
67.5% of People are in the Labor Force in Fort Lawn.
What is the Unemployment Rate in Fort Lawn?
Unemployment Rate in Fort Lawn is 9.0%.