Eutawville, SC Map & Demographics
Eutawville Map
Eutawville Overview
$22,347
PER CAPITA INCOME
$87,950
AVG FAMILY INCOME
$80,000
AVG HOUSEHOLD INCOME
11.9%
WAGE / INCOME GAP [ % ]
88.1¢/ $1
WAGE / INCOME GAP [ $ ]
0.40
INEQUALITY / GINI INDEX
396
TOTAL POPULATION
184
MALE POPULATION
212
FEMALE POPULATION
86.79
MALES / 100 FEMALES
115.22
FEMALES / 100 MALES
33.6
MEDIAN AGE
3.1
AVG FAMILY SIZE
2.9
AVG HOUSEHOLD SIZE
190
LABOR FORCE [ PEOPLE ]
61.5%
PERCENT IN LABOR FORCE
7.4%
UNEMPLOYMENT RATE
Eutawville Zip Codes
Income in Eutawville
Income Overview in Eutawville
Per Capita Income in Eutawville is $22,347, while median incomes of families and households are $87,950 and $80,000 respectively.
| Characteristic | Number | Measure |
| Per Capita Income | 396 | $22,347 |
| Median Family Income | 99 | $87,950 |
| Mean Family Income | 99 | $74,413 |
| Median Household Income | 136 | $80,000 |
| Mean Household Income | 136 | $71,702 |
| Income Deficit | 99 | $0 |
| Wage / Income Gap (%) | 396 | 11.87% |
| Wage / Income Gap ($) | 396 | 88.13¢ per $1 |
| Gini / Inequality Index | 396 | 0.40 |
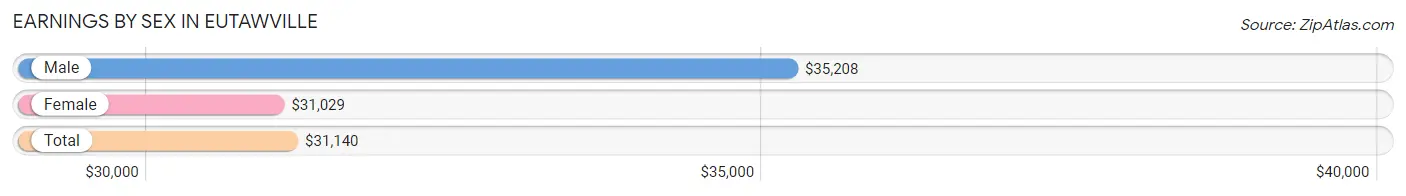
Earnings by Sex in Eutawville
Average Earnings in Eutawville are $31,140, $35,208 for men and $31,029 for women, a difference of 11.9%.
| Sex | Number | Average Earnings |
| Male | 107 (55.4%) | $35,208 |
| Female | 86 (44.6%) | $31,029 |
| Total | 193 (100.0%) | $31,140 |
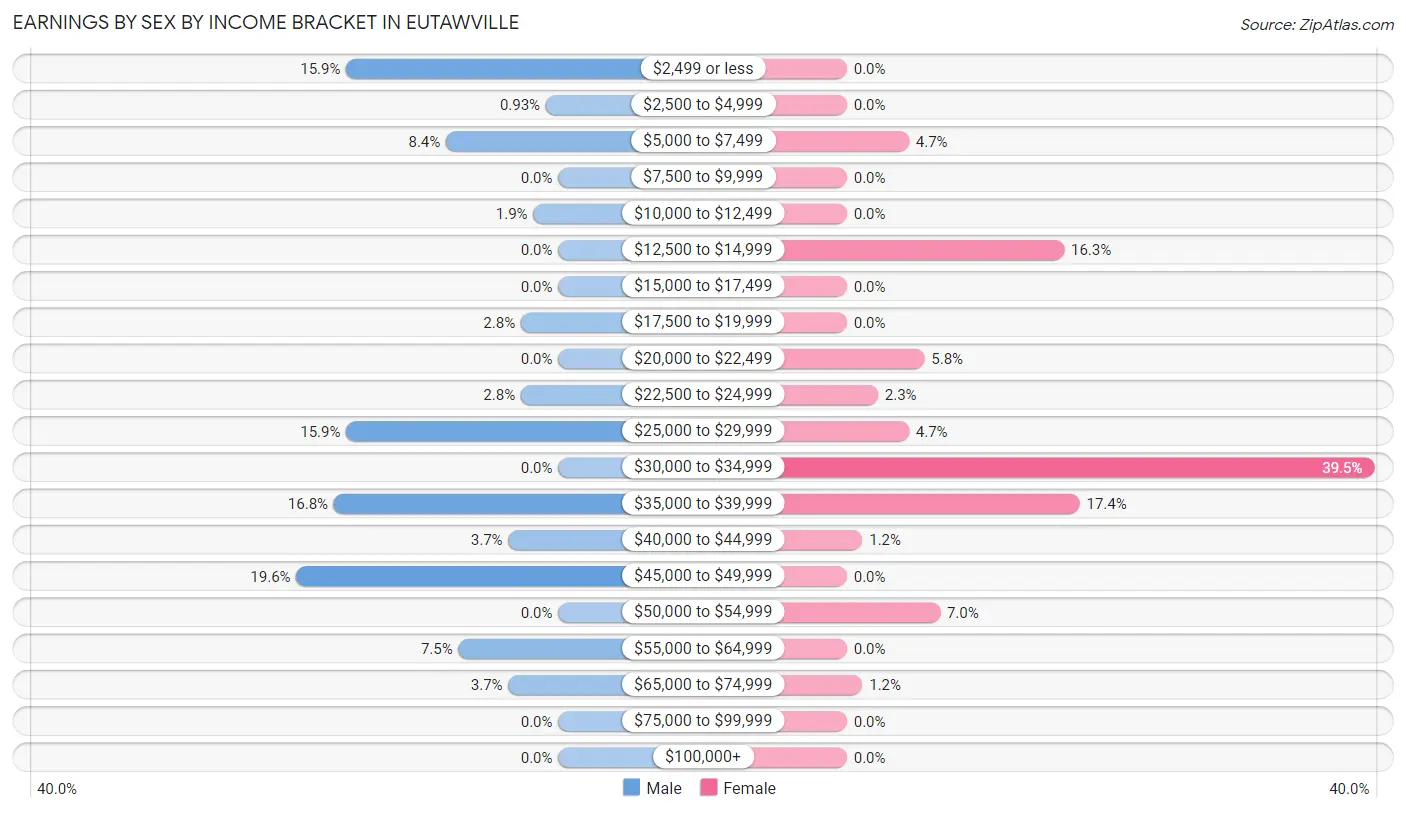
Earnings by Sex by Income Bracket in Eutawville
The most common earnings brackets in Eutawville are $45,000 to $49,999 for men (21 | 19.6%) and $30,000 to $34,999 for women (34 | 39.5%).
| Income | Male | Female |
| $2,499 or less | 17 (15.9%) | 0 (0.0%) |
| $2,500 to $4,999 | 1 (0.9%) | 0 (0.0%) |
| $5,000 to $7,499 | 9 (8.4%) | 4 (4.6%) |
| $7,500 to $9,999 | 0 (0.0%) | 0 (0.0%) |
| $10,000 to $12,499 | 2 (1.9%) | 0 (0.0%) |
| $12,500 to $14,999 | 0 (0.0%) | 14 (16.3%) |
| $15,000 to $17,499 | 0 (0.0%) | 0 (0.0%) |
| $17,500 to $19,999 | 3 (2.8%) | 0 (0.0%) |
| $20,000 to $22,499 | 0 (0.0%) | 5 (5.8%) |
| $22,500 to $24,999 | 3 (2.8%) | 2 (2.3%) |
| $25,000 to $29,999 | 17 (15.9%) | 4 (4.6%) |
| $30,000 to $34,999 | 0 (0.0%) | 34 (39.5%) |
| $35,000 to $39,999 | 18 (16.8%) | 15 (17.4%) |
| $40,000 to $44,999 | 4 (3.7%) | 1 (1.2%) |
| $45,000 to $49,999 | 21 (19.6%) | 0 (0.0%) |
| $50,000 to $54,999 | 0 (0.0%) | 6 (7.0%) |
| $55,000 to $64,999 | 8 (7.5%) | 0 (0.0%) |
| $65,000 to $74,999 | 4 (3.7%) | 1 (1.2%) |
| $75,000 to $99,999 | 0 (0.0%) | 0 (0.0%) |
| $100,000+ | 0 (0.0%) | 0 (0.0%) |
| Total | 107 (100.0%) | 86 (100.0%) |
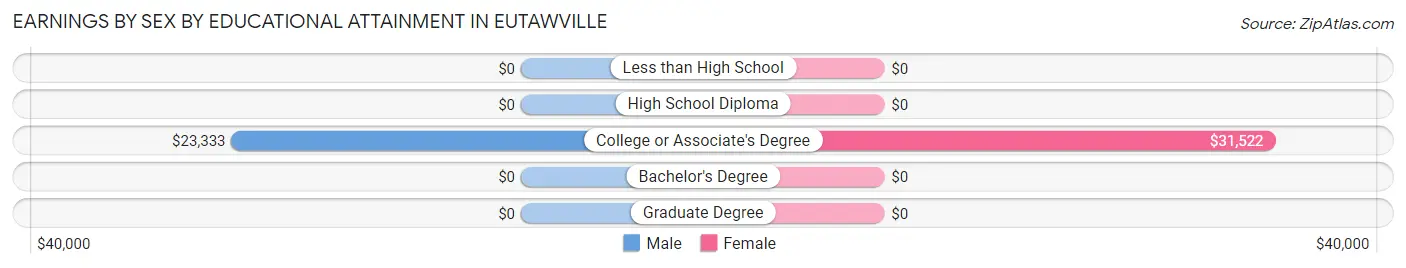
Earnings by Sex by Educational Attainment in Eutawville
Average earnings in Eutawville are $28,906 for men and $30,708 for women, a difference of 5.9%. Men with an educational attainment of college or associate's degree enjoy the highest average annual earnings of $23,333, while those with college or associate's degree education earn the least with $23,333. Women with an educational attainment of college or associate's degree earn the most with the average annual earnings of $31,522, while those with college or associate's degree education have the smallest earnings of $31,522.
| Educational Attainment | Male Income | Female Income |
| Less than High School | - | - |
| High School Diploma | - | - |
| College or Associate's Degree | $23,333 | $31,522 |
| Bachelor's Degree | - | - |
| Graduate Degree | - | - |
| Total | $28,906 | $30,708 |
Family Income in Eutawville
Family Income Brackets in Eutawville
According to the Eutawville family income data, there are 40 families falling into the $75,000 to $99,999 income range, which is the most common income bracket and makes up 40.4% of all families.
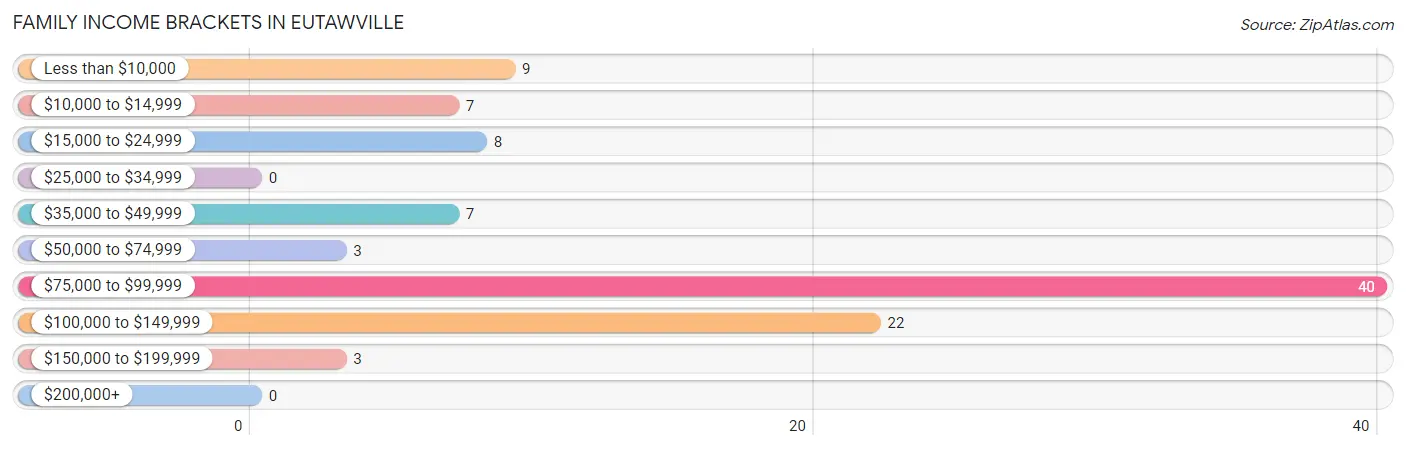
| Income Bracket | # Families | % Families |
| Less than $10,000 | 9 | 9.1% |
| $10,000 to $14,999 | 7 | 7.1% |
| $15,000 to $24,999 | 8 | 8.1% |
| $25,000 to $34,999 | 0 | 0.0% |
| $35,000 to $49,999 | 7 | 7.1% |
| $50,000 to $74,999 | 3 | 3.0% |
| $75,000 to $99,999 | 40 | 40.4% |
| $100,000 to $149,999 | 22 | 22.2% |
| $150,000 to $199,999 | 3 | 3.0% |
| $200,000+ | 0 | 0.0% |
Family Income by Famaliy Size in Eutawville
3-person families (27 | 27.3%) account for the highest median family income in Eutawville with $95,313 per family, while 3-person families (27 | 27.3%) have the highest median income of $31,771 per family member.
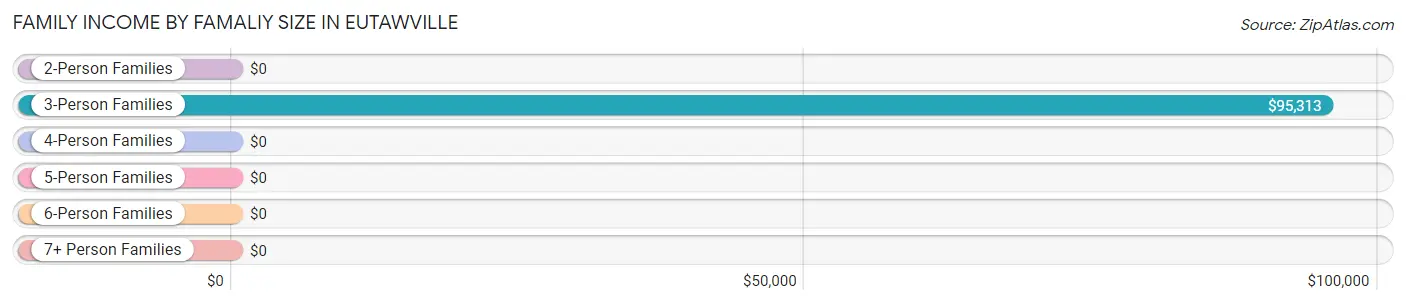
| Income Bracket | # Families | Median Income |
| 2-Person Families | 44 (44.4%) | $0 |
| 3-Person Families | 27 (27.3%) | $95,313 |
| 4-Person Families | 5 (5.1%) | $0 |
| 5-Person Families | 0 (0.0%) | $0 |
| 6-Person Families | 23 (23.2%) | $0 |
| 7+ Person Families | 0 (0.0%) | $0 |
| Total | 99 (100.0%) | $87,950 |
Family Income by Number of Earners in Eutawville
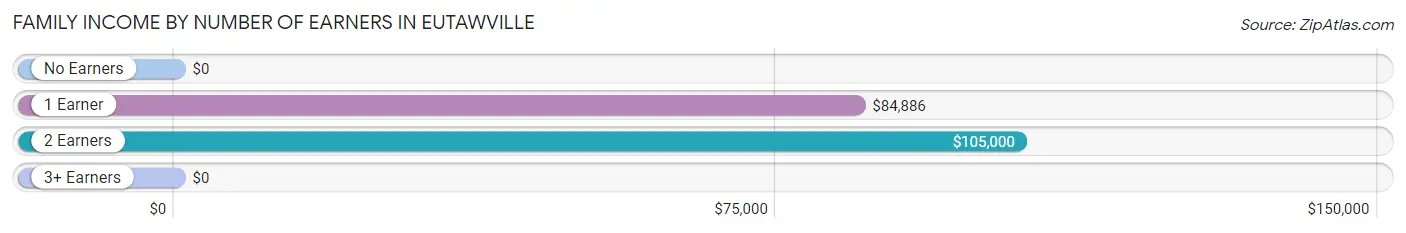
| Number of Earners | # Families | Median Income |
| No Earners | 12 (12.1%) | $0 |
| 1 Earner | 65 (65.7%) | $84,886 |
| 2 Earners | 18 (18.2%) | $105,000 |
| 3+ Earners | 4 (4.0%) | $0 |
| Total | 99 (100.0%) | $87,950 |
Household Income in Eutawville
Household Income Brackets in Eutawville
With 45 households falling in the category, the $100,000 to $149,999 income range is the most frequent in Eutawville, accounting for 33.1% of all households.
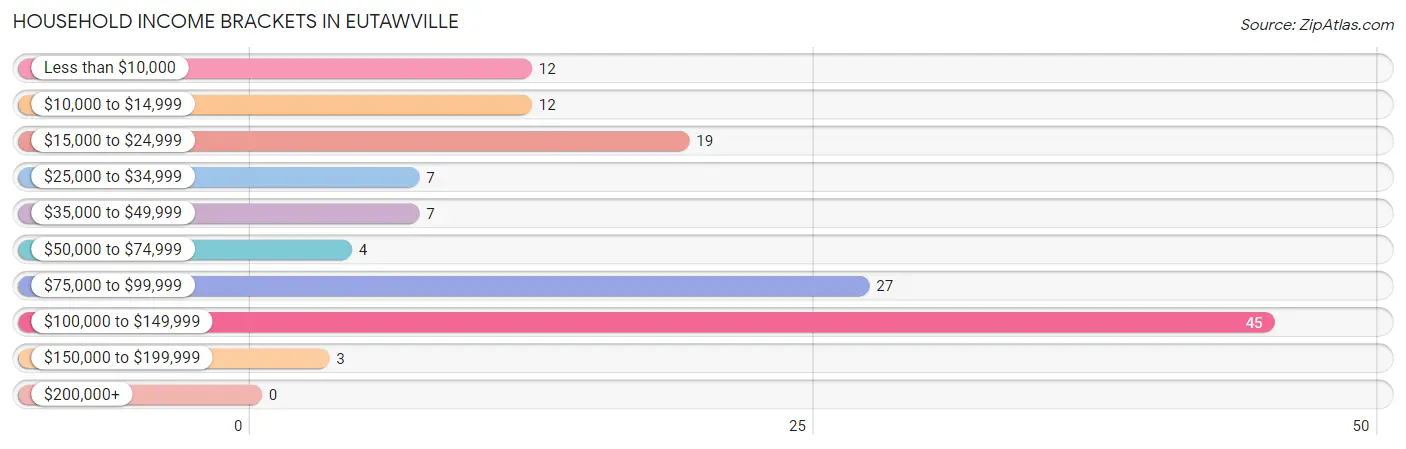
| Income Bracket | # Households | % Households |
| Less than $10,000 | 12 | 8.8% |
| $10,000 to $14,999 | 12 | 8.8% |
| $15,000 to $24,999 | 19 | 14.0% |
| $25,000 to $34,999 | 7 | 5.1% |
| $35,000 to $49,999 | 7 | 5.1% |
| $50,000 to $74,999 | 4 | 2.9% |
| $75,000 to $99,999 | 27 | 19.9% |
| $100,000 to $149,999 | 45 | 33.1% |
| $150,000 to $199,999 | 3 | 2.2% |
| $200,000+ | 0 | 0.0% |
Household Income by Householder Age in Eutawville
The median household income in Eutawville is $80,000, with the highest median household income of $112,143 found in the 25 to 44 years age bracket for the primary householder. A total of 50 households (36.8%) fall into this category. Meanwhile, the 15 to 24 years age bracket for the primary householder has the lowest median household income of $0, with 8 households (5.9%) in this group.
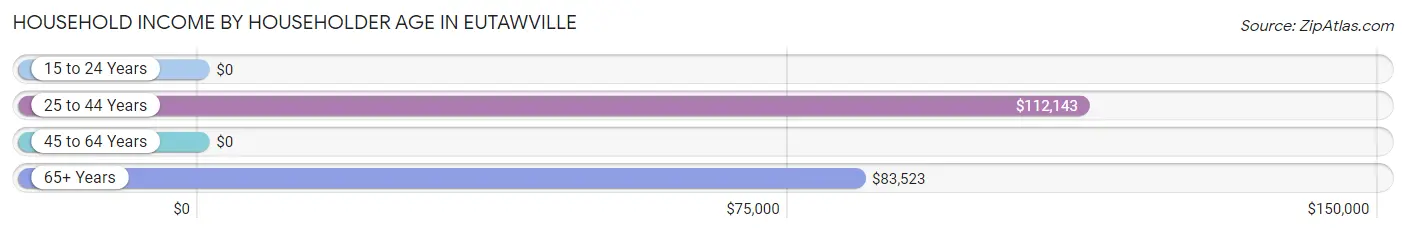
| Income Bracket | # Households | Median Income |
| 15 to 24 Years | 8 (5.9%) | $0 |
| 25 to 44 Years | 50 (36.8%) | $112,143 |
| 45 to 64 Years | 33 (24.3%) | $0 |
| 65+ Years | 45 (33.1%) | $83,523 |
| Total | 136 (100.0%) | $80,000 |
Poverty in Eutawville
Income Below Poverty by Sex and Age in Eutawville
With 33.2% poverty level for males and 20.3% for females among the residents of Eutawville, 25 to 34 year old males and 75 year old and over females are the most vulnerable to poverty, with 29 males (61.7%) and 5 females (45.5%) in their respective age groups living below the poverty level.
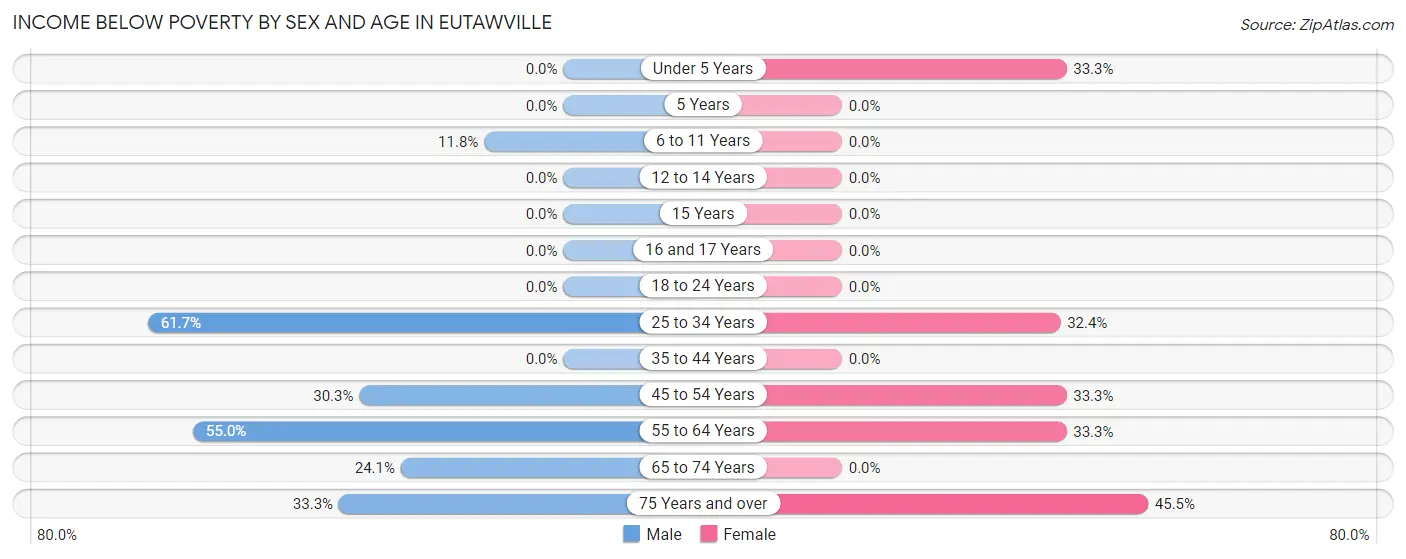
| Age Bracket | Male | Female |
| Under 5 Years | 0 (0.0%) | 8 (33.3%) |
| 5 Years | 0 (0.0%) | 0 (0.0%) |
| 6 to 11 Years | 2 (11.8%) | 0 (0.0%) |
| 12 to 14 Years | 0 (0.0%) | 0 (0.0%) |
| 15 Years | 0 (0.0%) | 0 (0.0%) |
| 16 and 17 Years | 0 (0.0%) | 0 (0.0%) |
| 18 to 24 Years | 0 (0.0%) | 0 (0.0%) |
| 25 to 34 Years | 29 (61.7%) | 12 (32.4%) |
| 35 to 44 Years | 0 (0.0%) | 0 (0.0%) |
| 45 to 54 Years | 10 (30.3%) | 13 (33.3%) |
| 55 to 64 Years | 11 (55.0%) | 5 (33.3%) |
| 65 to 74 Years | 7 (24.1%) | 0 (0.0%) |
| 75 Years and over | 2 (33.3%) | 5 (45.5%) |
| Total | 61 (33.2%) | 43 (20.3%) |
Income Above Poverty by Sex and Age in Eutawville
According to the poverty statistics in Eutawville, males aged 18 to 24 years and females aged 6 to 11 years are the age groups that are most secure financially, with 100.0% of males and 100.0% of females in these age groups living above the poverty line.
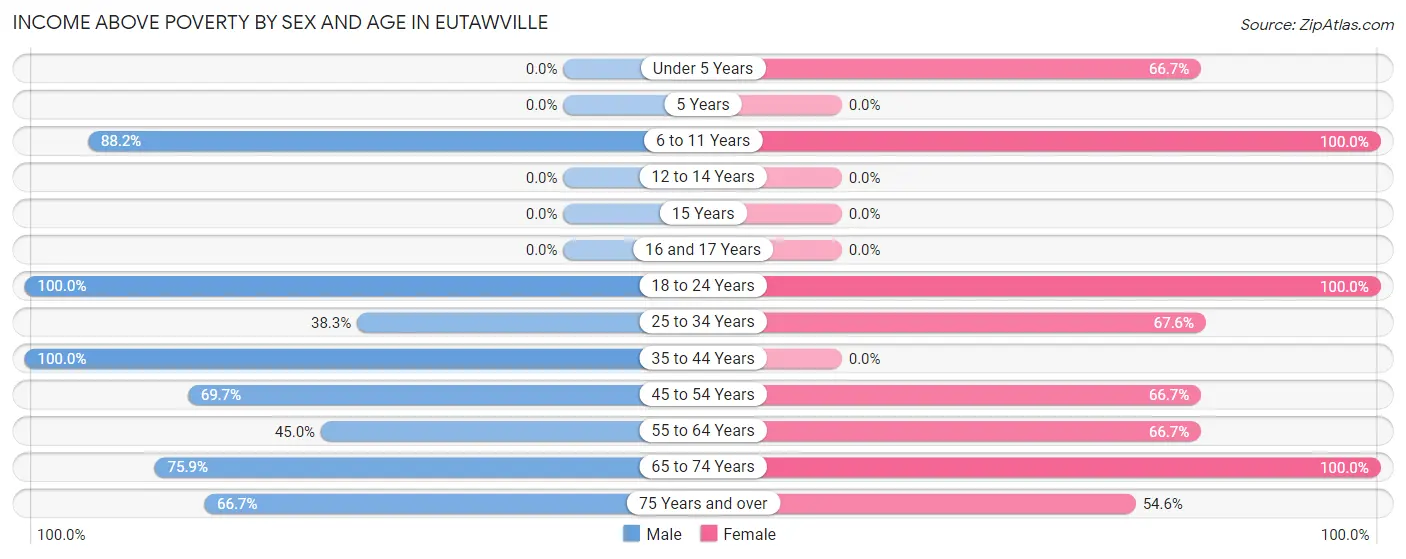
| Age Bracket | Male | Female |
| Under 5 Years | 0 (0.0%) | 16 (66.7%) |
| 5 Years | 0 (0.0%) | 0 (0.0%) |
| 6 to 11 Years | 15 (88.2%) | 46 (100.0%) |
| 12 to 14 Years | 0 (0.0%) | 0 (0.0%) |
| 15 Years | 0 (0.0%) | 0 (0.0%) |
| 16 and 17 Years | 0 (0.0%) | 0 (0.0%) |
| 18 to 24 Years | 19 (100.0%) | 11 (100.0%) |
| 25 to 34 Years | 18 (38.3%) | 25 (67.6%) |
| 35 to 44 Years | 13 (100.0%) | 0 (0.0%) |
| 45 to 54 Years | 23 (69.7%) | 26 (66.7%) |
| 55 to 64 Years | 9 (45.0%) | 10 (66.7%) |
| 65 to 74 Years | 22 (75.9%) | 29 (100.0%) |
| 75 Years and over | 4 (66.7%) | 6 (54.5%) |
| Total | 123 (66.8%) | 169 (79.7%) |
Income Below Poverty Among Married-Couple Families in Eutawville
The poverty statistics for married-couple families in Eutawville show that 3.8% or 2 of the total 52 families live below the poverty line. Families with 1 or 2 children have the highest poverty rate of 20.0%, comprising of 2 families. On the other hand, families with no children have the lowest poverty rate of 0.0%, which includes 0 families.
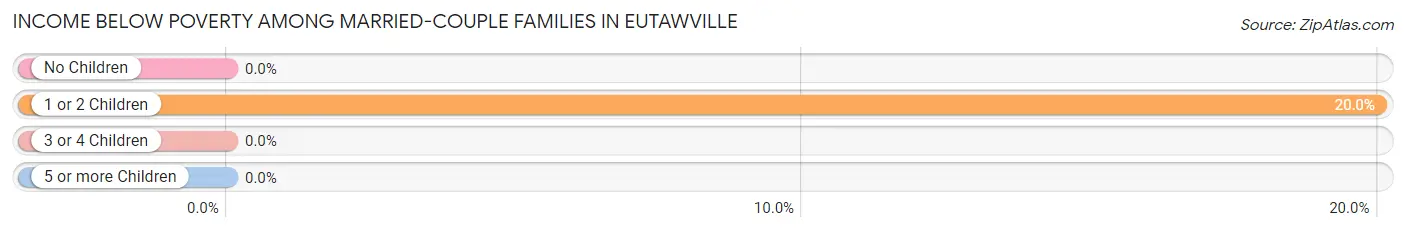
| Children | Above Poverty | Below Poverty |
| No Children | 42 (100.0%) | 0 (0.0%) |
| 1 or 2 Children | 8 (80.0%) | 2 (20.0%) |
| 3 or 4 Children | 0 (0.0%) | 0 (0.0%) |
| 5 or more Children | 0 (0.0%) | 0 (0.0%) |
| Total | 50 (96.2%) | 2 (3.8%) |
Income Below Poverty Among Single-Parent Households in Eutawville
According to the poverty data in Eutawville, 81.8% or 9 single-father households and 36.1% or 13 single-mother households are living below the poverty line. Among single-father households, those with 1 or 2 children have the highest poverty rate, with 9 households (81.8%) experiencing poverty. Likewise, among single-mother households, those with no children have the highest poverty rate, with 13 households (100.0%) falling below the poverty line.
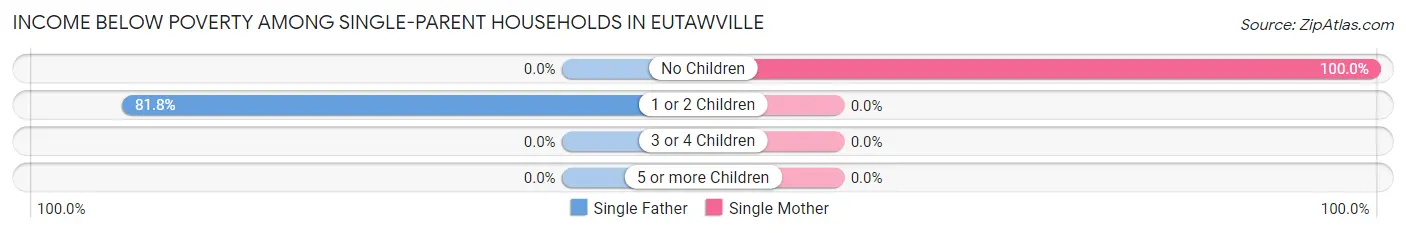
| Children | Single Father | Single Mother |
| No Children | 0 (0.0%) | 13 (100.0%) |
| 1 or 2 Children | 9 (81.8%) | 0 (0.0%) |
| 3 or 4 Children | 0 (0.0%) | 0 (0.0%) |
| 5 or more Children | 0 (0.0%) | 0 (0.0%) |
| Total | 9 (81.8%) | 13 (36.1%) |
Income Below Poverty Among Married-Couple vs Single-Parent Households in Eutawville
The poverty data for Eutawville shows that 2 of the married-couple family households (3.8%) and 22 of the single-parent households (46.8%) are living below the poverty level. Within the married-couple family households, those with 1 or 2 children have the highest poverty rate, with 2 households (20.0%) falling below the poverty line. Among the single-parent households, those with no children have the highest poverty rate, with 13 household (100.0%) living below poverty.
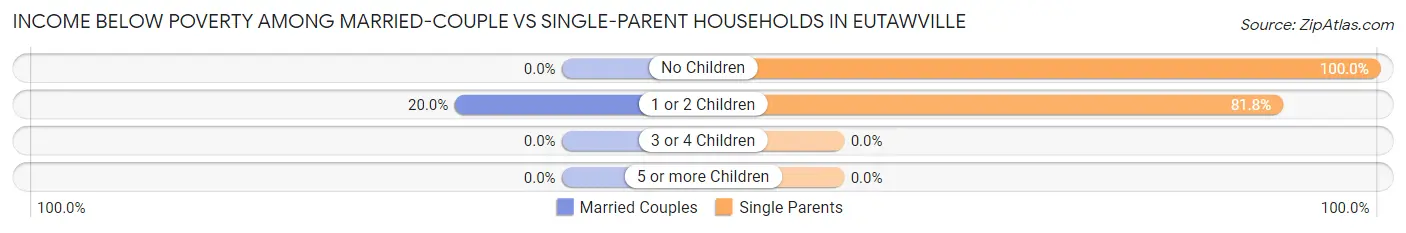
| Children | Married-Couple Families | Single-Parent Households |
| No Children | 0 (0.0%) | 13 (100.0%) |
| 1 or 2 Children | 2 (20.0%) | 9 (81.8%) |
| 3 or 4 Children | 0 (0.0%) | 0 (0.0%) |
| 5 or more Children | 0 (0.0%) | 0 (0.0%) |
| Total | 2 (3.8%) | 22 (46.8%) |
Race in Eutawville
The most populous races in Eutawville are White / Caucasian (234 | 59.1%), Black / African American (147 | 37.1%), and Two or more Races (8 | 2.0%).
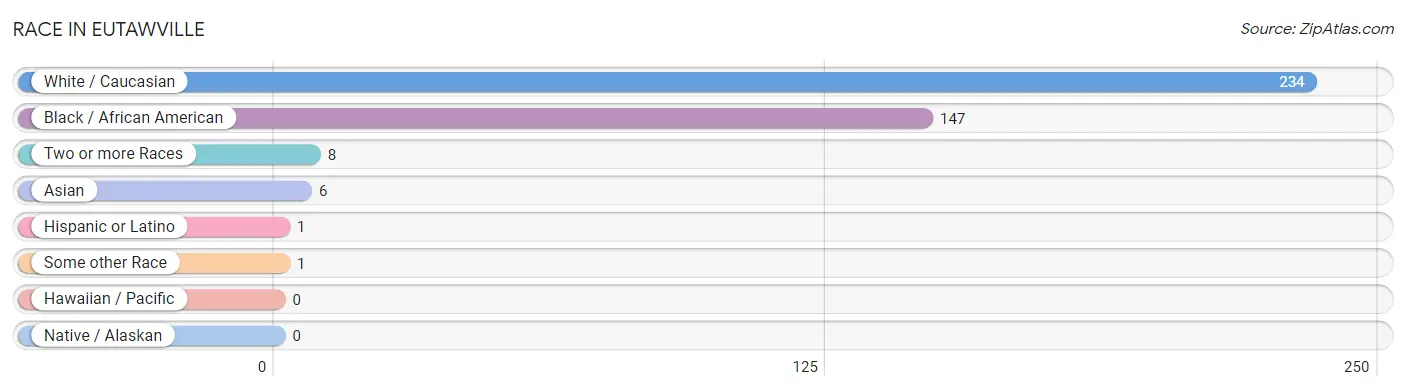
| Race | # Population | % Population |
| Asian | 6 | 1.5% |
| Black / African American | 147 | 37.1% |
| Hawaiian / Pacific | 0 | 0.0% |
| Hispanic or Latino | 1 | 0.3% |
| Native / Alaskan | 0 | 0.0% |
| White / Caucasian | 234 | 59.1% |
| Two or more Races | 8 | 2.0% |
| Some other Race | 1 | 0.3% |
| Total | 396 | 100.0% |
Ancestry in Eutawville
The most populous ancestries reported in Eutawville are Italian (36 | 9.1%), German (34 | 8.6%), American (18 | 4.5%), English (17 | 4.3%), and Burmese (6 | 1.5%), together accounting for 28.0% of all Eutawville residents.
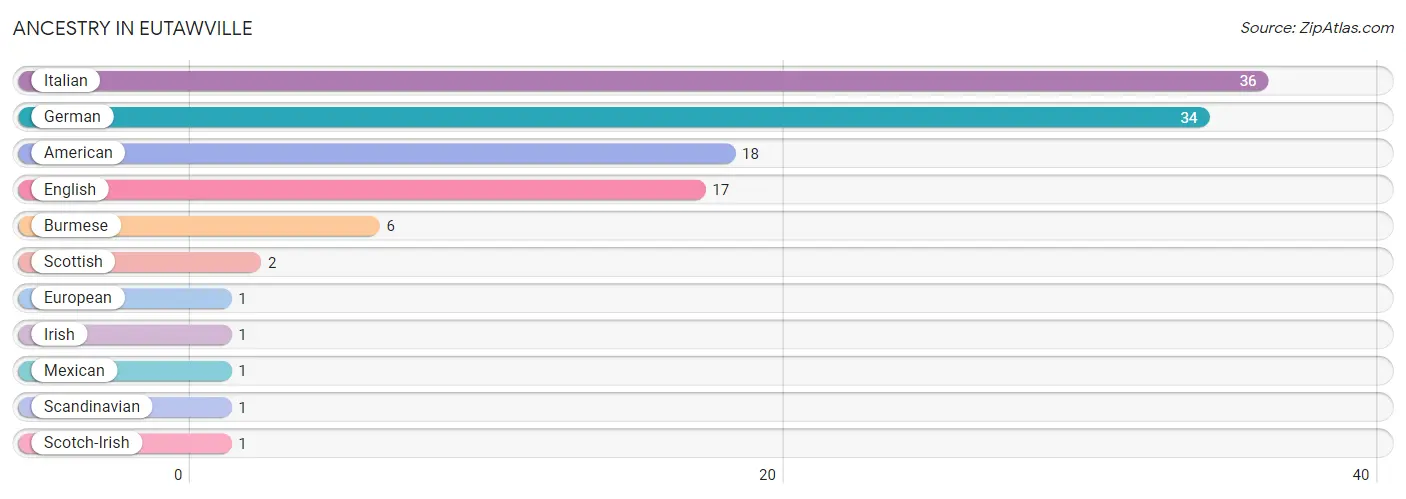
| Ancestry | # Population | % Population |
| American | 18 | 4.5% |
| Burmese | 6 | 1.5% |
| English | 17 | 4.3% |
| European | 1 | 0.3% |
| German | 34 | 8.6% |
| Irish | 1 | 0.3% |
| Italian | 36 | 9.1% |
| Mexican | 1 | 0.3% |
| Scandinavian | 1 | 0.3% |
| Scotch-Irish | 1 | 0.3% |
| Scottish | 2 | 0.5% | View All 11 Rows |
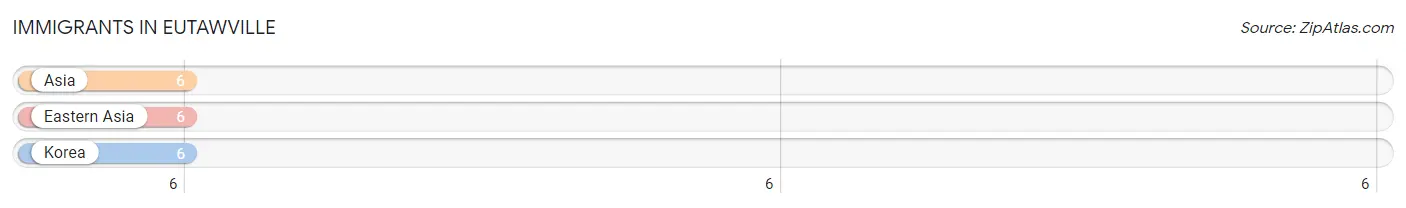
Immigrants in Eutawville
The most numerous immigrant groups reported in Eutawville came from Asia (6 | 1.5%), Eastern Asia (6 | 1.5%), and Korea (6 | 1.5%), together accounting for 4.6% of all Eutawville residents.
| Immigration Origin | # Population | % Population |
| Asia | 6 | 1.5% |
| Eastern Asia | 6 | 1.5% |
| Korea | 6 | 1.5% | View All 3 Rows |
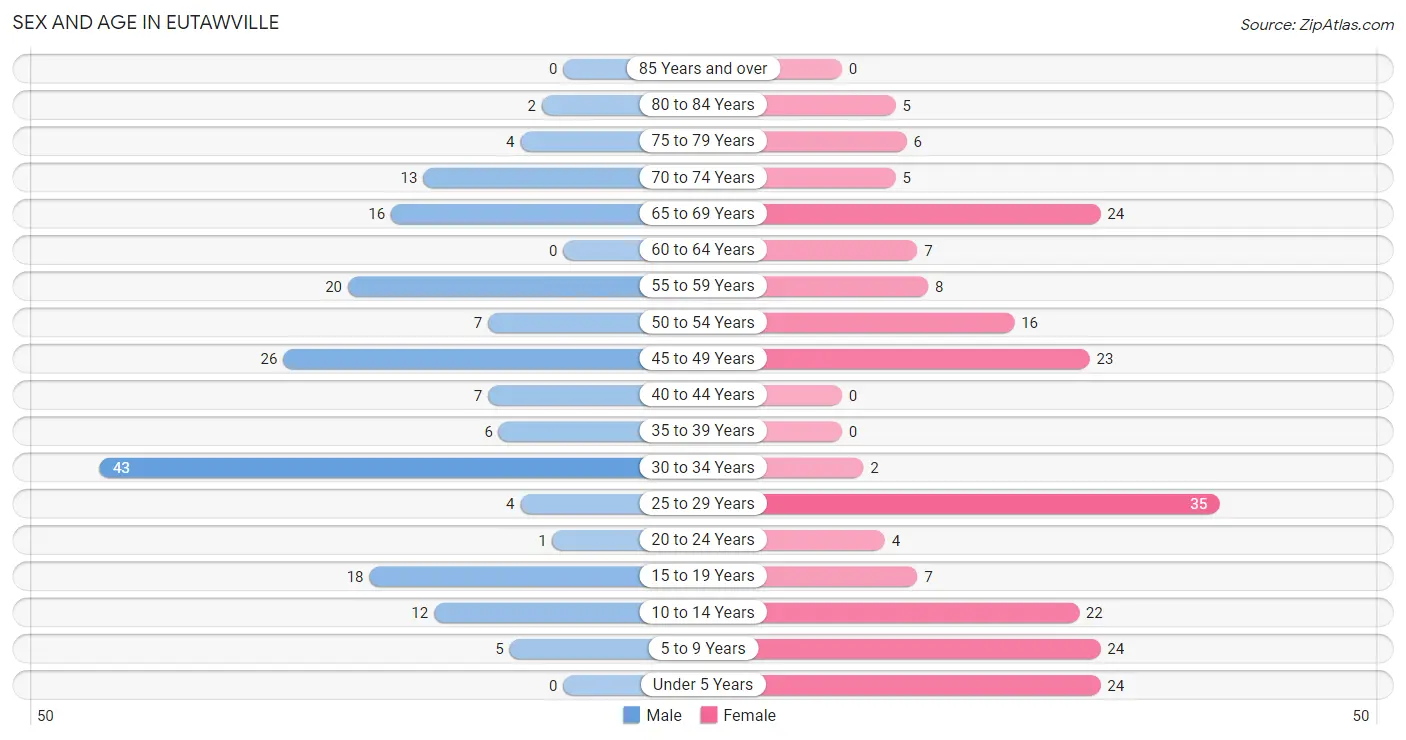
Sex and Age in Eutawville
Sex and Age in Eutawville
The most populous age groups in Eutawville are 30 to 34 Years (43 | 23.4%) for men and 25 to 29 Years (35 | 16.5%) for women.
| Age Bracket | Male | Female |
| Under 5 Years | 0 (0.0%) | 24 (11.3%) |
| 5 to 9 Years | 5 (2.7%) | 24 (11.3%) |
| 10 to 14 Years | 12 (6.5%) | 22 (10.4%) |
| 15 to 19 Years | 18 (9.8%) | 7 (3.3%) |
| 20 to 24 Years | 1 (0.5%) | 4 (1.9%) |
| 25 to 29 Years | 4 (2.2%) | 35 (16.5%) |
| 30 to 34 Years | 43 (23.4%) | 2 (0.9%) |
| 35 to 39 Years | 6 (3.3%) | 0 (0.0%) |
| 40 to 44 Years | 7 (3.8%) | 0 (0.0%) |
| 45 to 49 Years | 26 (14.1%) | 23 (10.8%) |
| 50 to 54 Years | 7 (3.8%) | 16 (7.5%) |
| 55 to 59 Years | 20 (10.9%) | 8 (3.8%) |
| 60 to 64 Years | 0 (0.0%) | 7 (3.3%) |
| 65 to 69 Years | 16 (8.7%) | 24 (11.3%) |
| 70 to 74 Years | 13 (7.1%) | 5 (2.4%) |
| 75 to 79 Years | 4 (2.2%) | 6 (2.8%) |
| 80 to 84 Years | 2 (1.1%) | 5 (2.4%) |
| 85 Years and over | 0 (0.0%) | 0 (0.0%) |
| Total | 184 (100.0%) | 212 (100.0%) |
Families and Households in Eutawville
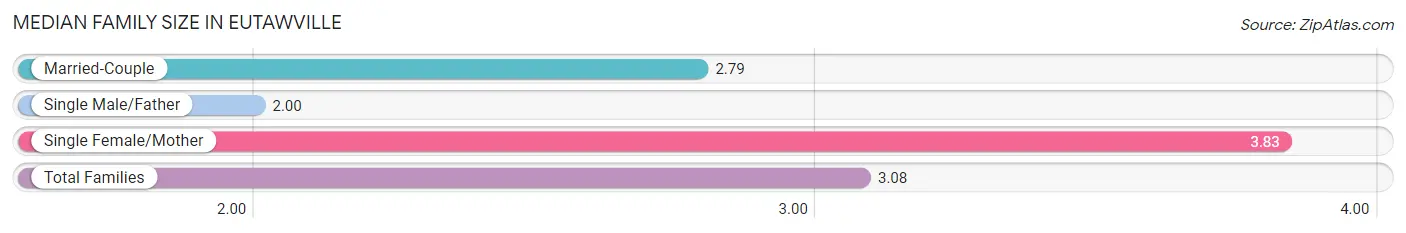
Median Family Size in Eutawville
The median family size in Eutawville is 3.08 persons per family, with single female/mother families (36 | 36.4%) accounting for the largest median family size of 3.83 persons per family. On the other hand, single male/father families (11 | 11.1%) represent the smallest median family size with 2.00 persons per family.
| Family Type | # Families | Family Size |
| Married-Couple | 52 (52.5%) | 2.79 |
| Single Male/Father | 11 (11.1%) | 2.00 |
| Single Female/Mother | 36 (36.4%) | 3.83 |
| Total Families | 99 (100.0%) | 3.08 |
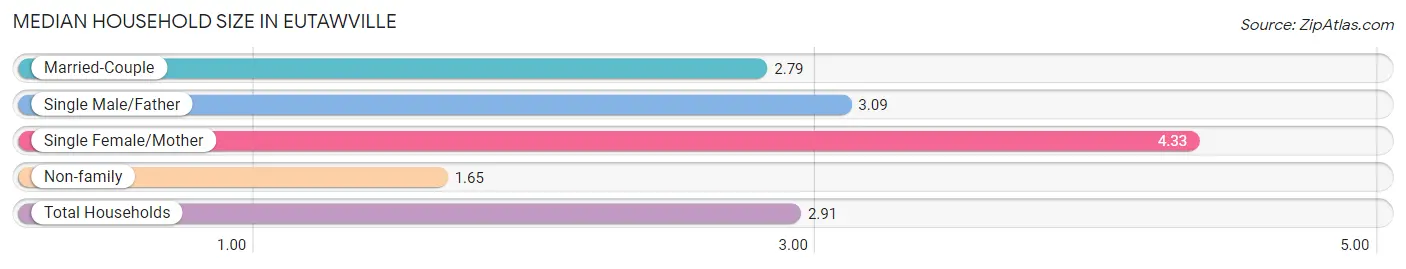
Median Household Size in Eutawville
The median household size in Eutawville is 2.91 persons per household, with single female/mother households (36 | 26.5%) accounting for the largest median household size of 4.33 persons per household. non-family households (37 | 27.2%) represent the smallest median household size with 1.65 persons per household.
| Household Type | # Households | Household Size |
| Married-Couple | 52 (38.2%) | 2.79 |
| Single Male/Father | 11 (8.1%) | 3.09 |
| Single Female/Mother | 36 (26.5%) | 4.33 |
| Non-family | 37 (27.2%) | 1.65 |
| Total Households | 136 (100.0%) | 2.91 |
Household Size by Marriage Status in Eutawville
Out of a total of 136 households in Eutawville, 99 (72.8%) are family households, while 37 (27.2%) are nonfamily households. The most numerous type of family households are 3-person households, comprising 36, and the most common type of nonfamily households are 1-person households, comprising 26.
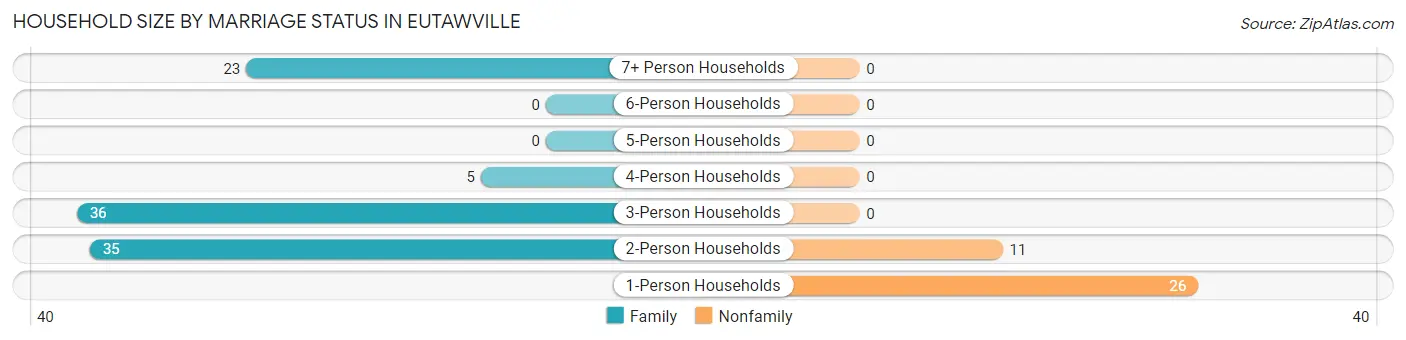
| Household Size | Family Households | Nonfamily Households |
| 1-Person Households | - | 26 (19.1%) |
| 2-Person Households | 35 (25.7%) | 11 (8.1%) |
| 3-Person Households | 36 (26.5%) | 0 (0.0%) |
| 4-Person Households | 5 (3.7%) | 0 (0.0%) |
| 5-Person Households | 0 (0.0%) | 0 (0.0%) |
| 6-Person Households | 0 (0.0%) | 0 (0.0%) |
| 7+ Person Households | 23 (16.9%) | 0 (0.0%) |
| Total | 99 (72.8%) | 37 (27.2%) |
Female Fertility in Eutawville
Fertility by Age in Eutawville
| Age Bracket | Women with Births | Births / 1,000 Women |
| 15 to 19 years | 0 (0.0%) | 0.0 |
| 20 to 34 years | 0 (0.0%) | 0.0 |
| 35 to 50 years | 0 (0.0%) | 0.0 |
| Total | 0 (0.0%) | 0.0 |
Fertility by Age by Marriage Status in Eutawville
| Age Bracket | Married | Unmarried |
| 15 to 19 years | 0 (0.0%) | 0 (0.0%) |
| 20 to 34 years | 0 (0.0%) | 0 (0.0%) |
| 35 to 50 years | 0 (0.0%) | 0 (0.0%) |
| Total | 0 (0.0%) | 0 (0.0%) |
Fertility by Education in Eutawville
| Educational Attainment | Women with Births | Births / 1,000 Women |
| Less than High School | 0 (0.0%) | 0.0 |
| High School Diploma | 0 (0.0%) | 0.0 |
| College or Associate's Degree | 0 (0.0%) | 0.0 |
| Bachelor's Degree | 0 (0.0%) | 0.0 |
| Graduate Degree | 0 (0.0%) | 0.0 |
| Total | 0 (0.0%) | 0.0 |
Fertility by Education by Marriage Status in Eutawville
| Educational Attainment | Married | Unmarried |
| Less than High School | 0 (0.0%) | 0 (0.0%) |
| High School Diploma | 0 (0.0%) | 0 (0.0%) |
| College or Associate's Degree | 0 (0.0%) | 0 (0.0%) |
| Bachelor's Degree | 0 (0.0%) | 0 (0.0%) |
| Graduate Degree | 0 (0.0%) | 0 (0.0%) |
| Total | 0 (0.0%) | 0 (0.0%) |
Employment Characteristics in Eutawville
Employment by Class of Employer in Eutawville
Among the 176 employed individuals in Eutawville, private company employees (158 | 89.8%), local government employees (10 | 5.7%), and state government employees (4 | 2.3%) make up the most common classes of employment.
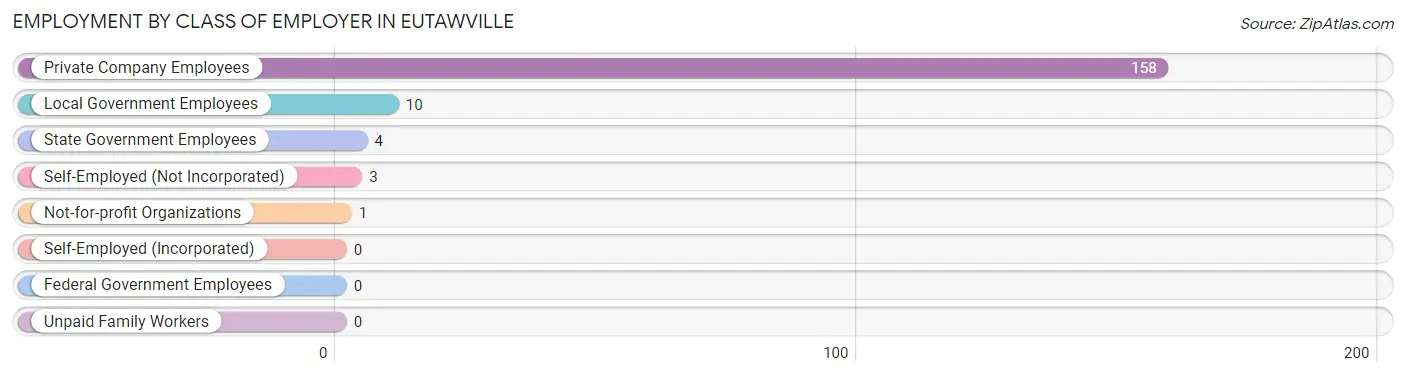
| Employer Class | # Employees | % Employees |
| Private Company Employees | 158 | 89.8% |
| Self-Employed (Incorporated) | 0 | 0.0% |
| Self-Employed (Not Incorporated) | 3 | 1.7% |
| Not-for-profit Organizations | 1 | 0.6% |
| Local Government Employees | 10 | 5.7% |
| State Government Employees | 4 | 2.3% |
| Federal Government Employees | 0 | 0.0% |
| Unpaid Family Workers | 0 | 0.0% |
| Total | 176 | 100.0% |
Employment Status by Age in Eutawville
According to the labor force statistics for Eutawville, out of the total population over 16 years of age (309), 61.5% or 190 individuals are in the labor force, with 7.4% or 14 of them unemployed. The age group with the highest labor force participation rate is 16 to 19 years, with 100.0% or 25 individuals in the labor force. Within the labor force, the 30 to 34 years age range has the highest percentage of unemployed individuals, with 27.5% or 11 of them being unemployed.
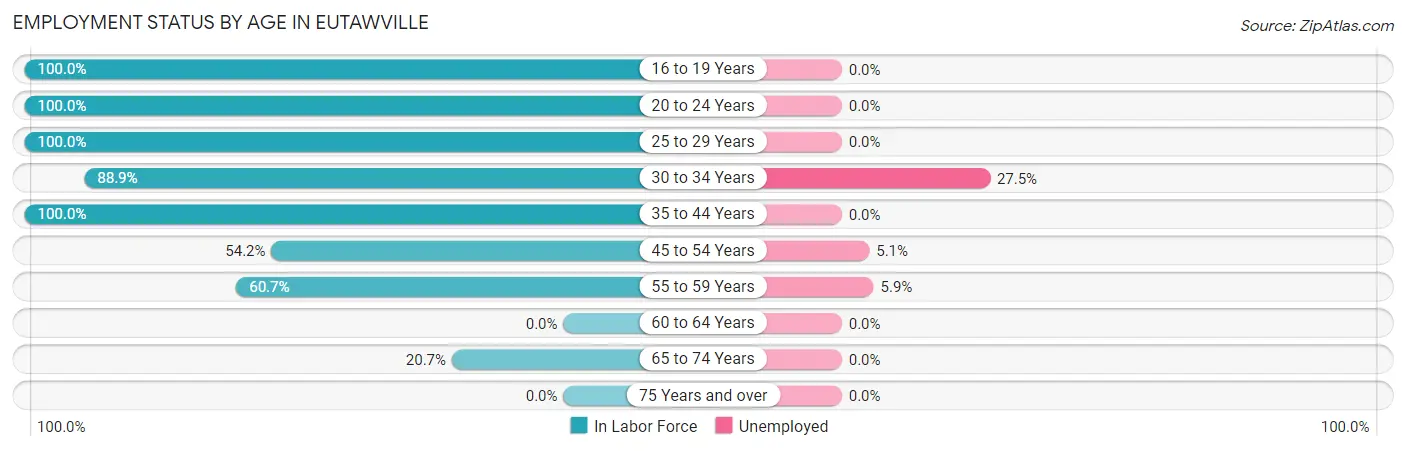
| Age Bracket | In Labor Force | Unemployed |
| 16 to 19 Years | 25 (100.0%) | 0 (0.0%) |
| 20 to 24 Years | 5 (100.0%) | 0 (0.0%) |
| 25 to 29 Years | 39 (100.0%) | 0 (0.0%) |
| 30 to 34 Years | 40 (88.9%) | 11 (27.5%) |
| 35 to 44 Years | 13 (100.0%) | 0 (0.0%) |
| 45 to 54 Years | 39 (54.2%) | 2 (5.1%) |
| 55 to 59 Years | 17 (60.7%) | 1 (5.9%) |
| 60 to 64 Years | 0 (0.0%) | 0 (0.0%) |
| 65 to 74 Years | 12 (20.7%) | 0 (0.0%) |
| 75 Years and over | 0 (0.0%) | 0 (0.0%) |
| Total | 190 (61.5%) | 14 (7.4%) |
Employment Status by Educational Attainment in Eutawville
According to labor force statistics for Eutawville, 72.5% of individuals (148) out of the total population between 25 and 64 years of age (204) are in the labor force, with 9.5% or 14 of them being unemployed. The group with the highest labor force participation rate are those with the educational attainment of bachelor's degree or higher, with 100.0% or 1 individuals in the labor force. Within the labor force, individuals with high school diploma education have the highest percentage of unemployment, with 14.0% or 12 of them being unemployed.
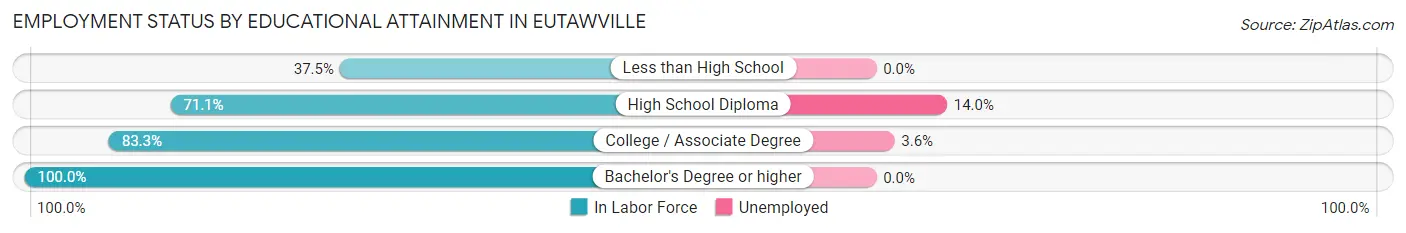
| Educational Attainment | In Labor Force | Unemployed |
| Less than High School | 6 (37.5%) | 0 (0.0%) |
| High School Diploma | 86 (71.1%) | 17 (14.0%) |
| College / Associate Degree | 55 (83.3%) | 2 (3.6%) |
| Bachelor's Degree or higher | 1 (100.0%) | 0 (0.0%) |
| Total | 148 (72.5%) | 19 (9.5%) |
Employment Occupations by Sex in Eutawville
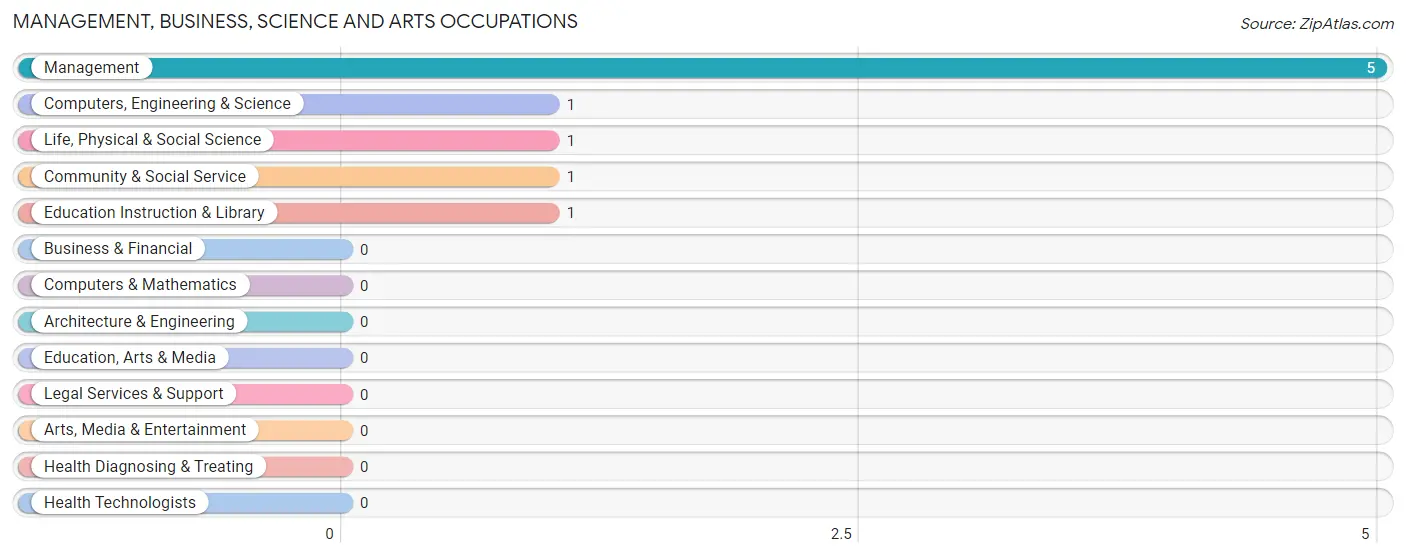
Management, Business, Science and Arts Occupations
The most common Management, Business, Science and Arts occupations in Eutawville are Management (5 | 2.8%), Computers, Engineering & Science (1 | 0.6%), Life, Physical & Social Science (1 | 0.6%), Community & Social Service (1 | 0.6%), and Education Instruction & Library (1 | 0.6%).
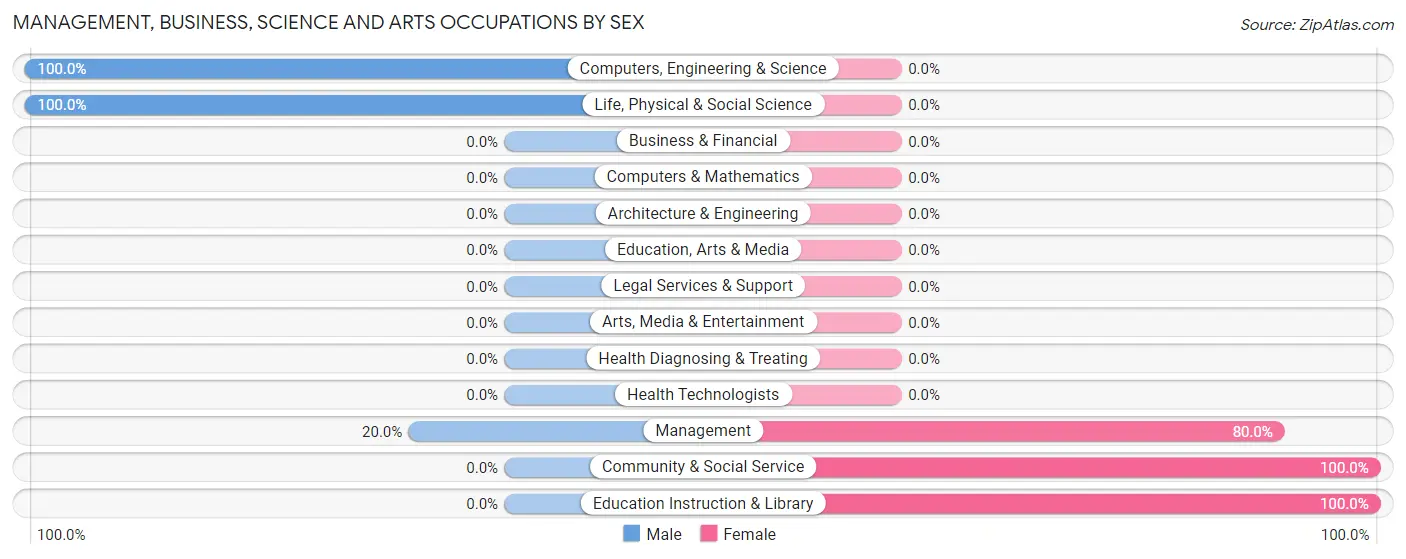
Management, Business, Science and Arts Occupations by Sex
Within the Management, Business, Science and Arts occupations in Eutawville, the most male-oriented occupations are Computers, Engineering & Science (100.0%), Life, Physical & Social Science (100.0%), and Management (20.0%), while the most female-oriented occupations are Community & Social Service (100.0%), Education Instruction & Library (100.0%), and Management (80.0%).
| Occupation | Male | Female |
| Management | 1 (20.0%) | 4 (80.0%) |
| Business & Financial | 0 (0.0%) | 0 (0.0%) |
| Computers, Engineering & Science | 1 (100.0%) | 0 (0.0%) |
| Computers & Mathematics | 0 (0.0%) | 0 (0.0%) |
| Architecture & Engineering | 0 (0.0%) | 0 (0.0%) |
| Life, Physical & Social Science | 1 (100.0%) | 0 (0.0%) |
| Community & Social Service | 0 (0.0%) | 1 (100.0%) |
| Education, Arts & Media | 0 (0.0%) | 0 (0.0%) |
| Legal Services & Support | 0 (0.0%) | 0 (0.0%) |
| Education Instruction & Library | 0 (0.0%) | 1 (100.0%) |
| Arts, Media & Entertainment | 0 (0.0%) | 0 (0.0%) |
| Health Diagnosing & Treating | 0 (0.0%) | 0 (0.0%) |
| Health Technologists | 0 (0.0%) | 0 (0.0%) |
| Total (Category) | 2 (28.6%) | 5 (71.4%) |
| Total (Overall) | 94 (53.4%) | 82 (46.6%) |
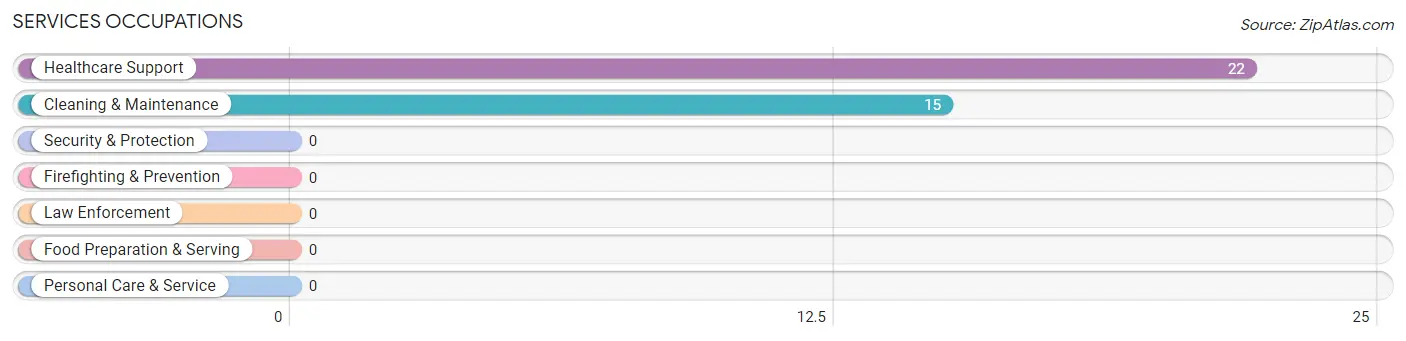
Services Occupations
The most common Services occupations in Eutawville are Healthcare Support (22 | 12.5%), and Cleaning & Maintenance (15 | 8.5%).
Services Occupations by Sex
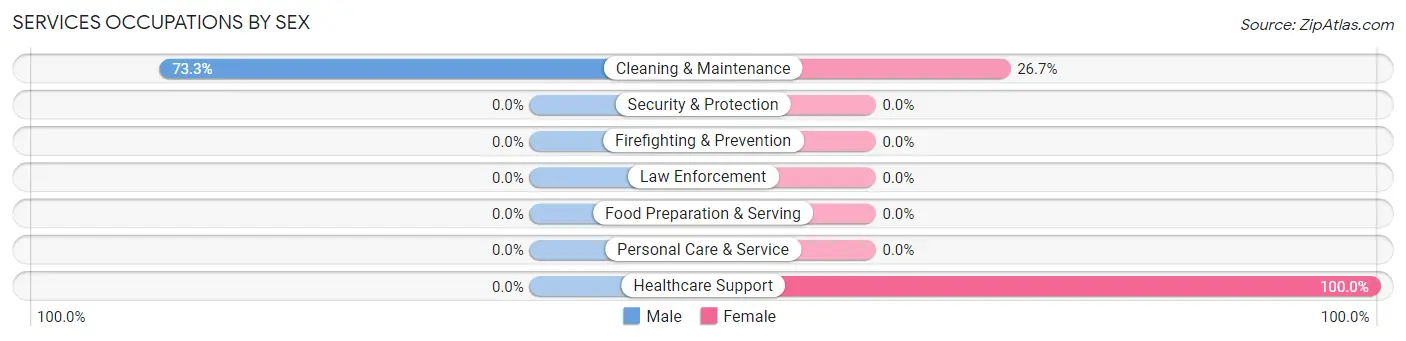
| Occupation | Male | Female |
| Healthcare Support | 0 (0.0%) | 22 (100.0%) |
| Security & Protection | 0 (0.0%) | 0 (0.0%) |
| Firefighting & Prevention | 0 (0.0%) | 0 (0.0%) |
| Law Enforcement | 0 (0.0%) | 0 (0.0%) |
| Food Preparation & Serving | 0 (0.0%) | 0 (0.0%) |
| Cleaning & Maintenance | 11 (73.3%) | 4 (26.7%) |
| Personal Care & Service | 0 (0.0%) | 0 (0.0%) |
| Total (Category) | 11 (29.7%) | 26 (70.3%) |
| Total (Overall) | 94 (53.4%) | 82 (46.6%) |
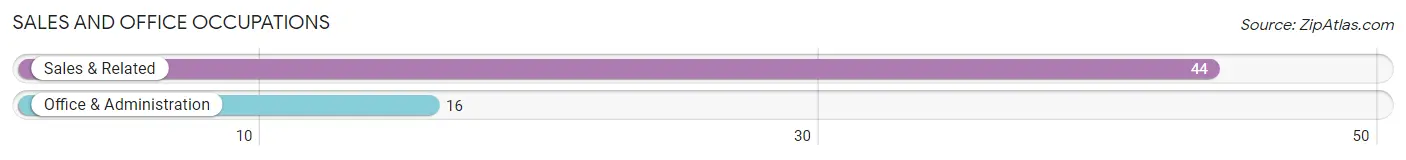
Sales and Office Occupations
The most common Sales and Office occupations in Eutawville are Sales & Related (44 | 25.0%), and Office & Administration (16 | 9.1%).
Sales and Office Occupations by Sex
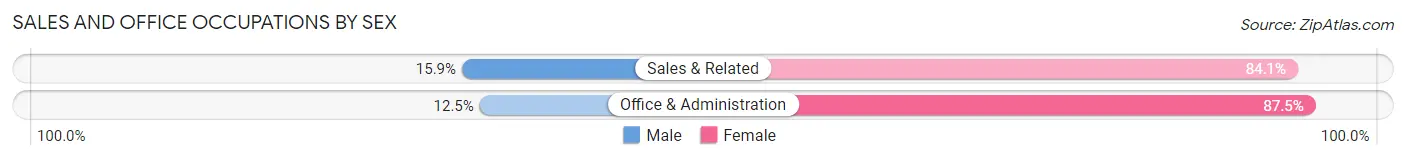
| Occupation | Male | Female |
| Sales & Related | 7 (15.9%) | 37 (84.1%) |
| Office & Administration | 2 (12.5%) | 14 (87.5%) |
| Total (Category) | 9 (15.0%) | 51 (85.0%) |
| Total (Overall) | 94 (53.4%) | 82 (46.6%) |
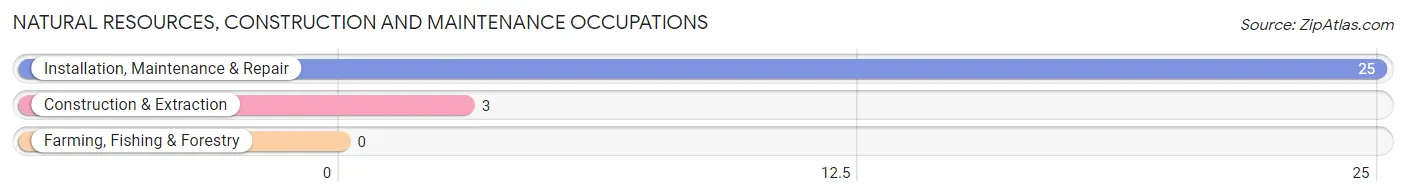
Natural Resources, Construction and Maintenance Occupations
The most common Natural Resources, Construction and Maintenance occupations in Eutawville are Installation, Maintenance & Repair (25 | 14.2%), and Construction & Extraction (3 | 1.7%).
Natural Resources, Construction and Maintenance Occupations by Sex
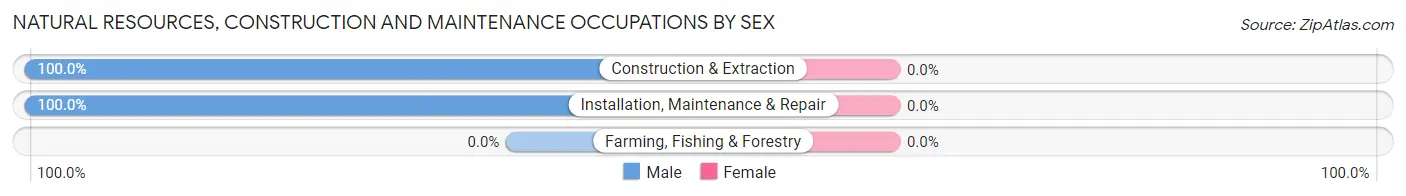
| Occupation | Male | Female |
| Farming, Fishing & Forestry | 0 (0.0%) | 0 (0.0%) |
| Construction & Extraction | 3 (100.0%) | 0 (0.0%) |
| Installation, Maintenance & Repair | 25 (100.0%) | 0 (0.0%) |
| Total (Category) | 28 (100.0%) | 0 (0.0%) |
| Total (Overall) | 94 (53.4%) | 82 (46.6%) |
Production, Transportation and Moving Occupations
The most common Production, Transportation and Moving occupations in Eutawville are Material Moving (21 | 11.9%), Transportation (20 | 11.4%), and Production (3 | 1.7%).
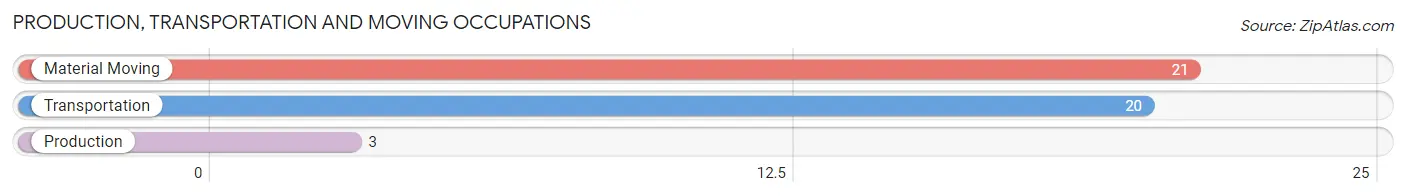
Production, Transportation and Moving Occupations by Sex
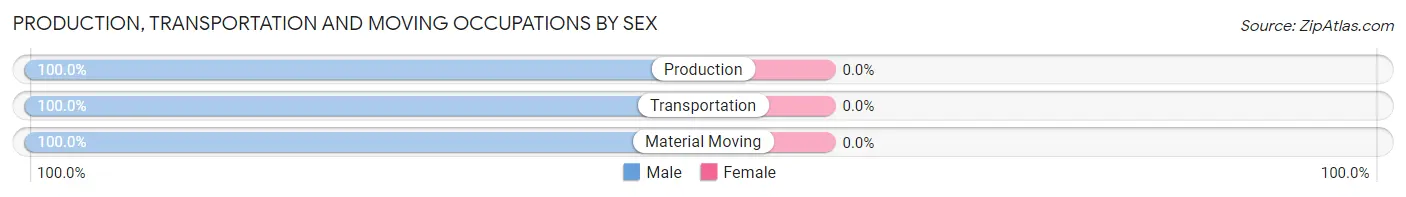
| Occupation | Male | Female |
| Production | 3 (100.0%) | 0 (0.0%) |
| Transportation | 20 (100.0%) | 0 (0.0%) |
| Material Moving | 21 (100.0%) | 0 (0.0%) |
| Total (Category) | 44 (100.0%) | 0 (0.0%) |
| Total (Overall) | 94 (53.4%) | 82 (46.6%) |
Employment Industries by Sex in Eutawville
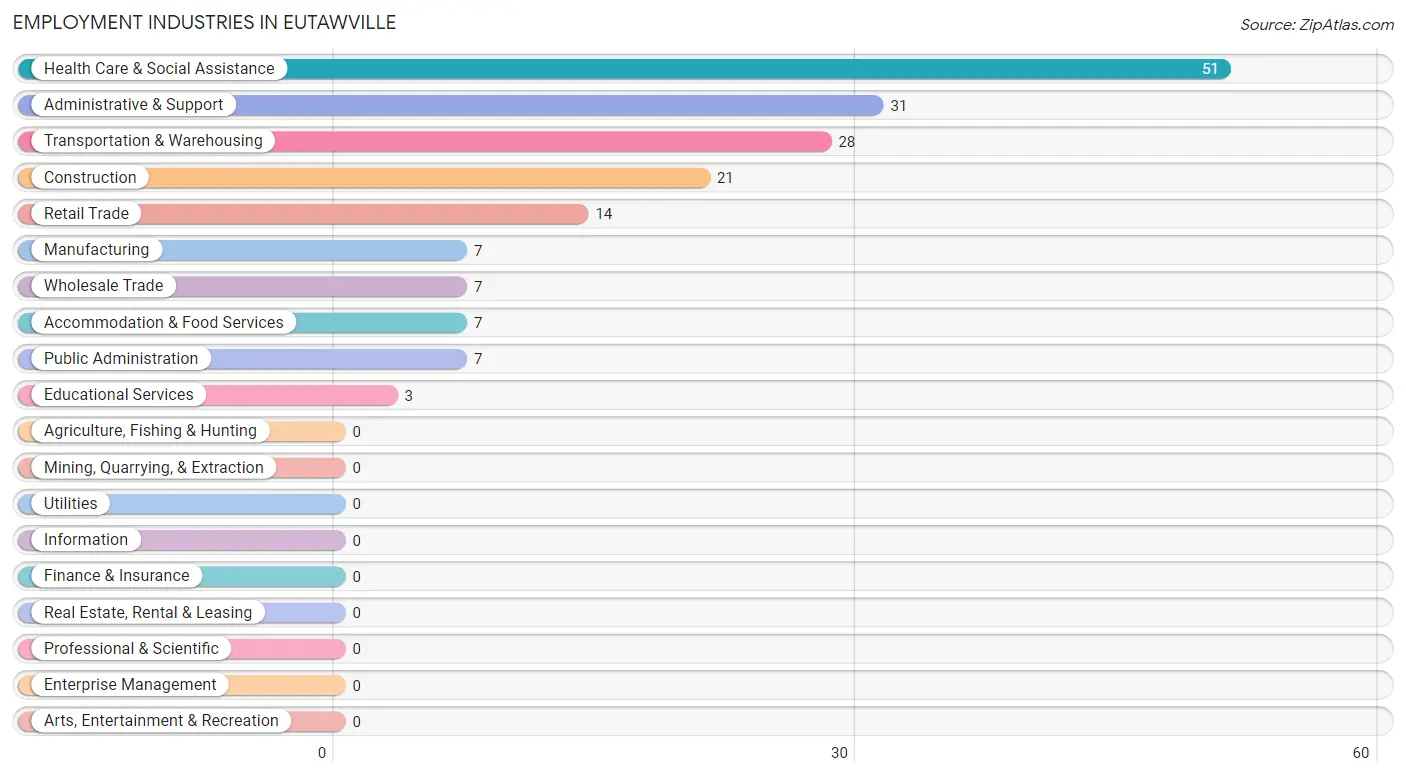
Employment Industries in Eutawville
The major employment industries in Eutawville include Health Care & Social Assistance (51 | 29.0%), Administrative & Support (31 | 17.6%), Transportation & Warehousing (28 | 15.9%), Construction (21 | 11.9%), and Retail Trade (14 | 8.0%).
Employment Industries by Sex in Eutawville
The Eutawville industries that see more men than women are Construction (100.0%), Manufacturing (100.0%), and Wholesale Trade (100.0%), whereas the industries that tend to have a higher number of women are Health Care & Social Assistance (100.0%), Accommodation & Food Services (100.0%), and Public Administration (85.7%).
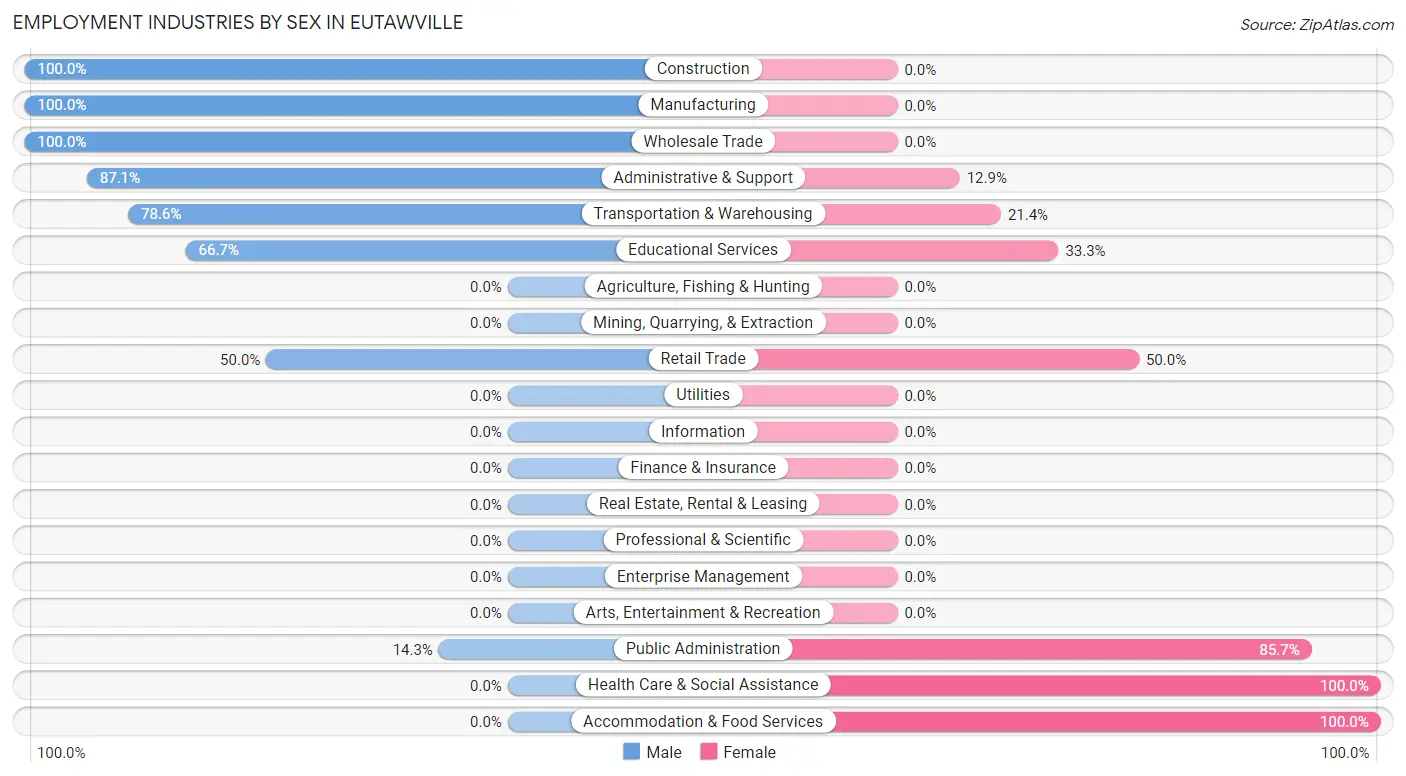
| Industry | Male | Female |
| Agriculture, Fishing & Hunting | 0 (0.0%) | 0 (0.0%) |
| Mining, Quarrying, & Extraction | 0 (0.0%) | 0 (0.0%) |
| Construction | 21 (100.0%) | 0 (0.0%) |
| Manufacturing | 7 (100.0%) | 0 (0.0%) |
| Wholesale Trade | 7 (100.0%) | 0 (0.0%) |
| Retail Trade | 7 (50.0%) | 7 (50.0%) |
| Transportation & Warehousing | 22 (78.6%) | 6 (21.4%) |
| Utilities | 0 (0.0%) | 0 (0.0%) |
| Information | 0 (0.0%) | 0 (0.0%) |
| Finance & Insurance | 0 (0.0%) | 0 (0.0%) |
| Real Estate, Rental & Leasing | 0 (0.0%) | 0 (0.0%) |
| Professional & Scientific | 0 (0.0%) | 0 (0.0%) |
| Enterprise Management | 0 (0.0%) | 0 (0.0%) |
| Administrative & Support | 27 (87.1%) | 4 (12.9%) |
| Educational Services | 2 (66.7%) | 1 (33.3%) |
| Health Care & Social Assistance | 0 (0.0%) | 51 (100.0%) |
| Arts, Entertainment & Recreation | 0 (0.0%) | 0 (0.0%) |
| Accommodation & Food Services | 0 (0.0%) | 7 (100.0%) |
| Public Administration | 1 (14.3%) | 6 (85.7%) |
| Total | 94 (53.4%) | 82 (46.6%) |
Education in Eutawville
School Enrollment in Eutawville
The most common levels of schooling among the 77 students in Eutawville are middle school (34 | 44.2%), elementary school (27 | 35.1%), and nursery / preschool (14 | 18.2%).
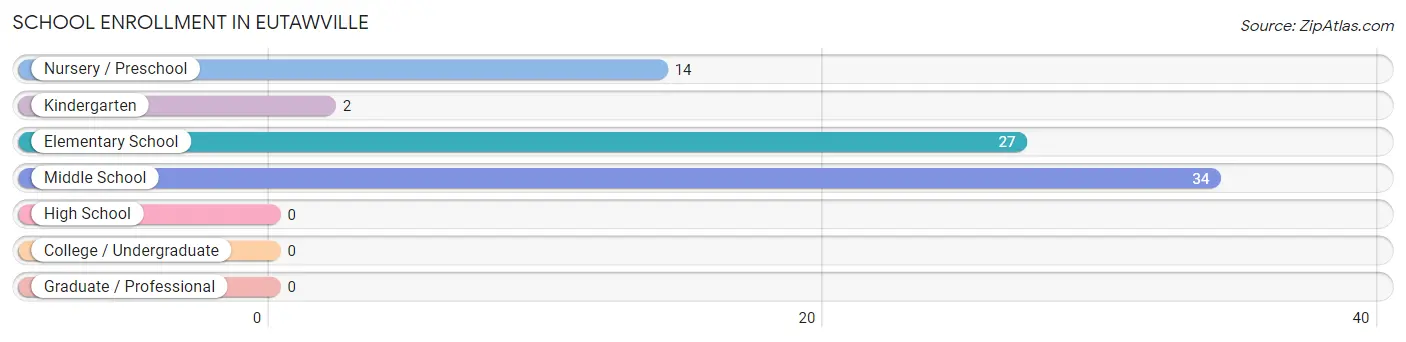
| School Level | # Students | % Students |
| Nursery / Preschool | 14 | 18.2% |
| Kindergarten | 2 | 2.6% |
| Elementary School | 27 | 35.1% |
| Middle School | 34 | 44.2% |
| High School | 0 | 0.0% |
| College / Undergraduate | 0 | 0.0% |
| Graduate / Professional | 0 | 0.0% |
| Total | 77 | 100.0% |
School Enrollment by Age by Funding Source in Eutawville
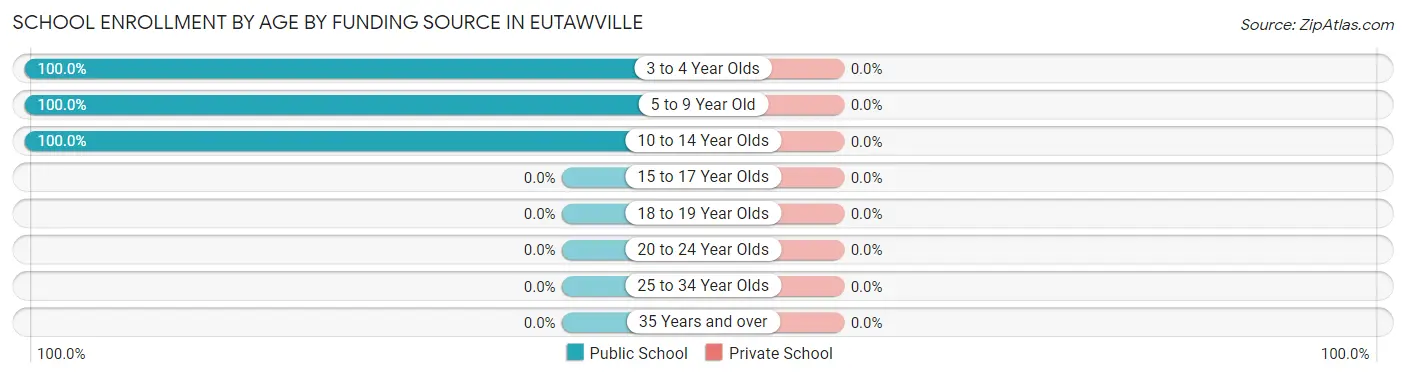
| Age Bracket | Public School | Private School |
| 3 to 4 Year Olds | 14 (100.0%) | 0 (0.0%) |
| 5 to 9 Year Old | 29 (100.0%) | 0 (0.0%) |
| 10 to 14 Year Olds | 34 (100.0%) | 0 (0.0%) |
| 15 to 17 Year Olds | 0 (0.0%) | 0 (0.0%) |
| 18 to 19 Year Olds | 0 (0.0%) | 0 (0.0%) |
| 20 to 24 Year Olds | 0 (0.0%) | 0 (0.0%) |
| 25 to 34 Year Olds | 0 (0.0%) | 0 (0.0%) |
| 35 Years and over | 0 (0.0%) | 0 (0.0%) |
| Total | 77 (100.0%) | 0 (0.0%) |
Educational Attainment by Field of Study in Eutawville
Education (5 | 45.5%), bio, nature & agricultural (2 | 18.2%), social sciences (2 | 18.2%), physical & health sciences (1 | 9.1%), and science & technology (1 | 9.1%) are the most common fields of study among 11 individuals in Eutawville who have obtained a bachelor's degree or higher.
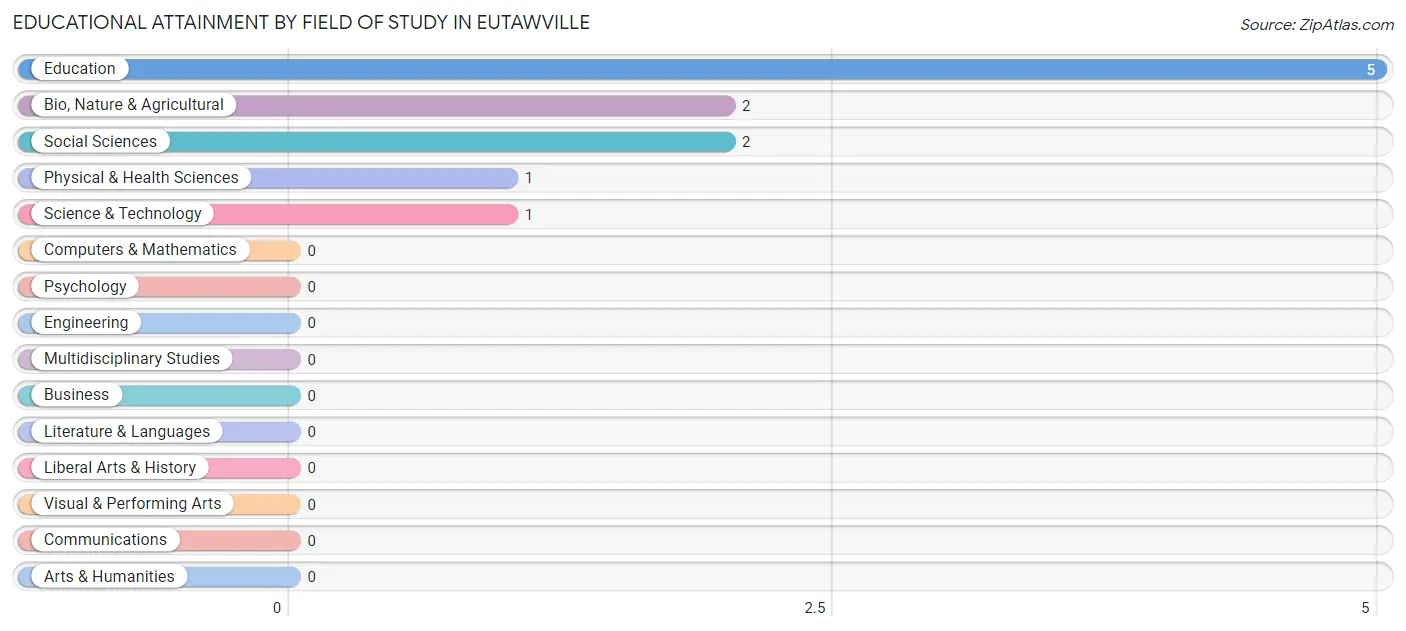
| Field of Study | # Graduates | % Graduates |
| Computers & Mathematics | 0 | 0.0% |
| Bio, Nature & Agricultural | 2 | 18.2% |
| Physical & Health Sciences | 1 | 9.1% |
| Psychology | 0 | 0.0% |
| Social Sciences | 2 | 18.2% |
| Engineering | 0 | 0.0% |
| Multidisciplinary Studies | 0 | 0.0% |
| Science & Technology | 1 | 9.1% |
| Business | 0 | 0.0% |
| Education | 5 | 45.5% |
| Literature & Languages | 0 | 0.0% |
| Liberal Arts & History | 0 | 0.0% |
| Visual & Performing Arts | 0 | 0.0% |
| Communications | 0 | 0.0% |
| Arts & Humanities | 0 | 0.0% |
| Total | 11 | 100.0% |
Transportation & Commute in Eutawville
Vehicle Availability by Sex in Eutawville
The most prevalent vehicle ownership categories in Eutawville are males with 4 vehicles (34, accounting for 36.2%) and females with 4 vehicles (23, making up 41.5%).
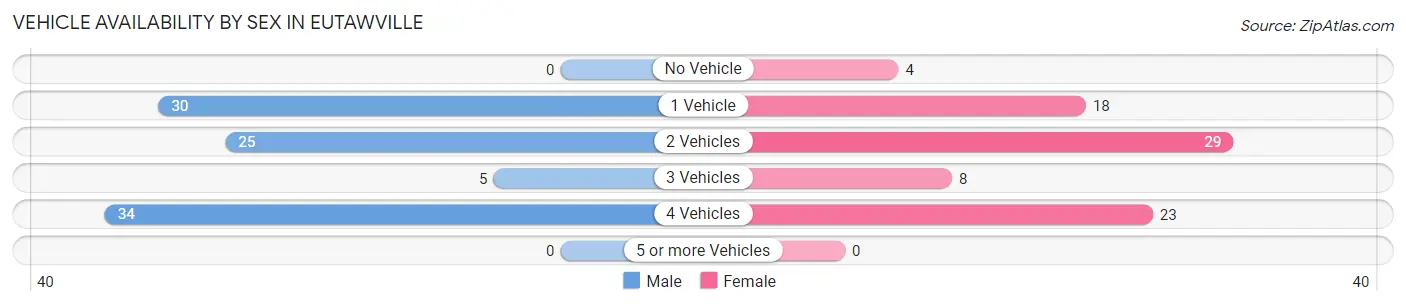
| Vehicles Available | Male | Female |
| No Vehicle | 0 (0.0%) | 4 (4.9%) |
| 1 Vehicle | 30 (31.9%) | 18 (22.0%) |
| 2 Vehicles | 25 (26.6%) | 29 (35.4%) |
| 3 Vehicles | 5 (5.3%) | 8 (9.8%) |
| 4 Vehicles | 34 (36.2%) | 23 (28.1%) |
| 5 or more Vehicles | 0 (0.0%) | 0 (0.0%) |
| Total | 94 (100.0%) | 82 (100.0%) |
Commute Time in Eutawville
The most frequently occuring commute durations in Eutawville are 45 to 59 minutes (102 commuters, 58.0%), 15 to 19 minutes (20 commuters, 11.4%), and 40 to 44 minutes (19 commuters, 10.8%).
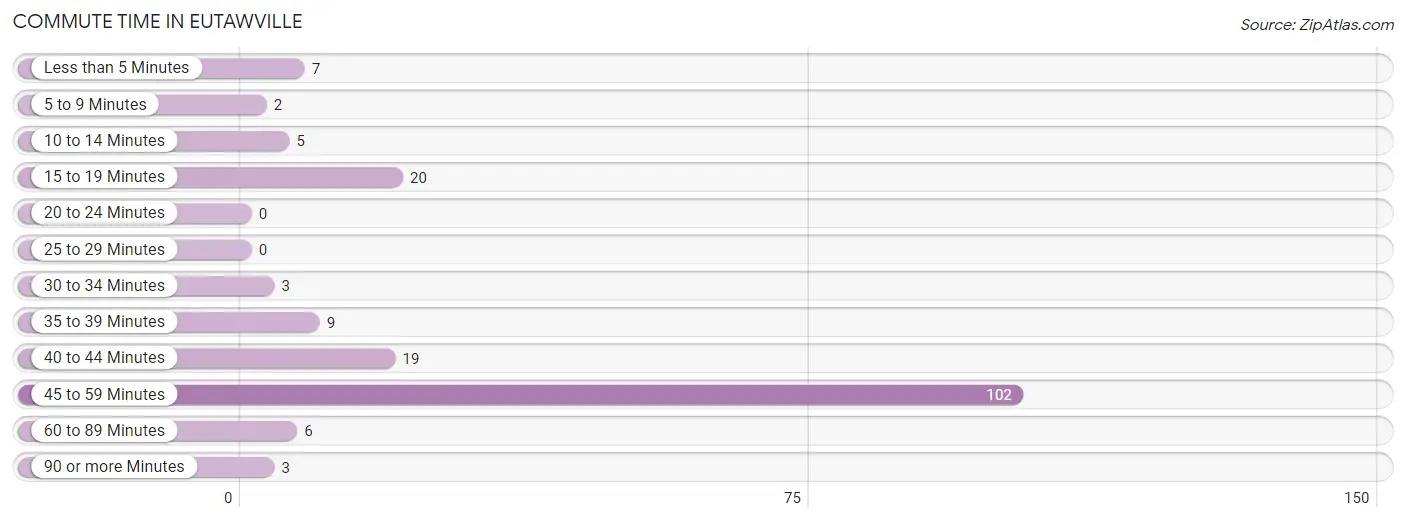
| Commute Time | # Commuters | % Commuters |
| Less than 5 Minutes | 7 | 4.0% |
| 5 to 9 Minutes | 2 | 1.1% |
| 10 to 14 Minutes | 5 | 2.8% |
| 15 to 19 Minutes | 20 | 11.4% |
| 20 to 24 Minutes | 0 | 0.0% |
| 25 to 29 Minutes | 0 | 0.0% |
| 30 to 34 Minutes | 3 | 1.7% |
| 35 to 39 Minutes | 9 | 5.1% |
| 40 to 44 Minutes | 19 | 10.8% |
| 45 to 59 Minutes | 102 | 58.0% |
| 60 to 89 Minutes | 6 | 3.4% |
| 90 or more Minutes | 3 | 1.7% |
Commute Time by Sex in Eutawville
The most common commute times in Eutawville are 45 to 59 minutes (51 commuters, 54.3%) for males and 45 to 59 minutes (51 commuters, 62.2%) for females.
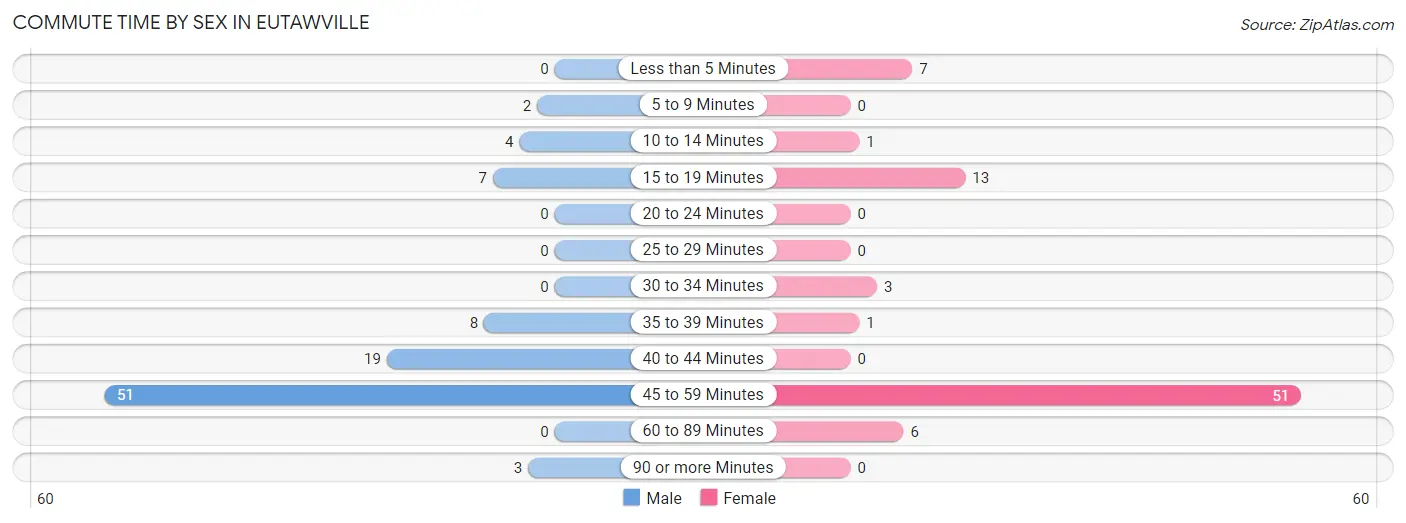
| Commute Time | Male | Female |
| Less than 5 Minutes | 0 (0.0%) | 7 (8.5%) |
| 5 to 9 Minutes | 2 (2.1%) | 0 (0.0%) |
| 10 to 14 Minutes | 4 (4.3%) | 1 (1.2%) |
| 15 to 19 Minutes | 7 (7.4%) | 13 (15.9%) |
| 20 to 24 Minutes | 0 (0.0%) | 0 (0.0%) |
| 25 to 29 Minutes | 0 (0.0%) | 0 (0.0%) |
| 30 to 34 Minutes | 0 (0.0%) | 3 (3.7%) |
| 35 to 39 Minutes | 8 (8.5%) | 1 (1.2%) |
| 40 to 44 Minutes | 19 (20.2%) | 0 (0.0%) |
| 45 to 59 Minutes | 51 (54.3%) | 51 (62.2%) |
| 60 to 89 Minutes | 0 (0.0%) | 6 (7.3%) |
| 90 or more Minutes | 3 (3.2%) | 0 (0.0%) |
Time of Departure to Work by Sex in Eutawville
The most frequent times of departure to work in Eutawville are 7:00 AM to 7:29 AM (38, 40.4%) for males and 7:30 AM to 7:59 AM (25, 30.5%) for females.
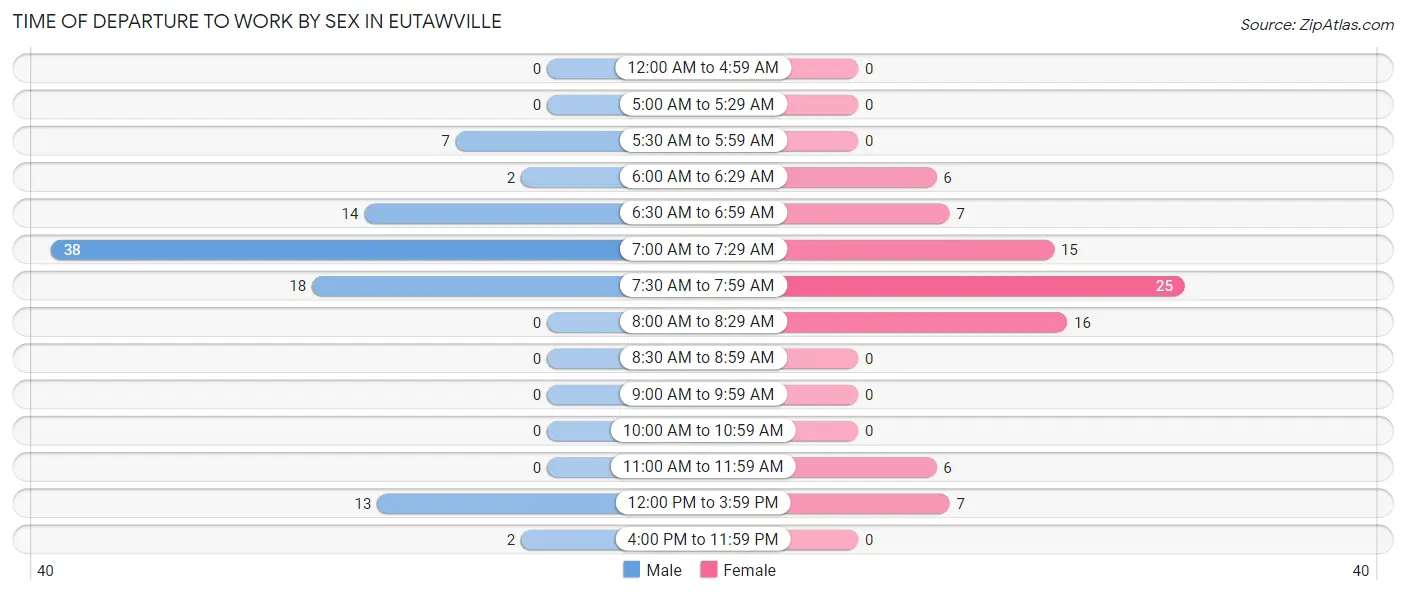
| Time of Departure | Male | Female |
| 12:00 AM to 4:59 AM | 0 (0.0%) | 0 (0.0%) |
| 5:00 AM to 5:29 AM | 0 (0.0%) | 0 (0.0%) |
| 5:30 AM to 5:59 AM | 7 (7.4%) | 0 (0.0%) |
| 6:00 AM to 6:29 AM | 2 (2.1%) | 6 (7.3%) |
| 6:30 AM to 6:59 AM | 14 (14.9%) | 7 (8.5%) |
| 7:00 AM to 7:29 AM | 38 (40.4%) | 15 (18.3%) |
| 7:30 AM to 7:59 AM | 18 (19.2%) | 25 (30.5%) |
| 8:00 AM to 8:29 AM | 0 (0.0%) | 16 (19.5%) |
| 8:30 AM to 8:59 AM | 0 (0.0%) | 0 (0.0%) |
| 9:00 AM to 9:59 AM | 0 (0.0%) | 0 (0.0%) |
| 10:00 AM to 10:59 AM | 0 (0.0%) | 0 (0.0%) |
| 11:00 AM to 11:59 AM | 0 (0.0%) | 6 (7.3%) |
| 12:00 PM to 3:59 PM | 13 (13.8%) | 7 (8.5%) |
| 4:00 PM to 11:59 PM | 2 (2.1%) | 0 (0.0%) |
| Total | 94 (100.0%) | 82 (100.0%) |
Housing Occupancy in Eutawville
Occupancy by Ownership in Eutawville
Of the total 136 dwellings in Eutawville, owner-occupied units account for 103 (75.7%), while renter-occupied units make up 33 (24.3%).
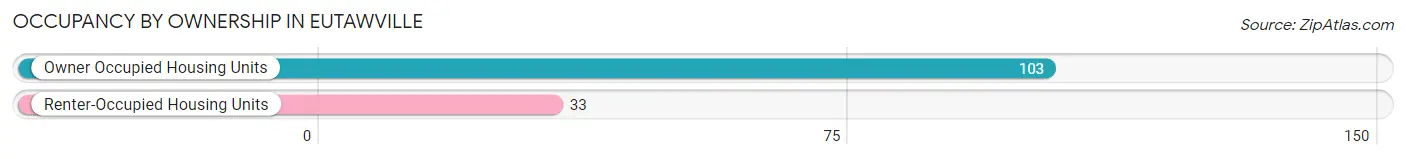
| Occupancy | # Housing Units | % Housing Units |
| Owner Occupied Housing Units | 103 | 75.7% |
| Renter-Occupied Housing Units | 33 | 24.3% |
| Total Occupied Housing Units | 136 | 100.0% |
Occupancy by Household Size in Eutawville
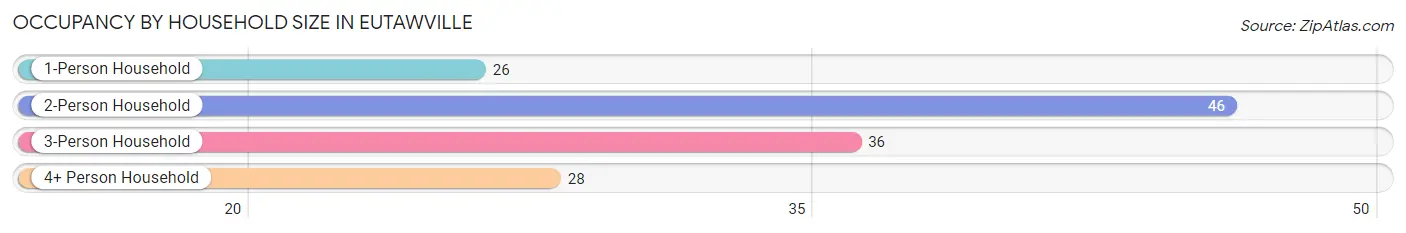
| Household Size | # Housing Units | % Housing Units |
| 1-Person Household | 26 | 19.1% |
| 2-Person Household | 46 | 33.8% |
| 3-Person Household | 36 | 26.5% |
| 4+ Person Household | 28 | 20.6% |
| Total Housing Units | 136 | 100.0% |
Occupancy by Ownership by Household Size in Eutawville
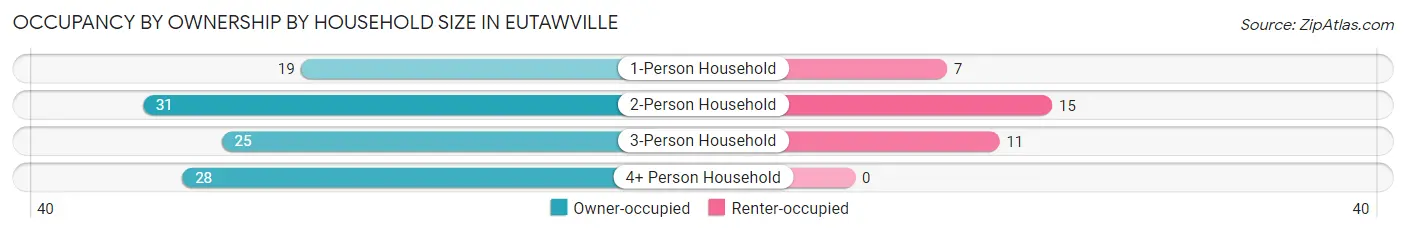
| Household Size | Owner-occupied | Renter-occupied |
| 1-Person Household | 19 (73.1%) | 7 (26.9%) |
| 2-Person Household | 31 (67.4%) | 15 (32.6%) |
| 3-Person Household | 25 (69.4%) | 11 (30.6%) |
| 4+ Person Household | 28 (100.0%) | 0 (0.0%) |
| Total Housing Units | 103 (75.7%) | 33 (24.3%) |
Occupancy by Educational Attainment in Eutawville
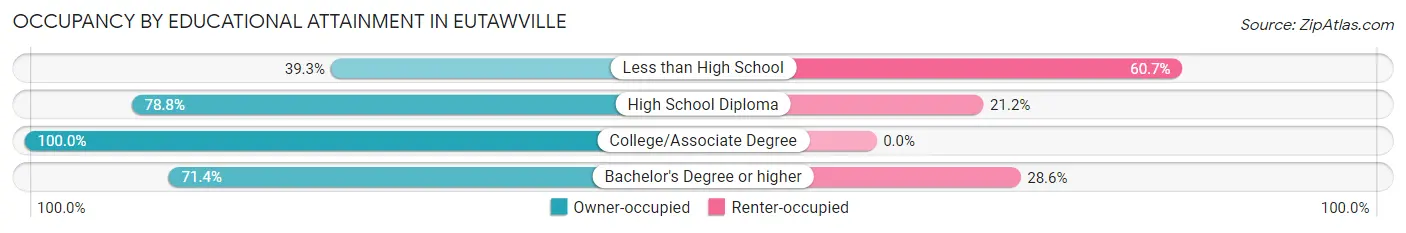
| Household Size | Owner-occupied | Renter-occupied |
| Less than High School | 11 (39.3%) | 17 (60.7%) |
| High School Diploma | 52 (78.8%) | 14 (21.2%) |
| College/Associate Degree | 35 (100.0%) | 0 (0.0%) |
| Bachelor's Degree or higher | 5 (71.4%) | 2 (28.6%) |
Occupancy by Age of Householder in Eutawville
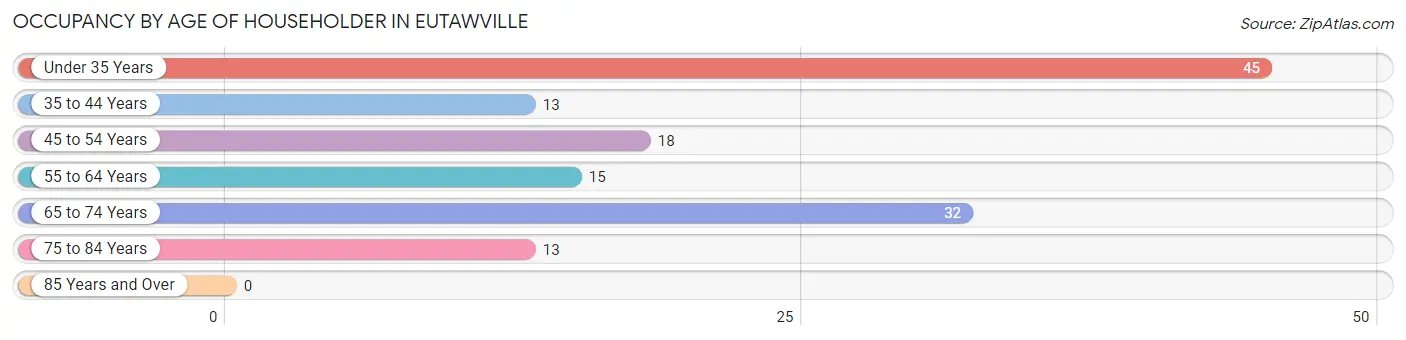
| Age Bracket | # Households | % Households |
| Under 35 Years | 45 | 33.1% |
| 35 to 44 Years | 13 | 9.6% |
| 45 to 54 Years | 18 | 13.2% |
| 55 to 64 Years | 15 | 11.0% |
| 65 to 74 Years | 32 | 23.5% |
| 75 to 84 Years | 13 | 9.6% |
| 85 Years and Over | 0 | 0.0% |
| Total | 136 | 100.0% |
Housing Finances in Eutawville
Median Income by Occupancy in Eutawville
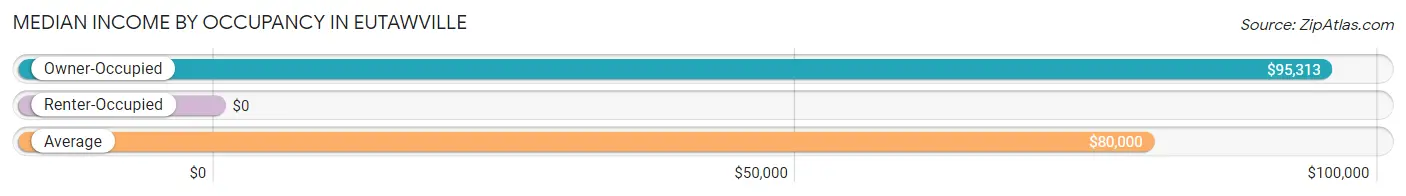
| Occupancy Type | # Households | Median Income |
| Owner-Occupied | 103 (75.7%) | $95,313 |
| Renter-Occupied | 33 (24.3%) | $0 |
| Average | 136 (100.0%) | $80,000 |
Occupancy by Householder Income Bracket in Eutawville
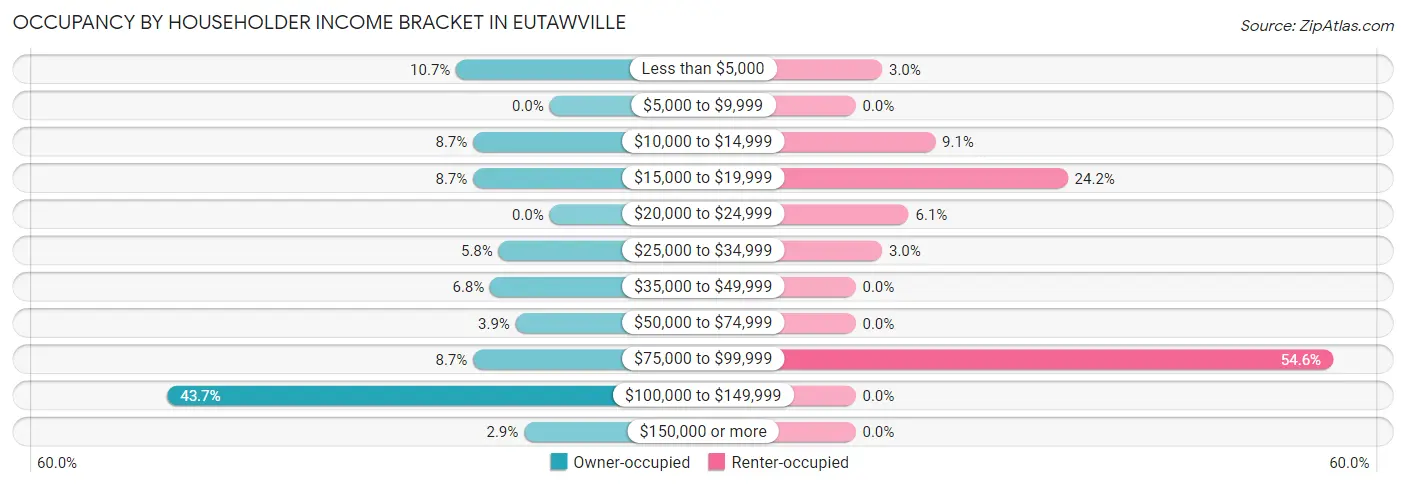
| Income Bracket | Owner-occupied | Renter-occupied |
| Less than $5,000 | 11 (10.7%) | 1 (3.0%) |
| $5,000 to $9,999 | 0 (0.0%) | 0 (0.0%) |
| $10,000 to $14,999 | 9 (8.7%) | 3 (9.1%) |
| $15,000 to $19,999 | 9 (8.7%) | 8 (24.2%) |
| $20,000 to $24,999 | 0 (0.0%) | 2 (6.1%) |
| $25,000 to $34,999 | 6 (5.8%) | 1 (3.0%) |
| $35,000 to $49,999 | 7 (6.8%) | 0 (0.0%) |
| $50,000 to $74,999 | 4 (3.9%) | 0 (0.0%) |
| $75,000 to $99,999 | 9 (8.7%) | 18 (54.5%) |
| $100,000 to $149,999 | 45 (43.7%) | 0 (0.0%) |
| $150,000 or more | 3 (2.9%) | 0 (0.0%) |
| Total | 103 (100.0%) | 33 (100.0%) |
Monthly Housing Cost Tiers in Eutawville
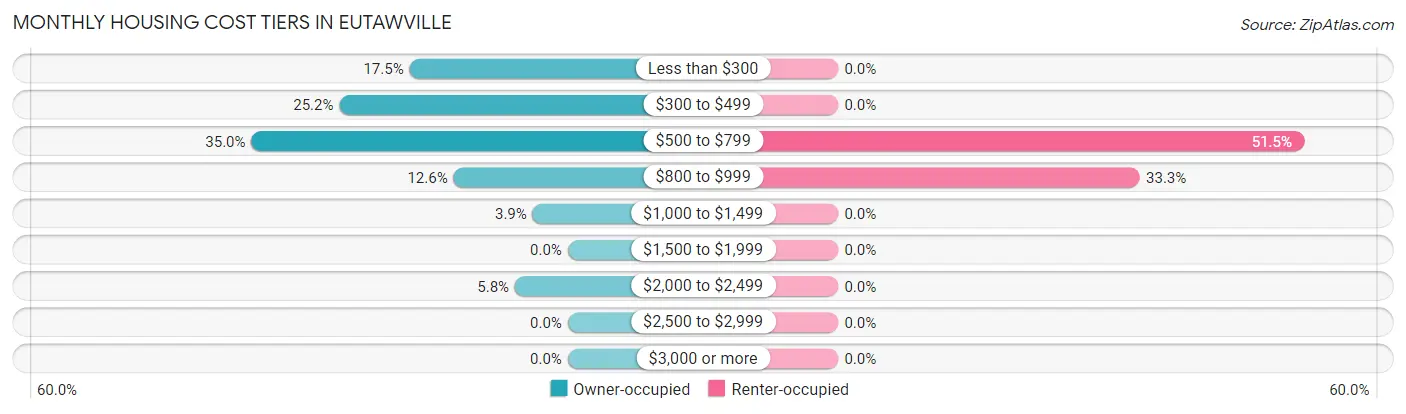
| Monthly Cost | Owner-occupied | Renter-occupied |
| Less than $300 | 18 (17.5%) | 0 (0.0%) |
| $300 to $499 | 26 (25.2%) | 0 (0.0%) |
| $500 to $799 | 36 (34.9%) | 17 (51.5%) |
| $800 to $999 | 13 (12.6%) | 11 (33.3%) |
| $1,000 to $1,499 | 4 (3.9%) | 0 (0.0%) |
| $1,500 to $1,999 | 0 (0.0%) | 0 (0.0%) |
| $2,000 to $2,499 | 6 (5.8%) | 0 (0.0%) |
| $2,500 to $2,999 | 0 (0.0%) | 0 (0.0%) |
| $3,000 or more | 0 (0.0%) | 0 (0.0%) |
| Total | 103 (100.0%) | 33 (100.0%) |
Physical Housing Characteristics in Eutawville
Housing Structures in Eutawville
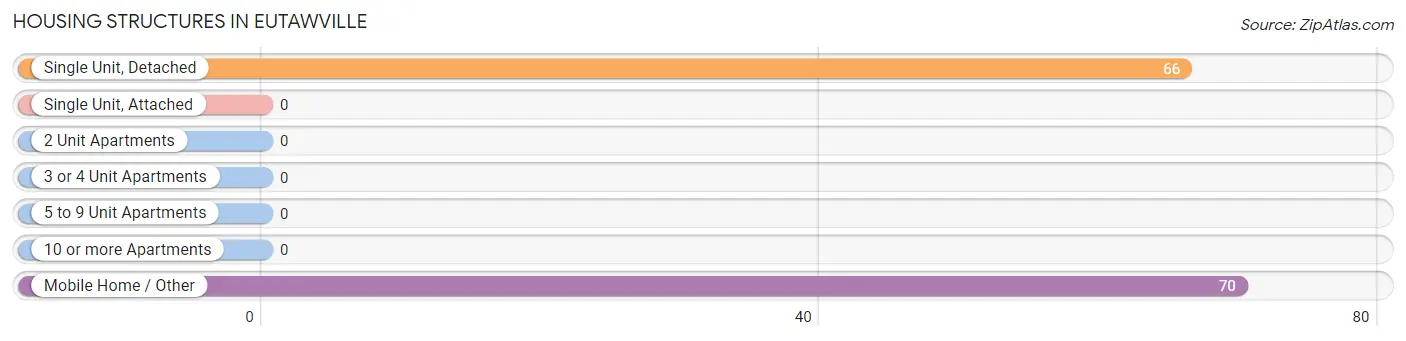
| Structure Type | # Housing Units | % Housing Units |
| Single Unit, Detached | 66 | 48.5% |
| Single Unit, Attached | 0 | 0.0% |
| 2 Unit Apartments | 0 | 0.0% |
| 3 or 4 Unit Apartments | 0 | 0.0% |
| 5 to 9 Unit Apartments | 0 | 0.0% |
| 10 or more Apartments | 0 | 0.0% |
| Mobile Home / Other | 70 | 51.5% |
| Total | 136 | 100.0% |
Housing Structures by Occupancy in Eutawville
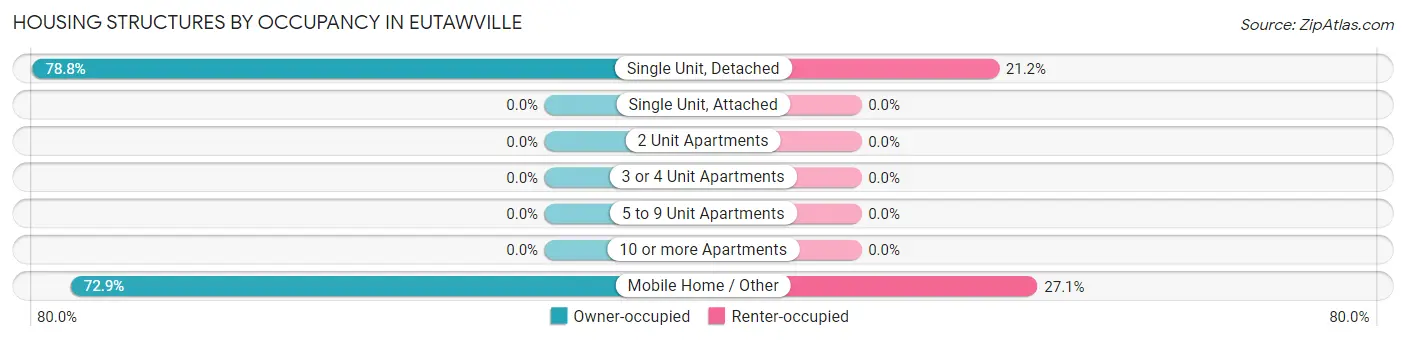
| Structure Type | Owner-occupied | Renter-occupied |
| Single Unit, Detached | 52 (78.8%) | 14 (21.2%) |
| Single Unit, Attached | 0 (0.0%) | 0 (0.0%) |
| 2 Unit Apartments | 0 (0.0%) | 0 (0.0%) |
| 3 or 4 Unit Apartments | 0 (0.0%) | 0 (0.0%) |
| 5 to 9 Unit Apartments | 0 (0.0%) | 0 (0.0%) |
| 10 or more Apartments | 0 (0.0%) | 0 (0.0%) |
| Mobile Home / Other | 51 (72.9%) | 19 (27.1%) |
| Total | 103 (75.7%) | 33 (24.3%) |
Housing Structures by Number of Rooms in Eutawville
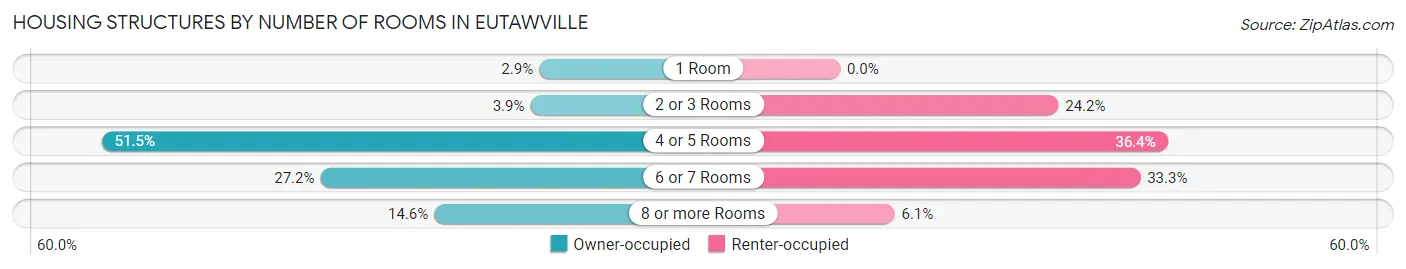
| Number of Rooms | Owner-occupied | Renter-occupied |
| 1 Room | 3 (2.9%) | 0 (0.0%) |
| 2 or 3 Rooms | 4 (3.9%) | 8 (24.2%) |
| 4 or 5 Rooms | 53 (51.5%) | 12 (36.4%) |
| 6 or 7 Rooms | 28 (27.2%) | 11 (33.3%) |
| 8 or more Rooms | 15 (14.6%) | 2 (6.1%) |
| Total | 103 (100.0%) | 33 (100.0%) |
Housing Structure by Heating Type in Eutawville
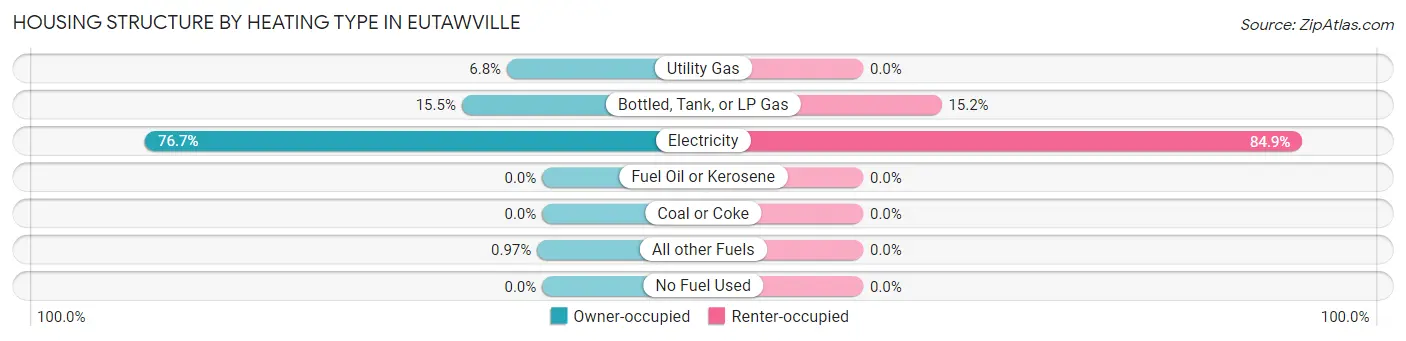
| Heating Type | Owner-occupied | Renter-occupied |
| Utility Gas | 7 (6.8%) | 0 (0.0%) |
| Bottled, Tank, or LP Gas | 16 (15.5%) | 5 (15.1%) |
| Electricity | 79 (76.7%) | 28 (84.9%) |
| Fuel Oil or Kerosene | 0 (0.0%) | 0 (0.0%) |
| Coal or Coke | 0 (0.0%) | 0 (0.0%) |
| All other Fuels | 1 (1.0%) | 0 (0.0%) |
| No Fuel Used | 0 (0.0%) | 0 (0.0%) |
| Total | 103 (100.0%) | 33 (100.0%) |
Household Vehicle Usage in Eutawville
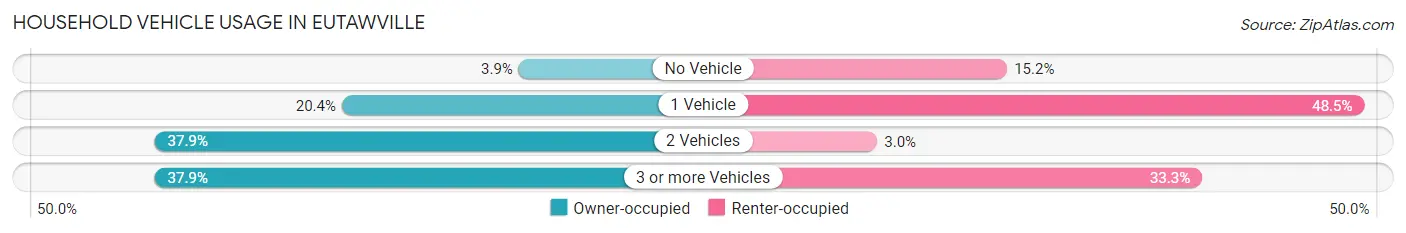
| Vehicles per Household | Owner-occupied | Renter-occupied |
| No Vehicle | 4 (3.9%) | 5 (15.1%) |
| 1 Vehicle | 21 (20.4%) | 16 (48.5%) |
| 2 Vehicles | 39 (37.9%) | 1 (3.0%) |
| 3 or more Vehicles | 39 (37.9%) | 11 (33.3%) |
| Total | 103 (100.0%) | 33 (100.0%) |
Real Estate & Mortgages in Eutawville
Real Estate and Mortgage Overview in Eutawville
| Characteristic | Without Mortgage | With Mortgage |
| Housing Units | 87 | 16 |
| Median Property Value | $58,400 | $162,500 |
| Median Household Income | - | - |
| Monthly Housing Costs | $493 | $0 |
| Real Estate Taxes | - | - |
Property Value by Mortgage Status in Eutawville
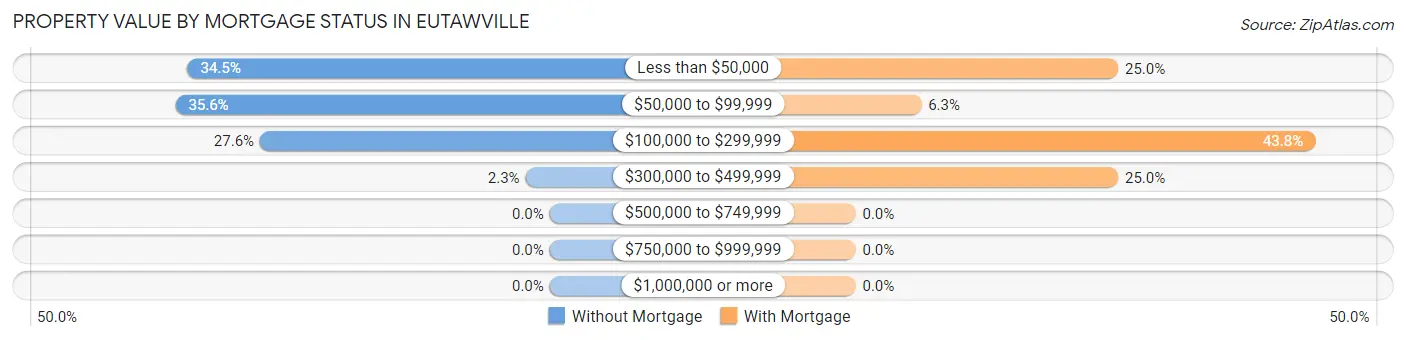
| Property Value | Without Mortgage | With Mortgage |
| Less than $50,000 | 30 (34.5%) | 4 (25.0%) |
| $50,000 to $99,999 | 31 (35.6%) | 1 (6.2%) |
| $100,000 to $299,999 | 24 (27.6%) | 7 (43.8%) |
| $300,000 to $499,999 | 2 (2.3%) | 4 (25.0%) |
| $500,000 to $749,999 | 0 (0.0%) | 0 (0.0%) |
| $750,000 to $999,999 | 0 (0.0%) | 0 (0.0%) |
| $1,000,000 or more | 0 (0.0%) | 0 (0.0%) |
| Total | 87 (100.0%) | 16 (100.0%) |
Household Income by Mortgage Status in Eutawville
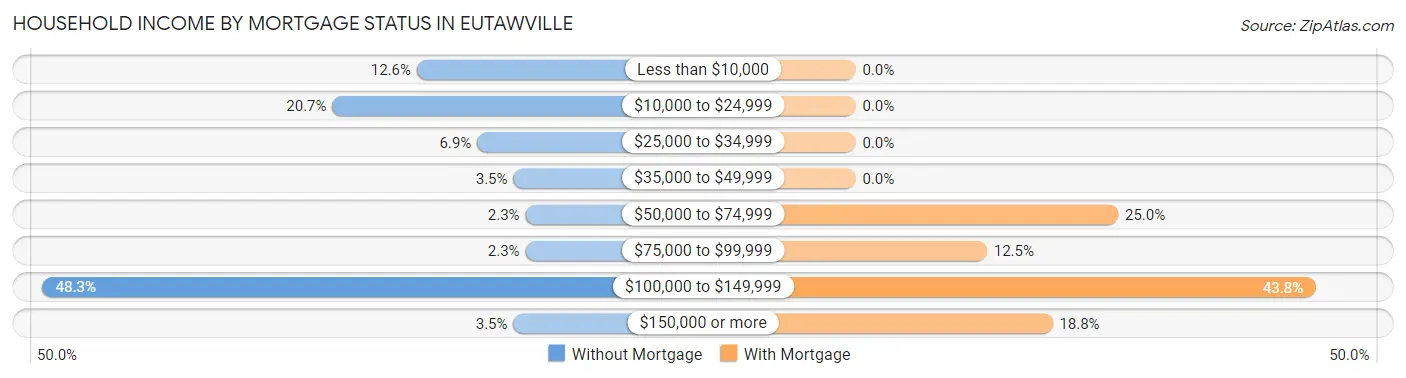
| Household Income | Without Mortgage | With Mortgage |
| Less than $10,000 | 11 (12.6%) | 0 (0.0%) |
| $10,000 to $24,999 | 18 (20.7%) | 0 (0.0%) |
| $25,000 to $34,999 | 6 (6.9%) | 0 (0.0%) |
| $35,000 to $49,999 | 3 (3.5%) | 0 (0.0%) |
| $50,000 to $74,999 | 2 (2.3%) | 4 (25.0%) |
| $75,000 to $99,999 | 2 (2.3%) | 2 (12.5%) |
| $100,000 to $149,999 | 42 (48.3%) | 7 (43.8%) |
| $150,000 or more | 3 (3.5%) | 3 (18.8%) |
| Total | 87 (100.0%) | 16 (100.0%) |
Property Value to Household Income Ratio in Eutawville
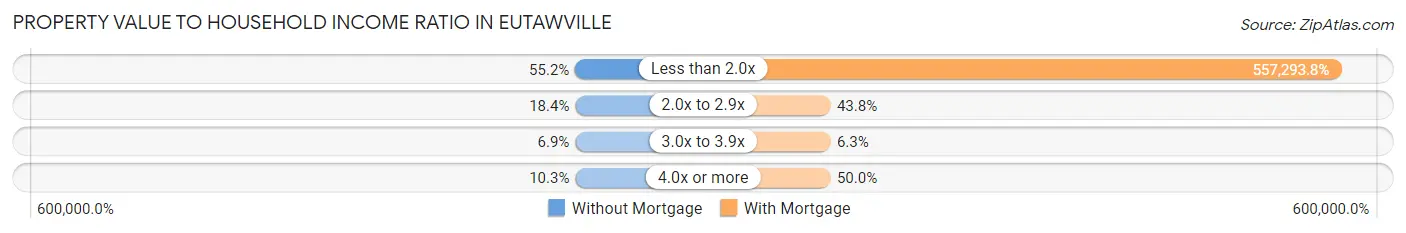
| Value-to-Income Ratio | Without Mortgage | With Mortgage |
| Less than 2.0x | 48 (55.2%) | 89,167 (557,293.8%) |
| 2.0x to 2.9x | 16 (18.4%) | 7 (43.8%) |
| 3.0x to 3.9x | 6 (6.9%) | 1 (6.2%) |
| 4.0x or more | 9 (10.3%) | 8 (50.0%) |
| Total | 87 (100.0%) | 16 (100.0%) |
Real Estate Taxes by Mortgage Status in Eutawville
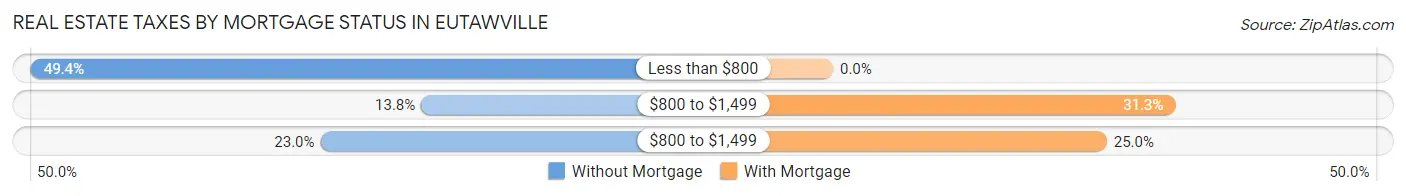
| Property Taxes | Without Mortgage | With Mortgage |
| Less than $800 | 43 (49.4%) | 0 (0.0%) |
| $800 to $1,499 | 12 (13.8%) | 5 (31.2%) |
| $800 to $1,499 | 20 (23.0%) | 4 (25.0%) |
| Total | 87 (100.0%) | 16 (100.0%) |
Health & Disability in Eutawville
Health Insurance Coverage by Age in Eutawville
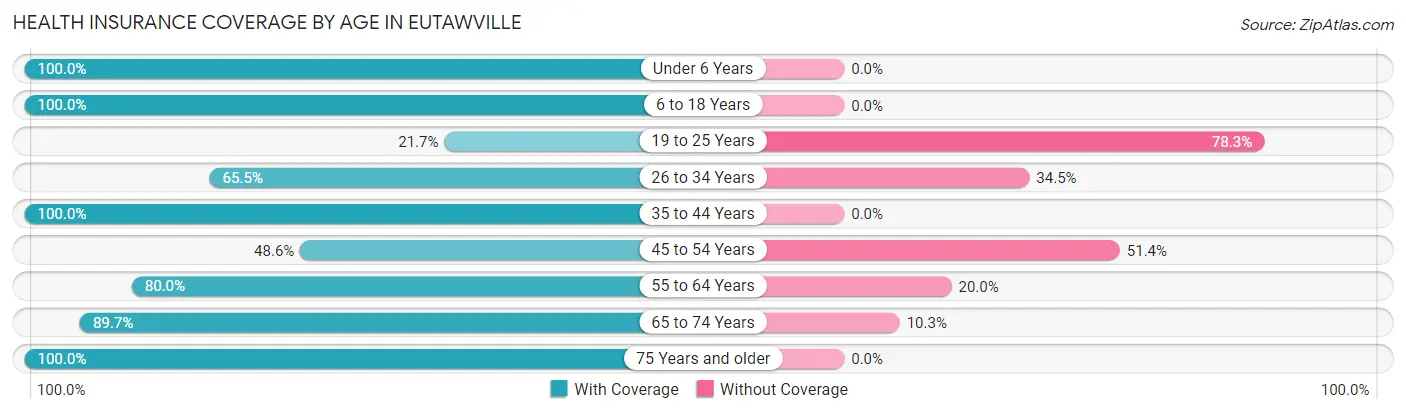
| Age Bracket | With Coverage | Without Coverage |
| Under 6 Years | 24 (100.0%) | 0 (0.0%) |
| 6 to 18 Years | 70 (100.0%) | 0 (0.0%) |
| 19 to 25 Years | 5 (21.7%) | 18 (78.3%) |
| 26 to 34 Years | 55 (65.5%) | 29 (34.5%) |
| 35 to 44 Years | 13 (100.0%) | 0 (0.0%) |
| 45 to 54 Years | 35 (48.6%) | 37 (51.4%) |
| 55 to 64 Years | 28 (80.0%) | 7 (20.0%) |
| 65 to 74 Years | 52 (89.7%) | 6 (10.3%) |
| 75 Years and older | 17 (100.0%) | 0 (0.0%) |
| Total | 299 (75.5%) | 97 (24.5%) |
Health Insurance Coverage by Citizenship Status in Eutawville
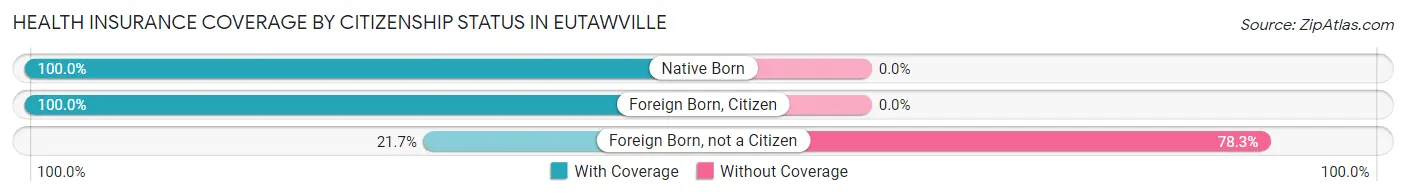
| Citizenship Status | With Coverage | Without Coverage |
| Native Born | 24 (100.0%) | 0 (0.0%) |
| Foreign Born, Citizen | 70 (100.0%) | 0 (0.0%) |
| Foreign Born, not a Citizen | 5 (21.7%) | 18 (78.3%) |
Health Insurance Coverage by Household Income in Eutawville
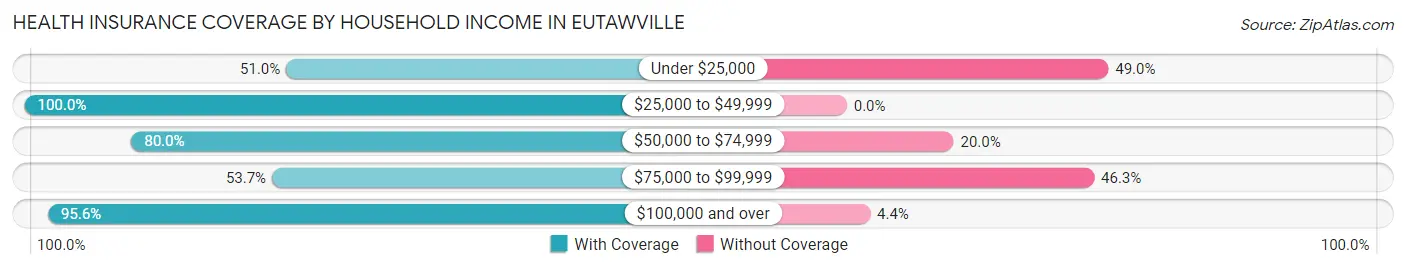
| Household Income | With Coverage | Without Coverage |
| Under $25,000 | 51 (51.0%) | 49 (49.0%) |
| $25,000 to $49,999 | 21 (100.0%) | 0 (0.0%) |
| $50,000 to $74,999 | 8 (80.0%) | 2 (20.0%) |
| $75,000 to $99,999 | 44 (53.7%) | 38 (46.3%) |
| $100,000 and over | 175 (95.6%) | 8 (4.4%) |
Public vs Private Health Insurance Coverage by Age in Eutawville
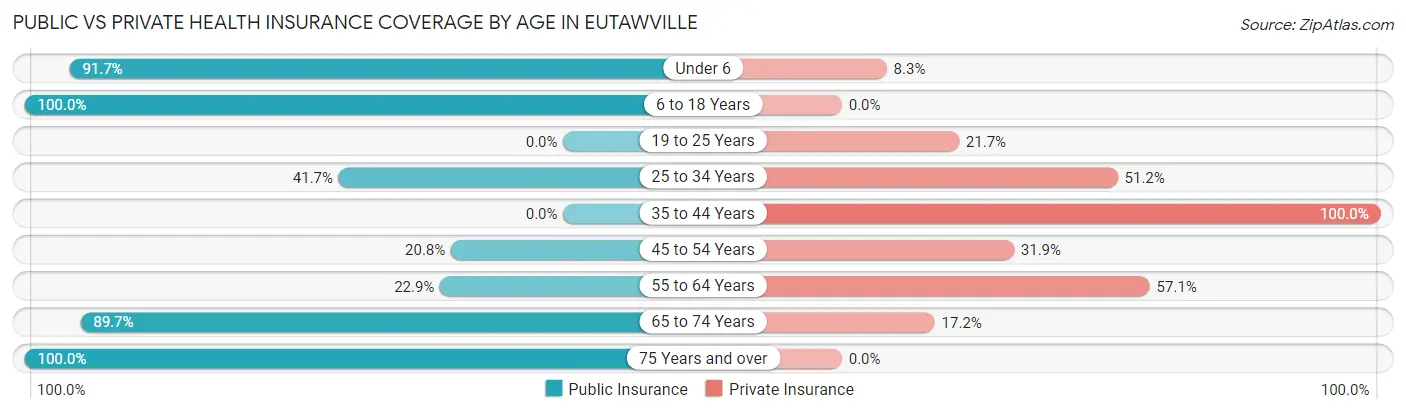
| Age Bracket | Public Insurance | Private Insurance |
| Under 6 | 22 (91.7%) | 2 (8.3%) |
| 6 to 18 Years | 70 (100.0%) | 0 (0.0%) |
| 19 to 25 Years | 0 (0.0%) | 5 (21.7%) |
| 25 to 34 Years | 35 (41.7%) | 43 (51.2%) |
| 35 to 44 Years | 0 (0.0%) | 13 (100.0%) |
| 45 to 54 Years | 15 (20.8%) | 23 (31.9%) |
| 55 to 64 Years | 8 (22.9%) | 20 (57.1%) |
| 65 to 74 Years | 52 (89.7%) | 10 (17.2%) |
| 75 Years and over | 17 (100.0%) | 0 (0.0%) |
| Total | 219 (55.3%) | 116 (29.3%) |
Disability Status by Sex by Age in Eutawville
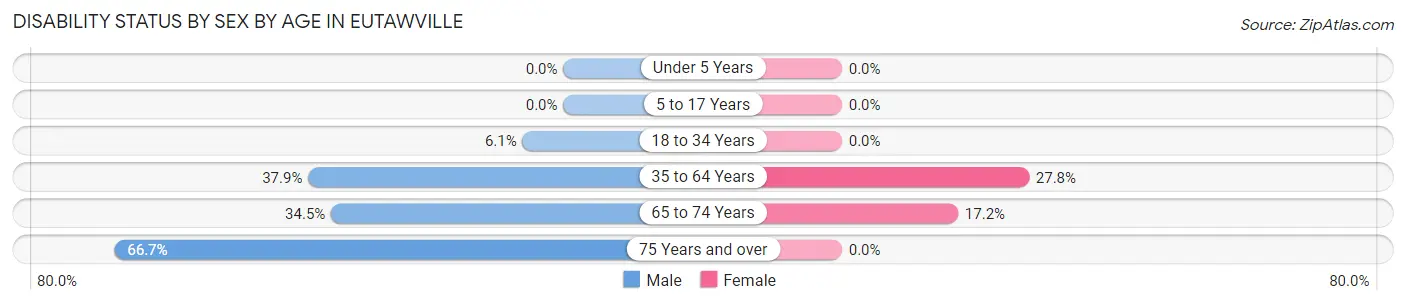
| Age Bracket | Male | Female |
| Under 5 Years | 0 (0.0%) | 0 (0.0%) |
| 5 to 17 Years | 0 (0.0%) | 0 (0.0%) |
| 18 to 34 Years | 4 (6.1%) | 0 (0.0%) |
| 35 to 64 Years | 25 (37.9%) | 15 (27.8%) |
| 65 to 74 Years | 10 (34.5%) | 5 (17.2%) |
| 75 Years and over | 4 (66.7%) | 0 (0.0%) |
Disability Class by Sex by Age in Eutawville
Disability Class: Hearing Difficulty
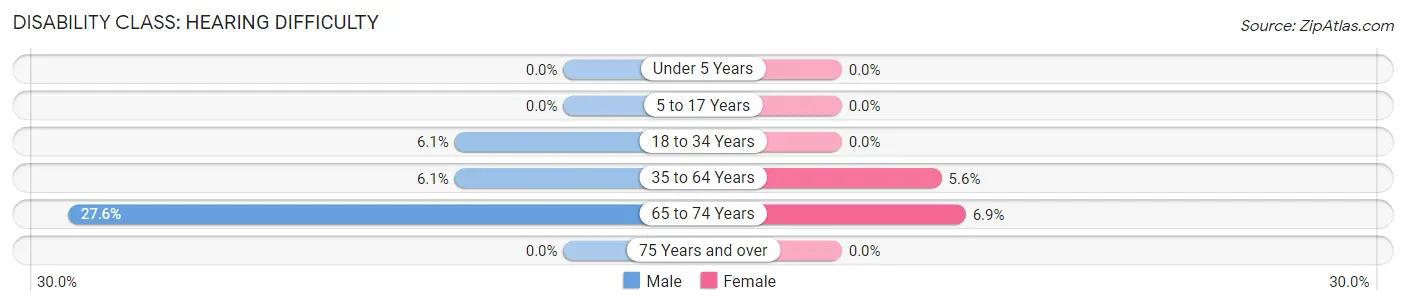
| Age Bracket | Male | Female |
| Under 5 Years | 0 (0.0%) | 0 (0.0%) |
| 5 to 17 Years | 0 (0.0%) | 0 (0.0%) |
| 18 to 34 Years | 4 (6.1%) | 0 (0.0%) |
| 35 to 64 Years | 4 (6.1%) | 3 (5.6%) |
| 65 to 74 Years | 8 (27.6%) | 2 (6.9%) |
| 75 Years and over | 0 (0.0%) | 0 (0.0%) |
Disability Class: Vision Difficulty
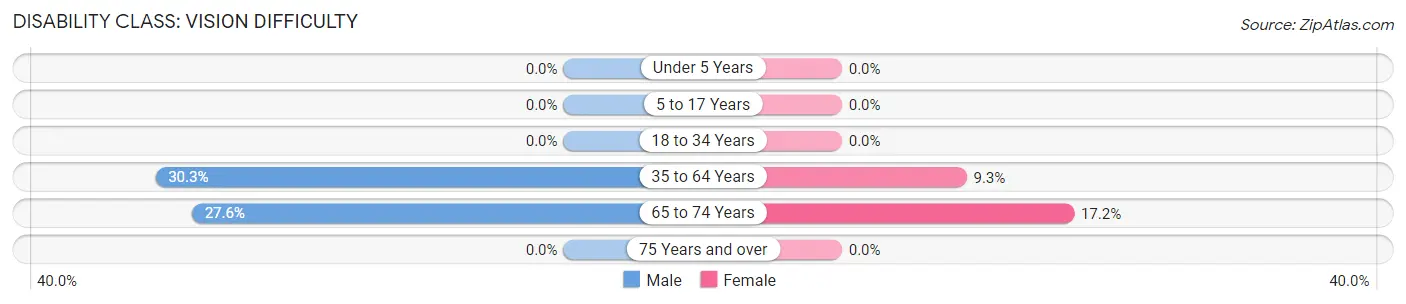
| Age Bracket | Male | Female |
| Under 5 Years | 0 (0.0%) | 0 (0.0%) |
| 5 to 17 Years | 0 (0.0%) | 0 (0.0%) |
| 18 to 34 Years | 0 (0.0%) | 0 (0.0%) |
| 35 to 64 Years | 20 (30.3%) | 5 (9.3%) |
| 65 to 74 Years | 8 (27.6%) | 5 (17.2%) |
| 75 Years and over | 0 (0.0%) | 0 (0.0%) |
Disability Class: Cognitive Difficulty
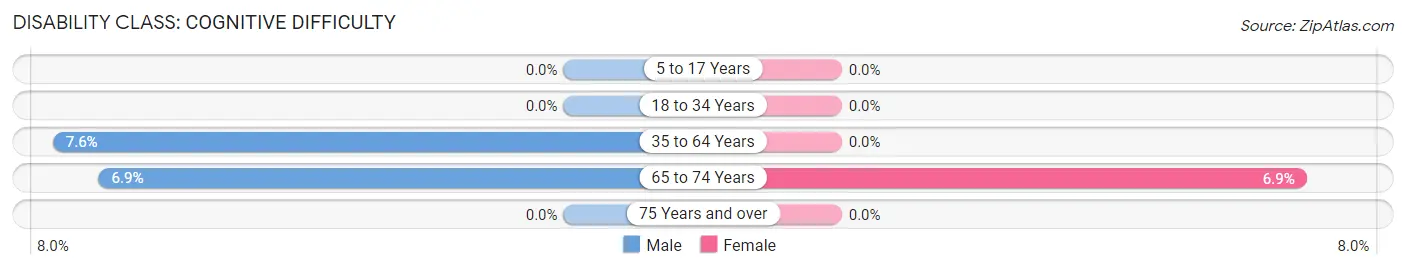
| Age Bracket | Male | Female |
| 5 to 17 Years | 0 (0.0%) | 0 (0.0%) |
| 18 to 34 Years | 0 (0.0%) | 0 (0.0%) |
| 35 to 64 Years | 5 (7.6%) | 0 (0.0%) |
| 65 to 74 Years | 2 (6.9%) | 2 (6.9%) |
| 75 Years and over | 0 (0.0%) | 0 (0.0%) |
Disability Class: Ambulatory Difficulty
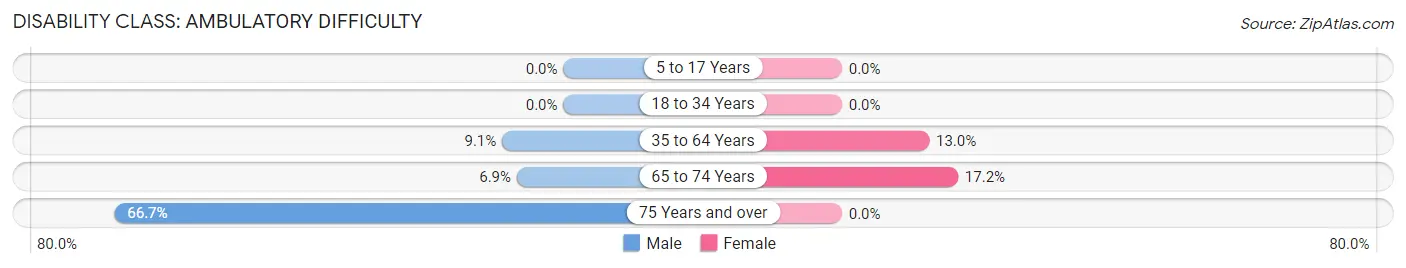
| Age Bracket | Male | Female |
| 5 to 17 Years | 0 (0.0%) | 0 (0.0%) |
| 18 to 34 Years | 0 (0.0%) | 0 (0.0%) |
| 35 to 64 Years | 6 (9.1%) | 7 (13.0%) |
| 65 to 74 Years | 2 (6.9%) | 5 (17.2%) |
| 75 Years and over | 4 (66.7%) | 0 (0.0%) |
Disability Class: Self-Care Difficulty
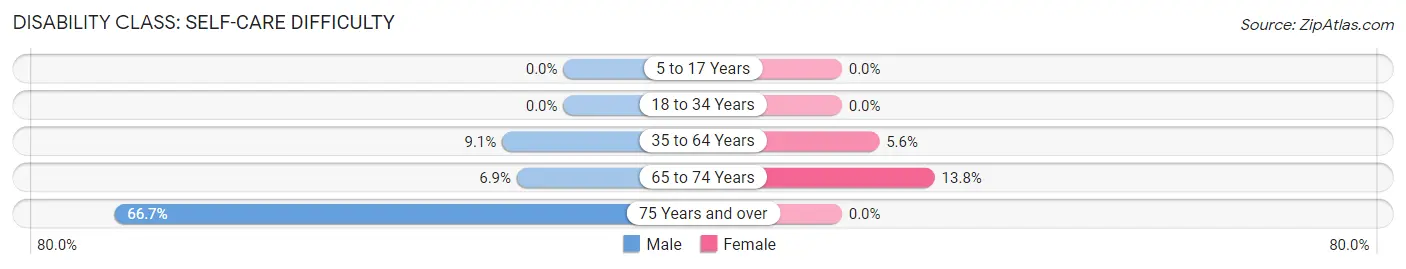
| Age Bracket | Male | Female |
| 5 to 17 Years | 0 (0.0%) | 0 (0.0%) |
| 18 to 34 Years | 0 (0.0%) | 0 (0.0%) |
| 35 to 64 Years | 6 (9.1%) | 3 (5.6%) |
| 65 to 74 Years | 2 (6.9%) | 4 (13.8%) |
| 75 Years and over | 4 (66.7%) | 0 (0.0%) |
Technology Access in Eutawville
Computing Device Access in Eutawville
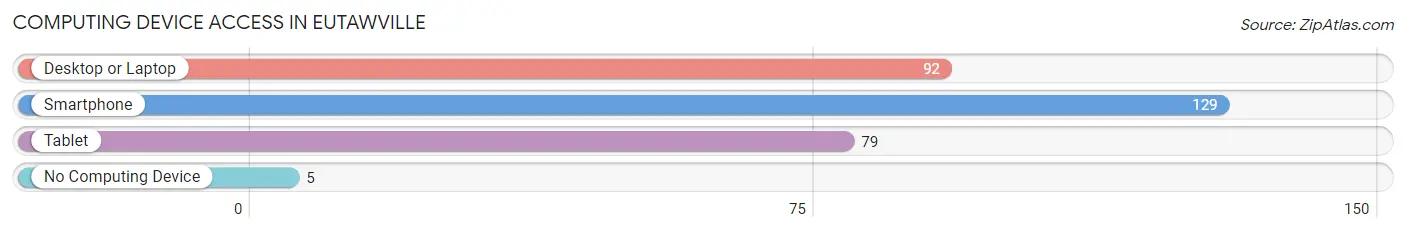
| Device Type | # Households | % Households |
| Desktop or Laptop | 92 | 67.6% |
| Smartphone | 129 | 94.9% |
| Tablet | 79 | 58.1% |
| No Computing Device | 5 | 3.7% |
| Total | 136 | 100.0% |
Internet Access in Eutawville
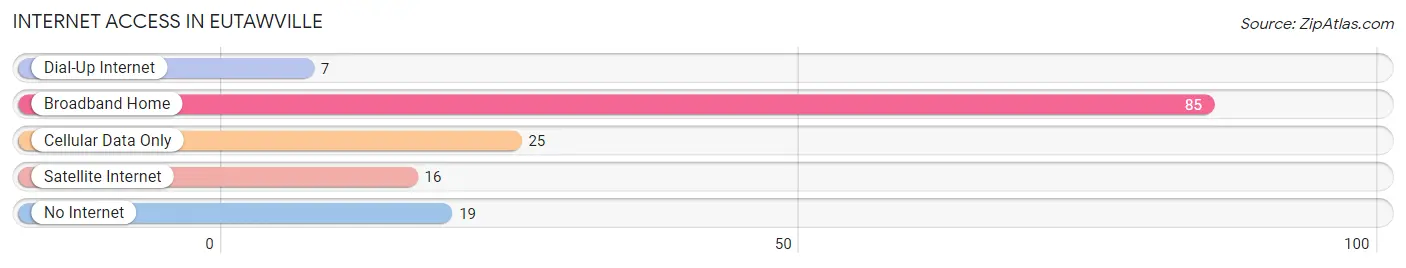
| Internet Type | # Households | % Households |
| Dial-Up Internet | 7 | 5.1% |
| Broadband Home | 85 | 62.5% |
| Cellular Data Only | 25 | 18.4% |
| Satellite Internet | 16 | 11.8% |
| No Internet | 19 | 14.0% |
| Total | 136 | 100.0% |
Eutawville Summary
Eutawville is a small town located in Orangeburg County, South Carolina. It is situated on the banks of Lake Marion, a large lake that is part of the Santee-Cooper system. The town is located about 30 miles south of Columbia, the state capital, and about 40 miles northwest of Charleston. The population of Eutawville was estimated to be 1,093 in 2019.
History
Eutawville was founded in 1820 by a group of settlers from the nearby town of Eutaw Springs. The town was named after the nearby Eutaw Springs, which was named after the Battle of Eutaw Springs, a Revolutionary War battle fought in 1781. The town was incorporated in 1883 and was a thriving agricultural center for many years.
Geography
Eutawville is located in the Piedmont region of South Carolina, which is characterized by rolling hills and flat plains. The town is situated on the banks of Lake Marion, a large lake that is part of the Santee-Cooper system. The lake is a popular destination for fishing, boating, and other recreational activities. The town is also located near the Edisto River, which is a popular destination for canoeing and kayaking.
Economy
Eutawville’s economy is largely based on agriculture. The town is home to several farms that produce a variety of crops, including corn, soybeans, cotton, and peanuts. The town is also home to several businesses, including a grocery store, a hardware store, and a few restaurants.
Demographics
As of the 2010 census, the population of Eutawville was 1,093. The racial makeup of the town was 79.3% White, 17.7% African American, 0.3% Native American, 0.3% Asian, 0.1% Pacific Islander, and 2.3% from other races. The median household income was $31,250, and the median family income was $37,500.
Conclusion
Eutawville is a small town located in Orangeburg County, South Carolina. It is situated on the banks of Lake Marion and is a popular destination for fishing, boating, and other recreational activities. The town’s economy is largely based on agriculture, and it is home to several businesses. The population of Eutawville was estimated to be 1,093 in 2019.
Common Questions
What is Per Capita Income in Eutawville?
Per Capita income in Eutawville is $22,347.
What is the Median Family Income in Eutawville?
Median Family Income in Eutawville is $87,950.
What is the Median Household income in Eutawville?
Median Household Income in Eutawville is $80,000.
What is Income or Wage Gap in Eutawville?
Income or Wage Gap in Eutawville is 11.9%.
Women in Eutawville earn 88.1 cents for every dollar earned by a man.
What is Inequality or Gini Index in Eutawville?
Inequality or Gini Index in Eutawville is 0.40.
What is the Total Population of Eutawville?
Total Population of Eutawville is 396.
What is the Total Male Population of Eutawville?
Total Male Population of Eutawville is 184.
What is the Total Female Population of Eutawville?
Total Female Population of Eutawville is 212.
What is the Ratio of Males per 100 Females in Eutawville?
There are 86.79 Males per 100 Females in Eutawville.
What is the Ratio of Females per 100 Males in Eutawville?
There are 115.22 Females per 100 Males in Eutawville.
What is the Median Population Age in Eutawville?
Median Population Age in Eutawville is 33.6 Years.
What is the Average Family Size in Eutawville
Average Family Size in Eutawville is 3.1 People.
What is the Average Household Size in Eutawville
Average Household Size in Eutawville is 2.9 People.
How Large is the Labor Force in Eutawville?
There are 190 People in the Labor Forcein in Eutawville.
What is the Percentage of People in the Labor Force in Eutawville?
61.5% of People are in the Labor Force in Eutawville.
What is the Unemployment Rate in Eutawville?
Unemployment Rate in Eutawville is 7.4%.