Lane, SC Map & Demographics
Lane Map
Lane Overview
$20,671
PER CAPITA INCOME
$37,188
AVG FAMILY INCOME
$35,658
AVG HOUSEHOLD INCOME
28.5%
WAGE / INCOME GAP [ % ]
71.5¢/ $1
WAGE / INCOME GAP [ $ ]
0.45
INEQUALITY / GINI INDEX
539
TOTAL POPULATION
289
MALE POPULATION
250
FEMALE POPULATION
115.60
MALES / 100 FEMALES
86.51
FEMALES / 100 MALES
54.3
MEDIAN AGE
3.8
AVG FAMILY SIZE
2.5
AVG HOUSEHOLD SIZE
179
LABOR FORCE [ PEOPLE ]
40.7%
PERCENT IN LABOR FORCE
5.6%
UNEMPLOYMENT RATE
Lane Zip Codes
Lane Area Codes
Income in Lane
Income Overview in Lane
Per Capita Income in Lane is $20,671, while median incomes of families and households are $37,188 and $35,658 respectively.
| Characteristic | Number | Measure |
| Per Capita Income | 539 | $20,671 |
| Median Family Income | 115 | $37,188 |
| Mean Family Income | 115 | $58,583 |
| Median Household Income | 216 | $35,658 |
| Mean Household Income | 216 | $44,175 |
| Income Deficit | 115 | $0 |
| Wage / Income Gap (%) | 539 | 28.52% |
| Wage / Income Gap ($) | 539 | 71.48¢ per $1 |
| Gini / Inequality Index | 539 | 0.45 |
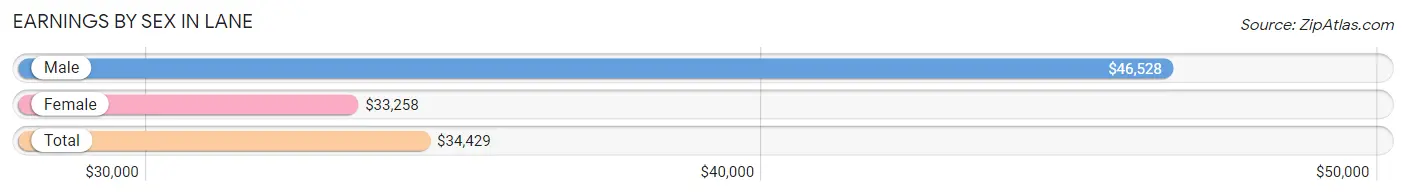
Earnings by Sex in Lane
Average Earnings in Lane are $34,429, $46,528 for men and $33,258 for women, a difference of 28.5%.
| Sex | Number | Average Earnings |
| Male | 112 (57.1%) | $46,528 |
| Female | 84 (42.9%) | $33,258 |
| Total | 196 (100.0%) | $34,429 |
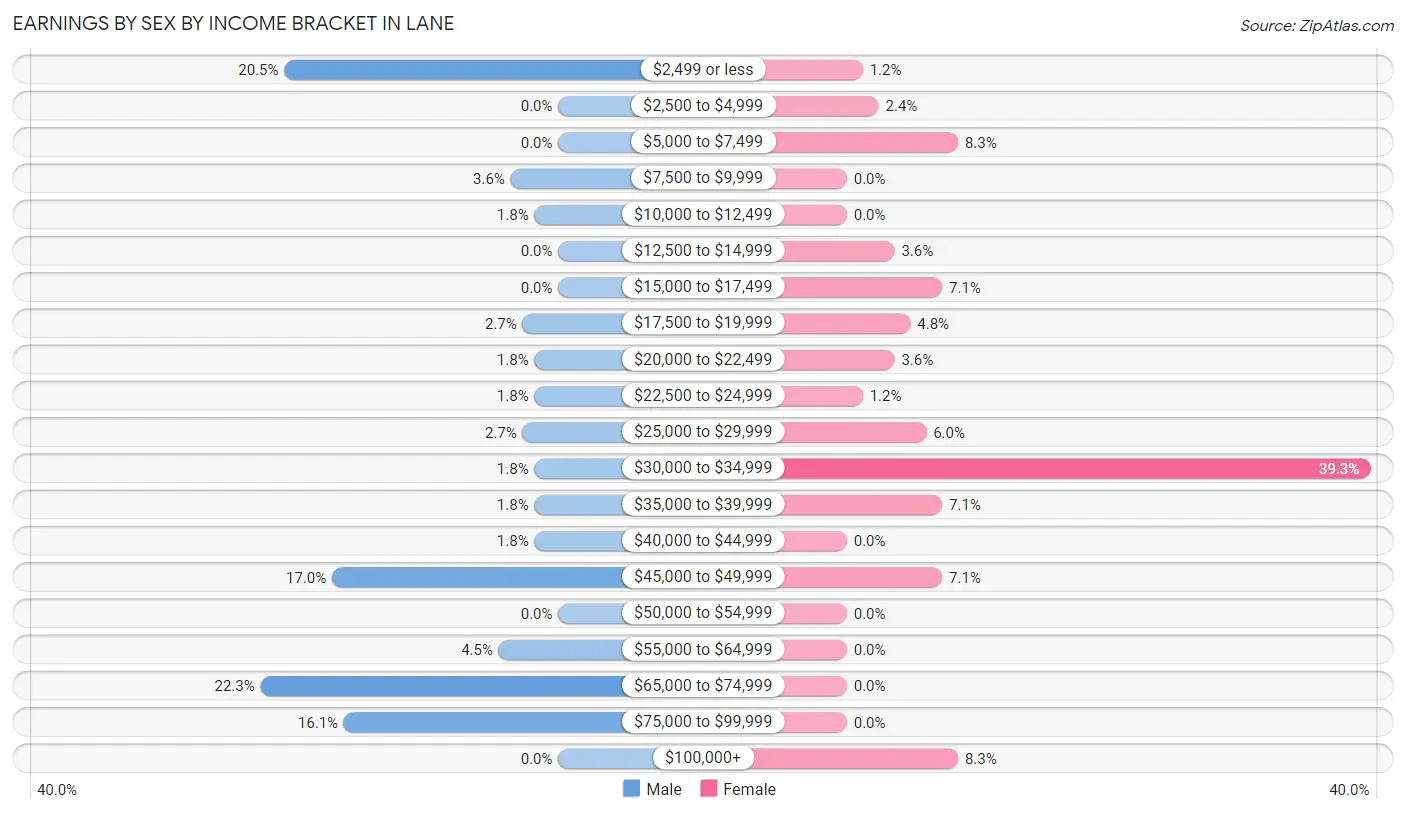
Earnings by Sex by Income Bracket in Lane
The most common earnings brackets in Lane are $65,000 to $74,999 for men (25 | 22.3%) and $30,000 to $34,999 for women (33 | 39.3%).
| Income | Male | Female |
| $2,499 or less | 23 (20.5%) | 1 (1.2%) |
| $2,500 to $4,999 | 0 (0.0%) | 2 (2.4%) |
| $5,000 to $7,499 | 0 (0.0%) | 7 (8.3%) |
| $7,500 to $9,999 | 4 (3.6%) | 0 (0.0%) |
| $10,000 to $12,499 | 2 (1.8%) | 0 (0.0%) |
| $12,500 to $14,999 | 0 (0.0%) | 3 (3.6%) |
| $15,000 to $17,499 | 0 (0.0%) | 6 (7.1%) |
| $17,500 to $19,999 | 3 (2.7%) | 4 (4.8%) |
| $20,000 to $22,499 | 2 (1.8%) | 3 (3.6%) |
| $22,500 to $24,999 | 2 (1.8%) | 1 (1.2%) |
| $25,000 to $29,999 | 3 (2.7%) | 5 (5.9%) |
| $30,000 to $34,999 | 2 (1.8%) | 33 (39.3%) |
| $35,000 to $39,999 | 2 (1.8%) | 6 (7.1%) |
| $40,000 to $44,999 | 2 (1.8%) | 0 (0.0%) |
| $45,000 to $49,999 | 19 (17.0%) | 6 (7.1%) |
| $50,000 to $54,999 | 0 (0.0%) | 0 (0.0%) |
| $55,000 to $64,999 | 5 (4.5%) | 0 (0.0%) |
| $65,000 to $74,999 | 25 (22.3%) | 0 (0.0%) |
| $75,000 to $99,999 | 18 (16.1%) | 0 (0.0%) |
| $100,000+ | 0 (0.0%) | 7 (8.3%) |
| Total | 112 (100.0%) | 84 (100.0%) |
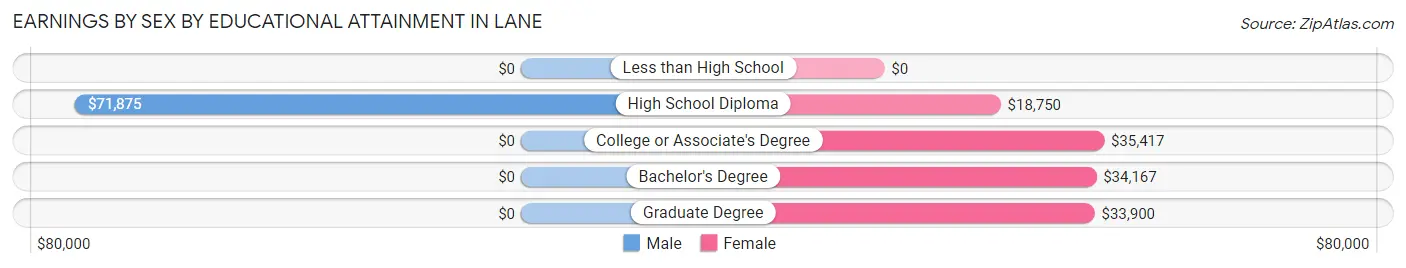
Earnings by Sex by Educational Attainment in Lane
Average earnings in Lane are $67,679 for men and $33,258 for women, a difference of 50.9%. Men with an educational attainment of high school diploma enjoy the highest average annual earnings of $71,875, while those with high school diploma education earn the least with $71,875. Women with an educational attainment of college or associate's degree earn the most with the average annual earnings of $35,417, while those with high school diploma education have the smallest earnings of $18,750.
| Educational Attainment | Male Income | Female Income |
| Less than High School | - | - |
| High School Diploma | $71,875 | $18,750 |
| College or Associate's Degree | - | - |
| Bachelor's Degree | - | - |
| Graduate Degree | - | - |
| Total | $67,679 | $33,258 |
Family Income in Lane
Family Income Brackets in Lane
According to the Lane family income data, there are 53 families falling into the $35,000 to $49,999 income range, which is the most common income bracket and makes up 46.1% of all families.
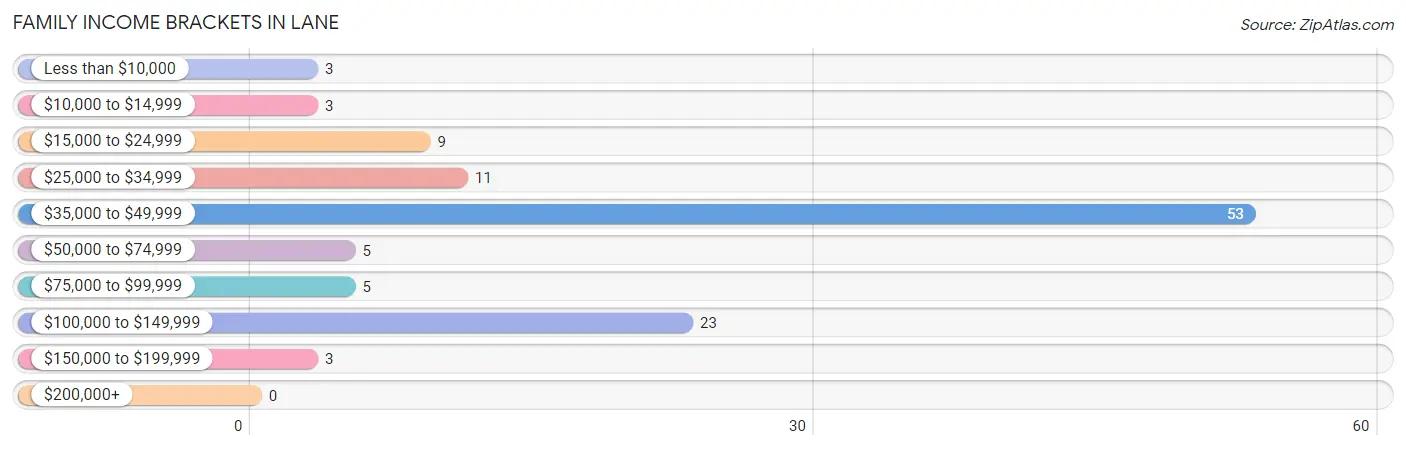
| Income Bracket | # Families | % Families |
| Less than $10,000 | 3 | 2.6% |
| $10,000 to $14,999 | 3 | 2.6% |
| $15,000 to $24,999 | 9 | 7.8% |
| $25,000 to $34,999 | 11 | 9.6% |
| $35,000 to $49,999 | 53 | 46.1% |
| $50,000 to $74,999 | 5 | 4.3% |
| $75,000 to $99,999 | 5 | 4.3% |
| $100,000 to $149,999 | 23 | 20.0% |
| $150,000 to $199,999 | 3 | 2.6% |
| $200,000+ | 0 | 0.0% |
Family Income by Famaliy Size in Lane
2-person families (38 | 33.0%) account for the highest median family income in Lane with $45,227 per family, while 2-person families (38 | 33.0%) have the highest median income of $22,614 per family member.
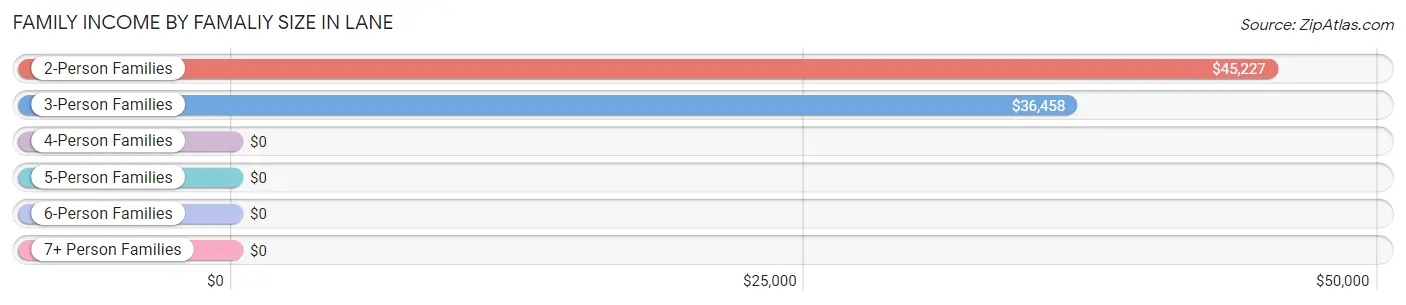
| Income Bracket | # Families | Median Income |
| 2-Person Families | 38 (33.0%) | $45,227 |
| 3-Person Families | 58 (50.4%) | $36,458 |
| 4-Person Families | 15 (13.0%) | $0 |
| 5-Person Families | 2 (1.7%) | $0 |
| 6-Person Families | 0 (0.0%) | $0 |
| 7+ Person Families | 2 (1.7%) | $0 |
| Total | 115 (100.0%) | $37,188 |
Family Income by Number of Earners in Lane
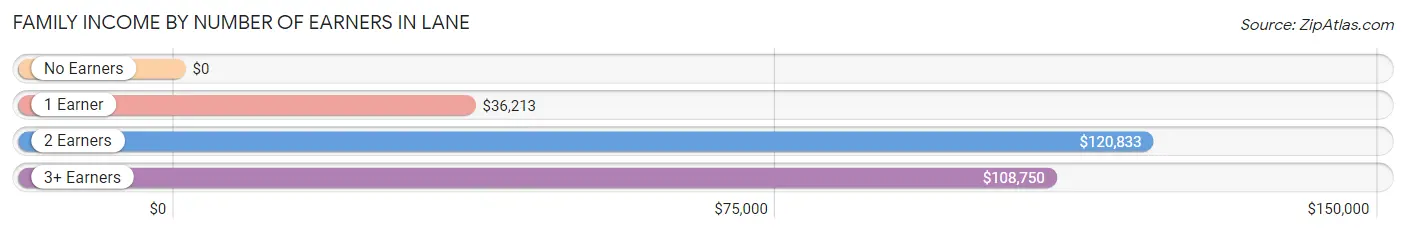
| Number of Earners | # Families | Median Income |
| No Earners | 38 (33.0%) | $0 |
| 1 Earner | 45 (39.1%) | $36,213 |
| 2 Earners | 22 (19.1%) | $120,833 |
| 3+ Earners | 10 (8.7%) | $108,750 |
| Total | 115 (100.0%) | $37,188 |
Household Income in Lane
Household Income Brackets in Lane
With 56 households falling in the category, the $35,000 to $49,999 income range is the most frequent in Lane, accounting for 25.9% of all households.
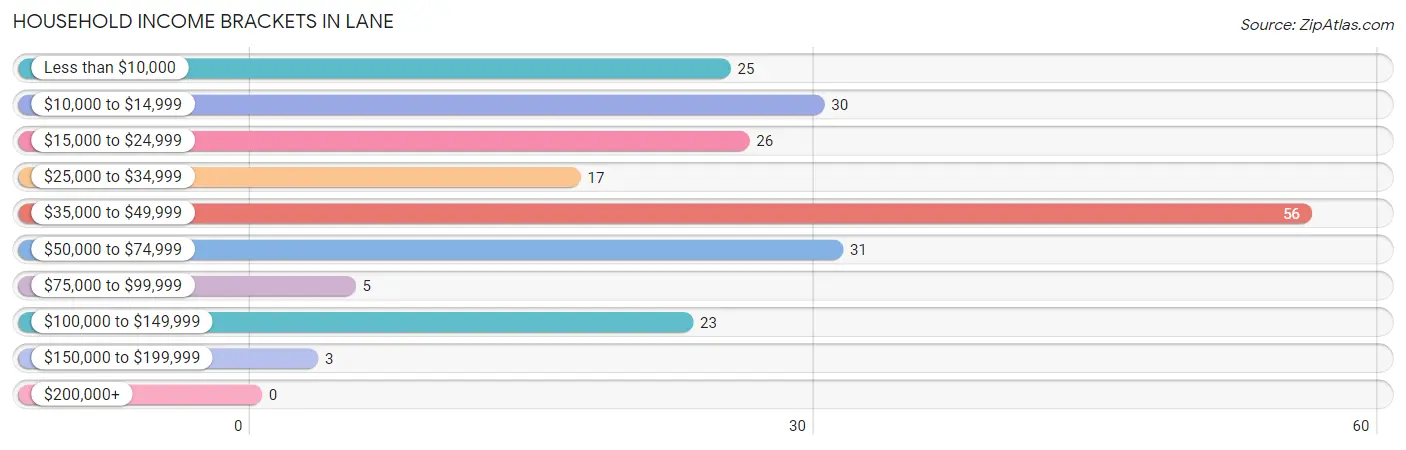
| Income Bracket | # Households | % Households |
| Less than $10,000 | 25 | 11.6% |
| $10,000 to $14,999 | 30 | 13.9% |
| $15,000 to $24,999 | 26 | 12.0% |
| $25,000 to $34,999 | 17 | 7.9% |
| $35,000 to $49,999 | 56 | 25.9% |
| $50,000 to $74,999 | 31 | 14.4% |
| $75,000 to $99,999 | 5 | 2.3% |
| $100,000 to $149,999 | 23 | 10.6% |
| $150,000 to $199,999 | 3 | 1.4% |
| $200,000+ | 0 | 0.0% |
Household Income by Householder Age in Lane
The median household income in Lane is $35,658, with the highest median household income of $67,880 found in the 45 to 64 years age bracket for the primary householder. A total of 89 households (41.2%) fall into this category.
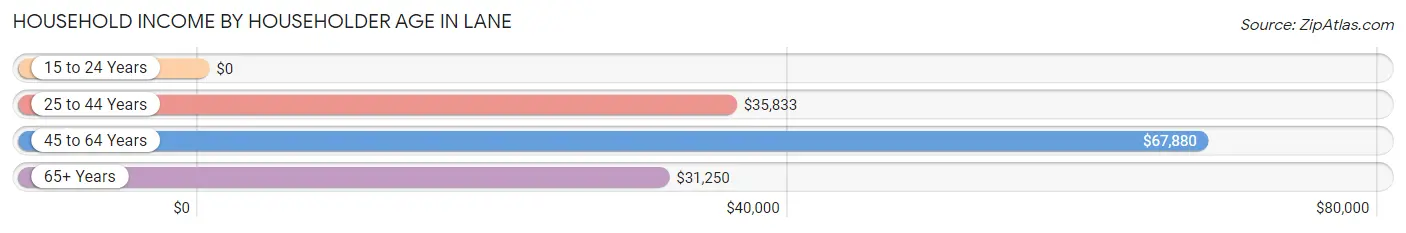
| Income Bracket | # Households | Median Income |
| 15 to 24 Years | 0 (0.0%) | $0 |
| 25 to 44 Years | 14 (6.5%) | $35,833 |
| 45 to 64 Years | 89 (41.2%) | $67,880 |
| 65+ Years | 113 (52.3%) | $31,250 |
| Total | 216 (100.0%) | $35,658 |
Poverty in Lane
Income Below Poverty by Sex and Age in Lane
With 13.2% poverty level for males and 8.4% for females among the residents of Lane, 45 to 54 year old males and under 5 year old females are the most vulnerable to poverty, with 20 males (28.2%) and 1 females (50.0%) in their respective age groups living below the poverty level.
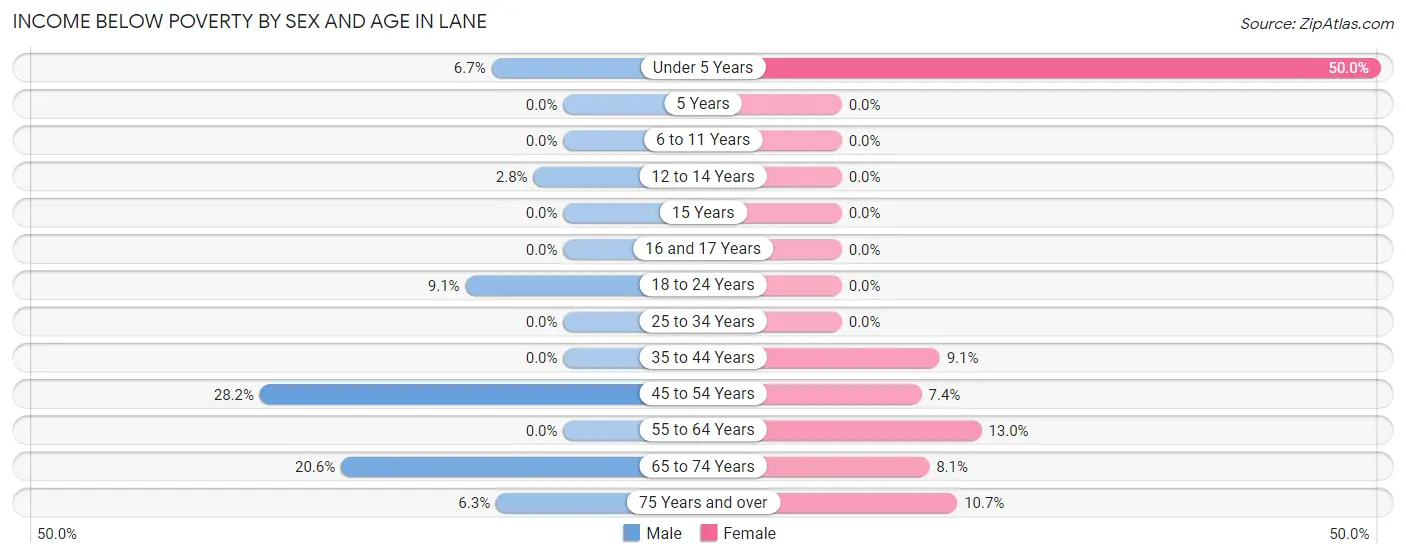
| Age Bracket | Male | Female |
| Under 5 Years | 1 (6.7%) | 1 (50.0%) |
| 5 Years | 0 (0.0%) | 0 (0.0%) |
| 6 to 11 Years | 0 (0.0%) | 0 (0.0%) |
| 12 to 14 Years | 1 (2.8%) | 0 (0.0%) |
| 15 Years | 0 (0.0%) | 0 (0.0%) |
| 16 and 17 Years | 0 (0.0%) | 0 (0.0%) |
| 18 to 24 Years | 2 (9.1%) | 0 (0.0%) |
| 25 to 34 Years | 0 (0.0%) | 0 (0.0%) |
| 35 to 44 Years | 0 (0.0%) | 2 (9.1%) |
| 45 to 54 Years | 20 (28.2%) | 2 (7.4%) |
| 55 to 64 Years | 0 (0.0%) | 7 (13.0%) |
| 65 to 74 Years | 13 (20.6%) | 6 (8.1%) |
| 75 Years and over | 1 (6.2%) | 3 (10.7%) |
| Total | 38 (13.2%) | 21 (8.4%) |
Income Above Poverty by Sex and Age in Lane
According to the poverty statistics in Lane, males aged 6 to 11 years and females aged 6 to 11 years are the age groups that are most secure financially, with 100.0% of males and 100.0% of females in these age groups living above the poverty line.
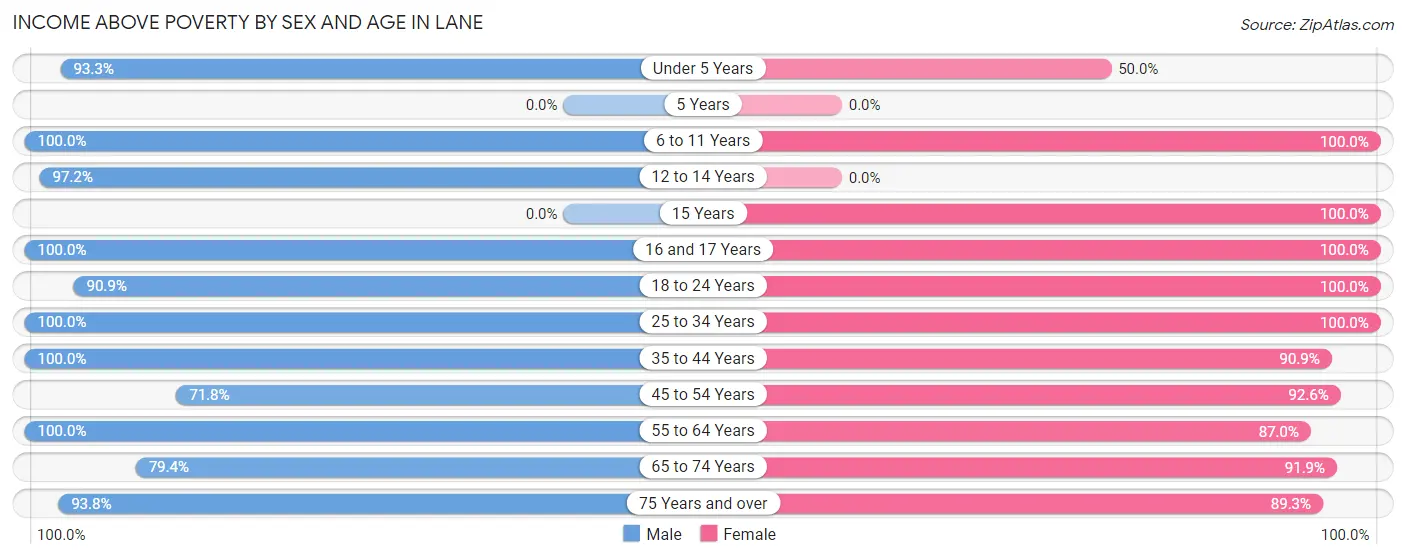
| Age Bracket | Male | Female |
| Under 5 Years | 14 (93.3%) | 1 (50.0%) |
| 5 Years | 0 (0.0%) | 0 (0.0%) |
| 6 to 11 Years | 33 (100.0%) | 9 (100.0%) |
| 12 to 14 Years | 35 (97.2%) | 0 (0.0%) |
| 15 Years | 0 (0.0%) | 4 (100.0%) |
| 16 and 17 Years | 13 (100.0%) | 10 (100.0%) |
| 18 to 24 Years | 20 (90.9%) | 7 (100.0%) |
| 25 to 34 Years | 2 (100.0%) | 13 (100.0%) |
| 35 to 44 Years | 9 (100.0%) | 20 (90.9%) |
| 45 to 54 Years | 51 (71.8%) | 25 (92.6%) |
| 55 to 64 Years | 9 (100.0%) | 47 (87.0%) |
| 65 to 74 Years | 50 (79.4%) | 68 (91.9%) |
| 75 Years and over | 15 (93.8%) | 25 (89.3%) |
| Total | 251 (86.9%) | 229 (91.6%) |
Income Below Poverty Among Married-Couple Families in Lane
The poverty statistics for married-couple families in Lane show that 4.0% or 3 of the total 76 families live below the poverty line. Families with no children have the highest poverty rate of 11.1%, comprising of 3 families. On the other hand, families with 1 or 2 children have the lowest poverty rate of 0.0%, which includes 0 families.
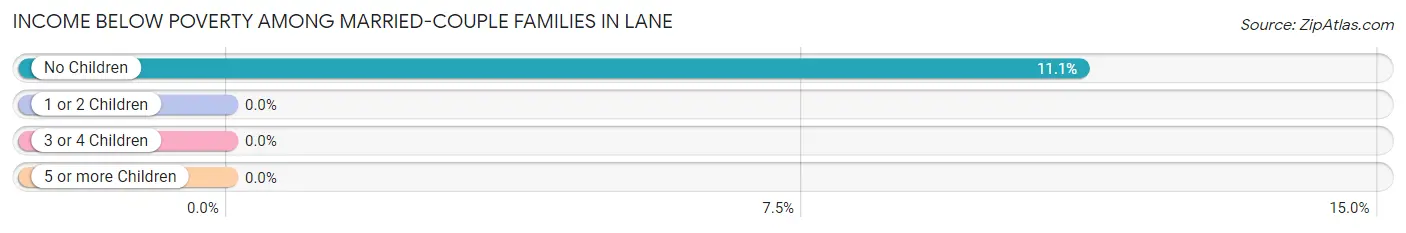
| Children | Above Poverty | Below Poverty |
| No Children | 24 (88.9%) | 3 (11.1%) |
| 1 or 2 Children | 49 (100.0%) | 0 (0.0%) |
| 3 or 4 Children | 0 (0.0%) | 0 (0.0%) |
| 5 or more Children | 0 (0.0%) | 0 (0.0%) |
| Total | 73 (96.1%) | 3 (4.0%) |
Income Below Poverty Among Single-Parent Households in Lane
According to the poverty data in Lane, 25.0% or 1 single-father households and 8.6% or 3 single-mother households are living below the poverty line. Among single-father households, those with 3 or 4 children have the highest poverty rate, with 1 households (100.0%) experiencing poverty. Likewise, among single-mother households, those with no children have the highest poverty rate, with 3 households (20.0%) falling below the poverty line.
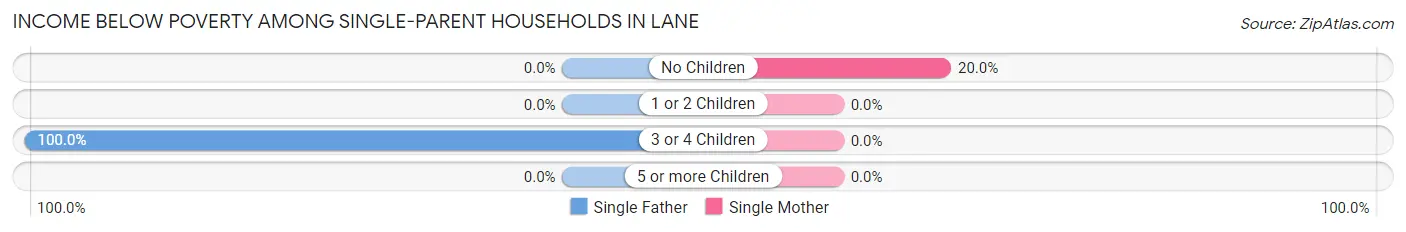
| Children | Single Father | Single Mother |
| No Children | 0 (0.0%) | 3 (20.0%) |
| 1 or 2 Children | 0 (0.0%) | 0 (0.0%) |
| 3 or 4 Children | 1 (100.0%) | 0 (0.0%) |
| 5 or more Children | 0 (0.0%) | 0 (0.0%) |
| Total | 1 (25.0%) | 3 (8.6%) |
Income Below Poverty Among Married-Couple vs Single-Parent Households in Lane
The poverty data for Lane shows that 3 of the married-couple family households (4.0%) and 4 of the single-parent households (10.3%) are living below the poverty level. Within the married-couple family households, those with no children have the highest poverty rate, with 3 households (11.1%) falling below the poverty line. Among the single-parent households, those with 3 or 4 children have the highest poverty rate, with 1 household (50.0%) living below poverty.
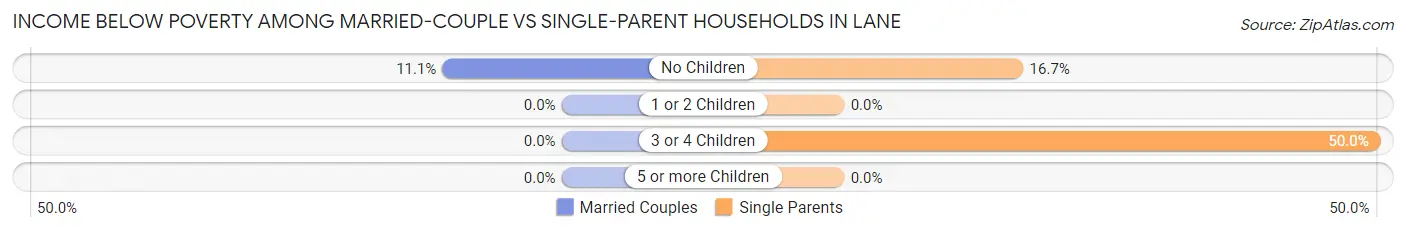
| Children | Married-Couple Families | Single-Parent Households |
| No Children | 3 (11.1%) | 3 (16.7%) |
| 1 or 2 Children | 0 (0.0%) | 0 (0.0%) |
| 3 or 4 Children | 0 (0.0%) | 1 (50.0%) |
| 5 or more Children | 0 (0.0%) | 0 (0.0%) |
| Total | 3 (4.0%) | 4 (10.3%) |
Race in Lane
The most populous races in Lane are Black / African American (416 | 77.2%), White / Caucasian (120 | 22.3%), and Two or more Races (3 | 0.6%).
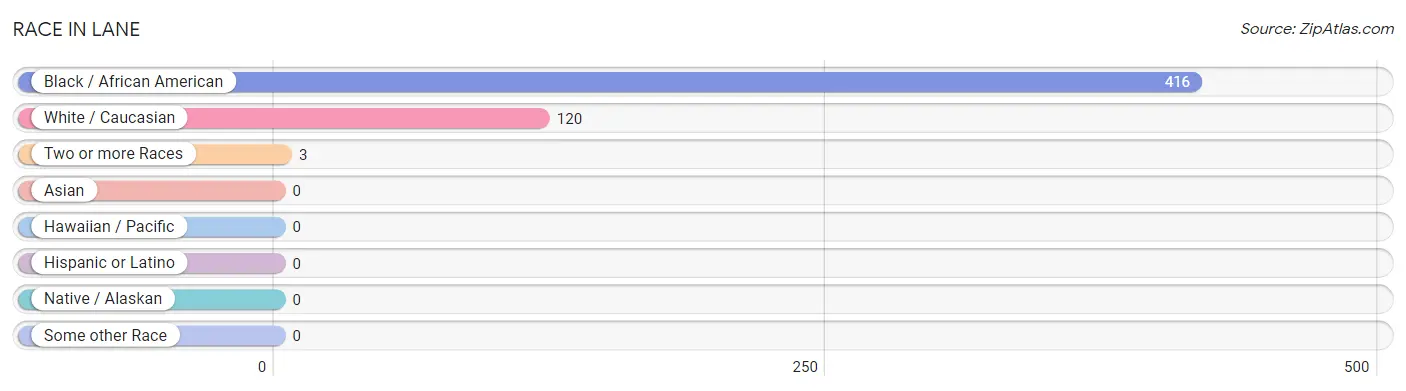
| Race | # Population | % Population |
| Asian | 0 | 0.0% |
| Black / African American | 416 | 77.2% |
| Hawaiian / Pacific | 0 | 0.0% |
| Hispanic or Latino | 0 | 0.0% |
| Native / Alaskan | 0 | 0.0% |
| White / Caucasian | 120 | 22.3% |
| Two or more Races | 3 | 0.6% |
| Some other Race | 0 | 0.0% |
| Total | 539 | 100.0% |
Ancestry in Lane
The most populous ancestries reported in Lane are Irish (28 | 5.2%), Jamaican (25 | 4.6%), Dutch (18 | 3.3%), Scottish (17 | 3.2%), and English (10 | 1.9%), together accounting for 18.2% of all Lane residents.
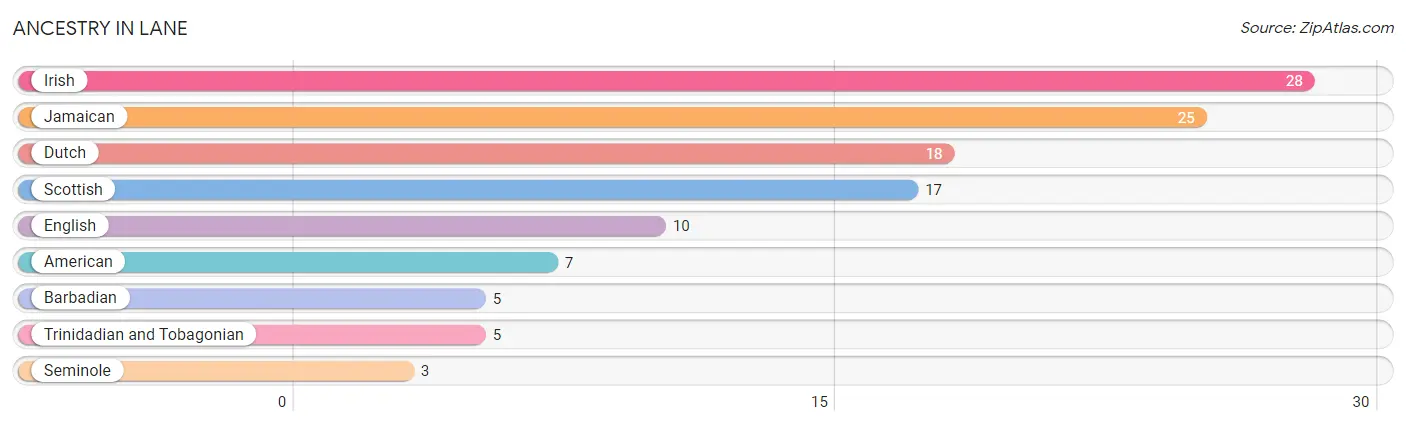
| Ancestry | # Population | % Population |
| American | 7 | 1.3% |
| Barbadian | 5 | 0.9% |
| Dutch | 18 | 3.3% |
| English | 10 | 1.9% |
| Irish | 28 | 5.2% |
| Jamaican | 25 | 4.6% |
| Scottish | 17 | 3.2% |
| Seminole | 3 | 0.6% |
| Trinidadian and Tobagonian | 5 | 0.9% | View All 9 Rows |
Immigrants in Lane

| Immigration Origin | # Population | % Population | View All 0 Rows |
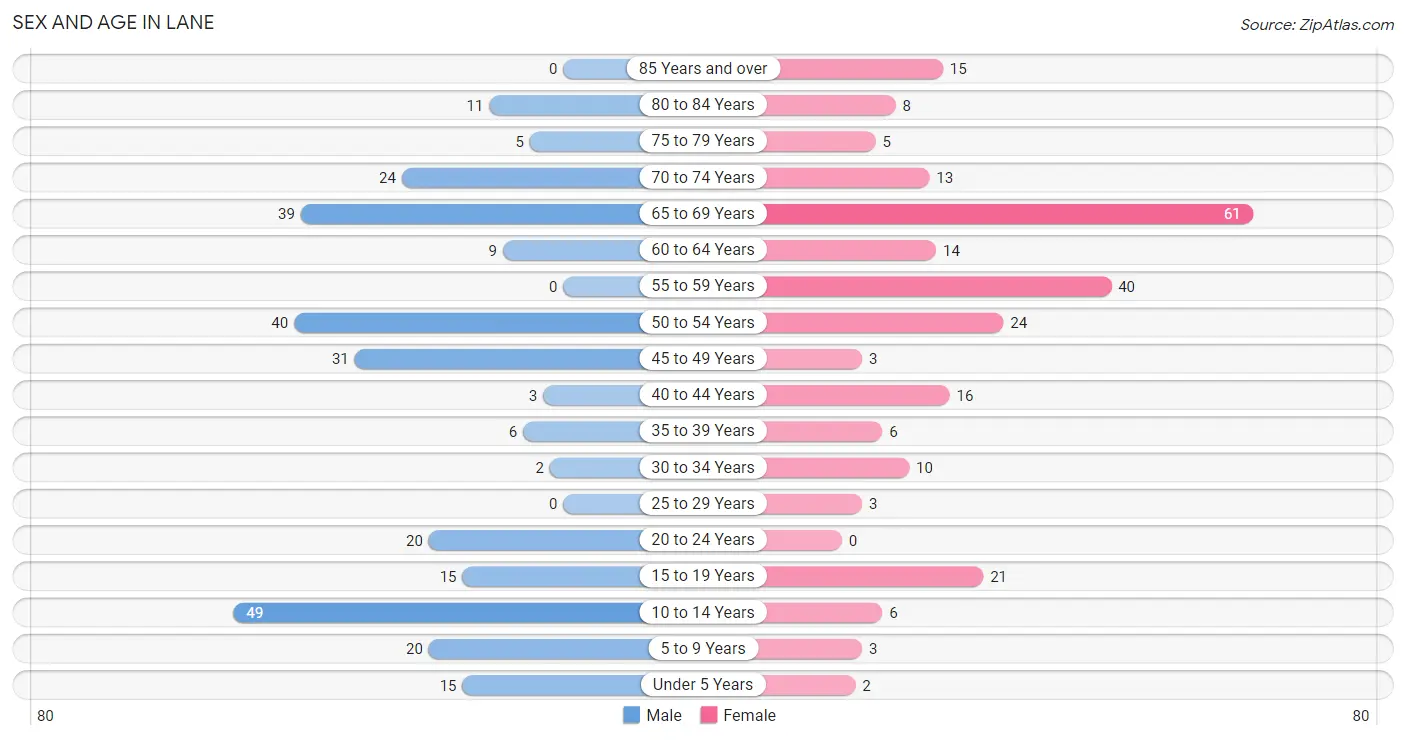
Sex and Age in Lane
Sex and Age in Lane
The most populous age groups in Lane are 10 to 14 Years (49 | 17.0%) for men and 65 to 69 Years (61 | 24.4%) for women.
| Age Bracket | Male | Female |
| Under 5 Years | 15 (5.2%) | 2 (0.8%) |
| 5 to 9 Years | 20 (6.9%) | 3 (1.2%) |
| 10 to 14 Years | 49 (17.0%) | 6 (2.4%) |
| 15 to 19 Years | 15 (5.2%) | 21 (8.4%) |
| 20 to 24 Years | 20 (6.9%) | 0 (0.0%) |
| 25 to 29 Years | 0 (0.0%) | 3 (1.2%) |
| 30 to 34 Years | 2 (0.7%) | 10 (4.0%) |
| 35 to 39 Years | 6 (2.1%) | 6 (2.4%) |
| 40 to 44 Years | 3 (1.0%) | 16 (6.4%) |
| 45 to 49 Years | 31 (10.7%) | 3 (1.2%) |
| 50 to 54 Years | 40 (13.8%) | 24 (9.6%) |
| 55 to 59 Years | 0 (0.0%) | 40 (16.0%) |
| 60 to 64 Years | 9 (3.1%) | 14 (5.6%) |
| 65 to 69 Years | 39 (13.5%) | 61 (24.4%) |
| 70 to 74 Years | 24 (8.3%) | 13 (5.2%) |
| 75 to 79 Years | 5 (1.7%) | 5 (2.0%) |
| 80 to 84 Years | 11 (3.8%) | 8 (3.2%) |
| 85 Years and over | 0 (0.0%) | 15 (6.0%) |
| Total | 289 (100.0%) | 250 (100.0%) |
Families and Households in Lane
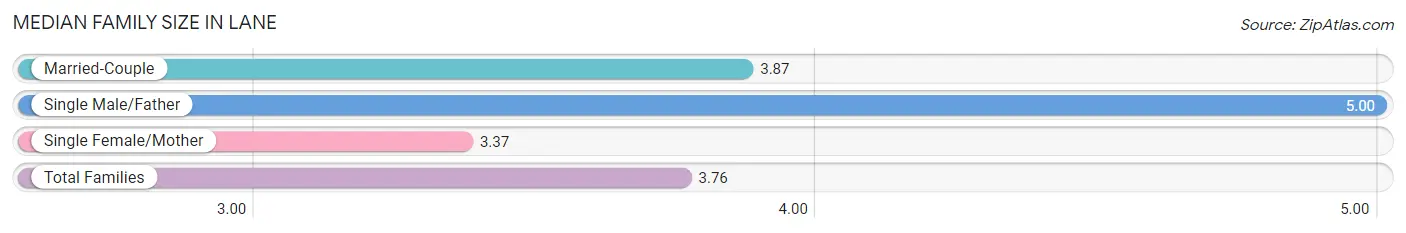
Median Family Size in Lane
The median family size in Lane is 3.76 persons per family, with single male/father families (4 | 3.5%) accounting for the largest median family size of 5 persons per family. On the other hand, single female/mother families (35 | 30.4%) represent the smallest median family size with 3.37 persons per family.
| Family Type | # Families | Family Size |
| Married-Couple | 76 (66.1%) | 3.87 |
| Single Male/Father | 4 (3.5%) | 5.00 |
| Single Female/Mother | 35 (30.4%) | 3.37 |
| Total Families | 115 (100.0%) | 3.76 |
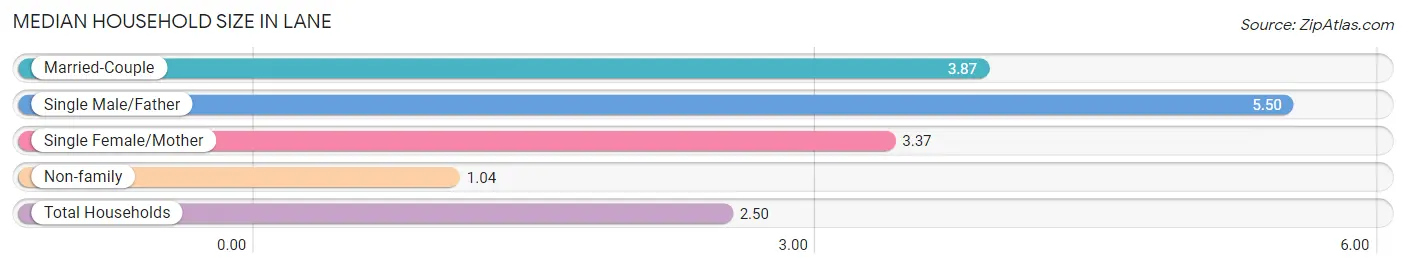
Median Household Size in Lane
The median household size in Lane is 2.50 persons per household, with single male/father households (4 | 1.8%) accounting for the largest median household size of 5.5 persons per household. non-family households (101 | 46.8%) represent the smallest median household size with 1.04 persons per household.
| Household Type | # Households | Household Size |
| Married-Couple | 76 (35.2%) | 3.87 |
| Single Male/Father | 4 (1.8%) | 5.50 |
| Single Female/Mother | 35 (16.2%) | 3.37 |
| Non-family | 101 (46.8%) | 1.04 |
| Total Households | 216 (100.0%) | 2.50 |
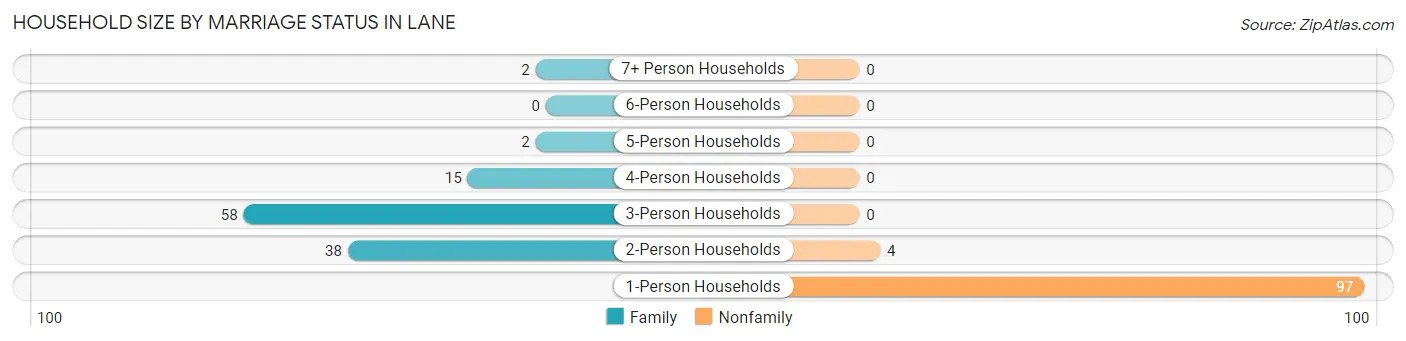
Household Size by Marriage Status in Lane
Out of a total of 216 households in Lane, 115 (53.2%) are family households, while 101 (46.8%) are nonfamily households. The most numerous type of family households are 3-person households, comprising 58, and the most common type of nonfamily households are 1-person households, comprising 97.
| Household Size | Family Households | Nonfamily Households |
| 1-Person Households | - | 97 (44.9%) |
| 2-Person Households | 38 (17.6%) | 4 (1.8%) |
| 3-Person Households | 58 (26.9%) | 0 (0.0%) |
| 4-Person Households | 15 (6.9%) | 0 (0.0%) |
| 5-Person Households | 2 (0.9%) | 0 (0.0%) |
| 6-Person Households | 0 (0.0%) | 0 (0.0%) |
| 7+ Person Households | 2 (0.9%) | 0 (0.0%) |
| Total | 115 (53.2%) | 101 (46.8%) |
Female Fertility in Lane
Fertility by Age in Lane
Average fertility rate in Lane is 27.0 births per 1,000 women. Women in the age bracket of 35 to 50 years have the highest fertility rate with 49.0 births per 1,000 women. Women in the age bracket of 35 to 50 years acount for 100.0% of all women with births.
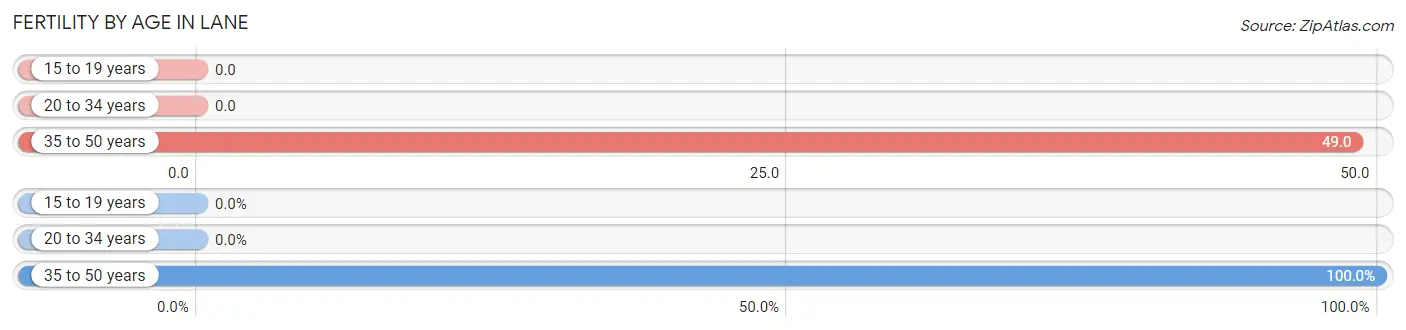
| Age Bracket | Women with Births | Births / 1,000 Women |
| 15 to 19 years | 0 (0.0%) | 0.0 |
| 20 to 34 years | 0 (0.0%) | 0.0 |
| 35 to 50 years | 2 (100.0%) | 49.0 |
| Total | 2 (100.0%) | 27.0 |
Fertility by Age by Marriage Status in Lane
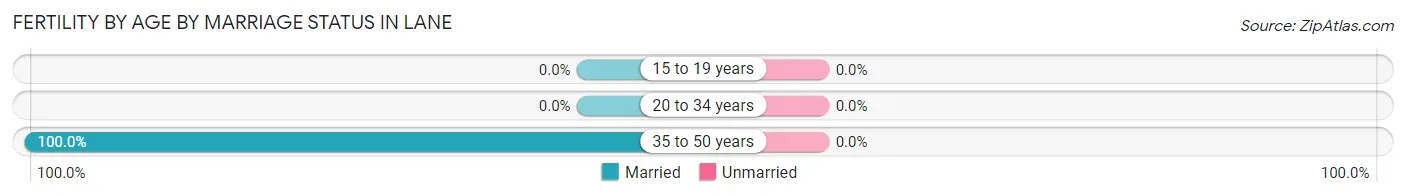
| Age Bracket | Married | Unmarried |
| 15 to 19 years | 0 (0.0%) | 0 (0.0%) |
| 20 to 34 years | 0 (0.0%) | 0 (0.0%) |
| 35 to 50 years | 2 (100.0%) | 0 (0.0%) |
| Total | 2 (100.0%) | 0 (0.0%) |
Fertility by Education in Lane
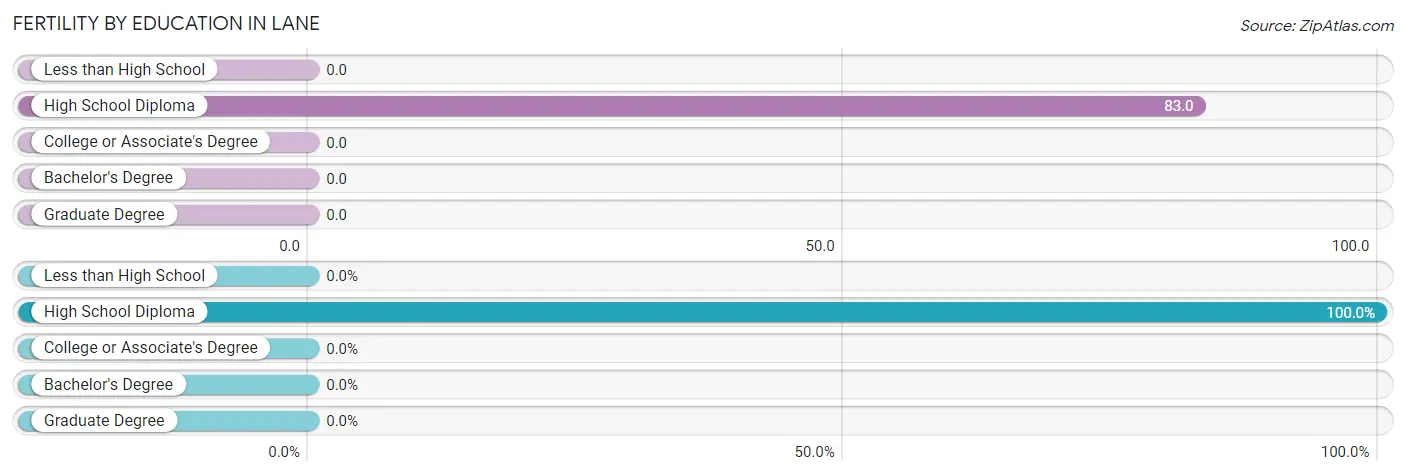
| Educational Attainment | Women with Births | Births / 1,000 Women |
| Less than High School | 0 (0.0%) | 0.0 |
| High School Diploma | 2 (100.0%) | 83.0 |
| College or Associate's Degree | 0 (0.0%) | 0.0 |
| Bachelor's Degree | 0 (0.0%) | 0.0 |
| Graduate Degree | 0 (0.0%) | 0.0 |
| Total | 2 (100.0%) | 27.0 |
Fertility by Education by Marriage Status in Lane
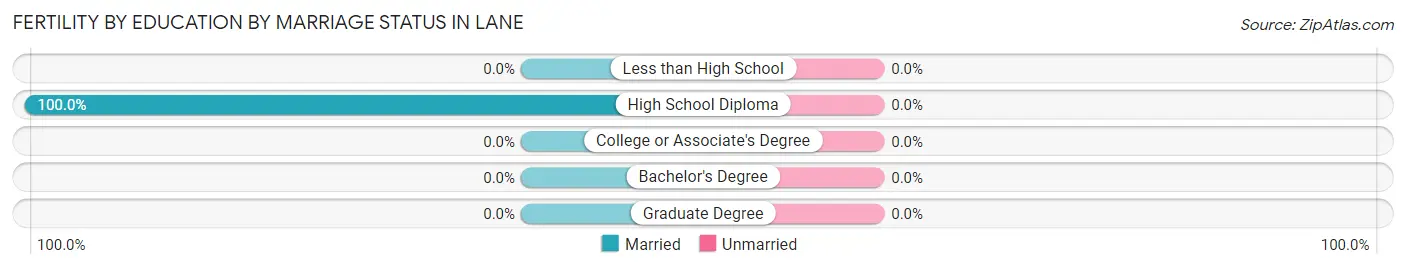
| Educational Attainment | Married | Unmarried |
| Less than High School | 0 (0.0%) | 0 (0.0%) |
| High School Diploma | 2 (100.0%) | 0 (0.0%) |
| College or Associate's Degree | 0 (0.0%) | 0 (0.0%) |
| Bachelor's Degree | 0 (0.0%) | 0 (0.0%) |
| Graduate Degree | 0 (0.0%) | 0 (0.0%) |
| Total | 2 (100.0%) | 0 (0.0%) |
Employment Characteristics in Lane
Employment by Class of Employer in Lane
Among the 151 employed individuals in Lane, private company employees (91 | 60.3%), state government employees (32 | 21.2%), and local government employees (9 | 6.0%) make up the most common classes of employment.
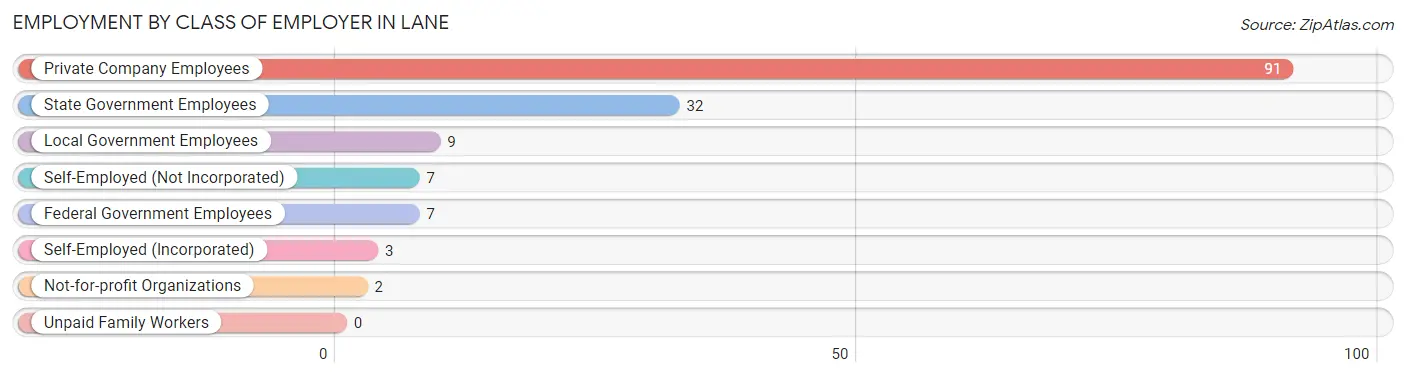
| Employer Class | # Employees | % Employees |
| Private Company Employees | 91 | 60.3% |
| Self-Employed (Incorporated) | 3 | 2.0% |
| Self-Employed (Not Incorporated) | 7 | 4.6% |
| Not-for-profit Organizations | 2 | 1.3% |
| Local Government Employees | 9 | 6.0% |
| State Government Employees | 32 | 21.2% |
| Federal Government Employees | 7 | 4.6% |
| Unpaid Family Workers | 0 | 0.0% |
| Total | 151 | 100.0% |
Employment Status by Age in Lane
According to the labor force statistics for Lane, out of the total population over 16 years of age (440), 40.7% or 179 individuals are in the labor force, with 5.6% or 10 of them unemployed. The age group with the highest labor force participation rate is 20 to 24 years, with 100.0% or 20 individuals in the labor force. Within the labor force, the 16 to 19 years age range has the highest percentage of unemployed individuals, with 100.0% or 5 of them being unemployed.
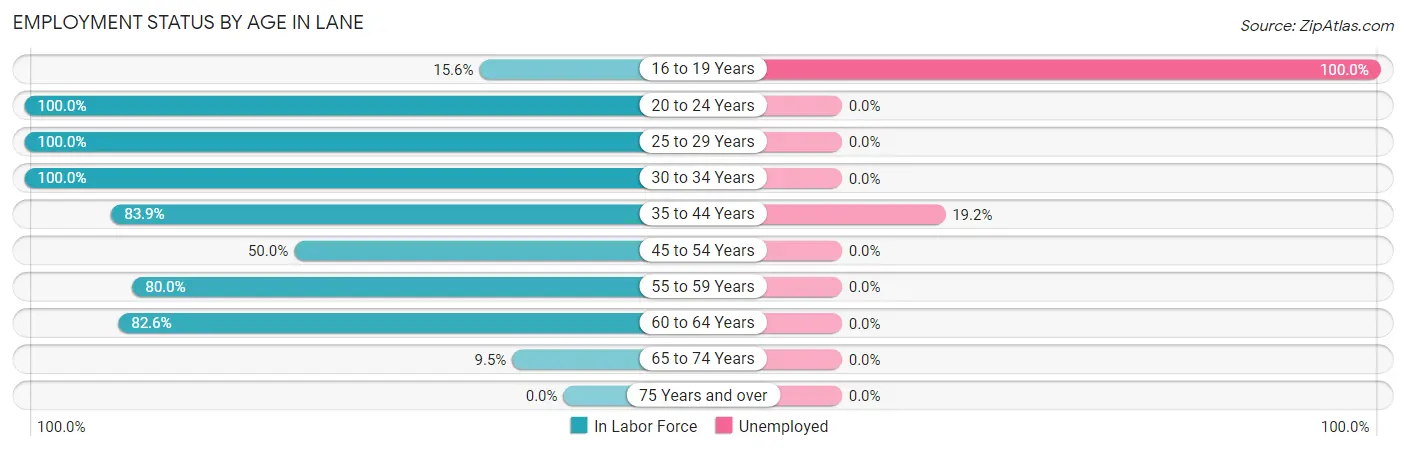
| Age Bracket | In Labor Force | Unemployed |
| 16 to 19 Years | 5 (15.6%) | 5 (100.0%) |
| 20 to 24 Years | 20 (100.0%) | 0 (0.0%) |
| 25 to 29 Years | 3 (100.0%) | 0 (0.0%) |
| 30 to 34 Years | 12 (100.0%) | 0 (0.0%) |
| 35 to 44 Years | 26 (83.9%) | 5 (19.2%) |
| 45 to 54 Years | 49 (50.0%) | 0 (0.0%) |
| 55 to 59 Years | 32 (80.0%) | 0 (0.0%) |
| 60 to 64 Years | 19 (82.6%) | 0 (0.0%) |
| 65 to 74 Years | 13 (9.5%) | 0 (0.0%) |
| 75 Years and over | 0 (0.0%) | 0 (0.0%) |
| Total | 179 (40.7%) | 10 (5.6%) |
Employment Status by Educational Attainment in Lane
According to labor force statistics for Lane, 68.1% of individuals (141) out of the total population between 25 and 64 years of age (207) are in the labor force, with 3.5% or 5 of them being unemployed. The group with the highest labor force participation rate are those with the educational attainment of bachelor's degree or higher, with 91.1% or 41 individuals in the labor force. Within the labor force, individuals with college / associate degree education have the highest percentage of unemployment, with 11.1% or 5 of them being unemployed.
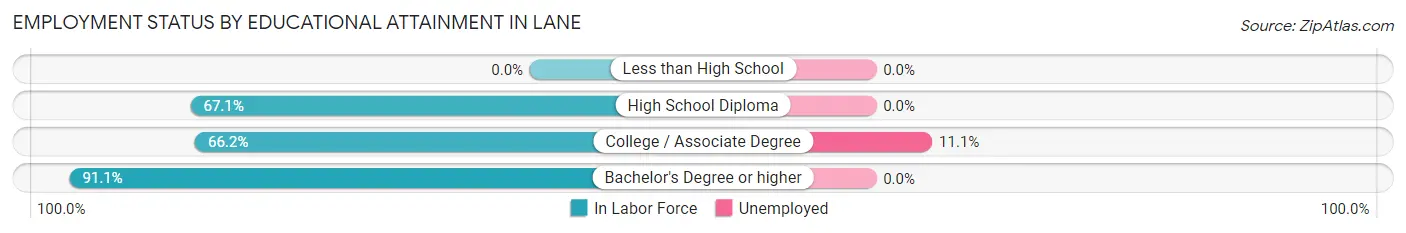
| Educational Attainment | In Labor Force | Unemployed |
| Less than High School | 0 (0.0%) | 0 (0.0%) |
| High School Diploma | 55 (67.1%) | 0 (0.0%) |
| College / Associate Degree | 45 (66.2%) | 8 (11.1%) |
| Bachelor's Degree or higher | 41 (91.1%) | 0 (0.0%) |
| Total | 141 (68.1%) | 7 (3.5%) |
Employment Occupations by Sex in Lane
Management, Business, Science and Arts Occupations
The most common Management, Business, Science and Arts occupations in Lane are Community & Social Service (35 | 20.7%), Education Instruction & Library (30 | 17.7%), Business & Financial (7 | 4.1%), Education, Arts & Media (5 | 3.0%), and Health Diagnosing & Treating (3 | 1.8%).
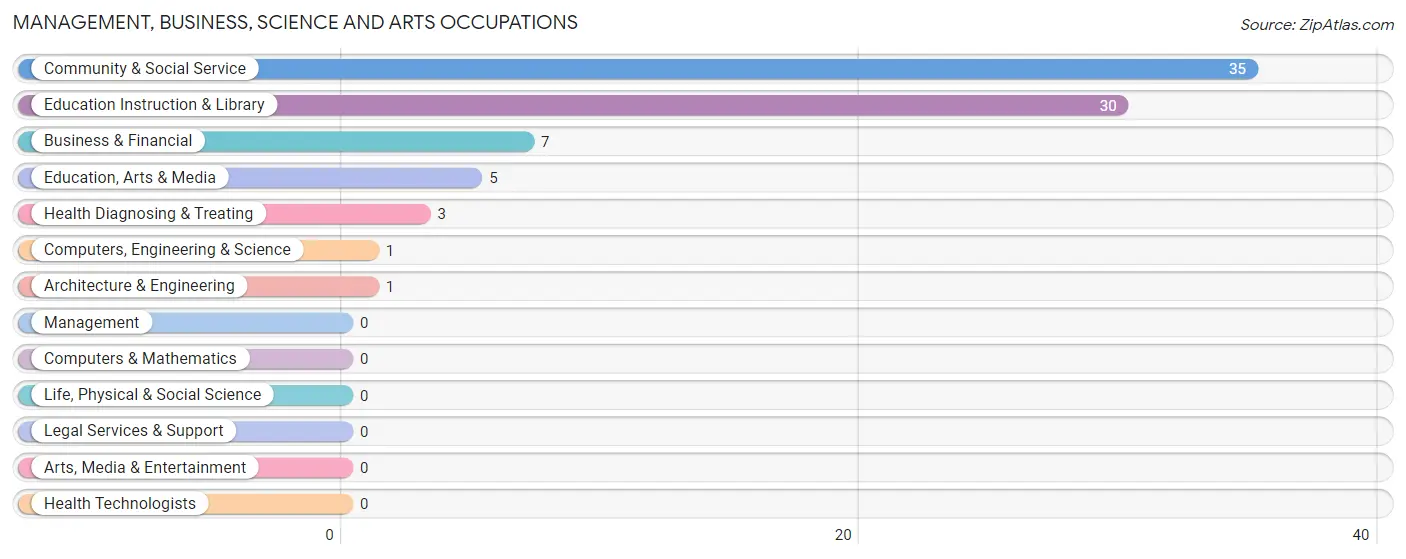
Management, Business, Science and Arts Occupations by Sex
Within the Management, Business, Science and Arts occupations in Lane, the most male-oriented occupations are Computers, Engineering & Science (100.0%), and Architecture & Engineering (100.0%), while the most female-oriented occupations are Business & Financial (100.0%), Community & Social Service (100.0%), and Education, Arts & Media (100.0%).
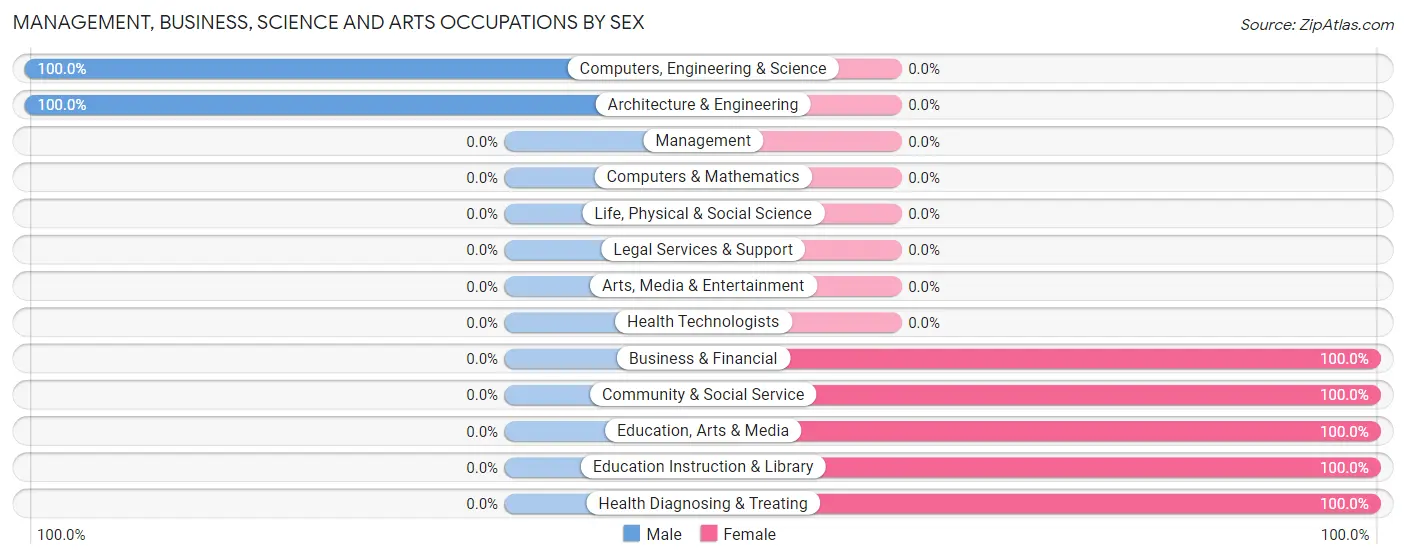
| Occupation | Male | Female |
| Management | 0 (0.0%) | 0 (0.0%) |
| Business & Financial | 0 (0.0%) | 7 (100.0%) |
| Computers, Engineering & Science | 1 (100.0%) | 0 (0.0%) |
| Computers & Mathematics | 0 (0.0%) | 0 (0.0%) |
| Architecture & Engineering | 1 (100.0%) | 0 (0.0%) |
| Life, Physical & Social Science | 0 (0.0%) | 0 (0.0%) |
| Community & Social Service | 0 (0.0%) | 35 (100.0%) |
| Education, Arts & Media | 0 (0.0%) | 5 (100.0%) |
| Legal Services & Support | 0 (0.0%) | 0 (0.0%) |
| Education Instruction & Library | 0 (0.0%) | 30 (100.0%) |
| Arts, Media & Entertainment | 0 (0.0%) | 0 (0.0%) |
| Health Diagnosing & Treating | 0 (0.0%) | 3 (100.0%) |
| Health Technologists | 0 (0.0%) | 0 (0.0%) |
| Total (Category) | 1 (2.2%) | 45 (97.8%) |
| Total (Overall) | 85 (50.3%) | 84 (49.7%) |
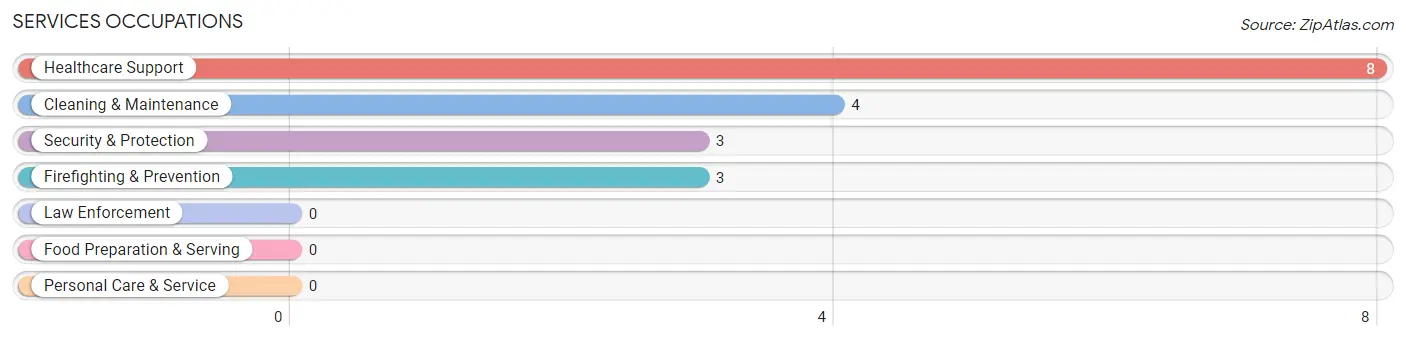
Services Occupations
The most common Services occupations in Lane are Healthcare Support (8 | 4.7%), Cleaning & Maintenance (4 | 2.4%), Security & Protection (3 | 1.8%), and Firefighting & Prevention (3 | 1.8%).
Services Occupations by Sex
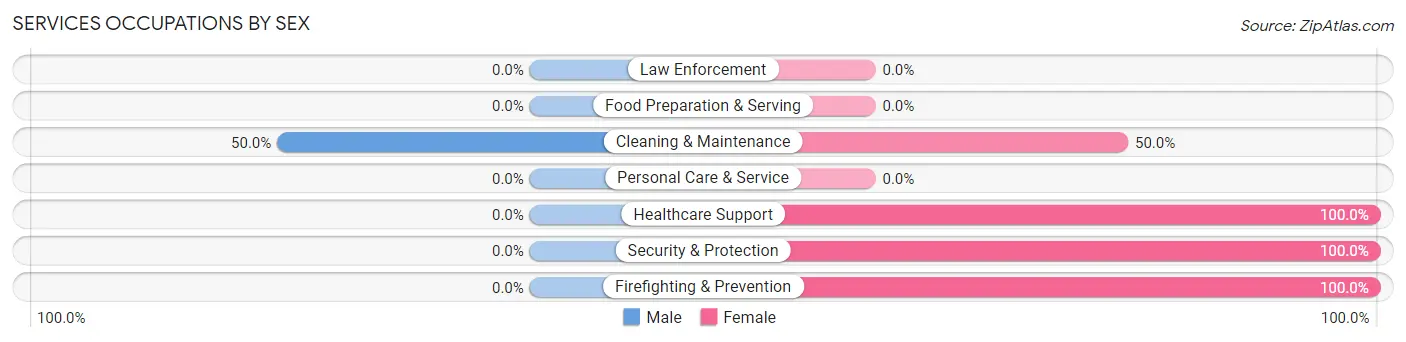
| Occupation | Male | Female |
| Healthcare Support | 0 (0.0%) | 8 (100.0%) |
| Security & Protection | 0 (0.0%) | 3 (100.0%) |
| Firefighting & Prevention | 0 (0.0%) | 3 (100.0%) |
| Law Enforcement | 0 (0.0%) | 0 (0.0%) |
| Food Preparation & Serving | 0 (0.0%) | 0 (0.0%) |
| Cleaning & Maintenance | 2 (50.0%) | 2 (50.0%) |
| Personal Care & Service | 0 (0.0%) | 0 (0.0%) |
| Total (Category) | 2 (13.3%) | 13 (86.7%) |
| Total (Overall) | 85 (50.3%) | 84 (49.7%) |
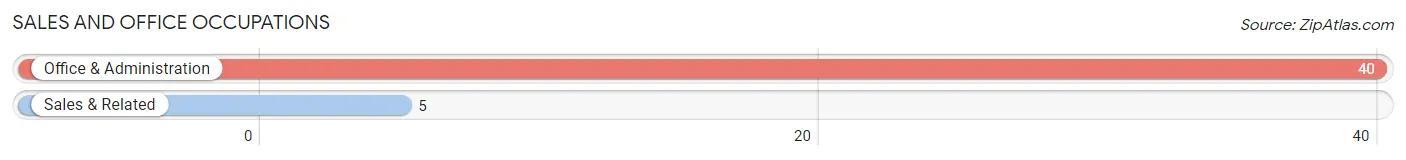
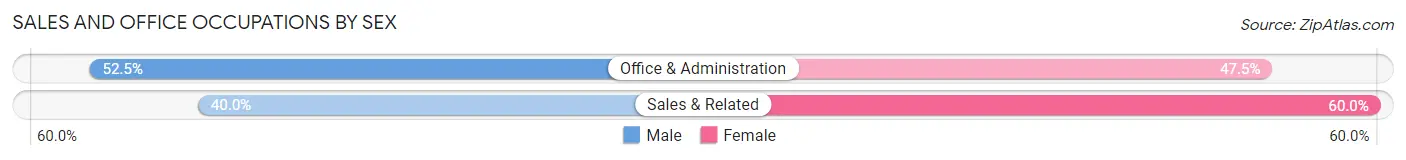
Sales and Office Occupations
The most common Sales and Office occupations in Lane are Office & Administration (40 | 23.7%), and Sales & Related (5 | 3.0%).
Sales and Office Occupations by Sex
| Occupation | Male | Female |
| Sales & Related | 2 (40.0%) | 3 (60.0%) |
| Office & Administration | 21 (52.5%) | 19 (47.5%) |
| Total (Category) | 23 (51.1%) | 22 (48.9%) |
| Total (Overall) | 85 (50.3%) | 84 (49.7%) |
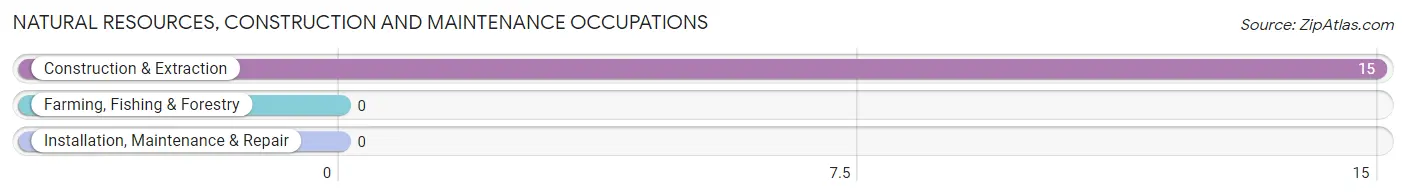
Natural Resources, Construction and Maintenance Occupations
The most common Natural Resources, Construction and Maintenance occupations in Lane are , and Construction & Extraction (15 | 8.9%).
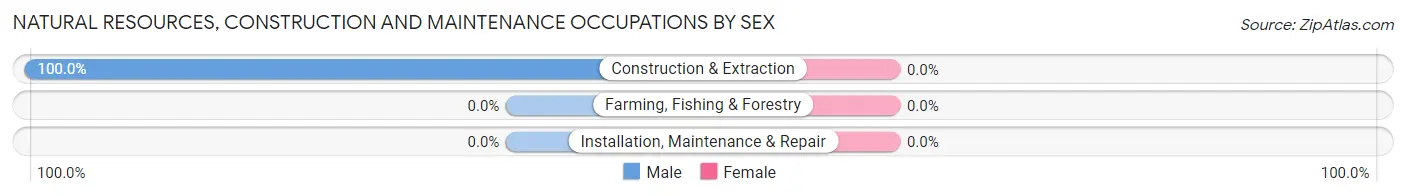
Natural Resources, Construction and Maintenance Occupations by Sex
| Occupation | Male | Female |
| Farming, Fishing & Forestry | 0 (0.0%) | 0 (0.0%) |
| Construction & Extraction | 15 (100.0%) | 0 (0.0%) |
| Installation, Maintenance & Repair | 0 (0.0%) | 0 (0.0%) |
| Total (Category) | 15 (100.0%) | 0 (0.0%) |
| Total (Overall) | 85 (50.3%) | 84 (49.7%) |
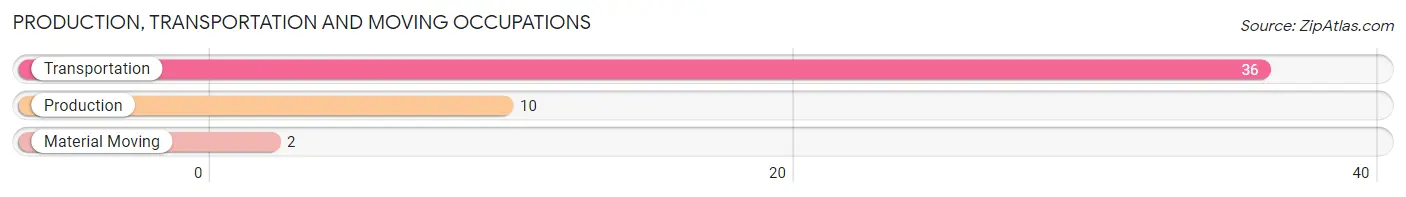
Production, Transportation and Moving Occupations
The most common Production, Transportation and Moving occupations in Lane are Transportation (36 | 21.3%), Production (10 | 5.9%), and Material Moving (2 | 1.2%).
Production, Transportation and Moving Occupations by Sex
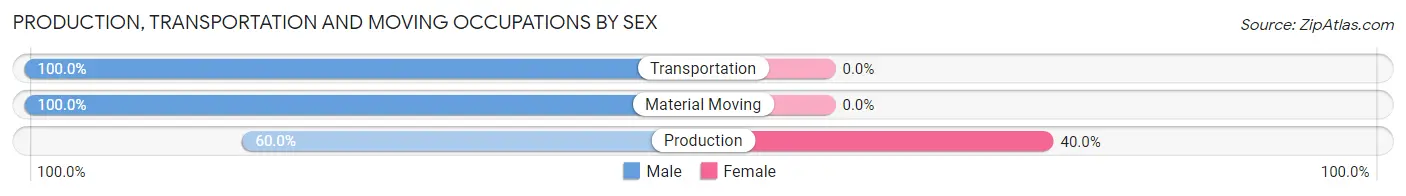
| Occupation | Male | Female |
| Production | 6 (60.0%) | 4 (40.0%) |
| Transportation | 36 (100.0%) | 0 (0.0%) |
| Material Moving | 2 (100.0%) | 0 (0.0%) |
| Total (Category) | 44 (91.7%) | 4 (8.3%) |
| Total (Overall) | 85 (50.3%) | 84 (49.7%) |
Employment Industries by Sex in Lane
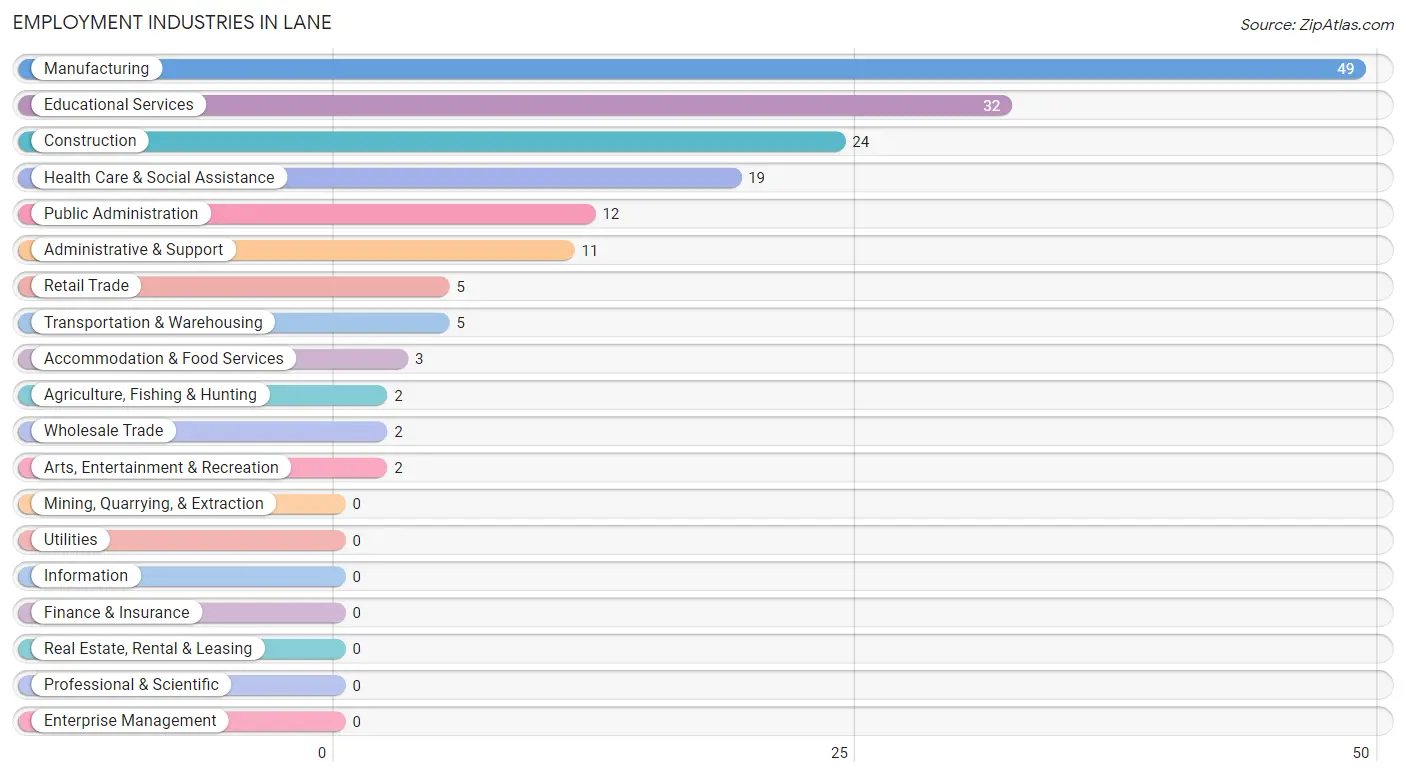
Employment Industries in Lane
The major employment industries in Lane include Manufacturing (49 | 29.0%), Educational Services (32 | 18.9%), Construction (24 | 14.2%), Health Care & Social Assistance (19 | 11.2%), and Public Administration (12 | 7.1%).
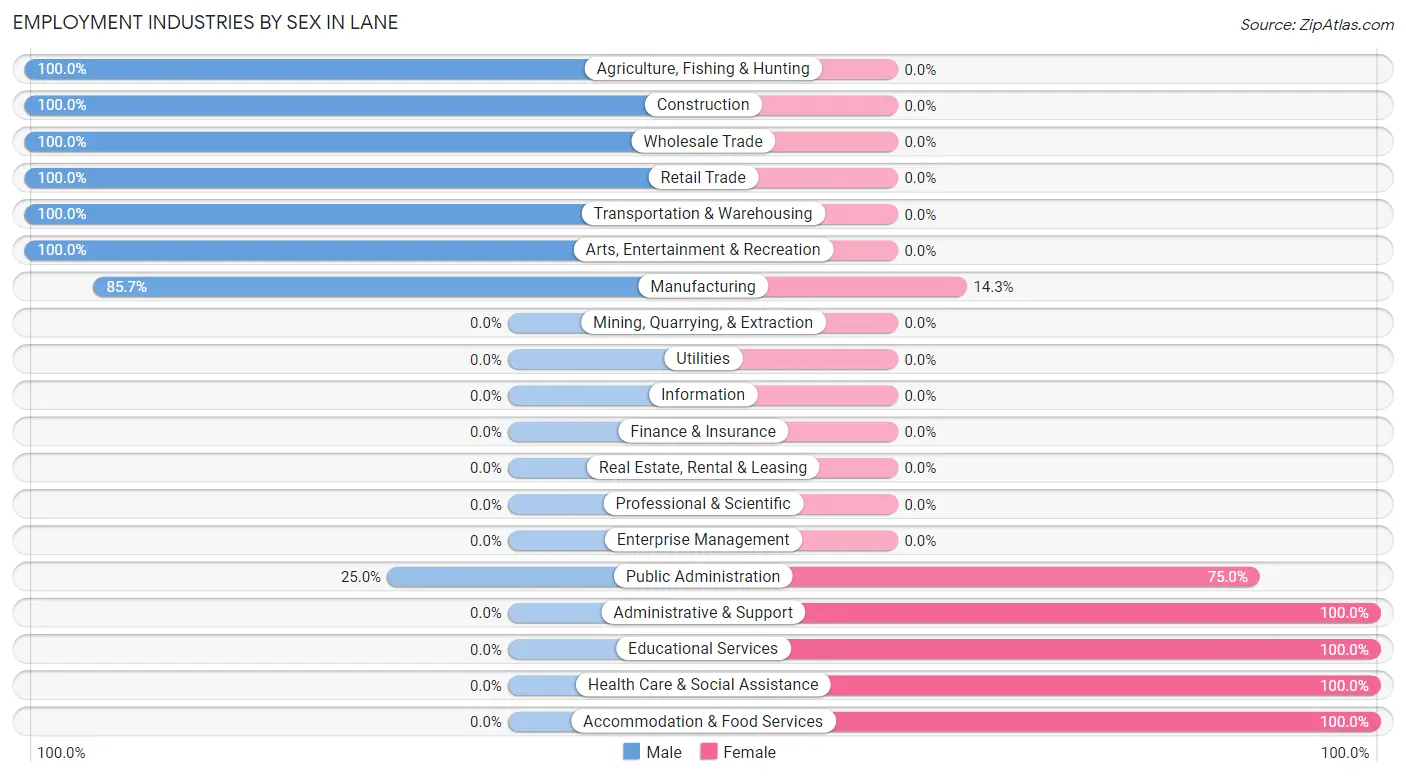
Employment Industries by Sex in Lane
The Lane industries that see more men than women are Agriculture, Fishing & Hunting (100.0%), Construction (100.0%), and Wholesale Trade (100.0%), whereas the industries that tend to have a higher number of women are Administrative & Support (100.0%), Educational Services (100.0%), and Health Care & Social Assistance (100.0%).
| Industry | Male | Female |
| Agriculture, Fishing & Hunting | 2 (100.0%) | 0 (0.0%) |
| Mining, Quarrying, & Extraction | 0 (0.0%) | 0 (0.0%) |
| Construction | 24 (100.0%) | 0 (0.0%) |
| Manufacturing | 42 (85.7%) | 7 (14.3%) |
| Wholesale Trade | 2 (100.0%) | 0 (0.0%) |
| Retail Trade | 5 (100.0%) | 0 (0.0%) |
| Transportation & Warehousing | 5 (100.0%) | 0 (0.0%) |
| Utilities | 0 (0.0%) | 0 (0.0%) |
| Information | 0 (0.0%) | 0 (0.0%) |
| Finance & Insurance | 0 (0.0%) | 0 (0.0%) |
| Real Estate, Rental & Leasing | 0 (0.0%) | 0 (0.0%) |
| Professional & Scientific | 0 (0.0%) | 0 (0.0%) |
| Enterprise Management | 0 (0.0%) | 0 (0.0%) |
| Administrative & Support | 0 (0.0%) | 11 (100.0%) |
| Educational Services | 0 (0.0%) | 32 (100.0%) |
| Health Care & Social Assistance | 0 (0.0%) | 19 (100.0%) |
| Arts, Entertainment & Recreation | 2 (100.0%) | 0 (0.0%) |
| Accommodation & Food Services | 0 (0.0%) | 3 (100.0%) |
| Public Administration | 3 (25.0%) | 9 (75.0%) |
| Total | 85 (50.3%) | 84 (49.7%) |
Education in Lane
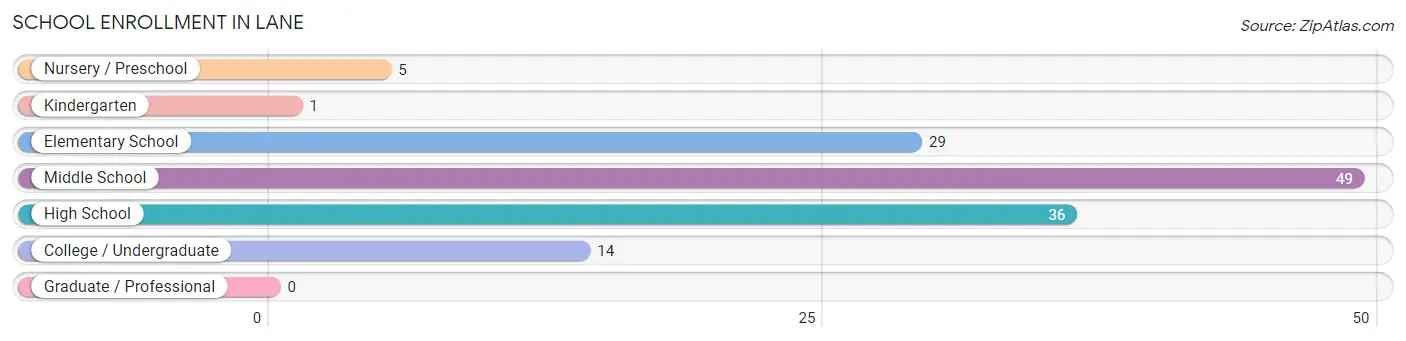
School Enrollment in Lane
The most common levels of schooling among the 134 students in Lane are middle school (49 | 36.6%), high school (36 | 26.9%), and elementary school (29 | 21.6%).
| School Level | # Students | % Students |
| Nursery / Preschool | 5 | 3.7% |
| Kindergarten | 1 | 0.7% |
| Elementary School | 29 | 21.6% |
| Middle School | 49 | 36.6% |
| High School | 36 | 26.9% |
| College / Undergraduate | 14 | 10.4% |
| Graduate / Professional | 0 | 0.0% |
| Total | 134 | 100.0% |
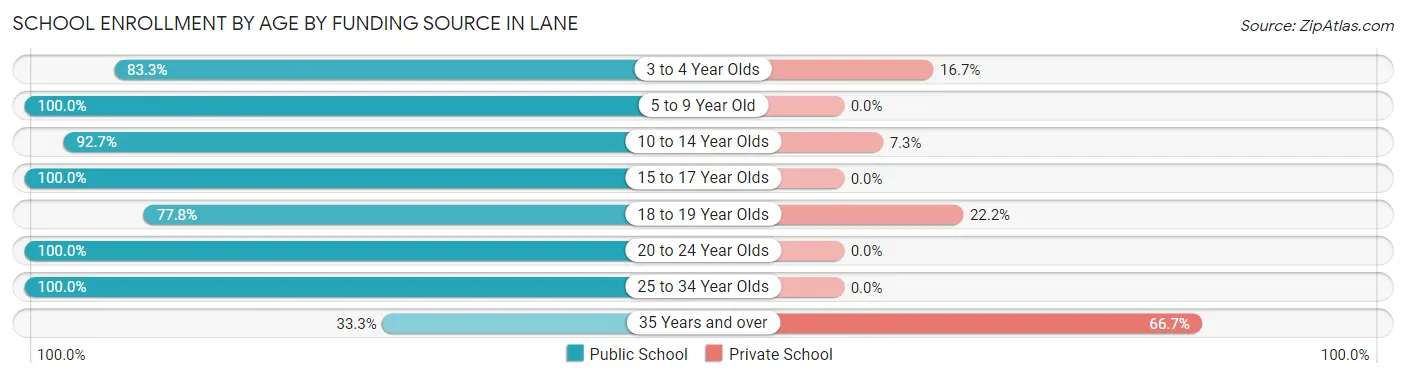
School Enrollment by Age by Funding Source in Lane
Out of a total of 134 students who are enrolled in schools in Lane, 13 (9.7%) attend a private institution, while the remaining 121 (90.3%) are enrolled in public schools. The age group of 35 years and over has the highest likelihood of being enrolled in private schools, with 6 (66.7% in the age bracket) enrolled. Conversely, the age group of 5 to 9 year old has the lowest likelihood of being enrolled in a private school, with 23 (100.0% in the age bracket) attending a public institution.
| Age Bracket | Public School | Private School |
| 3 to 4 Year Olds | 5 (83.3%) | 1 (16.7%) |
| 5 to 9 Year Old | 23 (100.0%) | 0 (0.0%) |
| 10 to 14 Year Olds | 51 (92.7%) | 4 (7.3%) |
| 15 to 17 Year Olds | 27 (100.0%) | 0 (0.0%) |
| 18 to 19 Year Olds | 7 (77.8%) | 2 (22.2%) |
| 20 to 24 Year Olds | 2 (100.0%) | 0 (0.0%) |
| 25 to 34 Year Olds | 3 (100.0%) | 0 (0.0%) |
| 35 Years and over | 3 (33.3%) | 6 (66.7%) |
| Total | 121 (90.3%) | 13 (9.7%) |
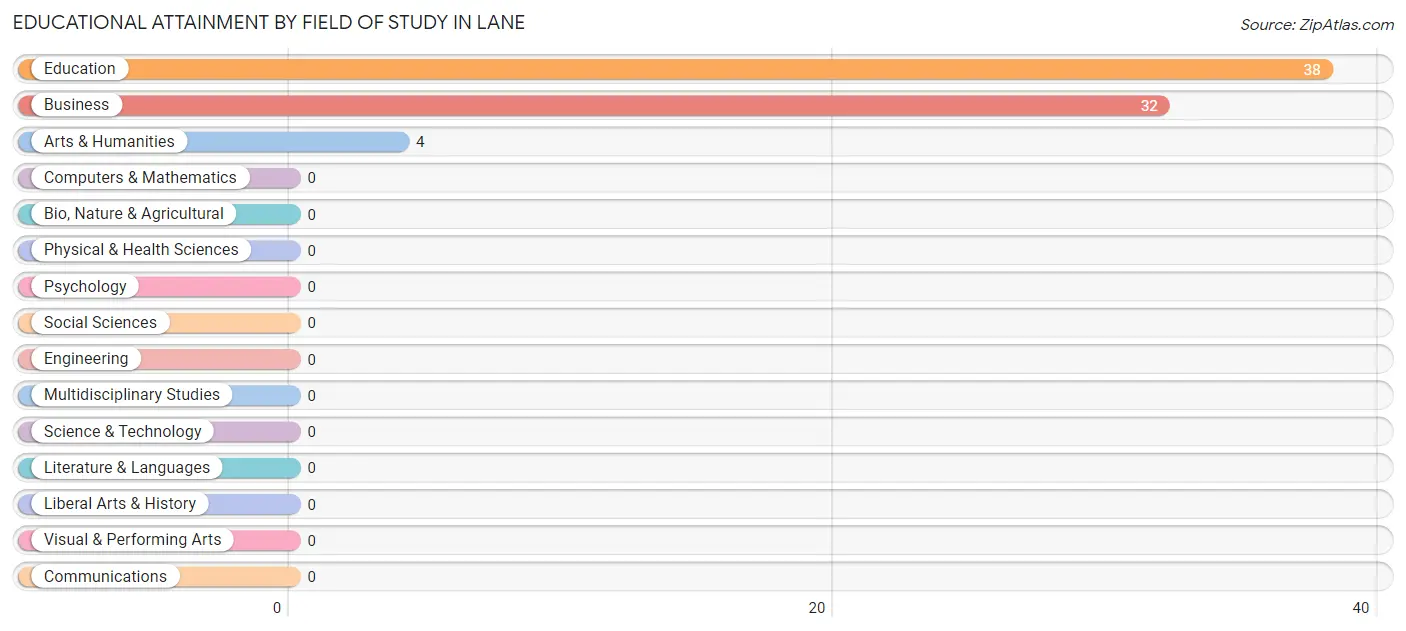
Educational Attainment by Field of Study in Lane
Education (38 | 51.3%), business (32 | 43.2%), and arts & humanities (4 | 5.4%) are the most common fields of study among 74 individuals in Lane who have obtained a bachelor's degree or higher.
| Field of Study | # Graduates | % Graduates |
| Computers & Mathematics | 0 | 0.0% |
| Bio, Nature & Agricultural | 0 | 0.0% |
| Physical & Health Sciences | 0 | 0.0% |
| Psychology | 0 | 0.0% |
| Social Sciences | 0 | 0.0% |
| Engineering | 0 | 0.0% |
| Multidisciplinary Studies | 0 | 0.0% |
| Science & Technology | 0 | 0.0% |
| Business | 32 | 43.2% |
| Education | 38 | 51.3% |
| Literature & Languages | 0 | 0.0% |
| Liberal Arts & History | 0 | 0.0% |
| Visual & Performing Arts | 0 | 0.0% |
| Communications | 0 | 0.0% |
| Arts & Humanities | 4 | 5.4% |
| Total | 74 | 100.0% |
Transportation & Commute in Lane
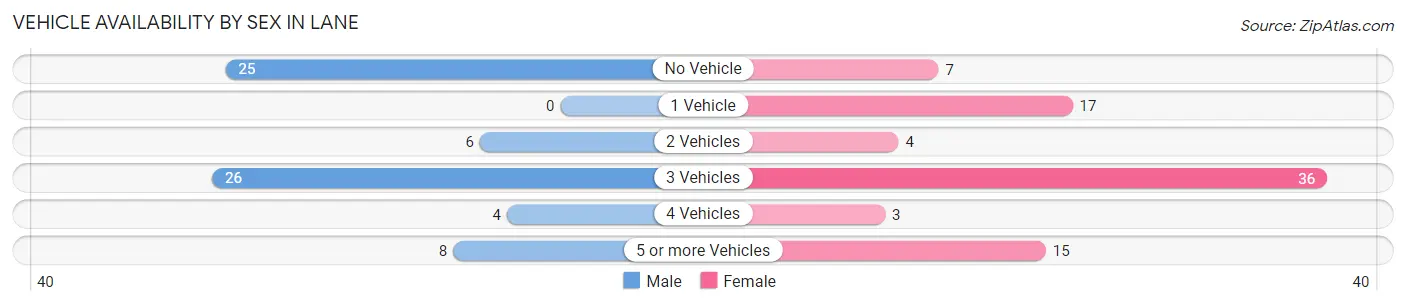
Vehicle Availability by Sex in Lane
The most prevalent vehicle ownership categories in Lane are males with 3 vehicles (26, accounting for 37.7%) and females with 3 vehicles (36, making up 31.7%).
| Vehicles Available | Male | Female |
| No Vehicle | 25 (36.2%) | 7 (8.5%) |
| 1 Vehicle | 0 (0.0%) | 17 (20.7%) |
| 2 Vehicles | 6 (8.7%) | 4 (4.9%) |
| 3 Vehicles | 26 (37.7%) | 36 (43.9%) |
| 4 Vehicles | 4 (5.8%) | 3 (3.7%) |
| 5 or more Vehicles | 8 (11.6%) | 15 (18.3%) |
| Total | 69 (100.0%) | 82 (100.0%) |
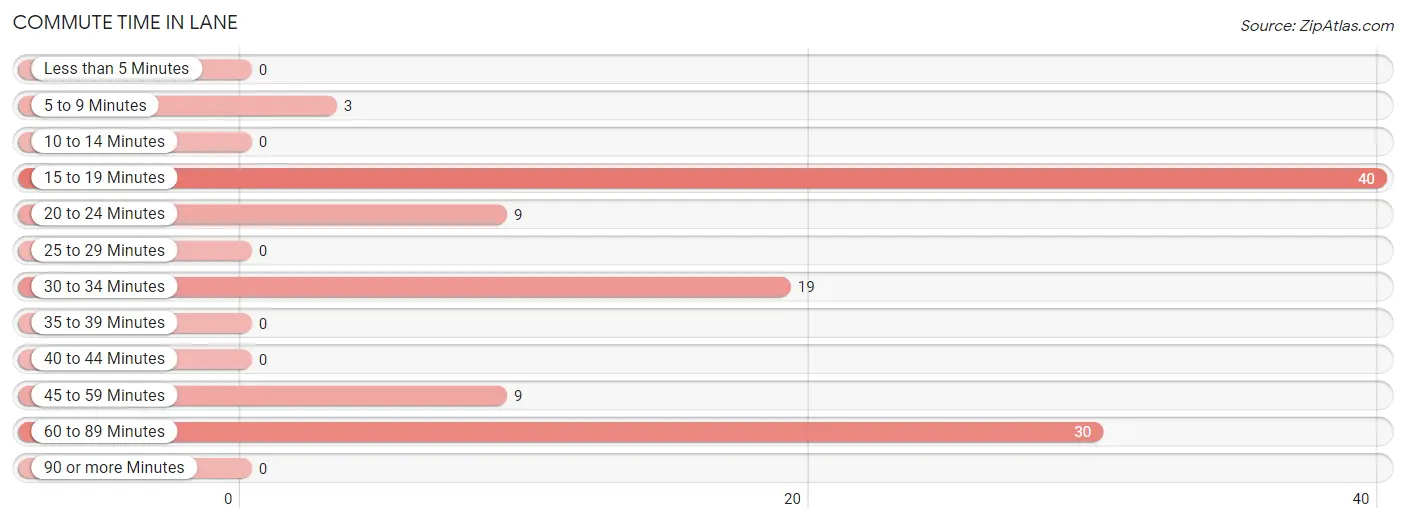
Commute Time in Lane
The most frequently occuring commute durations in Lane are 15 to 19 minutes (40 commuters, 36.4%), 60 to 89 minutes (30 commuters, 27.3%), and 30 to 34 minutes (19 commuters, 17.3%).
| Commute Time | # Commuters | % Commuters |
| Less than 5 Minutes | 0 | 0.0% |
| 5 to 9 Minutes | 3 | 2.7% |
| 10 to 14 Minutes | 0 | 0.0% |
| 15 to 19 Minutes | 40 | 36.4% |
| 20 to 24 Minutes | 9 | 8.2% |
| 25 to 29 Minutes | 0 | 0.0% |
| 30 to 34 Minutes | 19 | 17.3% |
| 35 to 39 Minutes | 0 | 0.0% |
| 40 to 44 Minutes | 0 | 0.0% |
| 45 to 59 Minutes | 9 | 8.2% |
| 60 to 89 Minutes | 30 | 27.3% |
| 90 or more Minutes | 0 | 0.0% |
Commute Time by Sex in Lane
The most common commute times in Lane are 60 to 89 minutes (28 commuters, 40.6%) for males and 15 to 19 minutes (16 commuters, 39.0%) for females.
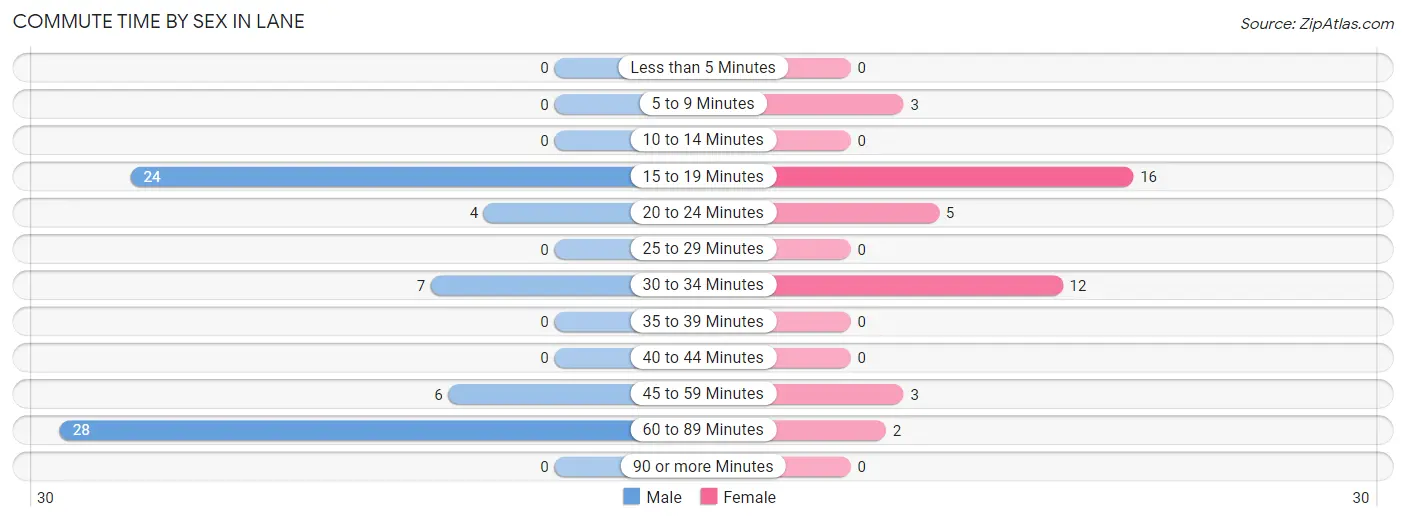
| Commute Time | Male | Female |
| Less than 5 Minutes | 0 (0.0%) | 0 (0.0%) |
| 5 to 9 Minutes | 0 (0.0%) | 3 (7.3%) |
| 10 to 14 Minutes | 0 (0.0%) | 0 (0.0%) |
| 15 to 19 Minutes | 24 (34.8%) | 16 (39.0%) |
| 20 to 24 Minutes | 4 (5.8%) | 5 (12.2%) |
| 25 to 29 Minutes | 0 (0.0%) | 0 (0.0%) |
| 30 to 34 Minutes | 7 (10.1%) | 12 (29.3%) |
| 35 to 39 Minutes | 0 (0.0%) | 0 (0.0%) |
| 40 to 44 Minutes | 0 (0.0%) | 0 (0.0%) |
| 45 to 59 Minutes | 6 (8.7%) | 3 (7.3%) |
| 60 to 89 Minutes | 28 (40.6%) | 2 (4.9%) |
| 90 or more Minutes | 0 (0.0%) | 0 (0.0%) |
Time of Departure to Work by Sex in Lane
The most frequent times of departure to work in Lane are 12:00 AM to 4:59 AM (27, 39.1%) for males and 7:00 AM to 7:29 AM (13, 31.7%) for females.
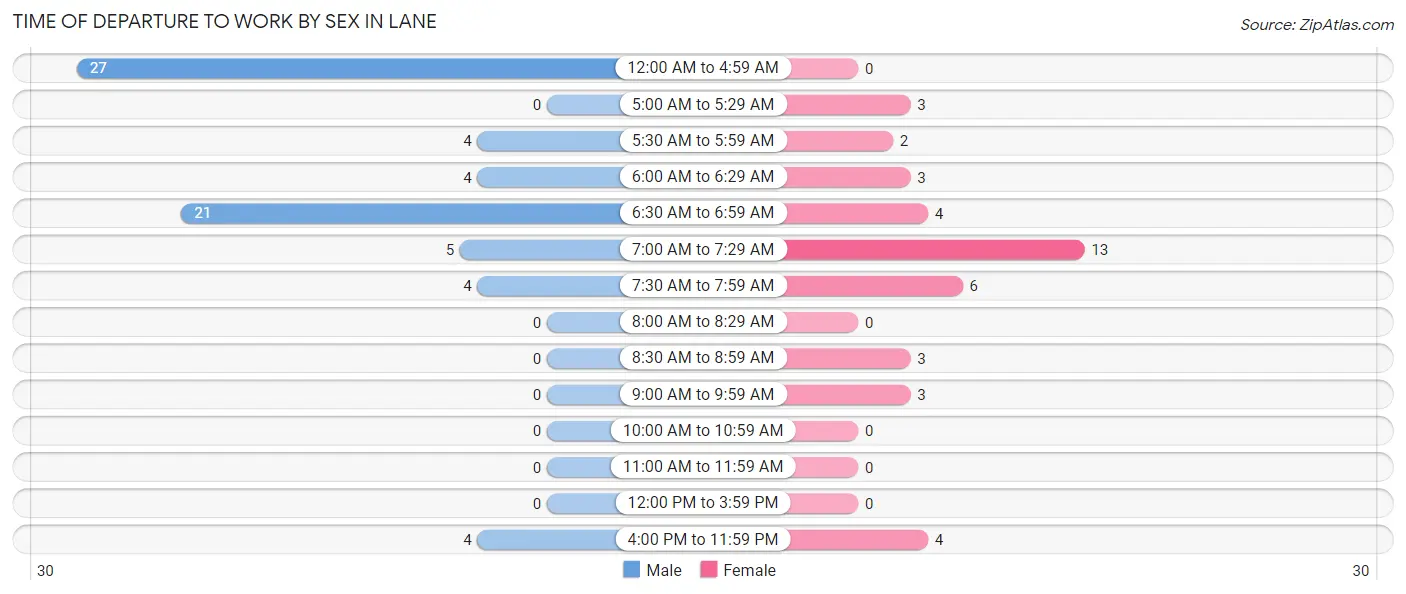
| Time of Departure | Male | Female |
| 12:00 AM to 4:59 AM | 27 (39.1%) | 0 (0.0%) |
| 5:00 AM to 5:29 AM | 0 (0.0%) | 3 (7.3%) |
| 5:30 AM to 5:59 AM | 4 (5.8%) | 2 (4.9%) |
| 6:00 AM to 6:29 AM | 4 (5.8%) | 3 (7.3%) |
| 6:30 AM to 6:59 AM | 21 (30.4%) | 4 (9.8%) |
| 7:00 AM to 7:29 AM | 5 (7.2%) | 13 (31.7%) |
| 7:30 AM to 7:59 AM | 4 (5.8%) | 6 (14.6%) |
| 8:00 AM to 8:29 AM | 0 (0.0%) | 0 (0.0%) |
| 8:30 AM to 8:59 AM | 0 (0.0%) | 3 (7.3%) |
| 9:00 AM to 9:59 AM | 0 (0.0%) | 3 (7.3%) |
| 10:00 AM to 10:59 AM | 0 (0.0%) | 0 (0.0%) |
| 11:00 AM to 11:59 AM | 0 (0.0%) | 0 (0.0%) |
| 12:00 PM to 3:59 PM | 0 (0.0%) | 0 (0.0%) |
| 4:00 PM to 11:59 PM | 4 (5.8%) | 4 (9.8%) |
| Total | 69 (100.0%) | 41 (100.0%) |
Housing Occupancy in Lane
Occupancy by Ownership in Lane
Of the total 216 dwellings in Lane, owner-occupied units account for 172 (79.6%), while renter-occupied units make up 44 (20.4%).
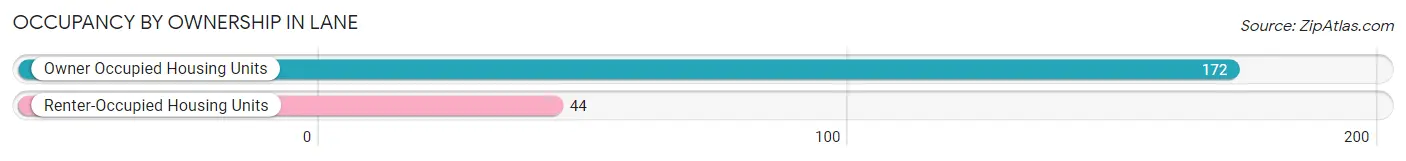
| Occupancy | # Housing Units | % Housing Units |
| Owner Occupied Housing Units | 172 | 79.6% |
| Renter-Occupied Housing Units | 44 | 20.4% |
| Total Occupied Housing Units | 216 | 100.0% |
Occupancy by Household Size in Lane
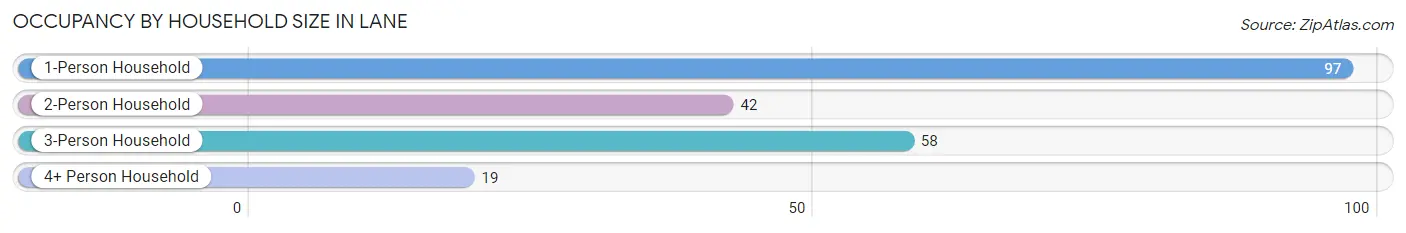
| Household Size | # Housing Units | % Housing Units |
| 1-Person Household | 97 | 44.9% |
| 2-Person Household | 42 | 19.4% |
| 3-Person Household | 58 | 26.9% |
| 4+ Person Household | 19 | 8.8% |
| Total Housing Units | 216 | 100.0% |
Occupancy by Ownership by Household Size in Lane
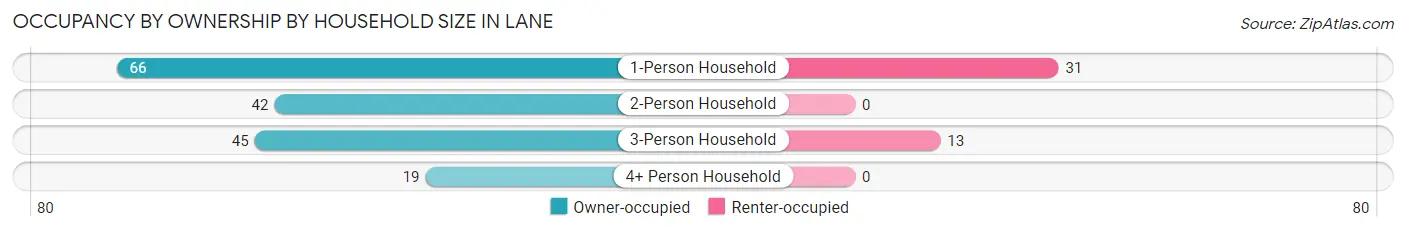
| Household Size | Owner-occupied | Renter-occupied |
| 1-Person Household | 66 (68.0%) | 31 (32.0%) |
| 2-Person Household | 42 (100.0%) | 0 (0.0%) |
| 3-Person Household | 45 (77.6%) | 13 (22.4%) |
| 4+ Person Household | 19 (100.0%) | 0 (0.0%) |
| Total Housing Units | 172 (79.6%) | 44 (20.4%) |
Occupancy by Educational Attainment in Lane
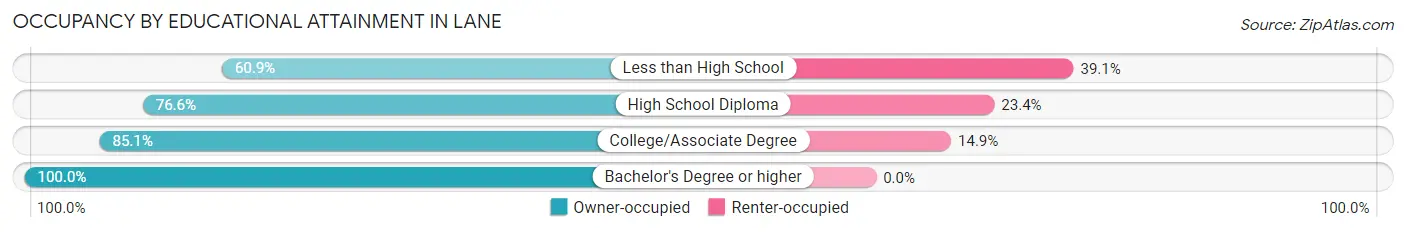
| Household Size | Owner-occupied | Renter-occupied |
| Less than High School | 28 (60.9%) | 18 (39.1%) |
| High School Diploma | 49 (76.6%) | 15 (23.4%) |
| College/Associate Degree | 63 (85.1%) | 11 (14.9%) |
| Bachelor's Degree or higher | 32 (100.0%) | 0 (0.0%) |
Occupancy by Age of Householder in Lane
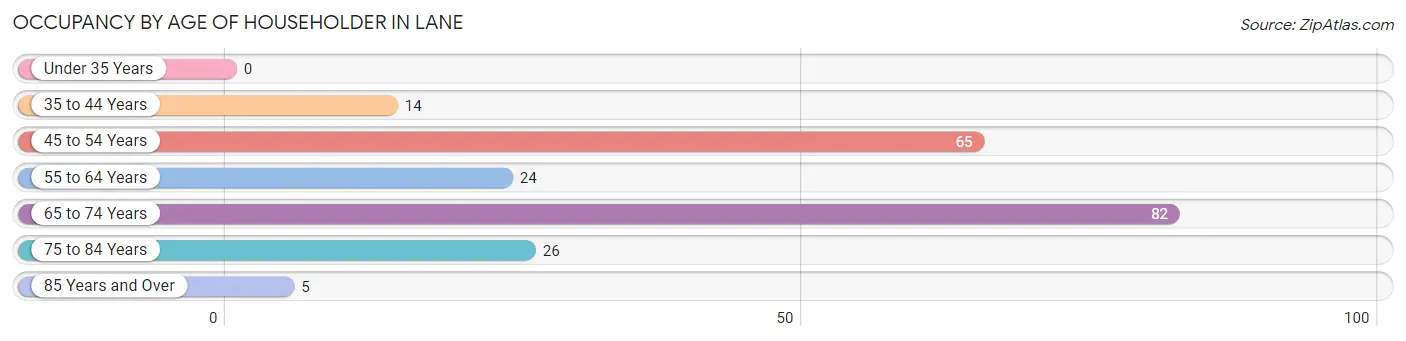
| Age Bracket | # Households | % Households |
| Under 35 Years | 0 | 0.0% |
| 35 to 44 Years | 14 | 6.5% |
| 45 to 54 Years | 65 | 30.1% |
| 55 to 64 Years | 24 | 11.1% |
| 65 to 74 Years | 82 | 38.0% |
| 75 to 84 Years | 26 | 12.0% |
| 85 Years and Over | 5 | 2.3% |
| Total | 216 | 100.0% |
Housing Finances in Lane
Median Income by Occupancy in Lane
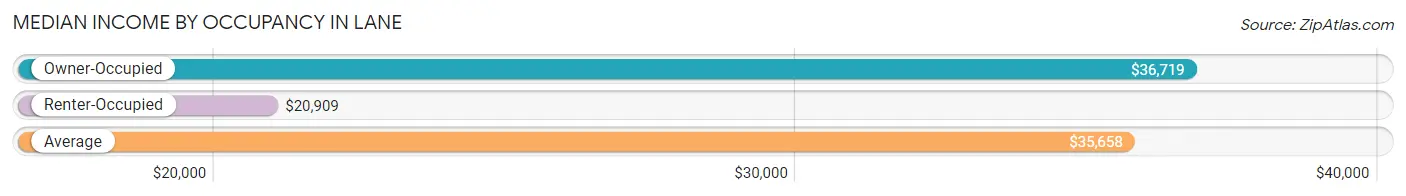
| Occupancy Type | # Households | Median Income |
| Owner-Occupied | 172 (79.6%) | $36,719 |
| Renter-Occupied | 44 (20.4%) | $20,909 |
| Average | 216 (100.0%) | $35,658 |
Occupancy by Householder Income Bracket in Lane
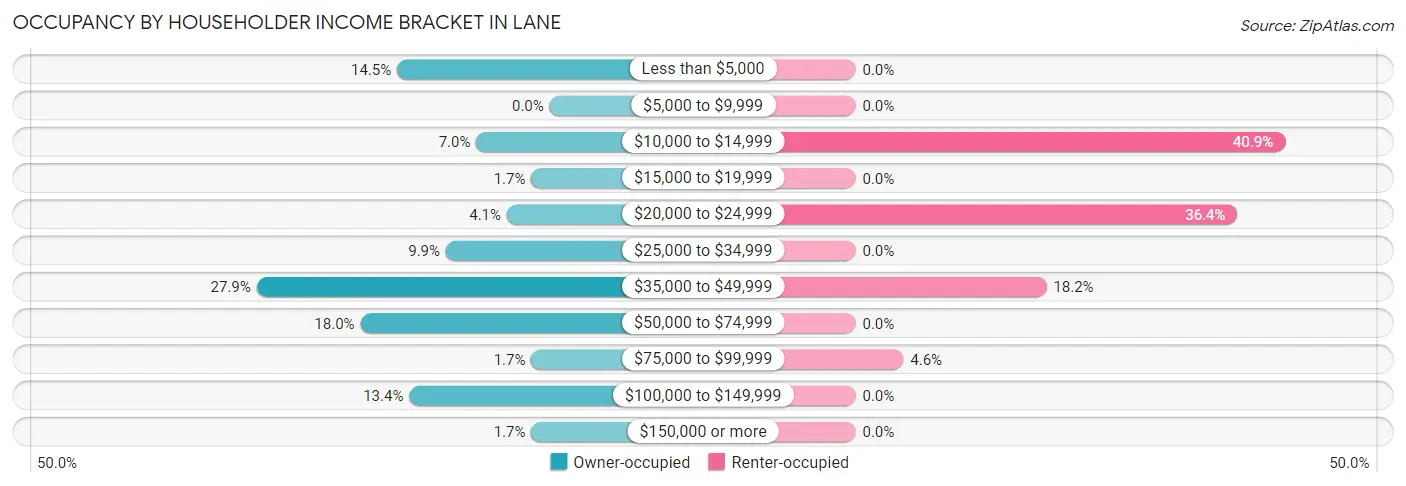
| Income Bracket | Owner-occupied | Renter-occupied |
| Less than $5,000 | 25 (14.5%) | 0 (0.0%) |
| $5,000 to $9,999 | 0 (0.0%) | 0 (0.0%) |
| $10,000 to $14,999 | 12 (7.0%) | 18 (40.9%) |
| $15,000 to $19,999 | 3 (1.7%) | 0 (0.0%) |
| $20,000 to $24,999 | 7 (4.1%) | 16 (36.4%) |
| $25,000 to $34,999 | 17 (9.9%) | 0 (0.0%) |
| $35,000 to $49,999 | 48 (27.9%) | 8 (18.2%) |
| $50,000 to $74,999 | 31 (18.0%) | 0 (0.0%) |
| $75,000 to $99,999 | 3 (1.7%) | 2 (4.5%) |
| $100,000 to $149,999 | 23 (13.4%) | 0 (0.0%) |
| $150,000 or more | 3 (1.7%) | 0 (0.0%) |
| Total | 172 (100.0%) | 44 (100.0%) |
Monthly Housing Cost Tiers in Lane
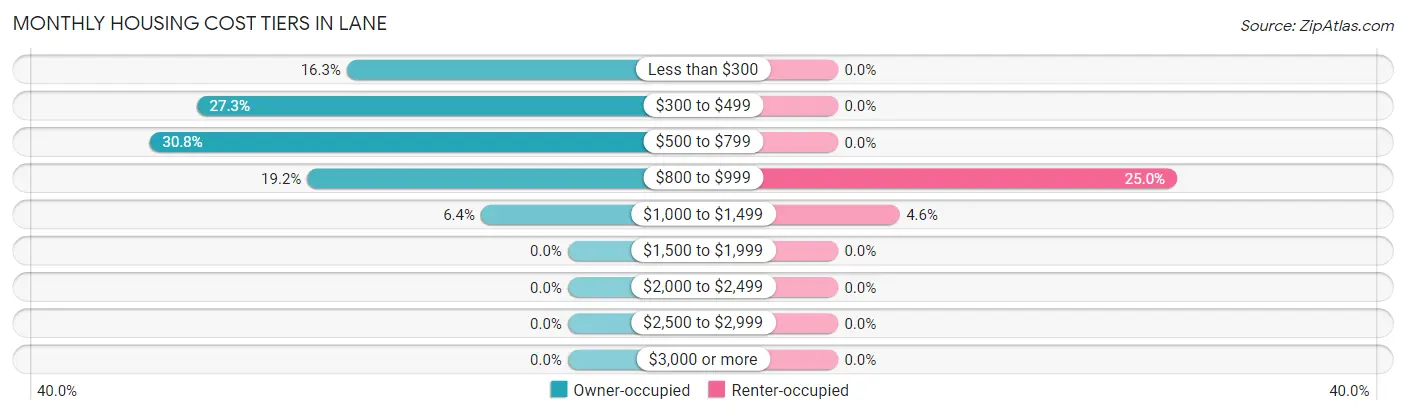
| Monthly Cost | Owner-occupied | Renter-occupied |
| Less than $300 | 28 (16.3%) | 0 (0.0%) |
| $300 to $499 | 47 (27.3%) | 0 (0.0%) |
| $500 to $799 | 53 (30.8%) | 0 (0.0%) |
| $800 to $999 | 33 (19.2%) | 11 (25.0%) |
| $1,000 to $1,499 | 11 (6.4%) | 2 (4.5%) |
| $1,500 to $1,999 | 0 (0.0%) | 0 (0.0%) |
| $2,000 to $2,499 | 0 (0.0%) | 0 (0.0%) |
| $2,500 to $2,999 | 0 (0.0%) | 0 (0.0%) |
| $3,000 or more | 0 (0.0%) | 0 (0.0%) |
| Total | 172 (100.0%) | 44 (100.0%) |
Physical Housing Characteristics in Lane
Housing Structures in Lane
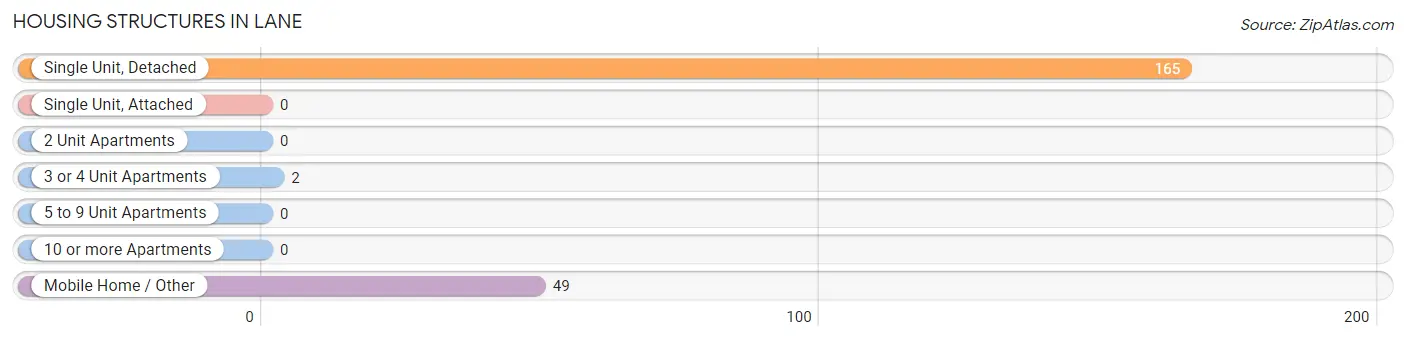
| Structure Type | # Housing Units | % Housing Units |
| Single Unit, Detached | 165 | 76.4% |
| Single Unit, Attached | 0 | 0.0% |
| 2 Unit Apartments | 0 | 0.0% |
| 3 or 4 Unit Apartments | 2 | 0.9% |
| 5 to 9 Unit Apartments | 0 | 0.0% |
| 10 or more Apartments | 0 | 0.0% |
| Mobile Home / Other | 49 | 22.7% |
| Total | 216 | 100.0% |
Housing Structures by Occupancy in Lane
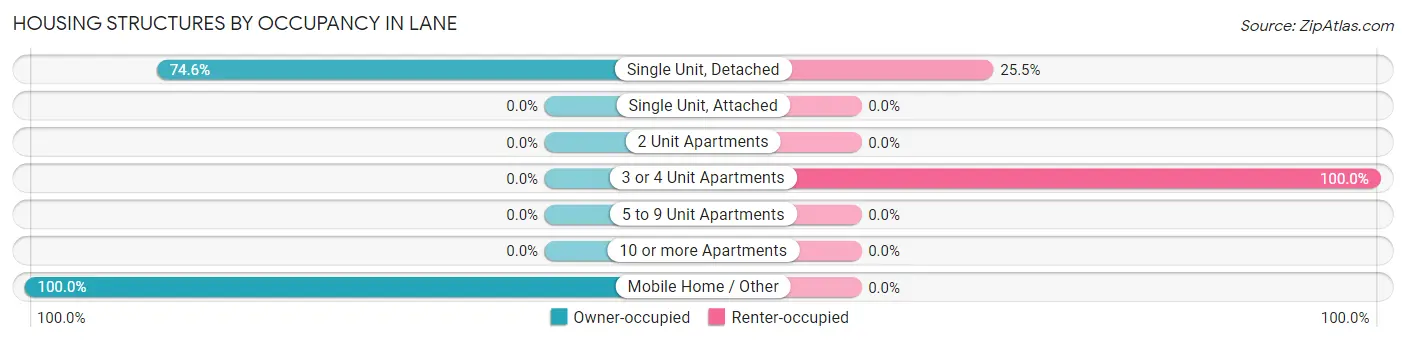
| Structure Type | Owner-occupied | Renter-occupied |
| Single Unit, Detached | 123 (74.6%) | 42 (25.5%) |
| Single Unit, Attached | 0 (0.0%) | 0 (0.0%) |
| 2 Unit Apartments | 0 (0.0%) | 0 (0.0%) |
| 3 or 4 Unit Apartments | 0 (0.0%) | 2 (100.0%) |
| 5 to 9 Unit Apartments | 0 (0.0%) | 0 (0.0%) |
| 10 or more Apartments | 0 (0.0%) | 0 (0.0%) |
| Mobile Home / Other | 49 (100.0%) | 0 (0.0%) |
| Total | 172 (79.6%) | 44 (20.4%) |
Housing Structures by Number of Rooms in Lane
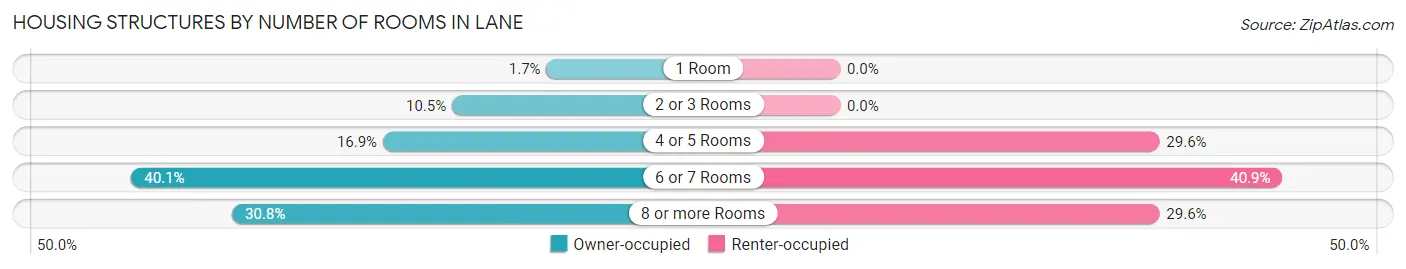
| Number of Rooms | Owner-occupied | Renter-occupied |
| 1 Room | 3 (1.7%) | 0 (0.0%) |
| 2 or 3 Rooms | 18 (10.5%) | 0 (0.0%) |
| 4 or 5 Rooms | 29 (16.9%) | 13 (29.5%) |
| 6 or 7 Rooms | 69 (40.1%) | 18 (40.9%) |
| 8 or more Rooms | 53 (30.8%) | 13 (29.5%) |
| Total | 172 (100.0%) | 44 (100.0%) |
Housing Structure by Heating Type in Lane
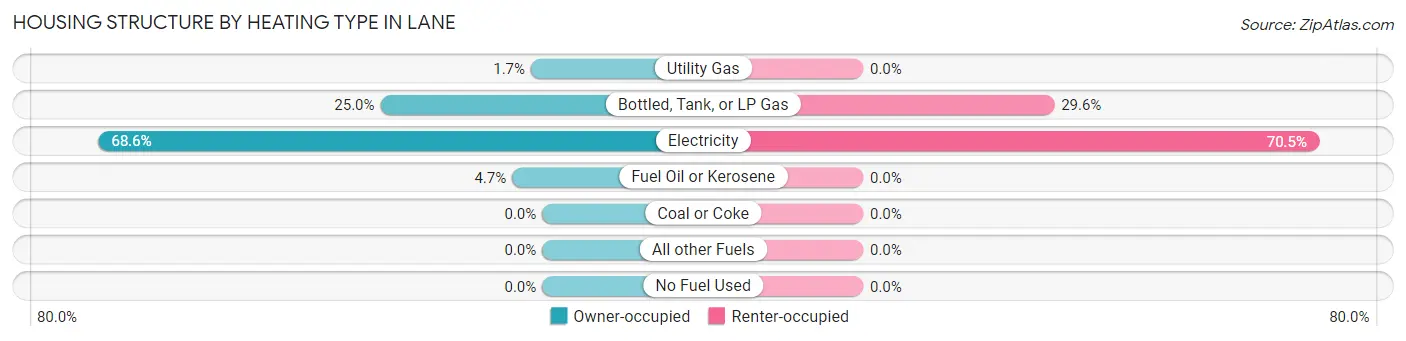
| Heating Type | Owner-occupied | Renter-occupied |
| Utility Gas | 3 (1.7%) | 0 (0.0%) |
| Bottled, Tank, or LP Gas | 43 (25.0%) | 13 (29.5%) |
| Electricity | 118 (68.6%) | 31 (70.5%) |
| Fuel Oil or Kerosene | 8 (4.6%) | 0 (0.0%) |
| Coal or Coke | 0 (0.0%) | 0 (0.0%) |
| All other Fuels | 0 (0.0%) | 0 (0.0%) |
| No Fuel Used | 0 (0.0%) | 0 (0.0%) |
| Total | 172 (100.0%) | 44 (100.0%) |
Household Vehicle Usage in Lane
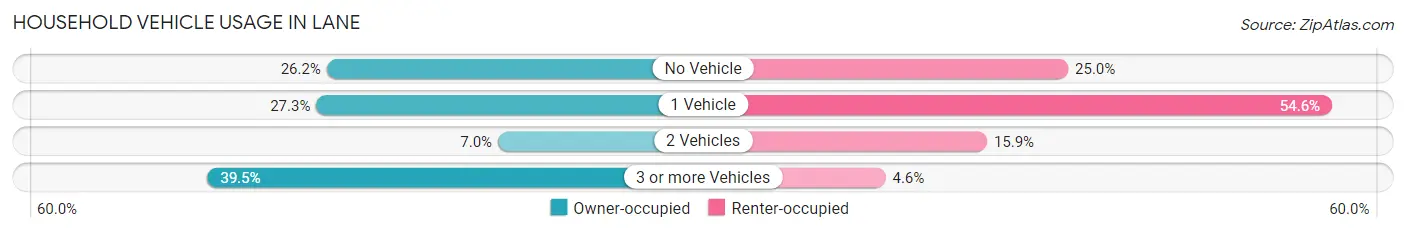
| Vehicles per Household | Owner-occupied | Renter-occupied |
| No Vehicle | 45 (26.2%) | 11 (25.0%) |
| 1 Vehicle | 47 (27.3%) | 24 (54.5%) |
| 2 Vehicles | 12 (7.0%) | 7 (15.9%) |
| 3 or more Vehicles | 68 (39.5%) | 2 (4.5%) |
| Total | 172 (100.0%) | 44 (100.0%) |
Real Estate & Mortgages in Lane
Real Estate and Mortgage Overview in Lane
| Characteristic | Without Mortgage | With Mortgage |
| Housing Units | 140 | 32 |
| Median Property Value | $156,300 | $66,700 |
| Median Household Income | $36,094 | $0 |
| Monthly Housing Costs | $472 | $0 |
| Real Estate Taxes | - | - |
Property Value by Mortgage Status in Lane
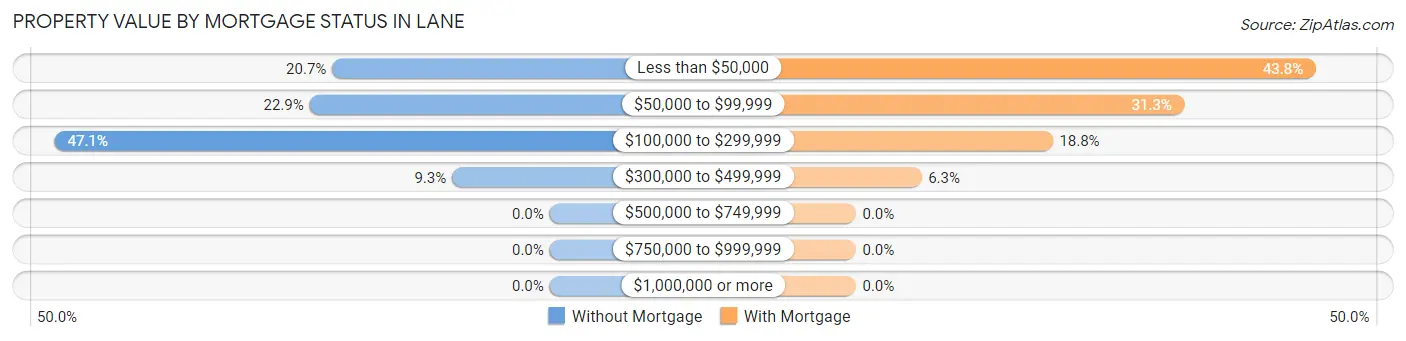
| Property Value | Without Mortgage | With Mortgage |
| Less than $50,000 | 29 (20.7%) | 14 (43.8%) |
| $50,000 to $99,999 | 32 (22.9%) | 10 (31.2%) |
| $100,000 to $299,999 | 66 (47.1%) | 6 (18.8%) |
| $300,000 to $499,999 | 13 (9.3%) | 2 (6.2%) |
| $500,000 to $749,999 | 0 (0.0%) | 0 (0.0%) |
| $750,000 to $999,999 | 0 (0.0%) | 0 (0.0%) |
| $1,000,000 or more | 0 (0.0%) | 0 (0.0%) |
| Total | 140 (100.0%) | 32 (100.0%) |
Household Income by Mortgage Status in Lane
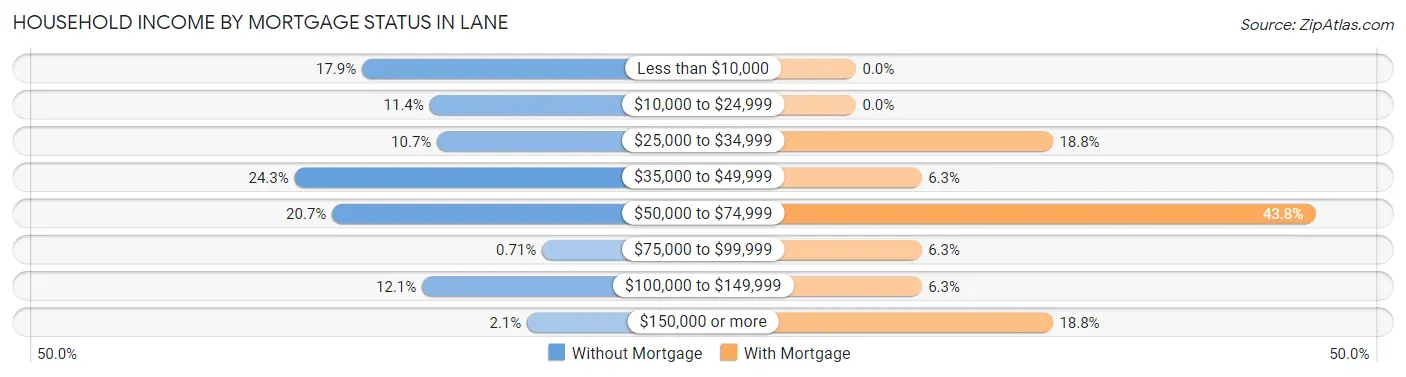
| Household Income | Without Mortgage | With Mortgage |
| Less than $10,000 | 25 (17.9%) | 0 (0.0%) |
| $10,000 to $24,999 | 16 (11.4%) | 0 (0.0%) |
| $25,000 to $34,999 | 15 (10.7%) | 6 (18.8%) |
| $35,000 to $49,999 | 34 (24.3%) | 2 (6.2%) |
| $50,000 to $74,999 | 29 (20.7%) | 14 (43.8%) |
| $75,000 to $99,999 | 1 (0.7%) | 2 (6.2%) |
| $100,000 to $149,999 | 17 (12.1%) | 2 (6.2%) |
| $150,000 or more | 3 (2.1%) | 6 (18.8%) |
| Total | 140 (100.0%) | 32 (100.0%) |
Property Value to Household Income Ratio in Lane
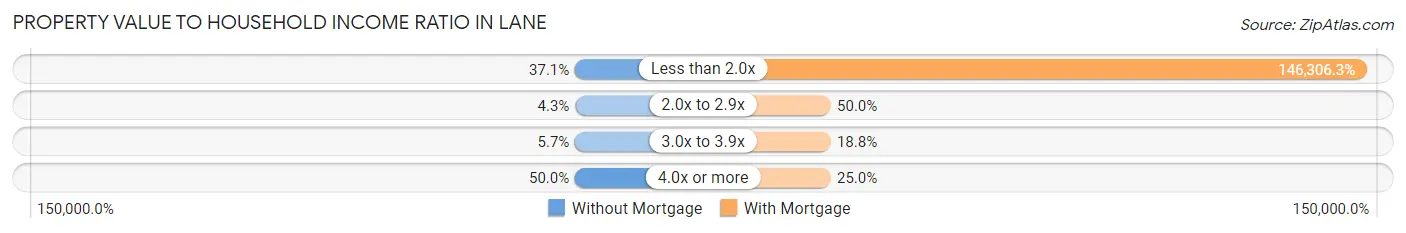
| Value-to-Income Ratio | Without Mortgage | With Mortgage |
| Less than 2.0x | 52 (37.1%) | 46,818 (146,306.2%) |
| 2.0x to 2.9x | 6 (4.3%) | 16 (50.0%) |
| 3.0x to 3.9x | 8 (5.7%) | 6 (18.8%) |
| 4.0x or more | 70 (50.0%) | 8 (25.0%) |
| Total | 140 (100.0%) | 32 (100.0%) |
Real Estate Taxes by Mortgage Status in Lane
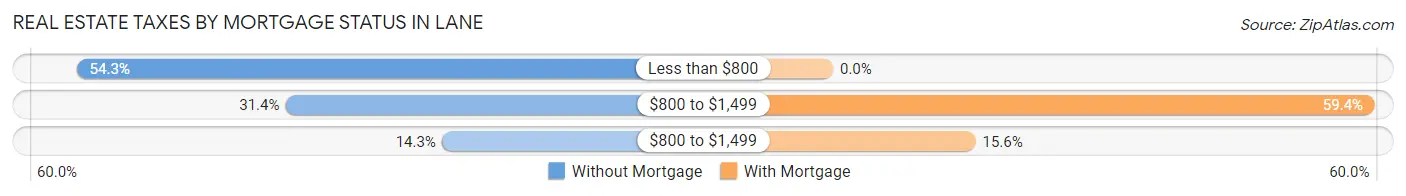
| Property Taxes | Without Mortgage | With Mortgage |
| Less than $800 | 76 (54.3%) | 0 (0.0%) |
| $800 to $1,499 | 44 (31.4%) | 19 (59.4%) |
| $800 to $1,499 | 20 (14.3%) | 5 (15.6%) |
| Total | 140 (100.0%) | 32 (100.0%) |
Health & Disability in Lane
Health Insurance Coverage by Age in Lane
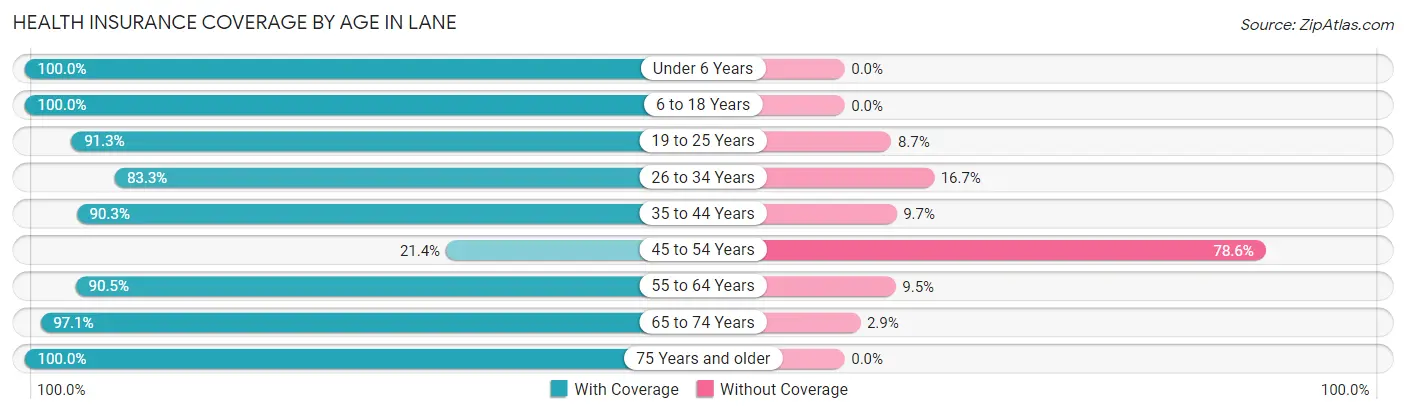
| Age Bracket | With Coverage | Without Coverage |
| Under 6 Years | 17 (100.0%) | 0 (0.0%) |
| 6 to 18 Years | 114 (100.0%) | 0 (0.0%) |
| 19 to 25 Years | 21 (91.3%) | 2 (8.7%) |
| 26 to 34 Years | 10 (83.3%) | 2 (16.7%) |
| 35 to 44 Years | 28 (90.3%) | 3 (9.7%) |
| 45 to 54 Years | 21 (21.4%) | 77 (78.6%) |
| 55 to 64 Years | 57 (90.5%) | 6 (9.5%) |
| 65 to 74 Years | 133 (97.1%) | 4 (2.9%) |
| 75 Years and older | 44 (100.0%) | 0 (0.0%) |
| Total | 445 (82.6%) | 94 (17.4%) |
Health Insurance Coverage by Citizenship Status in Lane
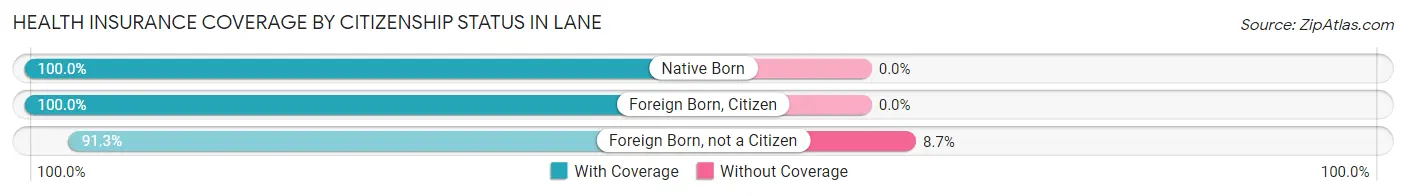
| Citizenship Status | With Coverage | Without Coverage |
| Native Born | 17 (100.0%) | 0 (0.0%) |
| Foreign Born, Citizen | 114 (100.0%) | 0 (0.0%) |
| Foreign Born, not a Citizen | 21 (91.3%) | 2 (8.7%) |
Health Insurance Coverage by Household Income in Lane
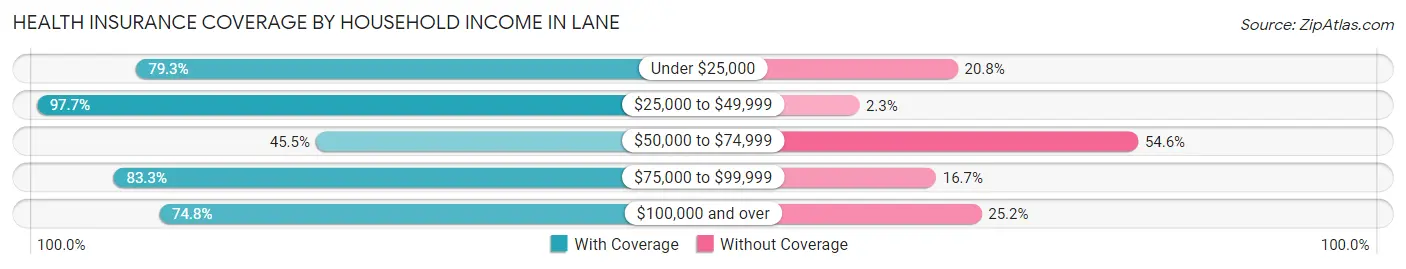
| Household Income | With Coverage | Without Coverage |
| Under $25,000 | 84 (79.2%) | 22 (20.7%) |
| $25,000 to $49,999 | 214 (97.7%) | 5 (2.3%) |
| $50,000 to $74,999 | 25 (45.5%) | 30 (54.5%) |
| $75,000 to $99,999 | 30 (83.3%) | 6 (16.7%) |
| $100,000 and over | 92 (74.8%) | 31 (25.2%) |
Public vs Private Health Insurance Coverage by Age in Lane
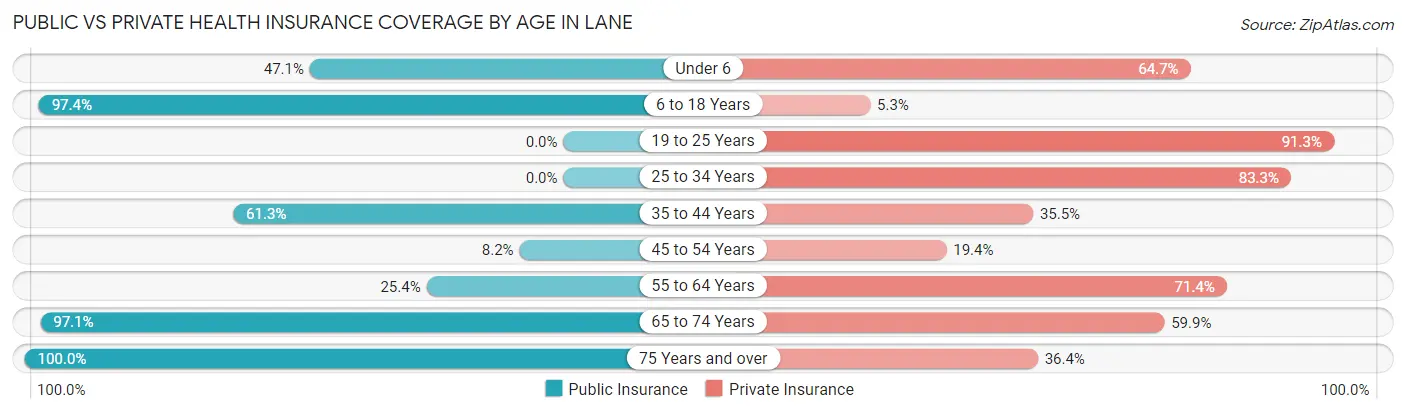
| Age Bracket | Public Insurance | Private Insurance |
| Under 6 | 8 (47.1%) | 11 (64.7%) |
| 6 to 18 Years | 111 (97.4%) | 6 (5.3%) |
| 19 to 25 Years | 0 (0.0%) | 21 (91.3%) |
| 25 to 34 Years | 0 (0.0%) | 10 (83.3%) |
| 35 to 44 Years | 19 (61.3%) | 11 (35.5%) |
| 45 to 54 Years | 8 (8.2%) | 19 (19.4%) |
| 55 to 64 Years | 16 (25.4%) | 45 (71.4%) |
| 65 to 74 Years | 133 (97.1%) | 82 (59.9%) |
| 75 Years and over | 44 (100.0%) | 16 (36.4%) |
| Total | 339 (62.9%) | 221 (41.0%) |
Disability Status by Sex by Age in Lane
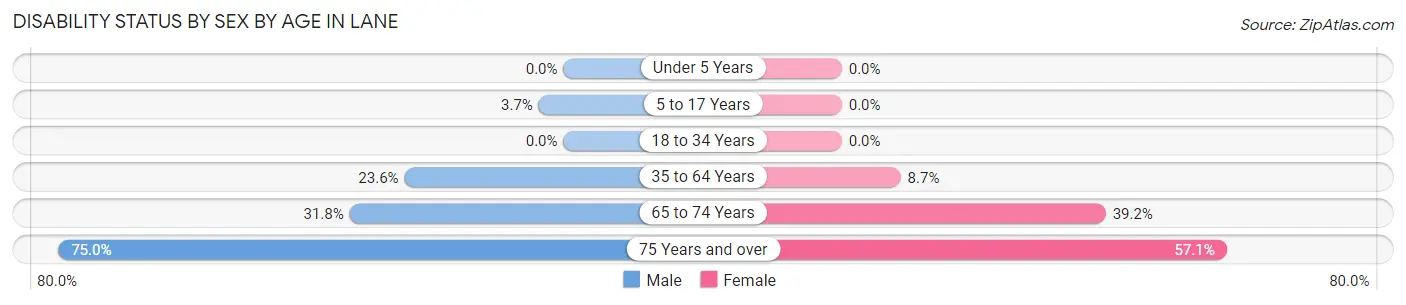
| Age Bracket | Male | Female |
| Under 5 Years | 0 (0.0%) | 0 (0.0%) |
| 5 to 17 Years | 3 (3.7%) | 0 (0.0%) |
| 18 to 34 Years | 0 (0.0%) | 0 (0.0%) |
| 35 to 64 Years | 21 (23.6%) | 9 (8.7%) |
| 65 to 74 Years | 20 (31.8%) | 29 (39.2%) |
| 75 Years and over | 12 (75.0%) | 16 (57.1%) |
Disability Class by Sex by Age in Lane
Disability Class: Hearing Difficulty
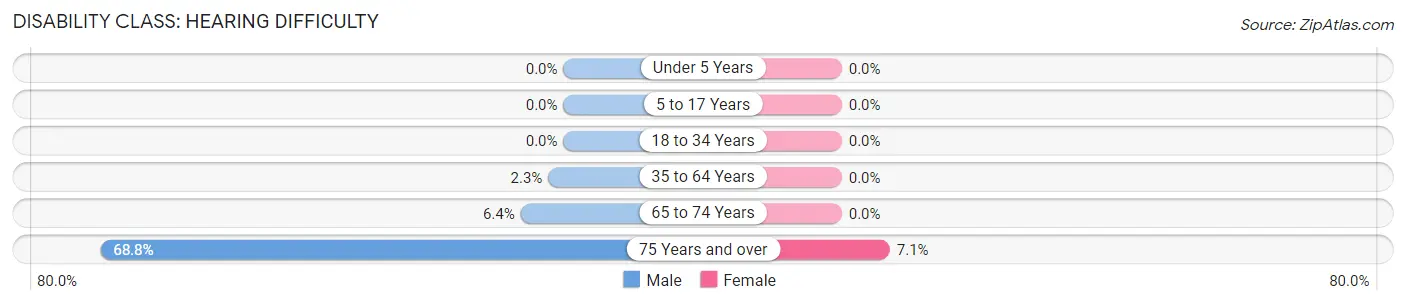
| Age Bracket | Male | Female |
| Under 5 Years | 0 (0.0%) | 0 (0.0%) |
| 5 to 17 Years | 0 (0.0%) | 0 (0.0%) |
| 18 to 34 Years | 0 (0.0%) | 0 (0.0%) |
| 35 to 64 Years | 2 (2.2%) | 0 (0.0%) |
| 65 to 74 Years | 4 (6.4%) | 0 (0.0%) |
| 75 Years and over | 11 (68.8%) | 2 (7.1%) |
Disability Class: Vision Difficulty
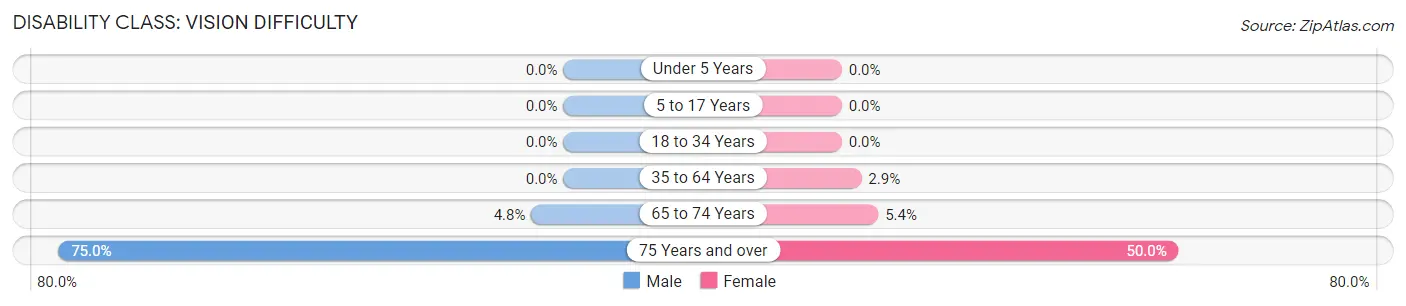
| Age Bracket | Male | Female |
| Under 5 Years | 0 (0.0%) | 0 (0.0%) |
| 5 to 17 Years | 0 (0.0%) | 0 (0.0%) |
| 18 to 34 Years | 0 (0.0%) | 0 (0.0%) |
| 35 to 64 Years | 0 (0.0%) | 3 (2.9%) |
| 65 to 74 Years | 3 (4.8%) | 4 (5.4%) |
| 75 Years and over | 12 (75.0%) | 14 (50.0%) |
Disability Class: Cognitive Difficulty
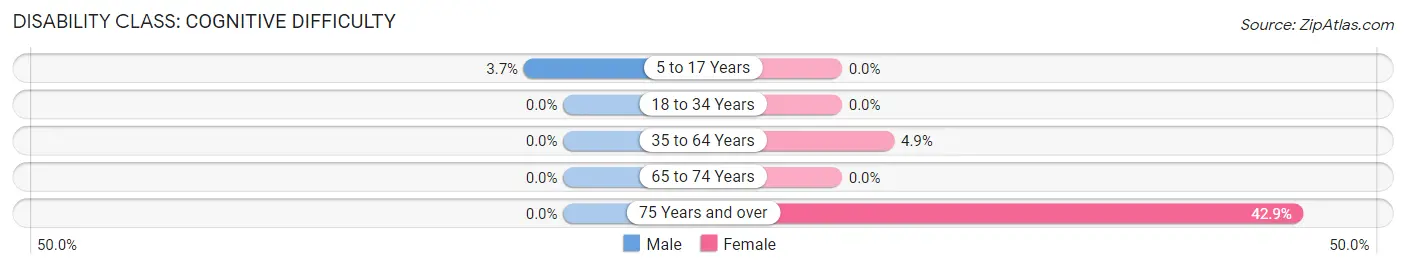
| Age Bracket | Male | Female |
| 5 to 17 Years | 3 (3.7%) | 0 (0.0%) |
| 18 to 34 Years | 0 (0.0%) | 0 (0.0%) |
| 35 to 64 Years | 0 (0.0%) | 5 (4.9%) |
| 65 to 74 Years | 0 (0.0%) | 0 (0.0%) |
| 75 Years and over | 0 (0.0%) | 12 (42.9%) |
Disability Class: Ambulatory Difficulty
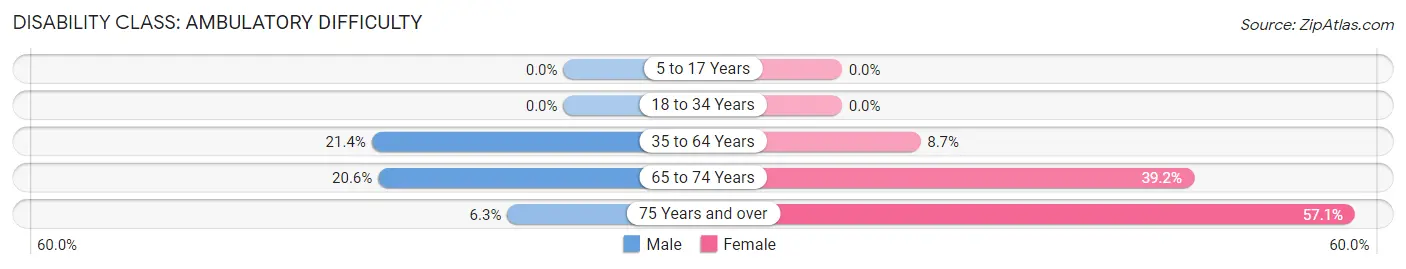
| Age Bracket | Male | Female |
| 5 to 17 Years | 0 (0.0%) | 0 (0.0%) |
| 18 to 34 Years | 0 (0.0%) | 0 (0.0%) |
| 35 to 64 Years | 19 (21.3%) | 9 (8.7%) |
| 65 to 74 Years | 13 (20.6%) | 29 (39.2%) |
| 75 Years and over | 1 (6.2%) | 16 (57.1%) |
Disability Class: Self-Care Difficulty
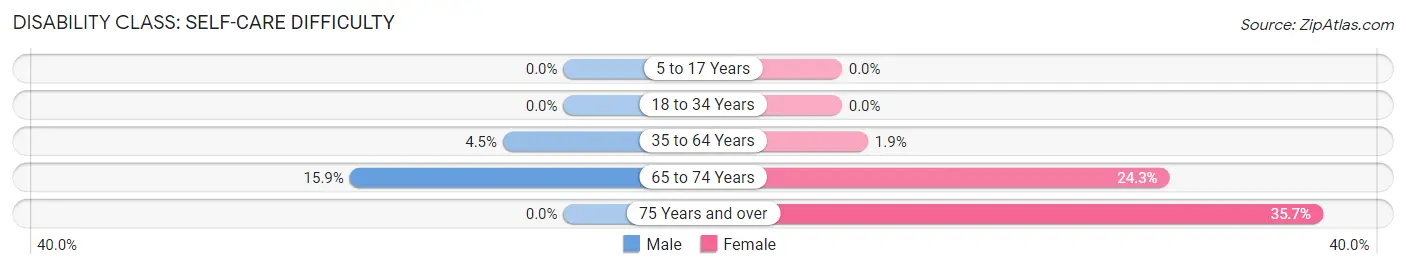
| Age Bracket | Male | Female |
| 5 to 17 Years | 0 (0.0%) | 0 (0.0%) |
| 18 to 34 Years | 0 (0.0%) | 0 (0.0%) |
| 35 to 64 Years | 4 (4.5%) | 2 (1.9%) |
| 65 to 74 Years | 10 (15.9%) | 18 (24.3%) |
| 75 Years and over | 0 (0.0%) | 10 (35.7%) |
Technology Access in Lane
Computing Device Access in Lane
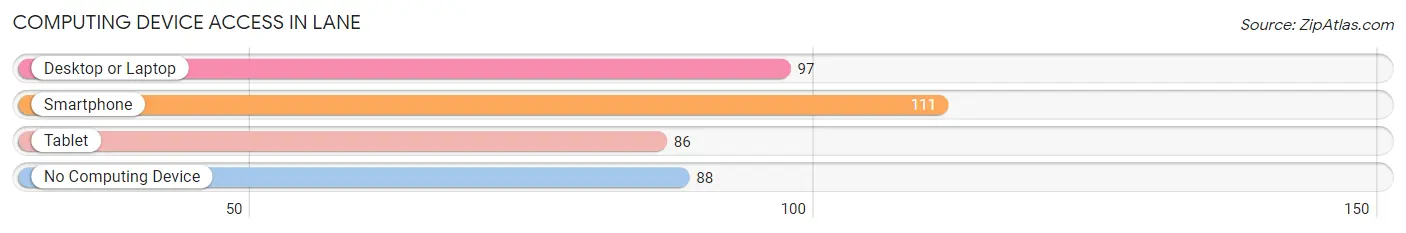
| Device Type | # Households | % Households |
| Desktop or Laptop | 97 | 44.9% |
| Smartphone | 111 | 51.4% |
| Tablet | 86 | 39.8% |
| No Computing Device | 88 | 40.7% |
| Total | 216 | 100.0% |
Internet Access in Lane
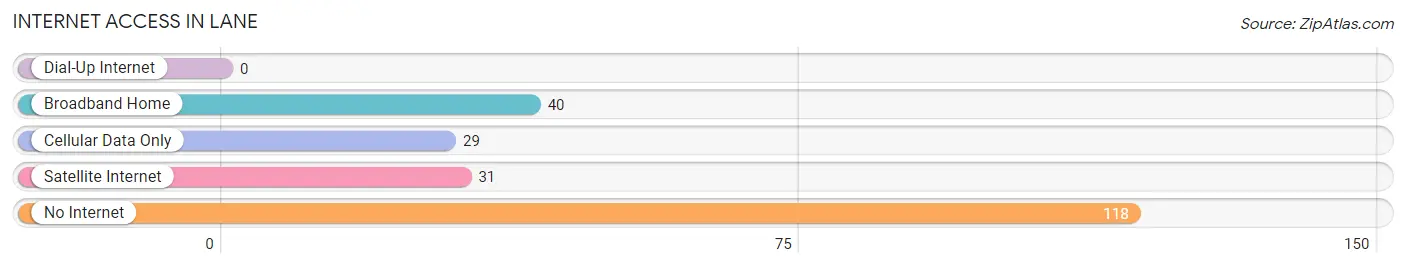
| Internet Type | # Households | % Households |
| Dial-Up Internet | 0 | 0.0% |
| Broadband Home | 40 | 18.5% |
| Cellular Data Only | 29 | 13.4% |
| Satellite Internet | 31 | 14.3% |
| No Internet | 118 | 54.6% |
| Total | 216 | 100.0% |
Lane Summary
Lane is a small town located in the state of South Carolina, United States. It is situated in the northeastern part of the state, in the Pee Dee region. The town is located in Florence County and is part of the Florence Metropolitan Statistical Area. As of the 2010 census, the population of Lane was 1,845.
Geography
Lane is located at 33°51'25" North, 79°51'25" West (33.856944, -79.856944). The town has a total area of 1.2 square miles, all of which is land. The town is situated in the Pee Dee region of South Carolina, which is characterized by flat terrain and sandy soils. The town is located near the Lynches River, which is a tributary of the Great Pee Dee River.
Climate
Lane has a humid subtropical climate, with hot, humid summers and mild winters. The average annual temperature is around 70°F, with an average high of around 90°F in the summer and an average low of around 50°F in the winter. The average annual precipitation is around 48 inches.
Demographics
As of the 2010 census, there were 1,845 people, 717 households, and 486 families residing in the town. The population density was 1,539.2 people per square mile. The racial makeup of the town was 68.2% White, 28.7% African American, 0.2% Native American, 0.4% Asian, 0.1% Pacific Islander, 0.9% from other races, and 1.5% from two or more races. Hispanic or Latino of any race were 2.2% of the population.
Economy
The economy of Lane is largely based on agriculture. The town is home to several farms, which produce a variety of crops, including cotton, soybeans, corn, and peanuts. The town is also home to several small businesses, including restaurants, convenience stores, and auto repair shops.
The town is served by the Florence County School District, which operates several schools in the area, including Lane Elementary School, Lane Middle School, and Lane High School. The town is also home to several churches, including Lane Baptist Church, Lane Presbyterian Church, and Lane United Methodist Church.
Conclusion
Lane is a small town located in the northeastern part of South Carolina. The town has a population of 1,845, as of the 2010 census. The town is situated in the Pee Dee region of the state, which is characterized by flat terrain and sandy soils. The economy of Lane is largely based on agriculture, with several farms producing a variety of crops. The town is served by the Florence County School District and is home to several churches.
Common Questions
What is Per Capita Income in Lane?
Per Capita income in Lane is $20,671.
What is the Median Family Income in Lane?
Median Family Income in Lane is $37,188.
What is the Median Household income in Lane?
Median Household Income in Lane is $35,658.
What is Income or Wage Gap in Lane?
Income or Wage Gap in Lane is 28.5%.
Women in Lane earn 71.5 cents for every dollar earned by a man.
What is Inequality or Gini Index in Lane?
Inequality or Gini Index in Lane is 0.45.
What is the Total Population of Lane?
Total Population of Lane is 539.
What is the Total Male Population of Lane?
Total Male Population of Lane is 289.
What is the Total Female Population of Lane?
Total Female Population of Lane is 250.
What is the Ratio of Males per 100 Females in Lane?
There are 115.60 Males per 100 Females in Lane.
What is the Ratio of Females per 100 Males in Lane?
There are 86.51 Females per 100 Males in Lane.
What is the Median Population Age in Lane?
Median Population Age in Lane is 54.3 Years.
What is the Average Family Size in Lane
Average Family Size in Lane is 3.8 People.
What is the Average Household Size in Lane
Average Household Size in Lane is 2.5 People.
How Large is the Labor Force in Lane?
There are 179 People in the Labor Forcein in Lane.
What is the Percentage of People in the Labor Force in Lane?
40.7% of People are in the Labor Force in Lane.
What is the Unemployment Rate in Lane?
Unemployment Rate in Lane is 5.6%.