Cross Hill, SC Map & Demographics
Cross Hill Map
Cross Hill Overview
$24,079
PER CAPITA INCOME
$43,618
AVG FAMILY INCOME
$39,625
AVG HOUSEHOLD INCOME
15.9%
WAGE / INCOME GAP [ % ]
84.1¢/ $1
WAGE / INCOME GAP [ $ ]
0.39
INEQUALITY / GINI INDEX
522
TOTAL POPULATION
253
MALE POPULATION
269
FEMALE POPULATION
94.05
MALES / 100 FEMALES
106.32
FEMALES / 100 MALES
54.4
MEDIAN AGE
2.7
AVG FAMILY SIZE
2.1
AVG HOUSEHOLD SIZE
217
LABOR FORCE [ PEOPLE ]
46.2%
PERCENT IN LABOR FORCE
Cross Hill Zip Codes
Cross Hill Area Codes
Income in Cross Hill
Income Overview in Cross Hill
Per Capita Income in Cross Hill is $24,079, while median incomes of families and households are $43,618 and $39,625 respectively.
| Characteristic | Number | Measure |
| Per Capita Income | 522 | $24,079 |
| Median Family Income | 145 | $43,618 |
| Mean Family Income | 145 | $55,198 |
| Median Household Income | 251 | $39,625 |
| Mean Household Income | 251 | $48,342 |
| Income Deficit | 145 | $0 |
| Wage / Income Gap (%) | 522 | 15.91% |
| Wage / Income Gap ($) | 522 | 84.09¢ per $1 |
| Gini / Inequality Index | 522 | 0.39 |
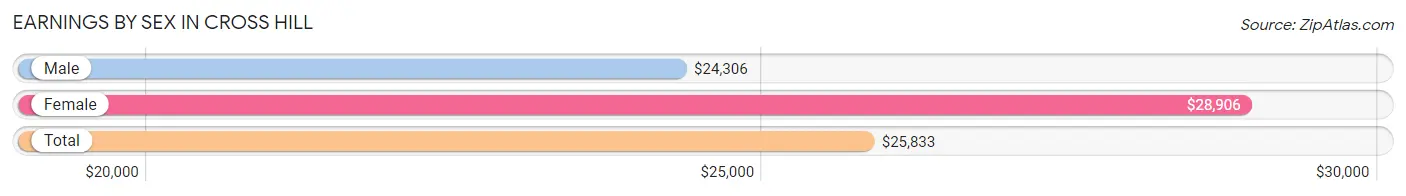
Earnings by Sex in Cross Hill
Average Earnings in Cross Hill are $25,833, $24,306 for men and $28,906 for women, a difference of 15.9%.
| Sex | Number | Average Earnings |
| Male | 131 (55.5%) | $24,306 |
| Female | 105 (44.5%) | $28,906 |
| Total | 236 (100.0%) | $25,833 |
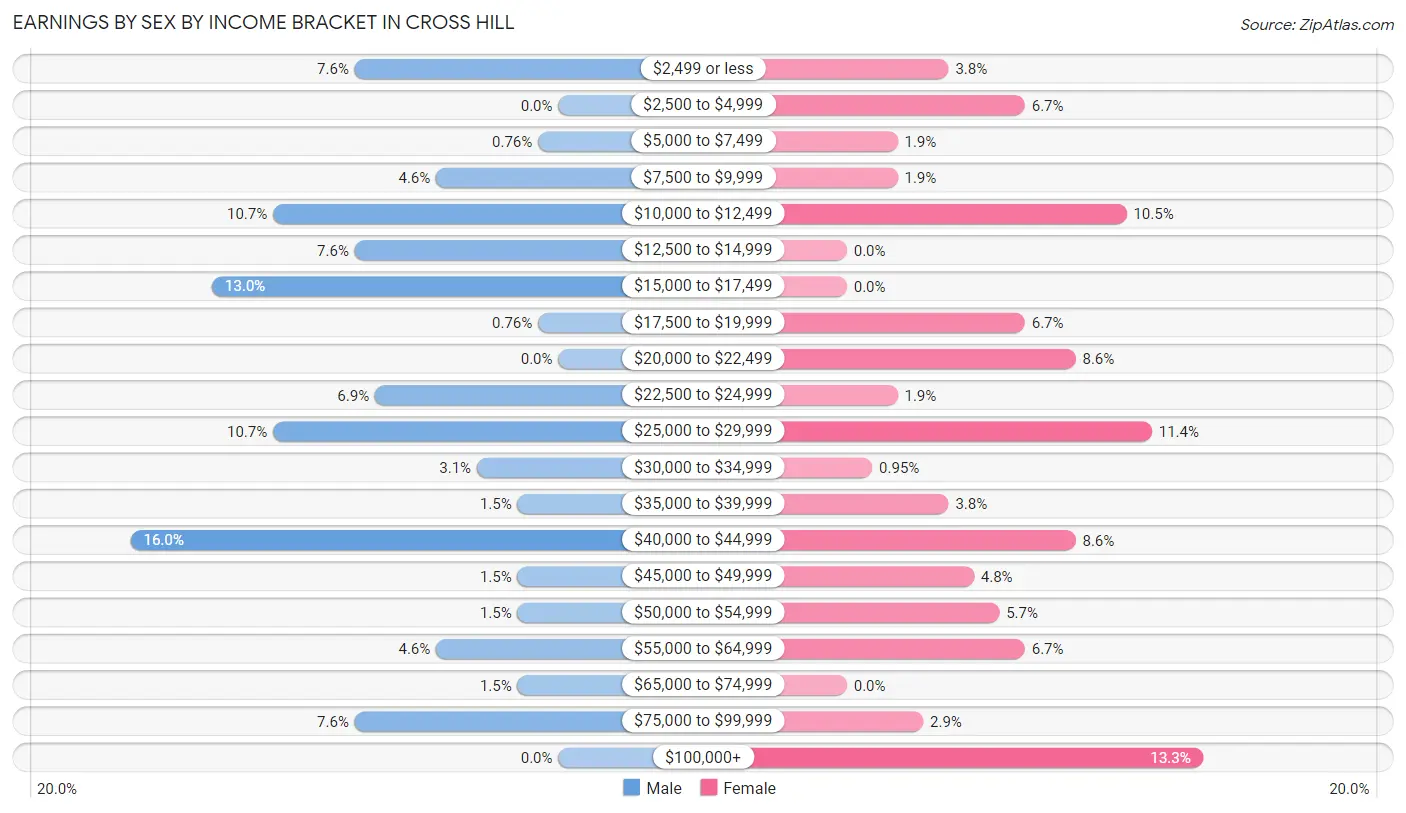
Earnings by Sex by Income Bracket in Cross Hill
The most common earnings brackets in Cross Hill are $40,000 to $44,999 for men (21 | 16.0%) and $100,000+ for women (14 | 13.3%).
| Income | Male | Female |
| $2,499 or less | 10 (7.6%) | 4 (3.8%) |
| $2,500 to $4,999 | 0 (0.0%) | 7 (6.7%) |
| $5,000 to $7,499 | 1 (0.8%) | 2 (1.9%) |
| $7,500 to $9,999 | 6 (4.6%) | 2 (1.9%) |
| $10,000 to $12,499 | 14 (10.7%) | 11 (10.5%) |
| $12,500 to $14,999 | 10 (7.6%) | 0 (0.0%) |
| $15,000 to $17,499 | 17 (13.0%) | 0 (0.0%) |
| $17,500 to $19,999 | 1 (0.8%) | 7 (6.7%) |
| $20,000 to $22,499 | 0 (0.0%) | 9 (8.6%) |
| $22,500 to $24,999 | 9 (6.9%) | 2 (1.9%) |
| $25,000 to $29,999 | 14 (10.7%) | 12 (11.4%) |
| $30,000 to $34,999 | 4 (3.0%) | 1 (0.9%) |
| $35,000 to $39,999 | 2 (1.5%) | 4 (3.8%) |
| $40,000 to $44,999 | 21 (16.0%) | 9 (8.6%) |
| $45,000 to $49,999 | 2 (1.5%) | 5 (4.8%) |
| $50,000 to $54,999 | 2 (1.5%) | 6 (5.7%) |
| $55,000 to $64,999 | 6 (4.6%) | 7 (6.7%) |
| $65,000 to $74,999 | 2 (1.5%) | 0 (0.0%) |
| $75,000 to $99,999 | 10 (7.6%) | 3 (2.9%) |
| $100,000+ | 0 (0.0%) | 14 (13.3%) |
| Total | 131 (100.0%) | 105 (100.0%) |
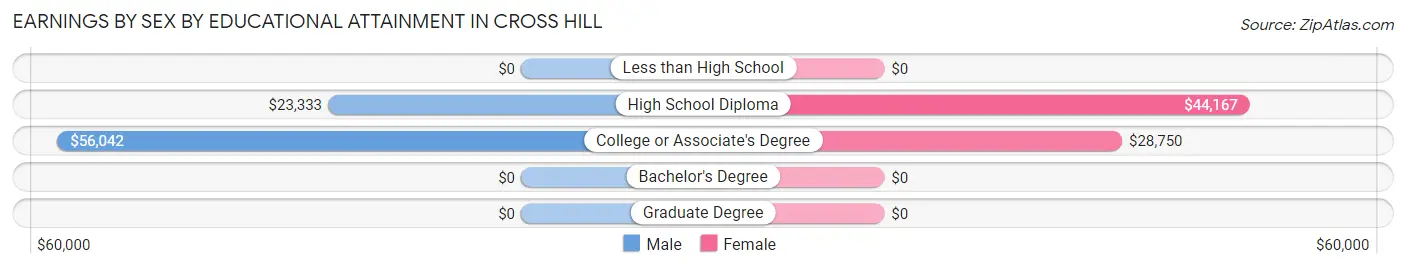
Earnings by Sex by Educational Attainment in Cross Hill
Average earnings in Cross Hill are $25,000 for men and $43,056 for women, a difference of 41.9%. Men with an educational attainment of college or associate's degree enjoy the highest average annual earnings of $56,042, while those with high school diploma education earn the least with $23,333. Women with an educational attainment of high school diploma earn the most with the average annual earnings of $44,167, while those with college or associate's degree education have the smallest earnings of $28,750.
| Educational Attainment | Male Income | Female Income |
| Less than High School | - | - |
| High School Diploma | $23,333 | $44,167 |
| College or Associate's Degree | $56,042 | $28,750 |
| Bachelor's Degree | - | - |
| Graduate Degree | - | - |
| Total | $25,000 | $43,056 |
Family Income in Cross Hill
Family Income Brackets in Cross Hill
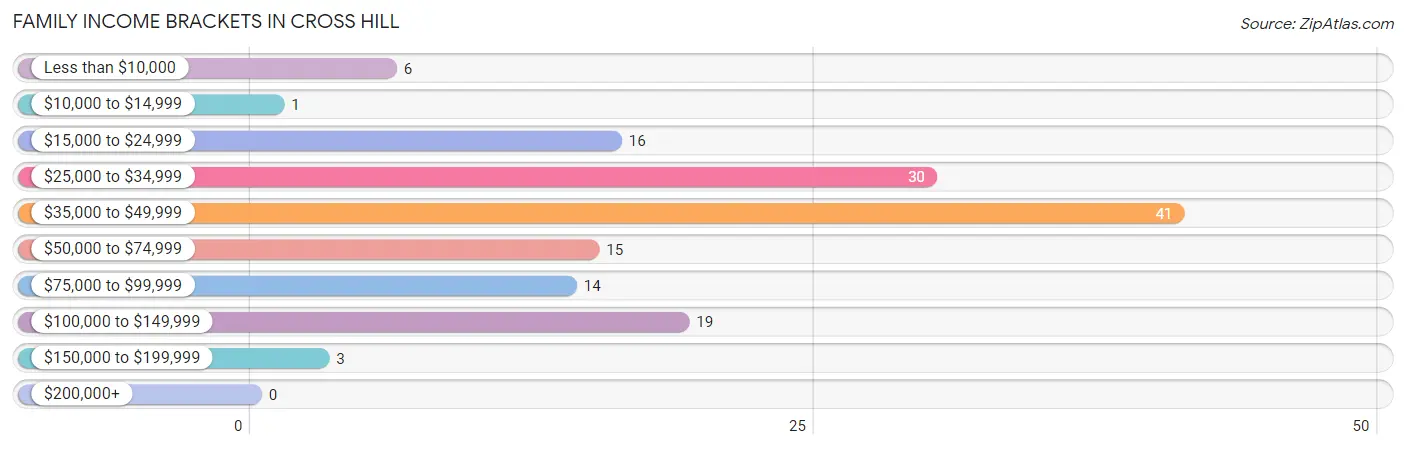
According to the Cross Hill family income data, there are 41 families falling into the $35,000 to $49,999 income range, which is the most common income bracket and makes up 28.3% of all families.
| Income Bracket | # Families | % Families |
| Less than $10,000 | 6 | 4.1% |
| $10,000 to $14,999 | 1 | 0.7% |
| $15,000 to $24,999 | 16 | 11.0% |
| $25,000 to $34,999 | 30 | 20.7% |
| $35,000 to $49,999 | 41 | 28.3% |
| $50,000 to $74,999 | 15 | 10.3% |
| $75,000 to $99,999 | 14 | 9.7% |
| $100,000 to $149,999 | 19 | 13.1% |
| $150,000 to $199,999 | 3 | 2.1% |
| $200,000+ | 0 | 0.0% |
Family Income by Famaliy Size in Cross Hill
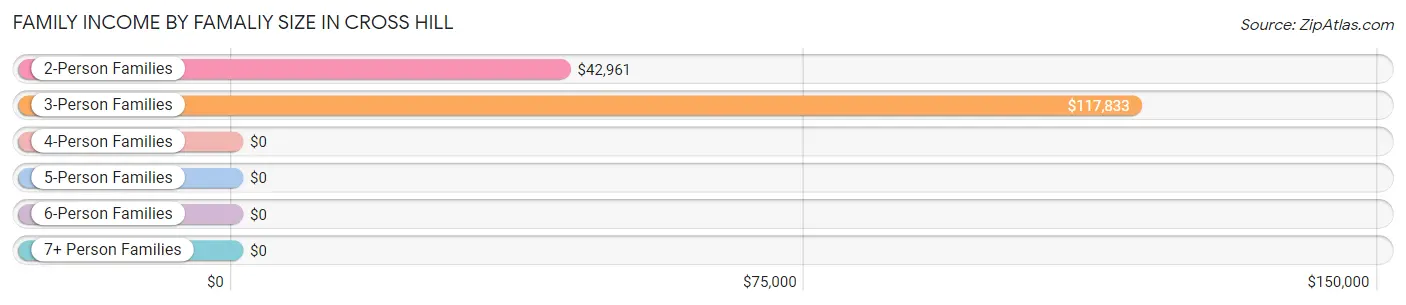
3-person families (26 | 17.9%) account for the highest median family income in Cross Hill with $117,833 per family, while 3-person families (26 | 17.9%) have the highest median income of $39,278 per family member.
| Income Bracket | # Families | Median Income |
| 2-Person Families | 101 (69.7%) | $42,961 |
| 3-Person Families | 26 (17.9%) | $117,833 |
| 4-Person Families | 10 (6.9%) | $0 |
| 5-Person Families | 3 (2.1%) | $0 |
| 6-Person Families | 5 (3.5%) | $0 |
| 7+ Person Families | 0 (0.0%) | $0 |
| Total | 145 (100.0%) | $43,618 |
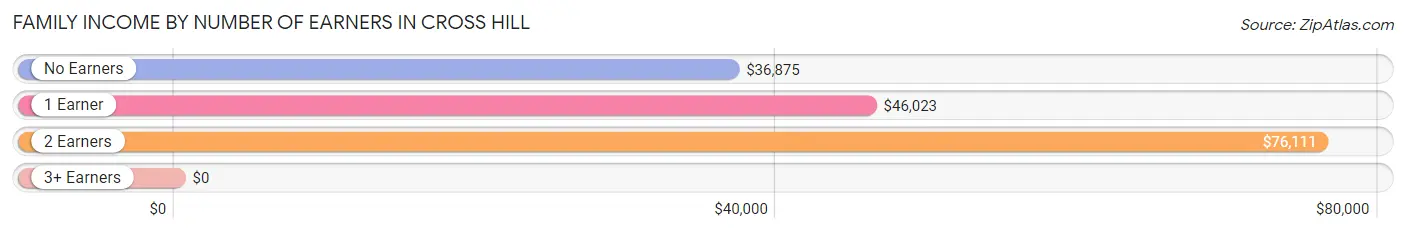
Family Income by Number of Earners in Cross Hill
| Number of Earners | # Families | Median Income |
| No Earners | 41 (28.3%) | $36,875 |
| 1 Earner | 75 (51.7%) | $46,023 |
| 2 Earners | 22 (15.2%) | $76,111 |
| 3+ Earners | 7 (4.8%) | $0 |
| Total | 145 (100.0%) | $43,618 |
Household Income in Cross Hill
Household Income Brackets in Cross Hill
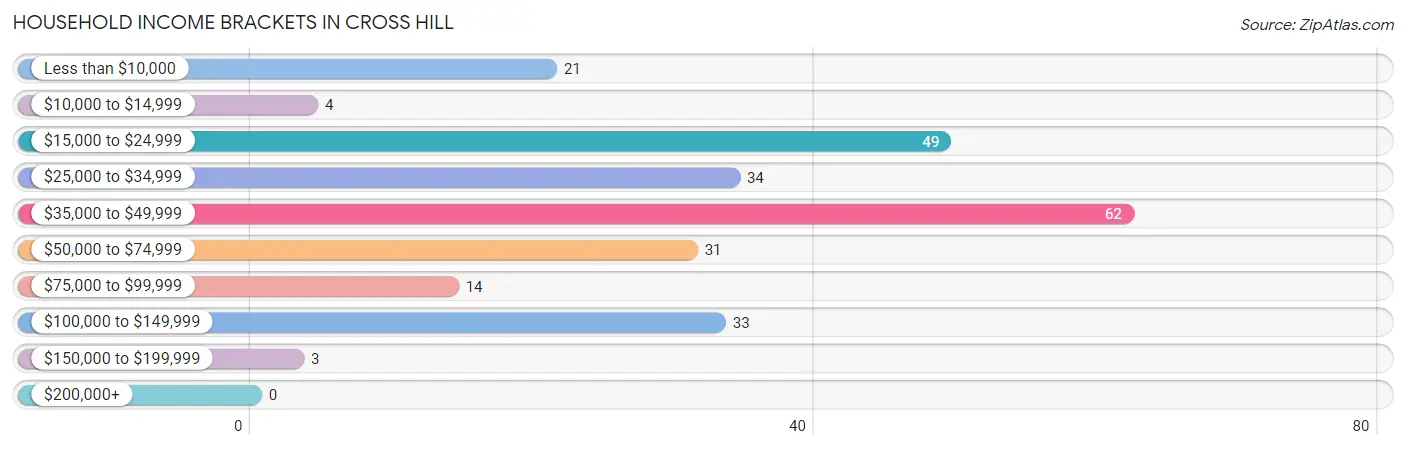
With 62 households falling in the category, the $35,000 to $49,999 income range is the most frequent in Cross Hill, accounting for 24.7% of all households.
| Income Bracket | # Households | % Households |
| Less than $10,000 | 21 | 8.4% |
| $10,000 to $14,999 | 4 | 1.6% |
| $15,000 to $24,999 | 49 | 19.5% |
| $25,000 to $34,999 | 34 | 13.5% |
| $35,000 to $49,999 | 62 | 24.7% |
| $50,000 to $74,999 | 31 | 12.4% |
| $75,000 to $99,999 | 14 | 5.6% |
| $100,000 to $149,999 | 33 | 13.1% |
| $150,000 to $199,999 | 3 | 1.2% |
| $200,000+ | 0 | 0.0% |
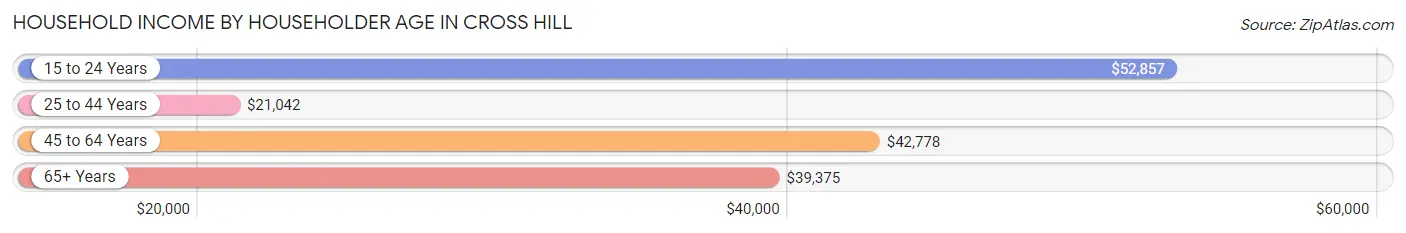
Household Income by Householder Age in Cross Hill
The median household income in Cross Hill is $39,625, with the highest median household income of $52,857 found in the 15 to 24 years age bracket for the primary householder. A total of 12 households (4.8%) fall into this category. Meanwhile, the 25 to 44 years age bracket for the primary householder has the lowest median household income of $21,042, with 25 households (10.0%) in this group.
| Income Bracket | # Households | Median Income |
| 15 to 24 Years | 12 (4.8%) | $52,857 |
| 25 to 44 Years | 25 (10.0%) | $21,042 |
| 45 to 64 Years | 120 (47.8%) | $42,778 |
| 65+ Years | 94 (37.4%) | $39,375 |
| Total | 251 (100.0%) | $39,625 |
Poverty in Cross Hill
Income Below Poverty by Sex and Age in Cross Hill
With 17.8% poverty level for males and 14.9% for females among the residents of Cross Hill, under 5 year old males and 12 to 14 year old females are the most vulnerable to poverty, with 1 males (100.0%) and 5 females (62.5%) in their respective age groups living below the poverty level.
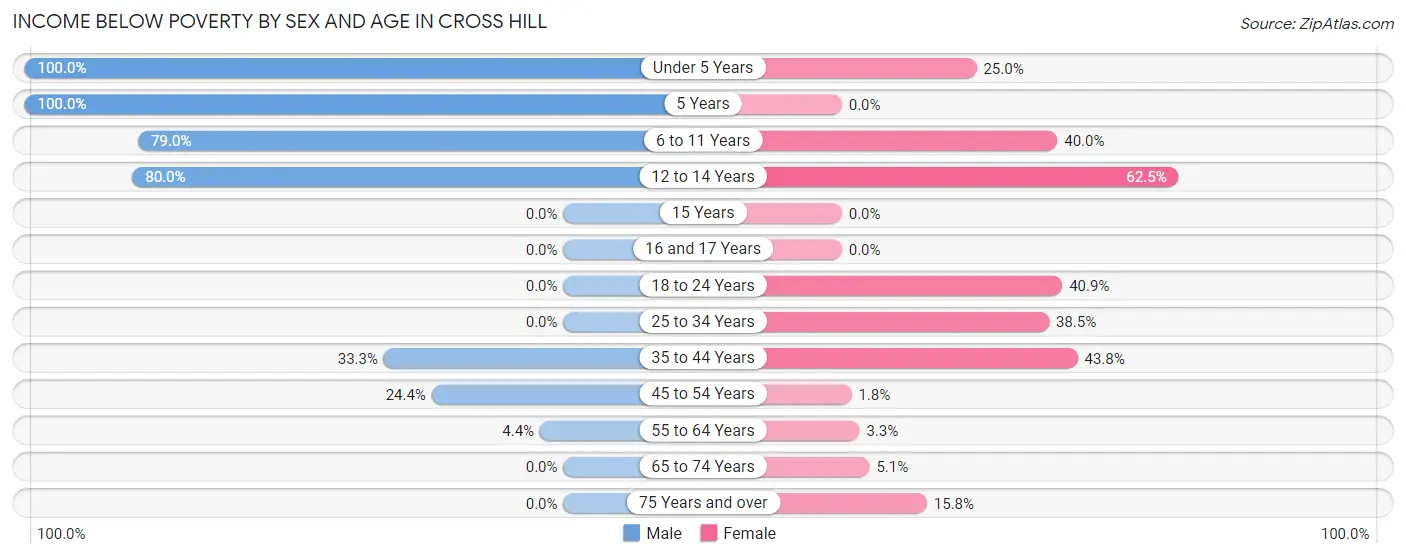
| Age Bracket | Male | Female |
| Under 5 Years | 1 (100.0%) | 1 (25.0%) |
| 5 Years | 5 (100.0%) | 0 (0.0%) |
| 6 to 11 Years | 15 (78.9%) | 2 (40.0%) |
| 12 to 14 Years | 4 (80.0%) | 5 (62.5%) |
| 15 Years | 0 (0.0%) | 0 (0.0%) |
| 16 and 17 Years | 0 (0.0%) | 0 (0.0%) |
| 18 to 24 Years | 0 (0.0%) | 9 (40.9%) |
| 25 to 34 Years | 0 (0.0%) | 5 (38.5%) |
| 35 to 44 Years | 6 (33.3%) | 7 (43.8%) |
| 45 to 54 Years | 11 (24.4%) | 1 (1.8%) |
| 55 to 64 Years | 3 (4.3%) | 2 (3.3%) |
| 65 to 74 Years | 0 (0.0%) | 2 (5.1%) |
| 75 Years and over | 0 (0.0%) | 6 (15.8%) |
| Total | 45 (17.8%) | 40 (14.9%) |
Income Above Poverty by Sex and Age in Cross Hill
According to the poverty statistics in Cross Hill, males aged 16 and 17 years and females aged 5 years are the age groups that are most secure financially, with 100.0% of males and 100.0% of females in these age groups living above the poverty line.
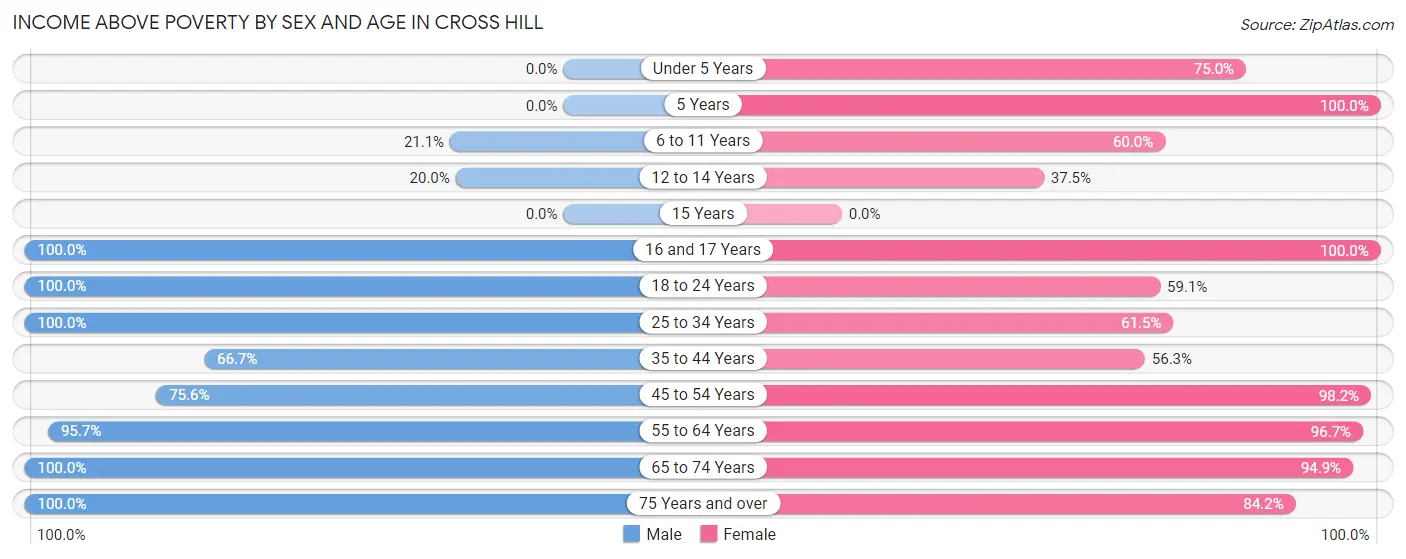
| Age Bracket | Male | Female |
| Under 5 Years | 0 (0.0%) | 3 (75.0%) |
| 5 Years | 0 (0.0%) | 5 (100.0%) |
| 6 to 11 Years | 4 (21.0%) | 3 (60.0%) |
| 12 to 14 Years | 1 (20.0%) | 3 (37.5%) |
| 15 Years | 0 (0.0%) | 0 (0.0%) |
| 16 and 17 Years | 14 (100.0%) | 2 (100.0%) |
| 18 to 24 Years | 29 (100.0%) | 13 (59.1%) |
| 25 to 34 Years | 3 (100.0%) | 8 (61.5%) |
| 35 to 44 Years | 12 (66.7%) | 9 (56.2%) |
| 45 to 54 Years | 34 (75.6%) | 55 (98.2%) |
| 55 to 64 Years | 66 (95.7%) | 59 (96.7%) |
| 65 to 74 Years | 30 (100.0%) | 37 (94.9%) |
| 75 Years and over | 15 (100.0%) | 32 (84.2%) |
| Total | 208 (82.2%) | 229 (85.1%) |
Income Below Poverty Among Married-Couple Families in Cross Hill
The poverty statistics for married-couple families in Cross Hill show that 7.4% or 7 of the total 95 families live below the poverty line. Families with 1 or 2 children have the highest poverty rate of 42.9%, comprising of 6 families. On the other hand, families with 3 or 4 children have the lowest poverty rate of 0.0%, which includes 0 families.
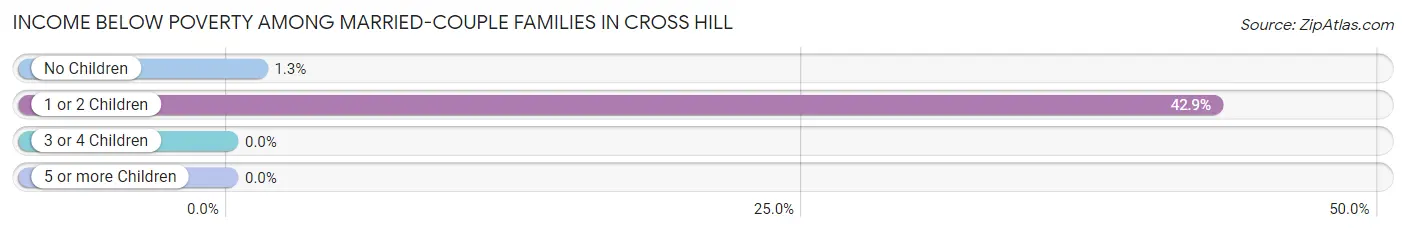
| Children | Above Poverty | Below Poverty |
| No Children | 77 (98.7%) | 1 (1.3%) |
| 1 or 2 Children | 8 (57.1%) | 6 (42.9%) |
| 3 or 4 Children | 3 (100.0%) | 0 (0.0%) |
| 5 or more Children | 0 (0.0%) | 0 (0.0%) |
| Total | 88 (92.6%) | 7 (7.4%) |
Income Below Poverty Among Single-Parent Households in Cross Hill
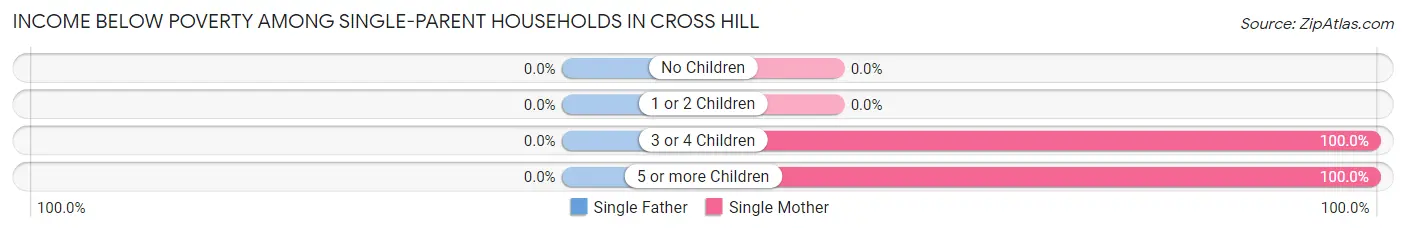
| Children | Single Father | Single Mother |
| No Children | 0 (0.0%) | 0 (0.0%) |
| 1 or 2 Children | 0 (0.0%) | 0 (0.0%) |
| 3 or 4 Children | 0 (0.0%) | 1 (100.0%) |
| 5 or more Children | 0 (0.0%) | 4 (100.0%) |
| Total | 0 (0.0%) | 5 (10.9%) |
Income Below Poverty Among Married-Couple vs Single-Parent Households in Cross Hill
The poverty data for Cross Hill shows that 7 of the married-couple family households (7.4%) and 5 of the single-parent households (10.0%) are living below the poverty level. Within the married-couple family households, those with 1 or 2 children have the highest poverty rate, with 6 households (42.9%) falling below the poverty line. Among the single-parent households, those with 3 or 4 children have the highest poverty rate, with 1 household (100.0%) living below poverty.
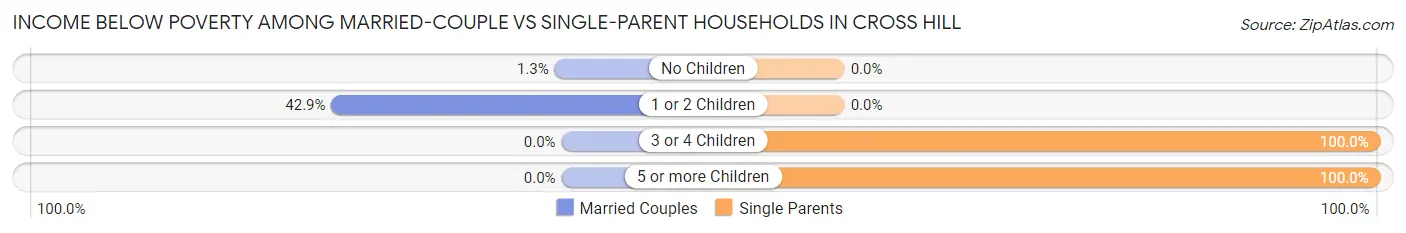
| Children | Married-Couple Families | Single-Parent Households |
| No Children | 1 (1.3%) | 0 (0.0%) |
| 1 or 2 Children | 6 (42.9%) | 0 (0.0%) |
| 3 or 4 Children | 0 (0.0%) | 1 (100.0%) |
| 5 or more Children | 0 (0.0%) | 4 (100.0%) |
| Total | 7 (7.4%) | 5 (10.0%) |
Race in Cross Hill
The most populous races in Cross Hill are Black / African American (265 | 50.8%), White / Caucasian (218 | 41.8%), and Two or more Races (39 | 7.5%).
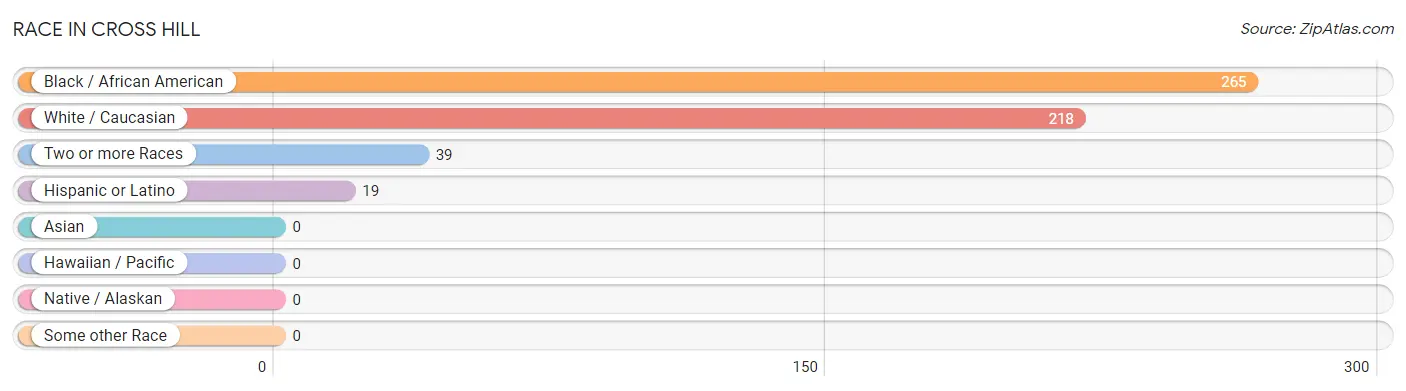
| Race | # Population | % Population |
| Asian | 0 | 0.0% |
| Black / African American | 265 | 50.8% |
| Hawaiian / Pacific | 0 | 0.0% |
| Hispanic or Latino | 19 | 3.6% |
| Native / Alaskan | 0 | 0.0% |
| White / Caucasian | 218 | 41.8% |
| Two or more Races | 39 | 7.5% |
| Some other Race | 0 | 0.0% |
| Total | 522 | 100.0% |
Ancestry in Cross Hill
The most populous ancestries reported in Cross Hill are American (70 | 13.4%), English (54 | 10.3%), German (33 | 6.3%), Irish (25 | 4.8%), and Slavic (14 | 2.7%), together accounting for 37.5% of all Cross Hill residents.
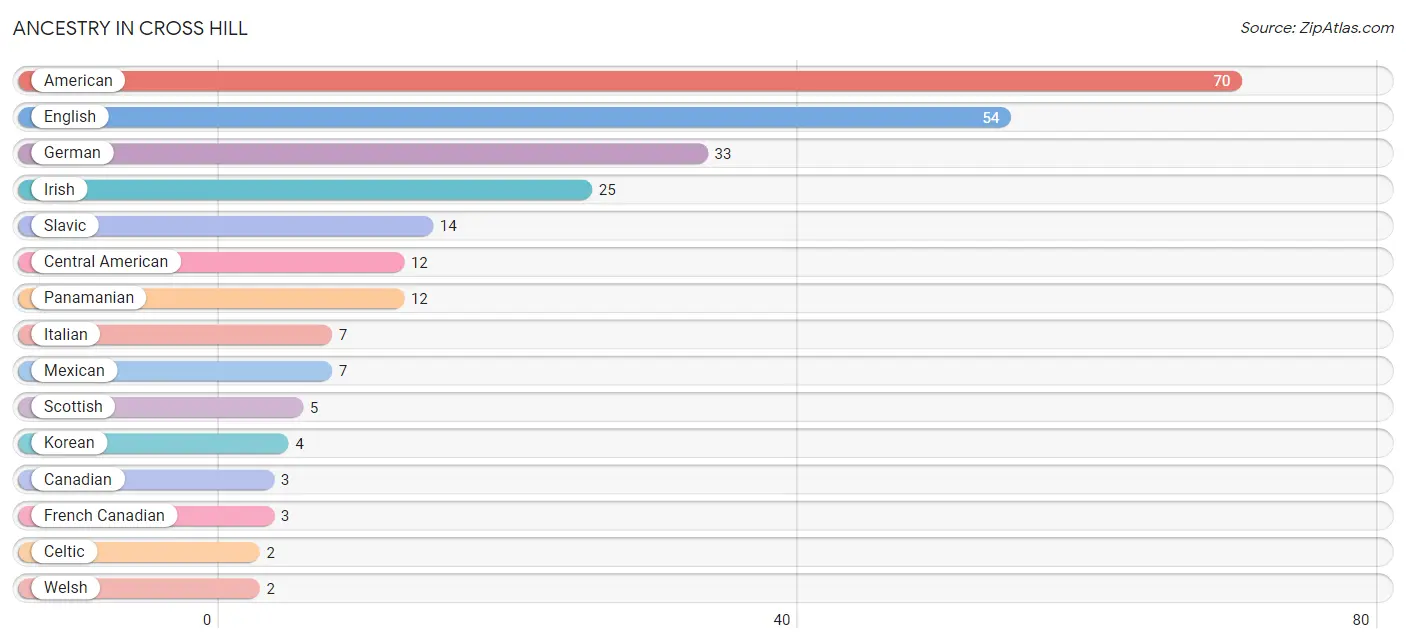
| Ancestry | # Population | % Population |
| American | 70 | 13.4% |
| British | 1 | 0.2% |
| Canadian | 3 | 0.6% |
| Celtic | 2 | 0.4% |
| Central American | 12 | 2.3% |
| English | 54 | 10.3% |
| French Canadian | 3 | 0.6% |
| German | 33 | 6.3% |
| Irish | 25 | 4.8% |
| Italian | 7 | 1.3% |
| Korean | 4 | 0.8% |
| Mexican | 7 | 1.3% |
| Panamanian | 12 | 2.3% |
| Scottish | 5 | 1.0% |
| Slavic | 14 | 2.7% |
| Swedish | 1 | 0.2% |
| Welsh | 2 | 0.4% | View All 17 Rows |
Immigrants in Cross Hill
The most numerous immigrant groups reported in Cross Hill came from Canada (3 | 0.6%), Asia (2 | 0.4%), Philippines (2 | 0.4%), and South Eastern Asia (2 | 0.4%), together accounting for 1.7% of all Cross Hill residents.
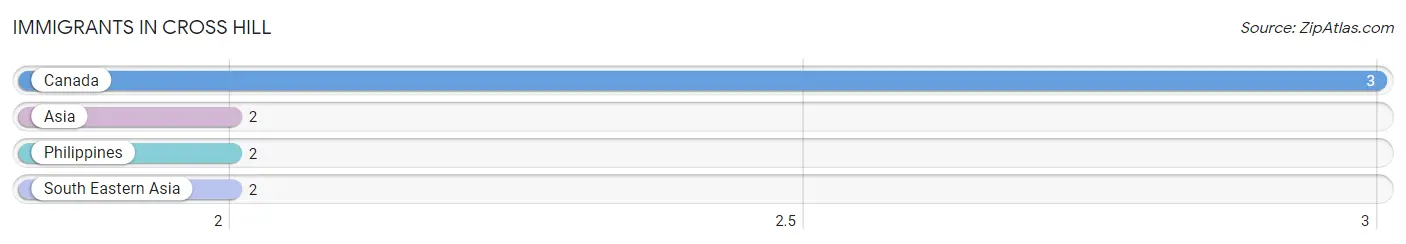
| Immigration Origin | # Population | % Population |
| Asia | 2 | 0.4% |
| Canada | 3 | 0.6% |
| Philippines | 2 | 0.4% |
| South Eastern Asia | 2 | 0.4% | View All 4 Rows |
Sex and Age in Cross Hill
Sex and Age in Cross Hill
The most populous age groups in Cross Hill are 60 to 64 Years (50 | 19.8%) for men and 60 to 64 Years (40 | 14.9%) for women.
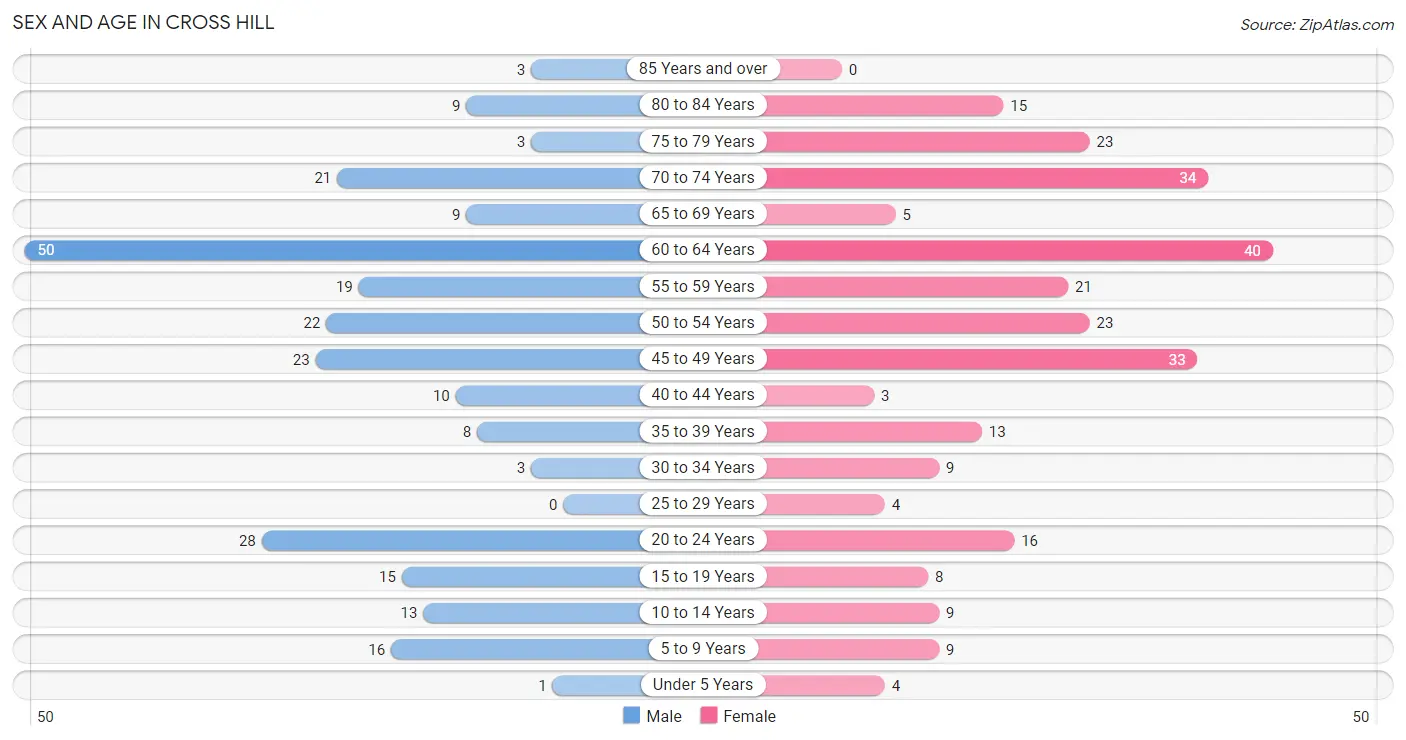
| Age Bracket | Male | Female |
| Under 5 Years | 1 (0.4%) | 4 (1.5%) |
| 5 to 9 Years | 16 (6.3%) | 9 (3.4%) |
| 10 to 14 Years | 13 (5.1%) | 9 (3.4%) |
| 15 to 19 Years | 15 (5.9%) | 8 (3.0%) |
| 20 to 24 Years | 28 (11.1%) | 16 (5.9%) |
| 25 to 29 Years | 0 (0.0%) | 4 (1.5%) |
| 30 to 34 Years | 3 (1.2%) | 9 (3.4%) |
| 35 to 39 Years | 8 (3.2%) | 13 (4.8%) |
| 40 to 44 Years | 10 (4.0%) | 3 (1.1%) |
| 45 to 49 Years | 23 (9.1%) | 33 (12.3%) |
| 50 to 54 Years | 22 (8.7%) | 23 (8.6%) |
| 55 to 59 Years | 19 (7.5%) | 21 (7.8%) |
| 60 to 64 Years | 50 (19.8%) | 40 (14.9%) |
| 65 to 69 Years | 9 (3.6%) | 5 (1.9%) |
| 70 to 74 Years | 21 (8.3%) | 34 (12.6%) |
| 75 to 79 Years | 3 (1.2%) | 23 (8.6%) |
| 80 to 84 Years | 9 (3.6%) | 15 (5.6%) |
| 85 Years and over | 3 (1.2%) | 0 (0.0%) |
| Total | 253 (100.0%) | 269 (100.0%) |
Families and Households in Cross Hill
Median Family Size in Cross Hill
The median family size in Cross Hill is 2.66 persons per family, with married-couple families (95 | 65.5%) accounting for the largest median family size of 2.73 persons per family. On the other hand, single male/father families (4 | 2.8%) represent the smallest median family size with 1.75 persons per family.
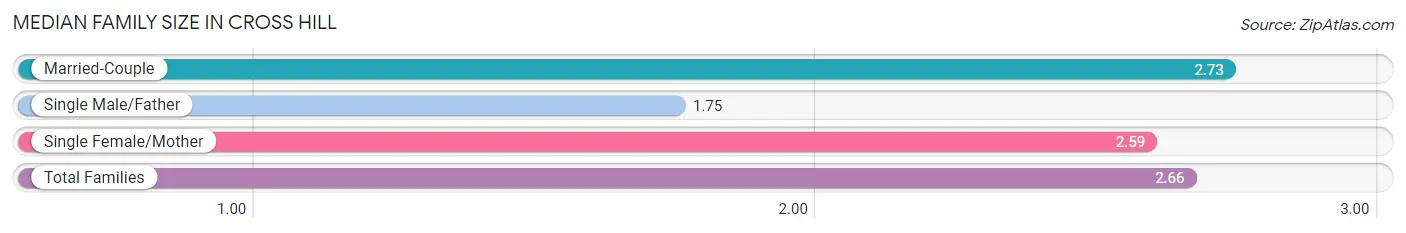
| Family Type | # Families | Family Size |
| Married-Couple | 95 (65.5%) | 2.73 |
| Single Male/Father | 4 (2.8%) | 1.75 |
| Single Female/Mother | 46 (31.7%) | 2.59 |
| Total Families | 145 (100.0%) | 2.66 |
Median Household Size in Cross Hill
The median household size in Cross Hill is 2.08 persons per household, with married-couple households (95 | 37.9%) accounting for the largest median household size of 2.82 persons per household. non-family households (106 | 42.2%) represent the smallest median household size with 1.20 persons per household.
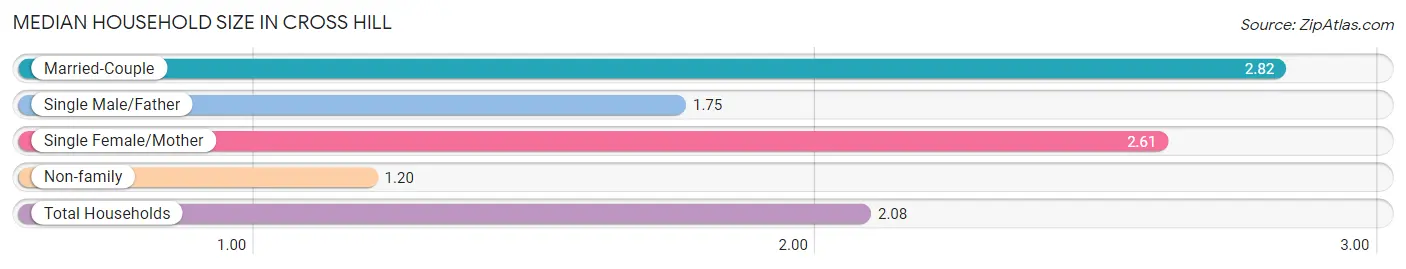
| Household Type | # Households | Household Size |
| Married-Couple | 95 (37.9%) | 2.82 |
| Single Male/Father | 4 (1.6%) | 1.75 |
| Single Female/Mother | 46 (18.3%) | 2.61 |
| Non-family | 106 (42.2%) | 1.20 |
| Total Households | 251 (100.0%) | 2.08 |
Household Size by Marriage Status in Cross Hill
Out of a total of 251 households in Cross Hill, 145 (57.8%) are family households, while 106 (42.2%) are nonfamily households. The most numerous type of family households are 2-person households, comprising 101, and the most common type of nonfamily households are 1-person households, comprising 95.
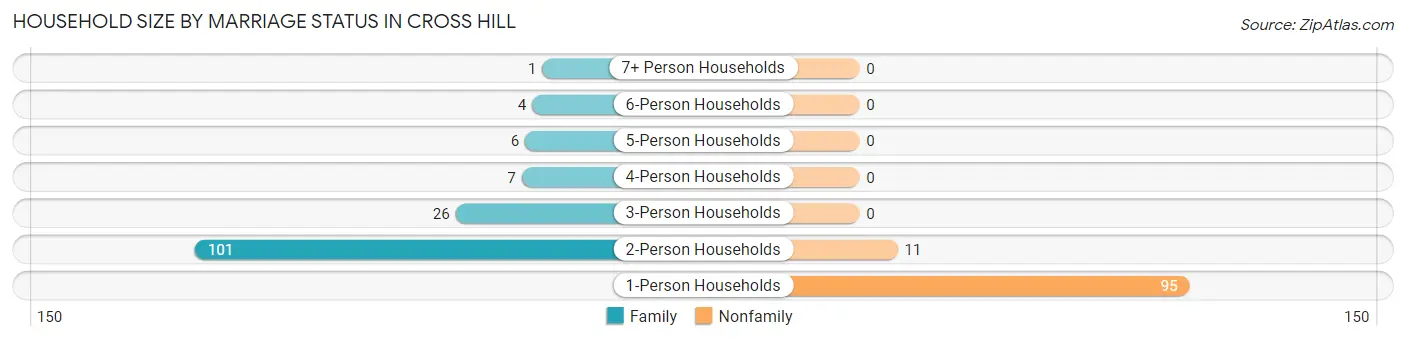
| Household Size | Family Households | Nonfamily Households |
| 1-Person Households | - | 95 (37.9%) |
| 2-Person Households | 101 (40.2%) | 11 (4.4%) |
| 3-Person Households | 26 (10.4%) | 0 (0.0%) |
| 4-Person Households | 7 (2.8%) | 0 (0.0%) |
| 5-Person Households | 6 (2.4%) | 0 (0.0%) |
| 6-Person Households | 4 (1.6%) | 0 (0.0%) |
| 7+ Person Households | 1 (0.4%) | 0 (0.0%) |
| Total | 145 (57.8%) | 106 (42.2%) |
Female Fertility in Cross Hill
Fertility by Age in Cross Hill
Average fertility rate in Cross Hill is 34.0 births per 1,000 women. Women in the age bracket of 20 to 34 years have the highest fertility rate with 103.0 births per 1,000 women. Women in the age bracket of 20 to 34 years acount for 100.0% of all women with births.
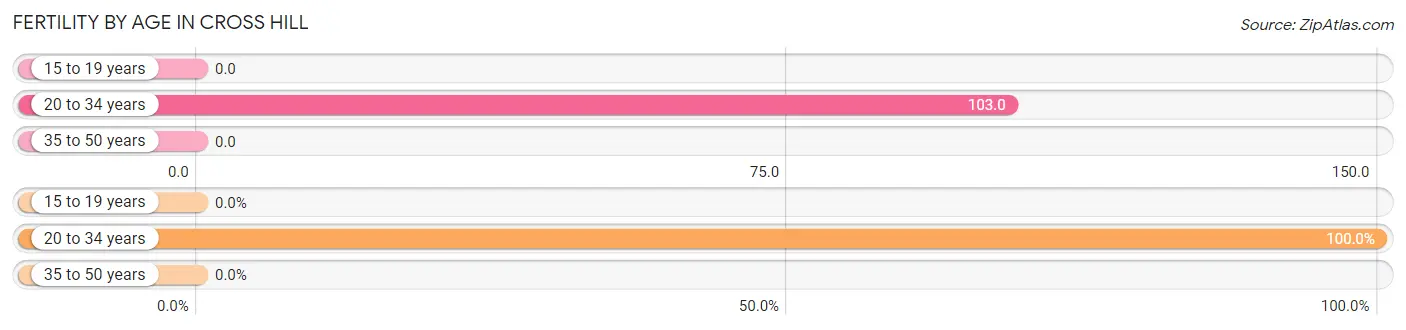
| Age Bracket | Women with Births | Births / 1,000 Women |
| 15 to 19 years | 0 (0.0%) | 0.0 |
| 20 to 34 years | 3 (100.0%) | 103.0 |
| 35 to 50 years | 0 (0.0%) | 0.0 |
| Total | 3 (100.0%) | 34.0 |
Fertility by Age by Marriage Status in Cross Hill
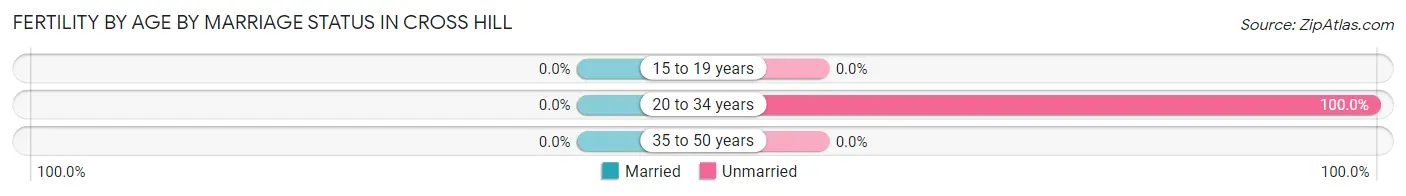
| Age Bracket | Married | Unmarried |
| 15 to 19 years | 0 (0.0%) | 0 (0.0%) |
| 20 to 34 years | 0 (0.0%) | 3 (100.0%) |
| 35 to 50 years | 0 (0.0%) | 0 (0.0%) |
| Total | 0 (0.0%) | 3 (100.0%) |
Fertility by Education in Cross Hill
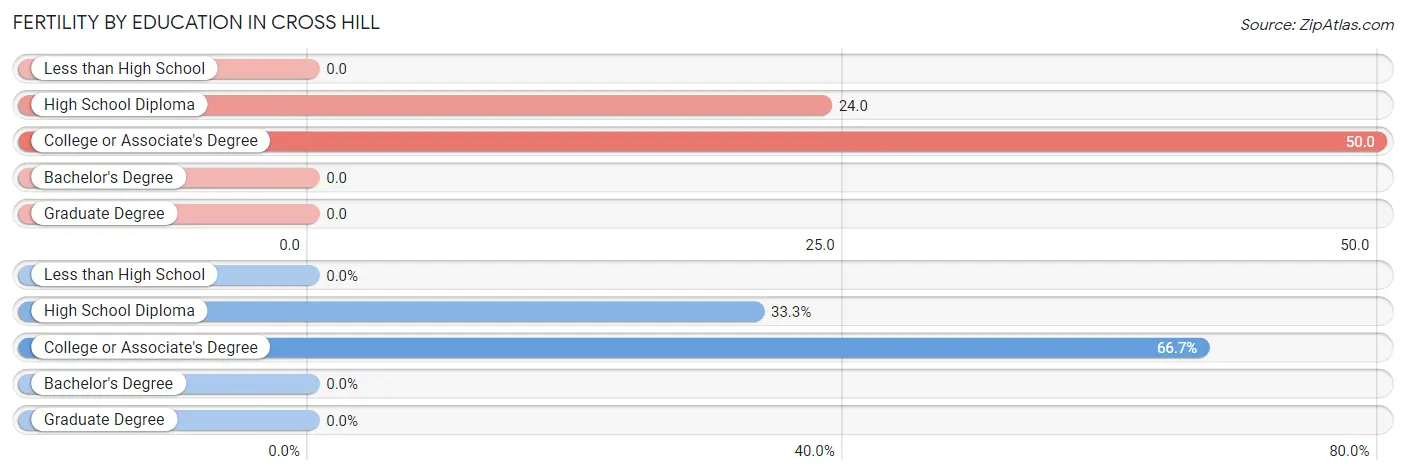
| Educational Attainment | Women with Births | Births / 1,000 Women |
| Less than High School | 0 (0.0%) | 0.0 |
| High School Diploma | 1 (33.3%) | 24.0 |
| College or Associate's Degree | 2 (66.7%) | 50.0 |
| Bachelor's Degree | 0 (0.0%) | 0.0 |
| Graduate Degree | 0 (0.0%) | 0.0 |
| Total | 3 (100.0%) | 34.0 |
Fertility by Education by Marriage Status in Cross Hill
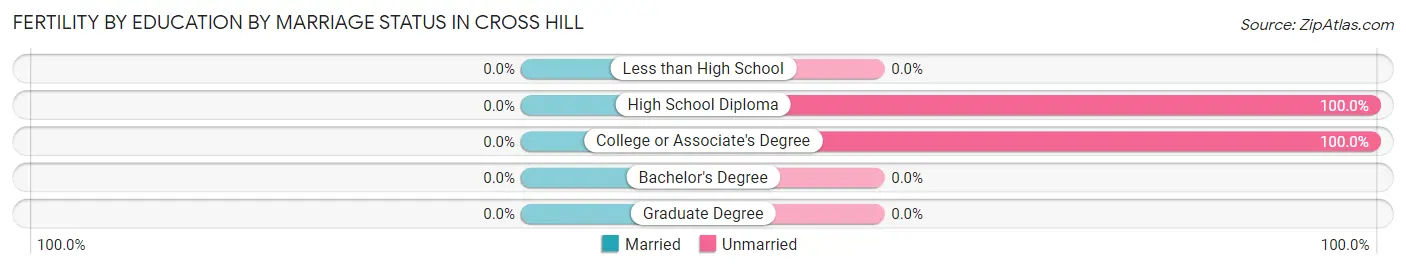
| Educational Attainment | Married | Unmarried |
| Less than High School | 0 (0.0%) | 0 (0.0%) |
| High School Diploma | 0 (0.0%) | 1 (100.0%) |
| College or Associate's Degree | 0 (0.0%) | 2 (100.0%) |
| Bachelor's Degree | 0 (0.0%) | 0 (0.0%) |
| Graduate Degree | 0 (0.0%) | 0 (0.0%) |
| Total | 0 (0.0%) | 3 (100.0%) |
Employment Characteristics in Cross Hill
Employment by Class of Employer in Cross Hill
Among the 209 employed individuals in Cross Hill, private company employees (166 | 79.4%), self-employed (not incorporated) (13 | 6.2%), and self-employed (incorporated) (12 | 5.7%) make up the most common classes of employment.
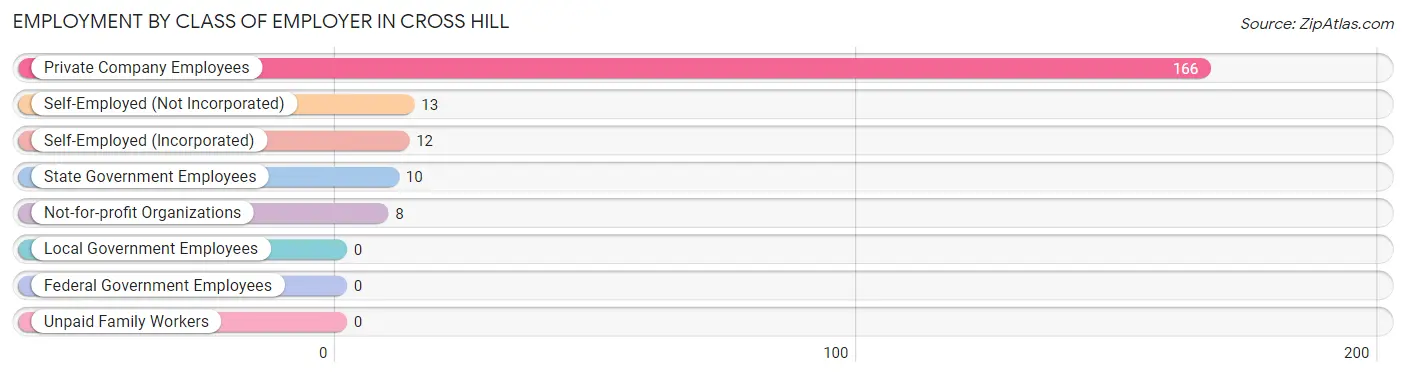
| Employer Class | # Employees | % Employees |
| Private Company Employees | 166 | 79.4% |
| Self-Employed (Incorporated) | 12 | 5.7% |
| Self-Employed (Not Incorporated) | 13 | 6.2% |
| Not-for-profit Organizations | 8 | 3.8% |
| Local Government Employees | 0 | 0.0% |
| State Government Employees | 10 | 4.8% |
| Federal Government Employees | 0 | 0.0% |
| Unpaid Family Workers | 0 | 0.0% |
| Total | 209 | 100.0% |
Employment Status by Age in Cross Hill
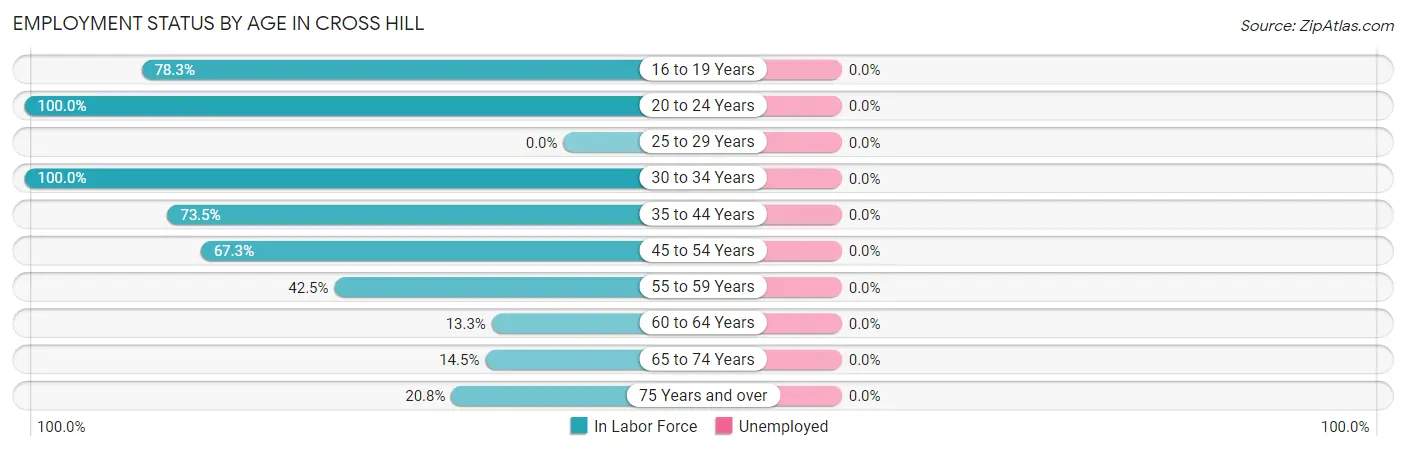
| Age Bracket | In Labor Force | Unemployed |
| 16 to 19 Years | 18 (78.3%) | 0 (0.0%) |
| 20 to 24 Years | 44 (100.0%) | 0 (0.0%) |
| 25 to 29 Years | 0 (0.0%) | 0 (0.0%) |
| 30 to 34 Years | 12 (100.0%) | 0 (0.0%) |
| 35 to 44 Years | 25 (73.5%) | 0 (0.0%) |
| 45 to 54 Years | 68 (67.3%) | 0 (0.0%) |
| 55 to 59 Years | 17 (42.5%) | 0 (0.0%) |
| 60 to 64 Years | 12 (13.3%) | 0 (0.0%) |
| 65 to 74 Years | 10 (14.5%) | 0 (0.0%) |
| 75 Years and over | 11 (20.8%) | 0 (0.0%) |
| Total | 217 (46.2%) | 0 (0.0%) |
Employment Status by Educational Attainment in Cross Hill
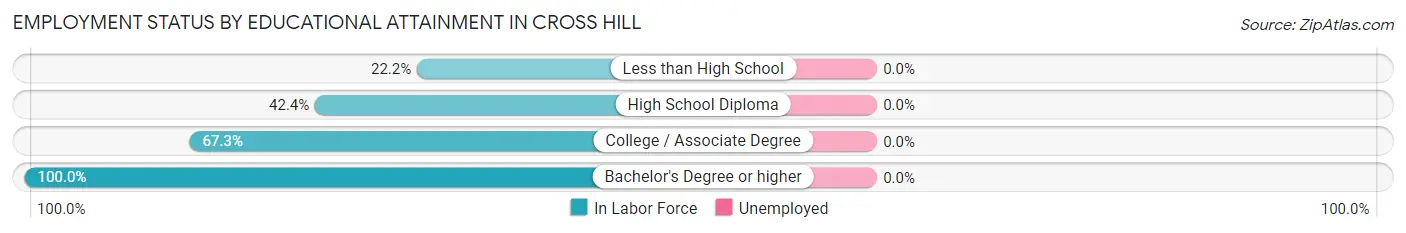
| Educational Attainment | In Labor Force | Unemployed |
| Less than High School | 6 (22.2%) | 0 (0.0%) |
| High School Diploma | 81 (42.4%) | 0 (0.0%) |
| College / Associate Degree | 33 (67.3%) | 0 (0.0%) |
| Bachelor's Degree or higher | 14 (100.0%) | 0 (0.0%) |
| Total | 134 (47.7%) | 0 (0.0%) |
Employment Occupations by Sex in Cross Hill
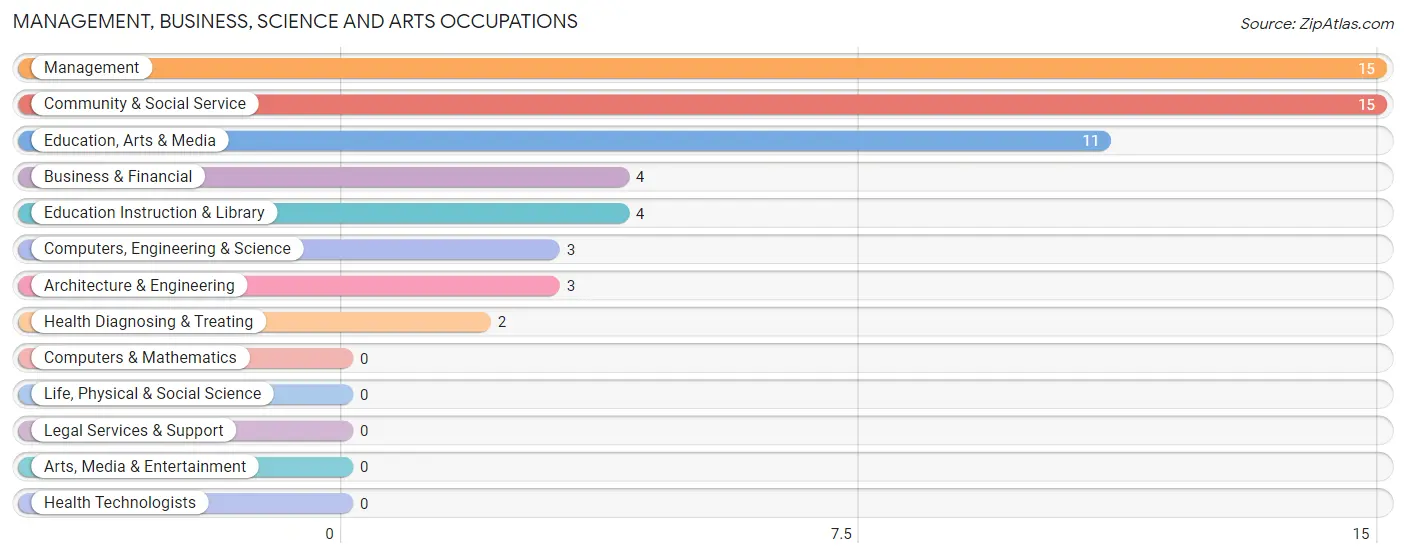
Management, Business, Science and Arts Occupations
The most common Management, Business, Science and Arts occupations in Cross Hill are Management (15 | 6.9%), Community & Social Service (15 | 6.9%), Education, Arts & Media (11 | 5.1%), Business & Financial (4 | 1.8%), and Education Instruction & Library (4 | 1.8%).
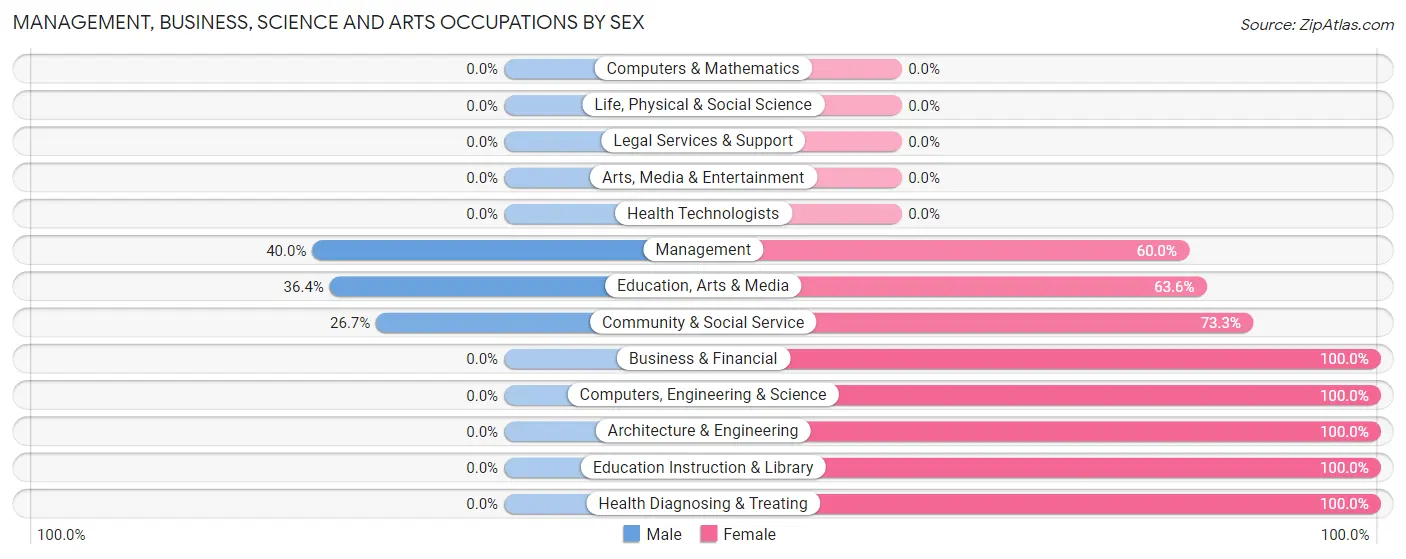
Management, Business, Science and Arts Occupations by Sex
Within the Management, Business, Science and Arts occupations in Cross Hill, the most male-oriented occupations are Management (40.0%), Education, Arts & Media (36.4%), and Community & Social Service (26.7%), while the most female-oriented occupations are Business & Financial (100.0%), Computers, Engineering & Science (100.0%), and Architecture & Engineering (100.0%).
| Occupation | Male | Female |
| Management | 6 (40.0%) | 9 (60.0%) |
| Business & Financial | 0 (0.0%) | 4 (100.0%) |
| Computers, Engineering & Science | 0 (0.0%) | 3 (100.0%) |
| Computers & Mathematics | 0 (0.0%) | 0 (0.0%) |
| Architecture & Engineering | 0 (0.0%) | 3 (100.0%) |
| Life, Physical & Social Science | 0 (0.0%) | 0 (0.0%) |
| Community & Social Service | 4 (26.7%) | 11 (73.3%) |
| Education, Arts & Media | 4 (36.4%) | 7 (63.6%) |
| Legal Services & Support | 0 (0.0%) | 0 (0.0%) |
| Education Instruction & Library | 0 (0.0%) | 4 (100.0%) |
| Arts, Media & Entertainment | 0 (0.0%) | 0 (0.0%) |
| Health Diagnosing & Treating | 0 (0.0%) | 2 (100.0%) |
| Health Technologists | 0 (0.0%) | 0 (0.0%) |
| Total (Category) | 10 (25.6%) | 29 (74.4%) |
| Total (Overall) | 128 (59.0%) | 89 (41.0%) |
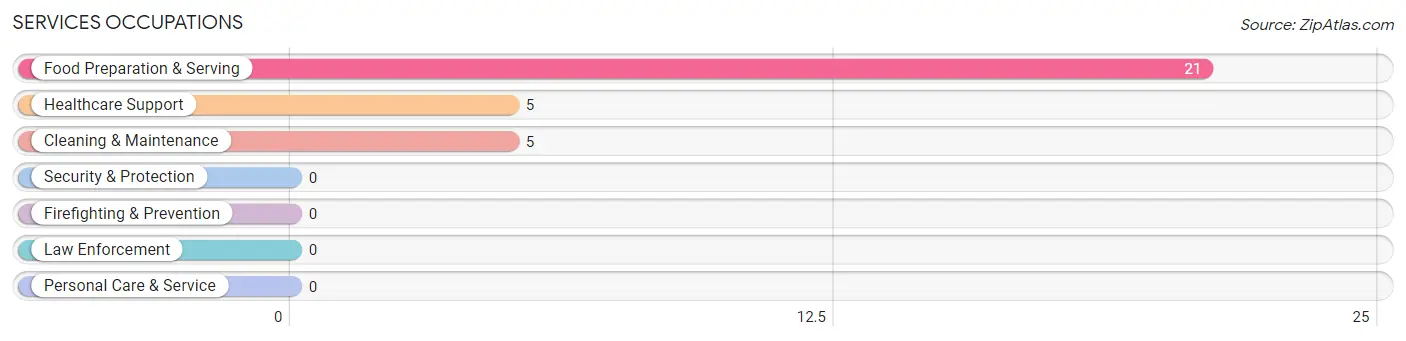
Services Occupations
The most common Services occupations in Cross Hill are Food Preparation & Serving (21 | 9.7%), Healthcare Support (5 | 2.3%), and Cleaning & Maintenance (5 | 2.3%).
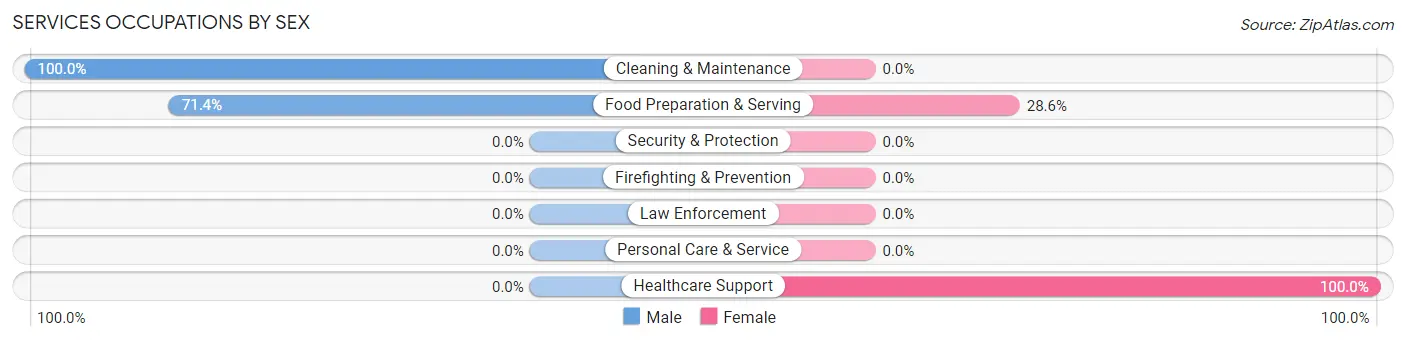
Services Occupations by Sex
Within the Services occupations in Cross Hill, the most male-oriented occupations are Cleaning & Maintenance (100.0%), and Food Preparation & Serving (71.4%), while the most female-oriented occupations are Healthcare Support (100.0%), and Food Preparation & Serving (28.6%).
| Occupation | Male | Female |
| Healthcare Support | 0 (0.0%) | 5 (100.0%) |
| Security & Protection | 0 (0.0%) | 0 (0.0%) |
| Firefighting & Prevention | 0 (0.0%) | 0 (0.0%) |
| Law Enforcement | 0 (0.0%) | 0 (0.0%) |
| Food Preparation & Serving | 15 (71.4%) | 6 (28.6%) |
| Cleaning & Maintenance | 5 (100.0%) | 0 (0.0%) |
| Personal Care & Service | 0 (0.0%) | 0 (0.0%) |
| Total (Category) | 20 (64.5%) | 11 (35.5%) |
| Total (Overall) | 128 (59.0%) | 89 (41.0%) |
Sales and Office Occupations
The most common Sales and Office occupations in Cross Hill are Sales & Related (8 | 3.7%), and Office & Administration (7 | 3.2%).
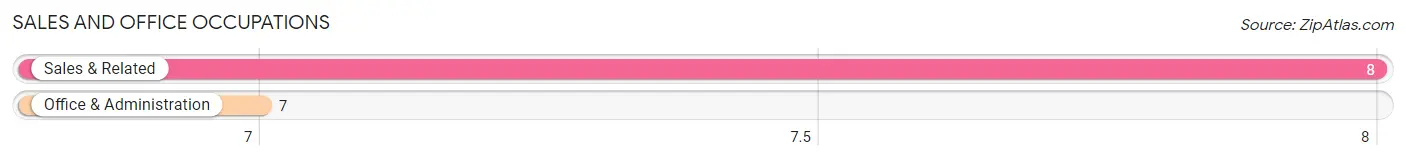
Sales and Office Occupations by Sex
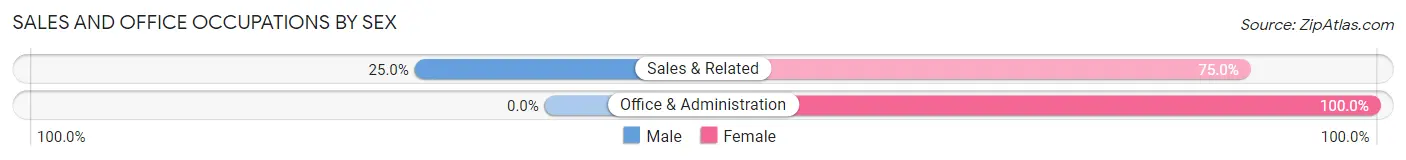
| Occupation | Male | Female |
| Sales & Related | 2 (25.0%) | 6 (75.0%) |
| Office & Administration | 0 (0.0%) | 7 (100.0%) |
| Total (Category) | 2 (13.3%) | 13 (86.7%) |
| Total (Overall) | 128 (59.0%) | 89 (41.0%) |
Natural Resources, Construction and Maintenance Occupations
The most common Natural Resources, Construction and Maintenance occupations in Cross Hill are Construction & Extraction (27 | 12.4%), and Installation, Maintenance & Repair (11 | 5.1%).
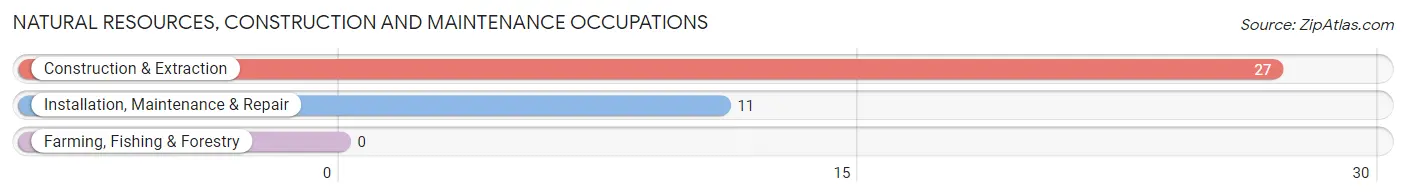
Natural Resources, Construction and Maintenance Occupations by Sex
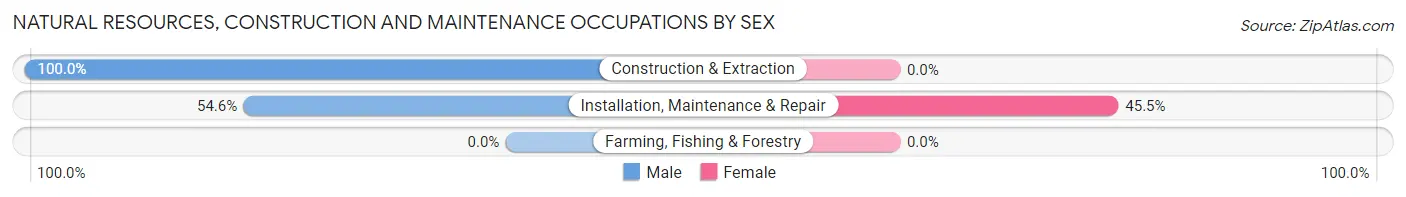
| Occupation | Male | Female |
| Farming, Fishing & Forestry | 0 (0.0%) | 0 (0.0%) |
| Construction & Extraction | 27 (100.0%) | 0 (0.0%) |
| Installation, Maintenance & Repair | 6 (54.5%) | 5 (45.5%) |
| Total (Category) | 33 (86.8%) | 5 (13.2%) |
| Total (Overall) | 128 (59.0%) | 89 (41.0%) |
Production, Transportation and Moving Occupations
The most common Production, Transportation and Moving occupations in Cross Hill are Production (63 | 29.0%), Material Moving (21 | 9.7%), and Transportation (10 | 4.6%).
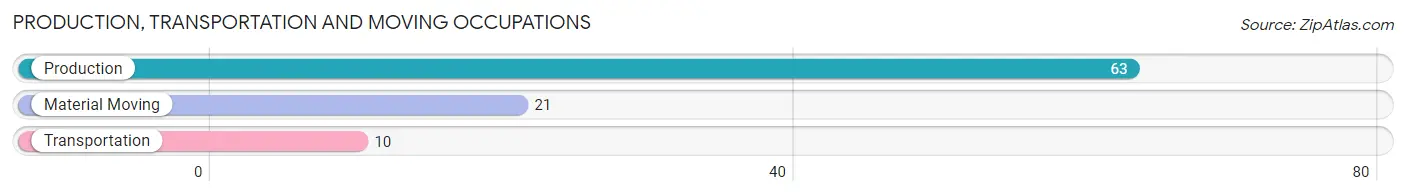
Production, Transportation and Moving Occupations by Sex
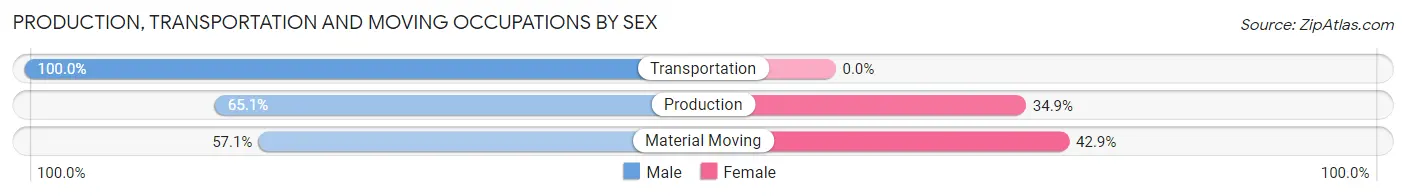
| Occupation | Male | Female |
| Production | 41 (65.1%) | 22 (34.9%) |
| Transportation | 10 (100.0%) | 0 (0.0%) |
| Material Moving | 12 (57.1%) | 9 (42.9%) |
| Total (Category) | 63 (67.0%) | 31 (33.0%) |
| Total (Overall) | 128 (59.0%) | 89 (41.0%) |
Employment Industries by Sex in Cross Hill
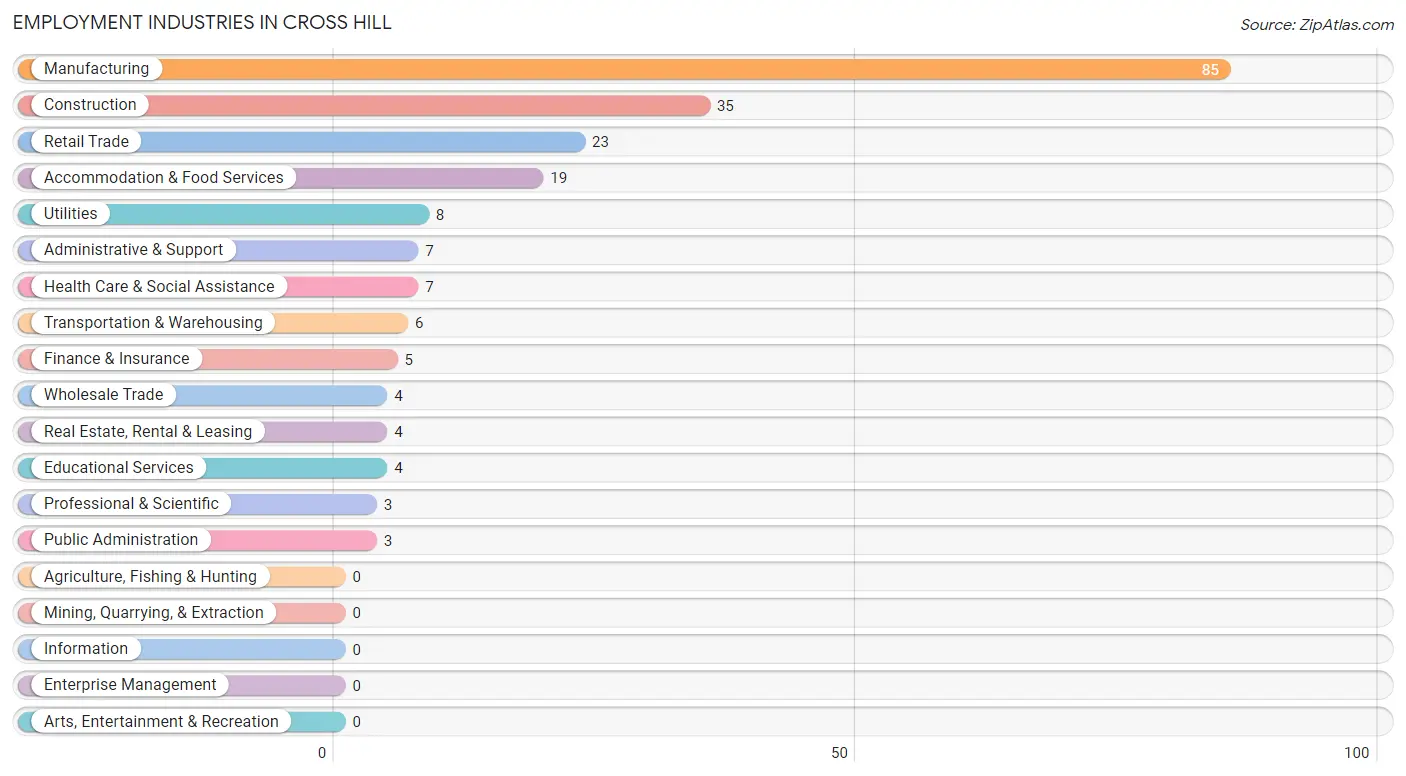
Employment Industries in Cross Hill
The major employment industries in Cross Hill include Manufacturing (85 | 39.2%), Construction (35 | 16.1%), Retail Trade (23 | 10.6%), Accommodation & Food Services (19 | 8.8%), and Utilities (8 | 3.7%).
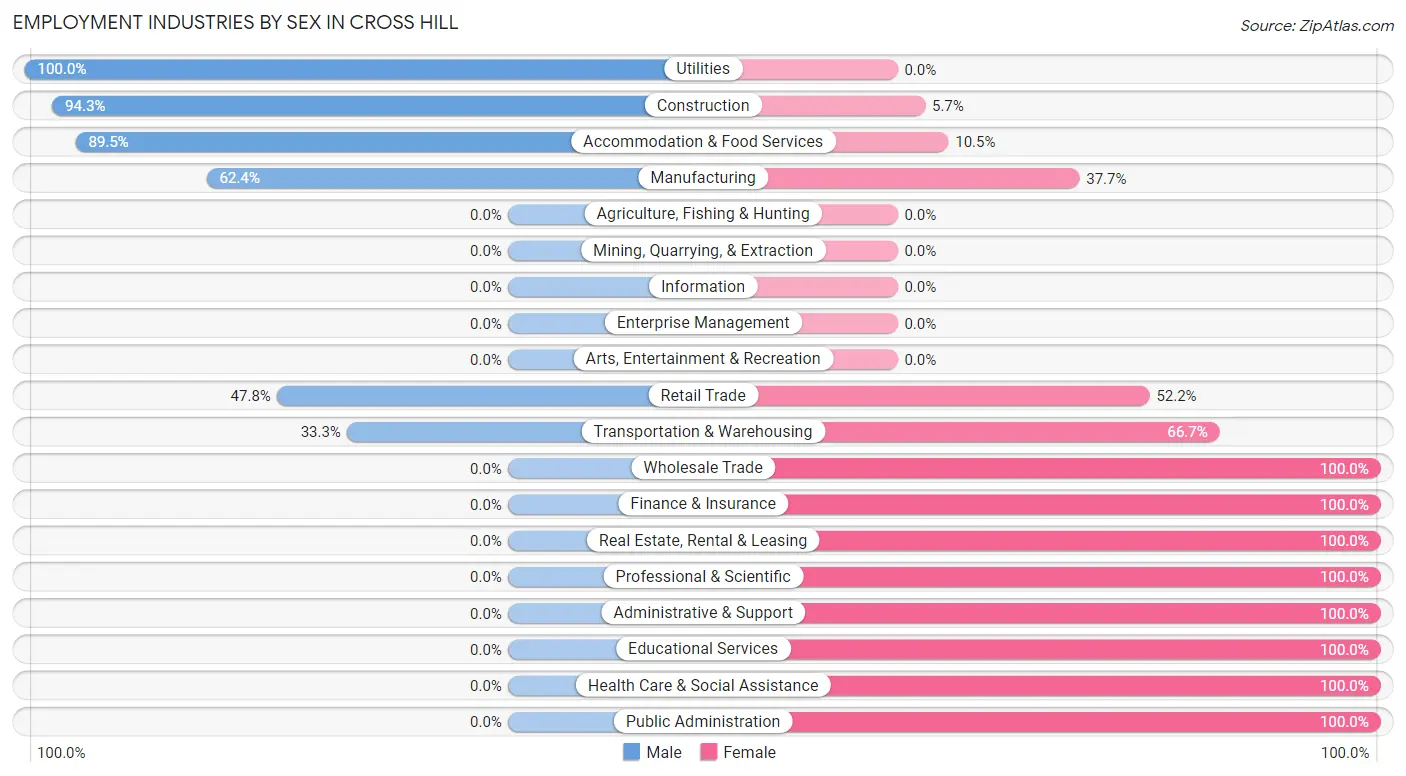
Employment Industries by Sex in Cross Hill
The Cross Hill industries that see more men than women are Utilities (100.0%), Construction (94.3%), and Accommodation & Food Services (89.5%), whereas the industries that tend to have a higher number of women are Wholesale Trade (100.0%), Finance & Insurance (100.0%), and Real Estate, Rental & Leasing (100.0%).
| Industry | Male | Female |
| Agriculture, Fishing & Hunting | 0 (0.0%) | 0 (0.0%) |
| Mining, Quarrying, & Extraction | 0 (0.0%) | 0 (0.0%) |
| Construction | 33 (94.3%) | 2 (5.7%) |
| Manufacturing | 53 (62.4%) | 32 (37.7%) |
| Wholesale Trade | 0 (0.0%) | 4 (100.0%) |
| Retail Trade | 11 (47.8%) | 12 (52.2%) |
| Transportation & Warehousing | 2 (33.3%) | 4 (66.7%) |
| Utilities | 8 (100.0%) | 0 (0.0%) |
| Information | 0 (0.0%) | 0 (0.0%) |
| Finance & Insurance | 0 (0.0%) | 5 (100.0%) |
| Real Estate, Rental & Leasing | 0 (0.0%) | 4 (100.0%) |
| Professional & Scientific | 0 (0.0%) | 3 (100.0%) |
| Enterprise Management | 0 (0.0%) | 0 (0.0%) |
| Administrative & Support | 0 (0.0%) | 7 (100.0%) |
| Educational Services | 0 (0.0%) | 4 (100.0%) |
| Health Care & Social Assistance | 0 (0.0%) | 7 (100.0%) |
| Arts, Entertainment & Recreation | 0 (0.0%) | 0 (0.0%) |
| Accommodation & Food Services | 17 (89.5%) | 2 (10.5%) |
| Public Administration | 0 (0.0%) | 3 (100.0%) |
| Total | 128 (59.0%) | 89 (41.0%) |
Education in Cross Hill
School Enrollment in Cross Hill
The most common levels of schooling among the 78 students in Cross Hill are high school (22 | 28.2%), elementary school (15 | 19.2%), and middle school (15 | 19.2%).
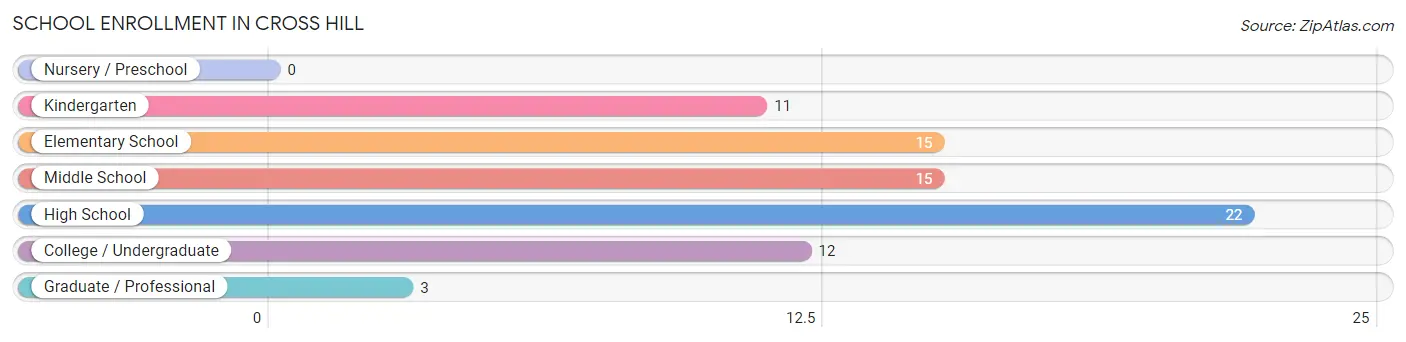
| School Level | # Students | % Students |
| Nursery / Preschool | 0 | 0.0% |
| Kindergarten | 11 | 14.1% |
| Elementary School | 15 | 19.2% |
| Middle School | 15 | 19.2% |
| High School | 22 | 28.2% |
| College / Undergraduate | 12 | 15.4% |
| Graduate / Professional | 3 | 3.8% |
| Total | 78 | 100.0% |
School Enrollment by Age by Funding Source in Cross Hill
Out of a total of 78 students who are enrolled in schools in Cross Hill, 14 (17.9%) attend a private institution, while the remaining 64 (82.1%) are enrolled in public schools. The age group of 20 to 24 year olds has the highest likelihood of being enrolled in private schools, with 5 (71.4% in the age bracket) enrolled. Conversely, the age group of 15 to 17 year olds has the lowest likelihood of being enrolled in a private school, with 16 (100.0% in the age bracket) attending a public institution.
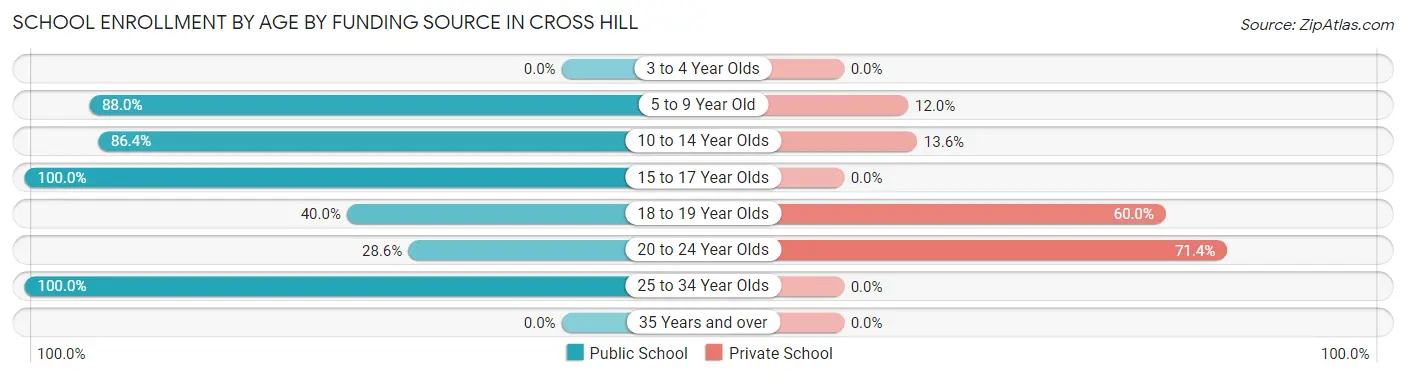
| Age Bracket | Public School | Private School |
| 3 to 4 Year Olds | 0 (0.0%) | 0 (0.0%) |
| 5 to 9 Year Old | 22 (88.0%) | 3 (12.0%) |
| 10 to 14 Year Olds | 19 (86.4%) | 3 (13.6%) |
| 15 to 17 Year Olds | 16 (100.0%) | 0 (0.0%) |
| 18 to 19 Year Olds | 2 (40.0%) | 3 (60.0%) |
| 20 to 24 Year Olds | 2 (28.6%) | 5 (71.4%) |
| 25 to 34 Year Olds | 3 (100.0%) | 0 (0.0%) |
| 35 Years and over | 0 (0.0%) | 0 (0.0%) |
| Total | 64 (82.1%) | 14 (17.9%) |
Educational Attainment by Field of Study in Cross Hill
Arts & humanities (7 | 36.8%), science & technology (4 | 21.0%), business (4 | 21.0%), liberal arts & history (3 | 15.8%), and physical & health sciences (1 | 5.3%) are the most common fields of study among 19 individuals in Cross Hill who have obtained a bachelor's degree or higher.
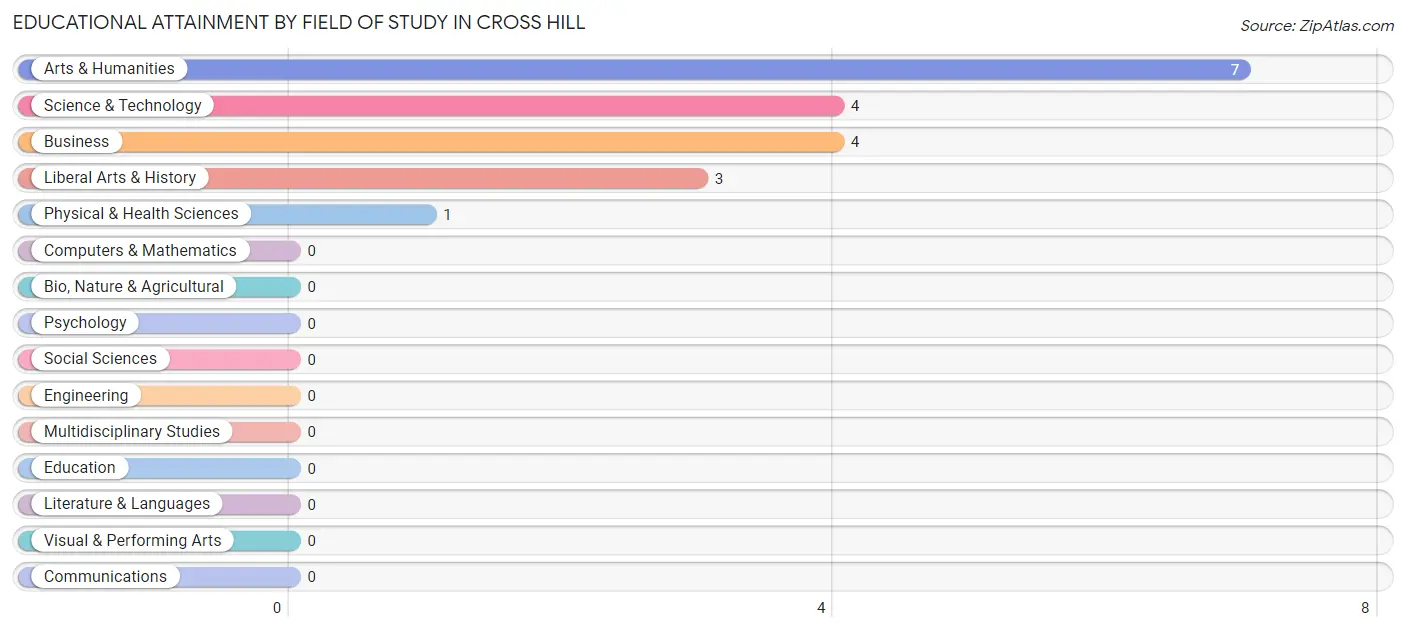
| Field of Study | # Graduates | % Graduates |
| Computers & Mathematics | 0 | 0.0% |
| Bio, Nature & Agricultural | 0 | 0.0% |
| Physical & Health Sciences | 1 | 5.3% |
| Psychology | 0 | 0.0% |
| Social Sciences | 0 | 0.0% |
| Engineering | 0 | 0.0% |
| Multidisciplinary Studies | 0 | 0.0% |
| Science & Technology | 4 | 21.0% |
| Business | 4 | 21.0% |
| Education | 0 | 0.0% |
| Literature & Languages | 0 | 0.0% |
| Liberal Arts & History | 3 | 15.8% |
| Visual & Performing Arts | 0 | 0.0% |
| Communications | 0 | 0.0% |
| Arts & Humanities | 7 | 36.8% |
| Total | 19 | 100.0% |
Transportation & Commute in Cross Hill
Vehicle Availability by Sex in Cross Hill
The most prevalent vehicle ownership categories in Cross Hill are males with 2 vehicles (40, accounting for 33.3%) and females with 2 vehicles (26, making up 44.9%).
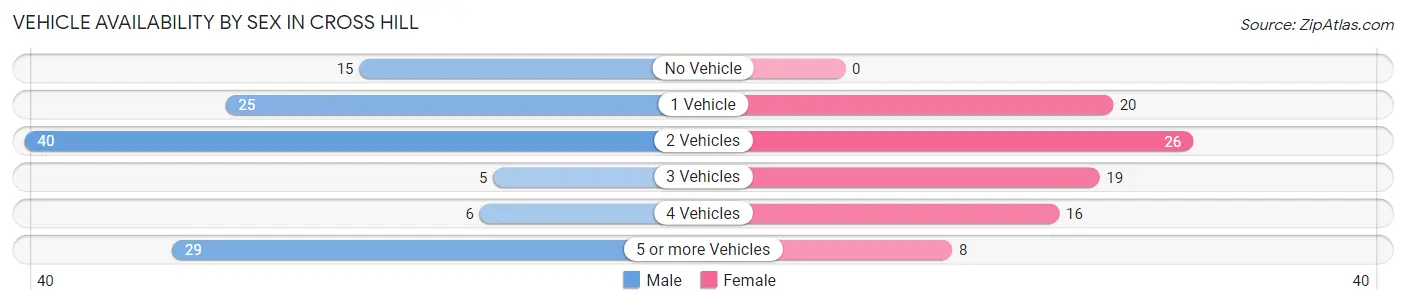
| Vehicles Available | Male | Female |
| No Vehicle | 15 (12.5%) | 0 (0.0%) |
| 1 Vehicle | 25 (20.8%) | 20 (22.5%) |
| 2 Vehicles | 40 (33.3%) | 26 (29.2%) |
| 3 Vehicles | 5 (4.2%) | 19 (21.3%) |
| 4 Vehicles | 6 (5.0%) | 16 (18.0%) |
| 5 or more Vehicles | 29 (24.2%) | 8 (9.0%) |
| Total | 120 (100.0%) | 89 (100.0%) |
Commute Time in Cross Hill
The most frequently occuring commute durations in Cross Hill are 45 to 59 minutes (56 commuters, 27.2%), 25 to 29 minutes (34 commuters, 16.5%), and 30 to 34 minutes (32 commuters, 15.5%).
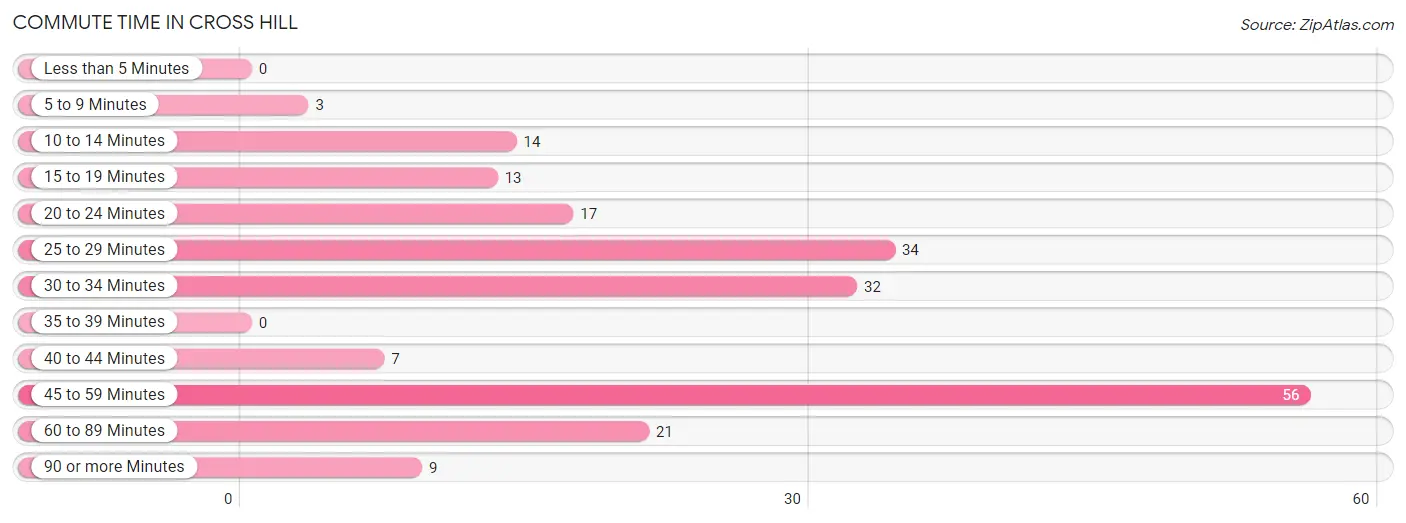
| Commute Time | # Commuters | % Commuters |
| Less than 5 Minutes | 0 | 0.0% |
| 5 to 9 Minutes | 3 | 1.5% |
| 10 to 14 Minutes | 14 | 6.8% |
| 15 to 19 Minutes | 13 | 6.3% |
| 20 to 24 Minutes | 17 | 8.3% |
| 25 to 29 Minutes | 34 | 16.5% |
| 30 to 34 Minutes | 32 | 15.5% |
| 35 to 39 Minutes | 0 | 0.0% |
| 40 to 44 Minutes | 7 | 3.4% |
| 45 to 59 Minutes | 56 | 27.2% |
| 60 to 89 Minutes | 21 | 10.2% |
| 90 or more Minutes | 9 | 4.4% |
Commute Time by Sex in Cross Hill
The most common commute times in Cross Hill are 45 to 59 minutes (36 commuters, 30.2%) for males and 45 to 59 minutes (20 commuters, 23.0%) for females.
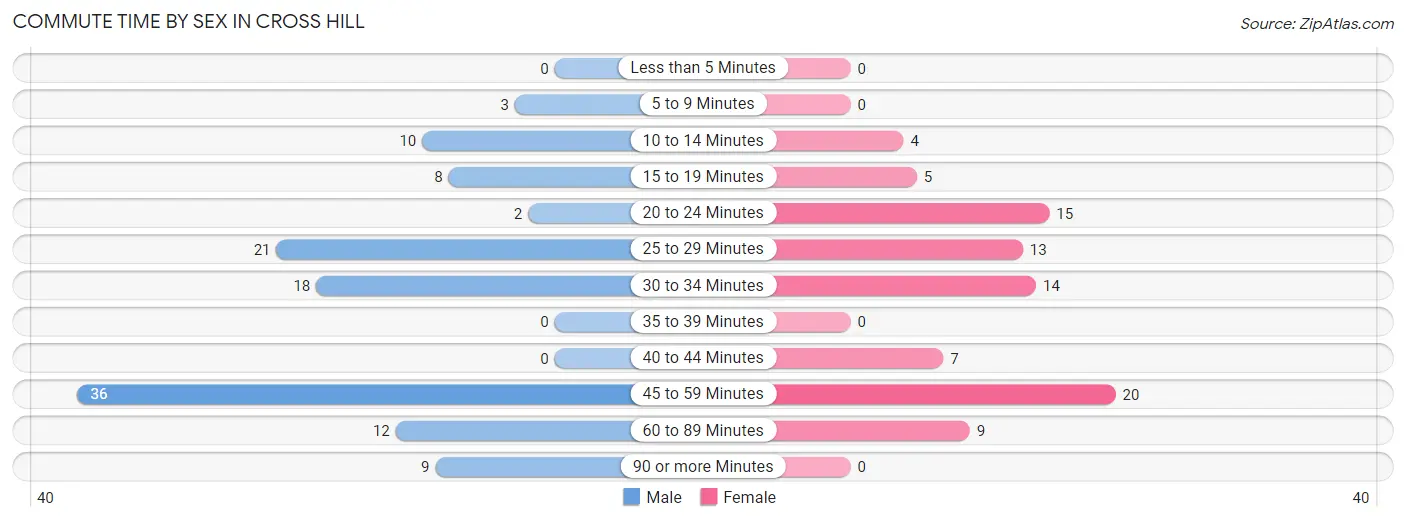
| Commute Time | Male | Female |
| Less than 5 Minutes | 0 (0.0%) | 0 (0.0%) |
| 5 to 9 Minutes | 3 (2.5%) | 0 (0.0%) |
| 10 to 14 Minutes | 10 (8.4%) | 4 (4.6%) |
| 15 to 19 Minutes | 8 (6.7%) | 5 (5.8%) |
| 20 to 24 Minutes | 2 (1.7%) | 15 (17.2%) |
| 25 to 29 Minutes | 21 (17.6%) | 13 (14.9%) |
| 30 to 34 Minutes | 18 (15.1%) | 14 (16.1%) |
| 35 to 39 Minutes | 0 (0.0%) | 0 (0.0%) |
| 40 to 44 Minutes | 0 (0.0%) | 7 (8.1%) |
| 45 to 59 Minutes | 36 (30.2%) | 20 (23.0%) |
| 60 to 89 Minutes | 12 (10.1%) | 9 (10.3%) |
| 90 or more Minutes | 9 (7.6%) | 0 (0.0%) |
Time of Departure to Work by Sex in Cross Hill
The most frequent times of departure to work in Cross Hill are 4:00 PM to 11:59 PM (43, 36.1%) for males and 7:00 AM to 7:29 AM (31, 35.6%) for females.
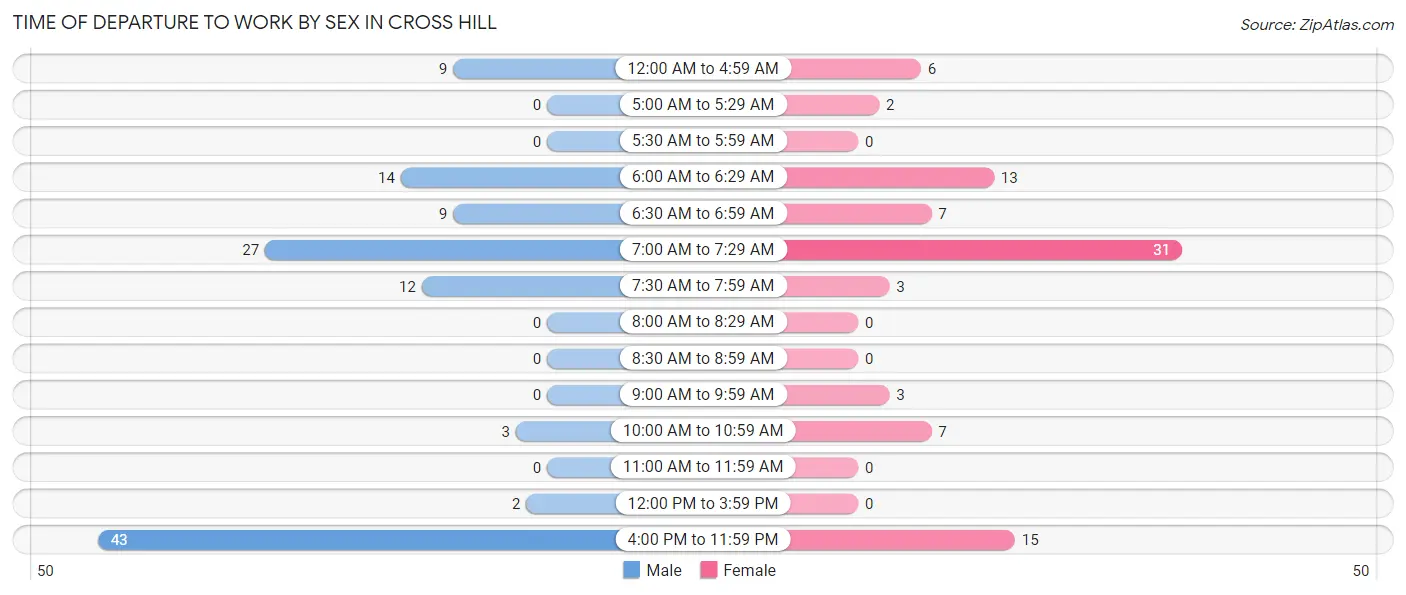
| Time of Departure | Male | Female |
| 12:00 AM to 4:59 AM | 9 (7.6%) | 6 (6.9%) |
| 5:00 AM to 5:29 AM | 0 (0.0%) | 2 (2.3%) |
| 5:30 AM to 5:59 AM | 0 (0.0%) | 0 (0.0%) |
| 6:00 AM to 6:29 AM | 14 (11.8%) | 13 (14.9%) |
| 6:30 AM to 6:59 AM | 9 (7.6%) | 7 (8.1%) |
| 7:00 AM to 7:29 AM | 27 (22.7%) | 31 (35.6%) |
| 7:30 AM to 7:59 AM | 12 (10.1%) | 3 (3.5%) |
| 8:00 AM to 8:29 AM | 0 (0.0%) | 0 (0.0%) |
| 8:30 AM to 8:59 AM | 0 (0.0%) | 0 (0.0%) |
| 9:00 AM to 9:59 AM | 0 (0.0%) | 3 (3.5%) |
| 10:00 AM to 10:59 AM | 3 (2.5%) | 7 (8.1%) |
| 11:00 AM to 11:59 AM | 0 (0.0%) | 0 (0.0%) |
| 12:00 PM to 3:59 PM | 2 (1.7%) | 0 (0.0%) |
| 4:00 PM to 11:59 PM | 43 (36.1%) | 15 (17.2%) |
| Total | 119 (100.0%) | 87 (100.0%) |
Housing Occupancy in Cross Hill
Occupancy by Ownership in Cross Hill
Of the total 251 dwellings in Cross Hill, owner-occupied units account for 205 (81.7%), while renter-occupied units make up 46 (18.3%).
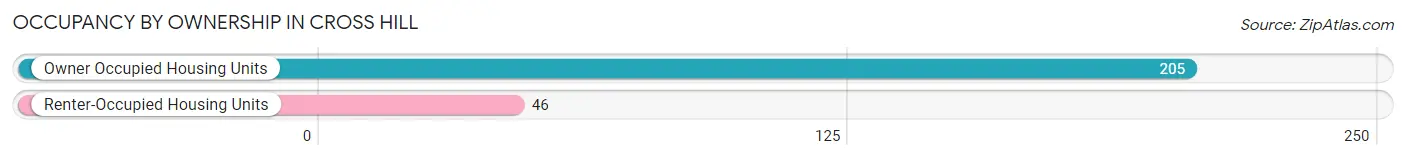
| Occupancy | # Housing Units | % Housing Units |
| Owner Occupied Housing Units | 205 | 81.7% |
| Renter-Occupied Housing Units | 46 | 18.3% |
| Total Occupied Housing Units | 251 | 100.0% |
Occupancy by Household Size in Cross Hill
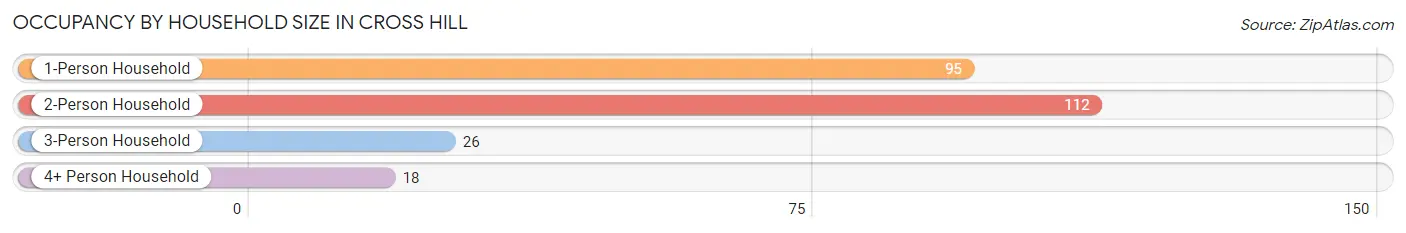
| Household Size | # Housing Units | % Housing Units |
| 1-Person Household | 95 | 37.9% |
| 2-Person Household | 112 | 44.6% |
| 3-Person Household | 26 | 10.4% |
| 4+ Person Household | 18 | 7.2% |
| Total Housing Units | 251 | 100.0% |
Occupancy by Ownership by Household Size in Cross Hill
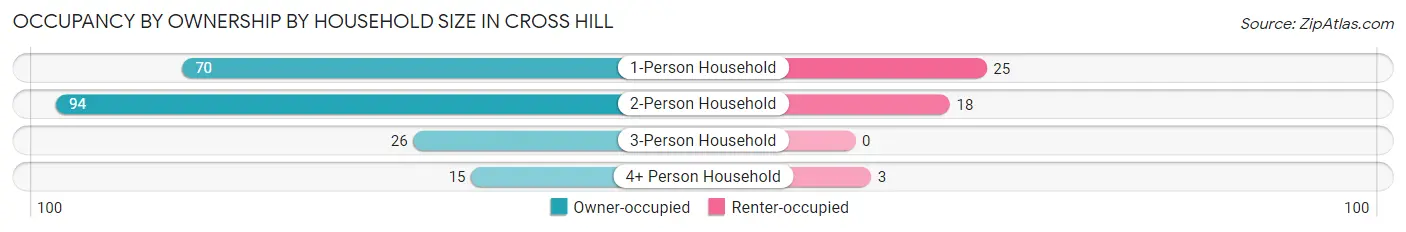
| Household Size | Owner-occupied | Renter-occupied |
| 1-Person Household | 70 (73.7%) | 25 (26.3%) |
| 2-Person Household | 94 (83.9%) | 18 (16.1%) |
| 3-Person Household | 26 (100.0%) | 0 (0.0%) |
| 4+ Person Household | 15 (83.3%) | 3 (16.7%) |
| Total Housing Units | 205 (81.7%) | 46 (18.3%) |
Occupancy by Educational Attainment in Cross Hill
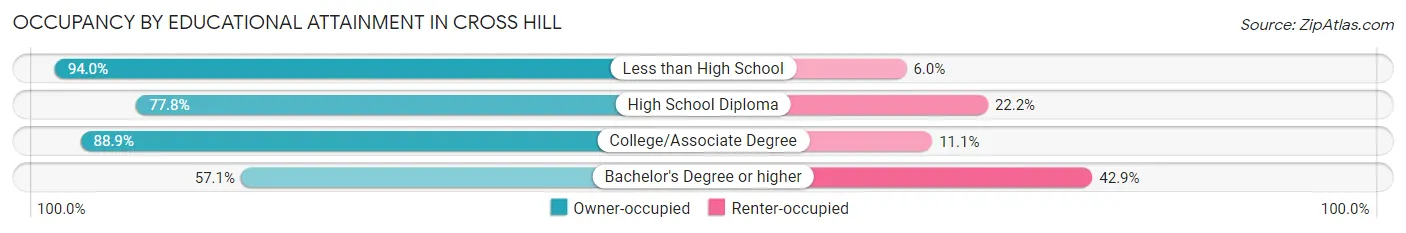
| Household Size | Owner-occupied | Renter-occupied |
| Less than High School | 47 (94.0%) | 3 (6.0%) |
| High School Diploma | 130 (77.8%) | 37 (22.2%) |
| College/Associate Degree | 24 (88.9%) | 3 (11.1%) |
| Bachelor's Degree or higher | 4 (57.1%) | 3 (42.9%) |
Occupancy by Age of Householder in Cross Hill
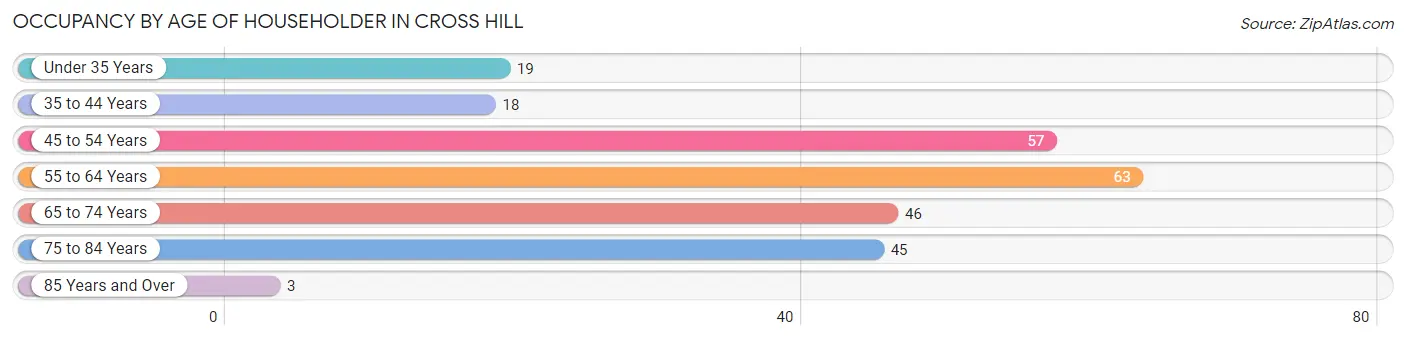
| Age Bracket | # Households | % Households |
| Under 35 Years | 19 | 7.6% |
| 35 to 44 Years | 18 | 7.2% |
| 45 to 54 Years | 57 | 22.7% |
| 55 to 64 Years | 63 | 25.1% |
| 65 to 74 Years | 46 | 18.3% |
| 75 to 84 Years | 45 | 17.9% |
| 85 Years and Over | 3 | 1.2% |
| Total | 251 | 100.0% |
Housing Finances in Cross Hill
Median Income by Occupancy in Cross Hill
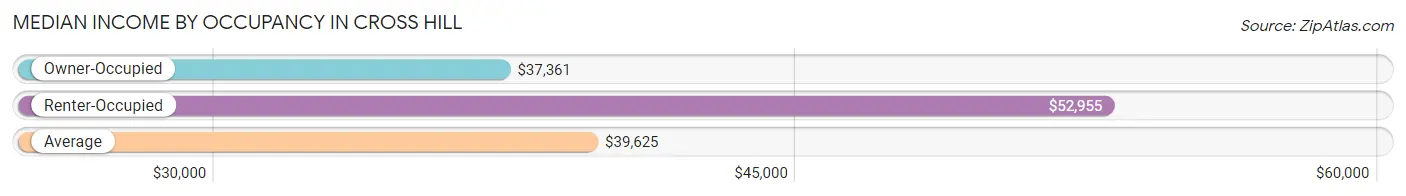
| Occupancy Type | # Households | Median Income |
| Owner-Occupied | 205 (81.7%) | $37,361 |
| Renter-Occupied | 46 (18.3%) | $52,955 |
| Average | 251 (100.0%) | $39,625 |
Occupancy by Householder Income Bracket in Cross Hill
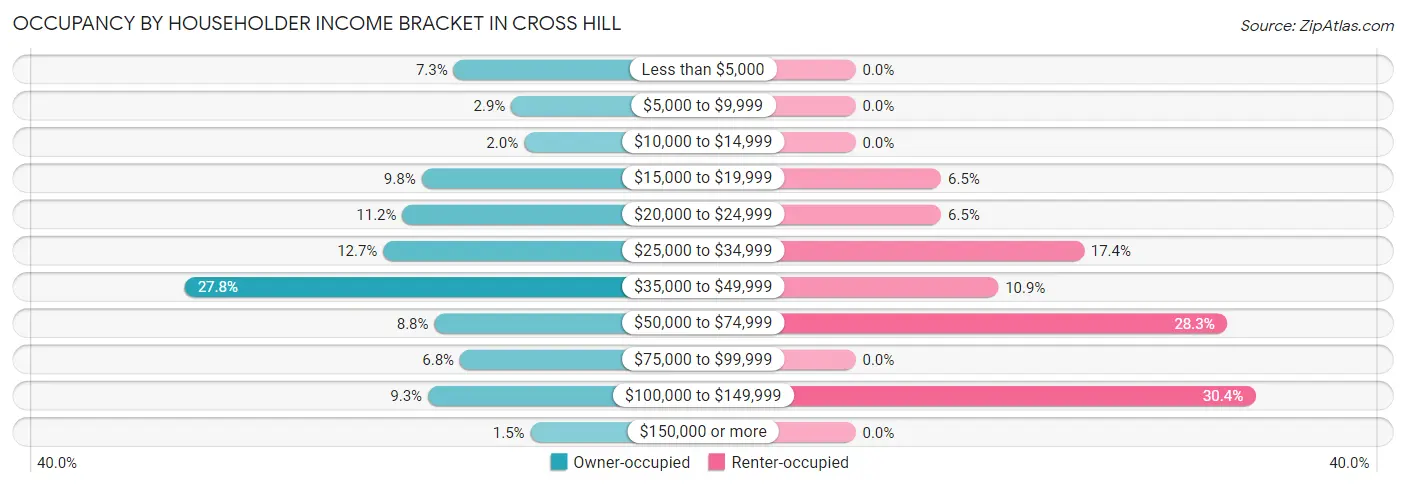
| Income Bracket | Owner-occupied | Renter-occupied |
| Less than $5,000 | 15 (7.3%) | 0 (0.0%) |
| $5,000 to $9,999 | 6 (2.9%) | 0 (0.0%) |
| $10,000 to $14,999 | 4 (1.9%) | 0 (0.0%) |
| $15,000 to $19,999 | 20 (9.8%) | 3 (6.5%) |
| $20,000 to $24,999 | 23 (11.2%) | 3 (6.5%) |
| $25,000 to $34,999 | 26 (12.7%) | 8 (17.4%) |
| $35,000 to $49,999 | 57 (27.8%) | 5 (10.9%) |
| $50,000 to $74,999 | 18 (8.8%) | 13 (28.3%) |
| $75,000 to $99,999 | 14 (6.8%) | 0 (0.0%) |
| $100,000 to $149,999 | 19 (9.3%) | 14 (30.4%) |
| $150,000 or more | 3 (1.5%) | 0 (0.0%) |
| Total | 205 (100.0%) | 46 (100.0%) |
Monthly Housing Cost Tiers in Cross Hill
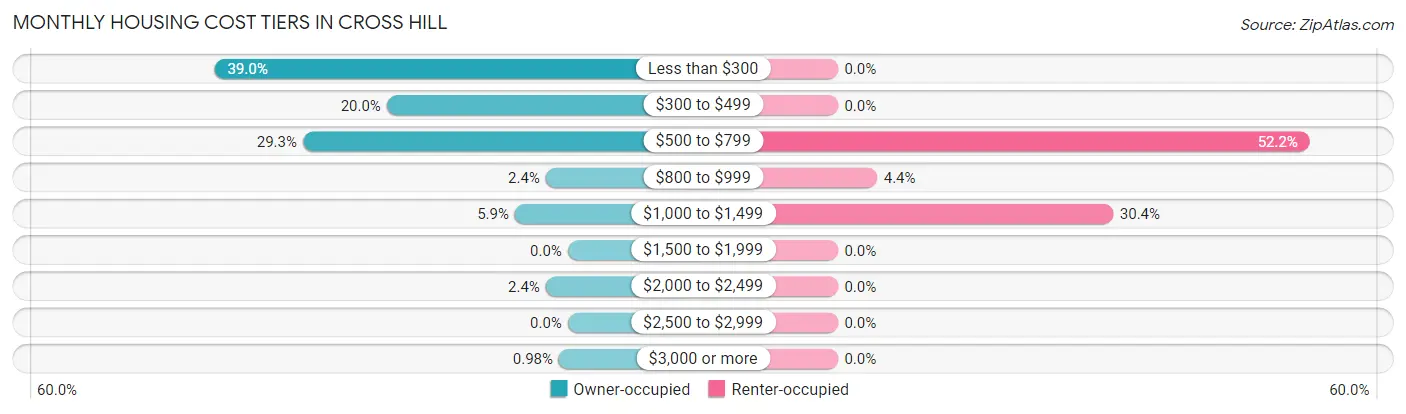
| Monthly Cost | Owner-occupied | Renter-occupied |
| Less than $300 | 80 (39.0%) | 0 (0.0%) |
| $300 to $499 | 41 (20.0%) | 0 (0.0%) |
| $500 to $799 | 60 (29.3%) | 24 (52.2%) |
| $800 to $999 | 5 (2.4%) | 2 (4.3%) |
| $1,000 to $1,499 | 12 (5.9%) | 14 (30.4%) |
| $1,500 to $1,999 | 0 (0.0%) | 0 (0.0%) |
| $2,000 to $2,499 | 5 (2.4%) | 0 (0.0%) |
| $2,500 to $2,999 | 0 (0.0%) | 0 (0.0%) |
| $3,000 or more | 2 (1.0%) | 0 (0.0%) |
| Total | 205 (100.0%) | 46 (100.0%) |
Physical Housing Characteristics in Cross Hill
Housing Structures in Cross Hill
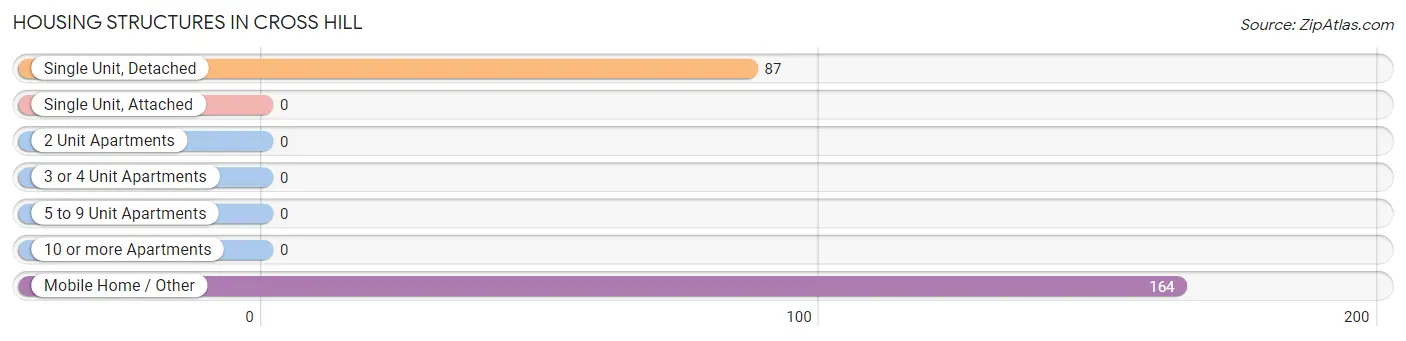
| Structure Type | # Housing Units | % Housing Units |
| Single Unit, Detached | 87 | 34.7% |
| Single Unit, Attached | 0 | 0.0% |
| 2 Unit Apartments | 0 | 0.0% |
| 3 or 4 Unit Apartments | 0 | 0.0% |
| 5 to 9 Unit Apartments | 0 | 0.0% |
| 10 or more Apartments | 0 | 0.0% |
| Mobile Home / Other | 164 | 65.3% |
| Total | 251 | 100.0% |
Housing Structures by Occupancy in Cross Hill
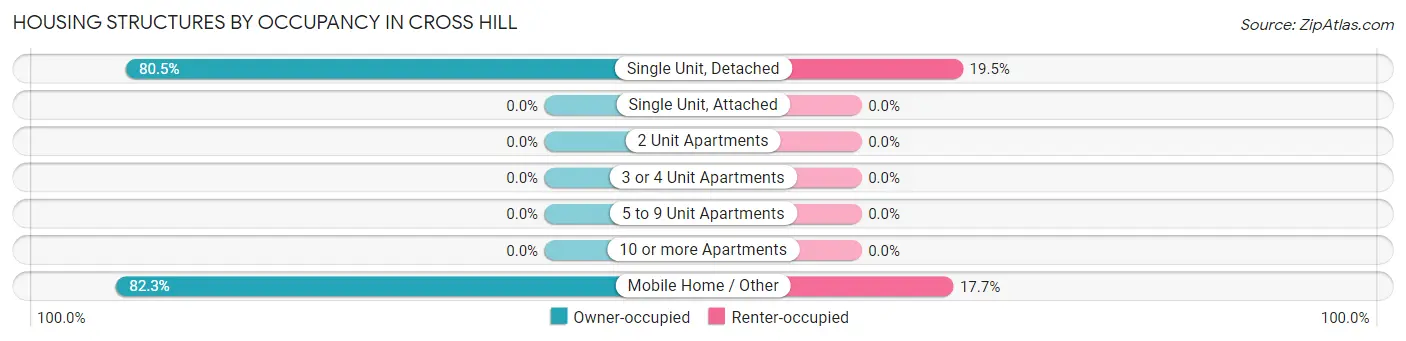
| Structure Type | Owner-occupied | Renter-occupied |
| Single Unit, Detached | 70 (80.5%) | 17 (19.5%) |
| Single Unit, Attached | 0 (0.0%) | 0 (0.0%) |
| 2 Unit Apartments | 0 (0.0%) | 0 (0.0%) |
| 3 or 4 Unit Apartments | 0 (0.0%) | 0 (0.0%) |
| 5 to 9 Unit Apartments | 0 (0.0%) | 0 (0.0%) |
| 10 or more Apartments | 0 (0.0%) | 0 (0.0%) |
| Mobile Home / Other | 135 (82.3%) | 29 (17.7%) |
| Total | 205 (81.7%) | 46 (18.3%) |
Housing Structures by Number of Rooms in Cross Hill
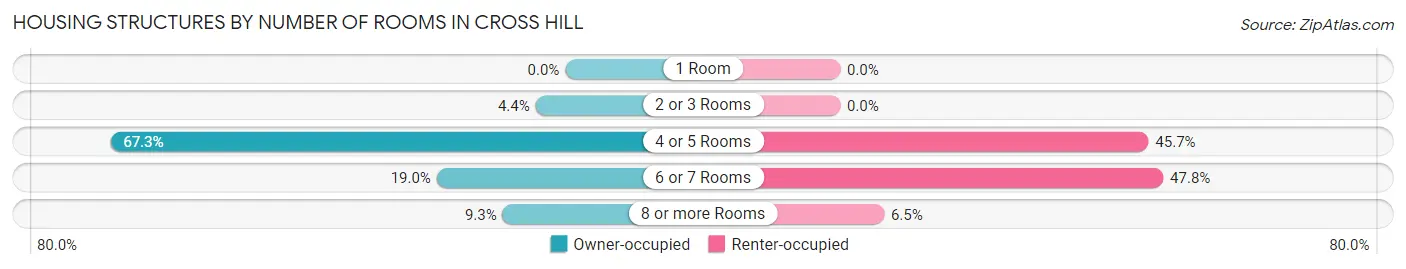
| Number of Rooms | Owner-occupied | Renter-occupied |
| 1 Room | 0 (0.0%) | 0 (0.0%) |
| 2 or 3 Rooms | 9 (4.4%) | 0 (0.0%) |
| 4 or 5 Rooms | 138 (67.3%) | 21 (45.7%) |
| 6 or 7 Rooms | 39 (19.0%) | 22 (47.8%) |
| 8 or more Rooms | 19 (9.3%) | 3 (6.5%) |
| Total | 205 (100.0%) | 46 (100.0%) |
Housing Structure by Heating Type in Cross Hill
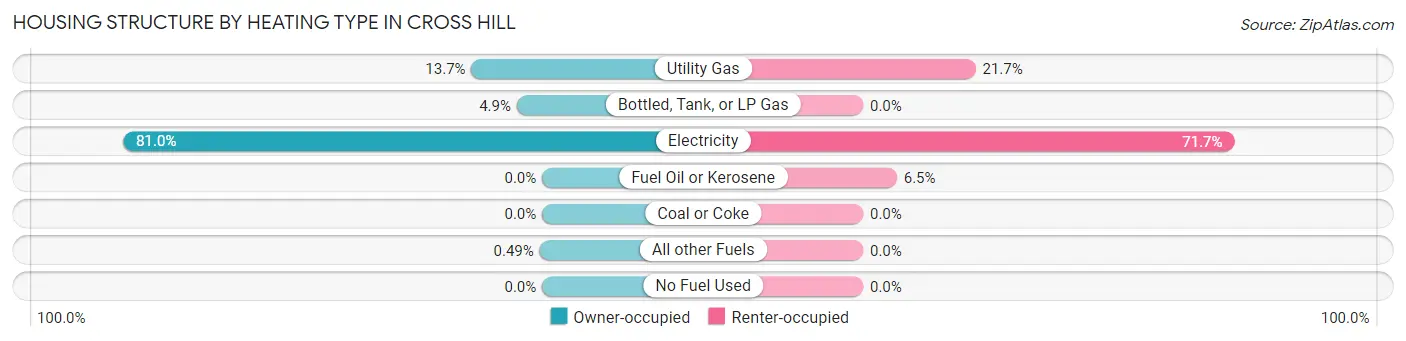
| Heating Type | Owner-occupied | Renter-occupied |
| Utility Gas | 28 (13.7%) | 10 (21.7%) |
| Bottled, Tank, or LP Gas | 10 (4.9%) | 0 (0.0%) |
| Electricity | 166 (81.0%) | 33 (71.7%) |
| Fuel Oil or Kerosene | 0 (0.0%) | 3 (6.5%) |
| Coal or Coke | 0 (0.0%) | 0 (0.0%) |
| All other Fuels | 1 (0.5%) | 0 (0.0%) |
| No Fuel Used | 0 (0.0%) | 0 (0.0%) |
| Total | 205 (100.0%) | 46 (100.0%) |
Household Vehicle Usage in Cross Hill
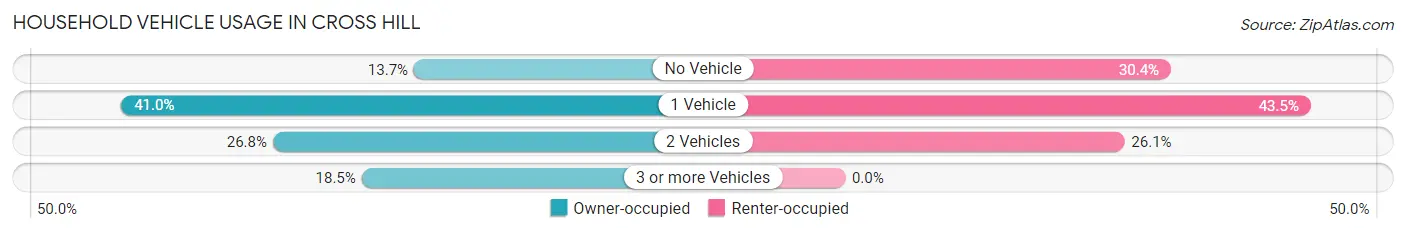
| Vehicles per Household | Owner-occupied | Renter-occupied |
| No Vehicle | 28 (13.7%) | 14 (30.4%) |
| 1 Vehicle | 84 (41.0%) | 20 (43.5%) |
| 2 Vehicles | 55 (26.8%) | 12 (26.1%) |
| 3 or more Vehicles | 38 (18.5%) | 0 (0.0%) |
| Total | 205 (100.0%) | 46 (100.0%) |
Real Estate & Mortgages in Cross Hill
Real Estate and Mortgage Overview in Cross Hill
| Characteristic | Without Mortgage | With Mortgage |
| Housing Units | 146 | 59 |
| Median Property Value | $45,700 | $0 |
| Median Household Income | $33,500 | $3 |
| Monthly Housing Costs | $282 | $0 |
| Real Estate Taxes | $205 | $3 |
Property Value by Mortgage Status in Cross Hill
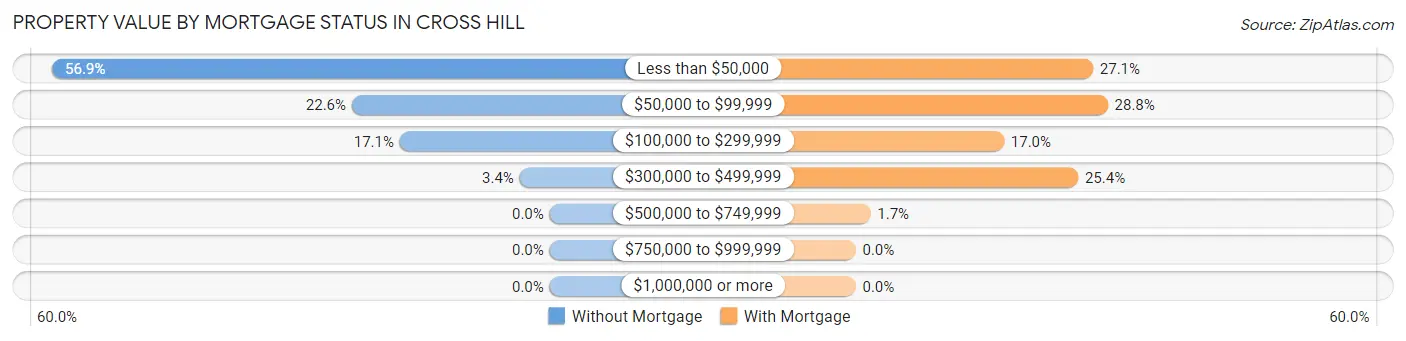
| Property Value | Without Mortgage | With Mortgage |
| Less than $50,000 | 83 (56.9%) | 16 (27.1%) |
| $50,000 to $99,999 | 33 (22.6%) | 17 (28.8%) |
| $100,000 to $299,999 | 25 (17.1%) | 10 (17.0%) |
| $300,000 to $499,999 | 5 (3.4%) | 15 (25.4%) |
| $500,000 to $749,999 | 0 (0.0%) | 1 (1.7%) |
| $750,000 to $999,999 | 0 (0.0%) | 0 (0.0%) |
| $1,000,000 or more | 0 (0.0%) | 0 (0.0%) |
| Total | 146 (100.0%) | 59 (100.0%) |
Household Income by Mortgage Status in Cross Hill
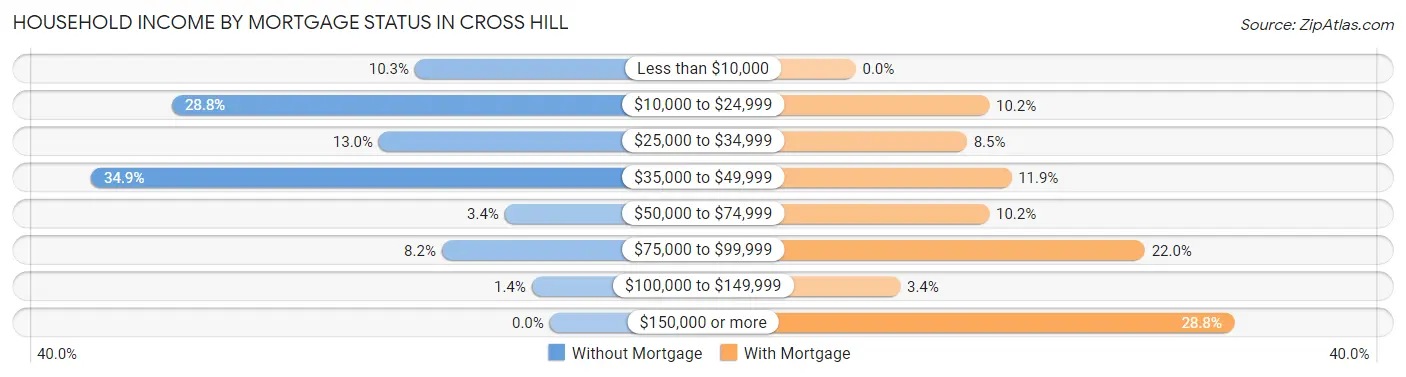
| Household Income | Without Mortgage | With Mortgage |
| Less than $10,000 | 15 (10.3%) | 0 (0.0%) |
| $10,000 to $24,999 | 42 (28.8%) | 6 (10.2%) |
| $25,000 to $34,999 | 19 (13.0%) | 5 (8.5%) |
| $35,000 to $49,999 | 51 (34.9%) | 7 (11.9%) |
| $50,000 to $74,999 | 5 (3.4%) | 6 (10.2%) |
| $75,000 to $99,999 | 12 (8.2%) | 13 (22.0%) |
| $100,000 to $149,999 | 2 (1.4%) | 2 (3.4%) |
| $150,000 or more | 0 (0.0%) | 17 (28.8%) |
| Total | 146 (100.0%) | 59 (100.0%) |
Property Value to Household Income Ratio in Cross Hill
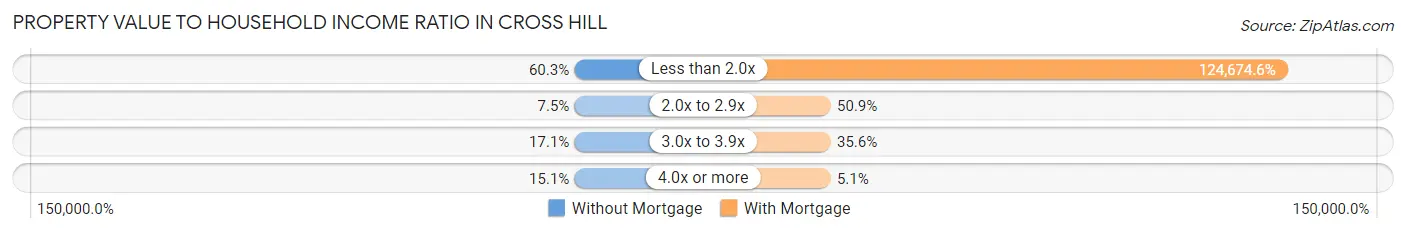
| Value-to-Income Ratio | Without Mortgage | With Mortgage |
| Less than 2.0x | 88 (60.3%) | 73,558 (124,674.6%) |
| 2.0x to 2.9x | 11 (7.5%) | 30 (50.8%) |
| 3.0x to 3.9x | 25 (17.1%) | 21 (35.6%) |
| 4.0x or more | 22 (15.1%) | 3 (5.1%) |
| Total | 146 (100.0%) | 59 (100.0%) |
Real Estate Taxes by Mortgage Status in Cross Hill
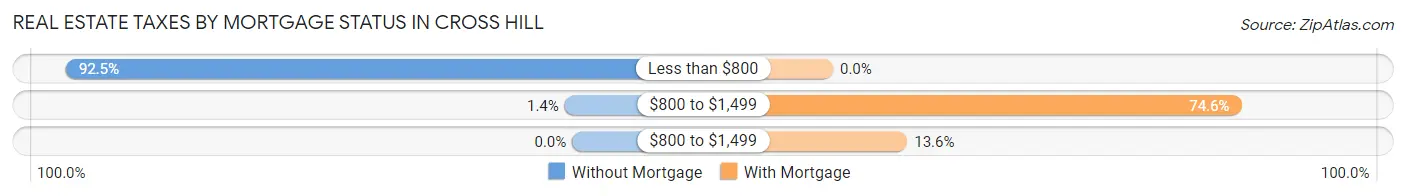
| Property Taxes | Without Mortgage | With Mortgage |
| Less than $800 | 135 (92.5%) | 0 (0.0%) |
| $800 to $1,499 | 2 (1.4%) | 44 (74.6%) |
| $800 to $1,499 | 0 (0.0%) | 8 (13.6%) |
| Total | 146 (100.0%) | 59 (100.0%) |
Health & Disability in Cross Hill
Health Insurance Coverage by Age in Cross Hill
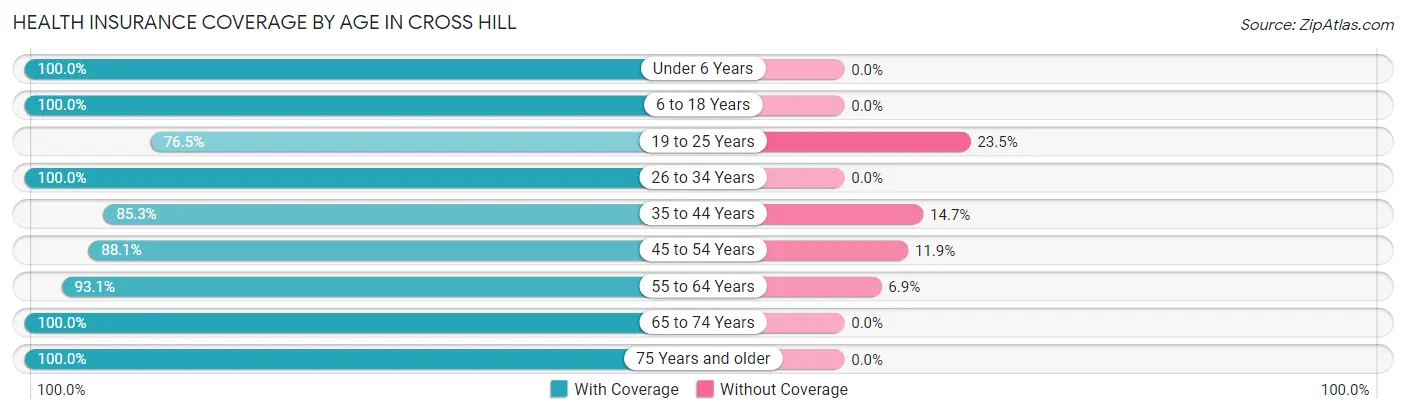
| Age Bracket | With Coverage | Without Coverage |
| Under 6 Years | 15 (100.0%) | 0 (0.0%) |
| 6 to 18 Years | 53 (100.0%) | 0 (0.0%) |
| 19 to 25 Years | 39 (76.5%) | 12 (23.5%) |
| 26 to 34 Years | 16 (100.0%) | 0 (0.0%) |
| 35 to 44 Years | 29 (85.3%) | 5 (14.7%) |
| 45 to 54 Years | 89 (88.1%) | 12 (11.9%) |
| 55 to 64 Years | 121 (93.1%) | 9 (6.9%) |
| 65 to 74 Years | 69 (100.0%) | 0 (0.0%) |
| 75 Years and older | 53 (100.0%) | 0 (0.0%) |
| Total | 484 (92.7%) | 38 (7.3%) |
Health Insurance Coverage by Citizenship Status in Cross Hill
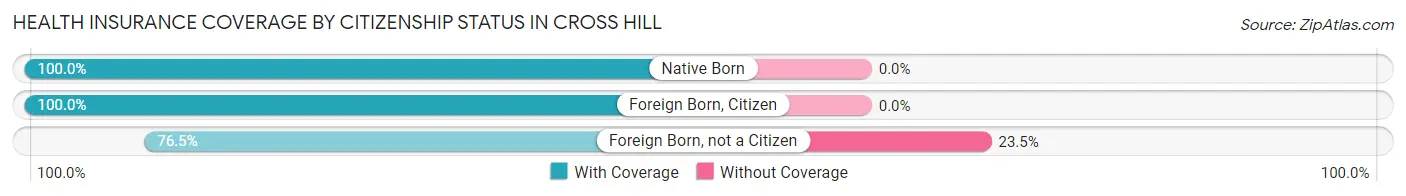
| Citizenship Status | With Coverage | Without Coverage |
| Native Born | 15 (100.0%) | 0 (0.0%) |
| Foreign Born, Citizen | 53 (100.0%) | 0 (0.0%) |
| Foreign Born, not a Citizen | 39 (76.5%) | 12 (23.5%) |
Health Insurance Coverage by Household Income in Cross Hill
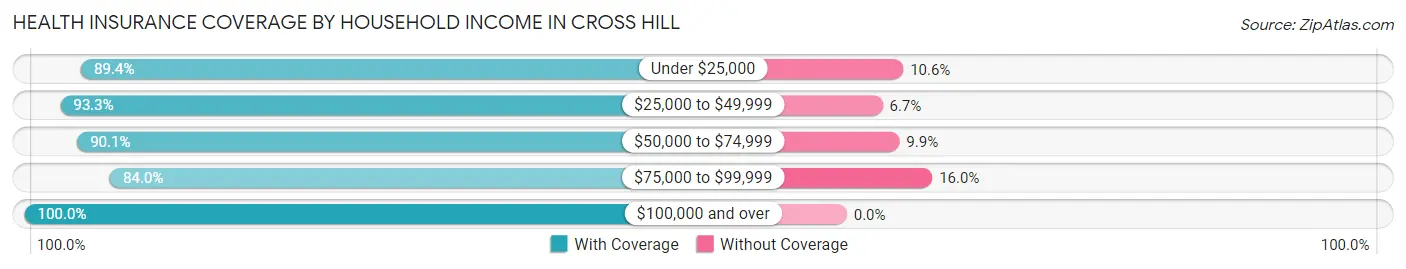
| Household Income | With Coverage | Without Coverage |
| Under $25,000 | 110 (89.4%) | 13 (10.6%) |
| $25,000 to $49,999 | 195 (93.3%) | 14 (6.7%) |
| $50,000 to $74,999 | 64 (90.1%) | 7 (9.9%) |
| $75,000 to $99,999 | 21 (84.0%) | 4 (16.0%) |
| $100,000 and over | 94 (100.0%) | 0 (0.0%) |
Public vs Private Health Insurance Coverage by Age in Cross Hill
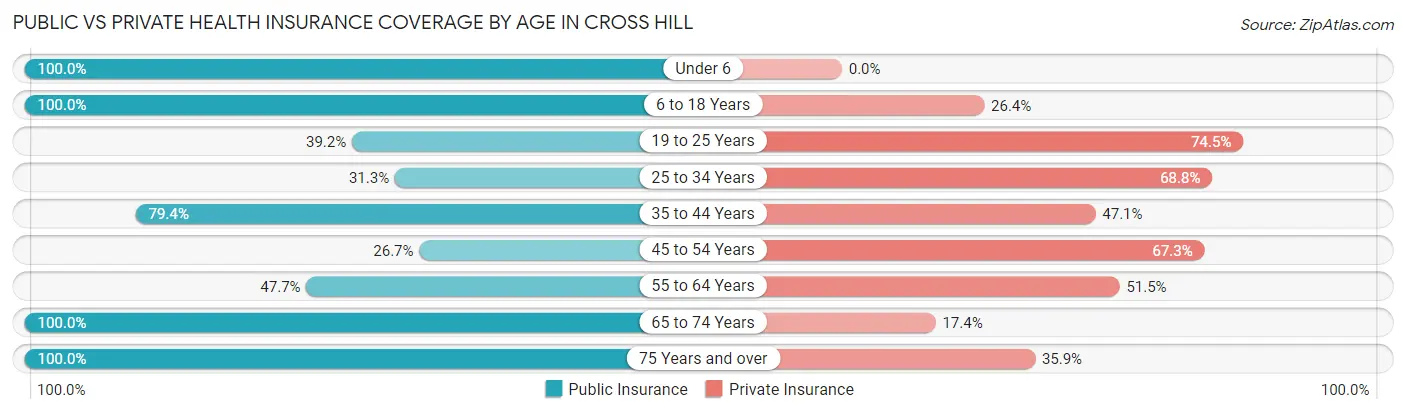
| Age Bracket | Public Insurance | Private Insurance |
| Under 6 | 15 (100.0%) | 0 (0.0%) |
| 6 to 18 Years | 53 (100.0%) | 14 (26.4%) |
| 19 to 25 Years | 20 (39.2%) | 38 (74.5%) |
| 25 to 34 Years | 5 (31.2%) | 11 (68.8%) |
| 35 to 44 Years | 27 (79.4%) | 16 (47.1%) |
| 45 to 54 Years | 27 (26.7%) | 68 (67.3%) |
| 55 to 64 Years | 62 (47.7%) | 67 (51.5%) |
| 65 to 74 Years | 69 (100.0%) | 12 (17.4%) |
| 75 Years and over | 53 (100.0%) | 19 (35.8%) |
| Total | 331 (63.4%) | 245 (46.9%) |
Disability Status by Sex by Age in Cross Hill
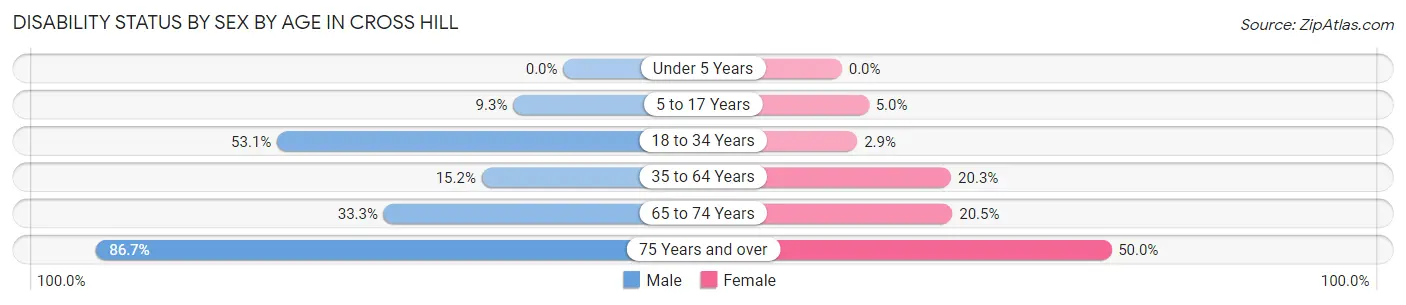
| Age Bracket | Male | Female |
| Under 5 Years | 0 (0.0%) | 0 (0.0%) |
| 5 to 17 Years | 4 (9.3%) | 1 (5.0%) |
| 18 to 34 Years | 17 (53.1%) | 1 (2.9%) |
| 35 to 64 Years | 20 (15.1%) | 27 (20.3%) |
| 65 to 74 Years | 10 (33.3%) | 8 (20.5%) |
| 75 Years and over | 13 (86.7%) | 19 (50.0%) |
Disability Class by Sex by Age in Cross Hill
Disability Class: Hearing Difficulty
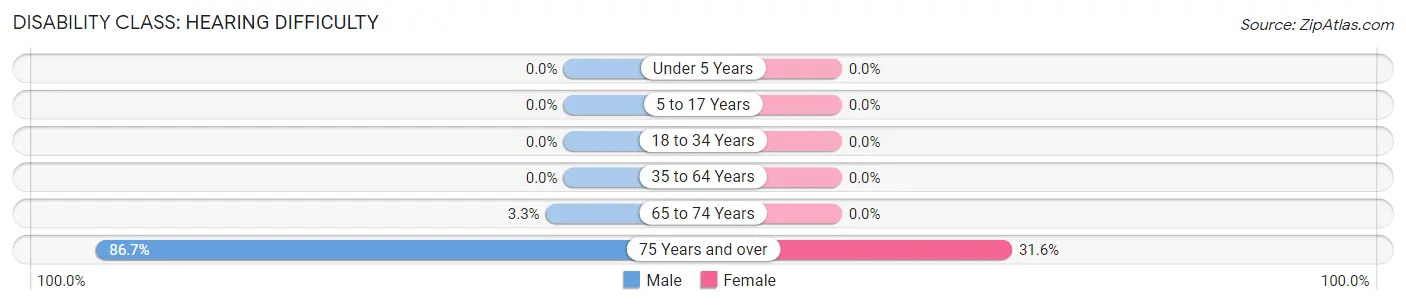
| Age Bracket | Male | Female |
| Under 5 Years | 0 (0.0%) | 0 (0.0%) |
| 5 to 17 Years | 0 (0.0%) | 0 (0.0%) |
| 18 to 34 Years | 0 (0.0%) | 0 (0.0%) |
| 35 to 64 Years | 0 (0.0%) | 0 (0.0%) |
| 65 to 74 Years | 1 (3.3%) | 0 (0.0%) |
| 75 Years and over | 13 (86.7%) | 12 (31.6%) |
Disability Class: Vision Difficulty
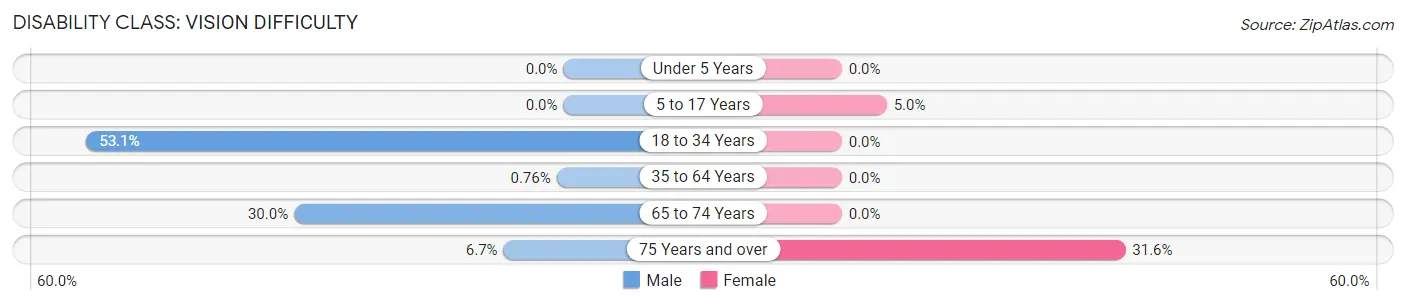
| Age Bracket | Male | Female |
| Under 5 Years | 0 (0.0%) | 0 (0.0%) |
| 5 to 17 Years | 0 (0.0%) | 1 (5.0%) |
| 18 to 34 Years | 17 (53.1%) | 0 (0.0%) |
| 35 to 64 Years | 1 (0.8%) | 0 (0.0%) |
| 65 to 74 Years | 9 (30.0%) | 0 (0.0%) |
| 75 Years and over | 1 (6.7%) | 12 (31.6%) |
Disability Class: Cognitive Difficulty
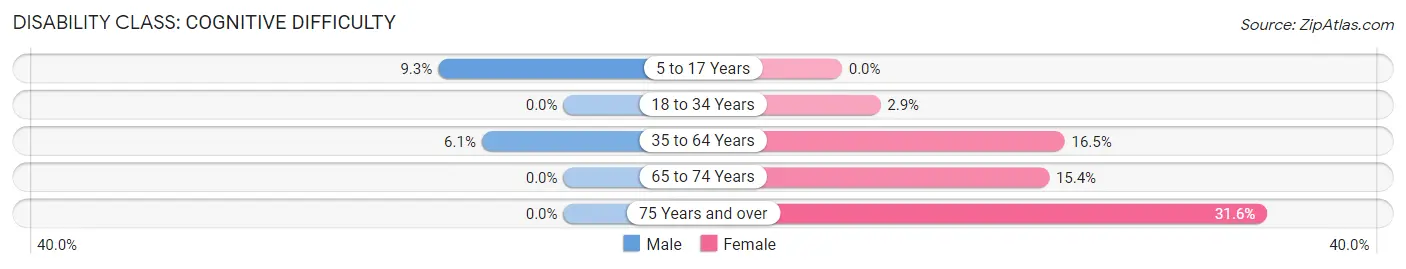
| Age Bracket | Male | Female |
| 5 to 17 Years | 4 (9.3%) | 0 (0.0%) |
| 18 to 34 Years | 0 (0.0%) | 1 (2.9%) |
| 35 to 64 Years | 8 (6.1%) | 22 (16.5%) |
| 65 to 74 Years | 0 (0.0%) | 6 (15.4%) |
| 75 Years and over | 0 (0.0%) | 12 (31.6%) |
Disability Class: Ambulatory Difficulty
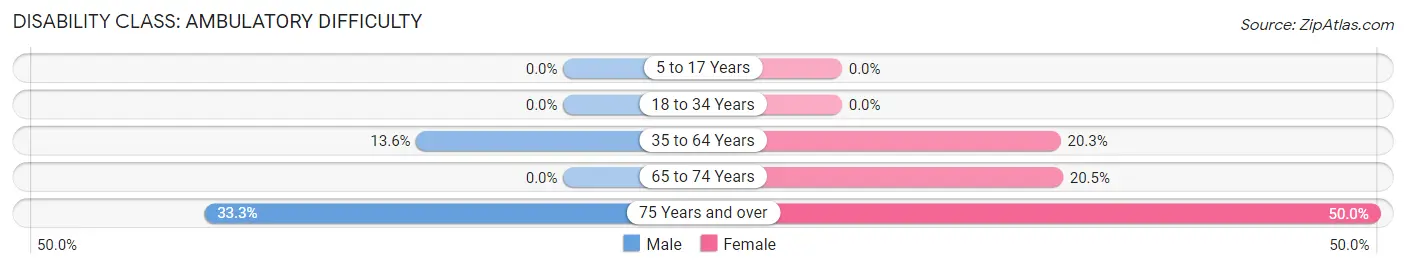
| Age Bracket | Male | Female |
| 5 to 17 Years | 0 (0.0%) | 0 (0.0%) |
| 18 to 34 Years | 0 (0.0%) | 0 (0.0%) |
| 35 to 64 Years | 18 (13.6%) | 27 (20.3%) |
| 65 to 74 Years | 0 (0.0%) | 8 (20.5%) |
| 75 Years and over | 5 (33.3%) | 19 (50.0%) |
Disability Class: Self-Care Difficulty
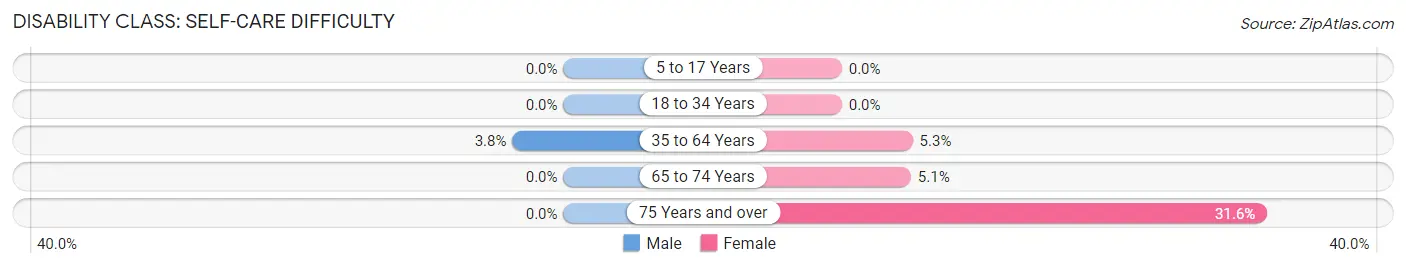
| Age Bracket | Male | Female |
| 5 to 17 Years | 0 (0.0%) | 0 (0.0%) |
| 18 to 34 Years | 0 (0.0%) | 0 (0.0%) |
| 35 to 64 Years | 5 (3.8%) | 7 (5.3%) |
| 65 to 74 Years | 0 (0.0%) | 2 (5.1%) |
| 75 Years and over | 0 (0.0%) | 12 (31.6%) |
Technology Access in Cross Hill
Computing Device Access in Cross Hill
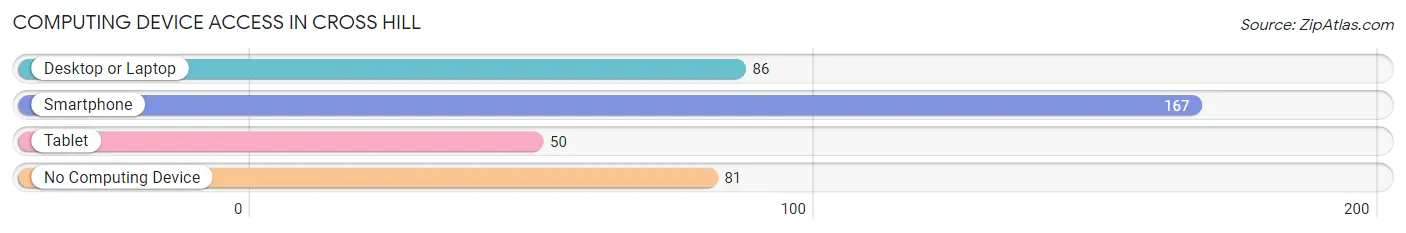
| Device Type | # Households | % Households |
| Desktop or Laptop | 86 | 34.3% |
| Smartphone | 167 | 66.5% |
| Tablet | 50 | 19.9% |
| No Computing Device | 81 | 32.3% |
| Total | 251 | 100.0% |
Internet Access in Cross Hill
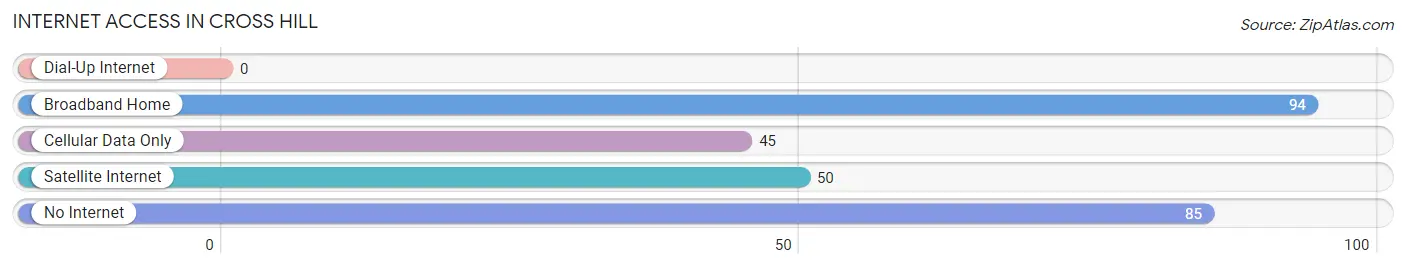
| Internet Type | # Households | % Households |
| Dial-Up Internet | 0 | 0.0% |
| Broadband Home | 94 | 37.4% |
| Cellular Data Only | 45 | 17.9% |
| Satellite Internet | 50 | 19.9% |
| No Internet | 85 | 33.9% |
| Total | 251 | 100.0% |
Cross Hill Summary
Cross Hill is a small town located in Laurens County, South Carolina. It is situated in the foothills of the Blue Ridge Mountains, approximately 25 miles south of Greenville and 40 miles north of Columbia. The town has a population of 1,845 people, according to the 2010 census.
Geography
Cross Hill is located in the Piedmont region of South Carolina, which is characterized by rolling hills and valleys. The town is situated in the foothills of the Blue Ridge Mountains, and is surrounded by the Sumter National Forest. The town is located on the banks of the Saluda River, which is a tributary of the Broad River. The town is located at an elevation of 845 feet above sea level.
The climate in Cross Hill is humid subtropical, with hot, humid summers and mild winters. The average annual temperature is around 64 degrees Fahrenheit, with an average high of around 87 degrees in the summer and an average low of around 41 degrees in the winter. The average annual precipitation is around 48 inches.
Economy
Cross Hill’s economy is largely based on agriculture. The town is home to several farms, which produce a variety of crops, including corn, soybeans, cotton, and tobacco. The town is also home to several small businesses, including restaurants, retail stores, and service providers.
Demographics
According to the 2010 census, the population of Cross Hill was 1,845 people. The racial makeup of the town was 87.3% White, 10.2% African American, 0.5% Native American, 0.3% Asian, 0.2% from other races, and 1.5% from two or more races. Hispanic or Latino of any race were 1.2% of the population.
The median income for a household in Cross Hill was $30,938, and the median income for a family was $37,917. The per capita income for the town was $15,945. About 17.2% of families and 20.2% of the population were below the poverty line, including 28.3% of those under age 18 and 15.2% of those age 65 or over.
History
Cross Hill was first settled in the early 1800s by settlers from North Carolina. The town was originally known as “Crossroads”, due to its location at the intersection of two major roads. The town was later renamed “Cross Hill”, after a nearby hill.
In the late 1800s, Cross Hill was a thriving agricultural community. The town was home to several cotton mills, as well as a number of other businesses. The town was also home to several churches, including the First Baptist Church, which was founded in 1871.
In the early 1900s, Cross Hill began to decline as the cotton industry moved away from the area. The town’s population began to decline, and many of the businesses closed. In the late 1900s, the town began to experience a resurgence, as new businesses moved into the area. Today, Cross Hill is a small, rural town with a strong sense of community.
Common Questions
What is Per Capita Income in Cross Hill?
Per Capita income in Cross Hill is $24,079.
What is the Median Family Income in Cross Hill?
Median Family Income in Cross Hill is $43,618.
What is the Median Household income in Cross Hill?
Median Household Income in Cross Hill is $39,625.
What is Income or Wage Gap in Cross Hill?
Income or Wage Gap in Cross Hill is 15.9%.
Women in Cross Hill earn 84.1 cents for every dollar earned by a man.
What is Inequality or Gini Index in Cross Hill?
Inequality or Gini Index in Cross Hill is 0.39.
What is the Total Population of Cross Hill?
Total Population of Cross Hill is 522.
What is the Total Male Population of Cross Hill?
Total Male Population of Cross Hill is 253.
What is the Total Female Population of Cross Hill?
Total Female Population of Cross Hill is 269.
What is the Ratio of Males per 100 Females in Cross Hill?
There are 94.05 Males per 100 Females in Cross Hill.
What is the Ratio of Females per 100 Males in Cross Hill?
There are 106.32 Females per 100 Males in Cross Hill.
What is the Median Population Age in Cross Hill?
Median Population Age in Cross Hill is 54.4 Years.
What is the Average Family Size in Cross Hill
Average Family Size in Cross Hill is 2.7 People.
What is the Average Household Size in Cross Hill
Average Household Size in Cross Hill is 2.1 People.
How Large is the Labor Force in Cross Hill?
There are 217 People in the Labor Forcein in Cross Hill.
What is the Percentage of People in the Labor Force in Cross Hill?
46.2% of People are in the Labor Force in Cross Hill.