Jacksonboro, SC Map & Demographics
Jacksonboro Map
Jacksonboro Overview
$32,206
PER CAPITA INCOME
$105,429
AVG FAMILY INCOME
$54,896
AVG HOUSEHOLD INCOME
0.28
INEQUALITY / GINI INDEX
270
TOTAL POPULATION
109
MALE POPULATION
161
FEMALE POPULATION
67.70
MALES / 100 FEMALES
147.71
FEMALES / 100 MALES
53.8
MEDIAN AGE
2.9
AVG FAMILY SIZE
2.1
AVG HOUSEHOLD SIZE
135
LABOR FORCE [ PEOPLE ]
56.0%
PERCENT IN LABOR FORCE
Jacksonboro Zip Codes
Jacksonboro Area Codes
Income in Jacksonboro
Income Overview in Jacksonboro
Per Capita Income in Jacksonboro is $32,206, while median incomes of families and households are $105,429 and $54,896 respectively.
| Characteristic | Number | Measure |
| Per Capita Income | 270 | $32,206 |
| Median Family Income | 70 | $105,429 |
| Mean Family Income | 70 | $90,336 |
| Median Household Income | 131 | $54,896 |
| Mean Household Income | 131 | $68,599 |
| Income Deficit | 70 | $0 |
| Wage / Income Gap (%) | 270 | 0.00% |
| Wage / Income Gap ($) | 270 | 100.00¢ per $1 |
| Gini / Inequality Index | 270 | 0.28 |
Earnings by Sex in Jacksonboro
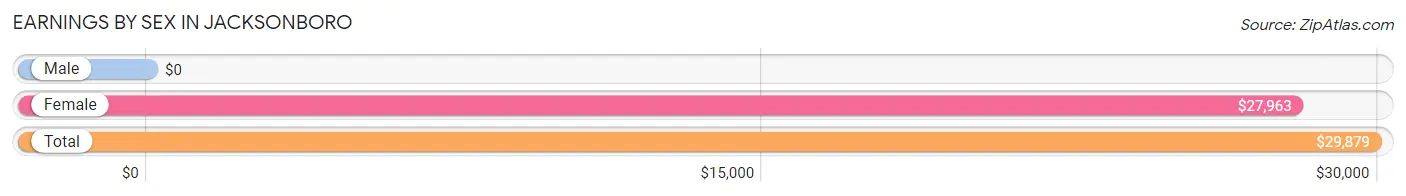
| Sex | Number | Average Earnings |
| Male | 87 (57.6%) | $0 |
| Female | 64 (42.4%) | $27,963 |
| Total | 151 (100.0%) | $29,879 |
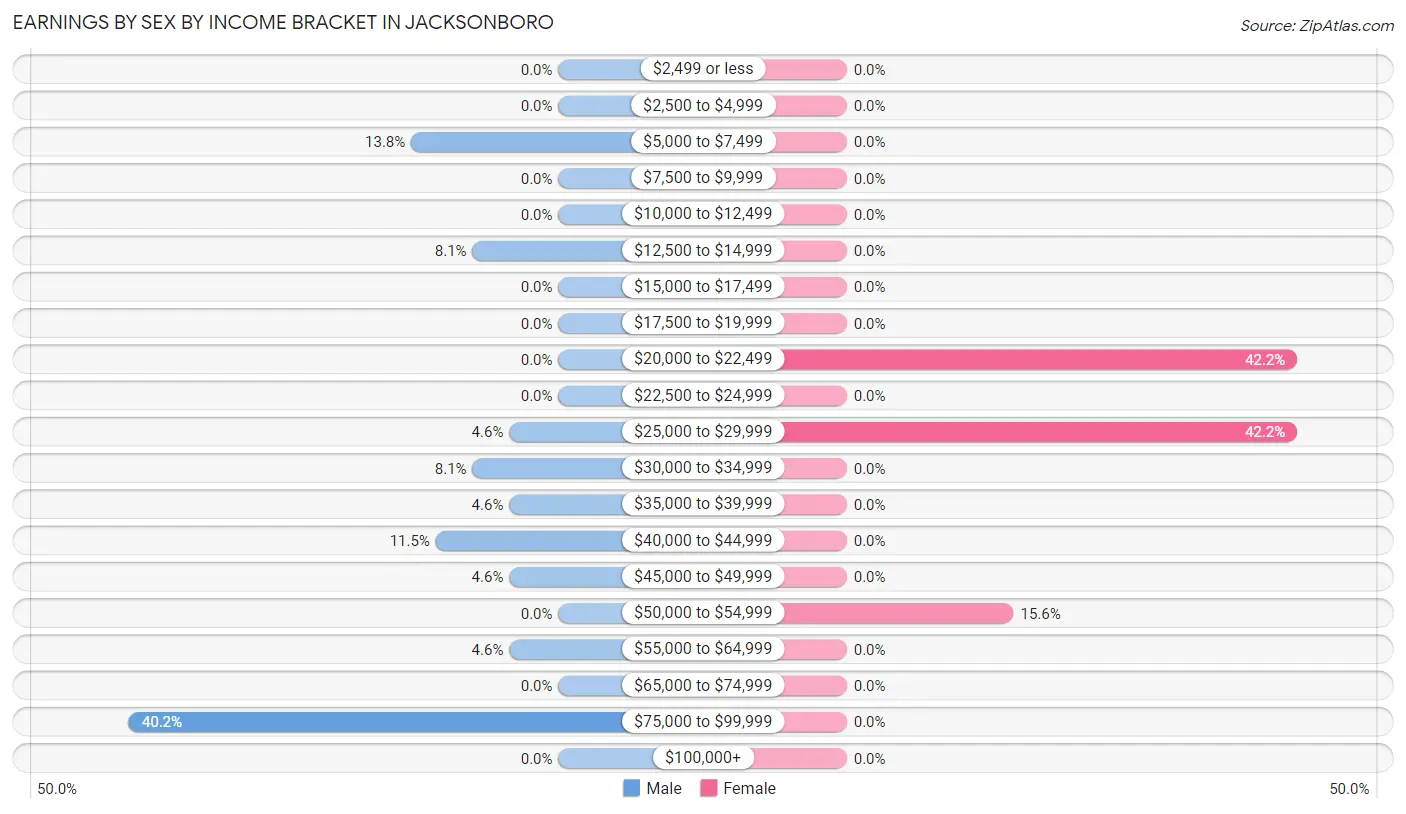
Earnings by Sex by Income Bracket in Jacksonboro
The most common earnings brackets in Jacksonboro are $75,000 to $99,999 for men (35 | 40.2%) and $20,000 to $22,499 for women (27 | 42.2%).
| Income | Male | Female |
| $2,499 or less | 0 (0.0%) | 0 (0.0%) |
| $2,500 to $4,999 | 0 (0.0%) | 0 (0.0%) |
| $5,000 to $7,499 | 12 (13.8%) | 0 (0.0%) |
| $7,500 to $9,999 | 0 (0.0%) | 0 (0.0%) |
| $10,000 to $12,499 | 0 (0.0%) | 0 (0.0%) |
| $12,500 to $14,999 | 7 (8.1%) | 0 (0.0%) |
| $15,000 to $17,499 | 0 (0.0%) | 0 (0.0%) |
| $17,500 to $19,999 | 0 (0.0%) | 0 (0.0%) |
| $20,000 to $22,499 | 0 (0.0%) | 27 (42.2%) |
| $22,500 to $24,999 | 0 (0.0%) | 0 (0.0%) |
| $25,000 to $29,999 | 4 (4.6%) | 27 (42.2%) |
| $30,000 to $34,999 | 7 (8.1%) | 0 (0.0%) |
| $35,000 to $39,999 | 4 (4.6%) | 0 (0.0%) |
| $40,000 to $44,999 | 10 (11.5%) | 0 (0.0%) |
| $45,000 to $49,999 | 4 (4.6%) | 0 (0.0%) |
| $50,000 to $54,999 | 0 (0.0%) | 10 (15.6%) |
| $55,000 to $64,999 | 4 (4.6%) | 0 (0.0%) |
| $65,000 to $74,999 | 0 (0.0%) | 0 (0.0%) |
| $75,000 to $99,999 | 35 (40.2%) | 0 (0.0%) |
| $100,000+ | 0 (0.0%) | 0 (0.0%) |
| Total | 87 (100.0%) | 64 (100.0%) |
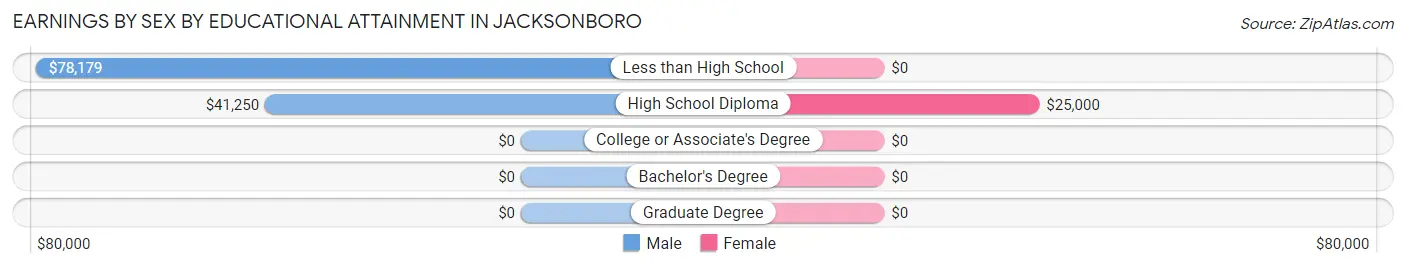
Earnings by Sex by Educational Attainment in Jacksonboro
Average earnings in Jacksonboro are $56,563 for men and $27,963 for women, a difference of 50.6%. Men with an educational attainment of less than high school enjoy the highest average annual earnings of $78,179, while those with high school diploma education earn the least with $41,250. Women with an educational attainment of high school diploma earn the most with the average annual earnings of $25,000, while those with high school diploma education have the smallest earnings of $25,000.
| Educational Attainment | Male Income | Female Income |
| Less than High School | $78,179 | $0 |
| High School Diploma | $41,250 | $25,000 |
| College or Associate's Degree | - | - |
| Bachelor's Degree | - | - |
| Graduate Degree | - | - |
| Total | $56,563 | $27,963 |
Family Income in Jacksonboro
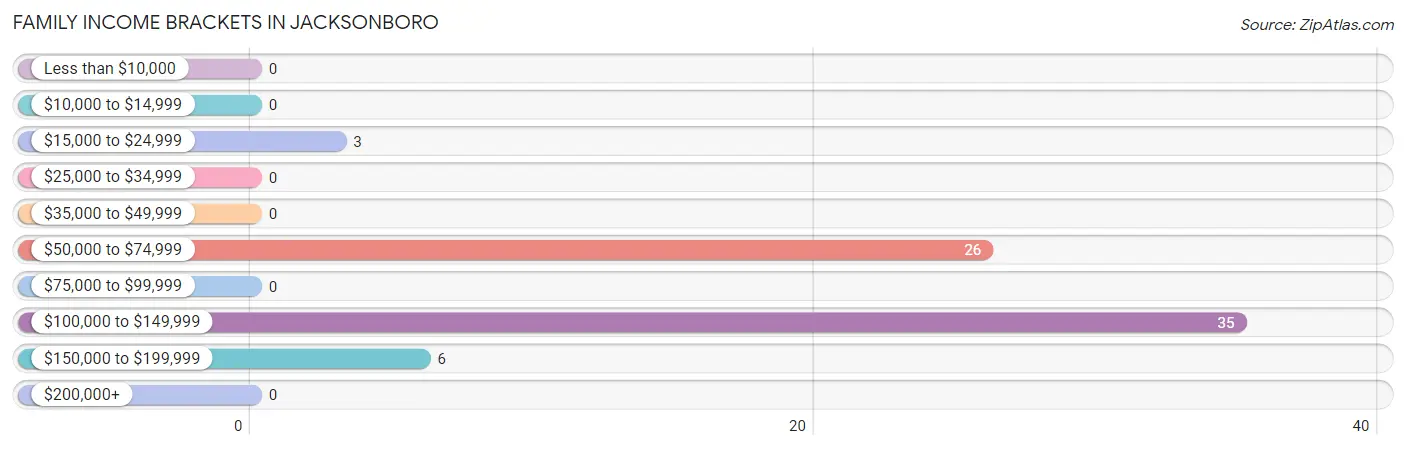
Family Income Brackets in Jacksonboro
According to the Jacksonboro family income data, there are 35 families falling into the $100,000 to $149,999 income range, which is the most common income bracket and makes up 50.0% of all families.
| Income Bracket | # Families | % Families |
| Less than $10,000 | 0 | 0.0% |
| $10,000 to $14,999 | 0 | 0.0% |
| $15,000 to $24,999 | 3 | 4.3% |
| $25,000 to $34,999 | 0 | 0.0% |
| $35,000 to $49,999 | 0 | 0.0% |
| $50,000 to $74,999 | 26 | 37.1% |
| $75,000 to $99,999 | 0 | 0.0% |
| $100,000 to $149,999 | 35 | 50.0% |
| $150,000 to $199,999 | 6 | 8.6% |
| $200,000+ | 0 | 0.0% |
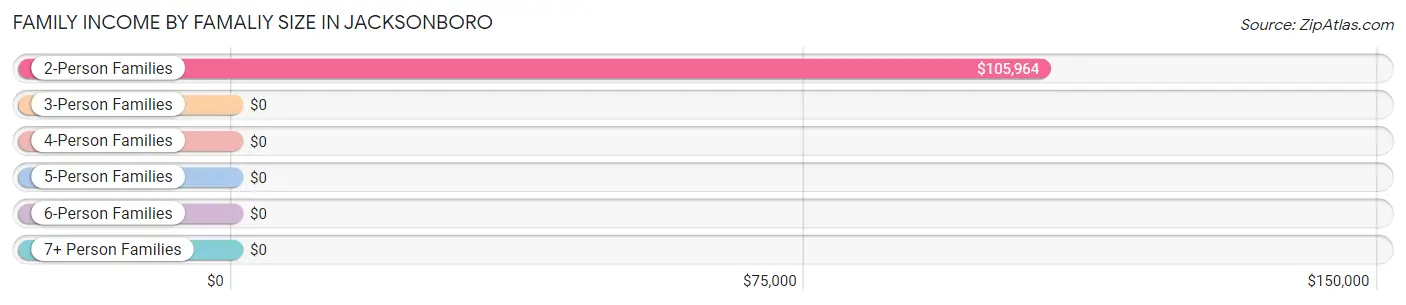
Family Income by Famaliy Size in Jacksonboro
2-person families (55 | 78.6%) account for the highest median family income in Jacksonboro with $105,964 per family, while 2-person families (55 | 78.6%) have the highest median income of $52,982 per family member.
| Income Bracket | # Families | Median Income |
| 2-Person Families | 55 (78.6%) | $105,964 |
| 3-Person Families | 0 (0.0%) | $0 |
| 4-Person Families | 12 (17.1%) | $0 |
| 5-Person Families | 3 (4.3%) | $0 |
| 6-Person Families | 0 (0.0%) | $0 |
| 7+ Person Families | 0 (0.0%) | $0 |
| Total | 70 (100.0%) | $105,429 |
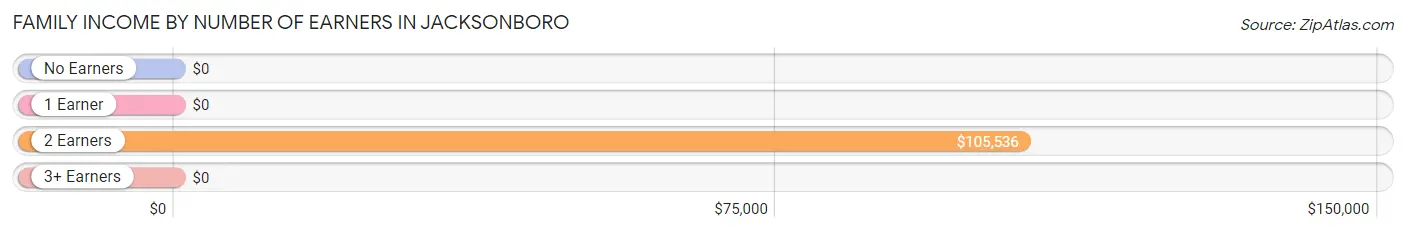
Family Income by Number of Earners in Jacksonboro
| Number of Earners | # Families | Median Income |
| No Earners | 9 (12.9%) | $0 |
| 1 Earner | 6 (8.6%) | $0 |
| 2 Earners | 55 (78.6%) | $105,536 |
| 3+ Earners | 0 (0.0%) | $0 |
| Total | 70 (100.0%) | $105,429 |
Household Income in Jacksonboro
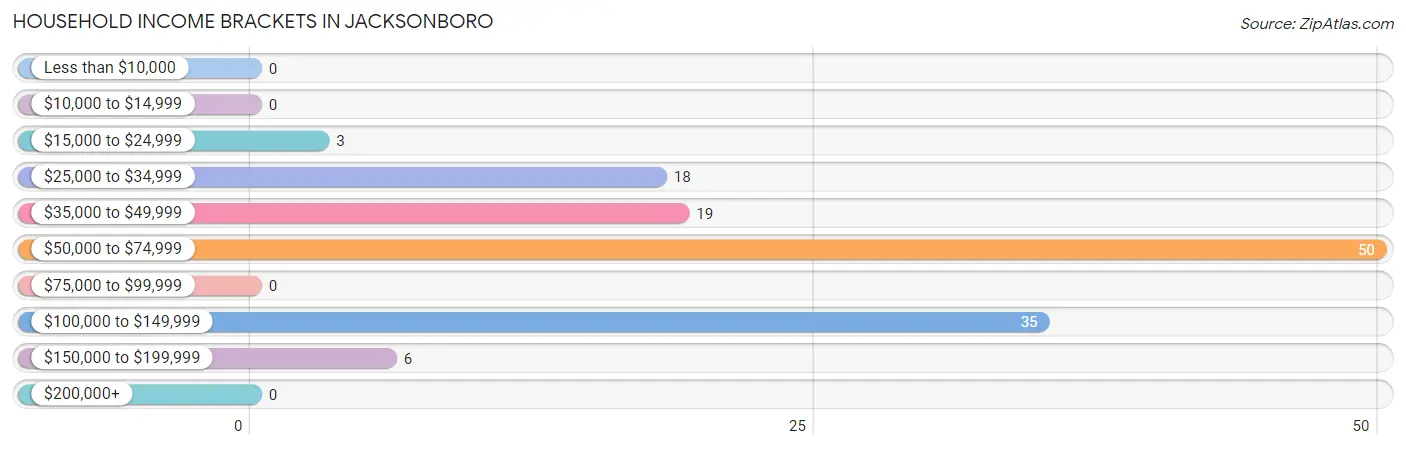
Household Income Brackets in Jacksonboro
With 50 households falling in the category, the $50,000 to $74,999 income range is the most frequent in Jacksonboro, accounting for 38.2% of all households.
| Income Bracket | # Households | % Households |
| Less than $10,000 | 0 | 0.0% |
| $10,000 to $14,999 | 0 | 0.0% |
| $15,000 to $24,999 | 3 | 2.3% |
| $25,000 to $34,999 | 18 | 13.7% |
| $35,000 to $49,999 | 19 | 14.5% |
| $50,000 to $74,999 | 50 | 38.2% |
| $75,000 to $99,999 | 0 | 0.0% |
| $100,000 to $149,999 | 35 | 26.7% |
| $150,000 to $199,999 | 6 | 4.6% |
| $200,000+ | 0 | 0.0% |
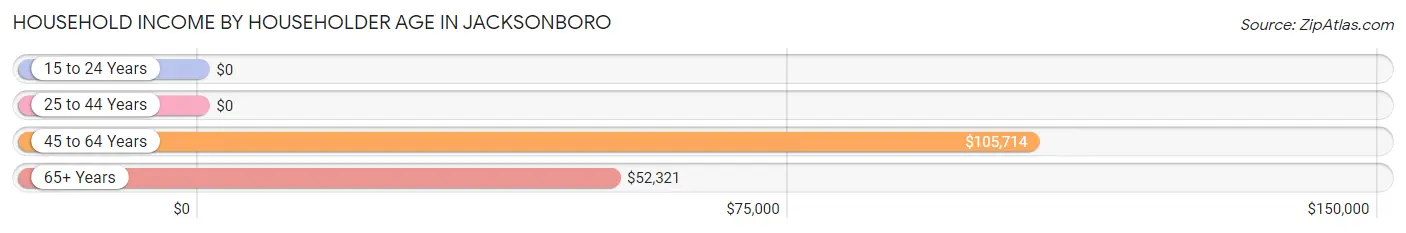
Household Income by Householder Age in Jacksonboro
The median household income in Jacksonboro is $54,896, with the highest median household income of $105,714 found in the 45 to 64 years age bracket for the primary householder. A total of 50 households (38.2%) fall into this category. Meanwhile, the 15 to 24 years age bracket for the primary householder has the lowest median household income of $0, with 7 households (5.3%) in this group.
| Income Bracket | # Households | Median Income |
| 15 to 24 Years | 7 (5.3%) | $0 |
| 25 to 44 Years | 4 (3.0%) | $0 |
| 45 to 64 Years | 50 (38.2%) | $105,714 |
| 65+ Years | 70 (53.4%) | $52,321 |
| Total | 131 (100.0%) | $54,896 |
Poverty in Jacksonboro
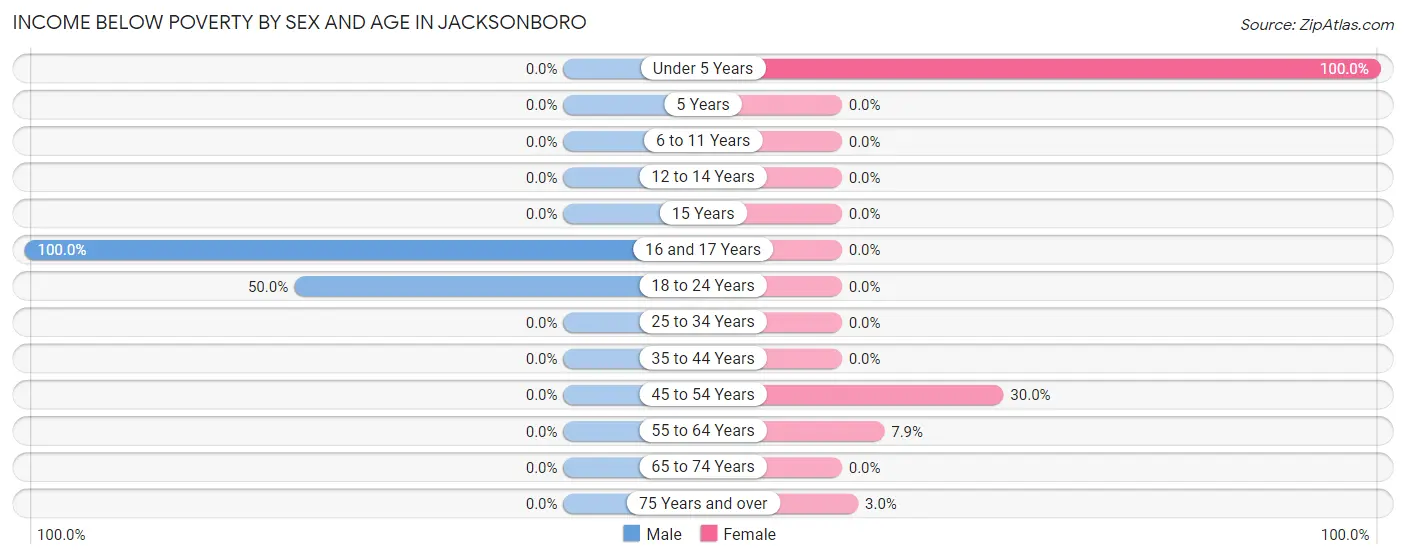
Income Below Poverty by Sex and Age in Jacksonboro
With 22.0% poverty level for males and 11.8% for females among the residents of Jacksonboro, 16 and 17 year old males and under 5 year old females are the most vulnerable to poverty, with 17 males (100.0%) and 9 females (100.0%) in their respective age groups living below the poverty level.
| Age Bracket | Male | Female |
| Under 5 Years | 0 (0.0%) | 9 (100.0%) |
| 5 Years | 0 (0.0%) | 0 (0.0%) |
| 6 to 11 Years | 0 (0.0%) | 0 (0.0%) |
| 12 to 14 Years | 0 (0.0%) | 0 (0.0%) |
| 15 Years | 0 (0.0%) | 0 (0.0%) |
| 16 and 17 Years | 17 (100.0%) | 0 (0.0%) |
| 18 to 24 Years | 7 (50.0%) | 0 (0.0%) |
| 25 to 34 Years | 0 (0.0%) | 0 (0.0%) |
| 35 to 44 Years | 0 (0.0%) | 0 (0.0%) |
| 45 to 54 Years | 0 (0.0%) | 6 (30.0%) |
| 55 to 64 Years | 0 (0.0%) | 3 (7.9%) |
| 65 to 74 Years | 0 (0.0%) | 0 (0.0%) |
| 75 Years and over | 0 (0.0%) | 1 (3.0%) |
| Total | 24 (22.0%) | 19 (11.8%) |
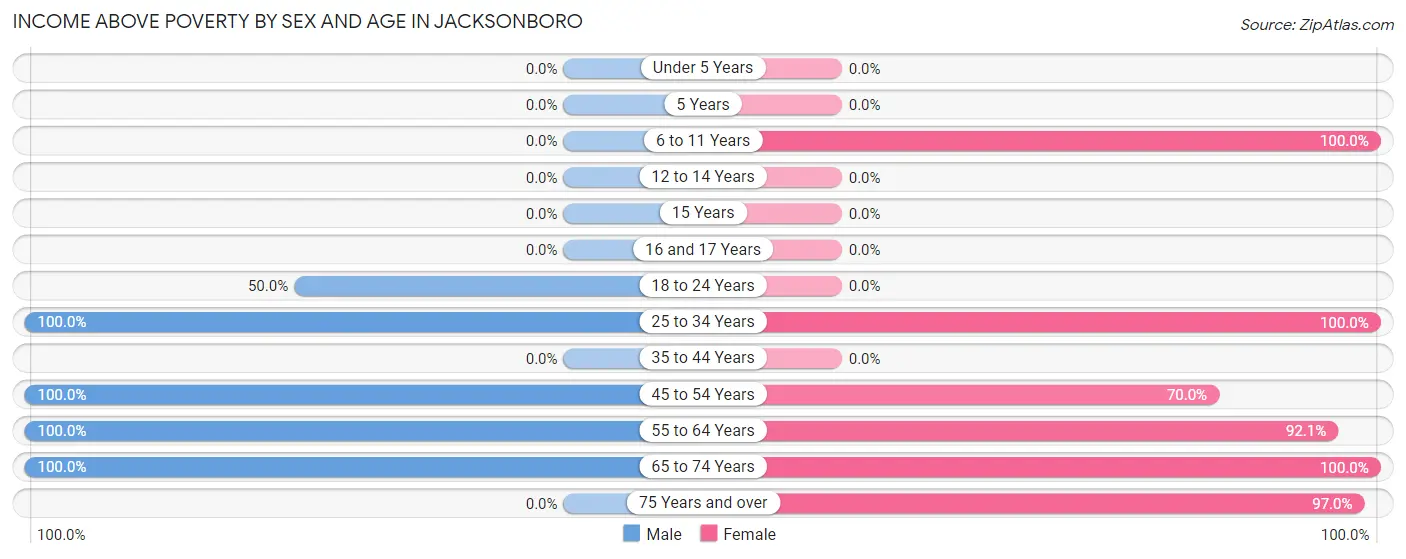
Income Above Poverty by Sex and Age in Jacksonboro
According to the poverty statistics in Jacksonboro, males aged 25 to 34 years and females aged 6 to 11 years are the age groups that are most secure financially, with 100.0% of males and 100.0% of females in these age groups living above the poverty line.
| Age Bracket | Male | Female |
| Under 5 Years | 0 (0.0%) | 0 (0.0%) |
| 5 Years | 0 (0.0%) | 0 (0.0%) |
| 6 to 11 Years | 0 (0.0%) | 20 (100.0%) |
| 12 to 14 Years | 0 (0.0%) | 0 (0.0%) |
| 15 Years | 0 (0.0%) | 0 (0.0%) |
| 16 and 17 Years | 0 (0.0%) | 0 (0.0%) |
| 18 to 24 Years | 7 (50.0%) | 0 (0.0%) |
| 25 to 34 Years | 4 (100.0%) | 19 (100.0%) |
| 35 to 44 Years | 0 (0.0%) | 0 (0.0%) |
| 45 to 54 Years | 39 (100.0%) | 14 (70.0%) |
| 55 to 64 Years | 10 (100.0%) | 35 (92.1%) |
| 65 to 74 Years | 25 (100.0%) | 22 (100.0%) |
| 75 Years and over | 0 (0.0%) | 32 (97.0%) |
| Total | 85 (78.0%) | 142 (88.2%) |
Income Below Poverty Among Married-Couple Families in Jacksonboro
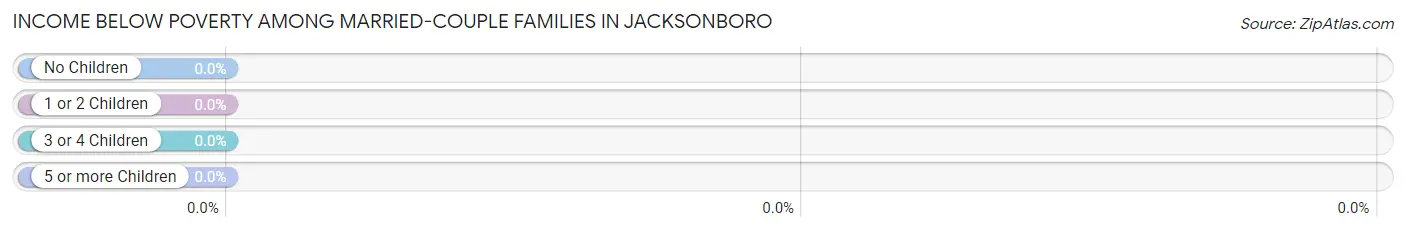
| Children | Above Poverty | Below Poverty |
| No Children | 55 (100.0%) | 0 (0.0%) |
| 1 or 2 Children | 0 (0.0%) | 0 (0.0%) |
| 3 or 4 Children | 0 (0.0%) | 0 (0.0%) |
| 5 or more Children | 0 (0.0%) | 0 (0.0%) |
| Total | 55 (100.0%) | 0 (0.0%) |
Income Below Poverty Among Single-Parent Households in Jacksonboro
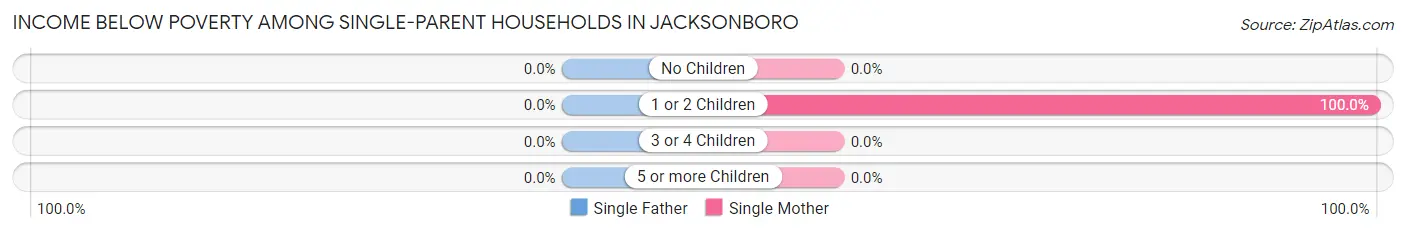
| Children | Single Father | Single Mother |
| No Children | 0 (0.0%) | 0 (0.0%) |
| 1 or 2 Children | 0 (0.0%) | 3 (100.0%) |
| 3 or 4 Children | 0 (0.0%) | 0 (0.0%) |
| 5 or more Children | 0 (0.0%) | 0 (0.0%) |
| Total | 0 (0.0%) | 3 (100.0%) |
Income Below Poverty Among Married-Couple vs Single-Parent Households in Jacksonboro
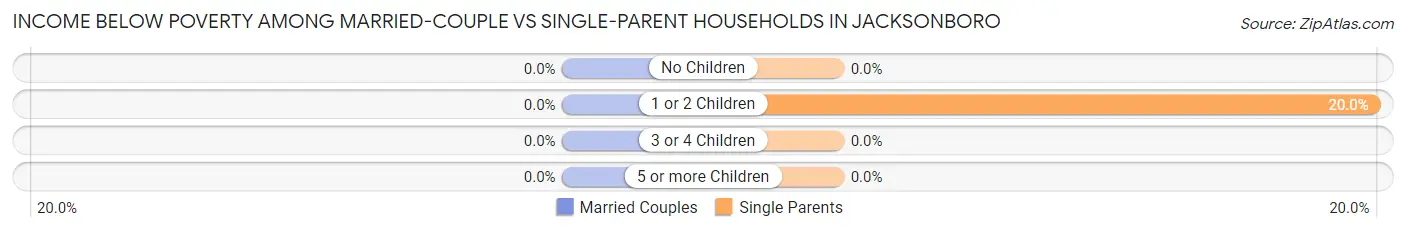
| Children | Married-Couple Families | Single-Parent Households |
| No Children | 0 (0.0%) | 0 (0.0%) |
| 1 or 2 Children | 0 (0.0%) | 3 (20.0%) |
| 3 or 4 Children | 0 (0.0%) | 0 (0.0%) |
| 5 or more Children | 0 (0.0%) | 0 (0.0%) |
| Total | 0 (0.0%) | 3 (20.0%) |
Race in Jacksonboro
The most populous races in Jacksonboro are Black / African American (234 | 86.7%), and White / Caucasian (36 | 13.3%).
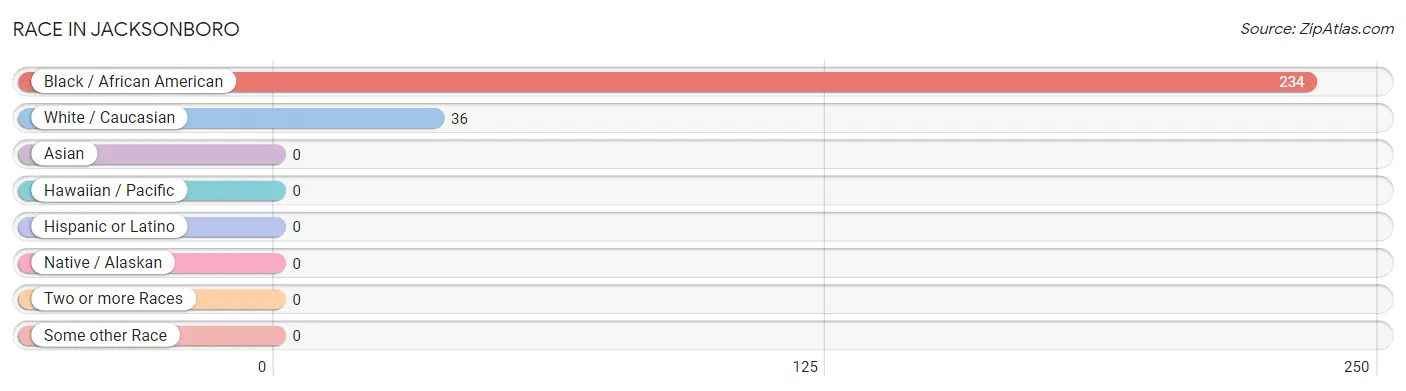
| Race | # Population | % Population |
| Asian | 0 | 0.0% |
| Black / African American | 234 | 86.7% |
| Hawaiian / Pacific | 0 | 0.0% |
| Hispanic or Latino | 0 | 0.0% |
| Native / Alaskan | 0 | 0.0% |
| White / Caucasian | 36 | 13.3% |
| Two or more Races | 0 | 0.0% |
| Some other Race | 0 | 0.0% |
| Total | 270 | 100.0% |
Ancestry in Jacksonboro
The most populous ancestries reported in Jacksonboro are American (62 | 23.0%), English (18 | 6.7%), German (7 | 2.6%), and Scotch-Irish (7 | 2.6%), together accounting for 34.8% of all Jacksonboro residents.
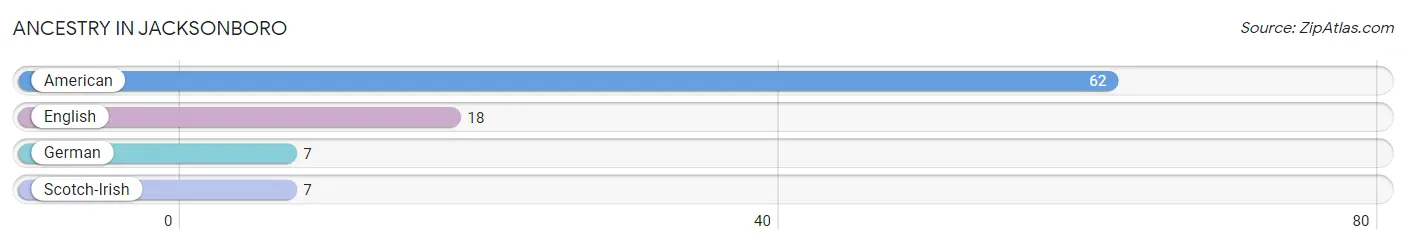
| Ancestry | # Population | % Population |
| American | 62 | 23.0% |
| English | 18 | 6.7% |
| German | 7 | 2.6% |
| Scotch-Irish | 7 | 2.6% | View All 4 Rows |
Immigrants in Jacksonboro

| Immigration Origin | # Population | % Population | View All 0 Rows |
Sex and Age in Jacksonboro
Sex and Age in Jacksonboro
The most populous age groups in Jacksonboro are 50 to 54 Years (35 | 32.1%) for men and 55 to 59 Years (35 | 21.7%) for women.
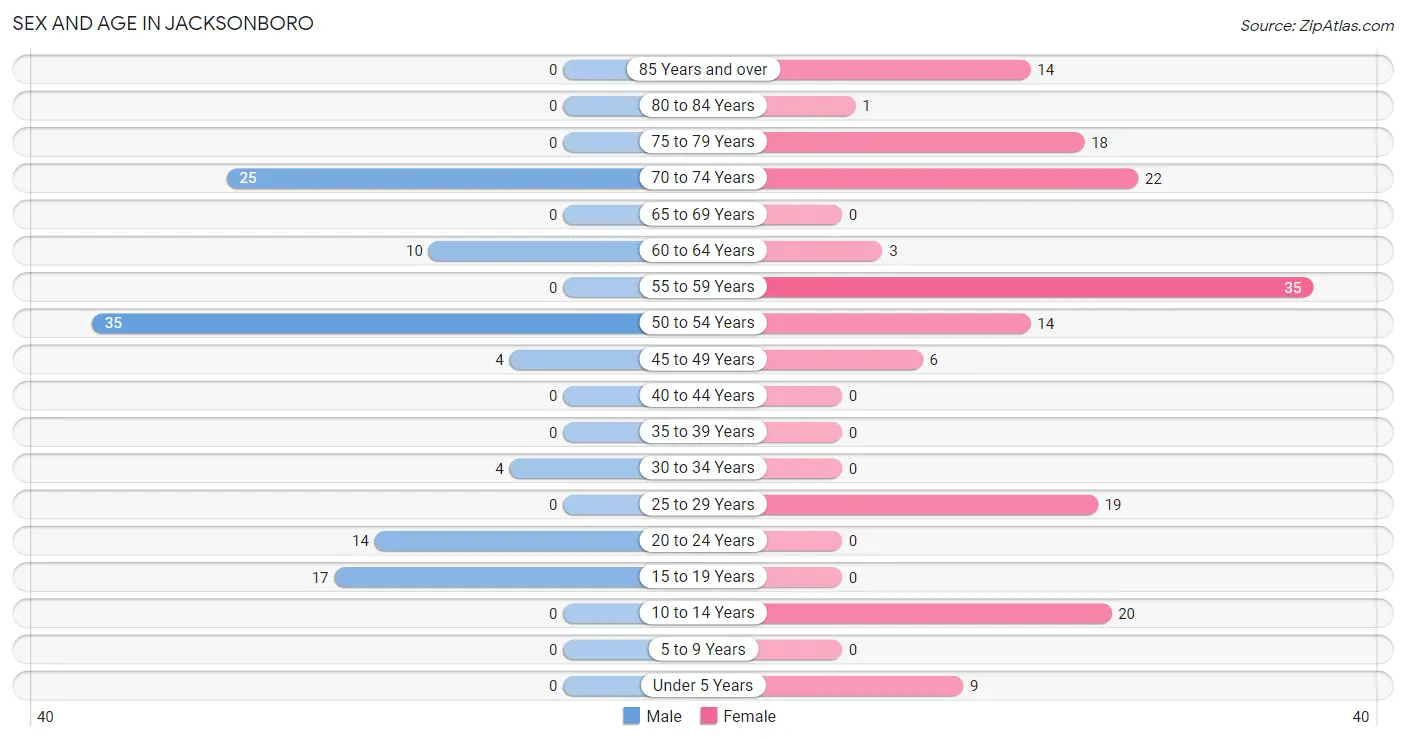
| Age Bracket | Male | Female |
| Under 5 Years | 0 (0.0%) | 9 (5.6%) |
| 5 to 9 Years | 0 (0.0%) | 0 (0.0%) |
| 10 to 14 Years | 0 (0.0%) | 20 (12.4%) |
| 15 to 19 Years | 17 (15.6%) | 0 (0.0%) |
| 20 to 24 Years | 14 (12.8%) | 0 (0.0%) |
| 25 to 29 Years | 0 (0.0%) | 19 (11.8%) |
| 30 to 34 Years | 4 (3.7%) | 0 (0.0%) |
| 35 to 39 Years | 0 (0.0%) | 0 (0.0%) |
| 40 to 44 Years | 0 (0.0%) | 0 (0.0%) |
| 45 to 49 Years | 4 (3.7%) | 6 (3.7%) |
| 50 to 54 Years | 35 (32.1%) | 14 (8.7%) |
| 55 to 59 Years | 0 (0.0%) | 35 (21.7%) |
| 60 to 64 Years | 10 (9.2%) | 3 (1.9%) |
| 65 to 69 Years | 0 (0.0%) | 0 (0.0%) |
| 70 to 74 Years | 25 (22.9%) | 22 (13.7%) |
| 75 to 79 Years | 0 (0.0%) | 18 (11.2%) |
| 80 to 84 Years | 0 (0.0%) | 1 (0.6%) |
| 85 Years and over | 0 (0.0%) | 14 (8.7%) |
| Total | 109 (100.0%) | 161 (100.0%) |
Families and Households in Jacksonboro
Median Family Size in Jacksonboro
The median family size in Jacksonboro is 2.89 persons per family, with single female/mother families (3 | 4.3%) accounting for the largest median family size of 12 persons per family. On the other hand, married-couple families (55 | 78.6%) represent the smallest median family size with 1.84 persons per family.
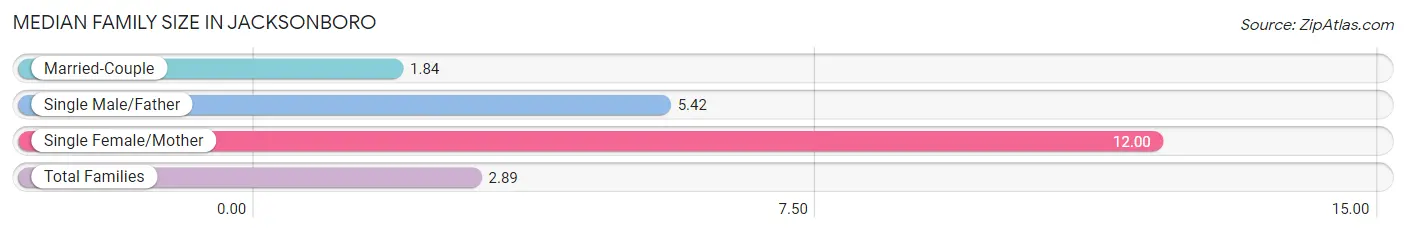
| Family Type | # Families | Family Size |
| Married-Couple | 55 (78.6%) | 1.84 |
| Single Male/Father | 12 (17.1%) | 5.42 |
| Single Female/Mother | 3 (4.3%) | 12.00 |
| Total Families | 70 (100.0%) | 2.89 |
Median Household Size in Jacksonboro
The median household size in Jacksonboro is 2.06 persons per household, with single female/mother households (3 | 2.3%) accounting for the largest median household size of 12 persons per household. non-family households (61 | 46.6%) represent the smallest median household size with 1.11 persons per household.
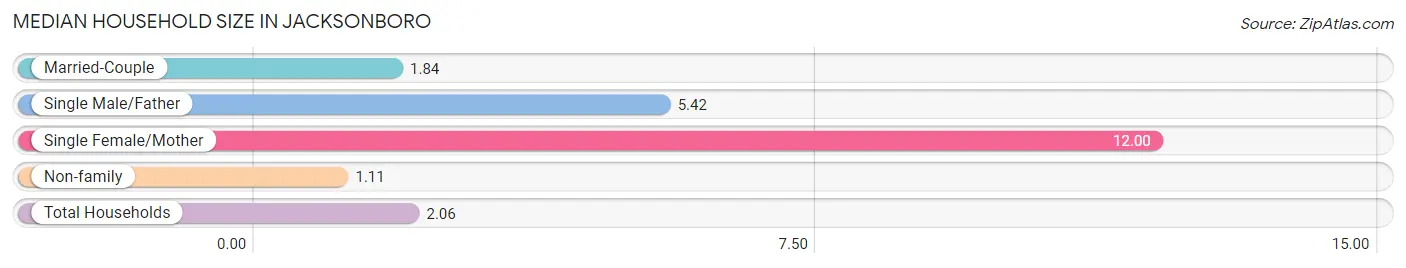
| Household Type | # Households | Household Size |
| Married-Couple | 55 (42.0%) | 1.84 |
| Single Male/Father | 12 (9.2%) | 5.42 |
| Single Female/Mother | 3 (2.3%) | 12.00 |
| Non-family | 61 (46.6%) | 1.11 |
| Total Households | 131 (100.0%) | 2.06 |
Household Size by Marriage Status in Jacksonboro
Out of a total of 131 households in Jacksonboro, 70 (53.4%) are family households, while 61 (46.6%) are nonfamily households. The most numerous type of family households are 2-person households, comprising 55, and the most common type of nonfamily households are 1-person households, comprising 54.
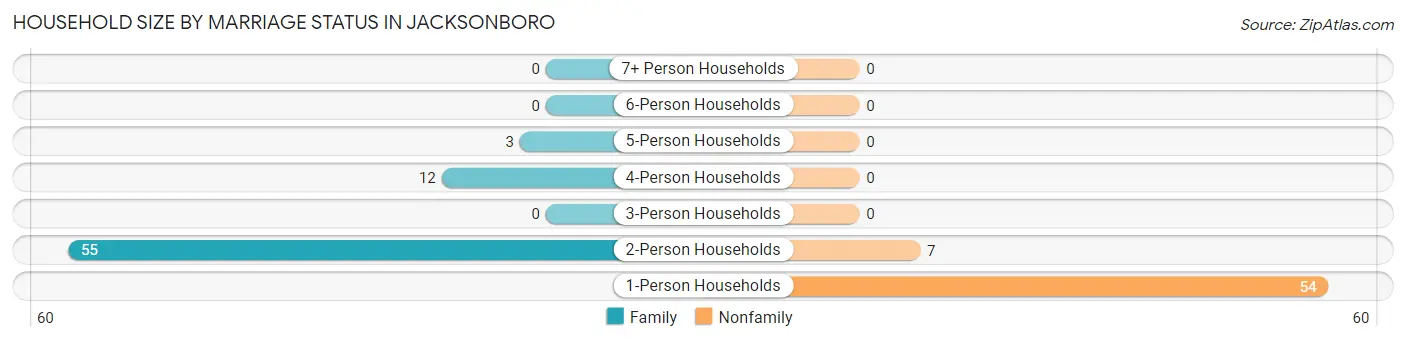
| Household Size | Family Households | Nonfamily Households |
| 1-Person Households | - | 54 (41.2%) |
| 2-Person Households | 55 (42.0%) | 7 (5.3%) |
| 3-Person Households | 0 (0.0%) | 0 (0.0%) |
| 4-Person Households | 12 (9.2%) | 0 (0.0%) |
| 5-Person Households | 3 (2.3%) | 0 (0.0%) |
| 6-Person Households | 0 (0.0%) | 0 (0.0%) |
| 7+ Person Households | 0 (0.0%) | 0 (0.0%) |
| Total | 70 (53.4%) | 61 (46.6%) |
Female Fertility in Jacksonboro
Fertility by Age in Jacksonboro
| Age Bracket | Women with Births | Births / 1,000 Women |
| 15 to 19 years | 0 (0.0%) | 0.0 |
| 20 to 34 years | 0 (0.0%) | 0.0 |
| 35 to 50 years | 0 (0.0%) | 0.0 |
| Total | 0 (0.0%) | 0.0 |
Fertility by Age by Marriage Status in Jacksonboro
| Age Bracket | Married | Unmarried |
| 15 to 19 years | 0 (0.0%) | 0 (0.0%) |
| 20 to 34 years | 0 (0.0%) | 0 (0.0%) |
| 35 to 50 years | 0 (0.0%) | 0 (0.0%) |
| Total | 0 (0.0%) | 0 (0.0%) |
Fertility by Education in Jacksonboro
| Educational Attainment | Women with Births | Births / 1,000 Women |
| Less than High School | 0 (0.0%) | 0.0 |
| High School Diploma | 0 (0.0%) | 0.0 |
| College or Associate's Degree | 0 (0.0%) | 0.0 |
| Bachelor's Degree | 0 (0.0%) | 0.0 |
| Graduate Degree | 0 (0.0%) | 0.0 |
| Total | 0 (0.0%) | 0.0 |
Fertility by Education by Marriage Status in Jacksonboro
| Educational Attainment | Married | Unmarried |
| Less than High School | 0 (0.0%) | 0 (0.0%) |
| High School Diploma | 0 (0.0%) | 0 (0.0%) |
| College or Associate's Degree | 0 (0.0%) | 0 (0.0%) |
| Bachelor's Degree | 0 (0.0%) | 0 (0.0%) |
| Graduate Degree | 0 (0.0%) | 0 (0.0%) |
| Total | 0 (0.0%) | 0 (0.0%) |
Employment Characteristics in Jacksonboro
Employment by Class of Employer in Jacksonboro
Among the 131 employed individuals in Jacksonboro, private company employees (111 | 84.7%), self-employed (not incorporated) (10 | 7.6%), and not-for-profit organizations (10 | 7.6%) make up the most common classes of employment.
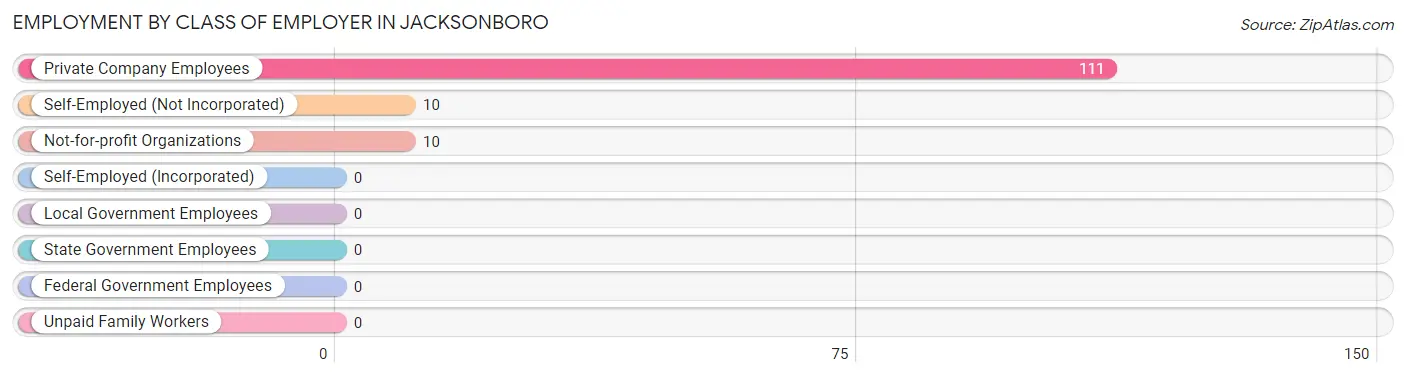
| Employer Class | # Employees | % Employees |
| Private Company Employees | 111 | 84.7% |
| Self-Employed (Incorporated) | 0 | 0.0% |
| Self-Employed (Not Incorporated) | 10 | 7.6% |
| Not-for-profit Organizations | 10 | 7.6% |
| Local Government Employees | 0 | 0.0% |
| State Government Employees | 0 | 0.0% |
| Federal Government Employees | 0 | 0.0% |
| Unpaid Family Workers | 0 | 0.0% |
| Total | 131 | 100.0% |
Employment Status by Age in Jacksonboro
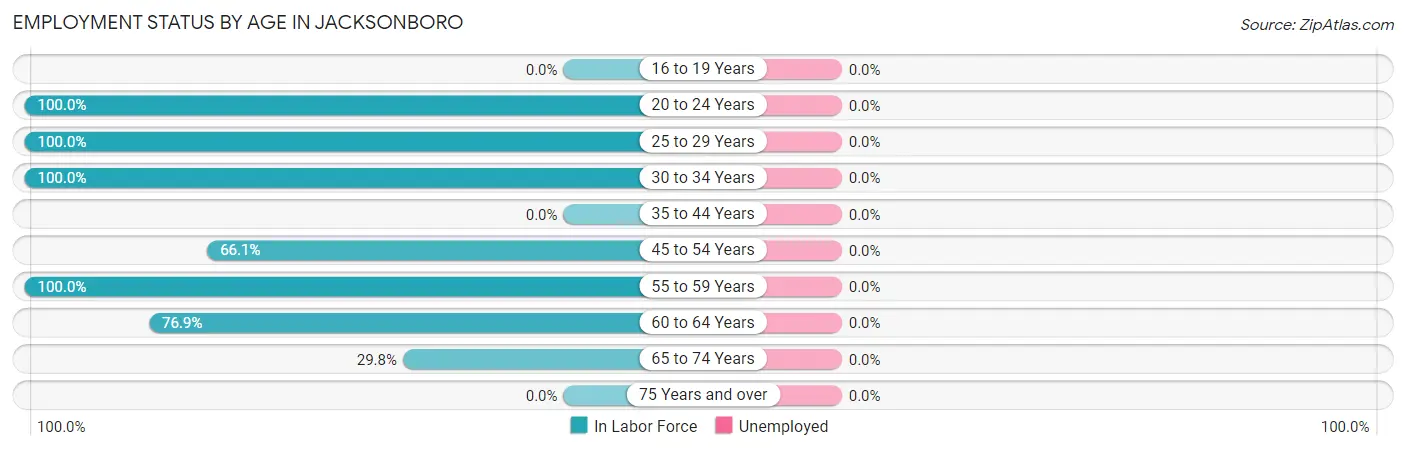
| Age Bracket | In Labor Force | Unemployed |
| 16 to 19 Years | 0 (0.0%) | 0 (0.0%) |
| 20 to 24 Years | 14 (100.0%) | 0 (0.0%) |
| 25 to 29 Years | 19 (100.0%) | 0 (0.0%) |
| 30 to 34 Years | 4 (100.0%) | 0 (0.0%) |
| 35 to 44 Years | 0 (0.0%) | 0 (0.0%) |
| 45 to 54 Years | 39 (66.1%) | 0 (0.0%) |
| 55 to 59 Years | 35 (100.0%) | 0 (0.0%) |
| 60 to 64 Years | 10 (76.9%) | 0 (0.0%) |
| 65 to 74 Years | 14 (29.8%) | 0 (0.0%) |
| 75 Years and over | 0 (0.0%) | 0 (0.0%) |
| Total | 135 (56.0%) | 0 (0.0%) |
Employment Status by Educational Attainment in Jacksonboro
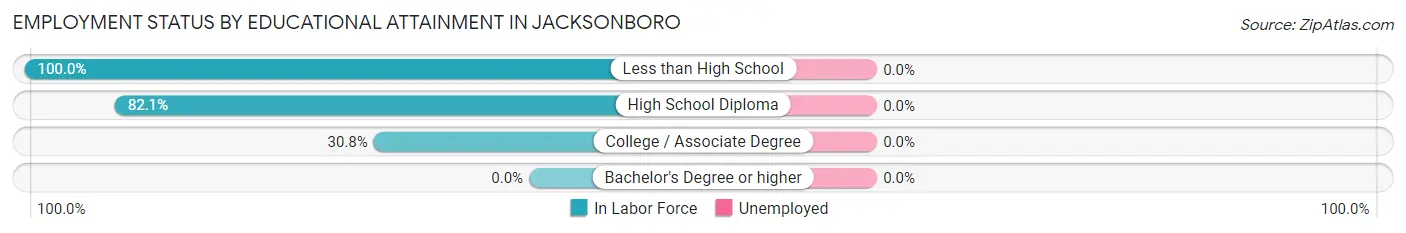
| Educational Attainment | In Labor Force | Unemployed |
| Less than High School | 39 (100.0%) | 0 (0.0%) |
| High School Diploma | 64 (82.1%) | 0 (0.0%) |
| College / Associate Degree | 4 (30.8%) | 0 (0.0%) |
| Bachelor's Degree or higher | 0 (0.0%) | 0 (0.0%) |
| Total | 107 (82.3%) | 0 (0.0%) |
Employment Occupations by Sex in Jacksonboro
Management, Business, Science and Arts Occupations
The most common Management, Business, Science and Arts occupations in Jacksonboro are Management (10 | 7.4%), Community & Social Service (8 | 5.9%), and Education, Arts & Media (8 | 5.9%).
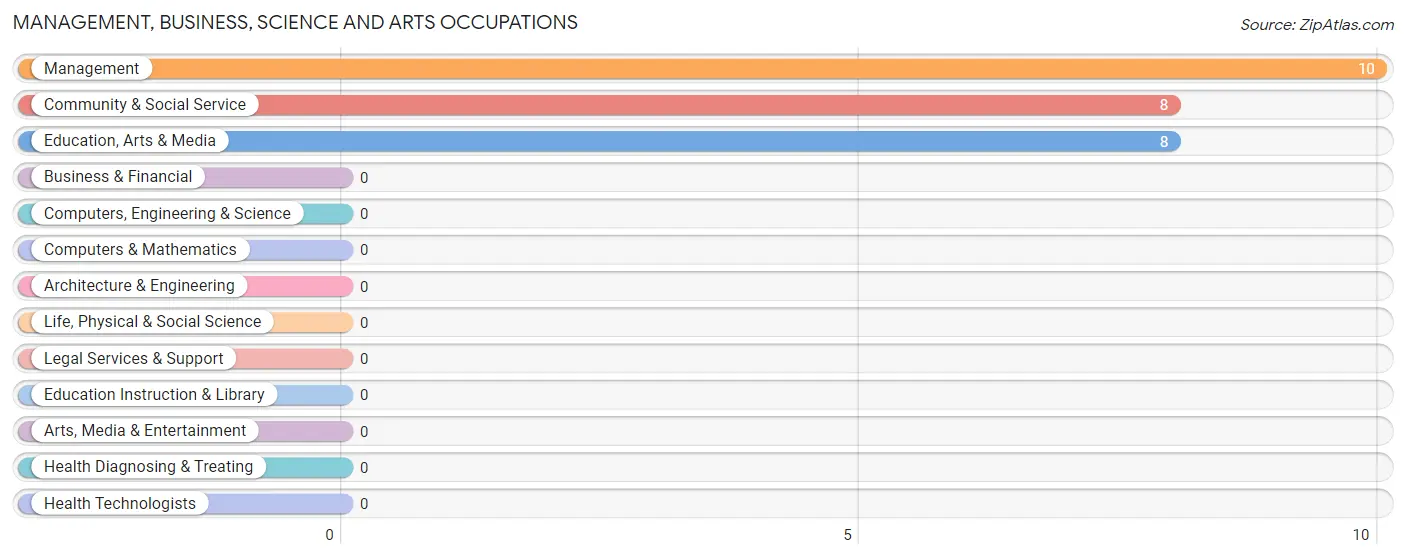
Management, Business, Science and Arts Occupations by Sex
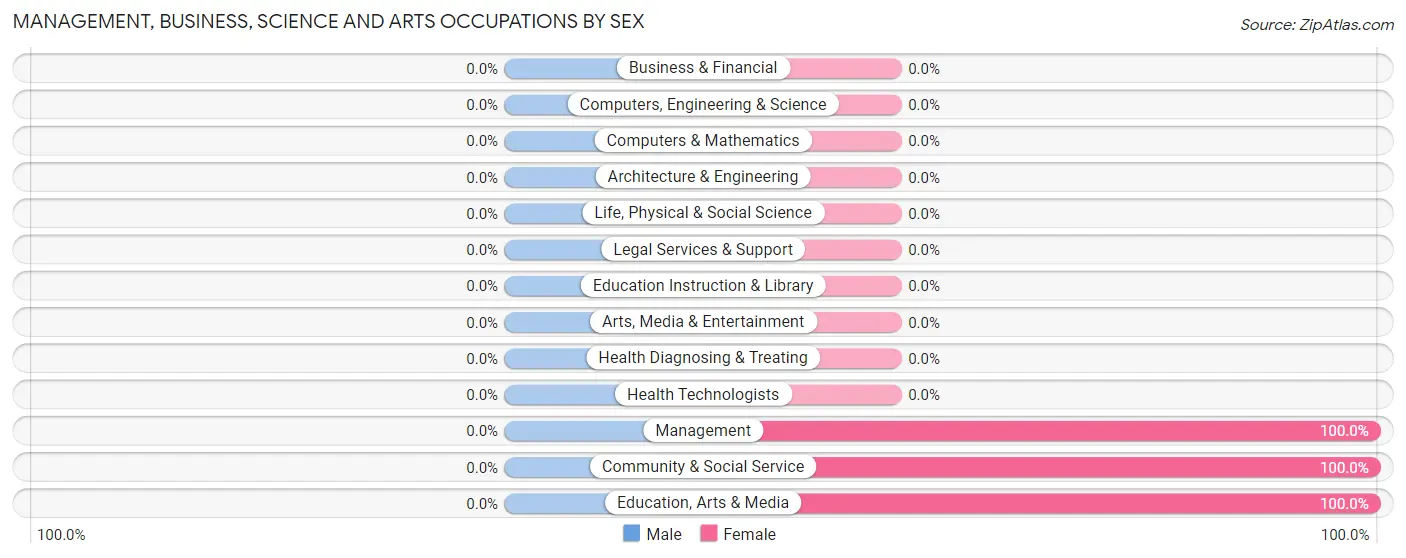
| Occupation | Male | Female |
| Management | 0 (0.0%) | 10 (100.0%) |
| Business & Financial | 0 (0.0%) | 0 (0.0%) |
| Computers, Engineering & Science | 0 (0.0%) | 0 (0.0%) |
| Computers & Mathematics | 0 (0.0%) | 0 (0.0%) |
| Architecture & Engineering | 0 (0.0%) | 0 (0.0%) |
| Life, Physical & Social Science | 0 (0.0%) | 0 (0.0%) |
| Community & Social Service | 0 (0.0%) | 8 (100.0%) |
| Education, Arts & Media | 0 (0.0%) | 8 (100.0%) |
| Legal Services & Support | 0 (0.0%) | 0 (0.0%) |
| Education Instruction & Library | 0 (0.0%) | 0 (0.0%) |
| Arts, Media & Entertainment | 0 (0.0%) | 0 (0.0%) |
| Health Diagnosing & Treating | 0 (0.0%) | 0 (0.0%) |
| Health Technologists | 0 (0.0%) | 0 (0.0%) |
| Total (Category) | 0 (0.0%) | 18 (100.0%) |
| Total (Overall) | 71 (52.6%) | 64 (47.4%) |
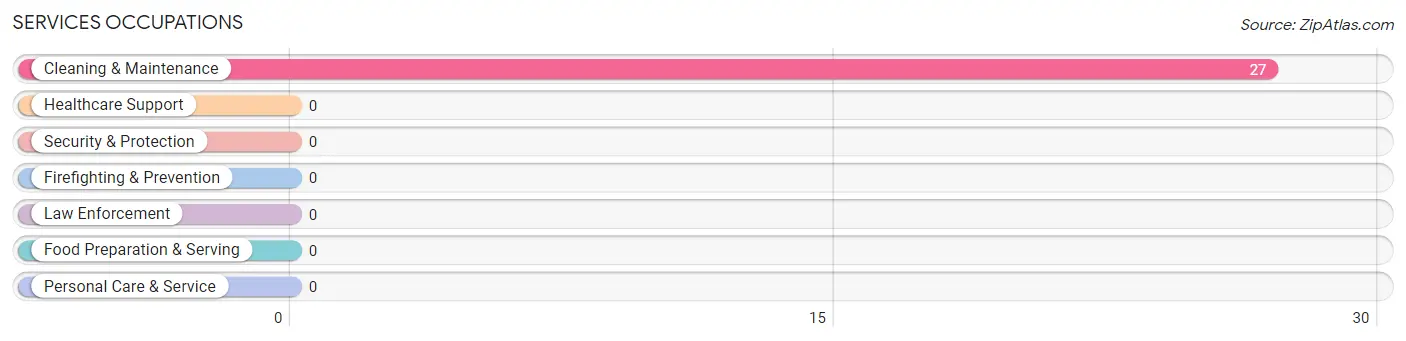
Services Occupations
The most common Services occupations in Jacksonboro are , and Cleaning & Maintenance (27 | 20.0%).
Services Occupations by Sex
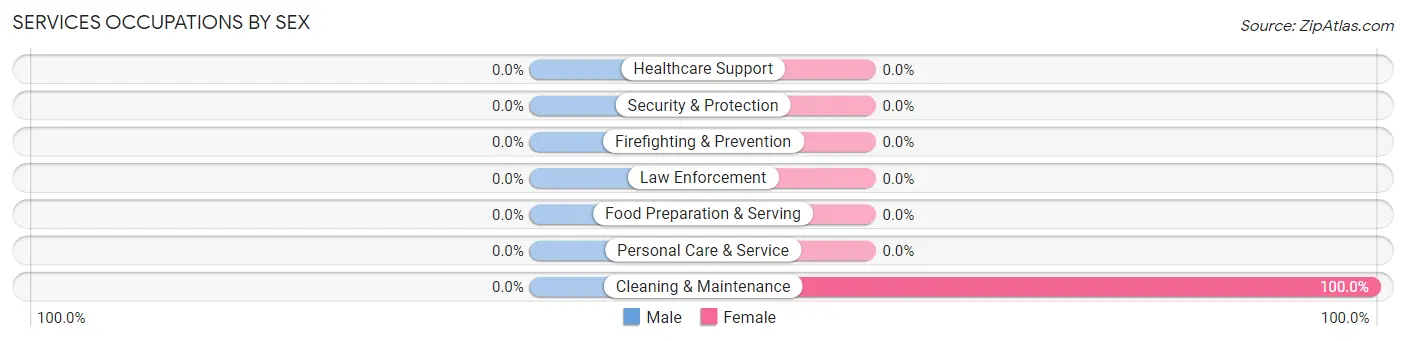
| Occupation | Male | Female |
| Healthcare Support | 0 (0.0%) | 0 (0.0%) |
| Security & Protection | 0 (0.0%) | 0 (0.0%) |
| Firefighting & Prevention | 0 (0.0%) | 0 (0.0%) |
| Law Enforcement | 0 (0.0%) | 0 (0.0%) |
| Food Preparation & Serving | 0 (0.0%) | 0 (0.0%) |
| Cleaning & Maintenance | 0 (0.0%) | 27 (100.0%) |
| Personal Care & Service | 0 (0.0%) | 0 (0.0%) |
| Total (Category) | 0 (0.0%) | 27 (100.0%) |
| Total (Overall) | 71 (52.6%) | 64 (47.4%) |
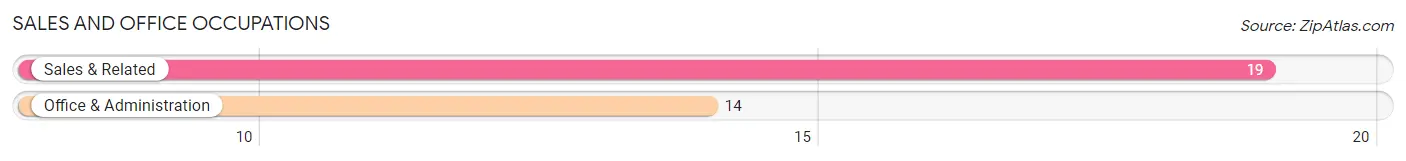
Sales and Office Occupations
The most common Sales and Office occupations in Jacksonboro are Sales & Related (19 | 14.1%), and Office & Administration (14 | 10.4%).
Sales and Office Occupations by Sex
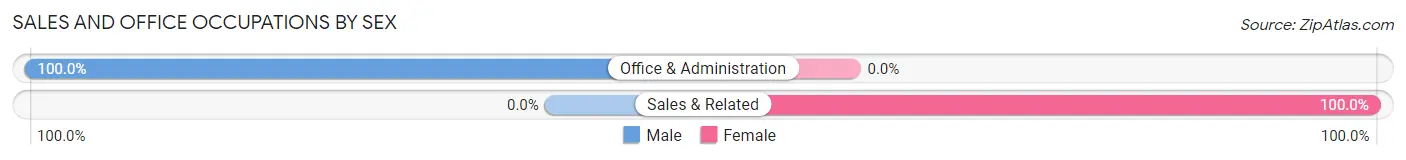
| Occupation | Male | Female |
| Sales & Related | 0 (0.0%) | 19 (100.0%) |
| Office & Administration | 14 (100.0%) | 0 (0.0%) |
| Total (Category) | 14 (42.4%) | 19 (57.6%) |
| Total (Overall) | 71 (52.6%) | 64 (47.4%) |
Natural Resources, Construction and Maintenance Occupations
The most common Natural Resources, Construction and Maintenance occupations in Jacksonboro are Construction & Extraction (39 | 28.9%), and Installation, Maintenance & Repair (4 | 3.0%).
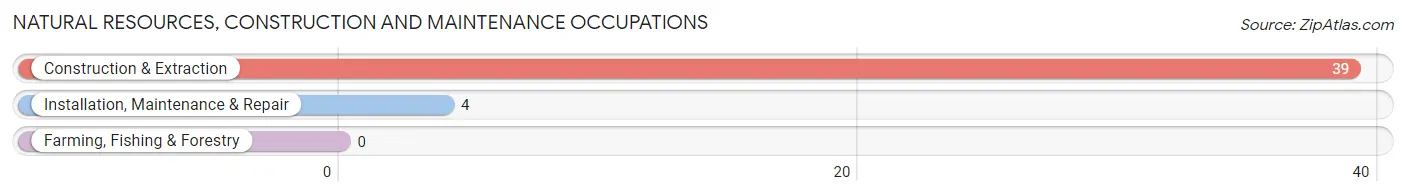
Natural Resources, Construction and Maintenance Occupations by Sex
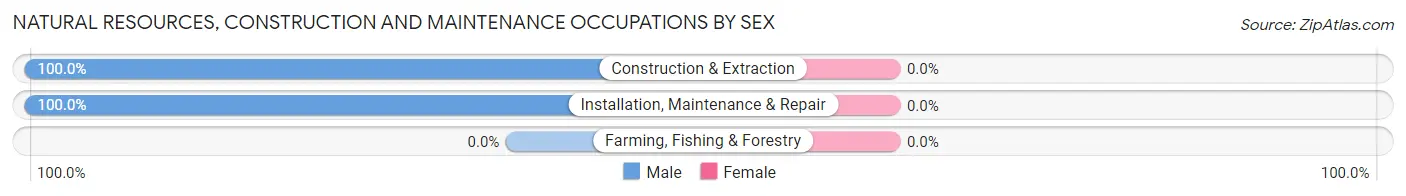
| Occupation | Male | Female |
| Farming, Fishing & Forestry | 0 (0.0%) | 0 (0.0%) |
| Construction & Extraction | 39 (100.0%) | 0 (0.0%) |
| Installation, Maintenance & Repair | 4 (100.0%) | 0 (0.0%) |
| Total (Category) | 43 (100.0%) | 0 (0.0%) |
| Total (Overall) | 71 (52.6%) | 64 (47.4%) |
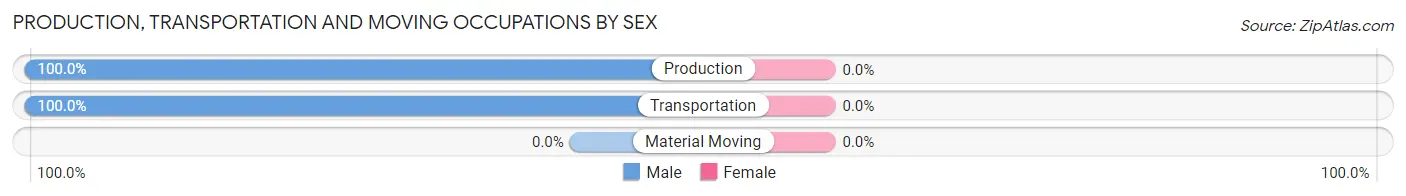
Production, Transportation and Moving Occupations
The most common Production, Transportation and Moving occupations in Jacksonboro are Transportation (10 | 7.4%), and Production (4 | 3.0%).
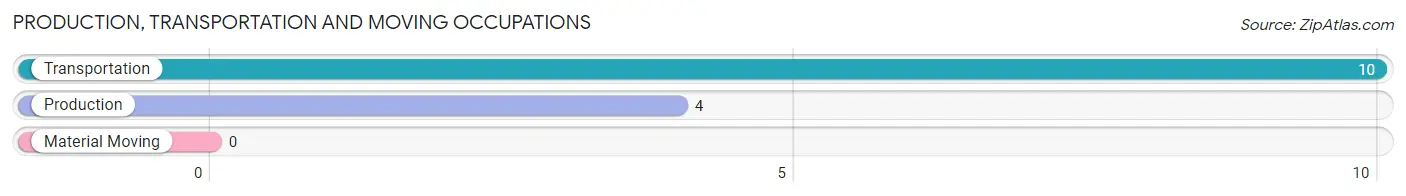
Production, Transportation and Moving Occupations by Sex
| Occupation | Male | Female |
| Production | 4 (100.0%) | 0 (0.0%) |
| Transportation | 10 (100.0%) | 0 (0.0%) |
| Material Moving | 0 (0.0%) | 0 (0.0%) |
| Total (Category) | 14 (100.0%) | 0 (0.0%) |
| Total (Overall) | 71 (52.6%) | 64 (47.4%) |
Employment Industries by Sex in Jacksonboro
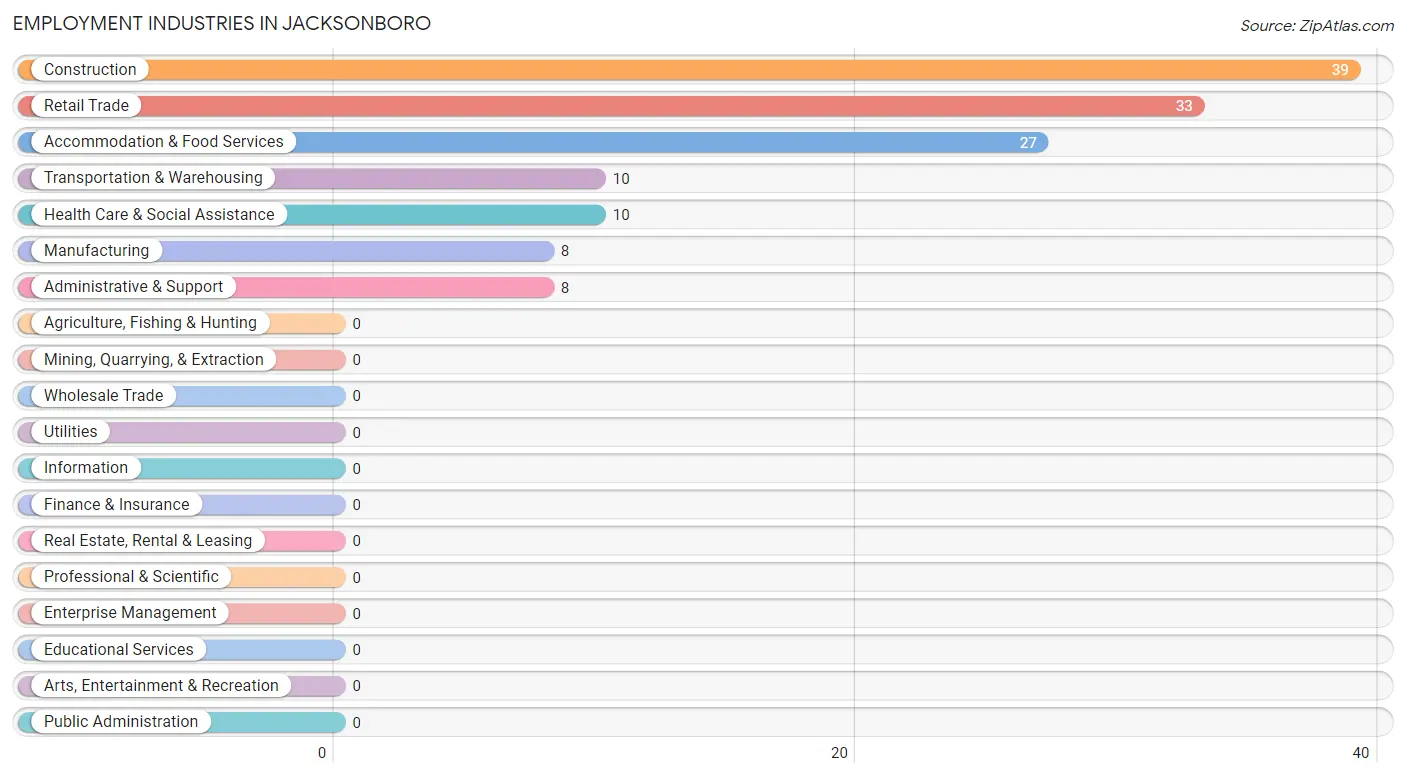
Employment Industries in Jacksonboro
The major employment industries in Jacksonboro include Construction (39 | 28.9%), Retail Trade (33 | 24.4%), Accommodation & Food Services (27 | 20.0%), Transportation & Warehousing (10 | 7.4%), and Health Care & Social Assistance (10 | 7.4%).
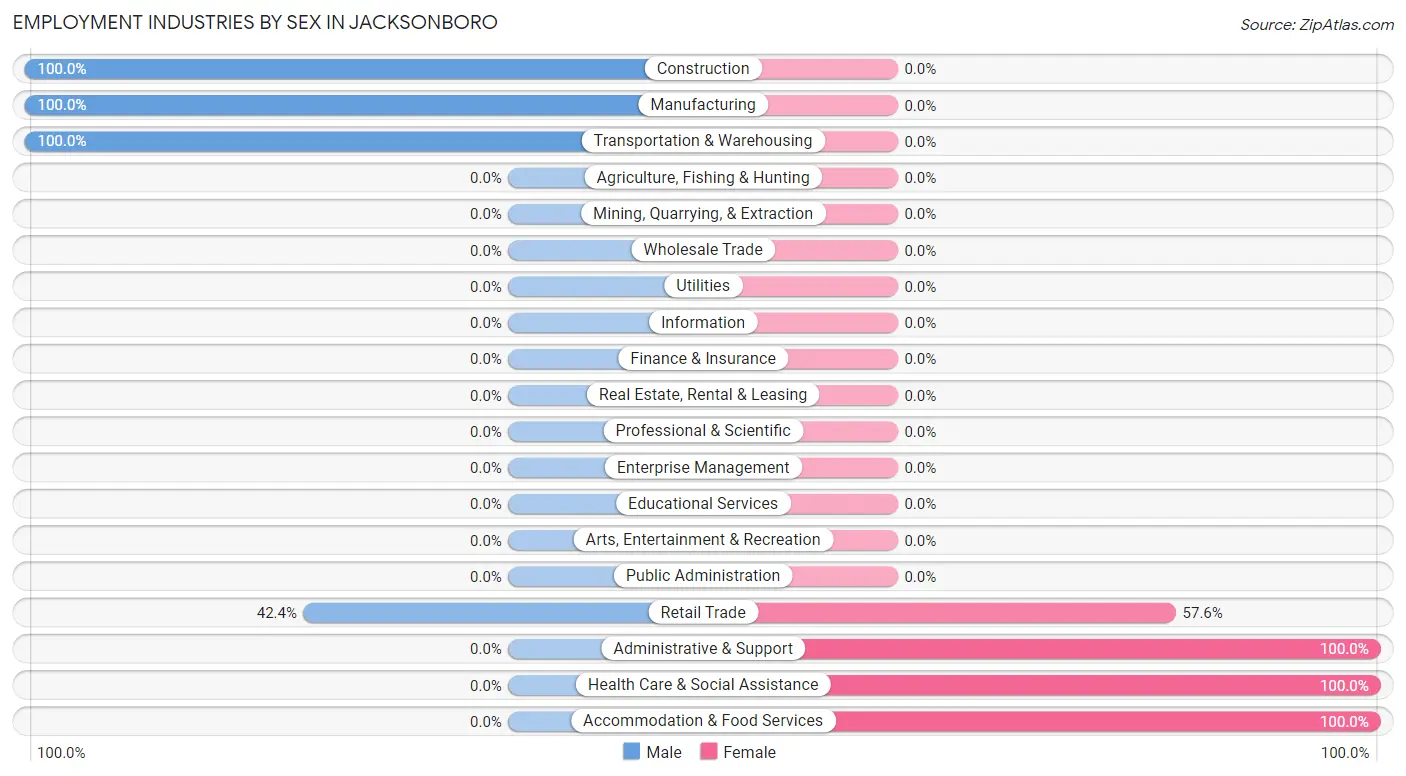
Employment Industries by Sex in Jacksonboro
The Jacksonboro industries that see more men than women are Construction (100.0%), Manufacturing (100.0%), and Transportation & Warehousing (100.0%), whereas the industries that tend to have a higher number of women are Administrative & Support (100.0%), Health Care & Social Assistance (100.0%), and Accommodation & Food Services (100.0%).
| Industry | Male | Female |
| Agriculture, Fishing & Hunting | 0 (0.0%) | 0 (0.0%) |
| Mining, Quarrying, & Extraction | 0 (0.0%) | 0 (0.0%) |
| Construction | 39 (100.0%) | 0 (0.0%) |
| Manufacturing | 8 (100.0%) | 0 (0.0%) |
| Wholesale Trade | 0 (0.0%) | 0 (0.0%) |
| Retail Trade | 14 (42.4%) | 19 (57.6%) |
| Transportation & Warehousing | 10 (100.0%) | 0 (0.0%) |
| Utilities | 0 (0.0%) | 0 (0.0%) |
| Information | 0 (0.0%) | 0 (0.0%) |
| Finance & Insurance | 0 (0.0%) | 0 (0.0%) |
| Real Estate, Rental & Leasing | 0 (0.0%) | 0 (0.0%) |
| Professional & Scientific | 0 (0.0%) | 0 (0.0%) |
| Enterprise Management | 0 (0.0%) | 0 (0.0%) |
| Administrative & Support | 0 (0.0%) | 8 (100.0%) |
| Educational Services | 0 (0.0%) | 0 (0.0%) |
| Health Care & Social Assistance | 0 (0.0%) | 10 (100.0%) |
| Arts, Entertainment & Recreation | 0 (0.0%) | 0 (0.0%) |
| Accommodation & Food Services | 0 (0.0%) | 27 (100.0%) |
| Public Administration | 0 (0.0%) | 0 (0.0%) |
| Total | 71 (52.6%) | 64 (47.4%) |
Education in Jacksonboro
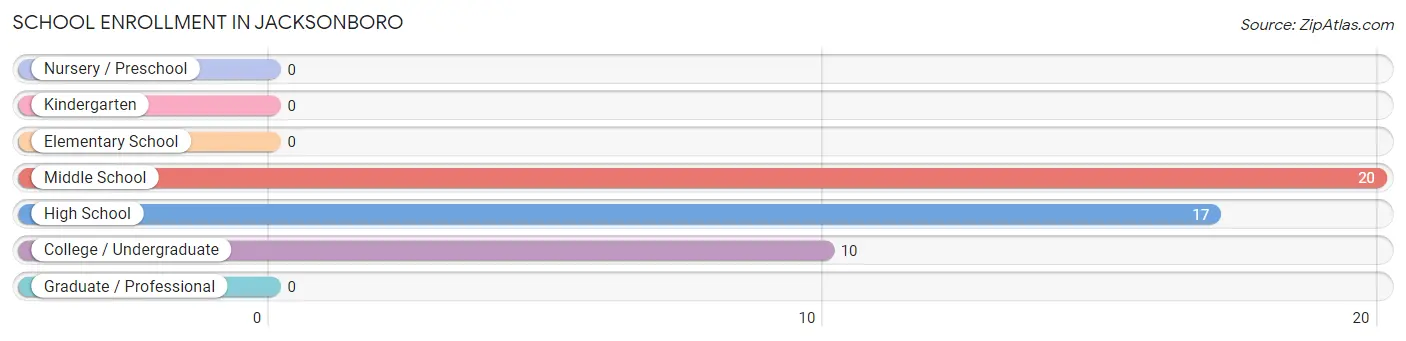
School Enrollment in Jacksonboro
The most common levels of schooling among the 47 students in Jacksonboro are middle school (20 | 42.5%), high school (17 | 36.2%), and college / undergraduate (10 | 21.3%).
| School Level | # Students | % Students |
| Nursery / Preschool | 0 | 0.0% |
| Kindergarten | 0 | 0.0% |
| Elementary School | 0 | 0.0% |
| Middle School | 20 | 42.5% |
| High School | 17 | 36.2% |
| College / Undergraduate | 10 | 21.3% |
| Graduate / Professional | 0 | 0.0% |
| Total | 47 | 100.0% |
School Enrollment by Age by Funding Source in Jacksonboro
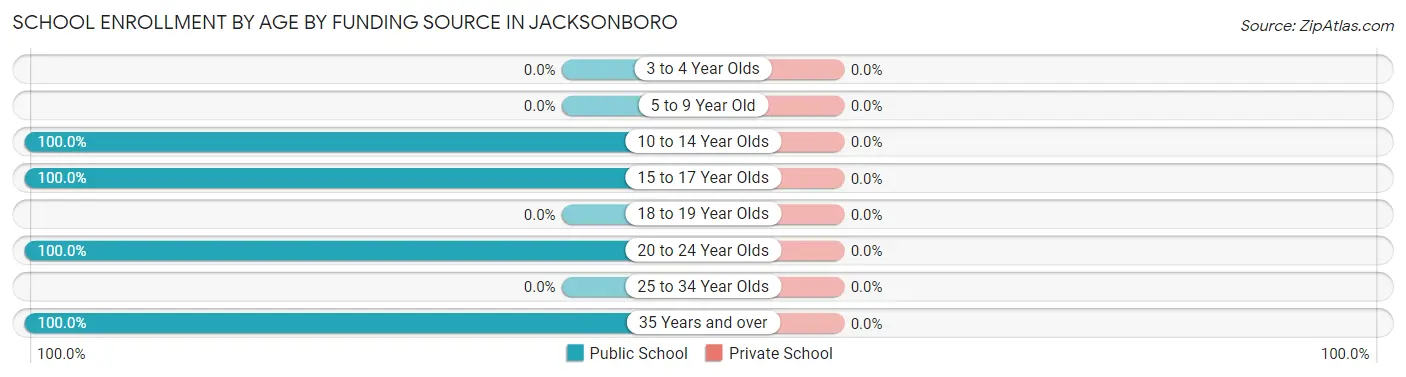
| Age Bracket | Public School | Private School |
| 3 to 4 Year Olds | 0 (0.0%) | 0 (0.0%) |
| 5 to 9 Year Old | 0 (0.0%) | 0 (0.0%) |
| 10 to 14 Year Olds | 20 (100.0%) | 0 (0.0%) |
| 15 to 17 Year Olds | 17 (100.0%) | 0 (0.0%) |
| 18 to 19 Year Olds | 0 (0.0%) | 0 (0.0%) |
| 20 to 24 Year Olds | 7 (100.0%) | 0 (0.0%) |
| 25 to 34 Year Olds | 0 (0.0%) | 0 (0.0%) |
| 35 Years and over | 3 (100.0%) | 0 (0.0%) |
| Total | 47 (100.0%) | 0 (0.0%) |
Educational Attainment by Field of Study in Jacksonboro
Education (32 | 76.2%), and business (10 | 23.8%) are the most common fields of study among 42 individuals in Jacksonboro who have obtained a bachelor's degree or higher.
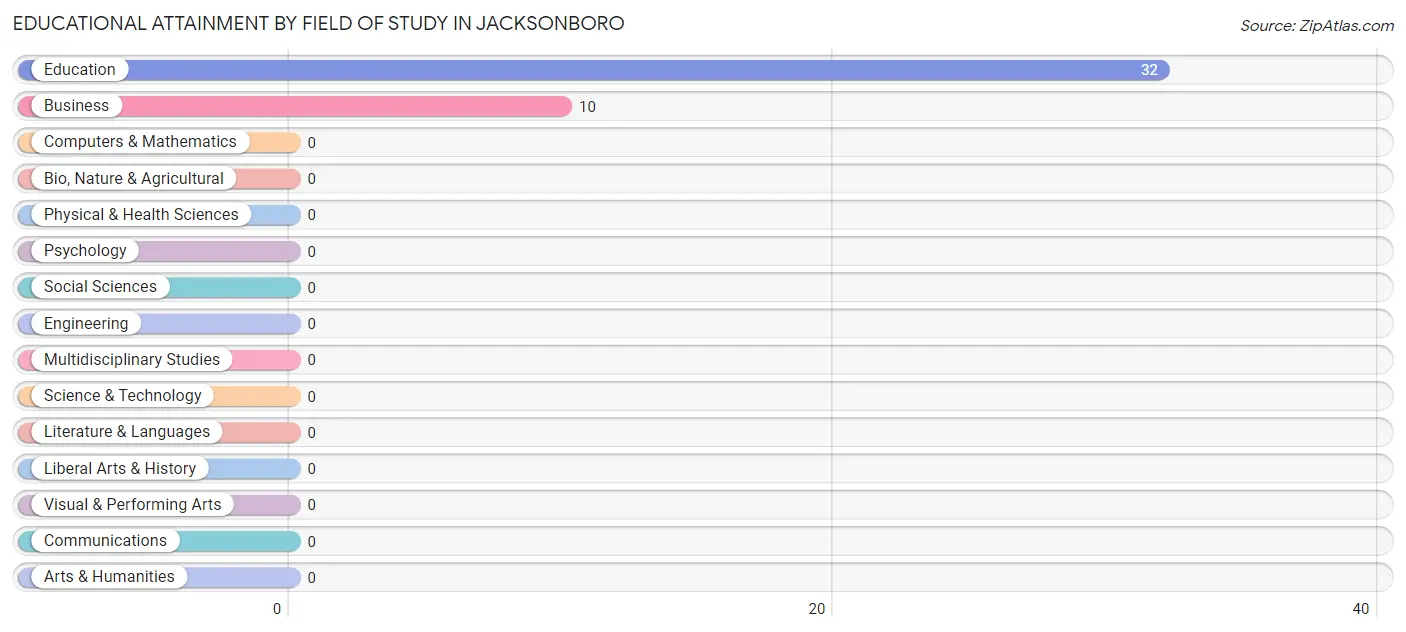
| Field of Study | # Graduates | % Graduates |
| Computers & Mathematics | 0 | 0.0% |
| Bio, Nature & Agricultural | 0 | 0.0% |
| Physical & Health Sciences | 0 | 0.0% |
| Psychology | 0 | 0.0% |
| Social Sciences | 0 | 0.0% |
| Engineering | 0 | 0.0% |
| Multidisciplinary Studies | 0 | 0.0% |
| Science & Technology | 0 | 0.0% |
| Business | 10 | 23.8% |
| Education | 32 | 76.2% |
| Literature & Languages | 0 | 0.0% |
| Liberal Arts & History | 0 | 0.0% |
| Visual & Performing Arts | 0 | 0.0% |
| Communications | 0 | 0.0% |
| Arts & Humanities | 0 | 0.0% |
| Total | 42 | 100.0% |
Transportation & Commute in Jacksonboro
Vehicle Availability by Sex in Jacksonboro
The most prevalent vehicle ownership categories in Jacksonboro are males with 1 vehicle (49, accounting for 73.1%) and females with 1 vehicle (37, making up 76.6%).
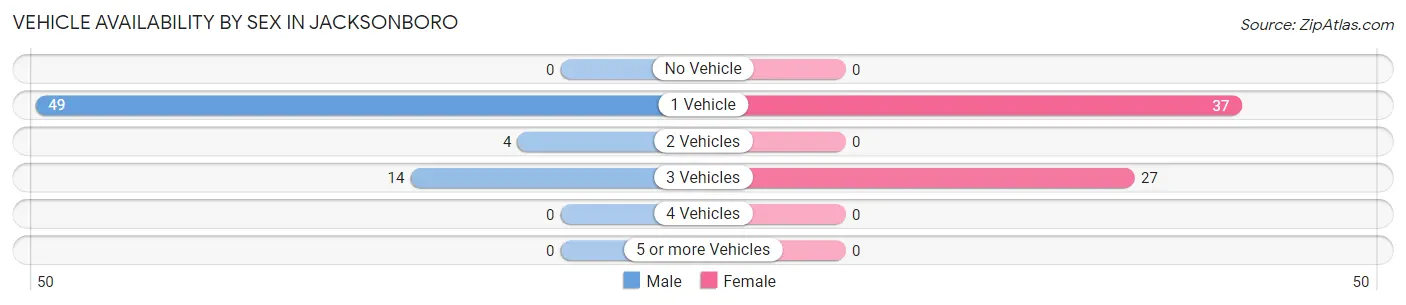
| Vehicles Available | Male | Female |
| No Vehicle | 0 (0.0%) | 0 (0.0%) |
| 1 Vehicle | 49 (73.1%) | 37 (57.8%) |
| 2 Vehicles | 4 (6.0%) | 0 (0.0%) |
| 3 Vehicles | 14 (20.9%) | 27 (42.2%) |
| 4 Vehicles | 0 (0.0%) | 0 (0.0%) |
| 5 or more Vehicles | 0 (0.0%) | 0 (0.0%) |
| Total | 67 (100.0%) | 64 (100.0%) |
Commute Time in Jacksonboro
The most frequently occuring commute durations in Jacksonboro are 45 to 59 minutes (47 commuters, 35.9%), 25 to 29 minutes (27 commuters, 20.6%), and 5 to 9 minutes (26 commuters, 19.9%).
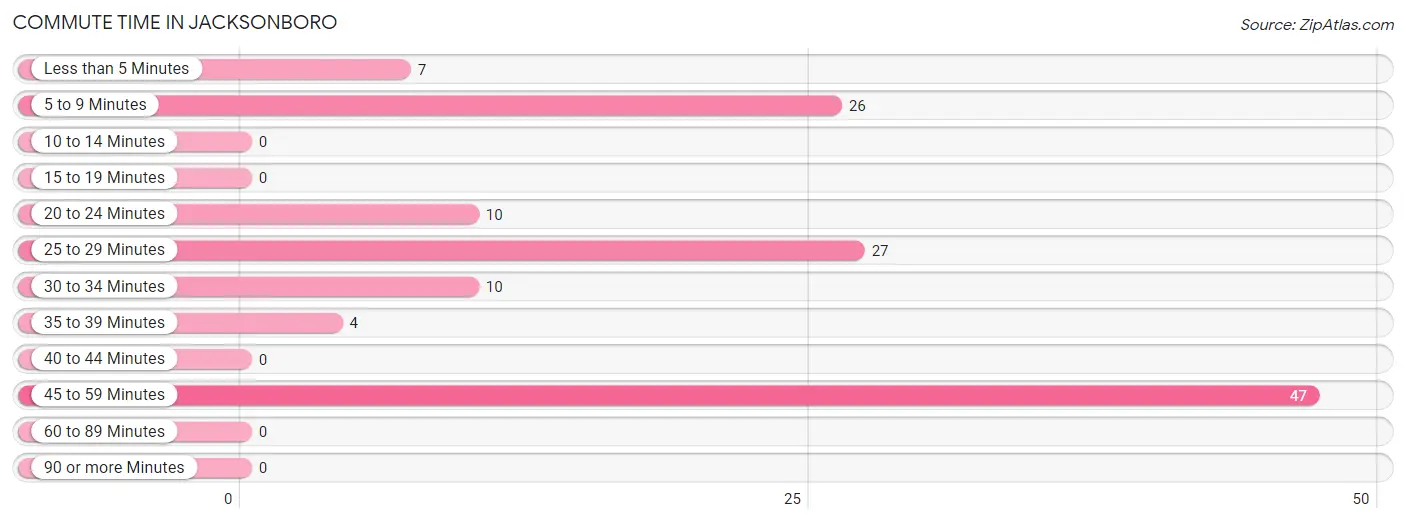
| Commute Time | # Commuters | % Commuters |
| Less than 5 Minutes | 7 | 5.3% |
| 5 to 9 Minutes | 26 | 19.9% |
| 10 to 14 Minutes | 0 | 0.0% |
| 15 to 19 Minutes | 0 | 0.0% |
| 20 to 24 Minutes | 10 | 7.6% |
| 25 to 29 Minutes | 27 | 20.6% |
| 30 to 34 Minutes | 10 | 7.6% |
| 35 to 39 Minutes | 4 | 3.0% |
| 40 to 44 Minutes | 0 | 0.0% |
| 45 to 59 Minutes | 47 | 35.9% |
| 60 to 89 Minutes | 0 | 0.0% |
| 90 or more Minutes | 0 | 0.0% |
Commute Time by Sex in Jacksonboro
The most common commute times in Jacksonboro are 45 to 59 minutes (39 commuters, 58.2%) for males and 25 to 29 minutes (27 commuters, 42.2%) for females.
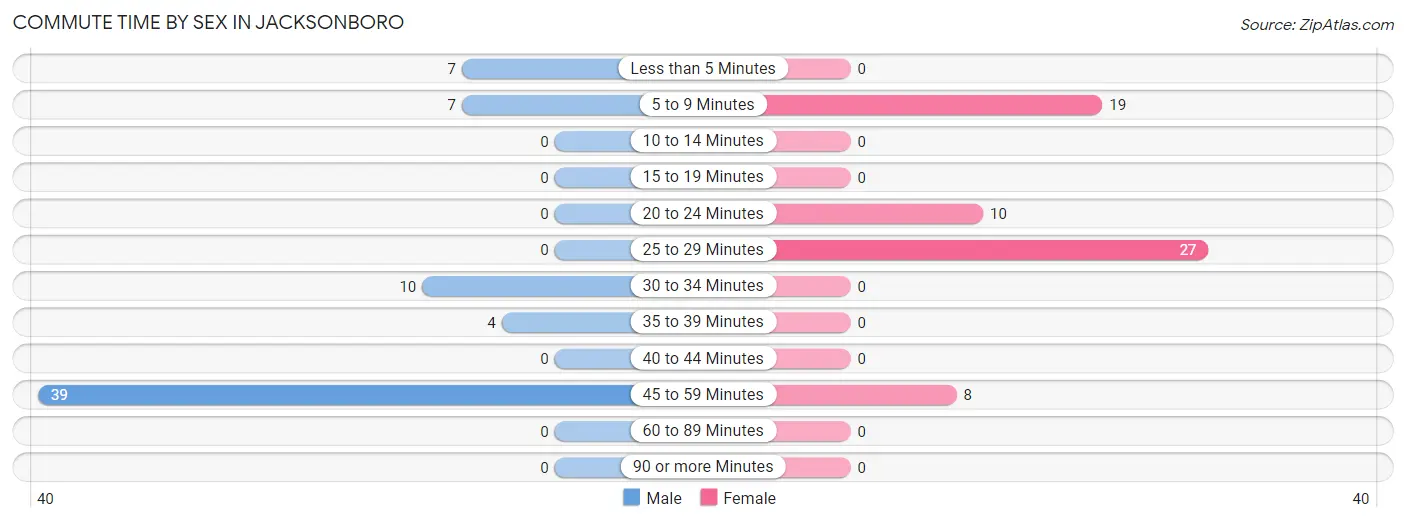
| Commute Time | Male | Female |
| Less than 5 Minutes | 7 (10.4%) | 0 (0.0%) |
| 5 to 9 Minutes | 7 (10.4%) | 19 (29.7%) |
| 10 to 14 Minutes | 0 (0.0%) | 0 (0.0%) |
| 15 to 19 Minutes | 0 (0.0%) | 0 (0.0%) |
| 20 to 24 Minutes | 0 (0.0%) | 10 (15.6%) |
| 25 to 29 Minutes | 0 (0.0%) | 27 (42.2%) |
| 30 to 34 Minutes | 10 (14.9%) | 0 (0.0%) |
| 35 to 39 Minutes | 4 (6.0%) | 0 (0.0%) |
| 40 to 44 Minutes | 0 (0.0%) | 0 (0.0%) |
| 45 to 59 Minutes | 39 (58.2%) | 8 (12.5%) |
| 60 to 89 Minutes | 0 (0.0%) | 0 (0.0%) |
| 90 or more Minutes | 0 (0.0%) | 0 (0.0%) |
Time of Departure to Work by Sex in Jacksonboro
The most frequent times of departure to work in Jacksonboro are 8:00 AM to 8:29 AM (35, 52.2%) for males and 7:00 AM to 7:29 AM (37, 57.8%) for females.
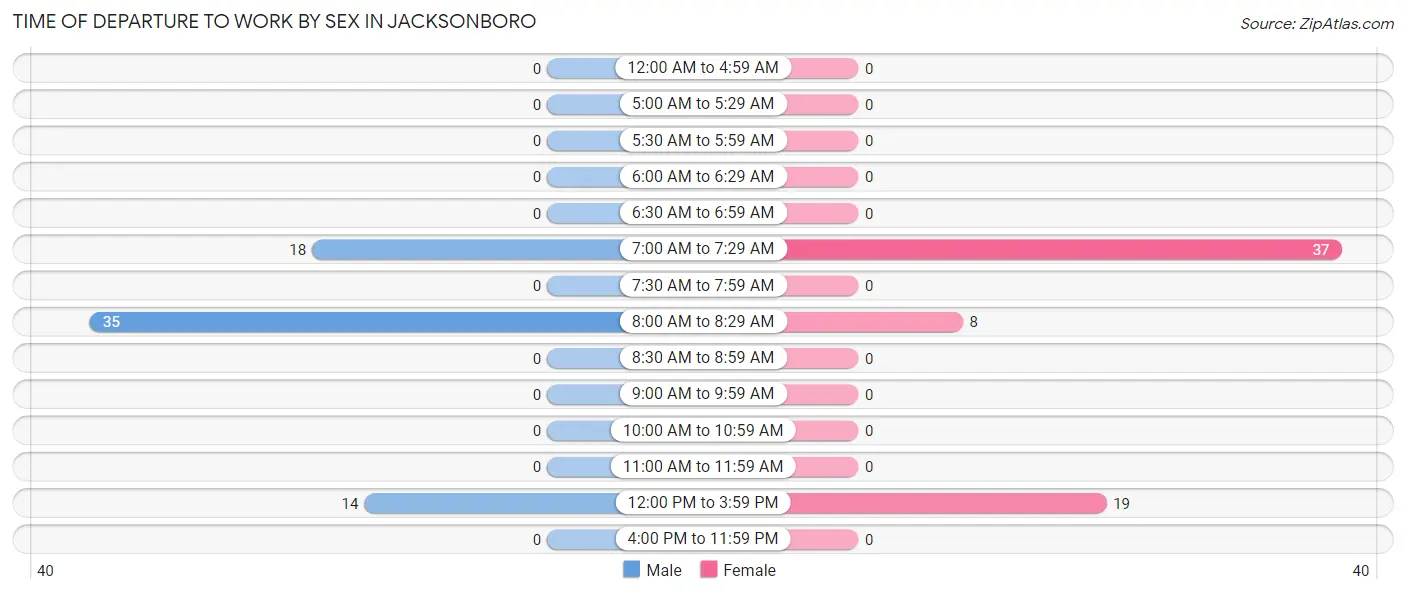
| Time of Departure | Male | Female |
| 12:00 AM to 4:59 AM | 0 (0.0%) | 0 (0.0%) |
| 5:00 AM to 5:29 AM | 0 (0.0%) | 0 (0.0%) |
| 5:30 AM to 5:59 AM | 0 (0.0%) | 0 (0.0%) |
| 6:00 AM to 6:29 AM | 0 (0.0%) | 0 (0.0%) |
| 6:30 AM to 6:59 AM | 0 (0.0%) | 0 (0.0%) |
| 7:00 AM to 7:29 AM | 18 (26.9%) | 37 (57.8%) |
| 7:30 AM to 7:59 AM | 0 (0.0%) | 0 (0.0%) |
| 8:00 AM to 8:29 AM | 35 (52.2%) | 8 (12.5%) |
| 8:30 AM to 8:59 AM | 0 (0.0%) | 0 (0.0%) |
| 9:00 AM to 9:59 AM | 0 (0.0%) | 0 (0.0%) |
| 10:00 AM to 10:59 AM | 0 (0.0%) | 0 (0.0%) |
| 11:00 AM to 11:59 AM | 0 (0.0%) | 0 (0.0%) |
| 12:00 PM to 3:59 PM | 14 (20.9%) | 19 (29.7%) |
| 4:00 PM to 11:59 PM | 0 (0.0%) | 0 (0.0%) |
| Total | 67 (100.0%) | 64 (100.0%) |
Housing Occupancy in Jacksonboro
Occupancy by Ownership in Jacksonboro
Of the total 131 dwellings in Jacksonboro, owner-occupied units account for 89 (67.9%), while renter-occupied units make up 42 (32.1%).
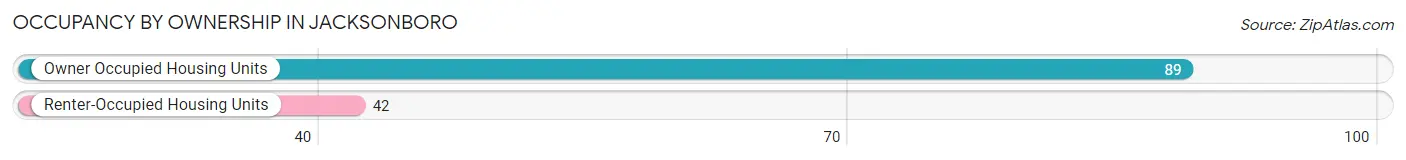
| Occupancy | # Housing Units | % Housing Units |
| Owner Occupied Housing Units | 89 | 67.9% |
| Renter-Occupied Housing Units | 42 | 32.1% |
| Total Occupied Housing Units | 131 | 100.0% |
Occupancy by Household Size in Jacksonboro
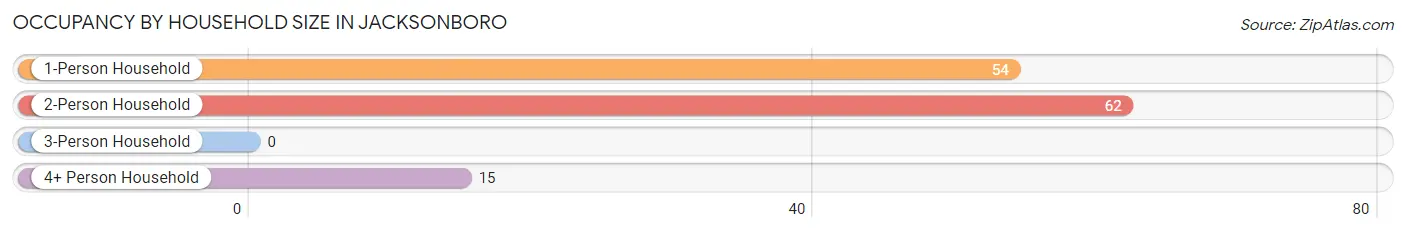
| Household Size | # Housing Units | % Housing Units |
| 1-Person Household | 54 | 41.2% |
| 2-Person Household | 62 | 47.3% |
| 3-Person Household | 0 | 0.0% |
| 4+ Person Household | 15 | 11.5% |
| Total Housing Units | 131 | 100.0% |
Occupancy by Ownership by Household Size in Jacksonboro
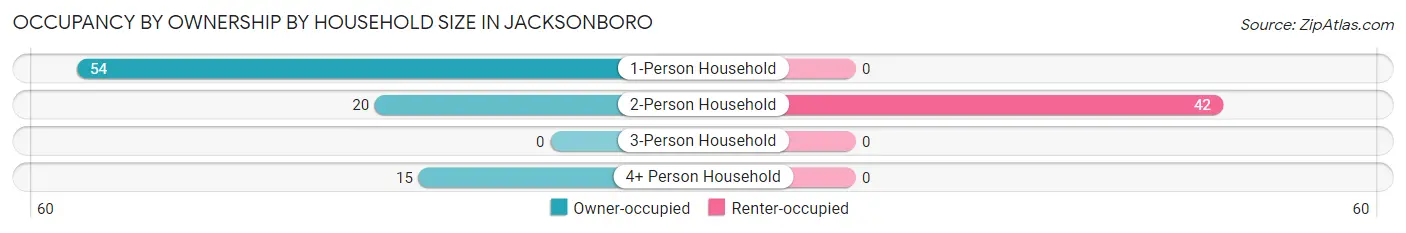
| Household Size | Owner-occupied | Renter-occupied |
| 1-Person Household | 54 (100.0%) | 0 (0.0%) |
| 2-Person Household | 20 (32.3%) | 42 (67.7%) |
| 3-Person Household | 0 (0.0%) | 0 (0.0%) |
| 4+ Person Household | 15 (100.0%) | 0 (0.0%) |
| Total Housing Units | 89 (67.9%) | 42 (32.1%) |
Occupancy by Educational Attainment in Jacksonboro
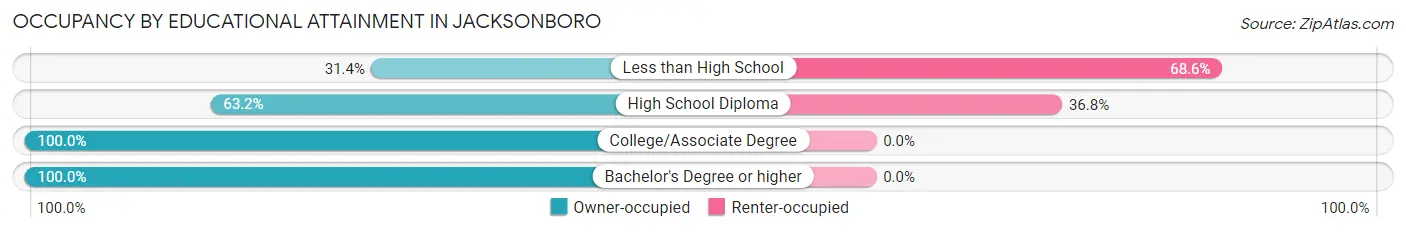
| Household Size | Owner-occupied | Renter-occupied |
| Less than High School | 16 (31.4%) | 35 (68.6%) |
| High School Diploma | 12 (63.2%) | 7 (36.8%) |
| College/Associate Degree | 19 (100.0%) | 0 (0.0%) |
| Bachelor's Degree or higher | 42 (100.0%) | 0 (0.0%) |
Occupancy by Age of Householder in Jacksonboro
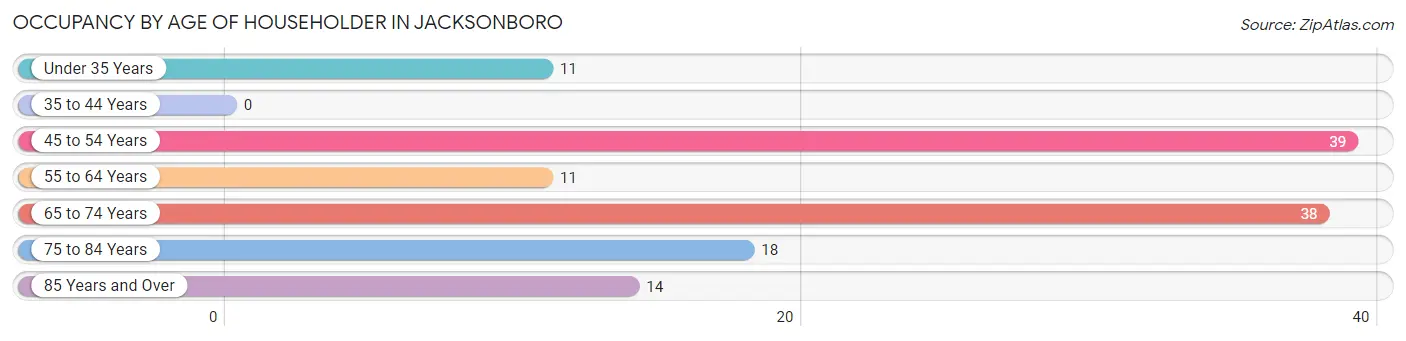
| Age Bracket | # Households | % Households |
| Under 35 Years | 11 | 8.4% |
| 35 to 44 Years | 0 | 0.0% |
| 45 to 54 Years | 39 | 29.8% |
| 55 to 64 Years | 11 | 8.4% |
| 65 to 74 Years | 38 | 29.0% |
| 75 to 84 Years | 18 | 13.7% |
| 85 Years and Over | 14 | 10.7% |
| Total | 131 | 100.0% |
Housing Finances in Jacksonboro
Median Income by Occupancy in Jacksonboro
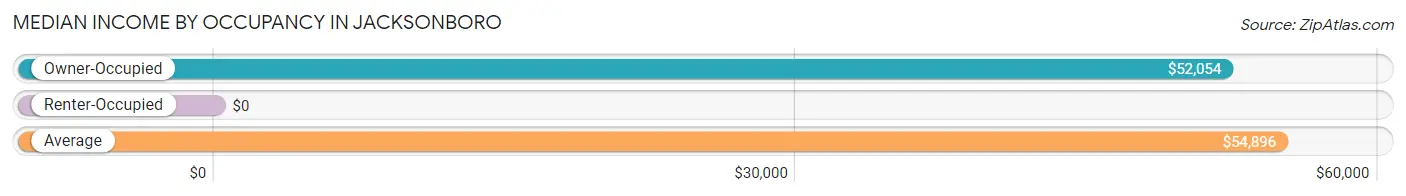
| Occupancy Type | # Households | Median Income |
| Owner-Occupied | 89 (67.9%) | $52,054 |
| Renter-Occupied | 42 (32.1%) | $0 |
| Average | 131 (100.0%) | $54,896 |
Occupancy by Householder Income Bracket in Jacksonboro
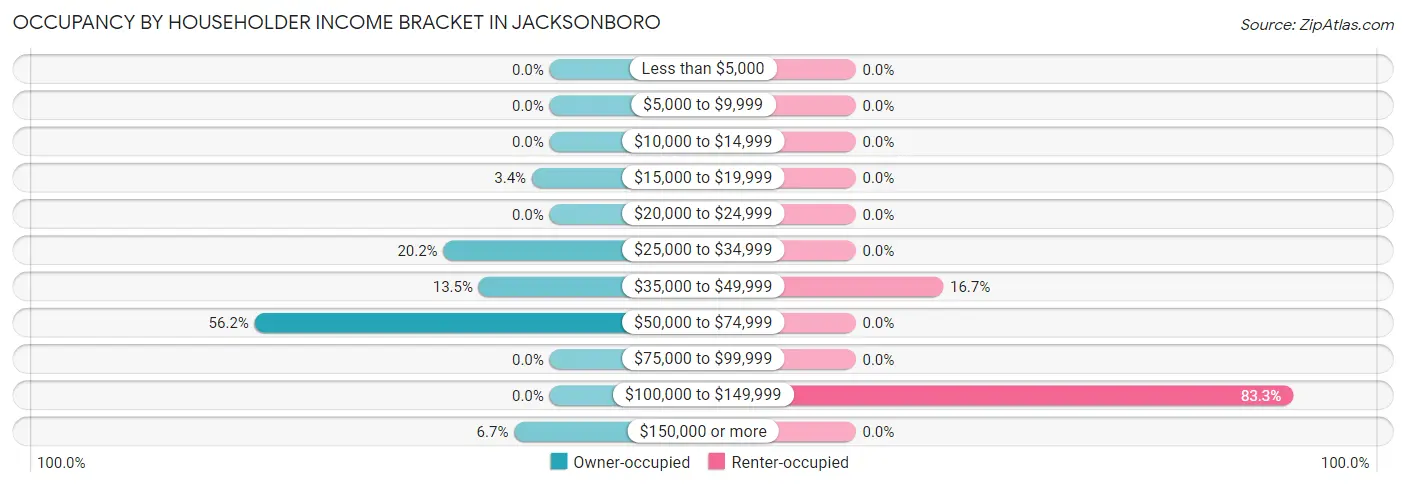
| Income Bracket | Owner-occupied | Renter-occupied |
| Less than $5,000 | 0 (0.0%) | 0 (0.0%) |
| $5,000 to $9,999 | 0 (0.0%) | 0 (0.0%) |
| $10,000 to $14,999 | 0 (0.0%) | 0 (0.0%) |
| $15,000 to $19,999 | 3 (3.4%) | 0 (0.0%) |
| $20,000 to $24,999 | 0 (0.0%) | 0 (0.0%) |
| $25,000 to $34,999 | 18 (20.2%) | 0 (0.0%) |
| $35,000 to $49,999 | 12 (13.5%) | 7 (16.7%) |
| $50,000 to $74,999 | 50 (56.2%) | 0 (0.0%) |
| $75,000 to $99,999 | 0 (0.0%) | 0 (0.0%) |
| $100,000 to $149,999 | 0 (0.0%) | 35 (83.3%) |
| $150,000 or more | 6 (6.7%) | 0 (0.0%) |
| Total | 89 (100.0%) | 42 (100.0%) |
Monthly Housing Cost Tiers in Jacksonboro
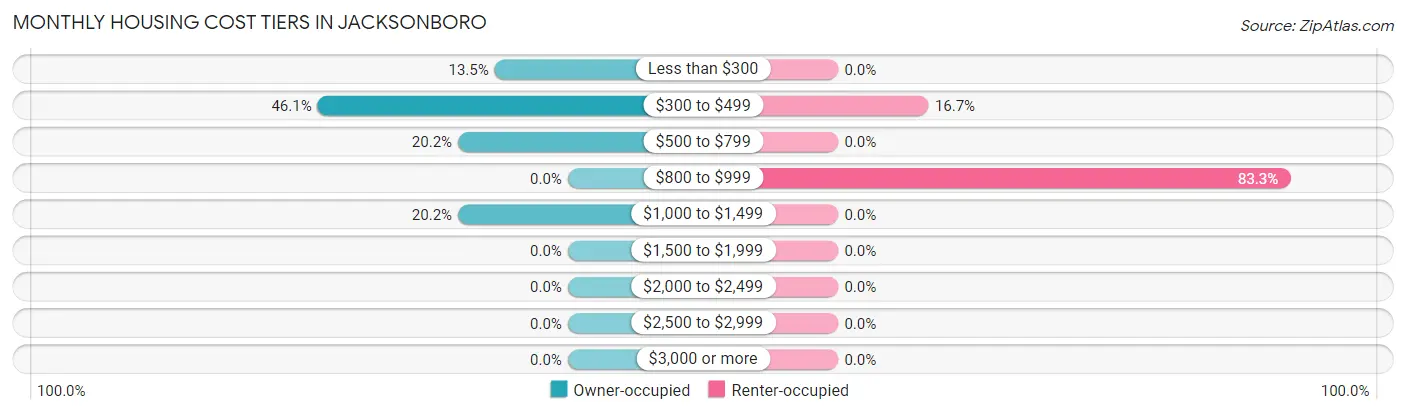
| Monthly Cost | Owner-occupied | Renter-occupied |
| Less than $300 | 12 (13.5%) | 0 (0.0%) |
| $300 to $499 | 41 (46.1%) | 7 (16.7%) |
| $500 to $799 | 18 (20.2%) | 0 (0.0%) |
| $800 to $999 | 0 (0.0%) | 35 (83.3%) |
| $1,000 to $1,499 | 18 (20.2%) | 0 (0.0%) |
| $1,500 to $1,999 | 0 (0.0%) | 0 (0.0%) |
| $2,000 to $2,499 | 0 (0.0%) | 0 (0.0%) |
| $2,500 to $2,999 | 0 (0.0%) | 0 (0.0%) |
| $3,000 or more | 0 (0.0%) | 0 (0.0%) |
| Total | 89 (100.0%) | 42 (100.0%) |
Physical Housing Characteristics in Jacksonboro
Housing Structures in Jacksonboro
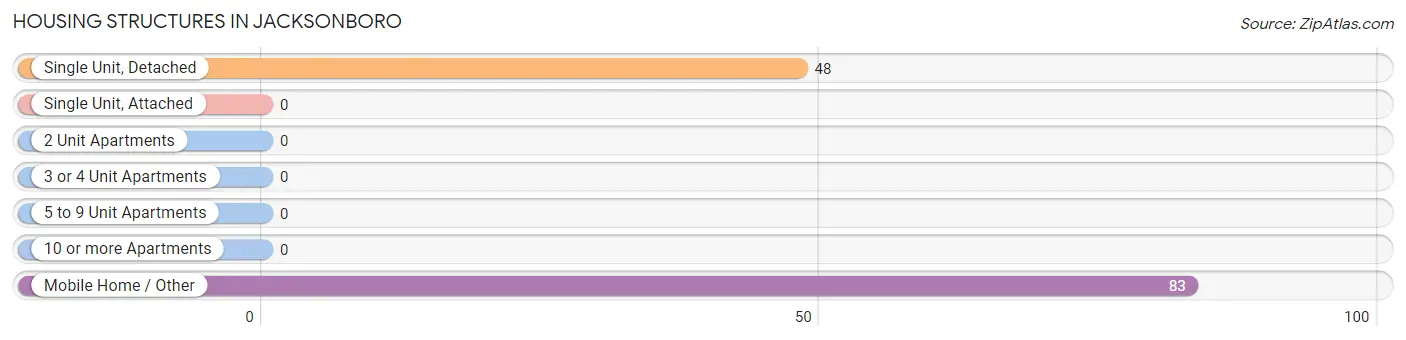
| Structure Type | # Housing Units | % Housing Units |
| Single Unit, Detached | 48 | 36.6% |
| Single Unit, Attached | 0 | 0.0% |
| 2 Unit Apartments | 0 | 0.0% |
| 3 or 4 Unit Apartments | 0 | 0.0% |
| 5 to 9 Unit Apartments | 0 | 0.0% |
| 10 or more Apartments | 0 | 0.0% |
| Mobile Home / Other | 83 | 63.4% |
| Total | 131 | 100.0% |
Housing Structures by Occupancy in Jacksonboro
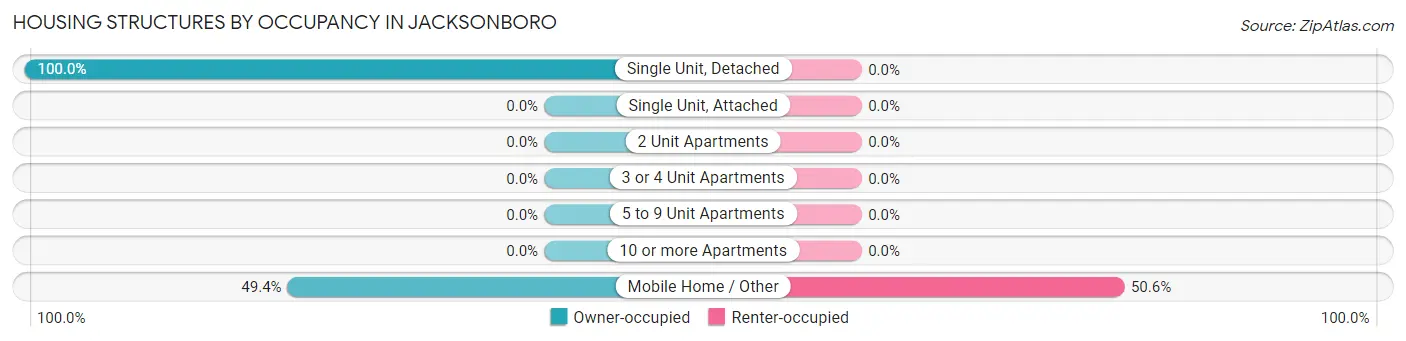
| Structure Type | Owner-occupied | Renter-occupied |
| Single Unit, Detached | 48 (100.0%) | 0 (0.0%) |
| Single Unit, Attached | 0 (0.0%) | 0 (0.0%) |
| 2 Unit Apartments | 0 (0.0%) | 0 (0.0%) |
| 3 or 4 Unit Apartments | 0 (0.0%) | 0 (0.0%) |
| 5 to 9 Unit Apartments | 0 (0.0%) | 0 (0.0%) |
| 10 or more Apartments | 0 (0.0%) | 0 (0.0%) |
| Mobile Home / Other | 41 (49.4%) | 42 (50.6%) |
| Total | 89 (67.9%) | 42 (32.1%) |
Housing Structures by Number of Rooms in Jacksonboro
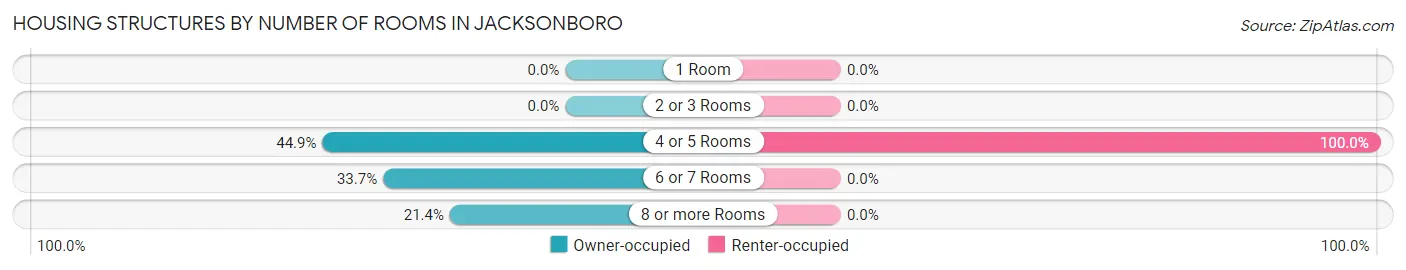
| Number of Rooms | Owner-occupied | Renter-occupied |
| 1 Room | 0 (0.0%) | 0 (0.0%) |
| 2 or 3 Rooms | 0 (0.0%) | 0 (0.0%) |
| 4 or 5 Rooms | 40 (44.9%) | 42 (100.0%) |
| 6 or 7 Rooms | 30 (33.7%) | 0 (0.0%) |
| 8 or more Rooms | 19 (21.3%) | 0 (0.0%) |
| Total | 89 (100.0%) | 42 (100.0%) |
Housing Structure by Heating Type in Jacksonboro
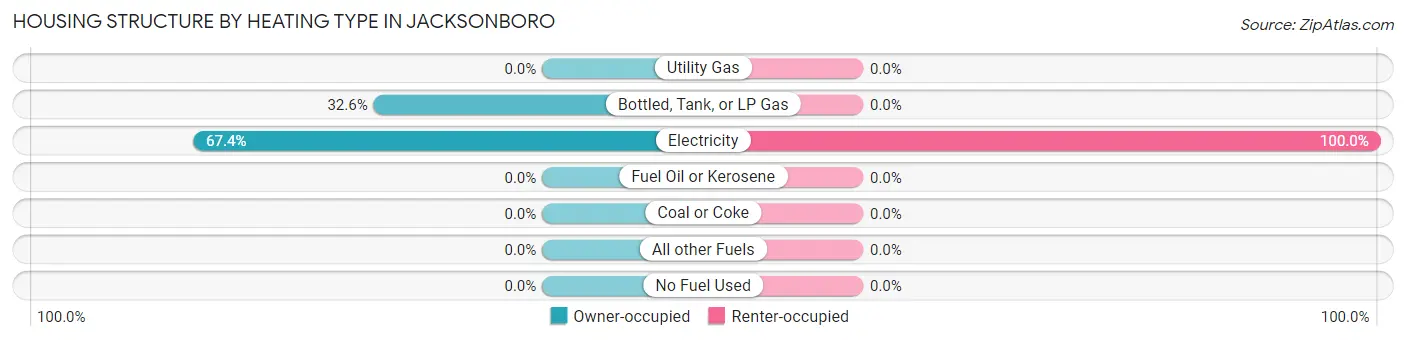
| Heating Type | Owner-occupied | Renter-occupied |
| Utility Gas | 0 (0.0%) | 0 (0.0%) |
| Bottled, Tank, or LP Gas | 29 (32.6%) | 0 (0.0%) |
| Electricity | 60 (67.4%) | 42 (100.0%) |
| Fuel Oil or Kerosene | 0 (0.0%) | 0 (0.0%) |
| Coal or Coke | 0 (0.0%) | 0 (0.0%) |
| All other Fuels | 0 (0.0%) | 0 (0.0%) |
| No Fuel Used | 0 (0.0%) | 0 (0.0%) |
| Total | 89 (100.0%) | 42 (100.0%) |
Household Vehicle Usage in Jacksonboro
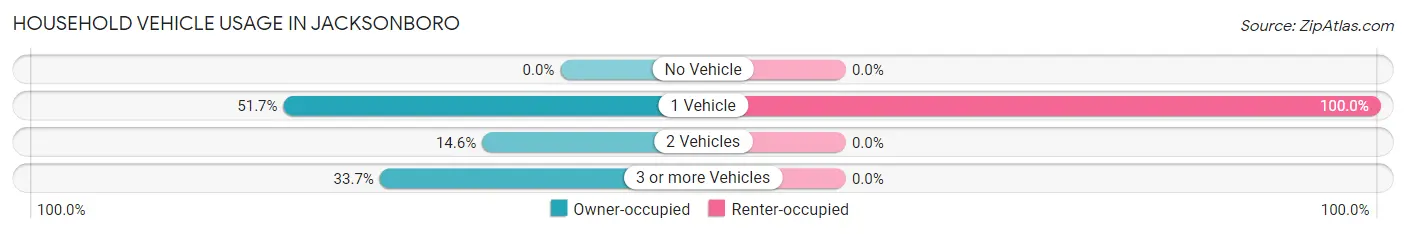
| Vehicles per Household | Owner-occupied | Renter-occupied |
| No Vehicle | 0 (0.0%) | 0 (0.0%) |
| 1 Vehicle | 46 (51.7%) | 42 (100.0%) |
| 2 Vehicles | 13 (14.6%) | 0 (0.0%) |
| 3 or more Vehicles | 30 (33.7%) | 0 (0.0%) |
| Total | 89 (100.0%) | 42 (100.0%) |
Real Estate & Mortgages in Jacksonboro
Real Estate and Mortgage Overview in Jacksonboro
| Characteristic | Without Mortgage | With Mortgage |
| Housing Units | 81 | 8 |
| Median Property Value | $90,500 | $0 |
| Median Household Income | $51,339 | $0 |
| Monthly Housing Costs | $345 | $0 |
| Real Estate Taxes | $615 | $0 |
Property Value by Mortgage Status in Jacksonboro
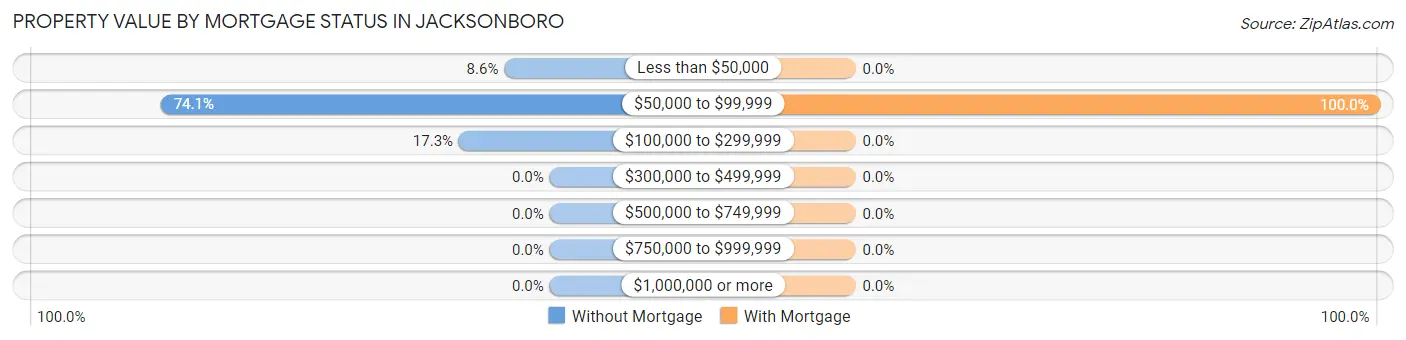
| Property Value | Without Mortgage | With Mortgage |
| Less than $50,000 | 7 (8.6%) | 0 (0.0%) |
| $50,000 to $99,999 | 60 (74.1%) | 8 (100.0%) |
| $100,000 to $299,999 | 14 (17.3%) | 0 (0.0%) |
| $300,000 to $499,999 | 0 (0.0%) | 0 (0.0%) |
| $500,000 to $749,999 | 0 (0.0%) | 0 (0.0%) |
| $750,000 to $999,999 | 0 (0.0%) | 0 (0.0%) |
| $1,000,000 or more | 0 (0.0%) | 0 (0.0%) |
| Total | 81 (100.0%) | 8 (100.0%) |
Household Income by Mortgage Status in Jacksonboro
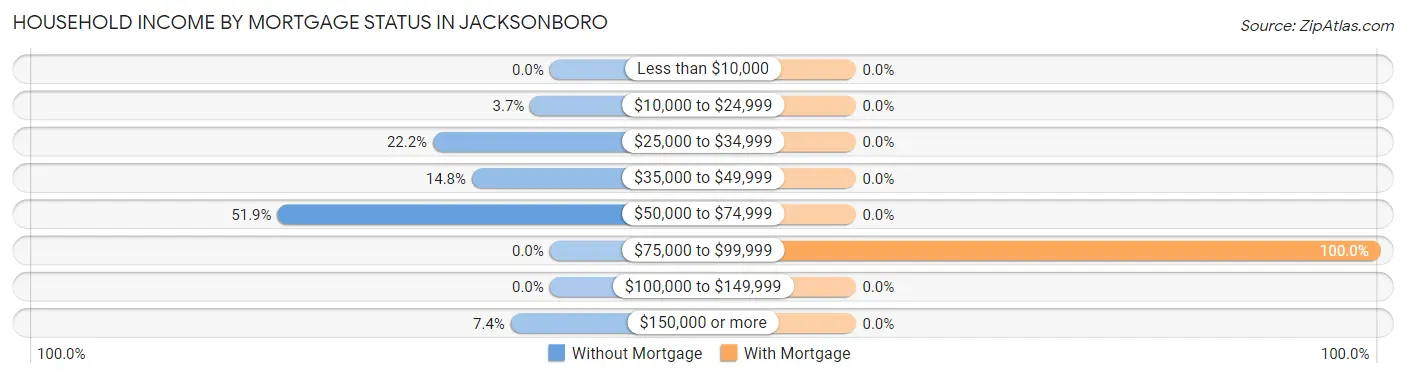
| Household Income | Without Mortgage | With Mortgage |
| Less than $10,000 | 0 (0.0%) | 0 (0.0%) |
| $10,000 to $24,999 | 3 (3.7%) | 0 (0.0%) |
| $25,000 to $34,999 | 18 (22.2%) | 0 (0.0%) |
| $35,000 to $49,999 | 12 (14.8%) | 0 (0.0%) |
| $50,000 to $74,999 | 42 (51.8%) | 0 (0.0%) |
| $75,000 to $99,999 | 0 (0.0%) | 8 (100.0%) |
| $100,000 to $149,999 | 0 (0.0%) | 0 (0.0%) |
| $150,000 or more | 6 (7.4%) | 0 (0.0%) |
| Total | 81 (100.0%) | 8 (100.0%) |
Property Value to Household Income Ratio in Jacksonboro
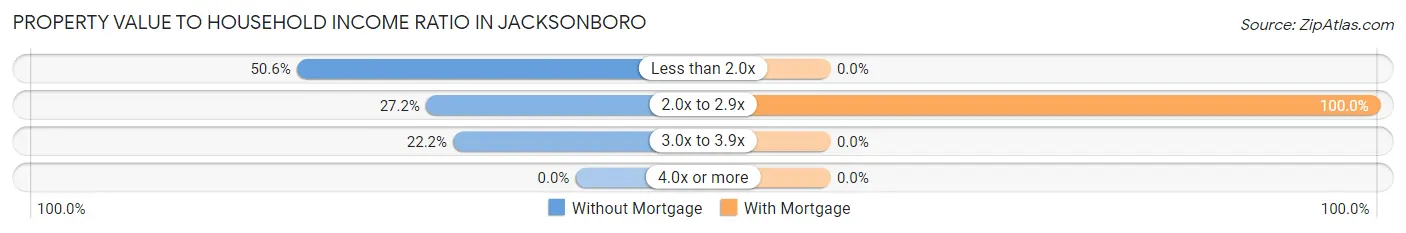
| Value-to-Income Ratio | Without Mortgage | With Mortgage |
| Less than 2.0x | 41 (50.6%) | 0 (0.0%) |
| 2.0x to 2.9x | 22 (27.2%) | 8 (100.0%) |
| 3.0x to 3.9x | 18 (22.2%) | 0 (0.0%) |
| 4.0x or more | 0 (0.0%) | 0 (0.0%) |
| Total | 81 (100.0%) | 8 (100.0%) |
Real Estate Taxes by Mortgage Status in Jacksonboro
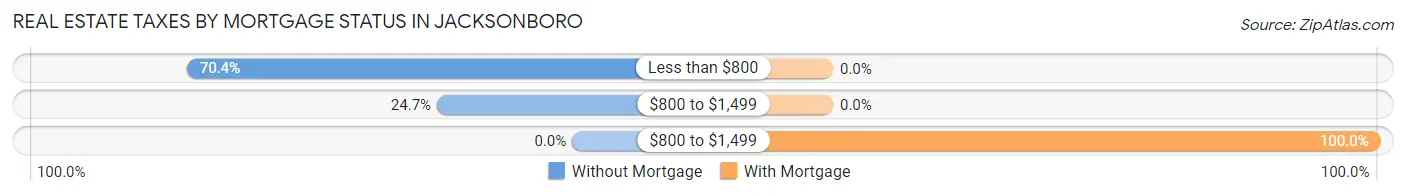
| Property Taxes | Without Mortgage | With Mortgage |
| Less than $800 | 57 (70.4%) | 0 (0.0%) |
| $800 to $1,499 | 20 (24.7%) | 0 (0.0%) |
| $800 to $1,499 | 0 (0.0%) | 8 (100.0%) |
| Total | 81 (100.0%) | 8 (100.0%) |
Health & Disability in Jacksonboro
Health Insurance Coverage by Age in Jacksonboro
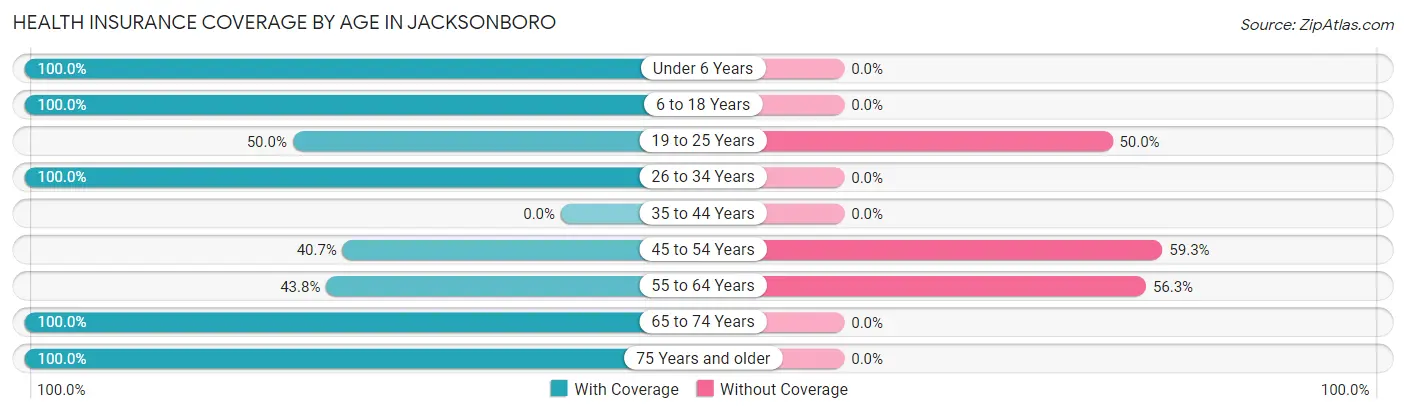
| Age Bracket | With Coverage | Without Coverage |
| Under 6 Years | 9 (100.0%) | 0 (0.0%) |
| 6 to 18 Years | 37 (100.0%) | 0 (0.0%) |
| 19 to 25 Years | 7 (50.0%) | 7 (50.0%) |
| 26 to 34 Years | 23 (100.0%) | 0 (0.0%) |
| 35 to 44 Years | 0 (0.0%) | 0 (0.0%) |
| 45 to 54 Years | 24 (40.7%) | 35 (59.3%) |
| 55 to 64 Years | 21 (43.8%) | 27 (56.2%) |
| 65 to 74 Years | 47 (100.0%) | 0 (0.0%) |
| 75 Years and older | 33 (100.0%) | 0 (0.0%) |
| Total | 201 (74.4%) | 69 (25.6%) |
Health Insurance Coverage by Citizenship Status in Jacksonboro
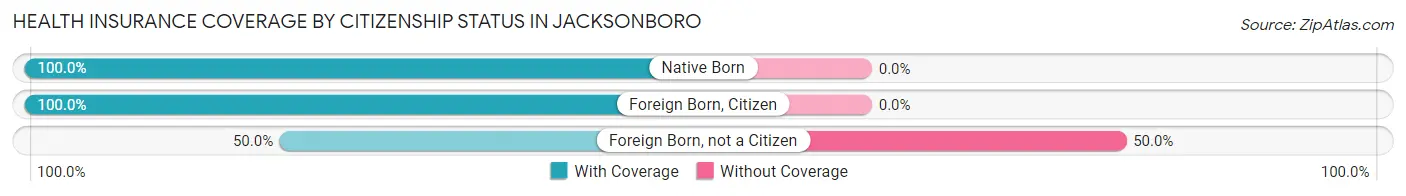
| Citizenship Status | With Coverage | Without Coverage |
| Native Born | 9 (100.0%) | 0 (0.0%) |
| Foreign Born, Citizen | 37 (100.0%) | 0 (0.0%) |
| Foreign Born, not a Citizen | 7 (50.0%) | 7 (50.0%) |
Health Insurance Coverage by Household Income in Jacksonboro
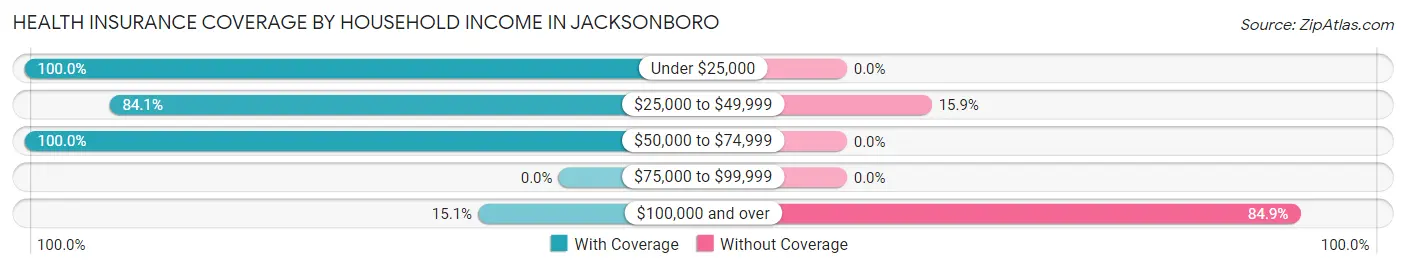
| Household Income | With Coverage | Without Coverage |
| Under $25,000 | 36 (100.0%) | 0 (0.0%) |
| $25,000 to $49,999 | 37 (84.1%) | 7 (15.9%) |
| $50,000 to $74,999 | 117 (100.0%) | 0 (0.0%) |
| $75,000 to $99,999 | 0 (0.0%) | 0 (0.0%) |
| $100,000 and over | 11 (15.1%) | 62 (84.9%) |
Public vs Private Health Insurance Coverage by Age in Jacksonboro
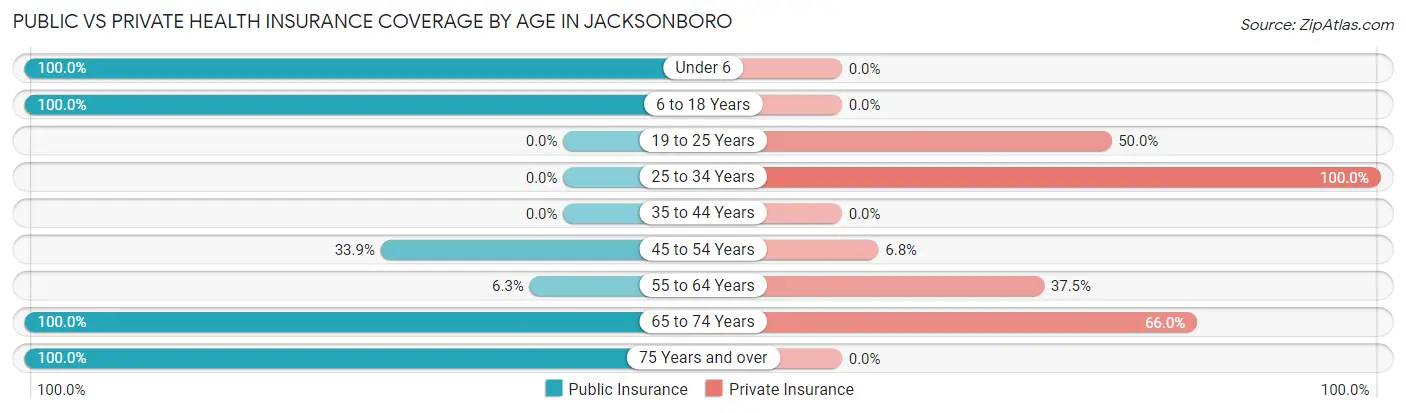
| Age Bracket | Public Insurance | Private Insurance |
| Under 6 | 9 (100.0%) | 0 (0.0%) |
| 6 to 18 Years | 37 (100.0%) | 0 (0.0%) |
| 19 to 25 Years | 0 (0.0%) | 7 (50.0%) |
| 25 to 34 Years | 0 (0.0%) | 23 (100.0%) |
| 35 to 44 Years | 0 (0.0%) | 0 (0.0%) |
| 45 to 54 Years | 20 (33.9%) | 4 (6.8%) |
| 55 to 64 Years | 3 (6.2%) | 18 (37.5%) |
| 65 to 74 Years | 47 (100.0%) | 31 (66.0%) |
| 75 Years and over | 33 (100.0%) | 0 (0.0%) |
| Total | 149 (55.2%) | 83 (30.7%) |
Disability Status by Sex by Age in Jacksonboro
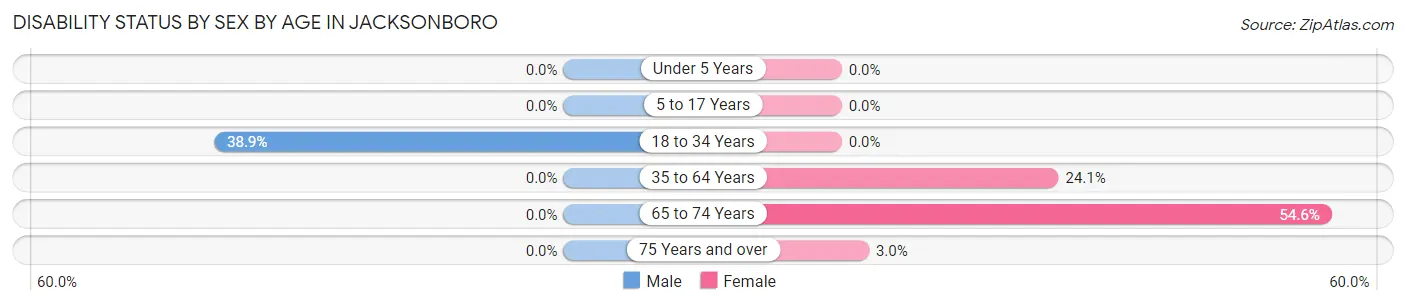
| Age Bracket | Male | Female |
| Under 5 Years | 0 (0.0%) | 0 (0.0%) |
| 5 to 17 Years | 0 (0.0%) | 0 (0.0%) |
| 18 to 34 Years | 7 (38.9%) | 0 (0.0%) |
| 35 to 64 Years | 0 (0.0%) | 14 (24.1%) |
| 65 to 74 Years | 0 (0.0%) | 12 (54.5%) |
| 75 Years and over | 0 (0.0%) | 1 (3.0%) |
Disability Class by Sex by Age in Jacksonboro
Disability Class: Hearing Difficulty
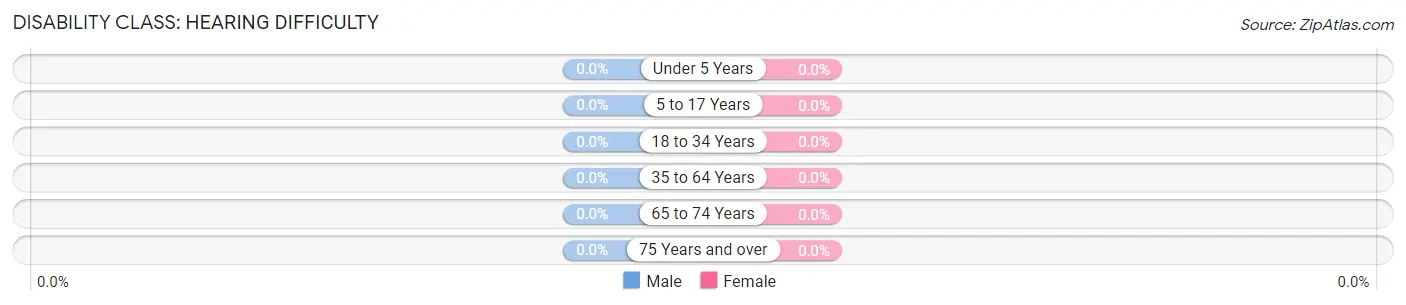
| Age Bracket | Male | Female |
| Under 5 Years | 0 (0.0%) | 0 (0.0%) |
| 5 to 17 Years | 0 (0.0%) | 0 (0.0%) |
| 18 to 34 Years | 0 (0.0%) | 0 (0.0%) |
| 35 to 64 Years | 0 (0.0%) | 0 (0.0%) |
| 65 to 74 Years | 0 (0.0%) | 0 (0.0%) |
| 75 Years and over | 0 (0.0%) | 0 (0.0%) |
Disability Class: Vision Difficulty
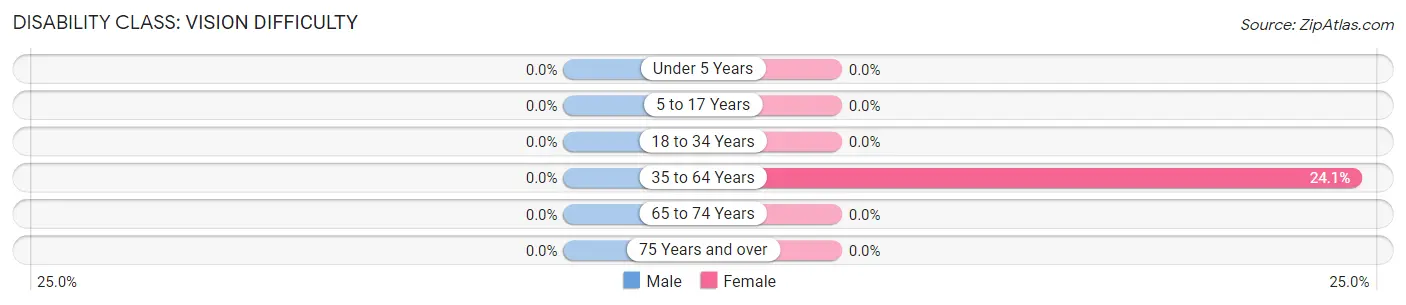
| Age Bracket | Male | Female |
| Under 5 Years | 0 (0.0%) | 0 (0.0%) |
| 5 to 17 Years | 0 (0.0%) | 0 (0.0%) |
| 18 to 34 Years | 0 (0.0%) | 0 (0.0%) |
| 35 to 64 Years | 0 (0.0%) | 14 (24.1%) |
| 65 to 74 Years | 0 (0.0%) | 0 (0.0%) |
| 75 Years and over | 0 (0.0%) | 0 (0.0%) |
Disability Class: Cognitive Difficulty
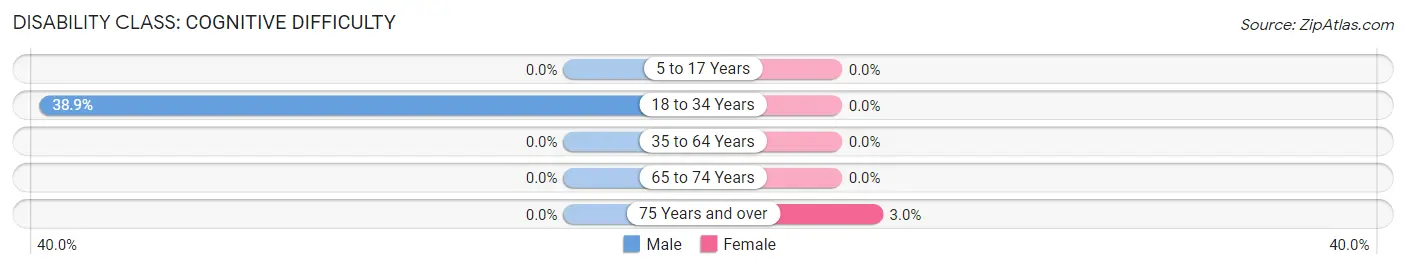
| Age Bracket | Male | Female |
| 5 to 17 Years | 0 (0.0%) | 0 (0.0%) |
| 18 to 34 Years | 7 (38.9%) | 0 (0.0%) |
| 35 to 64 Years | 0 (0.0%) | 0 (0.0%) |
| 65 to 74 Years | 0 (0.0%) | 0 (0.0%) |
| 75 Years and over | 0 (0.0%) | 1 (3.0%) |
Disability Class: Ambulatory Difficulty
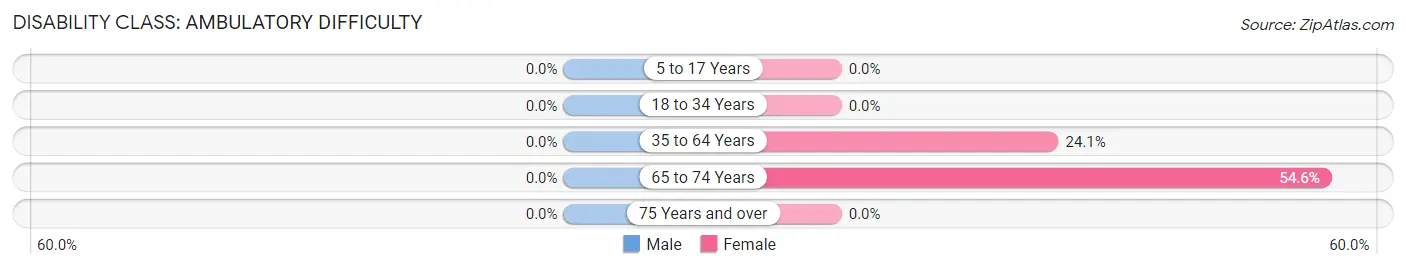
| Age Bracket | Male | Female |
| 5 to 17 Years | 0 (0.0%) | 0 (0.0%) |
| 18 to 34 Years | 0 (0.0%) | 0 (0.0%) |
| 35 to 64 Years | 0 (0.0%) | 14 (24.1%) |
| 65 to 74 Years | 0 (0.0%) | 12 (54.5%) |
| 75 Years and over | 0 (0.0%) | 0 (0.0%) |
Disability Class: Self-Care Difficulty
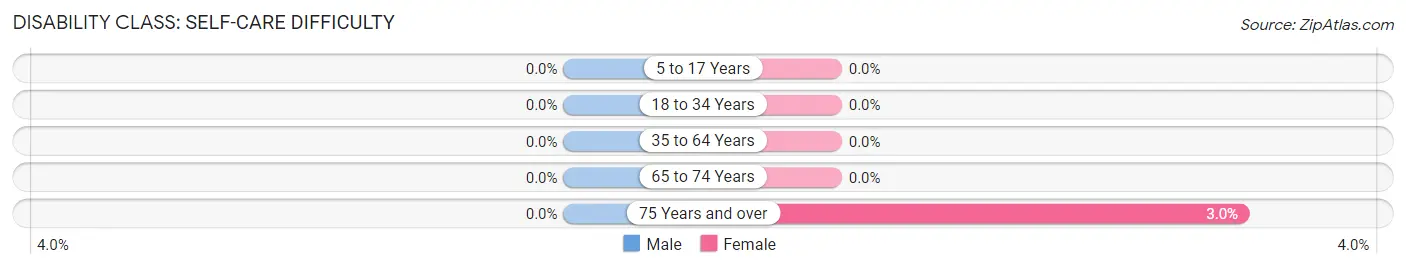
| Age Bracket | Male | Female |
| 5 to 17 Years | 0 (0.0%) | 0 (0.0%) |
| 18 to 34 Years | 0 (0.0%) | 0 (0.0%) |
| 35 to 64 Years | 0 (0.0%) | 0 (0.0%) |
| 65 to 74 Years | 0 (0.0%) | 0 (0.0%) |
| 75 Years and over | 0 (0.0%) | 1 (3.0%) |
Technology Access in Jacksonboro
Computing Device Access in Jacksonboro
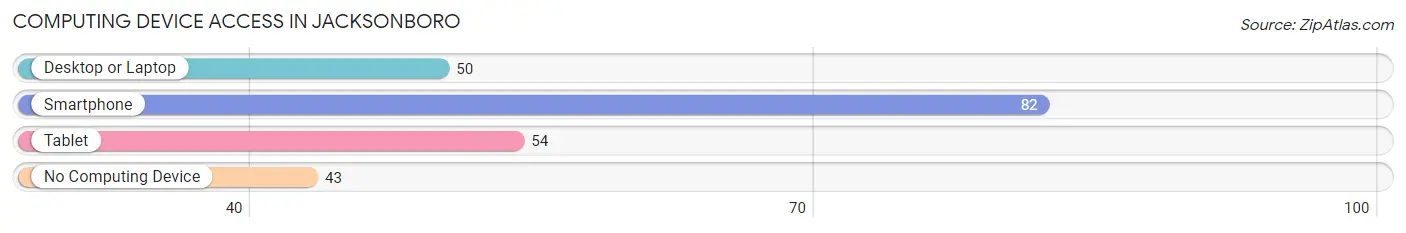
| Device Type | # Households | % Households |
| Desktop or Laptop | 50 | 38.2% |
| Smartphone | 82 | 62.6% |
| Tablet | 54 | 41.2% |
| No Computing Device | 43 | 32.8% |
| Total | 131 | 100.0% |
Internet Access in Jacksonboro
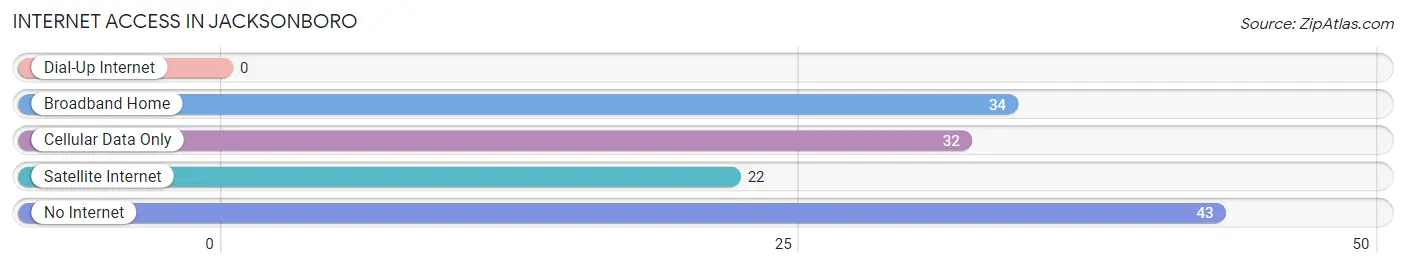
| Internet Type | # Households | % Households |
| Dial-Up Internet | 0 | 0.0% |
| Broadband Home | 34 | 26.0% |
| Cellular Data Only | 32 | 24.4% |
| Satellite Internet | 22 | 16.8% |
| No Internet | 43 | 32.8% |
| Total | 131 | 100.0% |
Jacksonboro Summary
Jacksonboro, SC is a small town located in Colleton County, South Carolina. It is situated on the banks of the Edisto River, about 25 miles west of Charleston. The town was founded in 1820 and named after Andrew Jackson, the seventh president of the United States. The population of Jacksonboro was estimated to be around 500 in 2020.
Geography
Jacksonboro is located in the Lowcountry region of South Carolina, which is characterized by its flat terrain and coastal plains. The town is situated on the banks of the Edisto River, which is a major tributary of the Savannah River. The town is surrounded by several small towns and villages, including Walterboro, Ruffin, and Canadys. The town is also close to the Francis Marion National Forest, which is a popular destination for outdoor activities such as camping, fishing, and hiking.
Economy
The economy of Jacksonboro is largely based on agriculture and forestry. The town is home to several farms, which produce a variety of crops such as corn, soybeans, cotton, and peanuts. The town is also home to several timber companies, which harvest timber from the nearby Francis Marion National Forest. In addition, the town is home to several small businesses, including restaurants, convenience stores, and gas stations.
Demographics
According to the 2010 census, the population of Jacksonboro was 498. The racial makeup of the town was 94.2% White, 3.2% African American, 0.4% Native American, 0.2% Asian, 0.2% from other races, and 1.8% from two or more races. The median household income was $31,250, and the median family income was $37,500. The per capita income was $15,945.
Conclusion
Jacksonboro, SC is a small town located in Colleton County, South Carolina. It is situated on the banks of the Edisto River, about 25 miles west of Charleston. The town was founded in 1820 and named after Andrew Jackson, the seventh president of the United States. The economy of Jacksonboro is largely based on agriculture and forestry, and the town is home to several small businesses. The population of Jacksonboro was estimated to be around 500 in 2020, and the racial makeup of the town was 94.2% White, 3.2% African American, 0.4% Native American, 0.2% Asian, 0.2% from other races, and 1.8% from two or more races. The median household income was $31,250, and the median family income was $37,500. The per capita income was $15,945.
Common Questions
What is Per Capita Income in Jacksonboro?
Per Capita income in Jacksonboro is $32,206.
What is the Median Family Income in Jacksonboro?
Median Family Income in Jacksonboro is $105,429.
What is the Median Household income in Jacksonboro?
Median Household Income in Jacksonboro is $54,896.
What is Inequality or Gini Index in Jacksonboro?
Inequality or Gini Index in Jacksonboro is 0.28.
What is the Total Population of Jacksonboro?
Total Population of Jacksonboro is 270.
What is the Total Male Population of Jacksonboro?
Total Male Population of Jacksonboro is 109.
What is the Total Female Population of Jacksonboro?
Total Female Population of Jacksonboro is 161.
What is the Ratio of Males per 100 Females in Jacksonboro?
There are 67.70 Males per 100 Females in Jacksonboro.
What is the Ratio of Females per 100 Males in Jacksonboro?
There are 147.71 Females per 100 Males in Jacksonboro.
What is the Median Population Age in Jacksonboro?
Median Population Age in Jacksonboro is 53.8 Years.
What is the Average Family Size in Jacksonboro
Average Family Size in Jacksonboro is 2.9 People.
What is the Average Household Size in Jacksonboro
Average Household Size in Jacksonboro is 2.1 People.
How Large is the Labor Force in Jacksonboro?
There are 135 People in the Labor Forcein in Jacksonboro.
What is the Percentage of People in the Labor Force in Jacksonboro?
56.0% of People are in the Labor Force in Jacksonboro.