York, SC Map & Demographics
York Map
York Overview
$26,020
PER CAPITA INCOME
$53,539
AVG FAMILY INCOME
$50,177
AVG HOUSEHOLD INCOME
8.1%
WAGE / INCOME GAP [ % ]
91.9¢/ $1
WAGE / INCOME GAP [ $ ]
0.48
INEQUALITY / GINI INDEX
8,534
TOTAL POPULATION
3,922
MALE POPULATION
4,612
FEMALE POPULATION
85.04
MALES / 100 FEMALES
117.59
FEMALES / 100 MALES
37.0
MEDIAN AGE
3.0
AVG FAMILY SIZE
2.5
AVG HOUSEHOLD SIZE
4,340
LABOR FORCE [ PEOPLE ]
66.1%
PERCENT IN LABOR FORCE
8.2%
UNEMPLOYMENT RATE
York Zip Codes
York Area Codes
Income in York
Income Overview in York
Per Capita Income in York is $26,020, while median incomes of families and households are $53,539 and $50,177 respectively.
| Characteristic | Number | Measure |
| Per Capita Income | 8,534 | $26,020 |
| Median Family Income | 2,274 | $53,539 |
| Mean Family Income | 2,274 | $76,491 |
| Median Household Income | 3,312 | $50,177 |
| Mean Household Income | 3,312 | $66,622 |
| Income Deficit | 2,274 | $0 |
| Wage / Income Gap (%) | 8,534 | 8.13% |
| Wage / Income Gap ($) | 8,534 | 91.87¢ per $1 |
| Gini / Inequality Index | 8,534 | 0.48 |
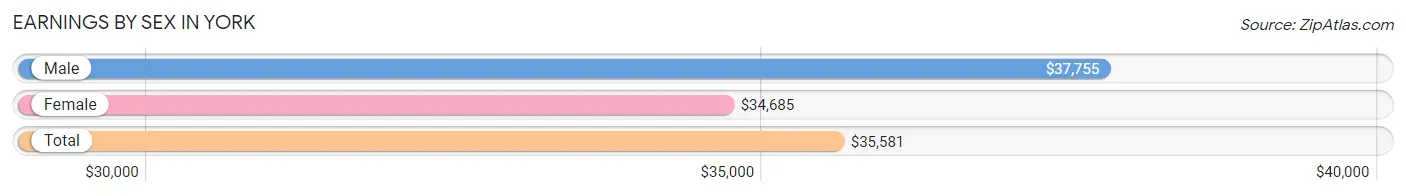
Earnings by Sex in York
Average Earnings in York are $35,581, $37,755 for men and $34,685 for women, a difference of 8.1%.
| Sex | Number | Average Earnings |
| Male | 2,140 (50.6%) | $37,755 |
| Female | 2,085 (49.3%) | $34,685 |
| Total | 4,225 (100.0%) | $35,581 |
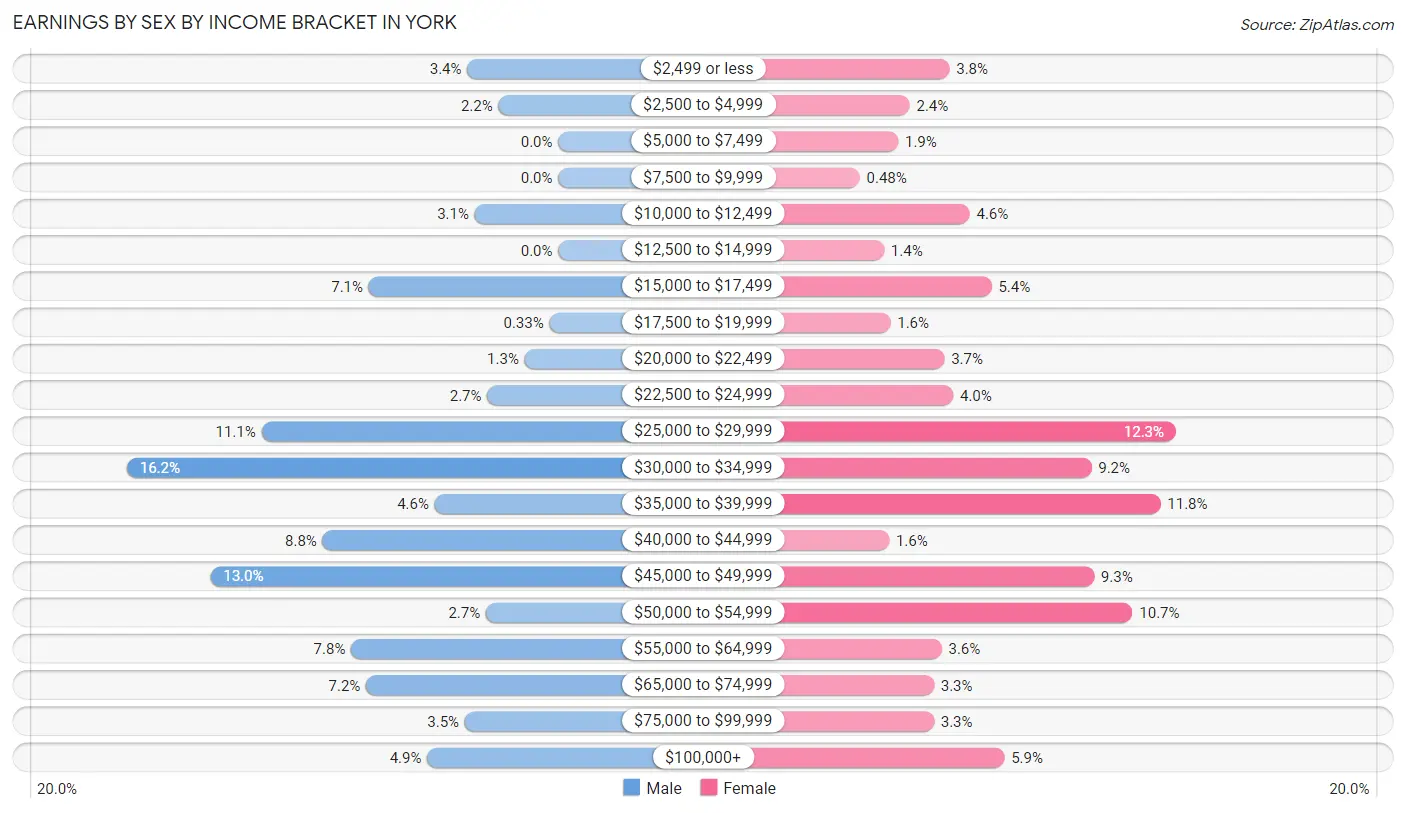
Earnings by Sex by Income Bracket in York
The most common earnings brackets in York are $30,000 to $34,999 for men (346 | 16.2%) and $25,000 to $29,999 for women (257 | 12.3%).
| Income | Male | Female |
| $2,499 or less | 73 (3.4%) | 80 (3.8%) |
| $2,500 to $4,999 | 48 (2.2%) | 49 (2.4%) |
| $5,000 to $7,499 | 0 (0.0%) | 40 (1.9%) |
| $7,500 to $9,999 | 0 (0.0%) | 10 (0.5%) |
| $10,000 to $12,499 | 67 (3.1%) | 96 (4.6%) |
| $12,500 to $14,999 | 0 (0.0%) | 29 (1.4%) |
| $15,000 to $17,499 | 152 (7.1%) | 113 (5.4%) |
| $17,500 to $19,999 | 7 (0.3%) | 34 (1.6%) |
| $20,000 to $22,499 | 27 (1.3%) | 76 (3.6%) |
| $22,500 to $24,999 | 57 (2.7%) | 83 (4.0%) |
| $25,000 to $29,999 | 238 (11.1%) | 257 (12.3%) |
| $30,000 to $34,999 | 346 (16.2%) | 191 (9.2%) |
| $35,000 to $39,999 | 99 (4.6%) | 245 (11.7%) |
| $40,000 to $44,999 | 189 (8.8%) | 33 (1.6%) |
| $45,000 to $49,999 | 279 (13.0%) | 193 (9.3%) |
| $50,000 to $54,999 | 58 (2.7%) | 223 (10.7%) |
| $55,000 to $64,999 | 166 (7.8%) | 74 (3.5%) |
| $65,000 to $74,999 | 154 (7.2%) | 68 (3.3%) |
| $75,000 to $99,999 | 75 (3.5%) | 68 (3.3%) |
| $100,000+ | 105 (4.9%) | 123 (5.9%) |
| Total | 2,140 (100.0%) | 2,085 (100.0%) |
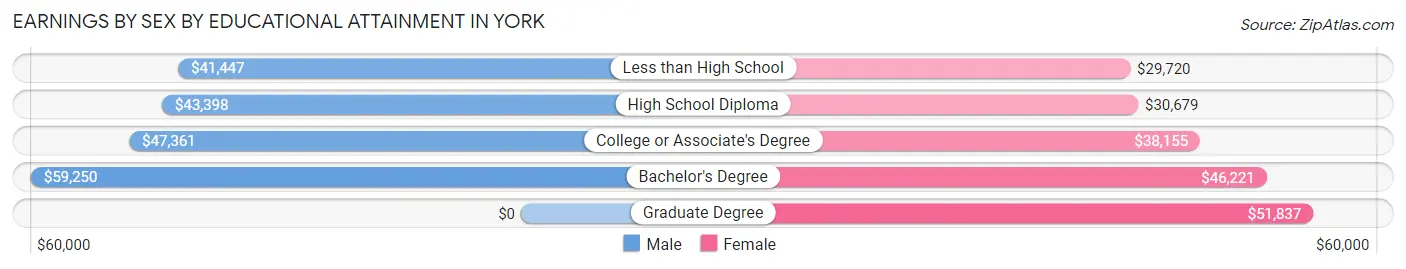
Earnings by Sex by Educational Attainment in York
Average earnings in York are $44,753 for men and $37,250 for women, a difference of 16.8%. Men with an educational attainment of bachelor's degree enjoy the highest average annual earnings of $59,250, while those with less than high school education earn the least with $41,447. Women with an educational attainment of graduate degree earn the most with the average annual earnings of $51,837, while those with less than high school education have the smallest earnings of $29,720.
| Educational Attainment | Male Income | Female Income |
| Less than High School | $41,447 | $29,720 |
| High School Diploma | $43,398 | $30,679 |
| College or Associate's Degree | $47,361 | $38,155 |
| Bachelor's Degree | $59,250 | $46,221 |
| Graduate Degree | - | - |
| Total | $44,753 | $37,250 |
Family Income in York
Family Income Brackets in York
According to the York family income data, there are 478 families falling into the $50,000 to $74,999 income range, which is the most common income bracket and makes up 21.0% of all families. Conversely, the $15,000 to $24,999 income bracket is the least frequent group with only 68 families (3.0%) belonging to this category.
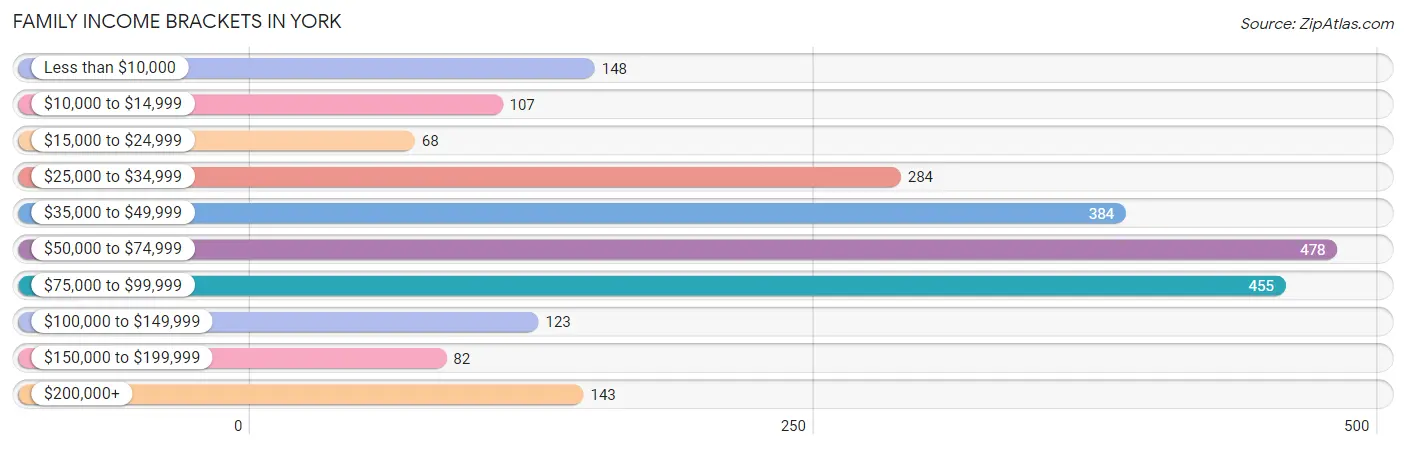
| Income Bracket | # Families | % Families |
| Less than $10,000 | 148 | 6.5% |
| $10,000 to $14,999 | 107 | 4.7% |
| $15,000 to $24,999 | 68 | 3.0% |
| $25,000 to $34,999 | 284 | 12.5% |
| $35,000 to $49,999 | 384 | 16.9% |
| $50,000 to $74,999 | 478 | 21.0% |
| $75,000 to $99,999 | 455 | 20.0% |
| $100,000 to $149,999 | 123 | 5.4% |
| $150,000 to $199,999 | 82 | 3.6% |
| $200,000+ | 143 | 6.3% |
Family Income by Famaliy Size in York
3-person families (415 | 18.2%) account for the highest median family income in York with $86,202 per family, while 3-person families (415 | 18.2%) have the highest median income of $28,734 per family member.
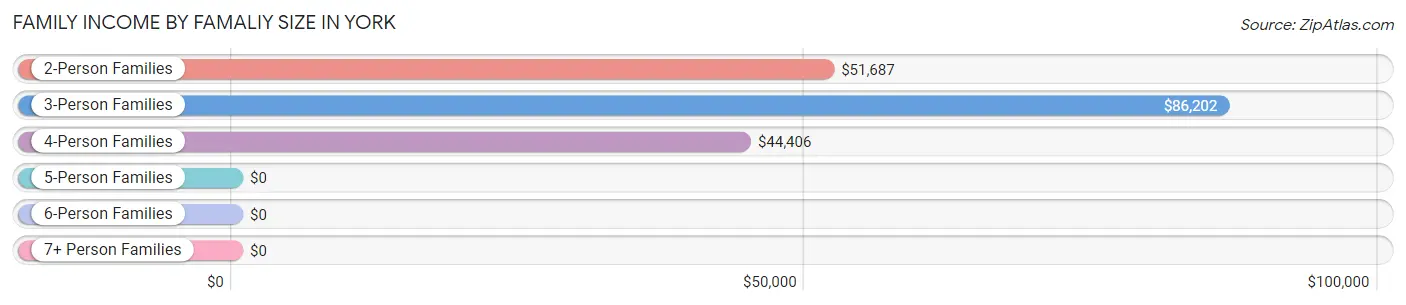
| Income Bracket | # Families | Median Income |
| 2-Person Families | 984 (43.3%) | $51,687 |
| 3-Person Families | 415 (18.2%) | $86,202 |
| 4-Person Families | 645 (28.4%) | $44,406 |
| 5-Person Families | 177 (7.8%) | $0 |
| 6-Person Families | 24 (1.1%) | $0 |
| 7+ Person Families | 29 (1.3%) | $0 |
| Total | 2,274 (100.0%) | $53,539 |
Family Income by Number of Earners in York
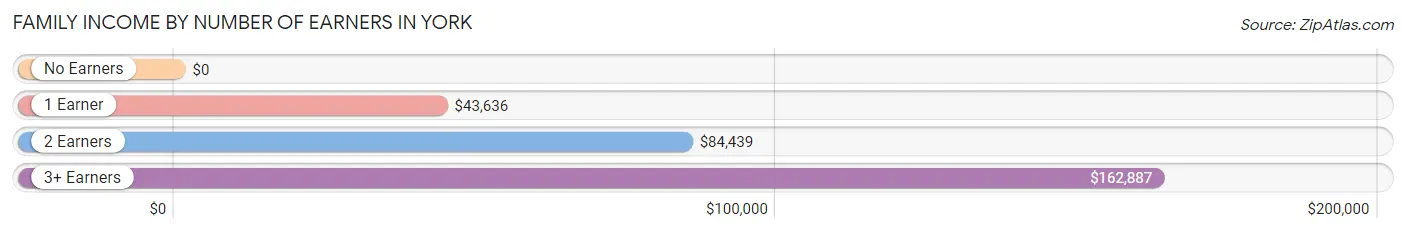
| Number of Earners | # Families | Median Income |
| No Earners | 311 (13.7%) | $0 |
| 1 Earner | 960 (42.2%) | $43,636 |
| 2 Earners | 746 (32.8%) | $84,439 |
| 3+ Earners | 257 (11.3%) | $162,887 |
| Total | 2,274 (100.0%) | $53,539 |
Household Income in York
Household Income Brackets in York
With 643 households falling in the category, the $50,000 to $74,999 income range is the most frequent in York, accounting for 19.4% of all households. In contrast, only 123 households (3.7%) fall into the $100,000 to $149,999 income bracket, making it the least populous group.
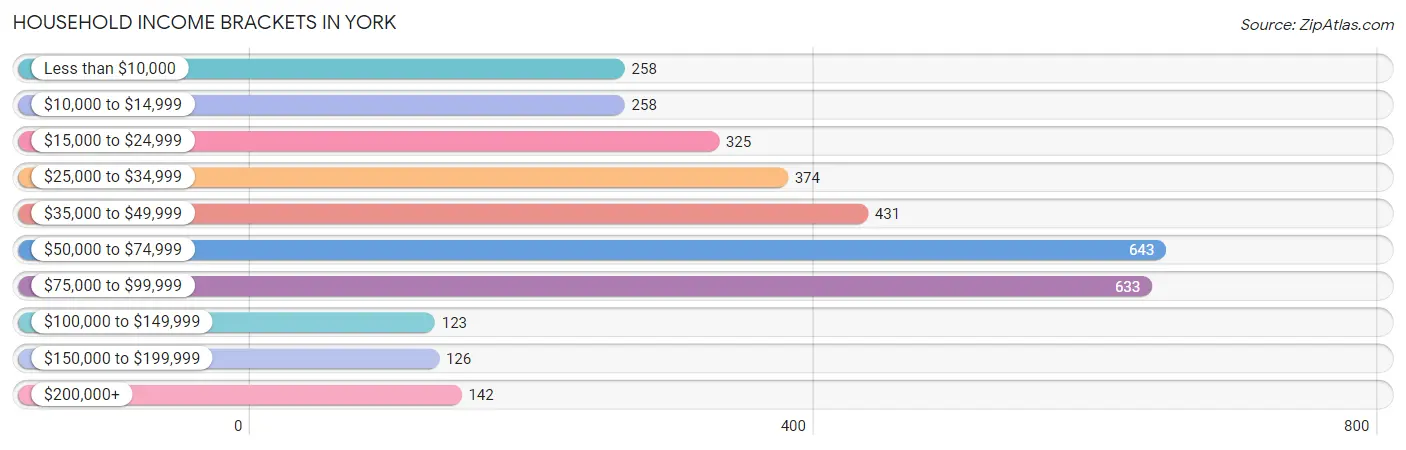
| Income Bracket | # Households | % Households |
| Less than $10,000 | 258 | 7.8% |
| $10,000 to $14,999 | 258 | 7.8% |
| $15,000 to $24,999 | 325 | 9.8% |
| $25,000 to $34,999 | 374 | 11.3% |
| $35,000 to $49,999 | 431 | 13.0% |
| $50,000 to $74,999 | 643 | 19.4% |
| $75,000 to $99,999 | 633 | 19.1% |
| $100,000 to $149,999 | 123 | 3.7% |
| $150,000 to $199,999 | 126 | 3.8% |
| $200,000+ | 142 | 4.3% |
Household Income by Householder Age in York
The median household income in York is $50,177, with the highest median household income of $73,274 found in the 25 to 44 years age bracket for the primary householder. A total of 1,165 households (35.2%) fall into this category. Meanwhile, the 15 to 24 years age bracket for the primary householder has the lowest median household income of $0, with 129 households (3.9%) in this group.
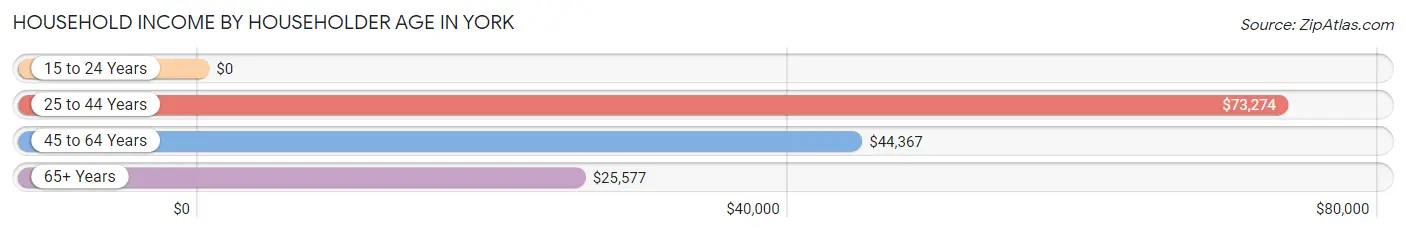
| Income Bracket | # Households | Median Income |
| 15 to 24 Years | 129 (3.9%) | $0 |
| 25 to 44 Years | 1,165 (35.2%) | $73,274 |
| 45 to 64 Years | 1,278 (38.6%) | $44,367 |
| 65+ Years | 740 (22.3%) | $25,577 |
| Total | 3,312 (100.0%) | $50,177 |
Poverty in York
Income Below Poverty by Sex and Age in York
With 12.2% poverty level for males and 21.8% for females among the residents of York, 75 year old and over males and 6 to 11 year old females are the most vulnerable to poverty, with 81 males (39.3%) and 215 females (51.7%) in their respective age groups living below the poverty level.
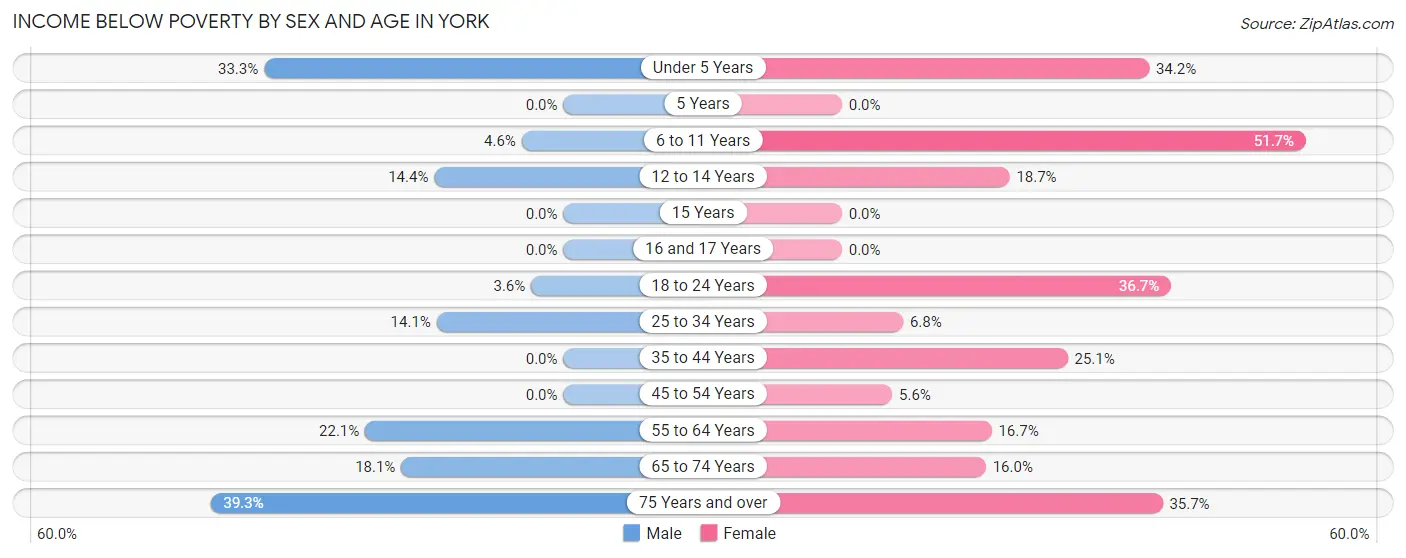
| Age Bracket | Male | Female |
| Under 5 Years | 73 (33.3%) | 104 (34.2%) |
| 5 Years | 0 (0.0%) | 0 (0.0%) |
| 6 to 11 Years | 17 (4.6%) | 215 (51.7%) |
| 12 to 14 Years | 44 (14.4%) | 45 (18.7%) |
| 15 Years | 0 (0.0%) | 0 (0.0%) |
| 16 and 17 Years | 0 (0.0%) | 0 (0.0%) |
| 18 to 24 Years | 18 (3.6%) | 154 (36.7%) |
| 25 to 34 Years | 80 (14.1%) | 35 (6.8%) |
| 35 to 44 Years | 0 (0.0%) | 134 (25.1%) |
| 45 to 54 Years | 0 (0.0%) | 37 (5.6%) |
| 55 to 64 Years | 121 (22.1%) | 114 (16.7%) |
| 65 to 74 Years | 41 (18.1%) | 46 (16.0%) |
| 75 Years and over | 81 (39.3%) | 100 (35.7%) |
| Total | 475 (12.2%) | 984 (21.8%) |
Income Above Poverty by Sex and Age in York
According to the poverty statistics in York, males aged 15 years and females aged 5 years are the age groups that are most secure financially, with 100.0% of males and 100.0% of females in these age groups living above the poverty line.
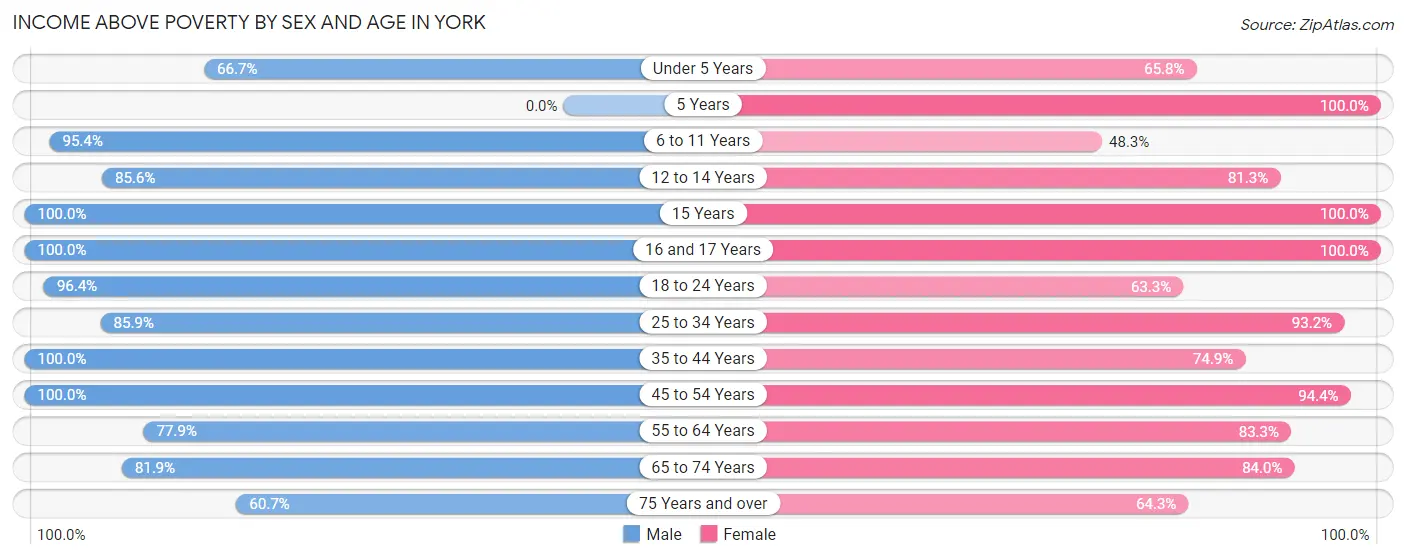
| Age Bracket | Male | Female |
| Under 5 Years | 146 (66.7%) | 200 (65.8%) |
| 5 Years | 0 (0.0%) | 17 (100.0%) |
| 6 to 11 Years | 349 (95.4%) | 201 (48.3%) |
| 12 to 14 Years | 262 (85.6%) | 196 (81.3%) |
| 15 Years | 24 (100.0%) | 51 (100.0%) |
| 16 and 17 Years | 64 (100.0%) | 106 (100.0%) |
| 18 to 24 Years | 483 (96.4%) | 266 (63.3%) |
| 25 to 34 Years | 487 (85.9%) | 479 (93.2%) |
| 35 to 44 Years | 526 (100.0%) | 399 (74.9%) |
| 45 to 54 Years | 326 (100.0%) | 624 (94.4%) |
| 55 to 64 Years | 427 (77.9%) | 570 (83.3%) |
| 65 to 74 Years | 186 (81.9%) | 241 (84.0%) |
| 75 Years and over | 125 (60.7%) | 180 (64.3%) |
| Total | 3,405 (87.8%) | 3,530 (78.2%) |
Income Below Poverty Among Married-Couple Families in York
The poverty statistics for married-couple families in York show that 2.2% or 24 of the total 1,105 families live below the poverty line. Families with no children have the highest poverty rate of 4.7%, comprising of 24 families. On the other hand, families with 1 or 2 children have the lowest poverty rate of 0.0%, which includes 0 families.
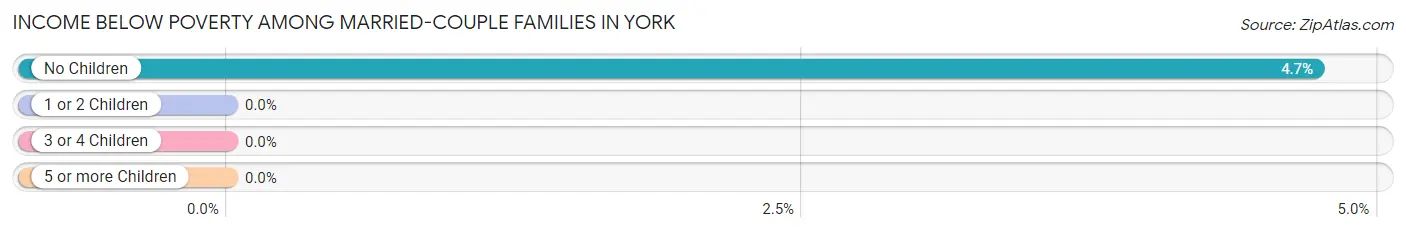
| Children | Above Poverty | Below Poverty |
| No Children | 483 (95.3%) | 24 (4.7%) |
| 1 or 2 Children | 483 (100.0%) | 0 (0.0%) |
| 3 or 4 Children | 101 (100.0%) | 0 (0.0%) |
| 5 or more Children | 14 (100.0%) | 0 (0.0%) |
| Total | 1,081 (97.8%) | 24 (2.2%) |
Income Below Poverty Among Single-Parent Households in York
According to the poverty data in York, 2.2% or 7 single-father households and 36.2% or 310 single-mother households are living below the poverty line. Among single-father households, those with no children have the highest poverty rate, with 7 households (3.0%) experiencing poverty. Likewise, among single-mother households, those with 3 or 4 children have the highest poverty rate, with 118 households (79.7%) falling below the poverty line.
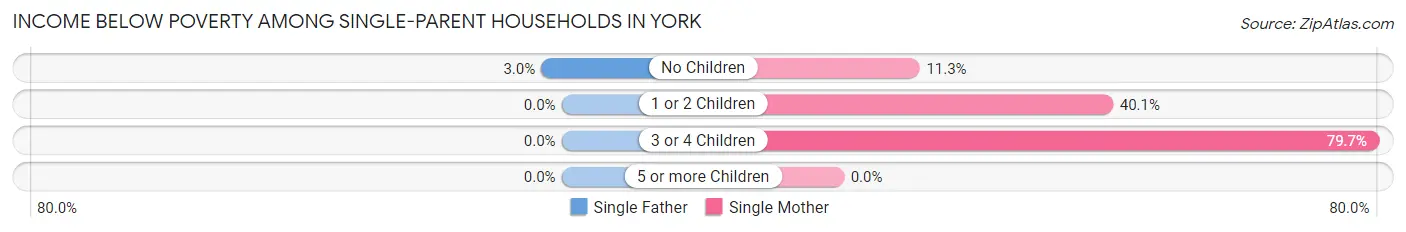
| Children | Single Father | Single Mother |
| No Children | 7 (3.0%) | 36 (11.3%) |
| 1 or 2 Children | 0 (0.0%) | 156 (40.1%) |
| 3 or 4 Children | 0 (0.0%) | 118 (79.7%) |
| 5 or more Children | 0 (0.0%) | 0 (0.0%) |
| Total | 7 (2.2%) | 310 (36.2%) |
Income Below Poverty Among Married-Couple vs Single-Parent Households in York
The poverty data for York shows that 24 of the married-couple family households (2.2%) and 317 of the single-parent households (27.1%) are living below the poverty level. Within the married-couple family households, those with no children have the highest poverty rate, with 24 households (4.7%) falling below the poverty line. Among the single-parent households, those with 3 or 4 children have the highest poverty rate, with 118 household (51.1%) living below poverty.
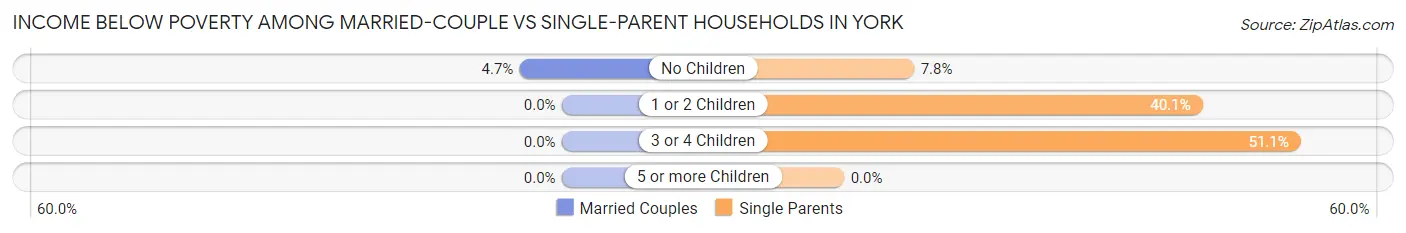
| Children | Married-Couple Families | Single-Parent Households |
| No Children | 24 (4.7%) | 43 (7.8%) |
| 1 or 2 Children | 0 (0.0%) | 156 (40.1%) |
| 3 or 4 Children | 0 (0.0%) | 118 (51.1%) |
| 5 or more Children | 0 (0.0%) | 0 (0.0%) |
| Total | 24 (2.2%) | 317 (27.1%) |
Race in York
The most populous races in York are White / Caucasian (4,364 | 51.1%), Black / African American (2,666 | 31.2%), and Two or more Races (1,009 | 11.8%).
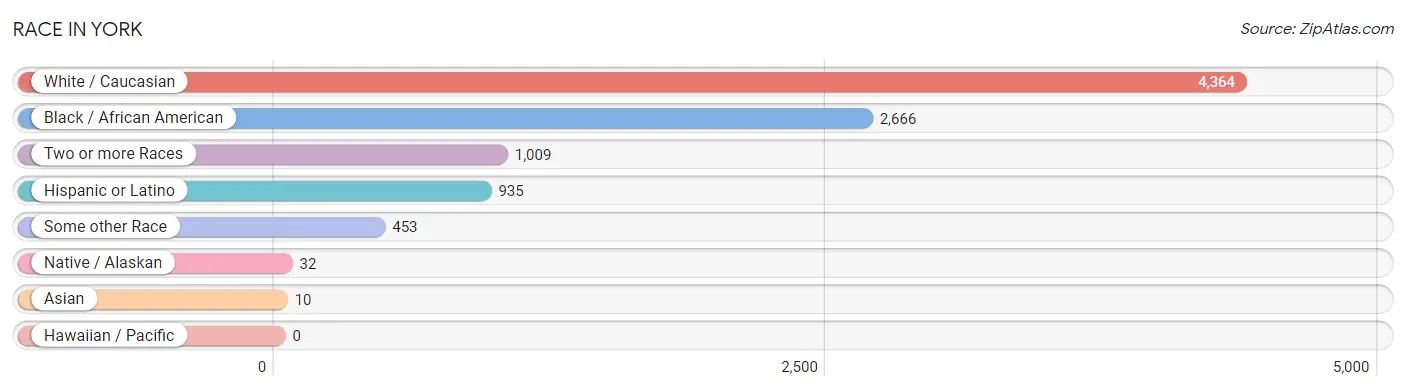
| Race | # Population | % Population |
| Asian | 10 | 0.1% |
| Black / African American | 2,666 | 31.2% |
| Hawaiian / Pacific | 0 | 0.0% |
| Hispanic or Latino | 935 | 11.0% |
| Native / Alaskan | 32 | 0.4% |
| White / Caucasian | 4,364 | 51.1% |
| Two or more Races | 1,009 | 11.8% |
| Some other Race | 453 | 5.3% |
| Total | 8,534 | 100.0% |
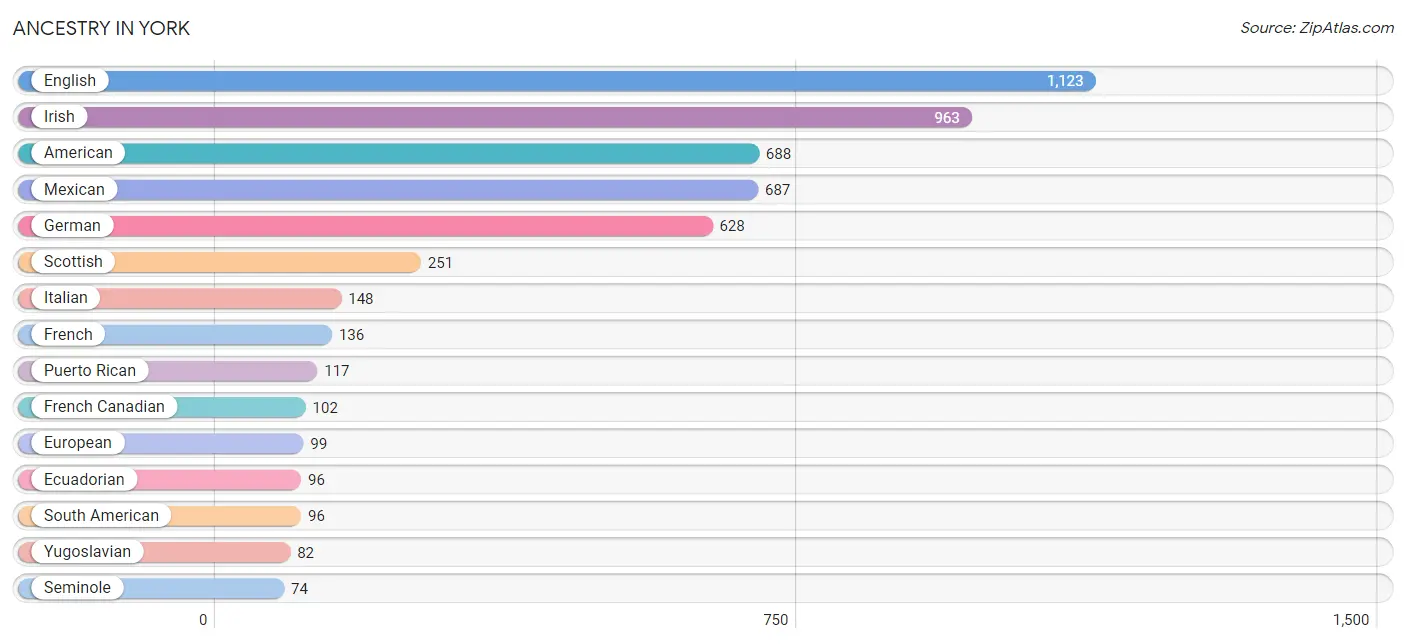
Ancestry in York
The most populous ancestries reported in York are English (1,123 | 13.2%), Irish (963 | 11.3%), American (688 | 8.1%), Mexican (687 | 8.1%), and German (628 | 7.4%), together accounting for 47.9% of all York residents.
| Ancestry | # Population | % Population |
| African | 11 | 0.1% |
| American | 688 | 8.1% |
| British | 51 | 0.6% |
| Central American | 19 | 0.2% |
| Cherokee | 30 | 0.4% |
| Czech | 52 | 0.6% |
| Eastern European | 6 | 0.1% |
| Ecuadorian | 96 | 1.1% |
| English | 1,123 | 13.2% |
| European | 99 | 1.2% |
| French | 136 | 1.6% |
| French Canadian | 102 | 1.2% |
| German | 628 | 7.4% |
| Greek | 12 | 0.1% |
| Haitian | 11 | 0.1% |
| Icelander | 16 | 0.2% |
| Indian (Asian) | 62 | 0.7% |
| Irish | 963 | 11.3% |
| Italian | 148 | 1.7% |
| Lumbee | 16 | 0.2% |
| Mexican | 687 | 8.1% |
| Norwegian | 12 | 0.1% |
| Polish | 59 | 0.7% |
| Puerto Rican | 117 | 1.4% |
| Salvadoran | 19 | 0.2% |
| Scotch-Irish | 69 | 0.8% |
| Scottish | 251 | 2.9% |
| Seminole | 74 | 0.9% |
| South American | 96 | 1.1% |
| Spanish | 13 | 0.2% |
| Sri Lankan | 27 | 0.3% |
| Subsaharan African | 11 | 0.1% |
| Thai | 10 | 0.1% |
| Turkish | 16 | 0.2% |
| Welsh | 11 | 0.1% |
| Yugoslavian | 82 | 1.0% | View All 36 Rows |
Immigrants in York
The most numerous immigrant groups reported in York came from Latin America (300 | 3.5%), Central America (274 | 3.2%), Mexico (274 | 3.2%), Europe (34 | 0.4%), and Northern Europe (34 | 0.4%), together accounting for 10.7% of all York residents.
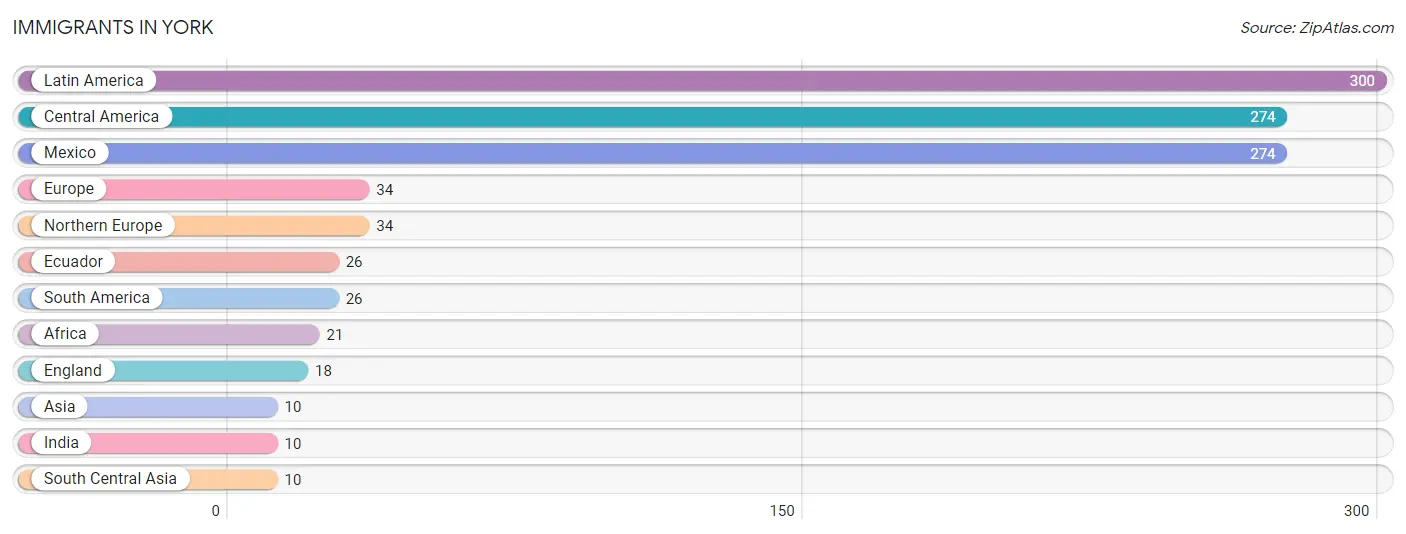
| Immigration Origin | # Population | % Population |
| Africa | 21 | 0.3% |
| Asia | 10 | 0.1% |
| Central America | 274 | 3.2% |
| Ecuador | 26 | 0.3% |
| England | 18 | 0.2% |
| Europe | 34 | 0.4% |
| India | 10 | 0.1% |
| Latin America | 300 | 3.5% |
| Mexico | 274 | 3.2% |
| Northern Europe | 34 | 0.4% |
| South America | 26 | 0.3% |
| South Central Asia | 10 | 0.1% | View All 12 Rows |
Sex and Age in York
Sex and Age in York
The most populous age groups in York are 10 to 14 Years (513 | 13.1%) for men and 50 to 54 Years (449 | 9.7%) for women.
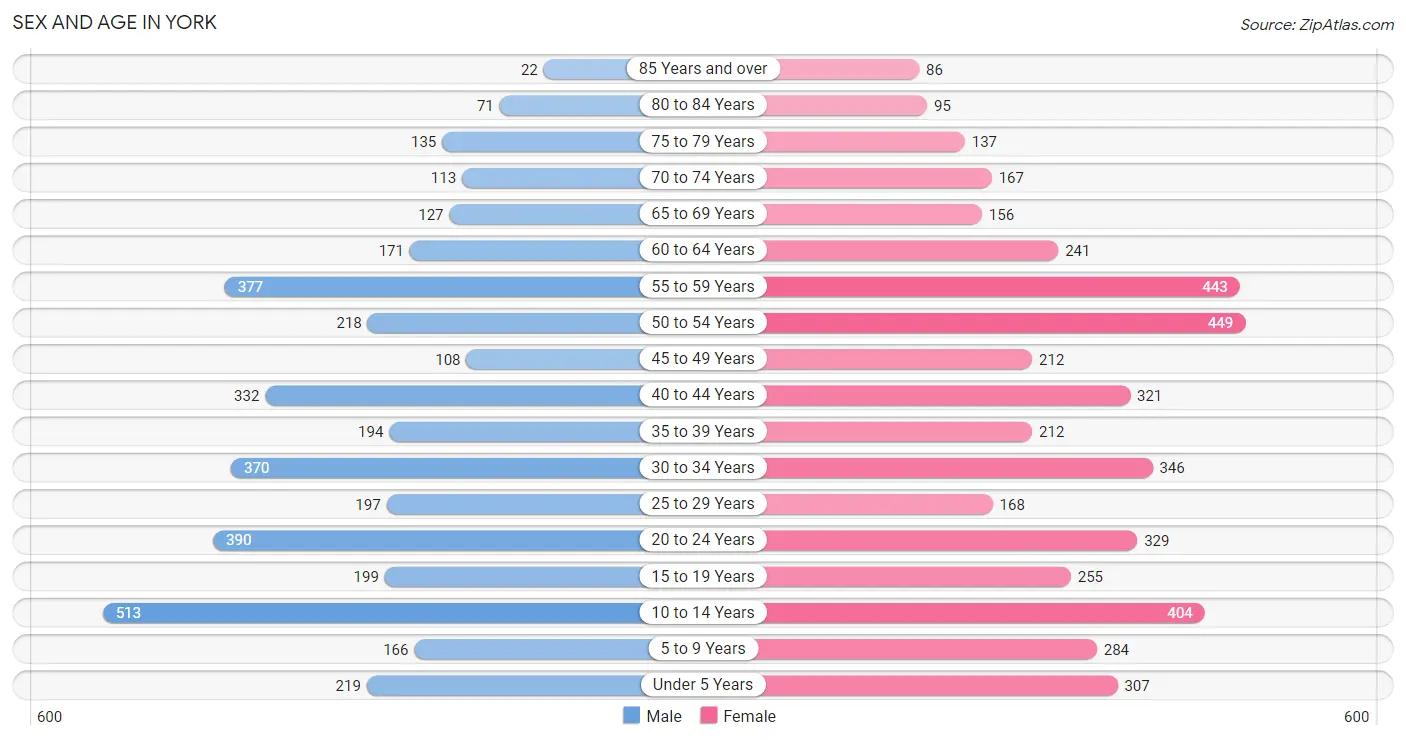
| Age Bracket | Male | Female |
| Under 5 Years | 219 (5.6%) | 307 (6.7%) |
| 5 to 9 Years | 166 (4.2%) | 284 (6.2%) |
| 10 to 14 Years | 513 (13.1%) | 404 (8.8%) |
| 15 to 19 Years | 199 (5.1%) | 255 (5.5%) |
| 20 to 24 Years | 390 (9.9%) | 329 (7.1%) |
| 25 to 29 Years | 197 (5.0%) | 168 (3.6%) |
| 30 to 34 Years | 370 (9.4%) | 346 (7.5%) |
| 35 to 39 Years | 194 (5.0%) | 212 (4.6%) |
| 40 to 44 Years | 332 (8.5%) | 321 (7.0%) |
| 45 to 49 Years | 108 (2.8%) | 212 (4.6%) |
| 50 to 54 Years | 218 (5.6%) | 449 (9.7%) |
| 55 to 59 Years | 377 (9.6%) | 443 (9.6%) |
| 60 to 64 Years | 171 (4.4%) | 241 (5.2%) |
| 65 to 69 Years | 127 (3.2%) | 156 (3.4%) |
| 70 to 74 Years | 113 (2.9%) | 167 (3.6%) |
| 75 to 79 Years | 135 (3.4%) | 137 (3.0%) |
| 80 to 84 Years | 71 (1.8%) | 95 (2.1%) |
| 85 Years and over | 22 (0.6%) | 86 (1.9%) |
| Total | 3,922 (100.0%) | 4,612 (100.0%) |
Families and Households in York
Median Family Size in York
The median family size in York is 3.00 persons per family, with married-couple families (1,105 | 48.6%) accounting for the largest median family size of 3.05 persons per family. On the other hand, single female/mother families (856 | 37.6%) represent the smallest median family size with 2.94 persons per family.
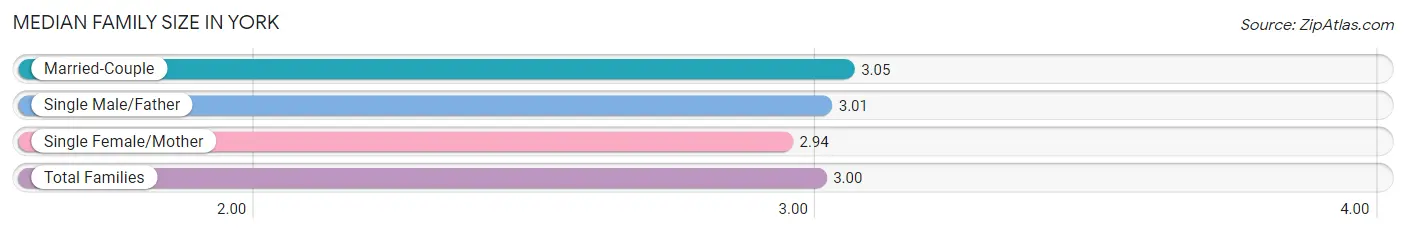
| Family Type | # Families | Family Size |
| Married-Couple | 1,105 (48.6%) | 3.05 |
| Single Male/Father | 313 (13.8%) | 3.01 |
| Single Female/Mother | 856 (37.6%) | 2.94 |
| Total Families | 2,274 (100.0%) | 3.00 |
Median Household Size in York
The median household size in York is 2.53 persons per household, with single male/father households (313 | 9.5%) accounting for the largest median household size of 3.47 persons per household. non-family households (1,038 | 31.3%) represent the smallest median household size with 1.18 persons per household.
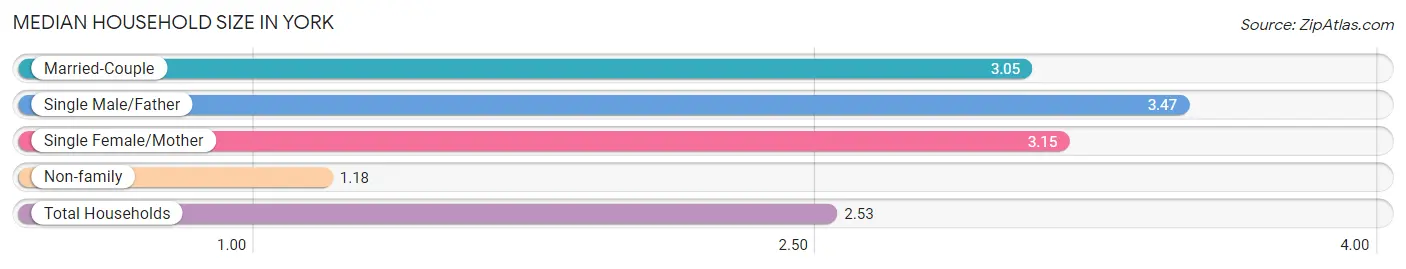
| Household Type | # Households | Household Size |
| Married-Couple | 1,105 (33.4%) | 3.05 |
| Single Male/Father | 313 (9.5%) | 3.47 |
| Single Female/Mother | 856 (25.9%) | 3.15 |
| Non-family | 1,038 (31.3%) | 1.18 |
| Total Households | 3,312 (100.0%) | 2.53 |
Household Size by Marriage Status in York
Out of a total of 3,312 households in York, 2,274 (68.7%) are family households, while 1,038 (31.3%) are nonfamily households. The most numerous type of family households are 2-person households, comprising 919, and the most common type of nonfamily households are 1-person households, comprising 887.
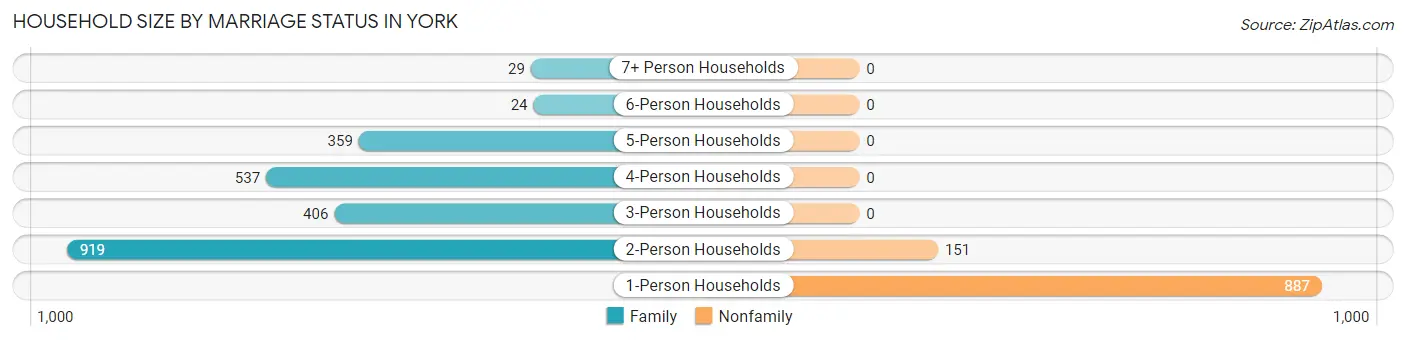
| Household Size | Family Households | Nonfamily Households |
| 1-Person Households | - | 887 (26.8%) |
| 2-Person Households | 919 (27.8%) | 151 (4.6%) |
| 3-Person Households | 406 (12.3%) | 0 (0.0%) |
| 4-Person Households | 537 (16.2%) | 0 (0.0%) |
| 5-Person Households | 359 (10.8%) | 0 (0.0%) |
| 6-Person Households | 24 (0.7%) | 0 (0.0%) |
| 7+ Person Households | 29 (0.9%) | 0 (0.0%) |
| Total | 2,274 (68.7%) | 1,038 (31.3%) |
Female Fertility in York
Fertility by Age in York
Average fertility rate in York is 78.0 births per 1,000 women. Women in the age bracket of 20 to 34 years have the highest fertility rate with 197.0 births per 1,000 women. Women in the age bracket of 20 to 34 years acount for 100.0% of all women with births.
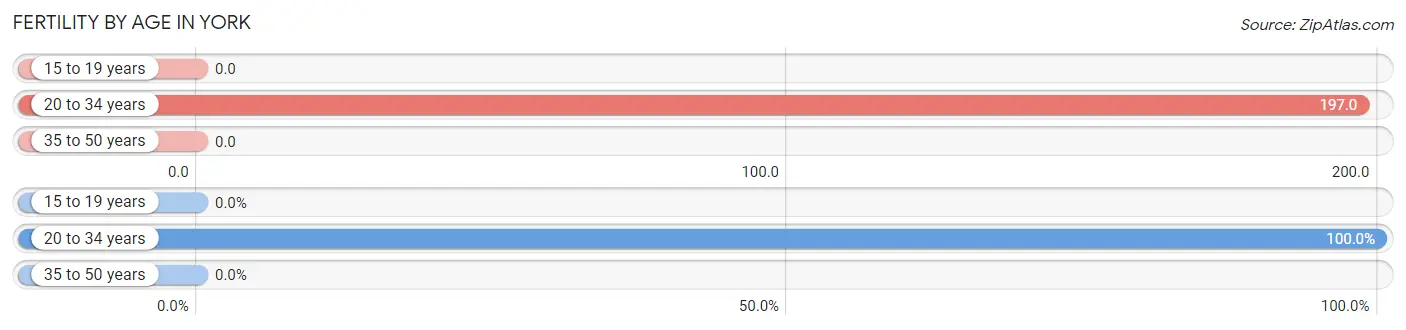
| Age Bracket | Women with Births | Births / 1,000 Women |
| 15 to 19 years | 0 (0.0%) | 0.0 |
| 20 to 34 years | 166 (100.0%) | 197.0 |
| 35 to 50 years | 0 (0.0%) | 0.0 |
| Total | 166 (100.0%) | 78.0 |
Fertility by Age by Marriage Status in York
29.5% of women with births (166) in York are married. The highest percentage of unmarried women with births falls into 20 to 34 years age bracket with 70.5% of them unmarried at the time of birth, while the lowest percentage of unmarried women with births belong to 20 to 34 years age bracket with 70.5% of them unmarried.
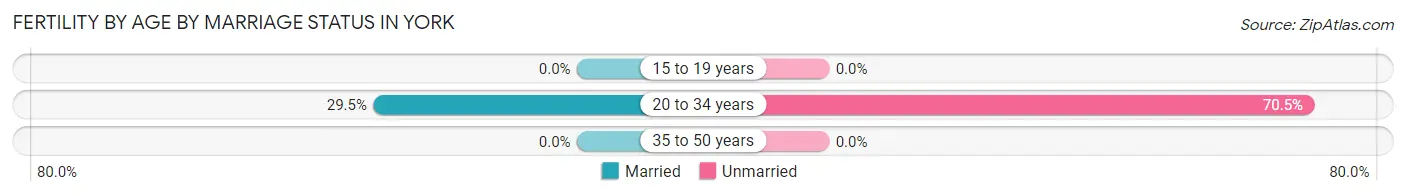
| Age Bracket | Married | Unmarried |
| 15 to 19 years | 0 (0.0%) | 0 (0.0%) |
| 20 to 34 years | 49 (29.5%) | 117 (70.5%) |
| 35 to 50 years | 0 (0.0%) | 0 (0.0%) |
| Total | 49 (29.5%) | 117 (70.5%) |
Fertility by Education in York
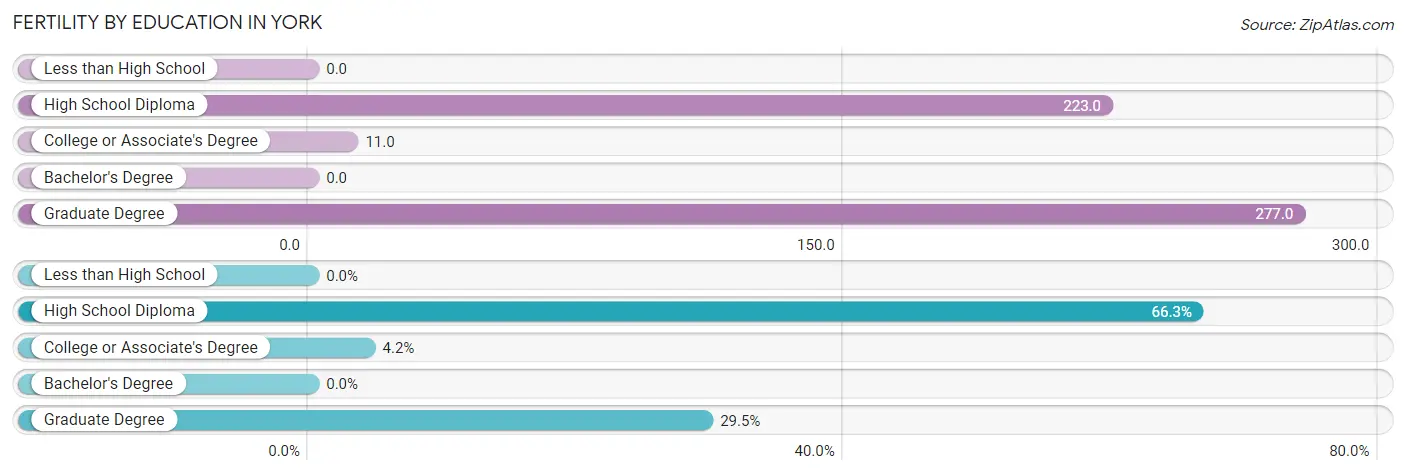
| Educational Attainment | Women with Births | Births / 1,000 Women |
| Less than High School | 0 (0.0%) | 0.0 |
| High School Diploma | 110 (66.3%) | 223.0 |
| College or Associate's Degree | 7 (4.2%) | 11.0 |
| Bachelor's Degree | 0 (0.0%) | 0.0 |
| Graduate Degree | 49 (29.5%) | 277.0 |
| Total | 166 (100.0%) | 78.0 |
Fertility by Education by Marriage Status in York
70.5% of women with births in York are unmarried. Women with the educational attainment of graduate degree are most likely to be married with 100.0% of them married at childbirth, while women with the educational attainment of high school diploma are least likely to be married with 100.0% of them unmarried at childbirth.
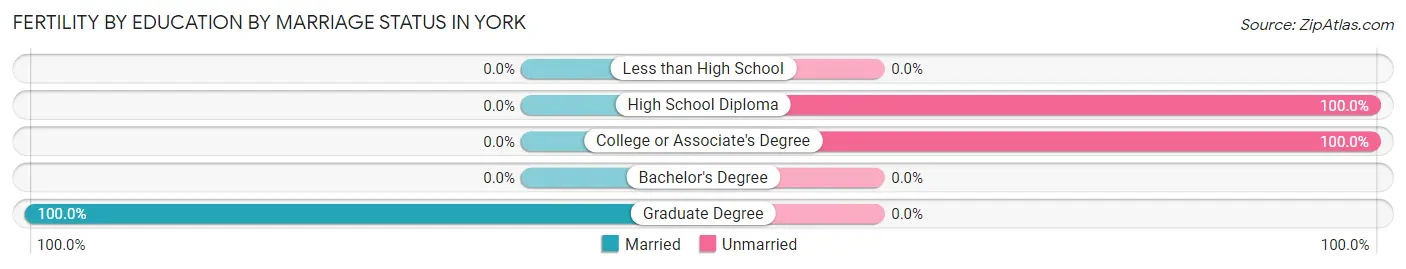
| Educational Attainment | Married | Unmarried |
| Less than High School | 0 (0.0%) | 0 (0.0%) |
| High School Diploma | 0 (0.0%) | 110 (100.0%) |
| College or Associate's Degree | 0 (0.0%) | 7 (100.0%) |
| Bachelor's Degree | 0 (0.0%) | 0 (0.0%) |
| Graduate Degree | 49 (100.0%) | 0 (0.0%) |
| Total | 49 (29.5%) | 117 (70.5%) |
Employment Characteristics in York
Employment by Class of Employer in York
Among the 3,934 employed individuals in York, private company employees (3,119 | 79.3%), local government employees (260 | 6.6%), and not-for-profit organizations (226 | 5.7%) make up the most common classes of employment.
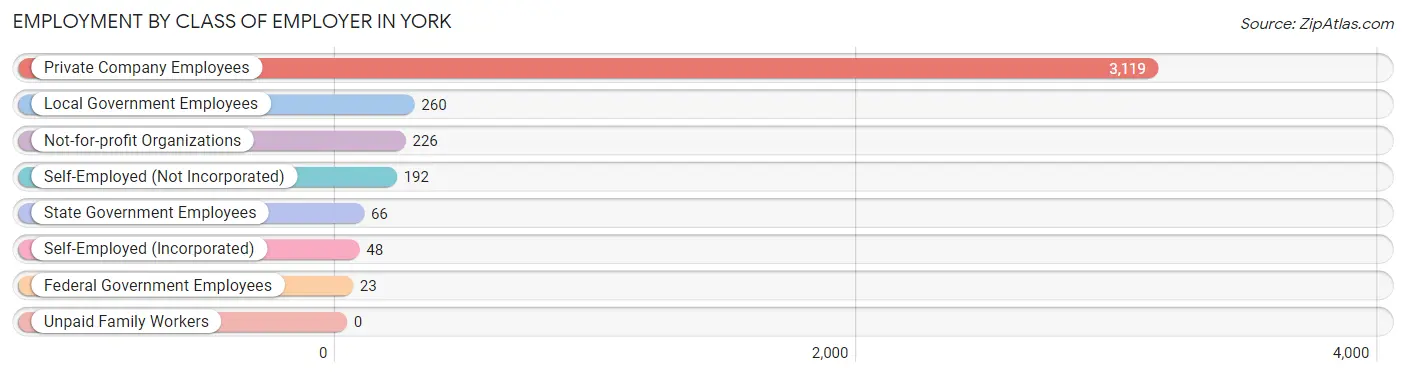
| Employer Class | # Employees | % Employees |
| Private Company Employees | 3,119 | 79.3% |
| Self-Employed (Incorporated) | 48 | 1.2% |
| Self-Employed (Not Incorporated) | 192 | 4.9% |
| Not-for-profit Organizations | 226 | 5.7% |
| Local Government Employees | 260 | 6.6% |
| State Government Employees | 66 | 1.7% |
| Federal Government Employees | 23 | 0.6% |
| Unpaid Family Workers | 0 | 0.0% |
| Total | 3,934 | 100.0% |
Employment Status by Age in York
According to the labor force statistics for York, out of the total population over 16 years of age (6,566), 66.1% or 4,340 individuals are in the labor force, with 8.2% or 356 of them unemployed. The age group with the highest labor force participation rate is 35 to 44 years, with 89.7% or 950 individuals in the labor force. Within the labor force, the 75 years and over age range has the highest percentage of unemployed individuals, with 40.0% or 4 of them being unemployed.
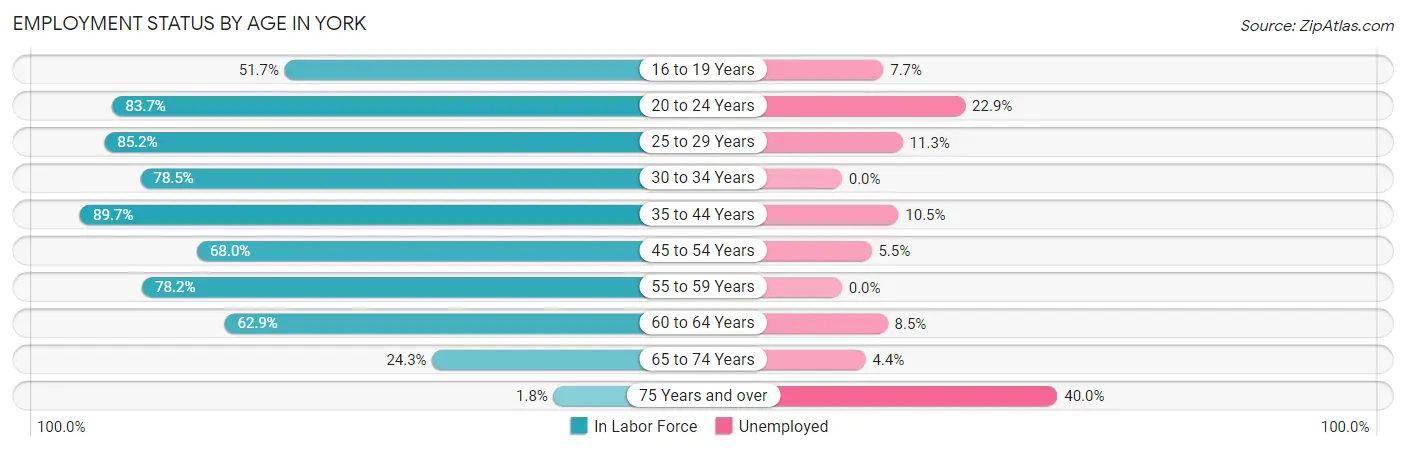
| Age Bracket | In Labor Force | Unemployed |
| 16 to 19 Years | 196 (51.7%) | 15 (7.7%) |
| 20 to 24 Years | 602 (83.7%) | 138 (22.9%) |
| 25 to 29 Years | 311 (85.2%) | 35 (11.3%) |
| 30 to 34 Years | 562 (78.5%) | 0 (0.0%) |
| 35 to 44 Years | 950 (89.7%) | 100 (10.5%) |
| 45 to 54 Years | 671 (68.0%) | 37 (5.5%) |
| 55 to 59 Years | 641 (78.2%) | 0 (0.0%) |
| 60 to 64 Years | 259 (62.9%) | 22 (8.5%) |
| 65 to 74 Years | 137 (24.3%) | 6 (4.4%) |
| 75 Years and over | 10 (1.8%) | 4 (40.0%) |
| Total | 4,340 (66.1%) | 356 (8.2%) |
Employment Status by Educational Attainment in York
According to labor force statistics for York, 77.9% of individuals (3,396) out of the total population between 25 and 64 years of age (4,359) are in the labor force, with 5.7% or 194 of them being unemployed. The group with the highest labor force participation rate are those with the educational attainment of bachelor's degree or higher, with 87.6% or 678 individuals in the labor force. Within the labor force, individuals with high school diploma education have the highest percentage of unemployment, with 11.3% or 152 of them being unemployed.
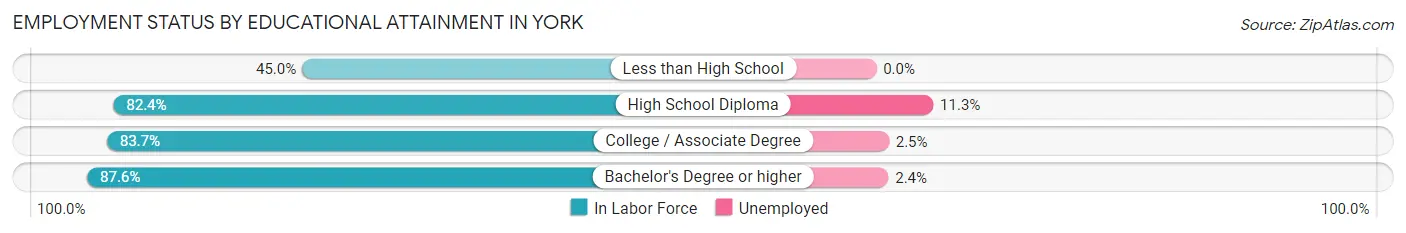
| Educational Attainment | In Labor Force | Unemployed |
| Less than High School | 308 (45.0%) | 0 (0.0%) |
| High School Diploma | 1,346 (82.4%) | 185 (11.3%) |
| College / Associate Degree | 1,060 (83.7%) | 32 (2.5%) |
| Bachelor's Degree or higher | 678 (87.6%) | 19 (2.4%) |
| Total | 3,396 (77.9%) | 248 (5.7%) |
Employment Occupations by Sex in York
Management, Business, Science and Arts Occupations
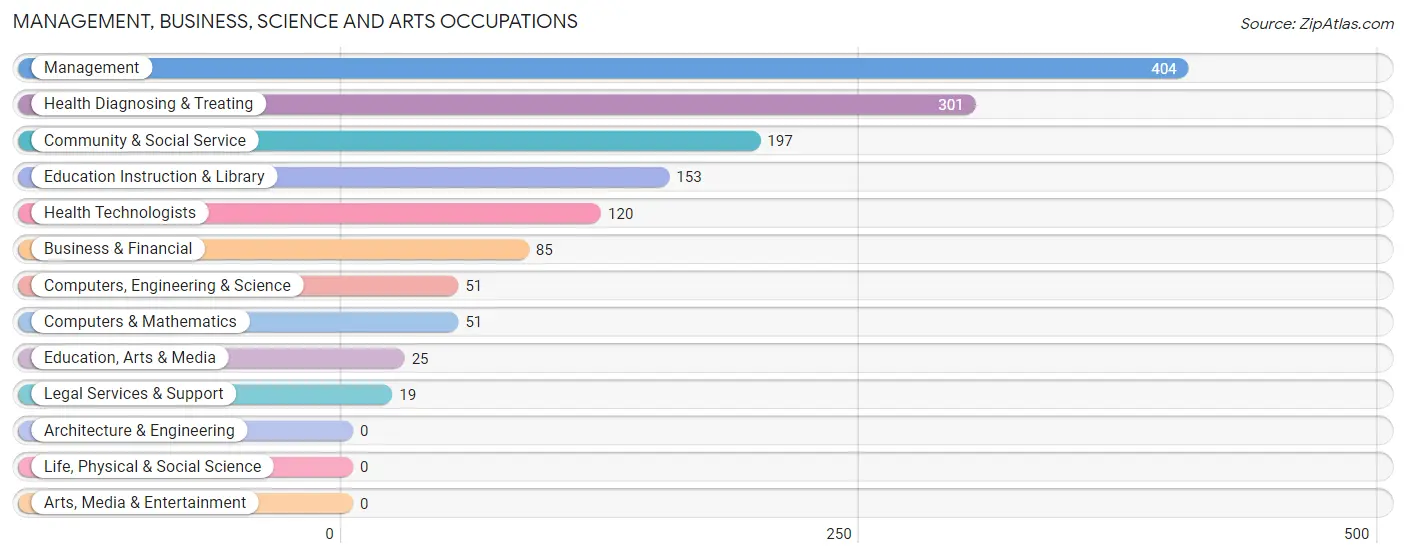
The most common Management, Business, Science and Arts occupations in York are Management (404 | 10.2%), Health Diagnosing & Treating (301 | 7.6%), Community & Social Service (197 | 5.0%), Education Instruction & Library (153 | 3.8%), and Health Technologists (120 | 3.0%).
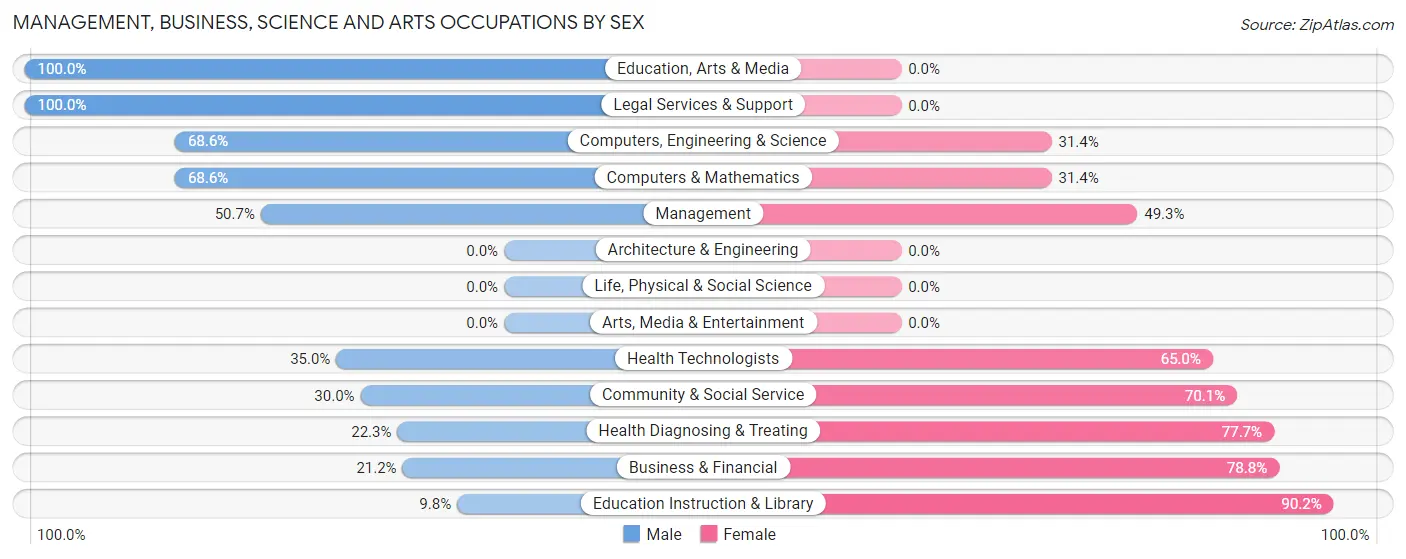
Management, Business, Science and Arts Occupations by Sex
Within the Management, Business, Science and Arts occupations in York, the most male-oriented occupations are Education, Arts & Media (100.0%), Legal Services & Support (100.0%), and Computers, Engineering & Science (68.6%), while the most female-oriented occupations are Education Instruction & Library (90.2%), Business & Financial (78.8%), and Health Diagnosing & Treating (77.7%).
| Occupation | Male | Female |
| Management | 205 (50.7%) | 199 (49.3%) |
| Business & Financial | 18 (21.2%) | 67 (78.8%) |
| Computers, Engineering & Science | 35 (68.6%) | 16 (31.4%) |
| Computers & Mathematics | 35 (68.6%) | 16 (31.4%) |
| Architecture & Engineering | 0 (0.0%) | 0 (0.0%) |
| Life, Physical & Social Science | 0 (0.0%) | 0 (0.0%) |
| Community & Social Service | 59 (29.9%) | 138 (70.1%) |
| Education, Arts & Media | 25 (100.0%) | 0 (0.0%) |
| Legal Services & Support | 19 (100.0%) | 0 (0.0%) |
| Education Instruction & Library | 15 (9.8%) | 138 (90.2%) |
| Arts, Media & Entertainment | 0 (0.0%) | 0 (0.0%) |
| Health Diagnosing & Treating | 67 (22.3%) | 234 (77.7%) |
| Health Technologists | 42 (35.0%) | 78 (65.0%) |
| Total (Category) | 384 (37.0%) | 654 (63.0%) |
| Total (Overall) | 2,002 (50.3%) | 1,980 (49.7%) |
Services Occupations
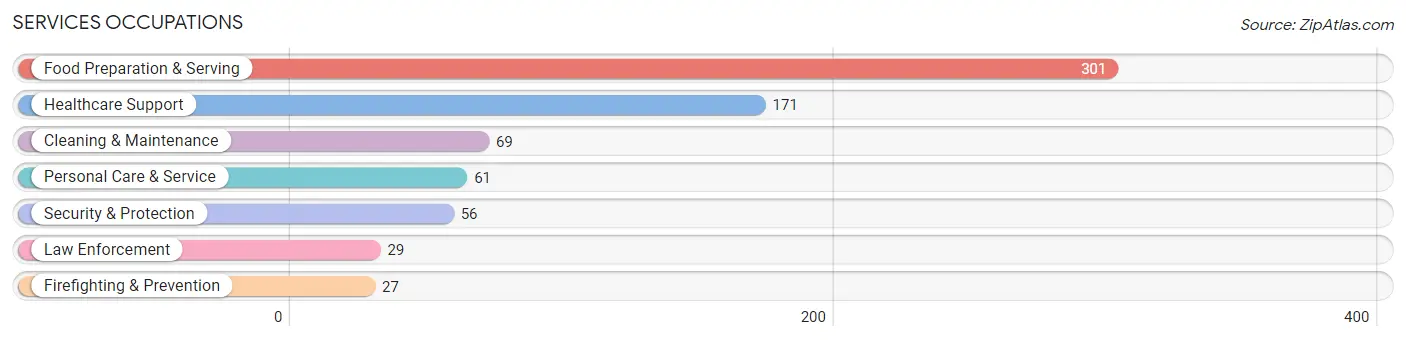
The most common Services occupations in York are Food Preparation & Serving (301 | 7.6%), Healthcare Support (171 | 4.3%), Cleaning & Maintenance (69 | 1.7%), Personal Care & Service (61 | 1.5%), and Security & Protection (56 | 1.4%).
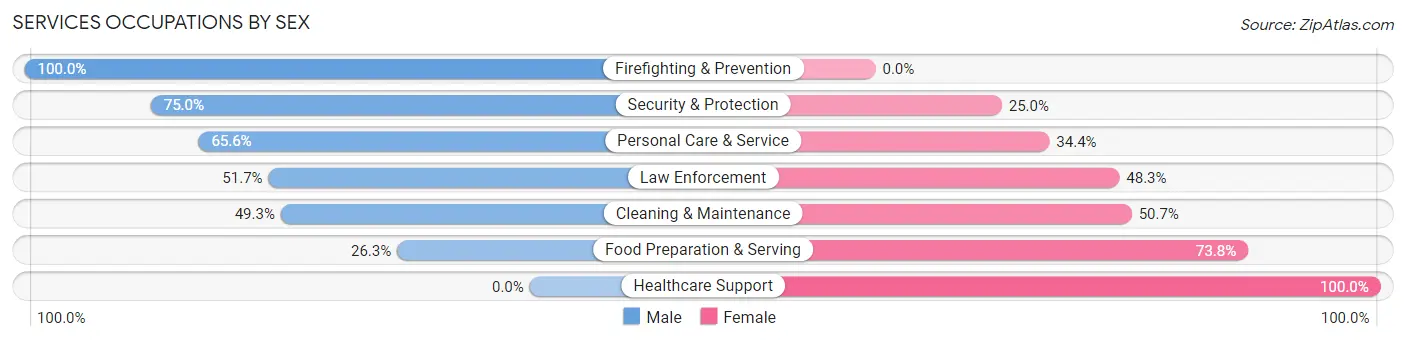
Services Occupations by Sex
Within the Services occupations in York, the most male-oriented occupations are Firefighting & Prevention (100.0%), Security & Protection (75.0%), and Personal Care & Service (65.6%), while the most female-oriented occupations are Healthcare Support (100.0%), Food Preparation & Serving (73.8%), and Cleaning & Maintenance (50.7%).
| Occupation | Male | Female |
| Healthcare Support | 0 (0.0%) | 171 (100.0%) |
| Security & Protection | 42 (75.0%) | 14 (25.0%) |
| Firefighting & Prevention | 27 (100.0%) | 0 (0.0%) |
| Law Enforcement | 15 (51.7%) | 14 (48.3%) |
| Food Preparation & Serving | 79 (26.3%) | 222 (73.8%) |
| Cleaning & Maintenance | 34 (49.3%) | 35 (50.7%) |
| Personal Care & Service | 40 (65.6%) | 21 (34.4%) |
| Total (Category) | 195 (29.6%) | 463 (70.4%) |
| Total (Overall) | 2,002 (50.3%) | 1,980 (49.7%) |
Sales and Office Occupations
The most common Sales and Office occupations in York are Office & Administration (356 | 8.9%), and Sales & Related (168 | 4.2%).
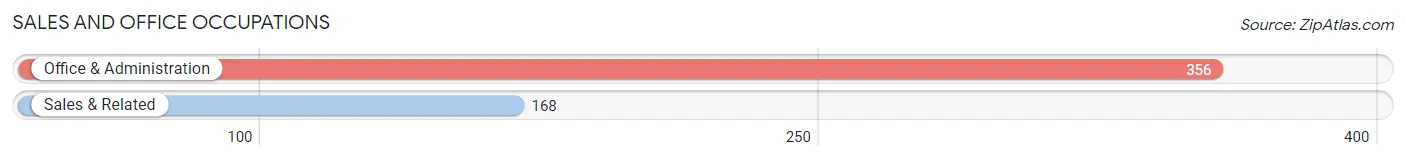
Sales and Office Occupations by Sex
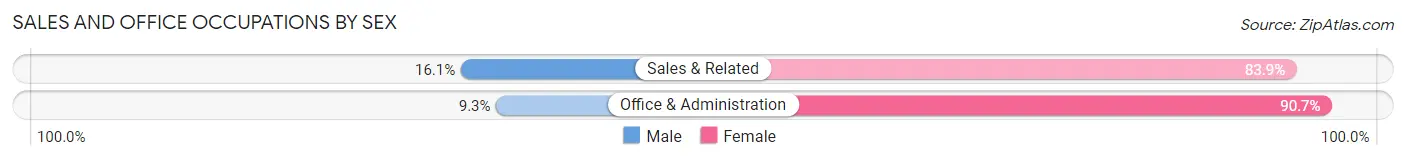
| Occupation | Male | Female |
| Sales & Related | 27 (16.1%) | 141 (83.9%) |
| Office & Administration | 33 (9.3%) | 323 (90.7%) |
| Total (Category) | 60 (11.5%) | 464 (88.5%) |
| Total (Overall) | 2,002 (50.3%) | 1,980 (49.7%) |
Natural Resources, Construction and Maintenance Occupations
The most common Natural Resources, Construction and Maintenance occupations in York are Construction & Extraction (329 | 8.3%), and Installation, Maintenance & Repair (200 | 5.0%).
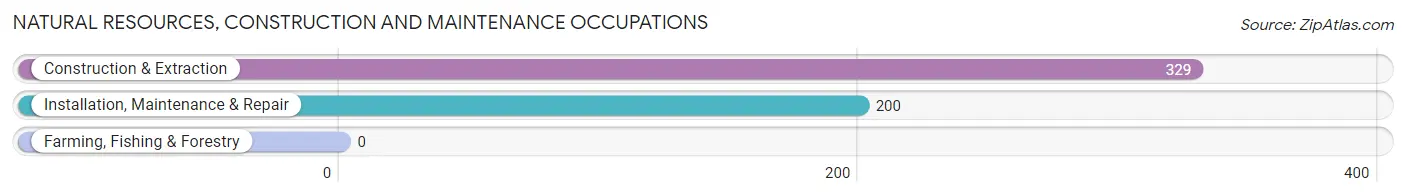
Natural Resources, Construction and Maintenance Occupations by Sex
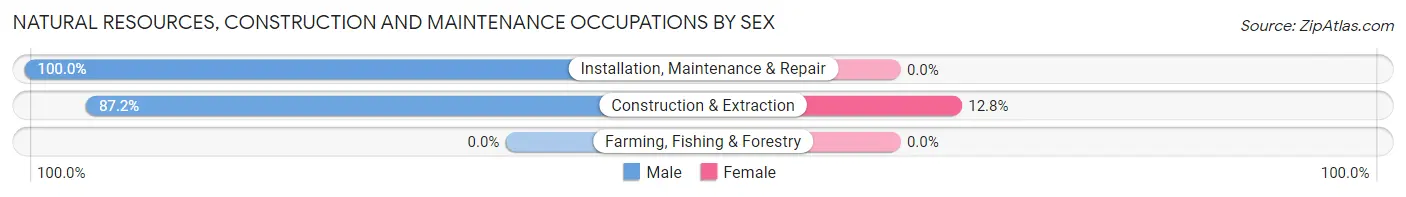
| Occupation | Male | Female |
| Farming, Fishing & Forestry | 0 (0.0%) | 0 (0.0%) |
| Construction & Extraction | 287 (87.2%) | 42 (12.8%) |
| Installation, Maintenance & Repair | 200 (100.0%) | 0 (0.0%) |
| Total (Category) | 487 (92.1%) | 42 (7.9%) |
| Total (Overall) | 2,002 (50.3%) | 1,980 (49.7%) |
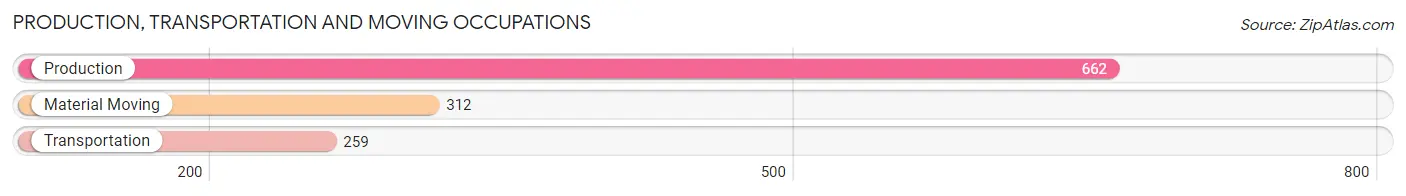
Production, Transportation and Moving Occupations
The most common Production, Transportation and Moving occupations in York are Production (662 | 16.6%), Material Moving (312 | 7.8%), and Transportation (259 | 6.5%).
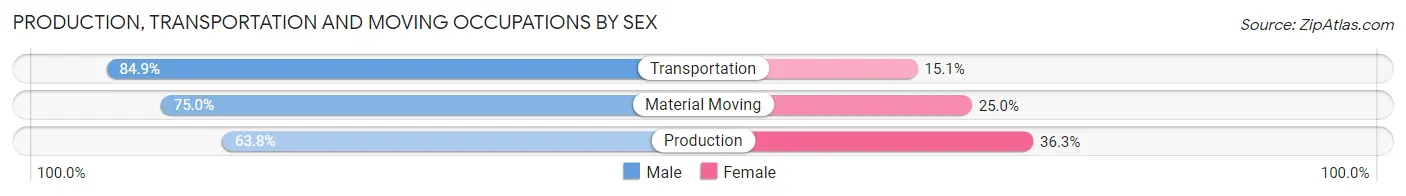
Production, Transportation and Moving Occupations by Sex
| Occupation | Male | Female |
| Production | 422 (63.7%) | 240 (36.2%) |
| Transportation | 220 (84.9%) | 39 (15.1%) |
| Material Moving | 234 (75.0%) | 78 (25.0%) |
| Total (Category) | 876 (71.1%) | 357 (28.9%) |
| Total (Overall) | 2,002 (50.3%) | 1,980 (49.7%) |
Employment Industries by Sex in York
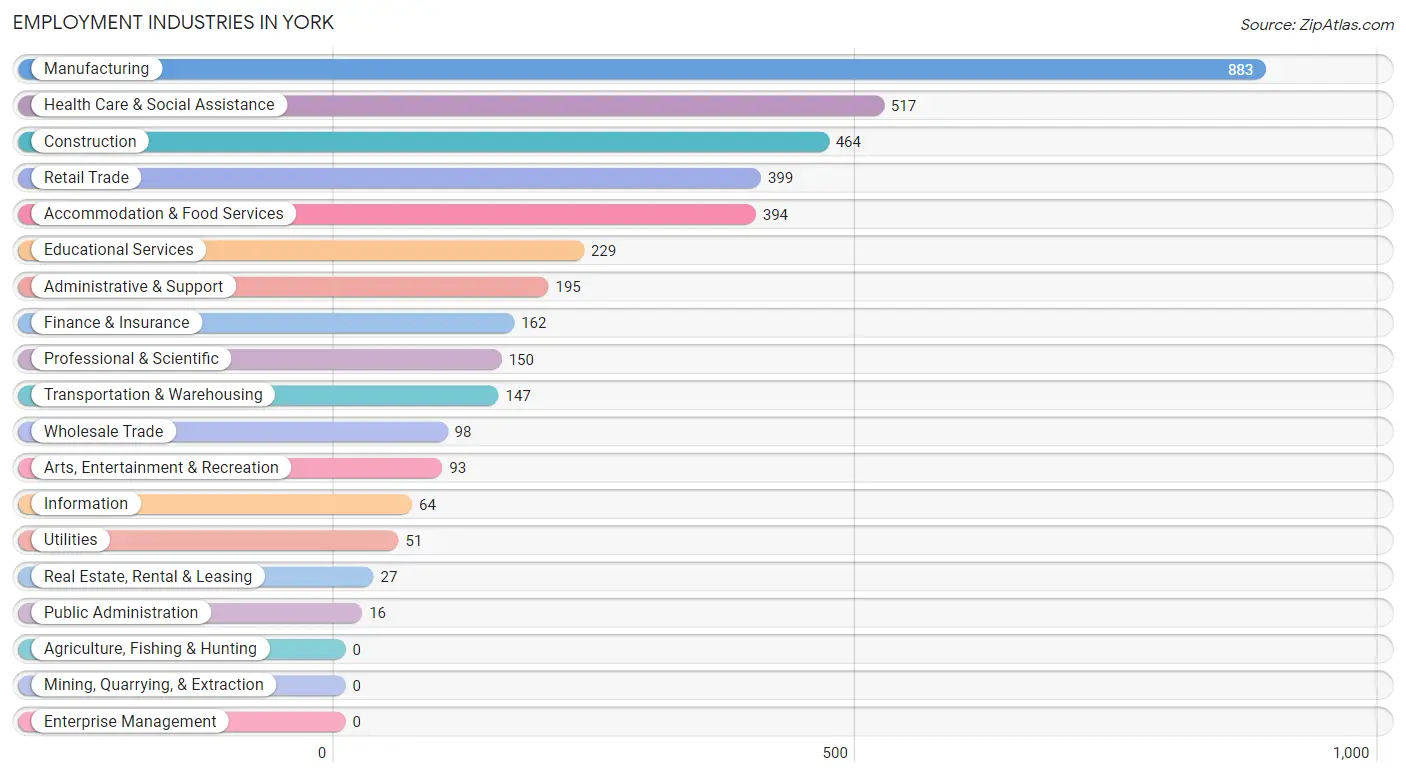
Employment Industries in York
The major employment industries in York include Manufacturing (883 | 22.2%), Health Care & Social Assistance (517 | 13.0%), Construction (464 | 11.7%), Retail Trade (399 | 10.0%), and Accommodation & Food Services (394 | 9.9%).
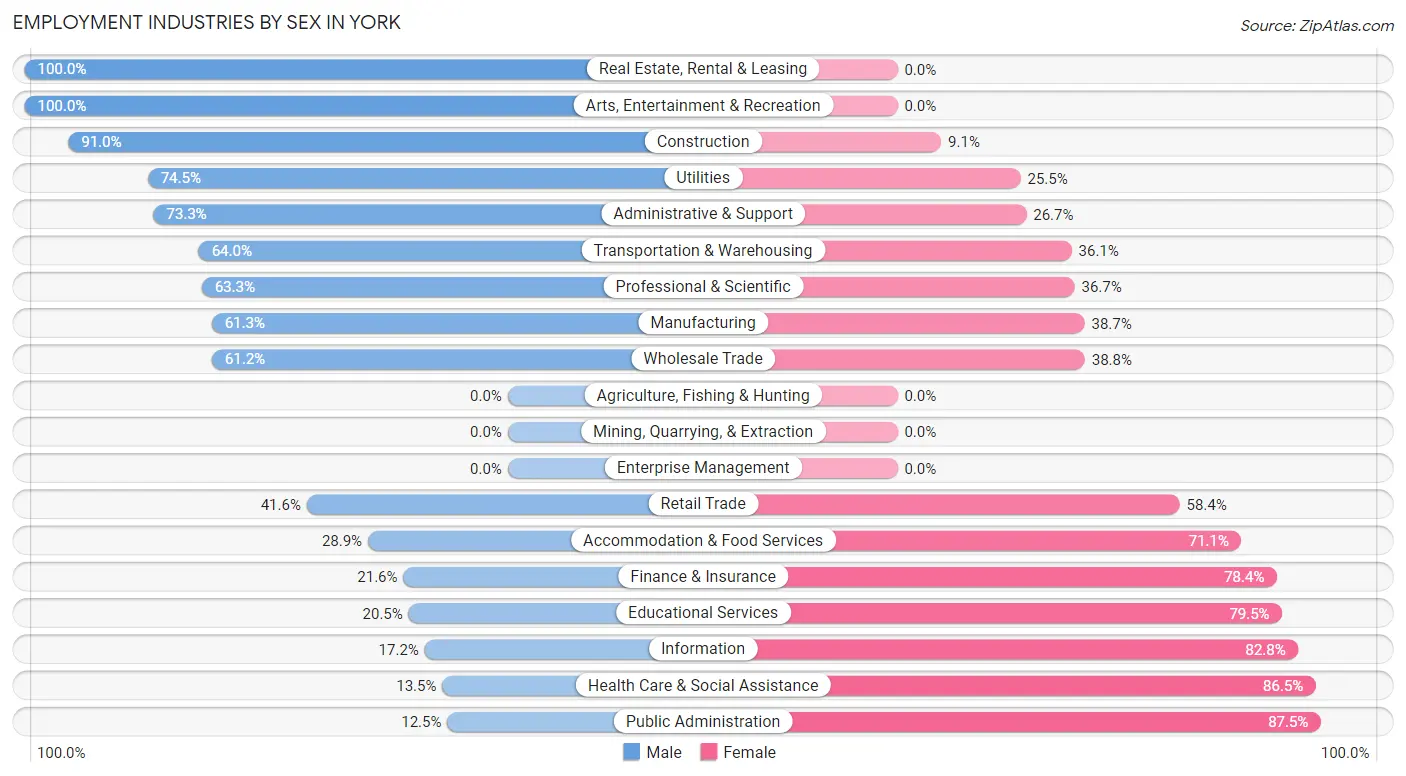
Employment Industries by Sex in York
The York industries that see more men than women are Real Estate, Rental & Leasing (100.0%), Arts, Entertainment & Recreation (100.0%), and Construction (90.9%), whereas the industries that tend to have a higher number of women are Public Administration (87.5%), Health Care & Social Assistance (86.5%), and Information (82.8%).
| Industry | Male | Female |
| Agriculture, Fishing & Hunting | 0 (0.0%) | 0 (0.0%) |
| Mining, Quarrying, & Extraction | 0 (0.0%) | 0 (0.0%) |
| Construction | 422 (90.9%) | 42 (9.0%) |
| Manufacturing | 541 (61.3%) | 342 (38.7%) |
| Wholesale Trade | 60 (61.2%) | 38 (38.8%) |
| Retail Trade | 166 (41.6%) | 233 (58.4%) |
| Transportation & Warehousing | 94 (63.9%) | 53 (36.0%) |
| Utilities | 38 (74.5%) | 13 (25.5%) |
| Information | 11 (17.2%) | 53 (82.8%) |
| Finance & Insurance | 35 (21.6%) | 127 (78.4%) |
| Real Estate, Rental & Leasing | 27 (100.0%) | 0 (0.0%) |
| Professional & Scientific | 95 (63.3%) | 55 (36.7%) |
| Enterprise Management | 0 (0.0%) | 0 (0.0%) |
| Administrative & Support | 143 (73.3%) | 52 (26.7%) |
| Educational Services | 47 (20.5%) | 182 (79.5%) |
| Health Care & Social Assistance | 70 (13.5%) | 447 (86.5%) |
| Arts, Entertainment & Recreation | 93 (100.0%) | 0 (0.0%) |
| Accommodation & Food Services | 114 (28.9%) | 280 (71.1%) |
| Public Administration | 2 (12.5%) | 14 (87.5%) |
| Total | 2,002 (50.3%) | 1,980 (49.7%) |
Education in York
School Enrollment in York
The most common levels of schooling among the 2,026 students in York are middle school (628 | 31.0%), elementary school (571 | 28.2%), and high school (404 | 19.9%).
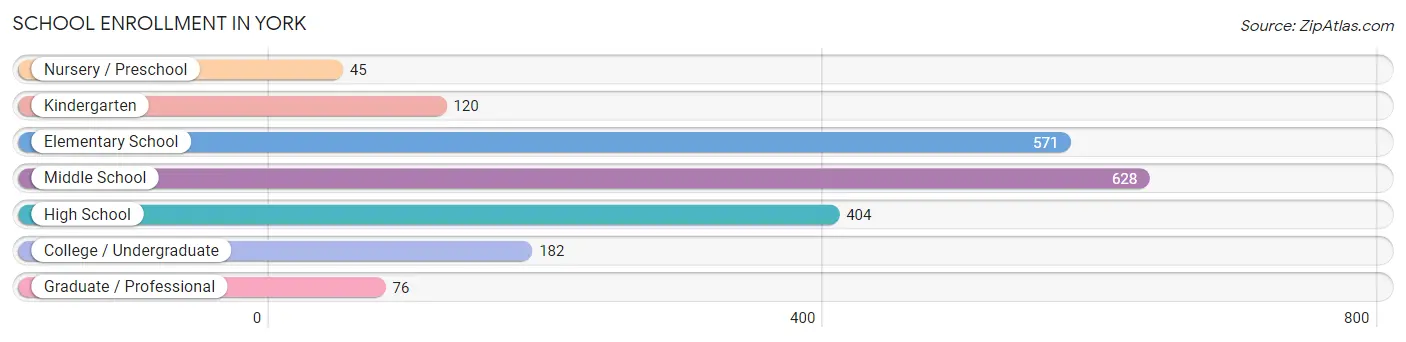
| School Level | # Students | % Students |
| Nursery / Preschool | 45 | 2.2% |
| Kindergarten | 120 | 5.9% |
| Elementary School | 571 | 28.2% |
| Middle School | 628 | 31.0% |
| High School | 404 | 19.9% |
| College / Undergraduate | 182 | 9.0% |
| Graduate / Professional | 76 | 3.7% |
| Total | 2,026 | 100.0% |
School Enrollment by Age by Funding Source in York
Out of a total of 2,026 students who are enrolled in schools in York, 233 (11.5%) attend a private institution, while the remaining 1,793 (88.5%) are enrolled in public schools. The age group of 20 to 24 year olds has the highest likelihood of being enrolled in private schools, with 46 (34.6% in the age bracket) enrolled. Conversely, the age group of 18 to 19 year olds has the lowest likelihood of being enrolled in a private school, with 106 (100.0% in the age bracket) attending a public institution.
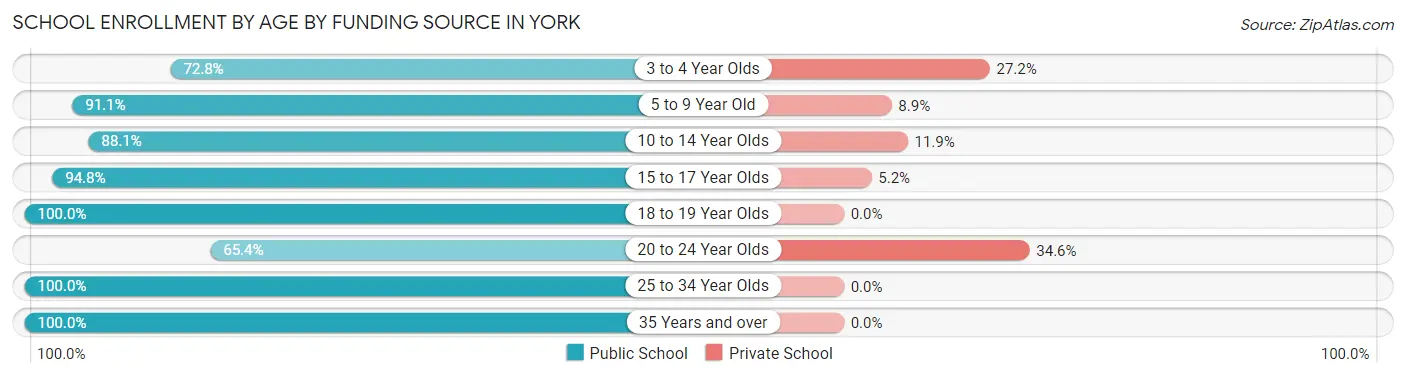
| Age Bracket | Public School | Private School |
| 3 to 4 Year Olds | 67 (72.8%) | 25 (27.2%) |
| 5 to 9 Year Old | 410 (91.1%) | 40 (8.9%) |
| 10 to 14 Year Olds | 808 (88.1%) | 109 (11.9%) |
| 15 to 17 Year Olds | 239 (94.8%) | 13 (5.2%) |
| 18 to 19 Year Olds | 106 (100.0%) | 0 (0.0%) |
| 20 to 24 Year Olds | 87 (65.4%) | 46 (34.6%) |
| 25 to 34 Year Olds | 36 (100.0%) | 0 (0.0%) |
| 35 Years and over | 40 (100.0%) | 0 (0.0%) |
| Total | 1,793 (88.5%) | 233 (11.5%) |
Educational Attainment by Field of Study in York
Business (268 | 25.3%), education (125 | 11.8%), bio, nature & agricultural (107 | 10.1%), arts & humanities (103 | 9.7%), and physical & health sciences (93 | 8.8%) are the most common fields of study among 1,061 individuals in York who have obtained a bachelor's degree or higher.
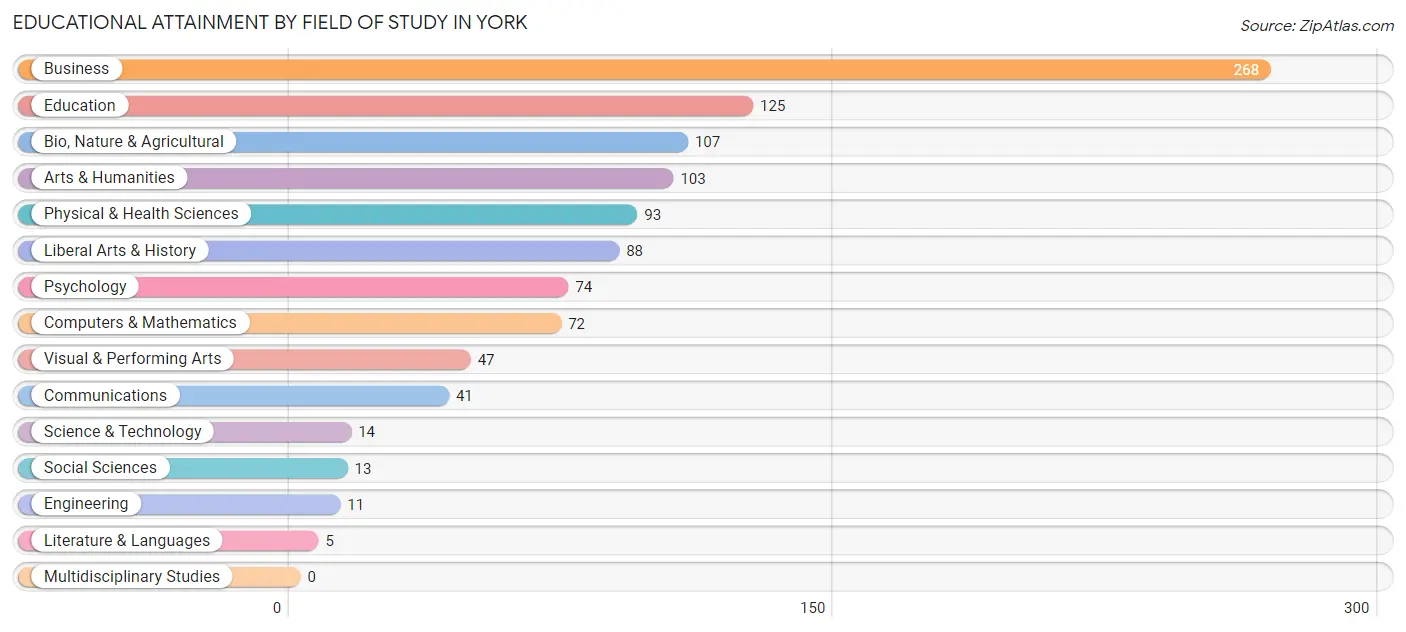
| Field of Study | # Graduates | % Graduates |
| Computers & Mathematics | 72 | 6.8% |
| Bio, Nature & Agricultural | 107 | 10.1% |
| Physical & Health Sciences | 93 | 8.8% |
| Psychology | 74 | 7.0% |
| Social Sciences | 13 | 1.2% |
| Engineering | 11 | 1.0% |
| Multidisciplinary Studies | 0 | 0.0% |
| Science & Technology | 14 | 1.3% |
| Business | 268 | 25.3% |
| Education | 125 | 11.8% |
| Literature & Languages | 5 | 0.5% |
| Liberal Arts & History | 88 | 8.3% |
| Visual & Performing Arts | 47 | 4.4% |
| Communications | 41 | 3.9% |
| Arts & Humanities | 103 | 9.7% |
| Total | 1,061 | 100.0% |
Transportation & Commute in York
Vehicle Availability by Sex in York
The most prevalent vehicle ownership categories in York are males with 2 vehicles (974, accounting for 49.1%) and females with 2 vehicles (773, making up 50.0%).
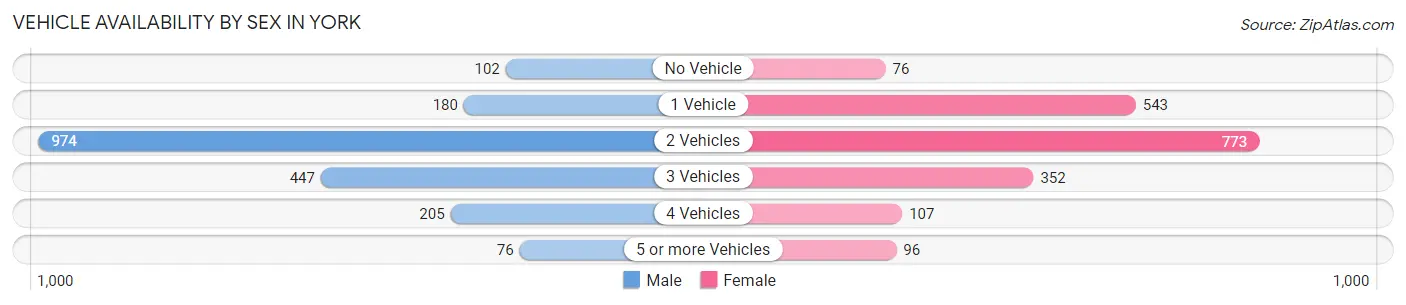
| Vehicles Available | Male | Female |
| No Vehicle | 102 (5.1%) | 76 (3.9%) |
| 1 Vehicle | 180 (9.1%) | 543 (27.9%) |
| 2 Vehicles | 974 (49.1%) | 773 (39.7%) |
| 3 Vehicles | 447 (22.5%) | 352 (18.1%) |
| 4 Vehicles | 205 (10.3%) | 107 (5.5%) |
| 5 or more Vehicles | 76 (3.8%) | 96 (4.9%) |
| Total | 1,984 (100.0%) | 1,947 (100.0%) |
Commute Time in York
The most frequently occuring commute durations in York are 45 to 59 minutes (659 commuters, 17.3%), 30 to 34 minutes (522 commuters, 13.7%), and 5 to 9 minutes (419 commuters, 11.0%).
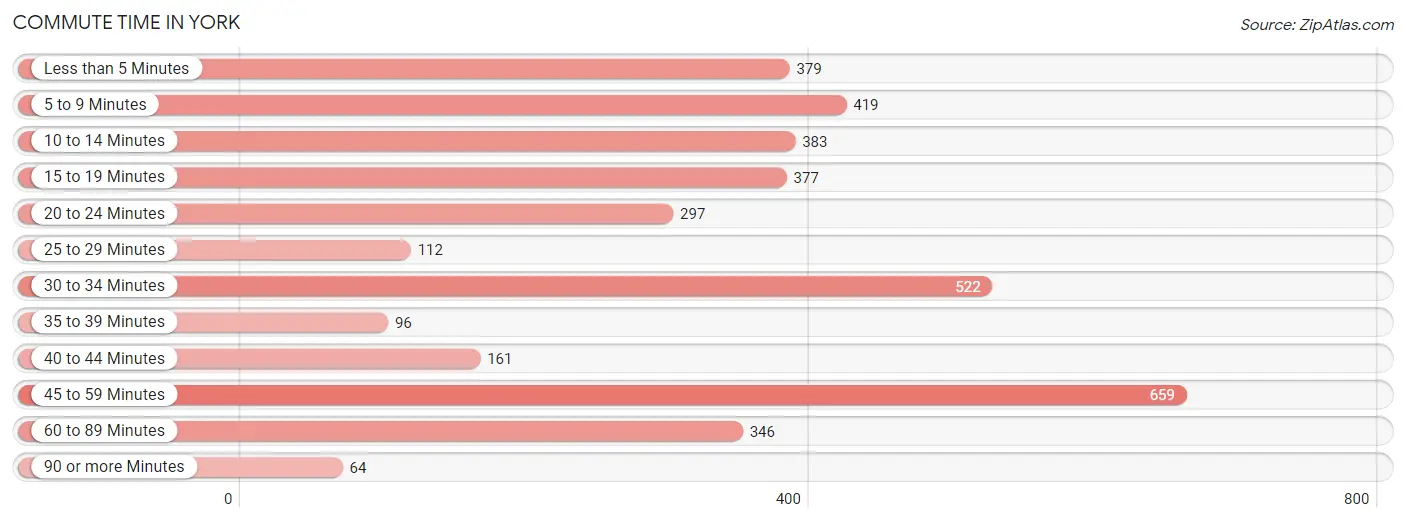
| Commute Time | # Commuters | % Commuters |
| Less than 5 Minutes | 379 | 9.9% |
| 5 to 9 Minutes | 419 | 11.0% |
| 10 to 14 Minutes | 383 | 10.0% |
| 15 to 19 Minutes | 377 | 9.9% |
| 20 to 24 Minutes | 297 | 7.8% |
| 25 to 29 Minutes | 112 | 2.9% |
| 30 to 34 Minutes | 522 | 13.7% |
| 35 to 39 Minutes | 96 | 2.5% |
| 40 to 44 Minutes | 161 | 4.2% |
| 45 to 59 Minutes | 659 | 17.3% |
| 60 to 89 Minutes | 346 | 9.1% |
| 90 or more Minutes | 64 | 1.7% |
Commute Time by Sex in York
The most common commute times in York are 45 to 59 minutes (337 commuters, 17.2%) for males and 45 to 59 minutes (322 commuters, 17.3%) for females.
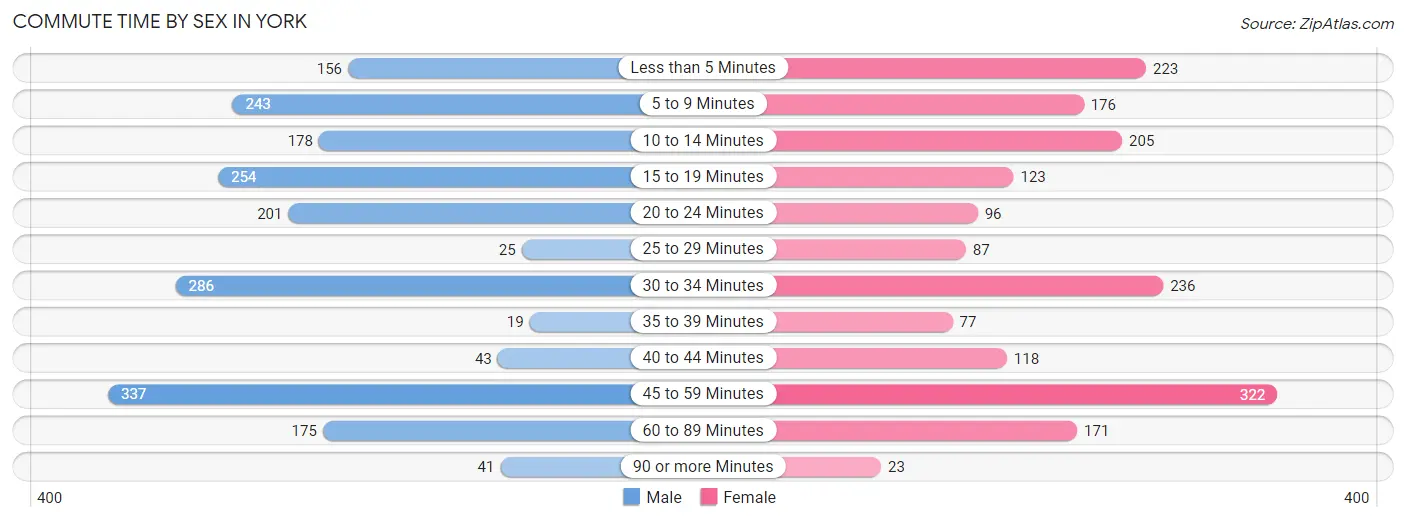
| Commute Time | Male | Female |
| Less than 5 Minutes | 156 (8.0%) | 223 (12.0%) |
| 5 to 9 Minutes | 243 (12.4%) | 176 (9.5%) |
| 10 to 14 Minutes | 178 (9.1%) | 205 (11.0%) |
| 15 to 19 Minutes | 254 (13.0%) | 123 (6.6%) |
| 20 to 24 Minutes | 201 (10.3%) | 96 (5.2%) |
| 25 to 29 Minutes | 25 (1.3%) | 87 (4.7%) |
| 30 to 34 Minutes | 286 (14.6%) | 236 (12.7%) |
| 35 to 39 Minutes | 19 (1.0%) | 77 (4.2%) |
| 40 to 44 Minutes | 43 (2.2%) | 118 (6.4%) |
| 45 to 59 Minutes | 337 (17.2%) | 322 (17.3%) |
| 60 to 89 Minutes | 175 (8.9%) | 171 (9.2%) |
| 90 or more Minutes | 41 (2.1%) | 23 (1.2%) |
Time of Departure to Work by Sex in York
The most frequent times of departure to work in York are 6:00 AM to 6:29 AM (372, 19.0%) for males and 6:00 AM to 6:29 AM (226, 12.2%) for females.
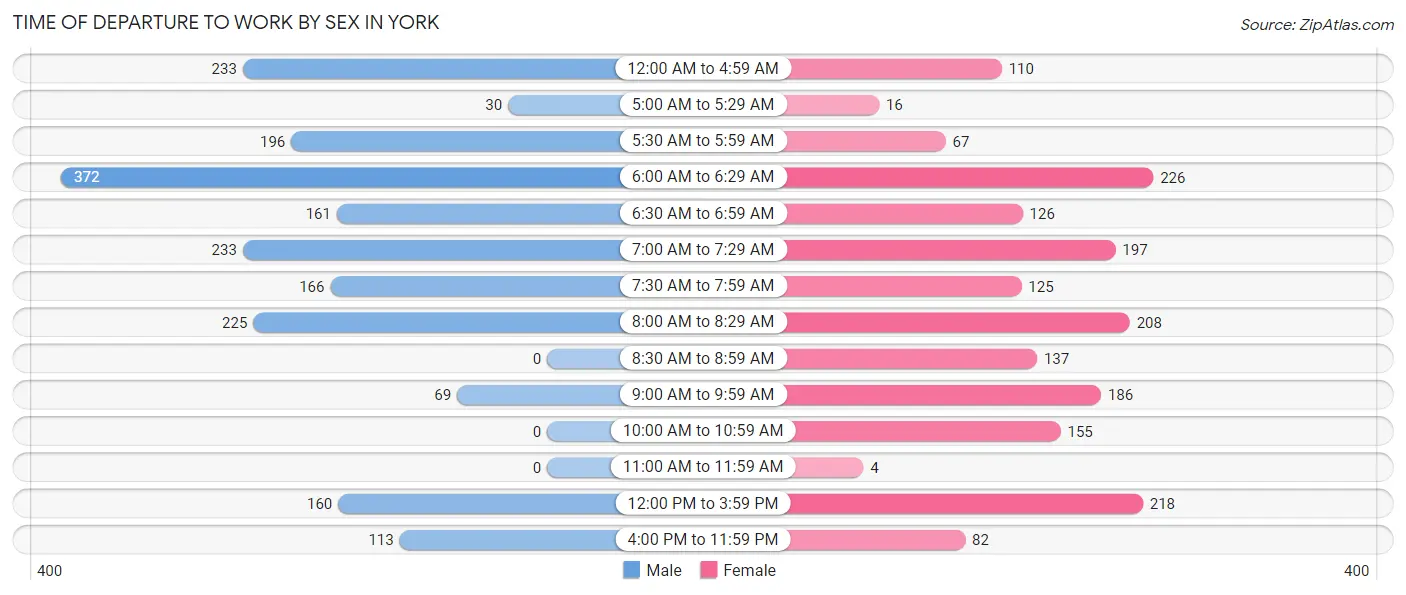
| Time of Departure | Male | Female |
| 12:00 AM to 4:59 AM | 233 (11.9%) | 110 (5.9%) |
| 5:00 AM to 5:29 AM | 30 (1.5%) | 16 (0.9%) |
| 5:30 AM to 5:59 AM | 196 (10.0%) | 67 (3.6%) |
| 6:00 AM to 6:29 AM | 372 (19.0%) | 226 (12.2%) |
| 6:30 AM to 6:59 AM | 161 (8.2%) | 126 (6.8%) |
| 7:00 AM to 7:29 AM | 233 (11.9%) | 197 (10.6%) |
| 7:30 AM to 7:59 AM | 166 (8.5%) | 125 (6.7%) |
| 8:00 AM to 8:29 AM | 225 (11.5%) | 208 (11.2%) |
| 8:30 AM to 8:59 AM | 0 (0.0%) | 137 (7.4%) |
| 9:00 AM to 9:59 AM | 69 (3.5%) | 186 (10.0%) |
| 10:00 AM to 10:59 AM | 0 (0.0%) | 155 (8.4%) |
| 11:00 AM to 11:59 AM | 0 (0.0%) | 4 (0.2%) |
| 12:00 PM to 3:59 PM | 160 (8.2%) | 218 (11.7%) |
| 4:00 PM to 11:59 PM | 113 (5.8%) | 82 (4.4%) |
| Total | 1,958 (100.0%) | 1,857 (100.0%) |
Housing Occupancy in York
Occupancy by Ownership in York
Of the total 3,312 dwellings in York, owner-occupied units account for 2,093 (63.2%), while renter-occupied units make up 1,219 (36.8%).
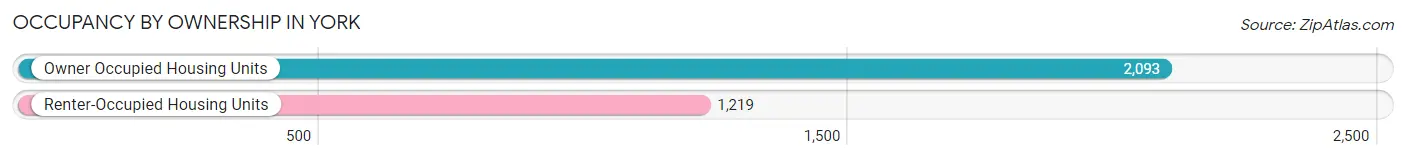
| Occupancy | # Housing Units | % Housing Units |
| Owner Occupied Housing Units | 2,093 | 63.2% |
| Renter-Occupied Housing Units | 1,219 | 36.8% |
| Total Occupied Housing Units | 3,312 | 100.0% |
Occupancy by Household Size in York
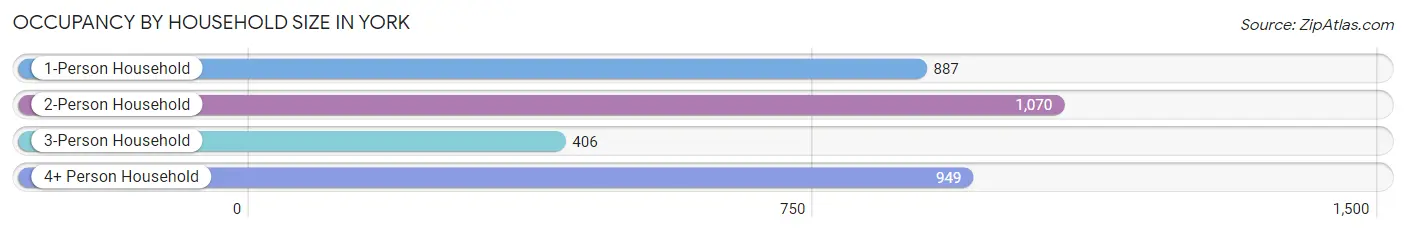
| Household Size | # Housing Units | % Housing Units |
| 1-Person Household | 887 | 26.8% |
| 2-Person Household | 1,070 | 32.3% |
| 3-Person Household | 406 | 12.3% |
| 4+ Person Household | 949 | 28.6% |
| Total Housing Units | 3,312 | 100.0% |
Occupancy by Ownership by Household Size in York
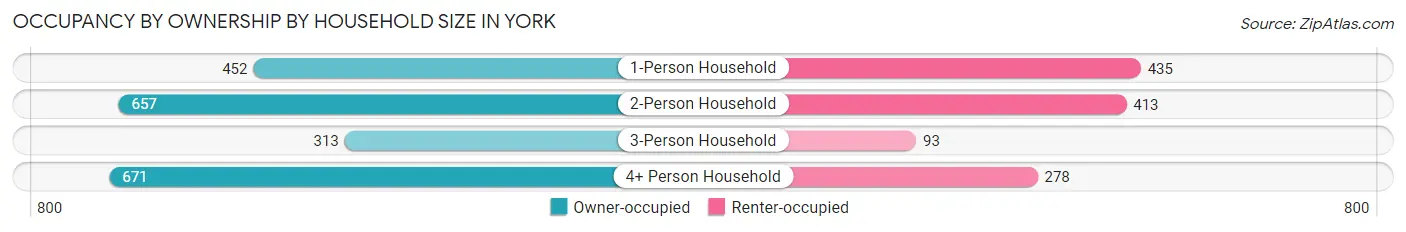
| Household Size | Owner-occupied | Renter-occupied |
| 1-Person Household | 452 (51.0%) | 435 (49.0%) |
| 2-Person Household | 657 (61.4%) | 413 (38.6%) |
| 3-Person Household | 313 (77.1%) | 93 (22.9%) |
| 4+ Person Household | 671 (70.7%) | 278 (29.3%) |
| Total Housing Units | 2,093 (63.2%) | 1,219 (36.8%) |
Occupancy by Educational Attainment in York
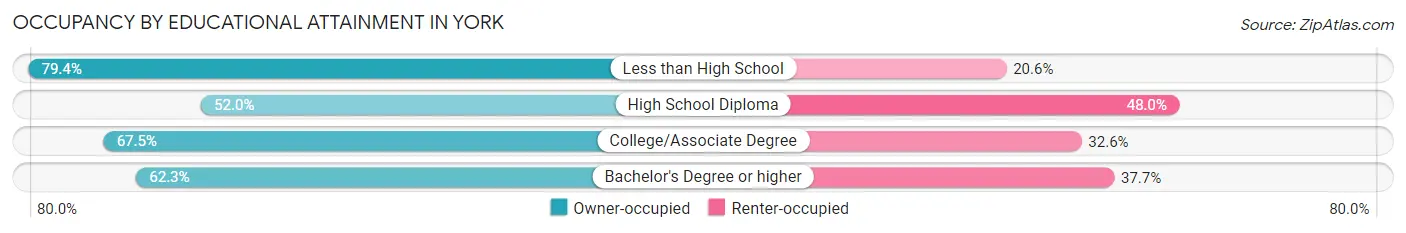
| Household Size | Owner-occupied | Renter-occupied |
| Less than High School | 400 (79.4%) | 104 (20.6%) |
| High School Diploma | 572 (52.0%) | 528 (48.0%) |
| College/Associate Degree | 748 (67.4%) | 361 (32.6%) |
| Bachelor's Degree or higher | 373 (62.3%) | 226 (37.7%) |
Occupancy by Age of Householder in York
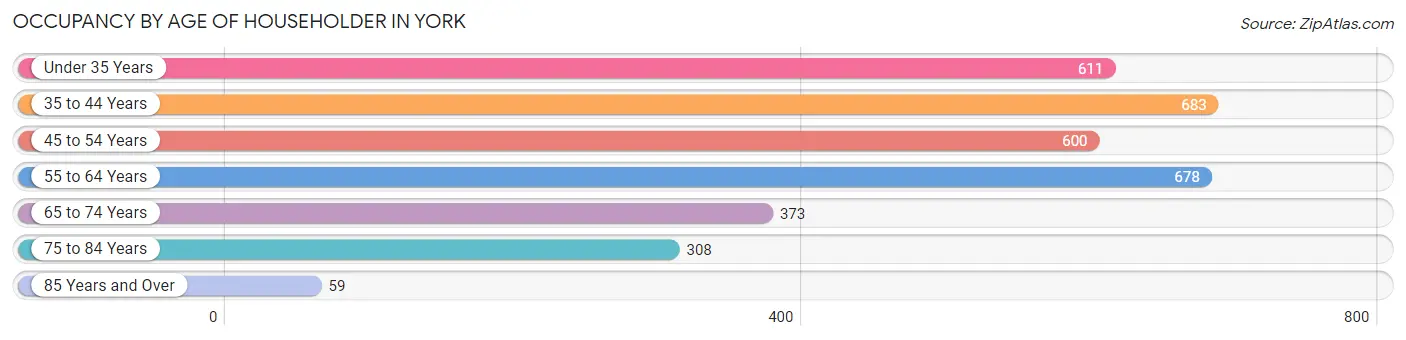
| Age Bracket | # Households | % Households |
| Under 35 Years | 611 | 18.4% |
| 35 to 44 Years | 683 | 20.6% |
| 45 to 54 Years | 600 | 18.1% |
| 55 to 64 Years | 678 | 20.5% |
| 65 to 74 Years | 373 | 11.3% |
| 75 to 84 Years | 308 | 9.3% |
| 85 Years and Over | 59 | 1.8% |
| Total | 3,312 | 100.0% |
Housing Finances in York
Median Income by Occupancy in York
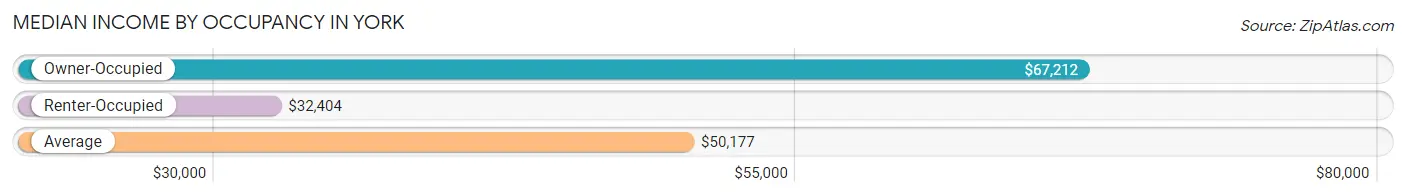
| Occupancy Type | # Households | Median Income |
| Owner-Occupied | 2,093 (63.2%) | $67,212 |
| Renter-Occupied | 1,219 (36.8%) | $32,404 |
| Average | 3,312 (100.0%) | $50,177 |
Occupancy by Householder Income Bracket in York
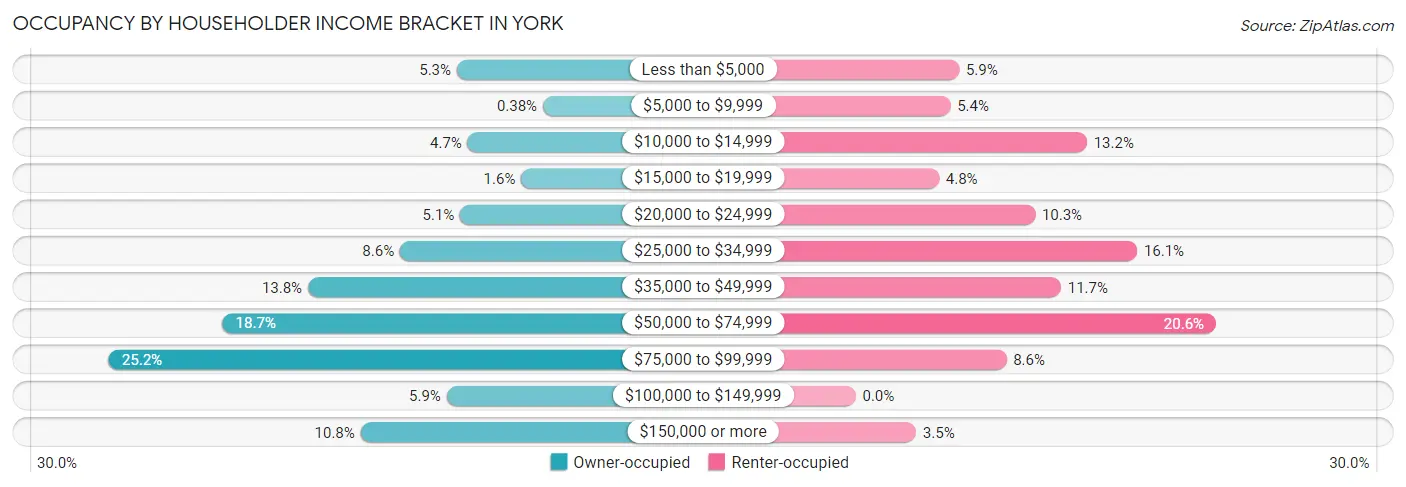
| Income Bracket | Owner-occupied | Renter-occupied |
| Less than $5,000 | 111 (5.3%) | 72 (5.9%) |
| $5,000 to $9,999 | 8 (0.4%) | 66 (5.4%) |
| $10,000 to $14,999 | 98 (4.7%) | 161 (13.2%) |
| $15,000 to $19,999 | 34 (1.6%) | 58 (4.8%) |
| $20,000 to $24,999 | 107 (5.1%) | 125 (10.2%) |
| $25,000 to $34,999 | 179 (8.6%) | 196 (16.1%) |
| $35,000 to $49,999 | 289 (13.8%) | 143 (11.7%) |
| $50,000 to $74,999 | 391 (18.7%) | 251 (20.6%) |
| $75,000 to $99,999 | 527 (25.2%) | 105 (8.6%) |
| $100,000 to $149,999 | 123 (5.9%) | 0 (0.0%) |
| $150,000 or more | 226 (10.8%) | 42 (3.5%) |
| Total | 2,093 (100.0%) | 1,219 (100.0%) |
Monthly Housing Cost Tiers in York
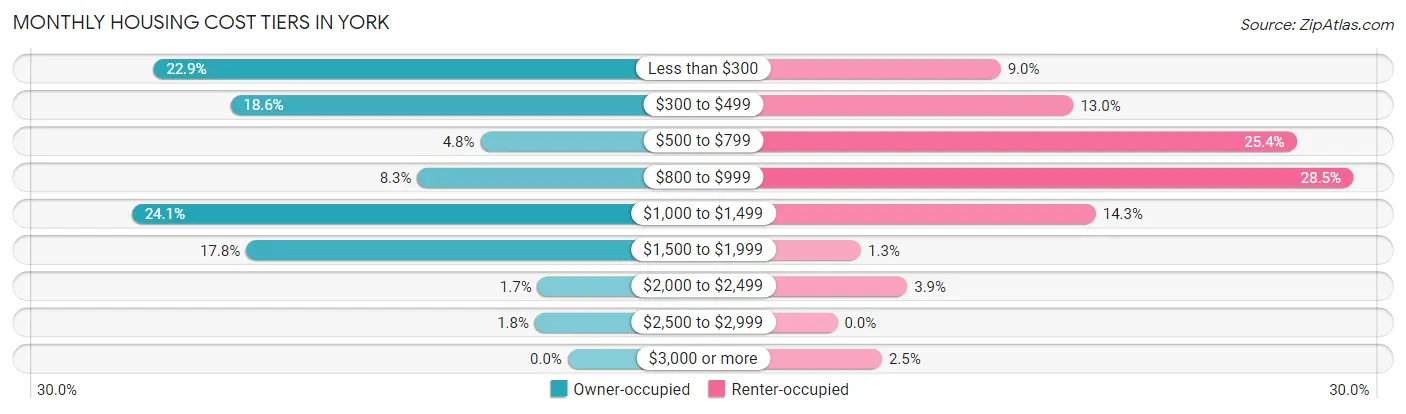
| Monthly Cost | Owner-occupied | Renter-occupied |
| Less than $300 | 479 (22.9%) | 110 (9.0%) |
| $300 to $499 | 390 (18.6%) | 159 (13.0%) |
| $500 to $799 | 101 (4.8%) | 309 (25.4%) |
| $800 to $999 | 174 (8.3%) | 347 (28.5%) |
| $1,000 to $1,499 | 504 (24.1%) | 174 (14.3%) |
| $1,500 to $1,999 | 372 (17.8%) | 16 (1.3%) |
| $2,000 to $2,499 | 35 (1.7%) | 47 (3.9%) |
| $2,500 to $2,999 | 38 (1.8%) | 0 (0.0%) |
| $3,000 or more | 0 (0.0%) | 30 (2.5%) |
| Total | 2,093 (100.0%) | 1,219 (100.0%) |
Physical Housing Characteristics in York
Housing Structures in York
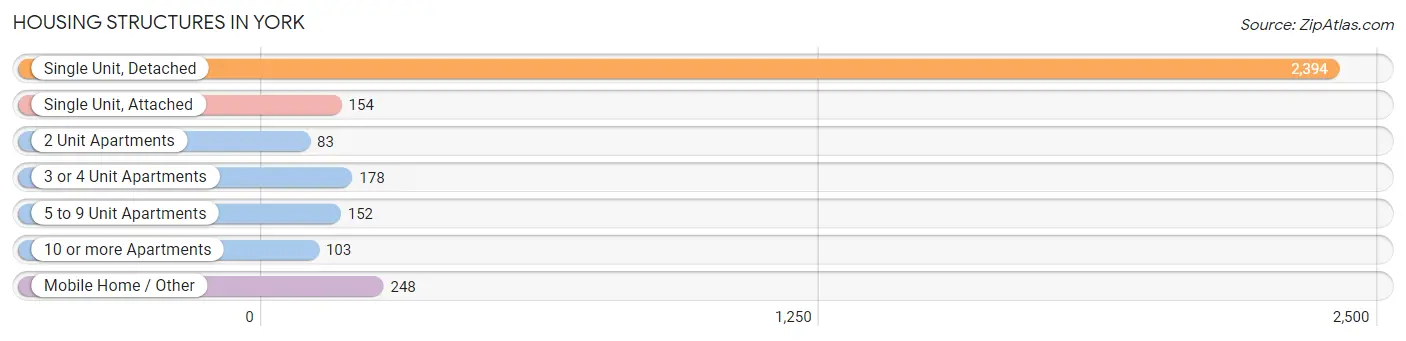
| Structure Type | # Housing Units | % Housing Units |
| Single Unit, Detached | 2,394 | 72.3% |
| Single Unit, Attached | 154 | 4.6% |
| 2 Unit Apartments | 83 | 2.5% |
| 3 or 4 Unit Apartments | 178 | 5.4% |
| 5 to 9 Unit Apartments | 152 | 4.6% |
| 10 or more Apartments | 103 | 3.1% |
| Mobile Home / Other | 248 | 7.5% |
| Total | 3,312 | 100.0% |
Housing Structures by Occupancy in York
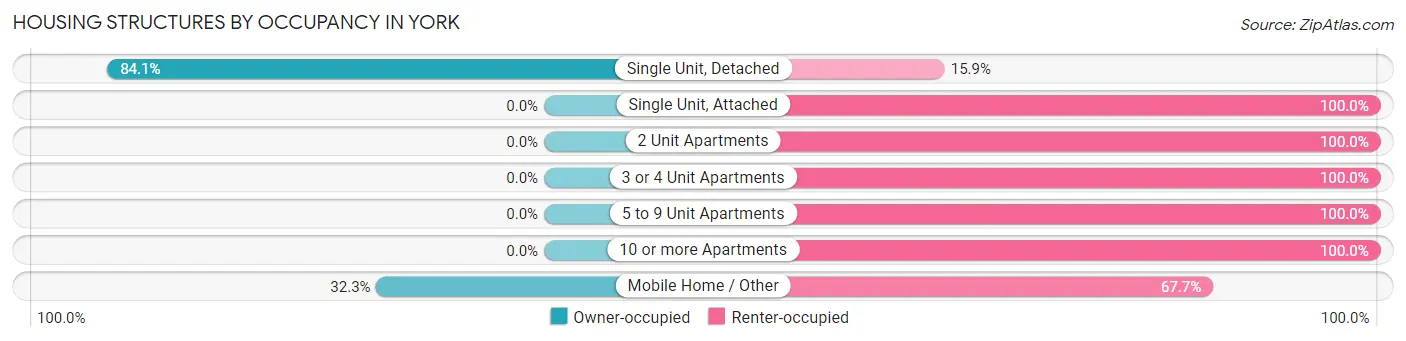
| Structure Type | Owner-occupied | Renter-occupied |
| Single Unit, Detached | 2,013 (84.1%) | 381 (15.9%) |
| Single Unit, Attached | 0 (0.0%) | 154 (100.0%) |
| 2 Unit Apartments | 0 (0.0%) | 83 (100.0%) |
| 3 or 4 Unit Apartments | 0 (0.0%) | 178 (100.0%) |
| 5 to 9 Unit Apartments | 0 (0.0%) | 152 (100.0%) |
| 10 or more Apartments | 0 (0.0%) | 103 (100.0%) |
| Mobile Home / Other | 80 (32.3%) | 168 (67.7%) |
| Total | 2,093 (63.2%) | 1,219 (36.8%) |
Housing Structures by Number of Rooms in York
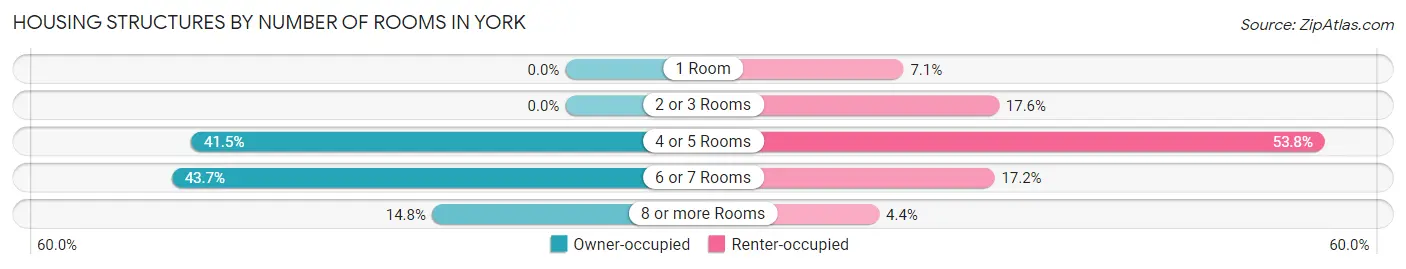
| Number of Rooms | Owner-occupied | Renter-occupied |
| 1 Room | 0 (0.0%) | 86 (7.0%) |
| 2 or 3 Rooms | 0 (0.0%) | 215 (17.6%) |
| 4 or 5 Rooms | 869 (41.5%) | 656 (53.8%) |
| 6 or 7 Rooms | 914 (43.7%) | 209 (17.2%) |
| 8 or more Rooms | 310 (14.8%) | 53 (4.3%) |
| Total | 2,093 (100.0%) | 1,219 (100.0%) |
Housing Structure by Heating Type in York
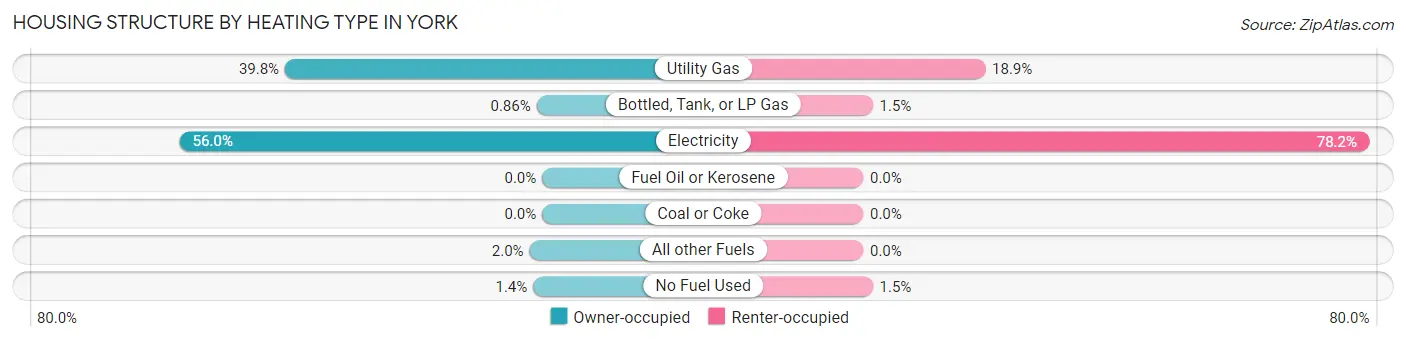
| Heating Type | Owner-occupied | Renter-occupied |
| Utility Gas | 832 (39.8%) | 230 (18.9%) |
| Bottled, Tank, or LP Gas | 18 (0.9%) | 18 (1.5%) |
| Electricity | 1,173 (56.0%) | 953 (78.2%) |
| Fuel Oil or Kerosene | 0 (0.0%) | 0 (0.0%) |
| Coal or Coke | 0 (0.0%) | 0 (0.0%) |
| All other Fuels | 41 (2.0%) | 0 (0.0%) |
| No Fuel Used | 29 (1.4%) | 18 (1.5%) |
| Total | 2,093 (100.0%) | 1,219 (100.0%) |
Household Vehicle Usage in York
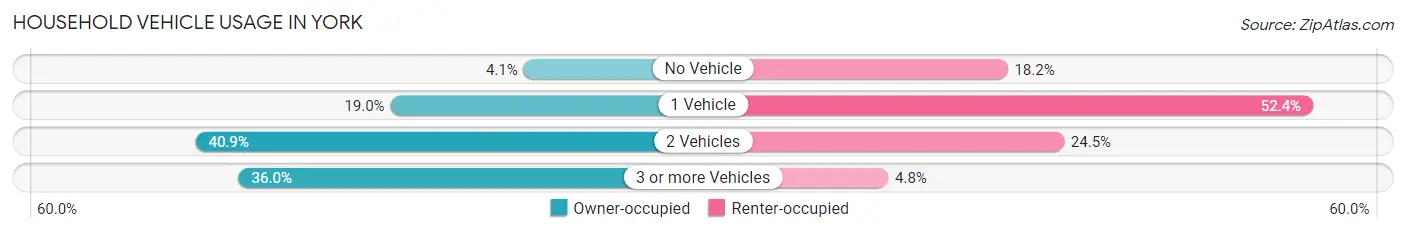
| Vehicles per Household | Owner-occupied | Renter-occupied |
| No Vehicle | 86 (4.1%) | 222 (18.2%) |
| 1 Vehicle | 398 (19.0%) | 639 (52.4%) |
| 2 Vehicles | 855 (40.8%) | 299 (24.5%) |
| 3 or more Vehicles | 754 (36.0%) | 59 (4.8%) |
| Total | 2,093 (100.0%) | 1,219 (100.0%) |
Real Estate & Mortgages in York
Real Estate and Mortgage Overview in York
| Characteristic | Without Mortgage | With Mortgage |
| Housing Units | 923 | 1,170 |
| Median Property Value | $64,700 | $200,500 |
| Median Household Income | $43,818 | $144 |
| Monthly Housing Costs | $282 | $0 |
| Real Estate Taxes | $384 | $57 |
Property Value by Mortgage Status in York
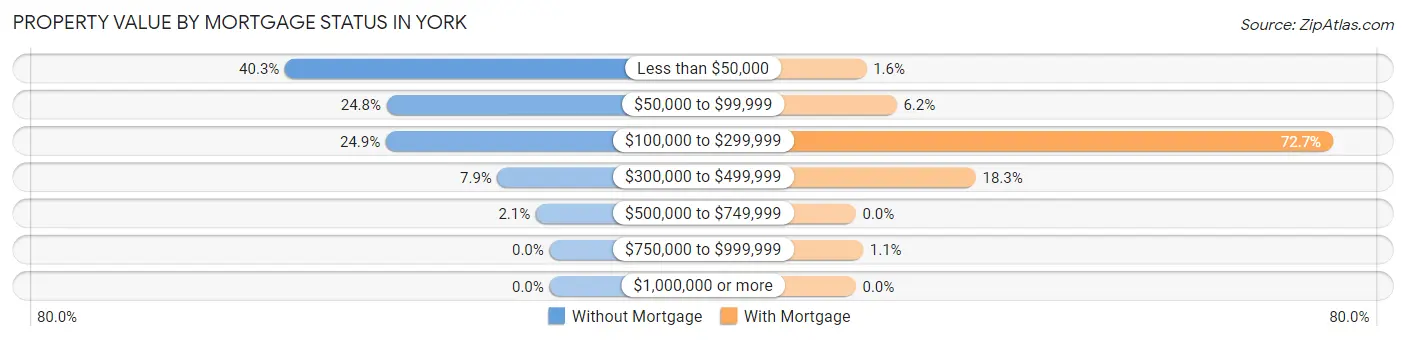
| Property Value | Without Mortgage | With Mortgage |
| Less than $50,000 | 372 (40.3%) | 19 (1.6%) |
| $50,000 to $99,999 | 229 (24.8%) | 73 (6.2%) |
| $100,000 to $299,999 | 230 (24.9%) | 851 (72.7%) |
| $300,000 to $499,999 | 73 (7.9%) | 214 (18.3%) |
| $500,000 to $749,999 | 19 (2.1%) | 0 (0.0%) |
| $750,000 to $999,999 | 0 (0.0%) | 13 (1.1%) |
| $1,000,000 or more | 0 (0.0%) | 0 (0.0%) |
| Total | 923 (100.0%) | 1,170 (100.0%) |
Household Income by Mortgage Status in York
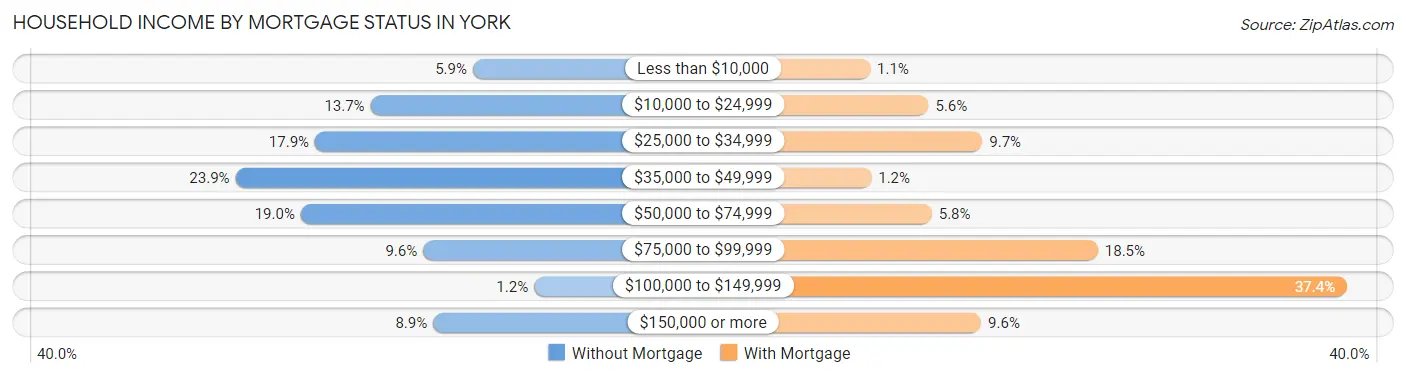
| Household Income | Without Mortgage | With Mortgage |
| Less than $10,000 | 54 (5.9%) | 13 (1.1%) |
| $10,000 to $24,999 | 126 (13.7%) | 65 (5.6%) |
| $25,000 to $34,999 | 165 (17.9%) | 113 (9.7%) |
| $35,000 to $49,999 | 221 (23.9%) | 14 (1.2%) |
| $50,000 to $74,999 | 175 (19.0%) | 68 (5.8%) |
| $75,000 to $99,999 | 89 (9.6%) | 216 (18.5%) |
| $100,000 to $149,999 | 11 (1.2%) | 438 (37.4%) |
| $150,000 or more | 82 (8.9%) | 112 (9.6%) |
| Total | 923 (100.0%) | 1,170 (100.0%) |
Property Value to Household Income Ratio in York
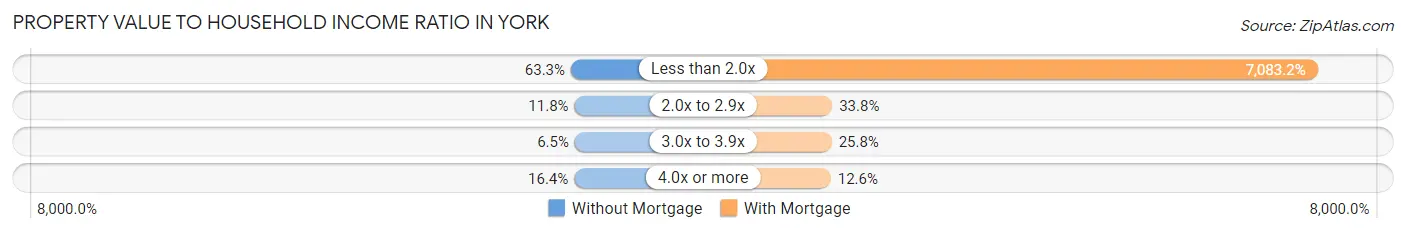
| Value-to-Income Ratio | Without Mortgage | With Mortgage |
| Less than 2.0x | 584 (63.3%) | 82,873 (7,083.2%) |
| 2.0x to 2.9x | 109 (11.8%) | 395 (33.8%) |
| 3.0x to 3.9x | 60 (6.5%) | 302 (25.8%) |
| 4.0x or more | 151 (16.4%) | 147 (12.6%) |
| Total | 923 (100.0%) | 1,170 (100.0%) |
Real Estate Taxes by Mortgage Status in York
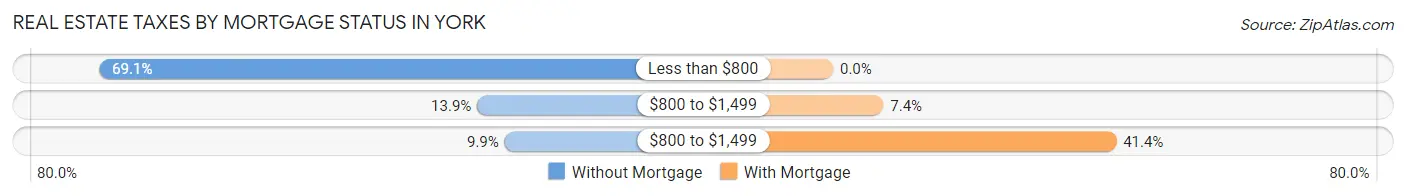
| Property Taxes | Without Mortgage | With Mortgage |
| Less than $800 | 638 (69.1%) | 0 (0.0%) |
| $800 to $1,499 | 128 (13.9%) | 86 (7.3%) |
| $800 to $1,499 | 91 (9.9%) | 484 (41.4%) |
| Total | 923 (100.0%) | 1,170 (100.0%) |
Health & Disability in York
Health Insurance Coverage by Age in York
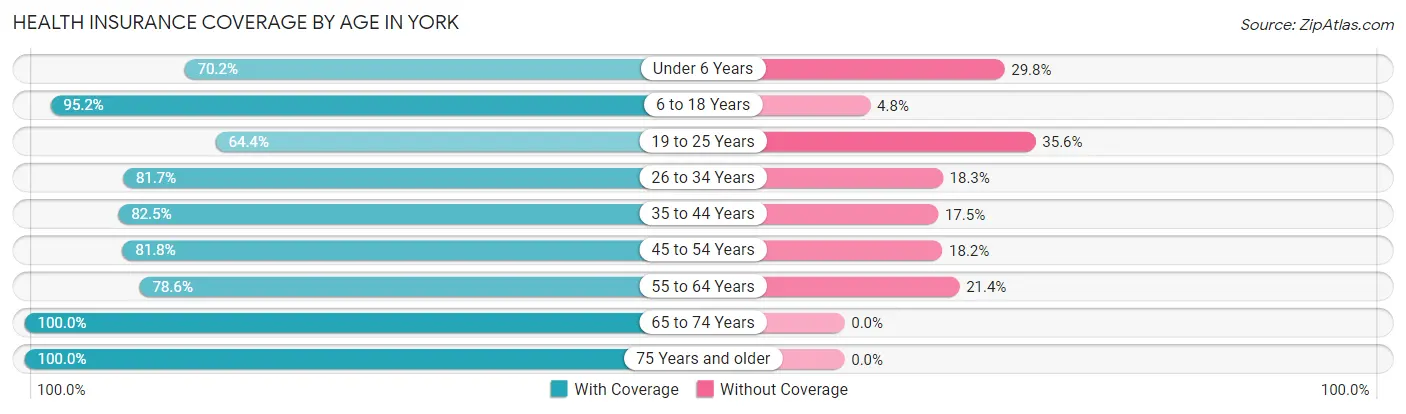
| Age Bracket | With Coverage | Without Coverage |
| Under 6 Years | 381 (70.2%) | 162 (29.8%) |
| 6 to 18 Years | 1,580 (95.2%) | 80 (4.8%) |
| 19 to 25 Years | 589 (64.4%) | 326 (35.6%) |
| 26 to 34 Years | 829 (81.7%) | 186 (18.3%) |
| 35 to 44 Years | 874 (82.5%) | 185 (17.5%) |
| 45 to 54 Years | 807 (81.8%) | 180 (18.2%) |
| 55 to 64 Years | 968 (78.6%) | 264 (21.4%) |
| 65 to 74 Years | 514 (100.0%) | 0 (0.0%) |
| 75 Years and older | 486 (100.0%) | 0 (0.0%) |
| Total | 7,028 (83.6%) | 1,383 (16.4%) |
Health Insurance Coverage by Citizenship Status in York
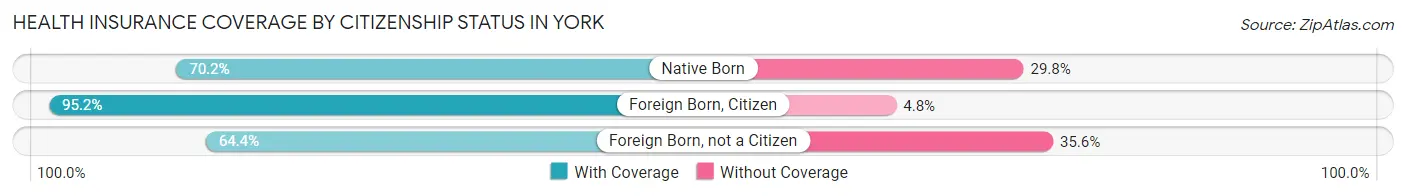
| Citizenship Status | With Coverage | Without Coverage |
| Native Born | 381 (70.2%) | 162 (29.8%) |
| Foreign Born, Citizen | 1,580 (95.2%) | 80 (4.8%) |
| Foreign Born, not a Citizen | 589 (64.4%) | 326 (35.6%) |
Health Insurance Coverage by Household Income in York
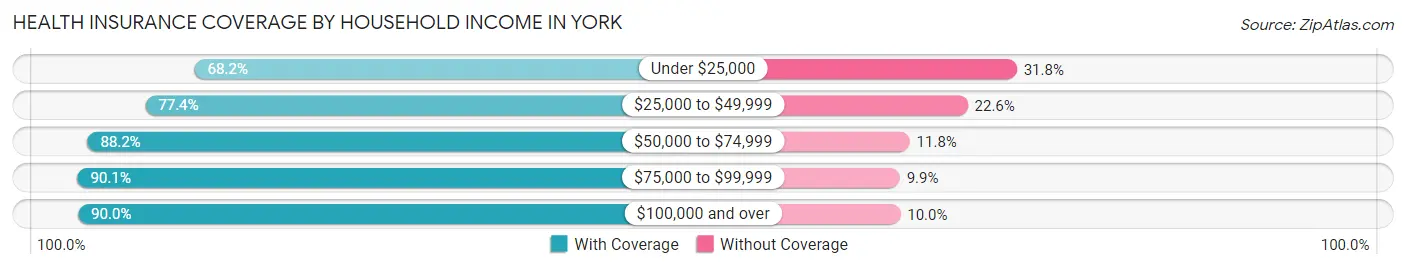
| Household Income | With Coverage | Without Coverage |
| Under $25,000 | 1,002 (68.2%) | 468 (31.8%) |
| $25,000 to $49,999 | 1,207 (77.4%) | 353 (22.6%) |
| $50,000 to $74,999 | 1,408 (88.2%) | 188 (11.8%) |
| $75,000 to $99,999 | 2,079 (90.1%) | 229 (9.9%) |
| $100,000 and over | 1,301 (90.0%) | 145 (10.0%) |
Public vs Private Health Insurance Coverage by Age in York
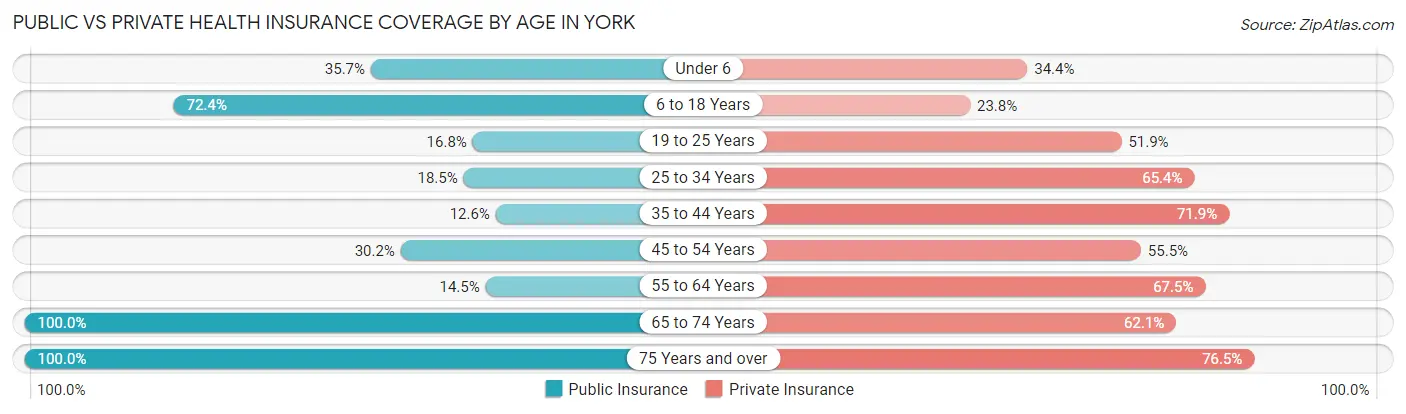
| Age Bracket | Public Insurance | Private Insurance |
| Under 6 | 194 (35.7%) | 187 (34.4%) |
| 6 to 18 Years | 1,201 (72.4%) | 395 (23.8%) |
| 19 to 25 Years | 154 (16.8%) | 475 (51.9%) |
| 25 to 34 Years | 188 (18.5%) | 664 (65.4%) |
| 35 to 44 Years | 133 (12.6%) | 761 (71.9%) |
| 45 to 54 Years | 298 (30.2%) | 548 (55.5%) |
| 55 to 64 Years | 178 (14.4%) | 831 (67.4%) |
| 65 to 74 Years | 514 (100.0%) | 319 (62.1%) |
| 75 Years and over | 486 (100.0%) | 372 (76.5%) |
| Total | 3,346 (39.8%) | 4,552 (54.1%) |
Disability Status by Sex by Age in York
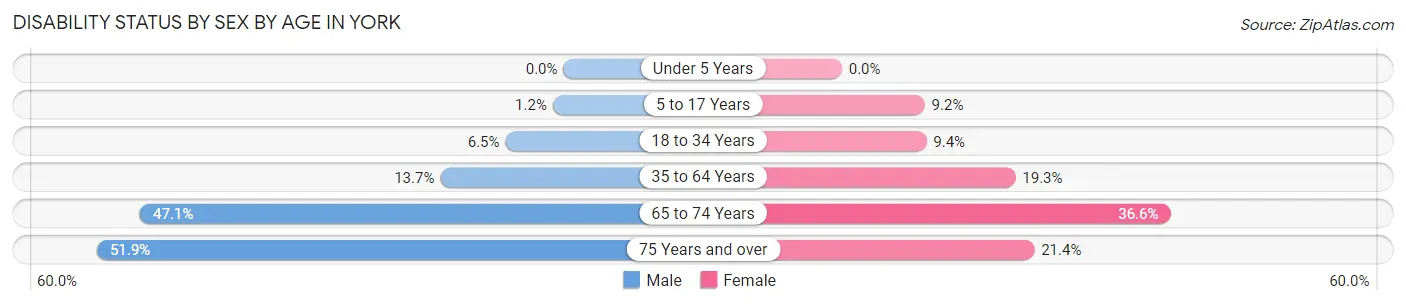
| Age Bracket | Male | Female |
| Under 5 Years | 0 (0.0%) | 0 (0.0%) |
| 5 to 17 Years | 9 (1.2%) | 78 (9.2%) |
| 18 to 34 Years | 69 (6.5%) | 88 (9.4%) |
| 35 to 64 Years | 192 (13.7%) | 363 (19.3%) |
| 65 to 74 Years | 107 (47.1%) | 105 (36.6%) |
| 75 Years and over | 107 (51.9%) | 60 (21.4%) |
Disability Class by Sex by Age in York
Disability Class: Hearing Difficulty
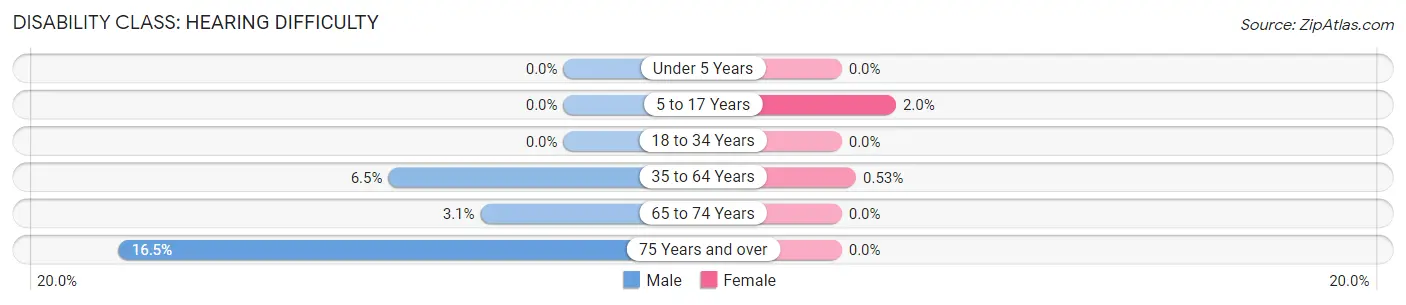
| Age Bracket | Male | Female |
| Under 5 Years | 0 (0.0%) | 0 (0.0%) |
| 5 to 17 Years | 0 (0.0%) | 17 (2.0%) |
| 18 to 34 Years | 0 (0.0%) | 0 (0.0%) |
| 35 to 64 Years | 91 (6.5%) | 10 (0.5%) |
| 65 to 74 Years | 7 (3.1%) | 0 (0.0%) |
| 75 Years and over | 34 (16.5%) | 0 (0.0%) |
Disability Class: Vision Difficulty
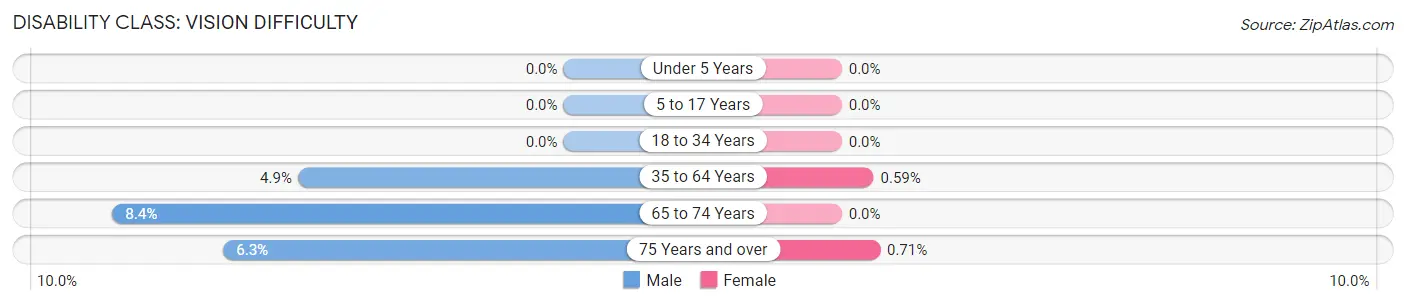
| Age Bracket | Male | Female |
| Under 5 Years | 0 (0.0%) | 0 (0.0%) |
| 5 to 17 Years | 0 (0.0%) | 0 (0.0%) |
| 18 to 34 Years | 0 (0.0%) | 0 (0.0%) |
| 35 to 64 Years | 69 (4.9%) | 11 (0.6%) |
| 65 to 74 Years | 19 (8.4%) | 0 (0.0%) |
| 75 Years and over | 13 (6.3%) | 2 (0.7%) |
Disability Class: Cognitive Difficulty
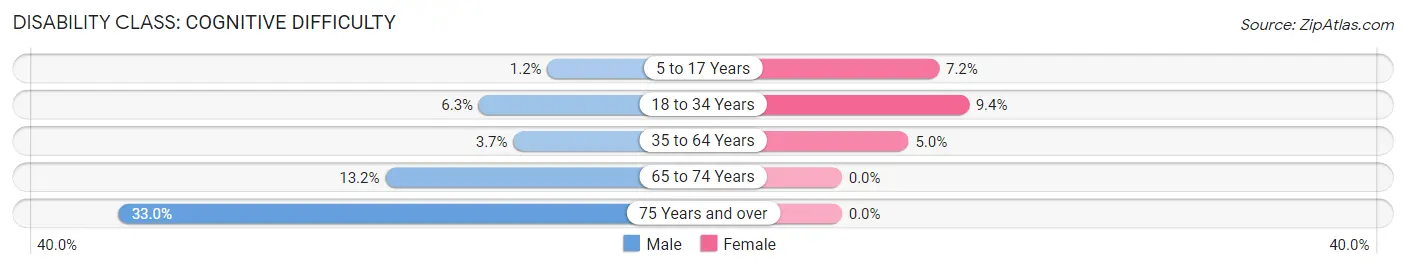
| Age Bracket | Male | Female |
| 5 to 17 Years | 9 (1.2%) | 61 (7.2%) |
| 18 to 34 Years | 67 (6.3%) | 88 (9.4%) |
| 35 to 64 Years | 52 (3.7%) | 93 (5.0%) |
| 65 to 74 Years | 30 (13.2%) | 0 (0.0%) |
| 75 Years and over | 68 (33.0%) | 0 (0.0%) |
Disability Class: Ambulatory Difficulty
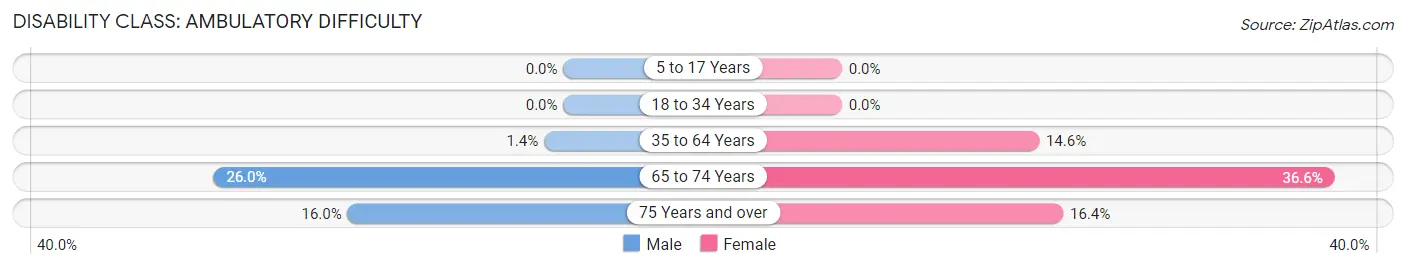
| Age Bracket | Male | Female |
| 5 to 17 Years | 0 (0.0%) | 0 (0.0%) |
| 18 to 34 Years | 0 (0.0%) | 0 (0.0%) |
| 35 to 64 Years | 20 (1.4%) | 275 (14.6%) |
| 65 to 74 Years | 59 (26.0%) | 105 (36.6%) |
| 75 Years and over | 33 (16.0%) | 46 (16.4%) |
Disability Class: Self-Care Difficulty
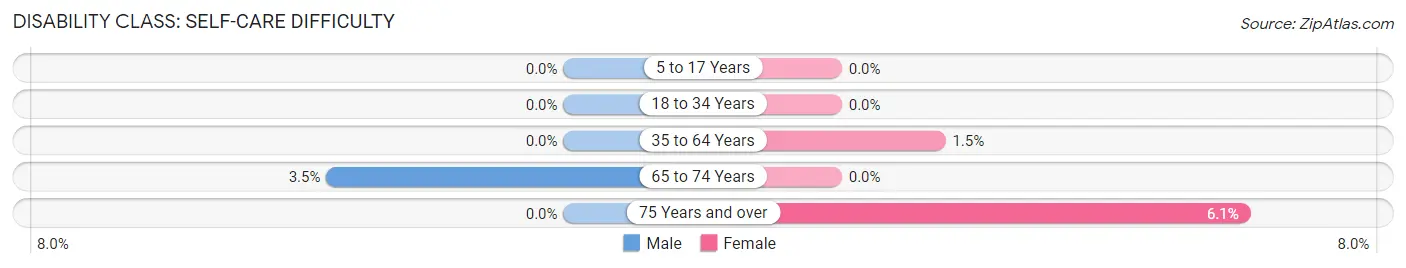
| Age Bracket | Male | Female |
| 5 to 17 Years | 0 (0.0%) | 0 (0.0%) |
| 18 to 34 Years | 0 (0.0%) | 0 (0.0%) |
| 35 to 64 Years | 0 (0.0%) | 29 (1.5%) |
| 65 to 74 Years | 8 (3.5%) | 0 (0.0%) |
| 75 Years and over | 0 (0.0%) | 17 (6.1%) |
Technology Access in York
Computing Device Access in York
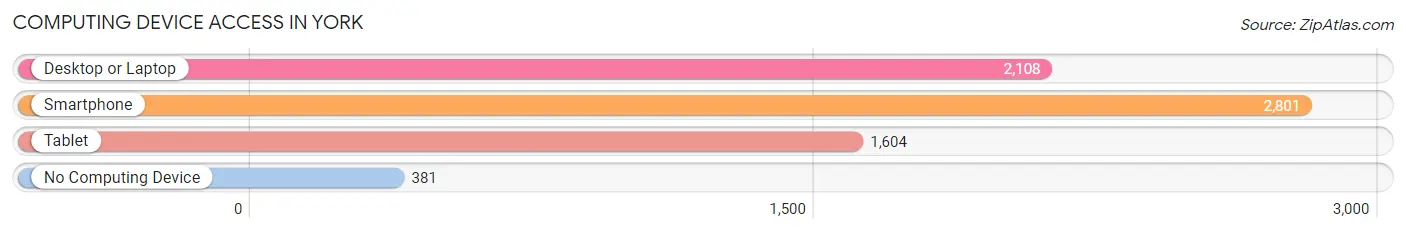
| Device Type | # Households | % Households |
| Desktop or Laptop | 2,108 | 63.6% |
| Smartphone | 2,801 | 84.6% |
| Tablet | 1,604 | 48.4% |
| No Computing Device | 381 | 11.5% |
| Total | 3,312 | 100.0% |
Internet Access in York
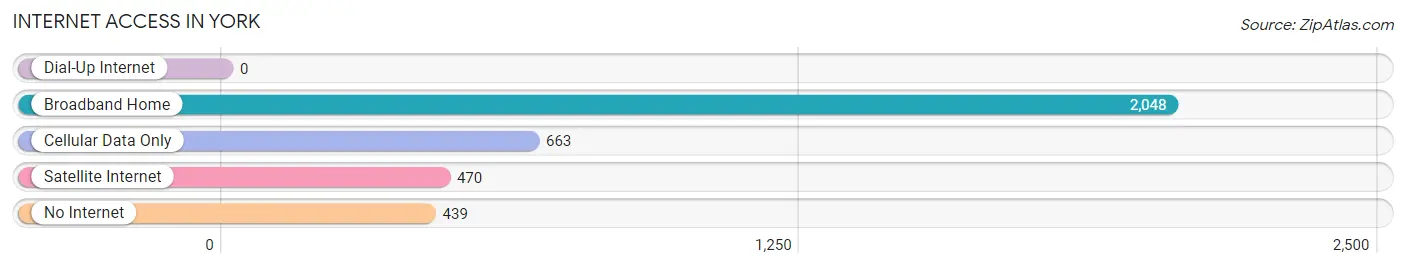
| Internet Type | # Households | % Households |
| Dial-Up Internet | 0 | 0.0% |
| Broadband Home | 2,048 | 61.8% |
| Cellular Data Only | 663 | 20.0% |
| Satellite Internet | 470 | 14.2% |
| No Internet | 439 | 13.3% |
| Total | 3,312 | 100.0% |
York Summary
York, South Carolina is a small town located in the northwestern corner of the state, approximately 25 miles south of Charlotte, North Carolina. It is the county seat of York County and is part of the Charlotte-Gastonia-Rock Hill Metropolitan Statistical Area. The town has a population of approximately 7,000 people and is the home of the York Technical College.
History
York was founded in 1785 by settlers from Pennsylvania and Virginia. The town was named after York, Pennsylvania, and was the first county seat of York County. The town was incorporated in 1855 and has been the county seat since then.
The town was an important stop on the Charlotte-Columbia Railroad, which was built in the late 1800s. The railroad brought economic growth to the area and helped to make York a center of commerce.
The town was also the site of a major Civil War battle in 1865. The Battle of York was fought between Union and Confederate forces and resulted in a Confederate victory.
Geography
York is located in the northwestern corner of South Carolina, approximately 25 miles south of Charlotte, North Carolina. The town is situated in the Piedmont region of the state and is surrounded by rolling hills and forests. The town is located on the Catawba River and is part of the Catawba River Basin.
The climate in York is mild and humid, with hot summers and mild winters. The average annual temperature is around 70 degrees Fahrenheit.
Economy
The economy of York is largely based on manufacturing and agriculture. The town is home to several manufacturing companies, including a paper mill, a textile mill, and a furniture factory. Agriculture is also an important part of the local economy, with the town being home to several farms and nurseries.
The town is also home to York Technical College, which provides educational opportunities for students in the area.
Demographics
As of the 2010 census, the population of York was 7,073. The racial makeup of the town was 79.3% White, 16.2% African American, 0.5% Native American, 0.7% Asian, 0.1% Pacific Islander, and 2.2% from other races. The median household income was $37,945 and the median family income was $45,945.
Conclusion
York, South Carolina is a small town located in the northwestern corner of the state. It was founded in 1785 and has been the county seat of York County since 1855. The town has a population of approximately 7,000 people and is the home of the York Technical College. The economy of York is largely based on manufacturing and agriculture, and the town is home to several farms and nurseries. The racial makeup of the town is 79.3% White, 16.2% African American, 0.5% Native American, 0.7% Asian, 0.1% Pacific Islander, and 2.2% from other races.
Common Questions
What is Per Capita Income in York?
Per Capita income in York is $26,020.
What is the Median Family Income in York?
Median Family Income in York is $53,539.
What is the Median Household income in York?
Median Household Income in York is $50,177.
What is Income or Wage Gap in York?
Income or Wage Gap in York is 8.1%.
Women in York earn 91.9 cents for every dollar earned by a man.
What is Inequality or Gini Index in York?
Inequality or Gini Index in York is 0.48.
What is the Total Population of York?
Total Population of York is 8,534.
What is the Total Male Population of York?
Total Male Population of York is 3,922.
What is the Total Female Population of York?
Total Female Population of York is 4,612.
What is the Ratio of Males per 100 Females in York?
There are 85.04 Males per 100 Females in York.
What is the Ratio of Females per 100 Males in York?
There are 117.59 Females per 100 Males in York.
What is the Median Population Age in York?
Median Population Age in York is 37.0 Years.
What is the Average Family Size in York
Average Family Size in York is 3.0 People.
What is the Average Household Size in York
Average Household Size in York is 2.5 People.
How Large is the Labor Force in York?
There are 4,340 People in the Labor Forcein in York.
What is the Percentage of People in the Labor Force in York?
66.1% of People are in the Labor Force in York.
What is the Unemployment Rate in York?
Unemployment Rate in York is 8.2%.